uk fx barometer 1
TRANSCRIPT

UK FXBarometer 1Understanding UK businesses’ attitudestowards FX and international payments
This document is a financial promotion and has been prepared and approved by Western Union International Bank GmbH, UK Branch. The information contained within this document does not constitute financial advice or a financial recommendation, is general in nature and has been prepared without taking into account your objectives, financial situation or needs.

Foreword . . . . . . . . . . . . . . . . . . . . . . . . . . . . . . . . . . . . . . . . . . . . . . . . . . . . . . . . .3
Sample and methodology . . . . . . . . . . . . . . . . . . . . . . . . . . . . . . . . . . . . . . . . . . .4
Key insights . . . . . . . . . . . . . . . . . . . . . . . . . . . . . . . . . . . . . . . . . . . . . . . . . . . . . . .5
The international trade environment in the UK . . . . . . . . . . . . . . . . . . . . . . . . . .6
Why do businesses import? . . . . . . . . . . . . . . . . . . . . . . . . . . . . . . . . . . . . . . . . . . . . . . . . . . . . . . . 8
Where do UK businesses import from? . . . . . . . . . . . . . . . . . . . . . . . . . . . . . . . . . . . . . . . . . . . . . . 10
What are the barriers to importing? . . . . . . . . . . . . . . . . . . . . . . . . . . . . . . . . . . . . . . . . . . . . . . . . . 11
Barriers to importing by sector and region . . . . . . . . . . . . . . . . . . . . . . . . . . . . . . . . . . . . . . . . . . . . 12
Impact of post-EU Referendum depreciation . . . . . . . . . . . . . . . . . . . . . . . . . . .13
How the rise in import costs affected industry sectors . . . . . . . . . . . . . . . . . . . . . . . . . . . . . . . . . . 14
Changes made to counter currency depreciation . . . . . . . . . . . . . . . . . . . . . . . . . . . . . . . . . . . . . . 15
How businesses passed on increased import costs . . . . . . . . . . . . . . . . . . . . . . . . . . . . . . . . . . . . 16
How businesses are planning future FX payments . . . . . . . . . . . . . . . . . . . . . . 17
Use of FX products by sector and region . . . . . . . . . . . . . . . . . . . . . . . . . . . . . . . . . . . . . . . . . . . . 18
Use of FX Forwards and FX Options . . . . . . . . . . . . . . . . . . . . . . . . . . . . . . . . . . . . . . . . . . . . . . . 20
Brexit effect on currency planning . . . . . . . . . . . . . . . . . . . . . . . . . . . . . . . . . . . . . . . . . . . . . . . . . . 21
How often do businesses review their FX planning? . . . . . . . . . . . . . . . . . . . . . . . . . . . . . . . . . . . 22
Methods businesses use to forecast future FX rates . . . . . . . . . . . . . . . . . . . . . . . . . . . . . . . . . . . 24
Western Union Business FX poll . . . . . . . . . . . . . . . . . . . . . . . . . . . . . . . . . . . . .26
GBP/USD exchange rate forecasts . . . . . . . . . . . . . . . . . . . . . . . . . . . . . . . . . . . . . . . . . . . . . . . . . 27
GBP/EUR exchange rate forecasts . . . . . . . . . . . . . . . . . . . . . . . . . . . . . . . . . . . . . . . . . . . . . . . . . 28
Businesses’ tolerance to negative FX swings . . . . . . . . . . . . . . . . . . . . . . . . . . . . . . . . . . . . . . . . . 29
Making FX planning easier for businesses . . . . . . . . . . . . . . . . . . . . . . . . . . . . .30
Table of contents
UK FX Barometer Q1 2018

Currency fluctuations are a concern for businesses trading internationally. For SMEs, even small movements in exchange rates can really affect their bottom line.
This report, our inaugural UK FX Barometer, provides research into how businesses of all sizes are currently managing this challenge alongside Brexit – insights that should help businesses and their advisors derive more value from their international trading and foreign exchange (FX) payments strategy.
While many talk of how the last 18 months have been beneficial for British exporters, the importance of importers on the UK economy and the challenges they face must not be ignored.
61% of UK businesses mention that one of the top reasons they import is to lower costs. However, FX planning can be complicated with many businesses feeling unable to make informed decisions about how best to address FX volatility and planning overseas payments.
For anyone who has the responsibility of managing international payments, Western Union is dedicated to helping SME businesses make this process easier and less complicated, aiding their future success and growth through robust FX strategies.
Foreword
By Tony Crivelli
Global Head of FX Services Western Union
UK FX Barometer Q1 2018
3

The FX Barometer is based on a survey of business decision makers responsible for managing international payments, and was carried out on behalf of Western Union Business Solutions by independent research specialists. The respondents include:
Sample and methodology
35% London
12% South East
11% North West
9% East Midlands / East of England
8% West Midlands
8% North East
7% South West
6% Scotland
3% Wales
1110UK key decision makers
Business size (annual gross revenue)
81%importers
Industry Sectors
• Manufacturing
• Construction
• Retail, wholesale, food
• Finance, insurance, real estate
• Communications, IT
• Travel, tourism, transport
• Health, medical, biotech
• Professional services
• Industrial, energy, utilities
• Other
54%
22% 24%
£1–25m£25–100m £100m+
Region
UK FX Barometer Q1 2018
4

Key insights
say currency volatility is one of the biggest barriers to importing
average price increase passed on to customers
40% 67%
17% 18%
44%
divergence in future GBP/USD forecasts
have absorbed increased import costs
can withstand a negative FX swing of 5% before financial difficulty
5
UK FX Barometer Q1 2018

The international trade environment in the UK
HMRC, UK Overseas Trade in Goods Statistics, December 2017
£498bnGoods imported to the UK in 2017
The UK was a net importer in 2017 with imports exceeding exports by
£153bn
21%Growth in imports since 2015
6
UK FX Barometer Q1 2018
1. ONS, Annual Business Survey, 2017
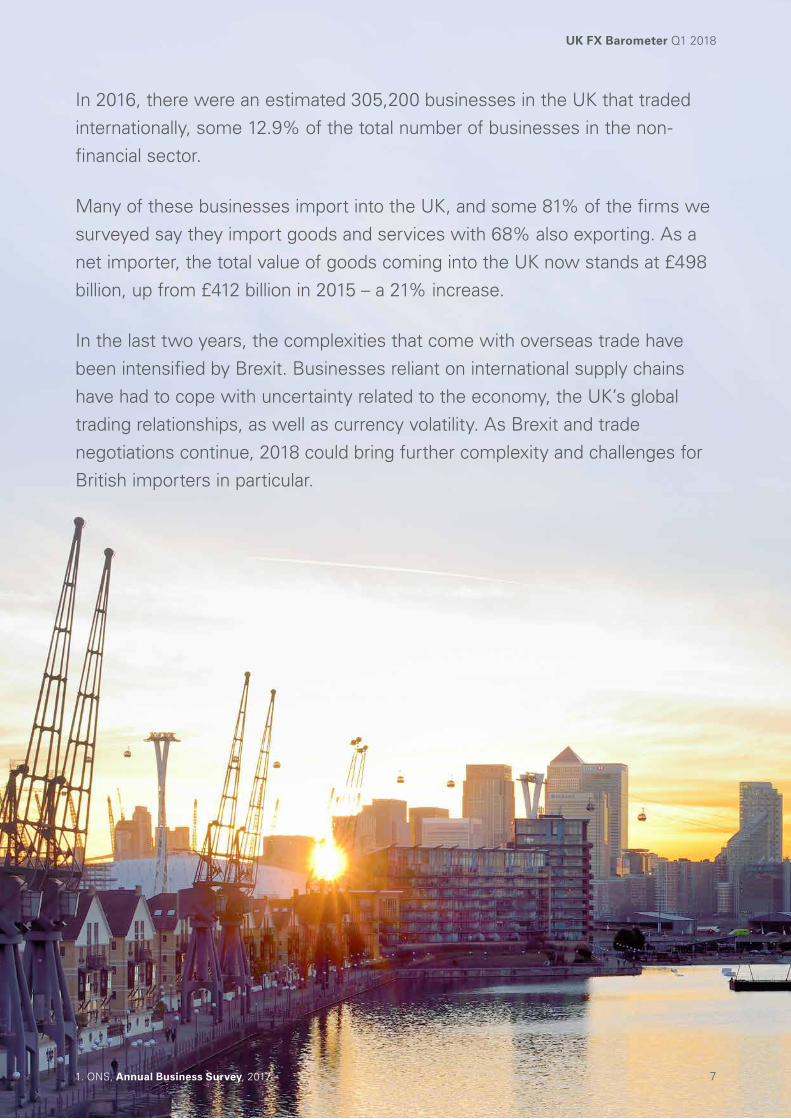
In 2016, there were an estimated 305,200 businesses in the UK that traded internationally, some 12.9% of the total number of businesses in the non-financial sector.
Many of these businesses import into the UK, and some 81% of the firms we surveyed say they import goods and services with 68% also exporting. As a net importer, the total value of goods coming into the UK now stands at £498 billion, up from £412 billion in 2015 – a 21% increase.
In the last two years, the complexities that come with overseas trade have been intensified by Brexit. Businesses reliant on international supply chains have had to cope with uncertainty related to the economy, the UK’s global trading relationships, as well as currency volatility. As Brexit and trade negotiations continue, 2018 could bring further complexity and challenges for British importers in particular.
UK FX Barometer Q1 2018
7

Lower cost
1
2
34
5 To source specific brands
FlexibilityReliability of supply
Better service
Top 5 reasons why businesses
import
Why do businesses import?
Importing remains vital for UK businesses; it enables firms to access raw materials, components and finished goods at lower costs than could be achieved domestically, or which simply aren’t available in the UK. This helps keep inflation low for British consumers and it also helps SMEs grow their knowledge, skills and competitiveness by collaborating in global supply chains and partnerships.
UK FX Barometer Q1 2018
8

0% 10% 20% 30% 40% 50% 60% 70%
Average
69%
65%
71%
58%
54%
63%
56%
47%
55%
50%
Manufacturing
Construction
Retail, Wholesale, Food
Finance, Insurance, Real Estate
Communications, IT
Travel, Tourism, Transport
Health, Medical, Biotech
Professional, Other Services
Industrial, Energy, Utilities
Other
Importing in order to lower costs was cited as one of the top three factors by over three-fifths (61%) of businesses. This is particularly true in the retail, wholesale and food sector, where 71% cited lower costs as a top-three factor. Regionally, businesses in the North East (68%) are most likely to say this is one of the most important reasons.
Regionally, businesses in the South West (75%), Scotland (74%) and the North East (68%) are most likely to say this is one of the most important reasons.
Sectors citing lower cost as top factor for importing
UK FX Barometer Q1 2018
9

Where do UK businesses import from?
While the USA and China rank highly as countries from which UK businesses import, it comes as no surprise that European Union (EU) countries such as Germany and France are still of vital importance. Whatever the outcome of the UK leaving the EU, the findings below emphasise that trade with EU nations will need to be carefully considered for the benefit of British importers.
35%from USA 32%
from China15%from Spain
35%from Germany
32%from France
14%from Italy
10
UK FX Barometer Q1 2018

What are the barriers to importing?
Regulation was commonly cited as one of the biggest barriers to importing, according to nearly half (45%) of UK businesses – with almost two-fifths (39%) also noting they are concerned about tariffs.
Currency concerns – as a result of exchange rate volatility or a weak Pound – are also making it difficult for UK businesses to source internationally, and were cited as top barriers by 44% and 40% of firms respectively.
45%of businesses cited REGULATION as one of the biggest barriers to importing
44%of businesses said CURRENCY VOLATILITY was one of the biggest barriers to importing
40%of businesses said a WEAK POUND was one of the biggest barriers to importing
39%of businesses said TARIFFS were one of the biggest barriers to importing
UK FX Barometer Q1 2018
11

Most common barrier to international sourcing
Travel, tourism, transport
Regulation 60%
Industrial, energy, utilities
Regulation 58%
Health, medical, biotech
Weak GBP
55%
Professional, other services
Regulation 52%
Retail, wholesale, food
Currency volatility
51%
Manufacturing Regulation 46%
Finance, insurance, real estate
Currency volatility
43%
Communications, IT
Currency volatility
42%
ConstructionCurrency volatility
41%
Barriers to importing by sector
When comparing sectors, it is apparent that some are more susceptible to particular barriers than others. For example, 60% of businesses in the travel, tourism and transport sector cited regulation as a top barrier – the most of any industry. While for industries such as construction, retail and financial services, currency volatility was cited as the most common barrier.
Barriers to importing by region
Businesses headquartered in London cited regulation (42%) and currency volatility (40%) as the biggest barriers. In the South East region, currency volatility (53%) and weak GBP (45%) were the biggest barriers. In Scotland, weak GBP (46%) was the most common barrier, whilst Wales cited tariffs (56%) as the biggest barrier to effective international sourcing.
Regulation
Currency volatility
Weak GBP
Tarrifs
UK FX Barometer Q1 2018
12

When asked about the impact of Sterling depreciation post-EU Referendum, two-fifths (41%) of all businesses said they experienced an increase in import costs over the past 18 months with an average increase of 21%.
Overall, over 1 in 5 businesses (22%) saw their profits fall – with an average decrease of 12%, rising to 18% for those in the financial, insurance and real estate sector and 16% in the travel, tourism and transport industry.
Impact of post-EU Referendum depreciation
businesses saw profits fall
average fall in profits
1 in 5
12%
UK FX Barometer Q1 2018
13

Average increase in import
costs
Average price increase passed on to customers
Businesses that absorbed
increased costs
All businesses 21% 17% 67%
Manufacturing 13% 12% 63%
Construction 19% 19% 71%
Retail, wholesale, food 17% 14% 63%
Finance, insurance, real estate 27% 32% 75%
Communications, IT 41% 18% 74%
Travel, tourism, transport 12% 12% 68%
Health, medical, biotech 14% 10% 66%
Professional, other services 20% 14% 58%
Industrial, energy, utilities 20% 16% 62%
How the rise in import costs affected industry sectors
When assessing the impact of Sterling depreciation post-EU Referendum across industries, 75% of businesses in the finance, insurance and real estate sector said they absorbed the increase in import costs compared to 63% of businesses in manufacturing. Of those who said they passed these higher costs onto consumers, businesses in the finance, insurance and real estate sectors also ranked the highest (32%) in terms of the average price increase they passed on.
UK FX Barometer Q1 2018
14

Changes made to counter currency depreciation
To cope with the impact of the depreciation in Sterling post-EU Referendum, businesses made a number of management changes – from re-negotiating contracts and pricing (68%), to sourcing from geographies with more favourable exchange rates (57%). Over half (54%) of businesses said they utilised FX risk management solutions as a result of Sterling depreciation following the EU Referendum.
Management changes made as a result of Sterling depreciation (past 18 months)
Re-negotiated contracts and pricing
Reviewed supply chain
Sourced more domestically
Reduced product line
Absorbed increased costs
67%
53%43%
67%68%
Passed on costs to customers by increasing prices
Utilised FX risk management solutions
Sourcing from geographies with more favourable exchange rates
63% 54%57%
UK FX Barometer Q1 2018
15

Average price increase passed on to customers
How businesses passed on increased import costs
As mentioned earlier, of those that passed on higher import costs to their customers through price increases, businesses in the financial and professional services sector increased their prices by 32% – substantially higher than the average price increase of 17% across all sectors. Businesses in the Construction (19%) and Communications, IT (18%) sectors were also above average.
0% 5% 10% 15% 20% 25%17% 30%
Average
19%
18%
32%
14%
12%
16%
14%
10%
12%
11%
Manufacturing
Construction
Retail, Wholesale, Food
Finance, Insurance, Real Estate
Communications, IT
Travel, Tourism,Transport
Health, Medical,Biotech
Professional, Other Services
Industrial, Energy, Utilities
Other
Average price increase
passed onto customers
17%
UK FX Barometer Q1 2018
16

How businesses are planning future FX payments
To provide insight into how UK businesses are managing and planning their FX payments, decision makers were asked a number of questions related to what products and techniques have been implemented.
When asked what FX products they had used, 44% of businesses in construction stated FX Options Contracts. Over a quarter (26%) in the manufacturing sector said they had not used any FX products in the past 12 months.
UK FX Barometer Q1 2018
17

0% 5% 10% 15% 20% 25% 30% 35%
Manufacturing
Construction
Retail, Wholesale, Food
Finance, Insurance,Real Estate
Communications, IT
Travel, Tourism, Transport
Health, Medical, Biotech
Professional, Other Services
Industrial, Energy, Utilities
Other
26%
25%
35%
22%
17%
25%
22%
11%
18%
15%
% of businesses that have not used FX products in last 12 months (by sector)
Use of FX products by sector
More than a fifth (22%) of UK businesses have not used any FX products (such as FX Forward and Options Contracts) in the last 12 months, rising to over a third (35%) of those in professional services and around a quarter for both manufacturing (26%) and retail, wholesale and food companies (25%).
UK FX Barometer Q1 2018
18

36% Wales
32% East Midlands / East of England
30% South East
27% West Midlands
25% North West
24% Scotland
23% North East
22% South West
13% London
% of businesses that have not used FX products in last 12 months (by region)
Use of FX products by region
Regionally, businesses in Wales (36%), the East Midlands (32%) and the South East (30%) have not used any FX products in the last 12 months, despite at least half of firms in these regions saying that currency volatility is their biggest barrier to international sourcing. By comparison, in London just 13% have not used FX products in the past twelve months.
UK FX Barometer Q1 2018
19

Use of FX Forwards and FX Options
Of those businesses that have used FX products, 38% are making use of FX Options Contracts with companies in finance, insurance and real estate (47%), and construction (44%) most commonly adopting these products to mitigate currency risk.
FX products used (by sector)
FX products used (by business size / turnover)
31%
£ 100m+
£ 25–100m
£ 1–25m
35%
44%
13%
12% 12%
39%48%
30%
37%
11%
25%
22%
33%
46%
FX ForwardContracts
FX OptionsContracts
Dual CurrencyDeposits FX Swaps None
Manufacturing
Construction
Retail, Wholesale,Food
Finance, Insurance,Real Estate
Communications,IT
Travel, Tourism,Transport
Health, Medical,Biotech
Professional,Other Services
Industrial, Energy,Utilities
All
39%
37%
32%
49%
41%
26%
23%
31%
35%
36%
36%
44%
37%
47%
38%
33%
40%
34%
38%
38%
26%
32%
35%
36%
37%
27%
40%
22%
27%
31%
14%
11%
15%
20%
20%
18%
13%
16%
6%
15%
26%
18%
25%
11%
15%
25%
22%
35%
17%
22%
FX ForwardContracts
FX OptionsContracts
Dual CurrencyDeposits FX Swaps None
UK FX Barometer Q1 2018
20

Brexit effect on currency planning
When asked how Brexit has changed your approach to currency volatility and protecting costs, almost a fifth (17%) of businesses said they now try to settle foreign currency invoices in Sterling more often. This trend rises to over a quarter (26%) for the health, medical and biotech sector and a fifth (21%) for the retail sector.
Regionally, more than a quarter (29%) of Scottish businesses have taken this approach. This is despite the fact that 61% of businesses say one of the top reasons why they import is for lower cost – with 71% of retail firms and 74% of businesses in Scotland saying this.
There has been a mixed reaction in the use of FX Forwards and FX Options as a method of managing future FX payments and foreign cash flows following the Brexit vote. A fifth (22%) of businesses have increased their use while 16% have decreased their use of these FX hedging products.
Impact Brexit has had on businesses’ use of FX hedging products
Increased use ofFX Forward and or
FX options contracts
Decreased use ofFX Forward and or
FX options contracts
Similar use ofFX Forward and orFX options contracts
We try to settleforeign currencyinvoices in Sterlingmore often
None of the above
22%
29%
17%
15%
16%
UK FX Barometer Q1 2018
21

How often do businesses review their FX planning?
Of the businesses surveyed, a fifth (22%) review their FX payments strategy at least once a month. Just under half (47%) of businesses review their strategies at least every two months, although those in the construction (55%) and communications industry (52%), as well as businesses in London (51%) do so more often.
At least once a month
Bi-monthly
Quarterly
Semi-annually
Annually
Longer than once a year
Never
22%
9%
7%
3%
3%
25%
31%
How often businesses review their FX payments planning and management
UK FX Barometer Q1 2018
22
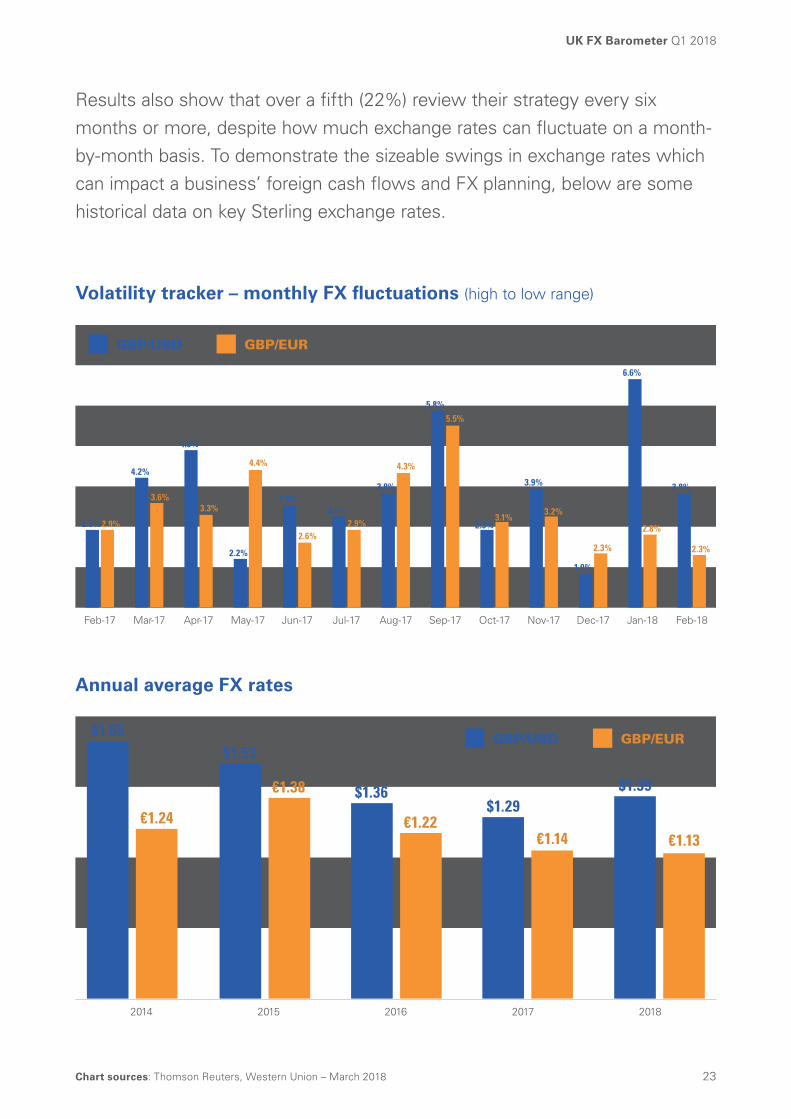
Feb-17 Mar-17 Apr-17 May-17 Jun-17 Jul-17 Aug-17 Sep-17 Oct-17 Nov-17 Dec-17 Jan-18 Feb-18
GBP/USD
2.9% 2.9%
4.2%
3.6%
4.9%
3.3%
2.2%
4.4%
3.5%
2.6%
GBP/EUR
3.2%2.9%
3.9%
4.3%
5.8%5.5%
2.9%3.1%
3.9%
3.2%
1.9%
2.3%
6.6%
2.8%
3.8%
2.3%
2014 2015 2016 2017 2018
$1.65
€1.24
$1.53
€1.38 $1.36
€1.22$1.29
€1.14
$1.39
€1.13
GBP/USD GBP/EUR
Chart sources: Thomson Reuters, Western Union – March 2018
Volatility tracker – monthly FX fluctuations (high to low range)
Annual average FX rates
Results also show that over a fifth (22%) review their strategy every six months or more, despite how much exchange rates can fluctuate on a month-by-month basis. To demonstrate the sizeable swings in exchange rates which can impact a business’ foreign cash flows and FX planning, below are some historical data on key Sterling exchange rates.
UK FX Barometer Q1 2018
23

Methods businesses use to forecast future FX rates
Businesses were asked what technique best describes the way they currently forecast and set the exchange rate they must use, or need to achieve, when budgeting for FX payments. Practices used by businesses are very fragmented, with almost two-fifths (17%) of businesses saying they use the market exchange rate (Spot rate) on the day.
use the rate recommended /
set by their supplier
use the current SPOT rate
seek advice from FX specialists
1 in 10 10%17%
UK FX Barometer Q1 2018
24

Methods used to forecast future FX rates
One-in-ten (10%) businesses say they allow their suppliers to set or recommend their FX budget or target rates – suggesting UK businesses may potentially allow their suppliers to add buffers for currency risk into contract pricing. Given the multiple global economic factors and complex risk events, such as elections constantly impacting exchange rates, one-in-ten (10%) say seeking advice from FX specialists best describes their approach.
Techniques used to set FX budget or target rates
17%We use the market
exchange rate on that day
(current SPOT rate)
11%We use an average
exchange rate based on a historical period
(such as the 3-month average)
13%We use a regularly
published exchange rate (such as
HMRC website)
10%My supplier/counter-party recommends or sets the exchange rate we use (such as per contract basis)
14%We use FX Forward
or FX Options pricing (such as a Forward
Contract quote)
10%We seek advice from
an FX specialist (such as request
research from your currency provider)
13%We use judgement/experience based on
various inputs and FX analysis
10%We use an internal rate of exchange
(such as a rate set by head office)
2%Other
UK FX Barometer Q1 2018
25

40%
25%
Western Union Business FX poll
The outlook for Sterling exchange rates can impact businesses’ long-term budgeting and FX planning; however, there is a wide divergence in future forecasts. This reflects the uncertain political and economic factors which impact future exchange rate volatility – uncertainty which has been exacerbated by ongoing Brexit negotiations.
When asked where do you see key Sterling exchange rates heading over the next 12 months, there is a 40% divergence in future GBP/USD forecasts among the 386 business decision makers in the UK who submitted their 12 month predictions.
divergence in future GBP/USD forecasts
divergence in future GBP/EUR forecasts
The Western Union Business FX Poll was conducted in the same FX Barometer survey by an independent research specialist on behalf of Western Union Business Solutions. A total of 386 forecasts were submitted. The respondents consist of decision makers from businesses across all geographic regions in the UK, covering over 20 different industry sectors. The survey includes businesses of all sizes, from Small Businesses (£1m gross revenue), to SMEs (up to £50m) as well as Corporates (up to £100m+). 26
UK FX Barometer Q1 2018

$1.65
$1.55
$1.45
$1.35
$1.25
$1.15
$1.38
$1.52
$1.39
$1.38
$1.20
$1.55
$1.20
$1.40
$1.38
$1.65
$1.18
$1.39
$1.41
Feb 2018 May 2018
High Average Reuters Poll average* Low
Aug 2018 Nov 2018 Feb 2019
40%divergencein future
GBP/USDforecasts
GBP/USD exchange rate forecasts
The average 12-month GBP/USD forecast for February 2019 shows businesses see the exchange rate trading at $1.41 next year. However, forecasts submitted by industry specialists in a comparable survey see the exchange rate lower at $1.39.
FX rates are extremely difficult to predict. Therefore, businesses can factor into their forward planning both the potential for exchange rates to trend in their favour, as well as the risk of exchange rates moving sharply against them.
* Thomson Reuters FX Poll – February 2018. This is a monthly survey of FX predictions from a range of participants such as global ‘tier 1’ banks, investment banks and specialist FX brokers. A total of 62 organisations submitted predictions. This is strictly Thomson Reuters proprietary content. No redistribution allowed. Click here for more information: Thomson Reuters
GBP/USD forecasts
May 2018 3 month
Aug 2018 6 month
Feb 2019 12 month
High $1.52 $1.55 $1.65
Average $1.39 $1.40 $1.41
Reuters Poll average* $1.38 $1.38 $1.39
Low $1.20 $1.20 $1.18
UK FX Barometer Q1 2018
27

GBP/EUR forecasts
May 2018 3 month
Aug 2018 6 month
Feb 2019 12 month
High €1.21 €1.23 €1.25
Average €1.14 €1.15 €1.16
Reuters Poll average* €1.13 €1.12 €1.12
Low €1.10 €1.00 €1.00
GBP/EUR exchange rate forecasts
The average 12-month GBP/EUR forecast for February 2019 shows businesses see the exchange rate trading at €1.16. However, forecasts submitted by industry specialists see the exchange rate 4 cents lower at €1.12.
As mentioned previously, the results of this poll suggest that businesses should factor into their forward planning both the potential for exchange rates to trend in their favour, as well as the risk of exchange rates moving sharply against them.
€1.28
€1.23
€1.18
€1.13
€1.08
€1.03
€0.98
€1.12
€1.21
€1.14
€1.13
€1.10
€1.23
€1.00
€1.15
€1.12
€1.25
€1.00
€1.12
€1.16
Feb 2018 May 2018 Aug 2018 Nov 2018 Feb 2019
25%divergencein future
GBP/EURforecasts
High Average Reuters Poll average* Low
* Thomson Reuters FX Poll – February 2018. This is a monthly survey of FX predictions from a range of participants such as global ‘tier 1’ banks, investment banks and specialist FX brokers. A total of 62 organisations submitted predictions. This is strictly Thomson Reuters proprietary content. No redistribution allowed. Click here for more information: Thomson Reuters
UK FX Barometer Q1 2018
28

Businesses’ tolerance to negative FX swings
When asked what level of unfavourable currency moves could your business withstand before facing financial difficulty, just under one-third (32%) of all businesses said they could withstand a negative currency swing of up to 10%. Nearly one in five businesses (18%) said they could withstand a negative currency swing of up to 5%.
Businesses’ tolerance to negative currency movements could be a cause for concern when compared to actual month-by-month FX volatility, as well as the percentage divergence in future forecasts submitted in the FX poll.
Up to a negative 5%currency move
Up to a negative10% currency move
Up to a negative15% currency move
More than 15%
No impact
18%
32%20%
15%
15%
Businesses’ tolerance to negative FX moves before financial difficulty
UK FX Barometer Q1 2018
29

Making FX planning easier for businesses
GET STARTED
We specialise in helping SME businesses make their international trading easier and less complicated. We help firms build and execute better currency plans to help protect profits and support growth through robust FX strategies.
WU® Currency Forecaster
To understand more about this report, or to benchmark your FX payments strategy, contact our team today on 0800 096 1229 or try our forecasting tool to download your personalized FX forecast report: WU® Currency Forecaster
UK FX Barometer Q1 2018
30

This document is a financial promotion and has been prepared and approved by Western Union International Bank GmbH, UK Branch. The information contained within this document does not constitute financial advice or a financial recommendation, is general in nature and has been prepared without taking into account your objectives, financial situation or needs.
The survey presented in this document was conducted by an independent research specialist on behalf of Western Union International Bank GmbH. The respondents consisted of decision makers from companies across all geographic regions in the UK, covering over 20 different industry sectors including construction, retail and finance. The survey includes companies of all sizes, from Small Businesses (£1m gross revenue), to SMEs (up to £50m) as well as Corporates (up to £100m+).
The Western Union Company provides its services in the UK through Western Union’s wholly-owned subsidiary, Western Union International Bank GmbH, UK Branch (WUIB). WUIB (Branch Address: 12 Appold Street, London, EC2A 2AW) is a branch of Western Union International Bank GmbH (registered in Austria, company number FN256184t, VAT Number ATU61347377, with its registered office at Schubertring 11, 1010 Vienna, Austria), which is licensed by the Austrian Financial Market Authority (Finanzmarktaufsicht).
WUIB makes no representation as to the accuracy or completeness of any statements made herein or made at any time orally or otherwise in connection with and all liability (in negligence or otherwise) in respect of any such matters or statements is expressly excluded, except only in the case of fraud or wilful default. Any opinions expressed are those of WUIB as at the time of writing and are subject to change without notice. This document should not be distributed to third parties without our prior consent. In circumstances where we agree to provide a third party with this report upon your request, the third party may not derive any rights here from against WUIB: in particular, but not limited to, WUIB assumes no third party liability.
WUIB is subject to limited regulation by the UK Financial Conduct Authority and Prudential Regulation Authority. Details about the extent of WUIB’s regulation by the Financial Conduct Authority and Prudential Regulation Authority are available from WUIB on request. This document has been prepared solely for informational purposes and does not in any way create any binding obligations on either party. Relations between you and WUIB shall be governed by the applicable terms and conditions. No representations, warranties or conditions of any kind, express or implied, are made in this document.
Contact us today to benchmark your FX strategy
0800 096 1229
business.westernunion.co.uk