uk economic forecast q3 2015 · pdf file10-09-2015 bcc uk economic forecast – q3 2015...
TRANSCRIPT

10-09-2015 BCC UK Economic Forecast – Q3 2015 PAGE 1 OF 13
UK Economic Forecast – Q3 2015
David Kern, Chief Economist at the BCC
The main purpose of the BCC Economic Forecast is to articulate a BCC view on economic topics that are relevant to
our members, and to contribute to the wider public debate on policy issues. The Forecast also aims to complement
the messages conveyed by the BCC’s Quarterly Economic Survey (QES).
Table of Contents
Key messages .................................................................................................................................................................... 2
GDP and the main components of demand ...................................................................................................................... 3
The external position: net trade & the current account .................................................................................................... 5
Monetary policy: interest rates, forward guidance & QE ................................................................................................. 7
UK main sectors: manufacturing, services & construction ............................................................................................... 8
Unemployment and the labour market ............................................................................................................................ 9
Youth unemployment ...................................................................................................................................................... 10
Inflation and labour costs ............................................................................................................................................... 10
UK public finances ........................................................................................................................................................... 11
Policy issues ..................................................................................................................................................................... 12
Contact details ................................................................................................................................................................ 13
10-09-2015 BCC UK Economic Forecast – Q3 2015 PAGE 2 OF 13
Key messages
The BCC is raising its UK GDP growth forecasts: to 2.6% for 2015, to 2.7% for 2016 and to 2.7% for 2017. In Q2, we
predicted 2.3% growth in 2015 and 2.6% in both 2016 and 2017.
The upgrading of our growth forecasts is mainly due to stronger growth than we previously predicted in services
output and in consumer spending.
Significant upward revisions by the ONS of some of their previous GDP estimates also contributed to the upgrading
of our forecasts, particularly for 2015.
The ONS estimated three months ago that, in Q1 2015, GDP recorded quarterly growth of 0.3% and annual growth
of 2.4%; the revised ONS figures for Q1 2015 are: 0.4% quarterly growth and 2.9% annual growth.
As we anticipated in our previous forecast, the Q1 2015 slowdown in UK growth proved to be temporary only.
Quarterly GDP growth in Q2 2015 was 0.7%, in line with our June forecast.
Quarterly GDP growth, after accelerating to 0.7% in Q2 2015, is likely to stabilise at a trend average rate of just
under 0.7% per quarter from Q3 2015 onwards.
This is in line with average quarterly GDP growth over the period since early 2013.
Services & household consumption will remain the main growth drivers in the next few years.
While the contribution of business investment and net exports will slowly increase it will still be inadequate, and
below the levels needed to produce a sustained improvement in growth.
Manufacturing and construction output, while performing disappointingly in recent quarters, will record positive
growth from Q3 2015, but at a weaker pace than the service sector.
The UK unemployment rate is forecast to fall from 5.6% in Q2 2015, to 5.3% in Q2 2016 and 5.0% in Q2 2017; it
will then stay at that level until Q2 2018.
Although our GDP growth forecasts have been revised up, unemployment rates are now slightly higher than we
predicted in Q2. The change is due to the following main reasons:
o The unexpected rise in the jobless total in Q2 2015 establishes a higher starting point for our new
unemployment forecast than in the June report.
o The scope for unemployment to fall without triggering inflationary pressures is likely to prove
slightly smaller than we predicted in Q2.
o The large increases in the minimum wage (now redefined as the living wage) announced in the July
2015 Budget will add to the jobless total in some areas of the labour market.
We expect the first increase in the Bank Rate, to 0.75%, to occur in Q2 2016, the same date as we previously
predicted. Further modest increases in official interest rates can then be expected, in small 0.25% steps, with
official interest rates reaching 2.00% in Q4 2017.

10-09-2015 BCC UK Economic Forecast – Q3 2015 PAGE 3 OF 13
Productivity has been weak since the financial crisis but we expect a gradual improvement in the next few years.
Strengthening UK productivity growth is a major medium-term challenge.
Public sector net borrowing is forecast to fall steadily over the next few years, in line with the new and more
realistic official timetable for moving into budgetary surplus in 2019/20.
GDP and the main components of demand
GDP: UK quarterly GDP growth in Q2 2015 was 0.7%, after 0.4% growth in Q1 2015.
Year-on-year growth in Q2 2015 was 2.6%. Full-year UK GDP growth in 2014 was 3.0%, the strongest annual
increase in output since 2006, when it was also 3.0%.
In Q2 2015, UK GDP was 5.2% higher than the pre-downturn peak of Q1 2008.
In calendar year 2014, UK GDP growth, at 3.0%, was stronger than in other G7 economies.
Year-on-year UK growth in Q2 2015, at 2.6%, compares with 2.7% in the US, 1.6% in Germany, 1.0% in France, and
1.2% in the eurozone as a whole.
Quarterly GDP growth, after accelerating to 0.7% in Q2 2015, is likely to stabilise at an average trend rate of just
under 0.7% per quarter from Q3 2015 onwards.
Growth in the next 2-3 years will benefit from higher disposable incomes and improved confidence. However,
recurring international uncertainties and persistent imbalances in the structure of UK growth will be dampening
factors and serious potential risks.
In calendar-year terms, GDP growth is forecast to slow from 3.0% growth in 2014 to 2.6% in 2015, and then
strengthen to 2.7% in both 2016 and 2017.
Household consumption: Household consumption growth has strengthened in full-year terms to 2.6% in 2014; it
is forecast to accelerate further, to 3.1% in 2015, as the fall in inflation boosts on real incomes.
Thereafter, our new forecast envisages a modest easing in full-year household consumption growth, to a still
strong rate of 2.6% in both 2016 and in 2017.
Rising employment, falling unemployment and still strong house prices also contributed to the rise in consumer
spending, by boosting confidence and encouraging falls in the savings ratio.
The UK households’ savings ratio fell in recent years, from a peak of 11.0% in 2010 in the aftermath of the financial
crisis, to 6.4% in 2013 and 6.1% in 2014.
Our forecast envisages further near-term falls in the savings ratio, as modest rises in real incomes, rising
employment and a still robust housing market boost consumer confidence.
However, the expected rise in mortgage interest rates early in 2016 will make households more cautious, and
growth in consumption is likely to slow in 2016 & 2017.
In calendar-year terms, we are forecasting that the savings ratio, after averaging 6.1% in 2014, will fall to 5.5% in
both 2015 and 2016, before edging back up to 6.0% in 2017.
The UK twin deficits, on current account and budget, remain excessive, and household debt levels are still unduly
high. The UK will have to save more in the medium term.

10-09-2015 BCC UK Economic Forecast – Q3 2015 PAGE 4 OF 13
Household consumption cannot rely indefinitely on increased debt and a falling savings ratio.
Securing stronger productivity increases is a crucial requirement for making possible higher growth in real earnings
and for ensuring that the recovery does not fizzle out.
Business investment: In full-year terms, UK business investment rose by 5.3% in 2013 and 8.0% in 2014. As a % of
GDP, business investment is now higher than before the recession; in 2014 it was 10.6%, highest annual figure
since 2000, when it was 11.1%.
In Q2 2015, business investment was 14.8% above its pre-recession peak in Q1 2008, and 5.0% higher than a year
earlier. In calendar-year terms, we are now predicting growth in business investment of 6.7% in 2015, 7.8% in
2016, and 7.4% in 2017.
Table 1 summarises our forecasts for UK GDP and its main components.
Table 1: UK GDP & Main Demand Components, % Change Year on Year
2012 2013 2014 2015 2016 2017
GDP 0.7% 1.7% 3.0% 2.6% 2.7% 2.7%
Household Consumption 1.5% 1.7% 2.6% 3.1% 2.6% 2.6%
General Government 2.3% -0.3% 1.6% 2.2% 0.8% 0.6%
Investment 0.7% 3.2% 8.6% 5.1% 6.0% 6.1%
of which: Business Investment 4.2% 5.3% 8.0% 6.7% 7.8% 7.4%
Exports 0.7% 1.5% 0.5% 6.8% 3.5% 2.9%
Imports 3.1% 1.4% 2.4% 4.9% 2.4% 2.6%
10-09-2015 BCC UK Economic Forecast – Q3 2015 PAGE 5 OF 13
The external position: net trade & the current account
The UK trade deficit is now smaller than before the financial crisis. In 2005-07, the goods & services trade deficit
averaged 3.7% of GDP in real terms and 2.6% in current prices.
In 2012-14, the trade deficit averaged 2.4% of GDP in real terms and 2.0% in current prices.
A larger trade surplus in services has made the main contribution to the improvement.
While there has been medium-term progress, the trade balance recorded varied movements in 2014. In real terms,
the trade deficit worsened from 2.2% of GDP in 2013 to 2.8% in 2014. In current prices, the trade deficit stayed at
2.0% of GDP in 2014, the same as in 2013.
The rebalancing of the UK economy towards net exports is still slow, patchy and inadequate.
The trade balance worsened in Q1 2015, particularly in real terms. In Q2 2015, we saw a very strong improvement
in the trade balance, both in nominal and real terms, but it is much too early to talk about a sustainable
improvement. The trade figures are notoriously volatile.
In the next few years, we expect a gradual fall in the UK trade deficit; and, due to the strong improvement recorded
in Q2, we are now predicting smaller trade deficits than in June.
Nevertheless, in both nominal and real terms, the UK trade deficit is clearly still too large, and the government
must address this issue as an urgent national priority.
This is particularly important at a time when our current account deficit, which in addition to trade includes items
such as investment income and transfers, has worsened markedly in recent years and has swelled to dangerously
large levels.
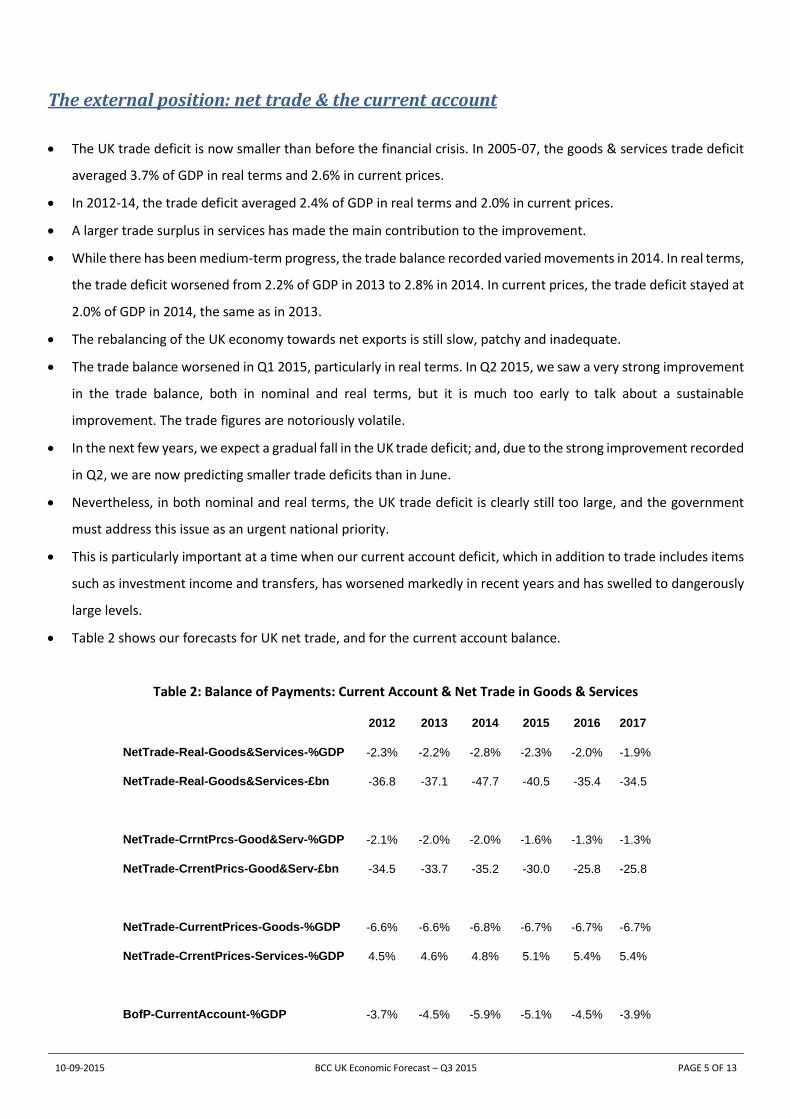
Table 2 shows our forecasts for UK net trade, and for the current account balance.
Table 2: Balance of Payments: Current Account & Net Trade in Goods & Services
2012 2013 2014 2015 2016 2017
NetTrade-Real-Goods&Services-%GDP -2.3% -2.2% -2.8% -2.3% -2.0% -1.9%
NetTrade-Real-Goods&Services-£bn -36.8 -37.1 -47.7 -40.5 -35.4 -34.5
NetTrade-CrrntPrcs-Good&Serv-%GDP -2.1% -2.0% -2.0% -1.6% -1.3% -1.3%
NetTrade-CrrentPrics-Good&Serv-£bn -34.5 -33.7 -35.2 -30.0 -25.8 -25.8
NetTrade-CurrentPrices-Goods-%GDP -6.6% -6.6% -6.8% -6.7% -6.7% -6.7%
NetTrade-CrrentPrices-Services-%GDP 4.5% 4.6% 4.8% 5.1% 5.4% 5.4%
BofP-CurrentAccount-%GDP -3.7% -4.5% -5.9% -5.1% -4.5% -3.9%

10-09-2015 BCC UK Economic Forecast – Q3 2015 PAGE 6 OF 13
BofP-CurrentAccount-£bn -61.9 -76.7 -105.7 -95.0 -87.0 -80.0
Our forecast is that the real net trade deficit will fall from 2.8% of GDP in 2014 to 2.3% of GDP in 2016, and then
fall more slowly to 1.9% of GDP in 2017.
The strong improvement we predict in 2015 is partly due to the exceptionally strong 3.9% quarterly increase in
real exports in Q2 2015, which may have been partly erratic.
Though we expect growth to return to a more normal path from Q3 2015 onwards, the very high Q2 figure distorts
the annual averages. We are now forecasting full-year growth in real exports of 6.8% in 2015, 3.5% in 2016 & 2.9%
in 2017.
In current prices, our forecast is that the trade deficit will fall from 2.0% of GDP in 2014, to 1.6% of GDP in 2015
and 1.3% of GDP in both 2016 & 2017.
If exports in current prices continue to grow at their long term average pace of around 5% per annum they will
only reach the official £1 trillion target in 2028.
The goods deficit is likely to fall marginally over the next three years, to 6.7% of GDP, while the trade surplus in
services will increase from 4.8% of GDP in 2014 to 5.4% of GDP in 2017.
In contrast to the trade deficit, the UK current account deficit is much larger than before the crisis, and the position
worsened markedly in recent years. In calendar-year 2014, the current account deficit totalled 5.9% of GDP, an
unacceptably high level.
The worsening in the UK current deficit in recent years is more than accounted for by the sharp deterioration in
the primary income balance, which moved from a traditional surplus to a large deficit totalling 2.5% of GDP in
2014.
The primary income balance has worsened mainly due to adverse FDI flows, as income paid on foreign investment
in the UK exceeds receipts on UK investments abroad.
Prospects for the current account are very uncertain, because it is unclear whether, and to what extent, the income
balance will recover in future years.
Our forecast is that the current account deficit will improve gradually, from 5.9% of GDP in 2014 to 3.9% of GDP
in 2017, still a very high and potentially risky shortfall.
Financing the current account deficit will be manageable in the short term; but, without a meaningful reduction,
the UK will be vulnerable in the medium term to speculative attacks and our credit rating could be at risk.

10-09-2015 BCC UK Economic Forecast – Q3 2015 PAGE 7 OF 13
Monetary policy: interest rates, forward guidance & QE
We expect the first increase in the Bank Rate, to 0.75%, to occur in Q2 2016, the same date as we previously
predicted. Further modest increases in official interest rates can then be expected, in small 0.25% steps, with
official interest rates reaching 2.00% in Q4 2017.
Though expectations of an earlier increase have strengthened, we believe worsening global growth prospects will
persuade the MPC to wait. This will be the right decision.
We have consistently argued that premature interest rate increases are unnecessary and too risky, at a time when
the recovery is still fragile and global uncertainties are mounting.
The MPC has stressed that when rates start rising, increases will be gradual and moderate.
But, to be effective and help businesses to plan, the MPC’s messages should be clearer.
The rises in official interest rates envisaged in our forecast, though modest, will dampen demand somewhat, but
will still permit continued economic growth at a satisfactory pace.
Our forecast envisages that the QE programme would be maintained at its current level of £375 billion. No
reduction in the stock of assets held by the BoE would be considered at least until end-2017. But we also predict
that there would be no further increases in QE.
The MPC should do more to support a revival in business lending, both by making better use of the existing QE
programme, and by using measures other than QE alone.
If the MPC agrees to purchase private sector assets other than gilts, such as securitised SME loans, banks would
be less risk-averse in lending to businesses.

10-09-2015 BCC UK Economic Forecast – Q3 2015 PAGE 8 OF 13
UK main sectors: manufacturing, services & construction
The service sector is by far the largest in the UK economy, accounting for 78.4% of total output; the sector will
remain the biggest contributor to GDP growth in the next 3 years.
Service sector output recorded calendar year growth of 3.0% in 2014; it is forecast to grow by 2.8% in 2015, 2.9%
in 2016 and 2.9% in 2017.
The share of services in total UK output is likely to rise a little further in the next few years.
This continued shift towards an increasing reliance on services reflects a long-term change in the structure of the
UK economy, and is not in itself a cause of concern.
Manufacturing and construction output, while performing disappointingly in recent quarters, will record positive
growth from Q3 2015, but at a weaker pace than the service sector.
Manufacturing output rose by 3.1% in calendar year 2014, but the pace of growth weakened recently. In Q2 2015,
year-on-year growth was only 0.6%. We are now forecasting full-year manufacturing output growth of 0.8% in
2015, 1.9% in 2016 & 2.1% in 2017.
For total industrial output, we are forecasting calendar year growth of 1.7% in 2015, 1.8% in 2016 & 1.6% in 2017,
after 1.7% growth in 2014.
Manufacturing is still a significant UK sector, but its share of total output has fallen in recent decades, and now
accounts for only 10.1% of the economy.
Our forecast indicates that the share of manufacturing in total UK output may shrink a little further in the next few
years.
Manufacturing is now a well-managed sector, and many firms have retained their skill bases during the recession.
The sector is still benefiting from a relatively competitive exchange rate, due to large falls between 2007 & 2009.
But recent sterling rises against the euro are creating difficulties.
In spite of the modest eurozone upturn, manufacturing will be hampered in the next few years by a very
challenging global environment. But the sector’s prospects are relatively positive.
Construction output figures remain very volatile. After very strong full-year growth in 2014, construction output
was virtually stagnant in the first half of 2015. We are now forecasting full-year construction output growth of
2.0% in 2015, 2.2% in 2016 & 2.3% in 2017.
Table 3 summarises our forecasts for manufacturing, services, and construction.
Table 3: Manufacturing, Services & Construction Output, % Change Year-on-Year
2012 2013 2014 2015 2016 2017
Manufacturing Output -1.3% -0.7% 3.1% 0.8% 1.9% 2.1%
Total Industrial Production -2.7% -0.5% 1.7% 1.7% 1.8% 1.6%
Construction Output -7.5% 1.4% 9.5% 2.0% 2.2% 2.3%
Services Output 2.0% 1.9% 3.0% 2.8% 2.9% 2.9%

10-09-2015 BCC UK Economic Forecast – Q3 2015 PAGE 9 OF 13
Unemployment and the labour market
The UK labour market weakened slightly in Q2 2015, the first reversal after a very long period of steady quarterly
improvements. Compared with the previous quarter, employment fell in Q2 by 63,000 and unemployment rose
by 25,000.
In spite of the Q2 setback, the UK labour market is dynamic and robust, and remains a source of strength for our
economy. However, youth unemployment, long-term joblessness, and the level of inactivity are all still too high.
Underemployment is also still much too high. 1,287,000 people worked part-time In Q2 2015 because they could
not find a full-time job. 565,000 people were temporary employees in Q2 2015 because they could not find a
permanent job.
The UK unemployment rate is forecast to fall from 5.6% in Q2 2015, to 5.3% in Q2 2016 and 5.0% in Q2 2017; it
will then stay around that level until Q2 2018.
Although our GDP growth forecast has been revised up, unemployment rates are now slightly higher than we
predicted in Q2, due to the following main reasons:
o The unexpected rise in the jobless total in Q2 2015 establishes a higher starting point for our new
unemployment forecast than in our June report.
o The scope for unemployment to fall without triggering inflationary pressures is likely to prove
slightly smaller than we predicted in Q2.
o The large increases in the minimum wage (now redefined as the living wage) announced in the
July 2015 Budget will add to the jobless total in some areas of the labour market.
We are forecasting total unemployment to fall from 1,852,000 in Q2 2015, to 1,752,000 in Q2 2016, 1,667,000 in
Q2 2017, and to 1,662,000 in Q2 2018, a net overall fall in the jobless total of 190,000 over the next 3 years.
Employment will rise in the next few years, but some factors would still exert upward pressure on unemployment,
limiting future declines: Government spending cuts will cause additional public sector job losses, while productivity
increases will limit the need for new workers.
Productivity has been weak since the financial crisis but we expect a gradual improvement in the next few years.
Strengthening UK productivity growth is a major medium-term challenge
A temporary weakness in productivity is acceptable during a recession, because it alleviates human misery and
helps businesses to retain skills. However, living standards will suffer in the long-term if productivity growth fails
to pick up as the economy recovers.

10-09-2015 BCC UK Economic Forecast – Q3 2015 PAGE 10 OF 13
Youth unemployment
With total UK unemployment forecast to fall to 1,662,000 in Q2 2018 (a jobless rate of 5.0%), we are forecasting
that total youth unemployment (people aged 16 to 24) will fall from 739,000 (a jobless rate of 16.0%) in Q2 2015,
to 695,000 (a jobless rate of 14.7%) in Q2 2018, a net fall of 44,000.
In line with international definitions, the youth unemployment figure includes people in full-time education who
were looking for part-time work.
Table 4 summarises our forecasts for total UK unemployment and for youth unemployment.
Table 4: UK labour market: total unemployment, youth unemployment and productivity
Actual Forecast
Q2 14 Q1 15 Q2 15 Q2 16 Q2 17 Q2 18
Unemployment rate, % 6.3% 5.5% 5.6% 5.3% 5.0% 5.0%
Unemployed, 000s 2074 1827 1852 1752 1667 1662
Youth Unemployment rate, % 16.9% 15.9% 16.0% 15.4% 15.0% 14.7%
Youth Unemployed, 000s 776 736 739 717 705 695
Output per hour, 2011=100 98.6 99.4 100.3 101.8 103.4 105.4
Output per hour, YonY % change 0.5% 0.3% 1.7% 1.4% 1.5% 1.8%
Inflation and labour costs
The downward trend in annual CPI inflation has continued in recent months, driven by falls in world oil, food and
other commodity prices.
Annual CPI inflation has been below the 2% target since January 2014. In December 2014, it fell below 1%. Since
February 2015, annual CPI inflation was effectively zero, fluctuating in a very narrow range between 0.1% and -
0.1%.
Annual CPI inflation will stay around zero for a few months, before edging slowly from Q4 2015 onwards, but
remaining below the 2% target at least until mid-2017.
In annual average terms, we are forecasting annual CPI inflation at 0.1% in 2015, 1.2% in 2016 and 2.0% in 2017.
In Q2 we predicted 0.2% in 2015, 1.5% in 2016 and 2.0% in 2017.

10-09-2015 BCC UK Economic Forecast – Q3 2015 PAGE 11 OF 13
For annual average RPI inflation we are now predicting 1.0% in 2015, 2.3% in 2016 and 3.1% in 2017, unchanged
since our Q2 forecast.
Table 5 summarises our specific forecasts for CPI & RPI inflation.
Table 5: UK Annual Inflation, % Change Year on Year
2012 2013 2014 2015 2016 2017
CPI 2.8% 2.6% 1.5% 0.1% 1.2% 2.0%
RPI-All Items 3.2% 3.0% 2.4% 1.0% 2.3% 3.1%
Earnings have recorded underlying increases in recent months. Pay is now rising at a rate well above inflation,
both including and excluding bonuses.
Pay increases in the private sector remain considerably higher than in the public sector.
Our forecast is that earnings growth will continue to edge up in the next few years, in line with higher economic
activity and rising productivity.
We are now predicting that total earnings growth (total pay including bonuses) will average 2.5% in 2015, 3.6% in
2016 and 4.3% in 2017.
UK public finances
Public sector net borrowing in the financial year 2014/15 was lower than the OBR predicted.
The public finances have improved further since April. For the full financial year 2015/16 we expect borrowing to
be some £5.5 billion lower than the OBR predicted in the July Budget.
The OBR’s new medium-term timetable, though challenging, is realistic in our view.
In line with the OBR’s July 2015 forecast, we are now predicting that UK public sector net borrowing will only move
into surplus in 2019/20.
In spite of continued GDP growth, the economy’s capacity to generate tax receipts has been damaged, and we
have to adjust to this reality by making cuts in current spending plans.
Table 6 compares the BCC’s PSNB forecasts, with the OBR’s March 2014 forecasts.
Table 6: Public Sector Net Borrowing (PSNB) – BCC vs. OBR Forecasts
2012 2013 2014 2015 2016 2017 2018
BCC forecast-PSNBex-FinYears-%GDP 7.6% 5.7% 4.9% 3.4% 2.2% 1.2% 0.3%
BCC forecast-PSNBex-FineYears-£bn 119.7 98.5 88.0 64.0 43.0 24.2 6.3
OBR forecast-PSNBex- FinYears-GDP 7.6% 5.6% 4.9% 3.7% 2.2% 1.2% 0.3%

10-09-2015 BCC UK Economic Forecast – Q3 2015 PAGE 12 OF 13
OBR forecast-PSNBex-FinYears-£bn 119.7 98.5 89.2 69.5 43.1 24.3 6.4
Note: Figures show PSNBex, i.e. PSNB excluding public sector banks. Negative PSNB indicates surplus. The OBR forecasts were
produced for the July 2015 Budget.
Policy issues
Our higher growth forecasts confirm our assessment that UK prospects remain positive. But the economy
continues to face many challenges, both domestic and international,
Low inflation, reflecting falls in oil, food and other commodity prices, underpin living standards and support
growth. Low interest rates also help to bolster the UK recovery.
But the underlying reasons for falling commodity prices, mainly weaker demand and the sharp slowdown in
China’s economy, could have adverse effects on global growth.
Britain’s flexible and vibrant labour market remains a source of strength for our economy. But the recent reversal,
though probably temporary, is a warning that the recovery is still fragile.
Limiting the adverse effects on jobs of the higher minimum wage will be a major challenge.
Though the UK will remain near the top of the G7 league table in the next few years, there is no room for any
complacency. Sustaining the UK recovery will be a challenging job.
Global confidence remains dependent on abnormally low official interest rates and on huge QE programmes.
Expected rises in US official interest rates may trigger global upheavals.
In spite of improved eurozone prospects, the agreement over Greece’s debts will only provide temporary relief.
Without radical corrective measures, a new crisis is a realistic risk.
UK growth is relying unduly on consumer spending. Progress towards rebalancing the economy is inadequate.
Although business investment is now growing at a satisfactory pace, Britain’s external position is vulnerable and,
in the longer term, unsustainable.
In particular, our current account deficit has swelled to dangerous levels, mainly due to a sharp worsening in the
primary income balance, as income we pay out on foreign investment in the UK exceeds receipts on UK
investments abroad. The big income deficit makes the need for a stronger trade balance even more critical and
urgent.
In the longer term, the key risks facing the UK are persistently low productivity and the twin fiscal & external
deficits, which are both unacceptably large.
Unless these issues are addressed effectively, they could undermine Britain’s credit rating.
The UK’s ability to generate tax revenues has worsened, due to big falls in oil & gas output and lower profits of UK
banks. We will have to adjust to this harsher and more difficult reality.
This means focusing on policies that would support higher productivity and a strong recovery in exports, and
persevering with the difficult job cutting the fiscal deficit, mainly by reducing further current public spending as a
proportion of GDP.

10-09-2015 BCC UK Economic Forecast – Q3 2015 PAGE 13 OF 13
Contact details
David Kern, Chief Economist at the BCC
E-mail: [email protected]