uk country fiche on pension projectionsas discussed in the uk pensions fiche for the 2015 ageing...
TRANSCRIPT
1
UK country fiche on pension projections
Revised draft version following the peer review by the Ageing Working Group
December 2017

2
Table of Contents Part 1 - Overview of the pension system ................................................................................ 3
1.1 Description ...................................................................................................................... 3
1.1.1 The current State Pension system .................................................................... 3
1.1.2 Change from old system and transition arrangements ................................. 5
1.2 The Private Pension System ...................................................................................... 7
1.3 Public Service Pension Schemes ............................................................................... 7
1.4 Recent reforms of the pension system .................................................................... 8
1.5 Description of the constant policy assumptions used in the projection .............. 9
2.1 Demographic development .................................................................................... 11
Part 3 - Pension projection results ......................................................................................... 16
3.1 Extent of the coverage of the pension schemes in the projections .................... 16
3.2 Overview of projection results ............................................................................... 17
3.3 Main driving forces behind the projection results and their implications for
main items from a pension questionnaire ........................................................................ 18
3.4 Sensitivity testing ..................................................................................................... 19
3.5 Projections including Public Service Pensions ....................................................... 22
3.6 Description of the changes in comparison with the 2006, 2009, 2012 and
2015 projections ................................................................................................................. 24
Part 4 - Description of the pension projection model and its base data ........................... 26
4.1 Institutional context in which those projections are made ................................. 26
4.2 Assumptions and methodologies applied ............................................................ 26
4.3 Data used to run the model ................................................................................... 27
4.4 Reforms incorporated in the model ...................................................................... 27
4.5 General description of the model(s) ...................................................................... 27
4.5.1 The Basic State Pension model....................................................................... 27
4.5.2 Additional Pension Model .............................................................................. 32
4.5.3 New State Pension Model .............................................................................. 33
4.6 Public Service Pensions modelling ......................................................................... 34

3
Part 1 - Overview of the pension system 1.1 Description 1.1.1 The current State Pension system
The UK introduced the new State Pension in April 2016 for people who reach State
Pension age from then onwards. It replaces the previous two tier State Pension system.
The State Pension is financed through a National Insurance system. Participation in the
State Pension system is mandatory. Qualifying years can be made up from qualifying paid
contributions, credits and voluntary contributions.
The full rate of the new State Pension is £159.55 a week (2017/18) (set above the basic
level of means-tested support) but not everyone will receive the full amount in the early
years. People with no National Insurance record before 6 April 2016 who gain 35
qualifying years will receive the full weekly amount when they reach State Pension age.
People with NI contributions from before April 2016 will have calculations made under
transitional arrangements, which take their past National Insurance record into account.
To receive the new State Pension people will need a minimum of ten years on their
National Insurance record.
The State Pension cannot be taken up before the State Pension age, but may be deferred
in return for a higher State Pension (1% per 9 weeks of deferral, or approximately 5.8%
per year).
The National Insurance system
National Insurance contributions (NICs) are social security contributions charged on
earnings, and are paid by employers, employees and the self-employed. There are four
ways to gain entitlement to the new State Pension via the NICs system:
• Employees must pay Class 1 NICs to gain entitlement. In 2017-18, employees pay
0% on earnings between £113 and £157 per week, pay 12% on earnings between
£157 and £866 per week, and 2% on earnings above this.
• The self-employed must pay Class 2 NICs to gain entitlement. In 2017-18, this is a
flat weekly rate of £2.80. They also pay Class 4 NICs, which provides no
entitlement. In 2017-18, Class 4 NICs is 9% on profits between £8,164 and
£45,000 per year, and 2% on profits above this.
• Individuals can purchase Class 3 NICs on a voluntary basis to fill or avoid gaps in
their National Insurance record. In 2017-18, this is a flat weekly rate of £14.25.
• NICs credits provide entitlement without having to pay NICs for special groups e.g.
parents of children under 12 or those who are claiming certain other benefits.
4
Employer NICs provides no entitlement to the new State Pension. Employers pay 13.8%
NICs on all earnings above £157 per week for an employee in 2017-18. For employees
aged below 21-years-old or apprentices aged below 25-years-old, employers pay 0% up
to £866 per week and 13.8% above this.
State Pension age
Currently men can claim their State Pension from age 65 whilst women’s State Pension
age is gradually increasing over the period 2010-2018 from 60 to equalise with men’s
State Pension age at 65 by November 2018. Both will then increase to 66 over the period
2018-2020 and to 67 in 2026-28.
The State Pension age is currently legislated to increase to 68 in 2044-46. However, the
Government completed its first regular State Pension age review in July 2017, which
announced that the increase to 68 will be brought forward to 2037-39. More information
on the State Pension age review process, including the most recent review, can be found
in Section 1.4 (recent reforms of the pension system).
Uprating
Legislation requires that the new State Pension be uprated annually at least in line with
average earnings. However, the Government has discretion to uprate by a different, more
generous, index. Since 2011, the Government has chosen to increase the new State
Pension by the “Triple Lock” - the highest of average earnings, the Consumer Price Index
(CPI) or 2.5%. Following the general election in June, the Confidence and Supply
Agreement between the Conservative and Unionist party and the Democratic Unionist
Party1 set out that: “Both parties have agreed that there will be no change to the Pensions
Triple Lock” for the remainder of the parliament (which is due to end in 2021/22).
Pensioner benefits
Individuals above the female State Pension age have access to Pension Credit, a means-
tested benefit mainly comprising of Guarantee Credit, whereby those with total weekly
income below the Standard Minimum Guarantee (£159.35 for 2017/18) will receive a
‘top up’ payment. Pensioners can also receive other UK benefits such as disability benefits
provided they meet the relevant criteria. There are also universal benefits for those who
reach a certain age including the Winter Fuel Payment, free eye tests, free prescriptions
and free bus travel.
1 https://www.gov.uk/government/publications/conservative-and-dup-agreement-and-uk-government-financial-
support-for-northern-ireland

5
The guaranteed minimum level of Pension Credit must be uprated annually at least in line
with average earnings. All other elements of the state pension system subject to uprating
are uprated by prices.
1.1.2 Change from old system and transition arrangements
As discussed in the UK pensions fiche for the 2015 Ageing Report2, prior to 6 April 2016
the UK State Pension system consisted of a basic State Pension and an earnings-related
additional component (various schemes depending on time of retirement). This system
continues to remain in place for all individuals who reached State Pension age prior to the
introduction of the new State Pension in April 2016. The basic State Pension required 30
years of National Insurance contributions or credits for the full award of £122.30 per week
(2017/18). Those with fewer than 30 years National Insurance record received a
proportionate amount, with no requirement to have a minimum number of NICs to claim.
Individuals could choose to defer taking their State Pension in return for an increment of
1% per 5 weeks of deferral (approximately 10.4% per year), with the option to receive this
as a lump sum if deferring for a year or more. The basic State Pension must be uprated at
least in line with average earnings, but has been uprated by the Triple Lock since 2011,
while the various additional State Pension amounts must be uprated at least in line with
prices, of which CPI is the measure currently used.
Those reaching State Pension age before the introduction of the new State Pension can
also access the Savings Credit element of Pension Credit. Savings Credit further rewards
Pension Credit recipients who have made some provision for their retirement, by paying
them 60p for every £1 of income they have below a certain level (known as the Savings
Credit threshold), up to a maximum of £13.20 per week for a single person and £14.90
per week for a couple (2017/18). Savings Credit is no longer available for those retiring
after April 2016 as the full new State Pension award is above the level of the Standard
Minimum Guarantee.
Some adjustments were made to ensure fairness during the transition from the previous
system to the new State Pension system. Transitional arrangements apply to those with a
National Insurance record before 6 April 2016. These arrangements were carefully
designed not to disadvantage people on either side of 6 April 2016. To ensure fairness,
people do not automatically receive the full rate as their previous National Insurance
record is taken into account. No one will receive less from the new State Pension than
they would have done from the previous system, based on their National Insurance record
up to 6 April 2016.
2 https://europa.eu/epc/sites/epc/files/docs/pages/united_kingdom_-_country_fiche_on_pensions.pdf

6
All who built entitlement under the old system are given a “starting amount” which is the
higher of what their National Insurance record to 6th April 2016 would provide under
either the previous or new system rules. Those with a higher starting amount than the full
rate of the new State Pension award receive the difference as a protected payment. Those
with a lower starting amount than the full amount of new State Pension can add further
qualifying years worth 1/35 of the full amount until they reach the full amount or their
State Pension age, whichever comes first.
Additionally, under the previous system individuals could contract out of the earnings-
related additional State Pension and pay lower National Insurance contributions in return.
Entitlement to the new State Pension is reduced to account for the reduced contributions
made by those who have contracted out. Contracting out is not available under the
current system.
Under the previous system, the pension award received varied significantly depending on
the level of additional pension built up. The introduction of the new State Pension has
made the system simpler as, after the transitional period, all individuals with a full National
Insurance record will receive the same entitlement regardless of earnings – as seen in
diagram below. In the short term the cost of the new system is roughly equivalent to the
previous system, but in the long term the system will become more sustainable as over
time fewer people are enrolled in the additional pension - as highlighted in the Ageing
Report of 2015.
Comparison of the New State Pension (Single tier) with the previous system

7
1.2 The Private Pension System
There are two types of occupational schemes offered by employers, defined benefit (DB)
- pensions based on years of service and final pay, or on career average revalued earnings
– and defined-contribution (DC) - pensions based on contributions and the investment
returns they generate.
The Government has implemented a major reform, first introduced in October 2012,
which means that employers also now have a duty to automatically enrol workers into a
pension. To this end the UK has established the National Employment Savings Trust
(NEST), a DC scheme that employers may use to fulfil their obligation. However, as
employees may continue to opt-out of these pensions, the private pensions system is not
mandatory. So far, the automatic enrolment policy has been a success, with over 8.1
million individuals newly saving or saving more to the end of June 2017. To this date,
about 9% of employees have opted out of being automatically enrolled into a workplace
pension.
Personal pensions, created in 1988, offer a private means of saving for retirement to those
without access to an occupational scheme or who change jobs frequently. Personal
pensions are largely DC schemes as described above.
These reforms do not affect these projections, as private pensions have not been
modelled.
1.3 Public Service Pension Schemes
There are 8 main categories of occupational pension schemes in the UK for public service
workers, which autonomously manage the pensions of staff in the NHS, teachers, civil
servants, staff in local government, police officers, firefighters, the armed forces and
judges, and which are under the direct control of Ministers. These schemes pay out
benefits in addition to and separately from the State Pension, and are based on a
member’s time in service and earnings. Together, these pension schemes are known as
Public Service Pension schemes (PSPs). There are also around 300 smaller Non-
Departmental Public Body Pension Schemes, which are partly funded through
Government grants, and which have more autonomy in designing and administering their
pension schemes.
Scheme benefits vary from one scheme to another; with some being based on a member’s
final salary and others on a member’s career average revalued earnings. Schemes also
have different accrual rates, revaluation rates, Normal Pension Ages, employee and
employer contribution rates, lump sum commutation rates and indexation rates.

8
As detailed in previous versions of the UK pensions fiche, the 2011 change in indexation
of PSPs (moving from RPI to CPI) contributed strongly to the sustainability of the PSP
system. Furthermore, in 2013, most PSP schemes moved from being calculated based on
‘career final salary’ to ‘career average salary’, thereby further decreasing PSP expenditure
and increasing the sustainability of the system.
1.4 Recent reforms of the pension system
In light of continuing increases in life expectancy, the Government recognised the need
for a structured framework to lock State Pension age into a coherent strategy for the
whole of the pensions system. This was delivered through the Pensions Act 2014, which
requires the Government to conduct periodic reviews of State Pension age at least once
every 6 years. Each review should follow the framework for considering changes to State
Pension age set out by the Government in the January 2013 White Paper ‘The single-tier
pension: a simple foundation for saving‘, which stated that any change:
• should be based on maintaining a given proportion of adult life in receipt of State
Pension;
• should take into account the latest demographic data available and be informed
by wider factors that could be taken into account when setting State Pension age;
and
• should seek to provide a minimum of 10 years’ notice for individuals affected by
changes to State Pension age.
To this end, the Pensions Act 2014 requires the Government to commission both a report
by the Government Actuary and a report by an Independent Reviewer, to inform the
Government review and ensure that it is based on the most recent data.
In July 2017, the Government completed the first review into the State Pension age3. This
review was informed by a report by the Government Actuary4 and a report by independent
reviewer John Cridland CBE5. In its final report, the Government announced it will bring
forward the increase in State Pension age to 68 from 2044-46 to 2037-39, and that in
the long run the State Pension age timetable should follow the principle of up to 32% of
adult life spent in retirement.
There will be a further review before legislating to bring forward the rise in State Pension
age to 68, to enable consideration of the latest life expectancy projections and to allow
an evaluation of the effects of previous increases in State Pension. The publication of the
3 https://www.gov.uk/government/publications/state-pension-age-review-final-report 4 https://www.gov.uk/government/publications/state-pension-age-periodic-review-report-by-the-government-
actuary 5 https://www.gov.uk/government/publications/state-pension-age-independent-review-final-report

9
State Pension age review and the announcement of the planned changes is part of the
Government’s commitment to have a clear baseline and managed pace of change that
will ensure adequate notice, including seeking to provide people with 10 years’ notice of
any changes to their State Pension age.
1.5 Description of the constant policy assumptions used in the projection
The UK’s Office for Budget Responsibility (OBR)6 produces regular Fiscal Sustainability
Reports7 which set out long-term projections for spending, revenue and financial
transactions, and assess whether they imply a sustainable path for the public finances.
On pensions, they make two important assumptions on the path of the State Pension age
and the mechanism used to uprate the State Pension. These have had to be amended for
the purposes of these projections to meet the definition of constant policy, as defined by
the Ageing Working Group (AWG). The details of these adjustments are set out below:
State Pension age
The Government has legislated for a review of the State Pension age to take place at least
once every six years. These reviews are informed by a technical assessment by the
Government Actuary and an additional report considering other relevant factors. Details
of the core principle to guide that review were set out alongside Autumn Statement 2013:
that people should expect to spend on average a up to a third of their adult life (beginning
from age 20) in receipt of the State Pension, with at least ten years’ notice provided and
changes being phased in over two years. In their most recent projections (published in
January 2017), the OBR assumed that State Pension age will increase such that the average
individual will spend 33.3% of adult life above State Pension age (this is also known as
the longevity link).
Neither the OBR’s longevity link assumption or the specific changes announced in the
recent State Pension age review have been incorporated in these projections. This is
because they have not yet been legislated for, and hence do not meet the AWG agreed
definition of ‘constant policy’.
The ‘constant policy’ assumption requires us to only take into account policy changes that
have been legislated for. Therefore, the projections included in this report are based on
the legislated timetable for increasing the State Pension age, which is set out below:
• Female State Pension age rising to 65 (equal to male State Pension age) between
April 2010 and November 2018;
6 http://budgetresponsibility.org.uk/ 7 http://budgetresponsibility.org.uk/fsr/fiscal-sustainability-report-january-2017/

10
• State Pension age rising to 66 between December 2018 and April 2020;
• State Pension age rising to 67 between April 2026 and April 2028; and
• State Pension age rising to 68 between April 2044 and April 2046;
State Pension uprating
As discussed in Section 1.1.1, since 2011, the State Pension has been uprated each year
by the Triple Lock, where pensions increase by the highest of CPI, average earnings growth
or a 2.5% underpin. Triple lock uprating has been included in these projections until 2021-
22, to reflect the Government’s commitment to keep it in place for the duration of the
current parliament. To meet the ‘constant policy’ assumption, after 2021-22 the State
Pension is uprated by average earnings (as required by legislation). This reflects the fact
that the Triple Lock has not been legislated for.
Implications for the projection
The combination of different policy, population and macroeconomic assumptions
between the OBR’s Fiscal Sustainability Report and the projections provided for the 2018
Ageing Report mean that the two sets of figures are not directly comparable. However,
both projections indicate that demographic change will put upwards pressure on pension
spending over the coming decades.
The adjustments we have made to the assumptions used in the FSR have different
implications for the projection of pension spending, relative to that included in the OBR’s
report. All else equal, using only the legislated timetable for increases to the State Pension
age results in a higher spending projection relative to FSR. On the other hand, not
incorporating the Triple Lock over the entire projection horizon results in a relatively lower
spending projection, which likely outweighs the effect of the State Pension age
assumption.

11
Part 2 - Demographic and macroeconomic projections
This section of the fiche considers the demographic and macroeconomic assumptions used to produce the projections. It also focuses on how these have change compared to those used in the 2015 Ageing Report.
2.1 Demographic development
Table 1 shows how a number of key demographic variables are expected to evolve over the projection period.
Table 1 Main demographic variables evolution
2016 2020 2030 2040 2050 2060 2070
Peak year*
Population (thousand) 65,607 67,466 71,758 75,152 77,670 79,419 81,041 2070
Population growth rate 0.7 0.7 0.6 0.4 0.3 0.2 0.2 2016
Old-age dependency ratio (pop65/pop15-64)
27.9 29.3 34.4 38.5 40.2 43.5 46.0 2070
Ageing of the aged (pop80+/pop65+)
26.9 27.4 31.1 33.1 39.2 37.9 40.3 2070
Men - Life expectancy at birth
79.6 80.2 81.6 83.0 84.2 85.4 86.5 2070
Men - Life expectancy at 65
18.8 19.2 20.1 21.1 22.0 22.8 23.6 2069
Women - Life expectancy at birth
83.3 83.9 85.3 86.7 87.9 89.0 90.1 2070
Women - Life expectancy at 65
21.3 21.7 22.8 23.8 24.8 25.7 26.5 2070
Men - Survivor rate at 65+ 87.5 88.2 89.9 91.3 92.5 93.5 94.4 2070
Men - Survivor rate at 80+ 60.2 62.1 66.7 70.8 74.5 77.7 80.6 2070
Women - Survivor rate at 65+
91.7 92.2 93.4 94.4 95.2 95.9 96.5 2070
Women - Survivor rate at 80+
71.4 73.2 77.1 80.5 83.4 85.9 88.1 2070
Net migration 244.0 251.5 220.1 181.0 134.2 121.1 107.3 2017
Net migration over population change
0.5 0.5 0.6 0.6 0.6 0.8 0.7 2059
Source: Eurostat, EU Commission.
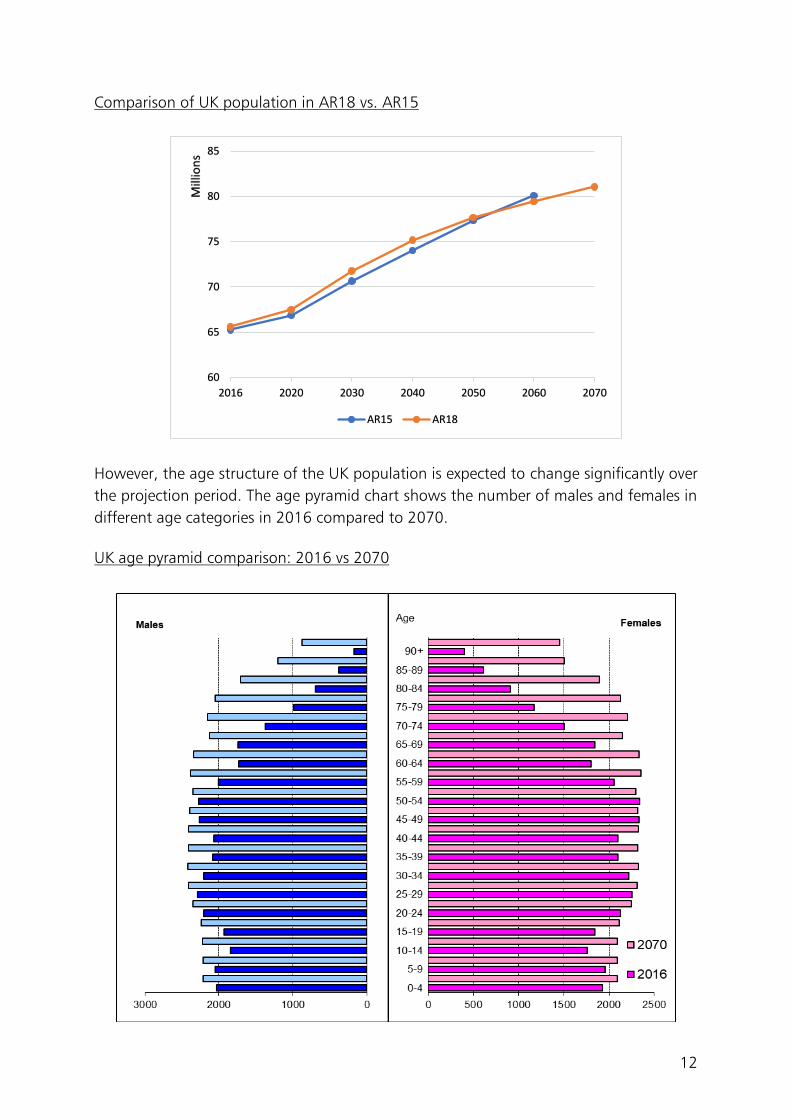
The Eurostat population projections show the UK’s population rising, from 65.6m in 2016
to 81.0m people in 2070. The UK is currently the second most populous member state
but according to Eurostat projections it will become the most populous in 2070.
The UK population projection is broadly unchanged compared to the previous Eurostat
projection used in the 2015 Ageing Report. As the chart below shows, the UK population
is projected to be marginally higher between 2016 and 2050, but comparing the two
projections in year 2060, the latest projection is lower (79.4m compared to 80.1m
previously.
12
Comparison of UK population in AR18 vs. AR15
However, the age structure of the UK population is expected to change significantly over
the projection period. The age pyramid chart shows the number of males and females in
different age categories in 2016 compared to 2070.
UK age pyramid comparison: 2016 vs 2070
60
65
70
75
80
85
2016 2020 2030 2040 2050 2060 2070
Mill
ion
s
AR15 AR18

13
The change in the age-structure of the population means that the old-age dependency
ratio8 is projected to increase from 27.9 in 2016 to 43.5 in 2060, and then 46.0 in 2070.
This is marginally below the EU-wide level.
Throughout the projection period the old-age dependency ratio is broadly in line with
what was anticipated in the 2015 Ageing Report. However, towards the end of the
projection period the trend diverges slightly and we see a more significant ageing effect
between 2050 and 2060. This results in the old-age dependency ratio reaching 43.5 in
2060, rather than 42.8, as projected in the last Ageing Report. The trend then moderates
slightly but the old-age dependency still reaches 46.0 in 2070.
Comparison of UK old-age dependency ratio in AR18 vs. AR15
The Eurostat net migration projection has changed significantly since the last Ageing
Report. As shown in the chart below, while net migration starts at a much higher level
than projected in the 2015 Ageing Report, over the projection period it falls to a much
lower long-term level. In 2060, net migration (000’s) is projected to be 121.1 which is a
reduction of just over 50,000 from the level anticipated in the 2015 Ageing Report –
171.2 for the same year.
As migrants tend to be concentrated at working ages, the change in this assumption may
be part of the reason the UK’s old-age dependency ratio is projected to increase by more
than was expected in the last Ageing Report.
8 This is defined as the population aged 65 and over as a percentage of the population aged 15-64
25
30
35
40
45
50
2016 2020 2030 2040 2050 2060 2070
AR15 AR18

14
Comparison of UK net migration in AR18 vs. AR15
Table 2 shows how labour force characteristics of older workers are projected to develop over the projection period.
Table 2 Participation rate, employment rate and share of workers for the age groups 55-64 and 65-74
2016 2020 2030 2040 2050 2060 2070
Peak year*
Labour force participation rate 55-64
66.0 66.7 68.9 71.1 73.7 73.9 74.2 2066
Employment rate for workers aged 55-64
63.5 63.9 65.8 67.9 70.3 70.5 70.8 2066
Share of workers aged 55-64 on the labour force 55-64
96.3 95.8 95.5 95.4 95.4 95.4 95.4 2016
Labour force participation rate 65-74
16.8 14.8 16.3 16.7 21.0 22.4 21.8 2058
Employment rate for workers aged 65-74
16.6 14.5 15.9 16.4 20.5 21.9 21.4 2058
Share of workers aged 65-74 on the labour force 65-74
98.6 98.2 97.9 98.0 97.9 97.9 98.0 2016
Median age of the labour force
40.0 39.0 39.0 40.0 40.0 41.0 41.0 2051
Source: Eurostat, EU Commission.
The UK has historically had a higher than EU average participation rate in the labour
market, and this trend is expected to continue. Among older workers the projected
participation rate increases as the population ages. For those aged 55-64 this rises from
66% in 2016 to 74% in 2070; for those aged 65-74 this rises from 17% in 2016 to 22%
0
50
100
150
200
250
300
2020 2030 2040 2050 2060 2070
AR15 AR18

15
in 2070. These labour market indicators are projected to evolve in much the same way,
and to a similar extent, as they were in the 2015 Ageing Report.
TABLE 3a Labour market effective exit age and expected duration of life spent at retirement - MEN
2017 2020 2030 2040 2050 2060 2070
Peak year
Average effective exit age (CSM) (II)
65.0 64.8 65.1 65.1 65.8 65.8 65.8 2049
Duration of retirement 18.9 19.2 20.1 21.1 21.1 21.9 22.7 2069
Percentage of adult life spent at retirement
28.7 29.1 29.9 31.0 30.6 31.4 32.2 2069
Early/late exit 1.5 1.2 1.2 1.3 1.4 1.5 1.5 2052
TABLE 3b Labour market effective exit age and expected duration of life spent at retirement - WOMEN
2017 2020 2030 2040 2050 2060 2070
Peak year
Average effective exit age (CSM) (II)
63.8 64.5 65.1 65.1 65.8 65.8 65.8 2048
Duration of retirement 22.2 21.7 22.8 23.8 23.9 24.8 25.6 2070
Percentage of adult life spent at retirement
32.7 31.8 32.6 33.6 33.4 34.2 34.9 2070
Early/late exit 1.3 1.6 1.5 1.5 1.4 1.5 1.5 2026
Source: Eurostat, EU Commission.
The labour market effective age of exit also increases over the projection period,
particularly for women. However, this does not keep pace with increases in longevity, and
so proportion of adult life spent in retirement also increases across the projection period
for both genders. As with the other labour market indicators discussed above, these
measures are also projected to develop is broadly the same way as anticipated in the 2015
Ageing Report.

16
Part 3 - Pension projection results
3.1 Extent of the coverage of the pension schemes in the projections
These projections include the new State Pension and protected payments, basic State
Pension, graduated retirement pension, lump sum payments, additional State Pension
(state second pension, SERPS), non-contributory pension and Pension Credit. It also
includes the pensioners’ Winter Fuel Payment, housing benefit for pensioners, a free TV
licence for those over 75 and a £10 Christmas bonus paid to those receiving the State
Pension.
As was the case for the 2015 Ageing Report, we have not included disability benefits for
pensioners, as this is not a pension, and seems to be excluded by the guidance.
We have not included any projections for PSPs in our central pensions projection tables,
as projections for PSPs are done by the Government Actuary’s Department, whose model
is not configured to use the EU macroeconomic assumptions. However, we have provided
a separate estimate for spending on PSPs in Section 3.5.
The ESSPROS assumptions below include Public Service Pensions, and hence have higher
projected expenditure. Note that we have used a Euro to Sterling conversion rate of
0.805942 (from the HMRC 2016 average). As the UK works in financial years (beginning
April), we have used the uprating index for year Y to provide the uprating for year
Y+1/Y+2. This is because under UK benefit uprating, indices for July and September in
2016 will be used to determine benefit rates in 2017/18. In the output tables, financial
years are presented.
TABLE 4 Eurostat (ESSPROS) vs. Ageing Working Group definition of pension expenditure (% GDP)
2007 2008 2009 2010 2011 2012 2013 2014
1 Eurostat total pension expenditure
9.8 10.2 11.3 11.4 11.4 11.7 11.5 11.3
2 Eurostat public pension expenditure
6.1 6.3 7.0 6.9 6.9 7.0 6.8 6.7
3 Public pension expenditure (AWG)
: : : 5.5 5.6 5.7 5.7 5.9
4 Difference (2) - (3)
: : : 1.4 1.3 1.2 1.1 0.7
Source: Eurostat, EU Commission.

17
3.2 Overview of projection results
Under the AWG approach as per Table 5, pension expenditure for the UK is projected to
increase between 2016 and 2070, from 5.7% of GDP to 7.4% in 2070.
TABLE 5 Projected gross and net pension spending and contributions (% of GDP)
Expenditure 2016 2020 2030 2040 2050 2060 2070 Peak year*
Gross public pension expenditure (excluding PSP)
5.7 5.5 5.8 6.5 6.4 6.9 7.4 2069
Spending (as a proportion of GDP) falls between 2016 and 2020 due to the acceleration
in female State Pension age rises between 2010 and 2018, and a general rise in male and
female State Pension ages between 2018 and 2020.
The projected increase in spending is largest between 2030 and 2040, which is partially
due to the retirement of the baby boomer generation. The (currently) legislated change
in SPA in the mid-2040’s results in projected spending levelling off up to around 2050.
After this point is rises steadily for the remainder of the projection period.
TABLE 6 Projected gross public pension spending by scheme (% of GDP)
Pension scheme 2016 2020 2030 2040 2050 2060 2070 Peak year *
Total public pensions 5.7 5.5 5.8 6.5 6.4 6.9 7.4 2069
of which
Old age and early pensions:
4.9 5.0 5.4 6.1 6.0 6.5 7.0 2069
Flat component 3.8 3.9 4.8 5.9 5.9 6.5 7.0 2069
Earnings related 1.1 1.0 0.5 0.2 0.0 0.0 0.0 2016
Minimum pensions (non-contributory) i.e. minimum income guarantee for people above 65
0.0 0.0 0.0 0.0 0.0 0.0 0.0 2029

18
3.3 Main driving forces behind the projection results and their implications for main items from a pension questionnaire
Note that only a single table 7 is provided here. Since only the State Pension is being
modelled, and since it is a universal pension, the number of pensioners and pensions is
equal.
TABLE 7 Factors behind the change in public pension expenditures between 2016 and 2070 using pension data (in percentage points of GDP) - pensions
2016-20 2020-30 2030-40
2040-50
2050-60
2060-70
2016-70
Average annual change
Public pensions to GDP
-0.2 0.4 0.7 -0.2 0.5 0.5 1.7 0.028
Dependency ratio effect
0.2 1.0 0.7 0.3 0.5 0.4 3.1 5.7%
Coverage ratio effect
-0.5 -0.5 0.0 -0.4 0.0 0.3 -1.1 -2.0%
Cohort effect* 0.0 -1.1 -0.6 0.1 -0.6 -0.3 -2.6 -5.0%
Benefit ratio effect
0.0 0.0 0.1 0.0 0.1 -0.2 0.0 -0.4%
Labour Market/Labour intensity effect
0.0 -0.1 -0.1 -0.1 -0.1 0.0 -0.3 -0.6%
Employment ratio effect
0.0 -0.1 -0.1 0.0 0.0 0.0 -0.2 -0.4%
Labour intensity effect
0.0 0.0 0.0 0.0 0.0 0.0 0.0 0.0%
Career shift effect
0.0 0.0 0.0 0.0 -0.1 0.0 -0.1 -0.2%
Residual 0.0 -0.1 0.0 0.0 0.0 0.0 -0.1 -0.1%
* Sub components of the coverage ratio effect do not add up necessarily.
TABLE 8 Replacement rate at retirement (RR), benefit ratio (BR) and coverage by pension scheme (in %)
2016 2020 2030 2040 2050 2060 2070
Public scheme (BR)
28% 28% 29% 29% 29% 30% 29%
TABLE 9 System dependency ratio and old-age dependency ratio
2016 2020 2030 2040 2050 2060 2070
Number of pensioners (thousand) (I)
13165.4 12845.6 14186.0 16210.0 16295.8 17608.1 19568.7
Employment (thousand) (II)
32035.2 32479.0 33882.3 35091.7 36384.0 36769.7 36890.6
Pension System Dependency Ratio (SDR) (I)/(II)
41.1 39.6 41.9 46.2 44.8 47.9 53.0
Number of people aged 65+ (thousand) (III)
11799.9 12574.6 15256.0 17420.9 18600.0 20195.2 21452.4

19
Working age population 15 - 64 (thousand) (IV)
42225.2 42959.4 44313.7 45214.2 46313.6 46389.8 46665.4
Old-age Dependency Ratio (ODR) (III)/(IV)
27.9 29.3 34.4 38.5 40.2 43.5 46.0
System efficiency (SDR/ODR)
1.5 1.4 1.2 1.2 1.1 1.1 1.2
The driving force behind the increased expenditure as a proportion of GDP is mainly down
to the dependency ratio effect, offset to some extent by the coverage ratio effect.
3.4 Sensitivity testing
Given the uncertainty surrounding the assumptions of long-run projections, it is necessary
to carry out a number of sensitivity tests so as to quantify the responsiveness of projection
results to changes in key underlying assumptions.
In all the scenarios that follow, our scenario modelling has been limited to changing the
following inputs: CPI, earnings growth (calculated based on the average gross wage
assumption), the Triple Lock (highest of CPI inflation, average earnings growth or a 2.5%
underpin) (we model this in the medium term out to 2021/22 only), GDP deflator, nominal
GDP, average gross wage (for the benefit ratio calculation), and populations (by age and
gender).
Any other inputs/ factors have been left static. For example, the State Pension age has not
been altered. We have not adjusted the rate of claiming of means tested benefits in any
of the sensitivities and it has not been possible to update the labour market or State
Pension age impacts to the model. Although several the inputs in the model cannot be
adjusted, which can make it difficult to carry out sensitivity testing, we can make several
observations about these results (for full results see Table 10).
In the next section, there is a description of each sensitivity scenario followed by a brief
overview of how the result it generates diverges from the central projection.
• Higher life expectancy: A scenario with an increase of life expectancy at birth of about two years by 2070 compared with the baseline projection.
Projection results: compared to the baseline scenario, the assumption of higher life
expectancy results in an increase in projected expenditure of 0.5ppt of GDP in 2070. As
life expectancy increases, so do entitlement periods which causes an increase in pension
expenditure.

20
• Lower/higher total factor productivity (TFP) growth: A scenario where TFP growth
is assumed to converge by 2045 to a growth rate which is 0.4 p.p. lower/higher
than in the baseline scenario (0.6% and 1.4% respectively in the two alternative
scenarios). The increase is introduced linearly during the period 2026-2045.
Projection results: this scenario has a minimal impact on the projection results (less than
0.1ppt of GDP). The main transmission mechanism from TFP growth to pension
expenditure is average earnings, however, although this is the mechanism used to uprated
the State Pension in this projection, it appears that the change in GDP offsets this
somewhat (i.e. spending as a proportion of GDP is similar).
• Lower/higher employment rate: A scenario with the employment rate being 2 p.p.
lower/higher compared with the baseline projection for the age-group 20-64. The
decrease/increase is introduced linearly over the period 2018-2030 and remains 2
p.p. higher thereafter. The higher employment rate is assumed to be achieved by
lowering the rate of structural unemployment (the NAWRU).
Projection results: a rise in the employment rate compared to the baseline scenario is
projected to cause a reduction in pension expenditure of 0.2ppt of GDP in 2070. On the
other hand, a reduction in the employment rate is projected to cause an increase in
expenditure, of equal magnitude.
• Higher employment rate of older workers: A scenario with the employment rate of
older workers (55-74) being 10 p.p. higher compared with the baseline projection.
The increase is introduced linearly over the period 2018-2030 and remains 10 p.p.
higher thereafter. The higher employment rate of this group of workers is assumed
to be achieved through a reduction of the inactive population.
Projection results: an increase in the employment rate of the elderly (55-74 years) in relation to the baseline scenario result in lower projected pension expenditure, of 0.4ppt of GDP in 2070.
• Lower/higher migration: A scenario with 33% less/more migration compared with
the baseline projection.
Projection results: in the low migration scenario, projected pension expenditure is 0.4ppt
of GDP higher in 2070 relative to the baseline. Lower migration leads to a lower working
age population, resulting in an increase in the old-age dependency ratio. Higher migration
has the opposite effect, leading to a reduction in projected expenditure relative to the
baseline, of 0.3ppt of GDP in 2070.

21
• Lower fertility: A scenario with 20% lower fertility gradually by 2070 compared
with the baseline projection.
Projection results: the low fertility scenario results in the biggest deviation from the
baseline. Under this scenario, pension expenditure is projected to be 1.3ppt of GDP higher
in 2070. In this scenario, GDP is projected to be significantly lower, meaning the change
in expenditure/GDP is large in part due to a denominator effect.
• Lower TFP growth (risk scenario): A scenario where TFP growth is assumed to
converge to 0.8% (the target rate) in 2045.
Projection results: as with the other TFP scenarios, this has a minimal impact on projected
expenditure (of around +0.04ppt of GDP in 2070).
• Policy-change scenario: This scenario considers the adoption of an automatic
mechanism. Retirement ages are shifted year-over-year in line with change in life
expectancy at current retirement ages.
Projection results: This policy-change assumption leads to a reduction in projected pension
expenditure of 0.5ppt of GDP in 2070 (relative to the baseline).
Sensitivity analysis: deviation from baseline projection in 2070 (ppt of GDP)
-1 -0.5 0 0.5 1 1.5
2% ER
Neg 2% ER
Higher TFP
Lower TFP
10% Older
Risk
Shift
Higher Migration
Lower Migration
HLE
Lower Fertility

22
TABLE 10 Public and total pension expenditure under different scenarios (p.p. deviation from the baseline)
Public Pension Expenditure
2016 2020 2030 2040 2050 2060 2070
Baseline 5.7 5.5 5.8 6.5 6.4 6.9 7.4
Higher life expectancy (2 extra years)
0.0 0.0 0.1 0.2 0.3 0.4 0.5
Higher Total Factor Productivity Growth (+0.4 pp.)
0.0 0.0 0.0 0.0 0.0 0.0 0.0
Lower Total Factor Productivity Growth (-0.4 pp.)
0.0 0.0 0.0 0.0 0.0 0.0 0.0
Higher emp. rate (+2 pp.)
0.0 0.0 -0.2 -0.2 -0.2 -0.2 -0.2
Lower emp. rate (-2 pp.)
0.0 0.0 0.2 0.2 0.2 0.2 0.2
Higher emp. of older workers (+10 pp.)
0.0 -0.1 -0.3 -0.4 -0.4 -0.4 -0.4
Higher migration (+20%)
0.0 0.0 -0.2 -0.3 -0.4 -0.4 -0.3
Lower migration (-20%)
0.0 0.0 0.2 0.3 0.4 0.5 0.4
Lower fertility 0.0 0.0 0.0 0.2 0.4 0.8 1.3
Risk scenario 0.0 0.0 0.1 0.1 0.0 0.0 0.0
Policy scenario: linking retirement age to increases in life expectancy
0.0 0.0 -0.1 -0.2 -0.2 -0.3 -0.5
3.5 Projections including Public Service Pensions
Although our central projection did not include PSPs we have included in this section a
projection of total public pensions expenditure including a projection of expenditure on
PSPs. This is to provide a comparison with previous years and give an idea of the relative
magnitude of this line of spending.
This projection is based on the most recent modelling done by the Government Actuary
(GAD) that was published in the OBR’s Fiscal Sustainability Report in January 2017. The
most recent FSR projection incorporates previous policy reforms: to increase employee
contributions; uprate payments with CPI; and amend scheme benefits in line with the
Public Service Pensions Act 2013, pensions including linking pension age to the State
Pension age.
According to the OBR, gross PSP expenditure is projected to fall from 2.1% of GDP in
2021-22 to 1.3% of GDP in 2066-67. To a large extent, this decline reflects reforms that
have been introduced since 2010 and the reductions to the public-sector workforce.
The OBR’s projection for cash spending on PSPs was higher than in their previous report,
which is mainly due to a revised workforce growth assumption. In previous FSRs, the OBR
applied a uniform assumption for medium-term growth across all pension schemes. In
the 2017 FSR, the OBR used disaggregated figures consistent with the 2015 Spending

23
Review settlements. They assume that the public-sector workforce will rise in line with
total employment growth over the long term, this was 0.35 per cent a year in the latest
FSR. Because of these and other smaller modelling changes, the OBR project spending on
public service pensions to be 0.2 per cent of GDP higher in 2066-67 than in their previous
report.
The projection of PSP spending provided in this report takes the latest OBR projection for
nominal PSP spending and expresses this as percentage of GDP, using the level of GDP
provided in the EU macroeconomic assumptions. The difference between the GDP
assumption in the 2017 FSR and the 2018 Ageing Report mean that the path of PSP
spending (expressed as a proportion of GDP) is different.
As shown in the table and chart below, the path for PSP spending is flat over the
projection period when using the 2018 Ageing Report GDP assumption, at around 2% of
GDP.
TABLE 11 Projected pension expenditure (% of GDP)
Expenditure 2016 2020 2030 2040 2050 2060 2070 Peak
Central projection 5.7 5.5 5.8 6.5 6.4 6.9 7.4 2069
Public Service Pensions 2.1 2.2 2.2 2.1 1.9 2.0 2.0 2025
Total* 7.7 7.7 8.0 8.6 8.3 8.9 9.5 2070
*figures may not sum due to rounding
Projection of total pension expenditure: central projection plus PSPs
0.0
1.0
2.0
3.0
4.0
5.0
6.0
7.0
8.0
9.0
10.0
2016 2020 2030 2040 2050 2060 2070
% o
f G
DP
Baseline PSPs

24
Compared to the 2015 Ageing Report, the projection for spending on PSPs is broadly similar. This reflects the fact that most of the measures designed to improve the sustainability of the system were also incorporated in the 2015 projection. Comparison of projected spending on PSPs in AR15 vs. AR18
Source: HMT calculations based on the OBR Fiscal Sustainability Report 2017
3.6 Description of the changes in comparison with the 2006, 2009, 2012 and 2015
projections
TABLE 12 Overall change in public pension expenditure to GDP under the 2006, 2009, 2012 and 2015 projection exercises - pensions
Public
pensions to GDP
Dependency ratio
Coverage ratio
Employment effect
Benefit ratio Labour
intensity
Residual (incl.
Interaction effect)
2006 * 1.89 4.66 0.00 -0.13 0.00 : -2.64
2009 ** 2.70 4.25 -1.43 -0.29 0.51 : -0.34
2012 *** 1.50 4.13 -1.85 -0.32 -0.10 0.01 -0.37
2015**** 0.73 3.85 -1.58 -0.48 -0.73 0.00 -0.34
2018***** 1.75 3.14 -1.08 -0.18 0.04 0.02 -0.20
* 2004-2050; ** 2007-2060; *** 2010-2060; **** 2013-2060; *****2016-2070
As the table shows, the projected increase in pension expenditure over the projection
period is notably higher in the 2018 Ageing Report compared to the 2015 Ageing Report.
This is headline measure is slightly misleading, and the two projections are very similar.
Projected pensions expenditure was on an upwards trajectory in the final decade of the
2015 projection (2050 – 2060), and the new projection of the 2018 Ageing Report
0
0.5
1
1.5
2
2.5
2016 2020 2030 2040 2050 2060 2070
AR15 AR18

25
essentially indicates that demographic developments will continue to put upwards
pressure on spending, in the absence of further policy change9.
The next chart shows a year-by-year comparison of projected spending in the two reports.
Comparison of the baseline projection in AR15 and AR18
For most of the projection period, pension expenditure is projected to be lower than
anticipated in the 2015 Ageing Report. This largely reflects demographic developments
(see section 2 for a comparison of the projected old-age dependency ratio in the two
projections). However, towards the end of the projection period, projected expenditure
starts to converge, in line with the demographic developments. In the final years of the
projection, the old-age dependency ratio is higher than anticipated in the 2015 Ageing
Report, resulting in a steady rise in projected spending.
9 As discussed in Section 1.4, the Government recently completed the first review into the State Pension age. This announced measures that will improve the long-run sustainability of the UK pension system. However, as discussed in Section 1.5, they do not meet the agreed Ageing Working Group definition of ‘constant policy’ and as such have not been incorporated in the projection.
0.0
1.0
2.0
3.0
4.0
5.0
6.0
7.0
8.0
2016 2020 2030 2040 2050 2060 2070
% o
f G
DP
AR15 AR18

26
Part 4 - Description of the pension projection model and its base data 4.1 Institutional context in which those projections are made
These projections are run by the Department for Work and Pensions (DWP). The models
used are principally for the provision of long-term pensioner benefit expenditure to the
UK Office for Budget Responsibility. These are published annually in the Fiscal
Sustainability Report (http://budgetresponsibility.org.uk/fsr/fiscal-sustainability-report-
january-2017/) and on the DWP website
(https://www.gov.uk/government/publications/benefit-expenditure-and-caseload-tables-
2017 ).
4.2 Assumptions and methodologies applied
The projections are made up from a combination of four different models on an aggregate
basis. For the EU Ageing Report projections, we have taken the projections produced for
the 2017 Fiscal Sustainability Report forecasts as a starting point, and adjusted them as
follows:
• changed the population assumptions to use those provided by the EU;
• changed the economic assumptions to use those provided by the EU (see further
details below).
• our long-term projection models only extend to 2069. The projections have been
extended an additional year to 2070, by maintaining expenditure as a constant
proportion of GDP from 2069 (so the 2069 projections are scaled by the ratio of
GDP in 2070 to GDP in 2069), using the GDP assumptions provided by the EU.
For uprating assumptions, we have used the CPI assumptions provided by the EU, and
average earnings growth assumptions based on the gross mean earnings assumptions
provided by the EU. This resulted in an average earnings growth assumption of 14.03%
for 2015, which affects the 2016 projections. To avoid this extreme value we have instead
used the UK Office for Budget Responsibility’s assumption of 2.9% average earnings
growth for 2015 only.
We made the following assumptions on pensioner benefits policy:
• on uprating of the State Pension, we assumed that the State Pension would be
uprated by the triple lock (the highest of CPI, average earnings growth, or 2.5%)
until 2021 after which it would be uprated by average earnings growth;

27
• on State Pension age, we used the currently legislated State Pension age timetable
in the UK. This does not take into account the recommendations of the State
Pension Age Review published in July 2017.
4.3 Data used to run the model
The models use a wide variety of administrative data collected in the process of assessing
and paying DWP benefits; plus managing the National Insurance system in the UK. Some
of the models also incorporate survey data from a variety of household surveys. The
sources are given in more detail below, against the general description of each model.
4.4 Reforms incorporated in the model
Since the previous EU Ageing Report, we have added a new model to model the new
State Pension, which applies to people reaching State Pension age from 6 April 2016
onwards.
4.5 General description of the model(s)
The models used consist of:
• a payouts-based model for basic State Pension, GRAD and lump sums, based on
estimates/forecasts of pension payments at State Pension age for current and
future pensioners;
• an accruals-based model for Additional Pension, in which estimates of entitlement
accrued during people’s working lives (revalued by earnings growth) are used to
estimate their entitlements to Additional Pension from State Pension age.
• a payouts-based model for new State Pension, based on estimates/forecasts of
pension payments at State Pension age for current and future pensioners.
4.5.1 The Basic State Pension model
General description of the model
The model is built in SAS and of an aggregate stock flow design. This means that it has
inflows and outflows which are used to generate a caseload forecast each year. The
caseload forecast is then multiplied by average amounts to create an expenditure forecast.
This model also produces the GRAD forecast. Lump sums are modelled in a separate Excel
model.

28
The aggregation in the model is as follows:
• Country of residence – GB, non-frozen rate overseas, frozen rate overseas.
• Sex – male, female.
• Marital status – male, single female, married female, divorced female, widowed
female.
• Age – State Pension age up to age 125.
• Personal entitlement – 0%, 0-50%, 50-60%, 60-80%, 80-100%, 100%.
• Category of pension – A, B, D (which combined with marital status and personal
entitlement information gives further breakdowns).
The model aggregation results in 17,550 groups. However many of these groups are not
possible, such as anyone with Category D below age 80. Many assumptions used in the
model are also generated at a higher level. For example mortality is only considered based
on age, sex and country of residence which reduces the number of mortality assumptions
to 650.
The flow diagram on the following page provides an overview of the major process that
occur in the model.

29
Calculation of inflow numbers Cohort numbers
• Population projections provide numbers expected to reach State Pension age each year. This provides the total potential number of inflows which are then split by level of personal entitlement on a cohort basis. The numbers are then adjusted into year of inflow. For Great Britain it is assumed the entire State Pension age cohort will inflow at some point during the year.
Starting population from March QSE
Mortality
Widowhood
Transition &
inflows
Cat D inflows
End year caseloads
Population reaching State Pension age and deferral rates
Marital status in year of inflow
Proportion of cohort with each % personal
entitlement from L2
Annual inflows & %
Cat A entitlement
Average amounts from QSE
L2 cohort based
average amounts
Annual uprating
Average amounts
Mid year caseloads
Annual expenditure
Additional components
caseloads

30
• Overseas inflows are based on the growth in the Great Britain population reaching State Pension age.
Inflows above State Pension age
• Rates to calculate inflows above State Pension age come from estimates used in
medium term forecasts. These are simplified and extended into the long term. The
rates are derived using historic inflow numbers combined with population
estimates to predict how many people with unclaimed entitlement are above State
Pension age at a given point in time, and when they are expected to inflow in the
future.
Marital status
• Marital status is determined at time of inflow based on age and sex. The numbers
inflowing at each age are split by marital status projections. Together with the way
widowhood is applied in the model this approach preserves the splits.
• For men, marital status data is not reliable enough be used directly. Instead marital
status splits are imposed on the population using figures from the Office for
National Statistics. Where men can be identified as widowers and they receive a
Category B or AB pension they are assigned to the widower population. The
remainder of the population is assigned randomly until the correct numbers of
people are in both the widower and non-widower groups.
Marital status and personal entitlement levels
• Personal entitlement levels are not split by marital status. For men, it is assumed
that entitlement can be applied uniformly across both marital status groups. For
women, this assumption is less valid, especially under pre-reform rules where single
women are much more likely to have a more complete contribution record than
married women.
• Personal entitlement is calculated using both pre-and post reforms for all
individuals. This is merged with the recently retired population making use of the
marital status flag there. This allows conditional probabilities to be created that
inform the likelihood of someone being in each personal entitlement group given
the total number people in each marital status group, and also the total number
of people from those groups in each personal entitlement group.
• As proportions in each personal entitlement group change for each cohort, and
proportions in each marital status group change based on age and year of inflow,
the respective numbers with each marital status in a given personal entitlement

31
group change. This does not affect the overall numbers who inflow with each level
of personal entitlement, nor the total number from each marital status group.
Mortality
• Mortality rates come from the population projections split by sex and single year
of age. The same rates are used for GB and overseas claimants, and are not
adjusted for level of personal entitlement or marital status.
Average amounts
• In addition to the inflow figures, the model uses a number of average amounts to
produce overall projections. The average amounts forecasts are calculated
separately to the caseload forecast. It has the same aggregation as the caseload
forecast so that average amounts can be applied directly to mid-year caseload to
generate expenditure. The main calculations are:
o Mean proportion of the standard rate at State Pension age - average amounts
for each pension group in the model are combined with the full rate of Basic
State Pension payable each year to convert the average amounts into mean
proportions of the standard rate. This allows year on year averages to be
compared.
o Mean proportion of the standard rate above State Pension age - Above State
Pension age future mean proportions are driven by applying observed year on
year changes to preserve cohort effects.
Additional components
• Three types of transitions (i.e. a change in entitlement) are modelled: less than 60%
Category to Category D for those 80 or above; less than 100% Category A or zero
entitlement to Category B/BL or Category AB/ABL for those under 80; and
conversion to Category B/AB on widowhood. A series of assumptions are used to
estimate transitions across these different categories of state pension to take
account of the change in pensioner entitlements.
Data sources
• The model uses data from the Quarterly Statistical Enquiry, a biannual 5 per cent
sample of administrative data. In order to allocate people to the right group in the
caseload forecast, data on personal entitlement to BSP is needed. This comes from
the ‘L2 dataset’ (a 1 per cent sample of HM Revenue and Customs’ National
32
Insurance Recording System). L2 shows the entitlement to BSP built up by each
person in terms of qualifying years, whether as a result of paying NI contributions
while working or as a result of building up credits. Age and sex data from the L2
dataset is also used to show when people will reach State Pension age.
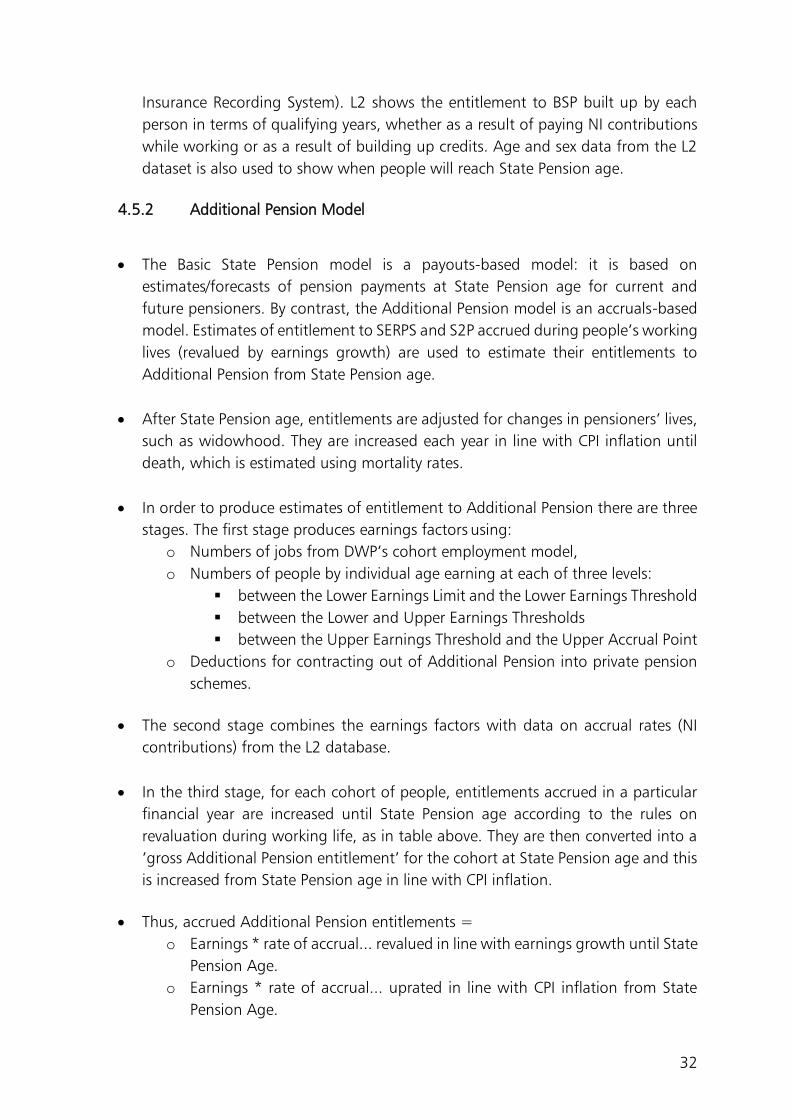
4.5.2 Additional Pension Model
• The Basic State Pension model is a payouts-based model: it is based on
estimates/forecasts of pension payments at State Pension age for current and
future pensioners. By contrast, the Additional Pension model is an accruals-based
model. Estimates of entitlement to SERPS and S2P accrued during people’s working
lives (revalued by earnings growth) are used to estimate their entitlements to
Additional Pension from State Pension age.
• After State Pension age, entitlements are adjusted for changes in pensioners’ lives,
such as widowhood. They are increased each year in line with CPI inflation until
death, which is estimated using mortality rates.
• In order to produce estimates of entitlement to Additional Pension there are three
stages. The first stage produces earnings factors using:
o Numbers of jobs from DWP’s cohort employment model,
o Numbers of people by individual age earning at each of three levels:
▪ between the Lower Earnings Limit and the Lower Earnings Threshold
▪ between the Lower and Upper Earnings Thresholds
▪ between the Upper Earnings Threshold and the Upper Accrual Point
o Deductions for contracting out of Additional Pension into private pension
schemes.
• The second stage combines the earnings factors with data on accrual rates (NI
contributions) from the L2 database.
• In the third stage, for each cohort of people, entitlements accrued in a particular
financial year are increased until State Pension age according to the rules on
revaluation during working life, as in table above. They are then converted into a
‘gross Additional Pension entitlement’ for the cohort at State Pension age and this
is increased from State Pension age in line with CPI inflation.
• Thus, accrued Additional Pension entitlements =
o Earnings * rate of accrual... revalued in line with earnings growth until State
Pension Age.
o Earnings * rate of accrual... uprated in line with CPI inflation from State
Pension Age.

33
• Carer credits are modelled separately using data on benefit caseloads, economic
activity, information from the L2 database and population projections.
4.5.3 New State Pension Model
• The new State Pension model is an Excel based payouts model. Similar to the
methodology used for the Basic State Pension model, caseload forecasts are
created from the inflows into the pensioner population for each cohort reaching
SPA now and in the future. The caseload forecasts are then multiplied by the
relevant average state pension payment to produce an expenditure forecast at
State Pension age, which is then uprated in future years.
• As with the Basic State Pension model, population projections provide numbers
expected to reach State Pension age each year. Overseas inflows are based on the
growth in the Great Britain population reaching State Pension age. Mortality rates
again come from the population projections split by sex and single year of age.
• To calculate expenditure, the end-year caseloads are multiplied by the following
formula:
Weekly rate of new State Pension x weeks in a year x MPnSR
• The MPnSR is the “mean proportion of standard rate” of the new State Pension
and is between 0 and 1. It is calculated separately for each cohort and for
males/females using the L2 dataset (a 1 per cent sample of HM Revenue and
Customs’ National Insurance Recording System). The MPnSR can be interpreted as
the average proportion of the full weekly rate of new State Pension to which people
in a particular cohort will be entitled when reaching State Pension age, based on
their qualifying years; it includes people with no entitlement.
• The main data source used for the new State Pension model is the ‘L2 dataset’, a
1 per cent sample of HM Revenue and Customs’ National Insurance Recording
System.
• Protected Payment amounts are calculated in the same analysis that produces the
new State Pension starting amount values. The Protected Payment amounts are
then run through a separate Excel model to forecast the yearly Protected Payment
expenditure until it is forecast to reach £0.

34
4.6 Public Service Pensions modelling
As was made clear in Section 1, Public Service Pensions have not been explicitly modelled.
However, in order to produce the aggregate table in Section 3.5, the PSP projections from
the Government Actuary’s Department (GAD) for FSR 2017 were taken as a baseline.
These were then adapted to incorporate EU macroeconomic assumptions on nominal
GDP.