my fund range for the j.p. morgan uk pension plan go the ...€¦ · my fund range for the j.p....
TRANSCRIPT

My Fund Range for the J.P. Morgan UK Pension Plan
Go the extra mile
J.P. Morgan UK Pension PlanYour future. Your choice.

J.P. Morgan UK Pension Plan2
My Investments
MyPlanner
MyPension Investment choices

Your future. Your choice. 3
« »
next
J.P. Morgan UK Pension PlanYour future. Your choice.
Prepared with you in mind
My Default Strategy for the J.P. Morgan UK Pension Plan
My Investments gives you an overview of the important things to consider when investing, plus it includes:
h the different types of investments available;
h an introduction to the types of risk;
h the investment options available to you within the Plan.
My Investments
We recognise that you will need different sources of information at different times. So, you might be interested to know about the ways in which you can access information to help you plan for your retirement:
Library
ToolsLibrary
Tools
You can find all of these guides in the Plan library
on MyPension and on MyPensionTools.
J.P. Morgan UK Pension PlanYour future. Your choice.
My Investments for the J.P. Morgan UK Pension Plan
Tending to your future
next
Performance history – quarter by quarter
Fund summaryFund Name Benchmark Target out-performance
(net of fees)Management Fees
Settlement Period
L&G DiversifiedFund
Bank of England Base Rate. n/a AMC: 0.13% p.a.TER: 0.13% p.a.
Trading day +2
AMC = Annual Management Charge TER = Total Expense Ratio
Fund performancePerformance
5 Years to 31.12.2014 Performance
3 Years to 31.12.2014Performance
1 Year to 31.12.2014Performance
Quarter 4 to 31.12.2014 Target ReturnsFund Benchmark Fund Benchmark Fund Benchmark Fund Benchmark
% p.a. % p.a. % p.a. % p.a. % % % % % p.a.
n/a n/a n/a n/a 10.1 10.8 3.3 4.1 n/a
Legal & General– Diversified Fund
Passive
Div
ersi
fied
Gro
wth
fun
d
J.P. Morgan UK Pension Plan | 1
Dec12
Mar13
Jun13
Sep13
Dec13
Mar14
Jun14
Sep14
Dec14
Jun12
Sep12
-24.0
-16.0
-8.0
0.0
8.0
16.0
24.0
-8.0
-12.0
-16.0
-4.0
0.0
4.0
8.0
12.0
16.0
L&G Diversified FundExcess Return in Multi-asset Diversified Growth from Jun 2012 to Dec 2014
LGIM DG vs. BoAML 3 month LIBOR (after fees)*
Qua
rter
ly E
xces
s R
etur
n (%
)
Excess R
eturn (%)
Falling Markets Rising Markets 1 Year Rolling Excess Return Upper Quartile Upper Quartile Median
* For comparative purposes, we have compared the performance of the Fund to the Bank of America Merrill Lynch LIBOR 3 month average due to the Fund’s absolute return target.
Log on to keep on top of your pension account by checking your fund value and investments choices. You can also use the new MyPlanner to model a whole range of scenarios for funding your future. The MyPension App is also available to download on your smartphone.
MyPension Fund factsheets
MyPensionTools
Visit www.mypensiontools.co.uk to access a number of useful tools, such as the Contribution Calculator, to help you to work out the net cost of increasing your contributions. With savings in tax and National Insurance, it might cost you much less than you think.
In addition to My Fund Range, which summarises the performance of all funds available in the Plan over the courses of the quarter, you can also access a more detailed 2-page fund factsheet on each of the individual funds on MyPension. These are updated annually.
Our 3 short films, available on MyPensionTools, will help you understand why it’s important to consider your retirement savings as early as you can, no matter what your age. They are designed around 3 simple steps: Know how much you’ll need, Contribute as much as you can, and Make your money work harder.
Films
My Quick Guide gives an overview of the Plan to help you make the most of your membership. It’s particularly useful if you’re a new joiner, as it summarises:
h how the Plan works;
h what to expect when you first join;
h information about how Company and employee contributions work; and
h details of the benefits provided to you and your dependants by the Plan.
My Default Strategy guide provides an in-depth explanation of the Default Strategy, providing more detail on:
h the different phases, funds and switching processes;
h the Alternative Endpoints available;
h choosing your Target Retirements Age and reviewing your choices.
My Handbook covers many of the same themes as My Quick Guide, but gives you further details around:
h how the Plan works;
h the types of contributions you can make to your pension account;
h what happens when you retire, including all the options available to you;
h what happens if you die while in service, or after you retire; and the State Pension benefits.
My Quick Guide
My Default Strategy
My Handbook

Contents
J.P. Morgan UK Pension Plan4
Welcome to the J.P. Morgan UK Pension Plan Fund Range guide ....................................................................................................................................................................................................................................................................................................................................................................................................................................................................................................................................................................................... 5
What should I do now? ................................................................................................................................................................................................................................................................................................................................................................................................................................................................................................................................................................................................................................................................................................................................................................................................................................................................................................................................................................................................................................................................................................................................................................................................................................................................................................................................................................................................................................................................................................................................................................................................................................................................................................................................................................................................................................................................................................................................................................................................................................................................................................................................................................................................................................................................................................................................................................................................................................................................................................... 6
Risk ........................................................................................................................................................................................................................................................................................................................................................................................................................................................................................................................................................................................................................................................................................................................................................................................................................................................................................................................................................................................................................................................................................................................................................................................................................................................................................................................................................................................................................................................................................................................................................................................................................................................................................................................................................................................................................................................................................................................................................................................................................................................................................................................................................................................................................................................................................................................................................................................................................................................................................................................................................................................................................................................................................................................................................................................................................................................................................................................................................................................................................................................................................................................................................................................................................................................................................................................................................ 8
Risk rankings ............................................................................................................................................................................................................................................................................................................................................................................................................................................................................................................................................................................................................................................................................................................................................................................................................................................................................................................................................................................................................................................................................................................................................................................................................................................................................................................................................................................................................................................................................................................................................................................................................................................................................................................................................................................................................................................................................................................................................................................................................................................................................................................................................................................................................................................................................................................................................................................................................................................................................................................................................................................................................................................................................................................................................................................................................................................................................................................................ 9
Risk vs return ................................................................................................................................................................................................................................................................................................................................................................................................................................................................................................................................................................................................................................................................................................................................................................................................................................................................................................................................................................................................................................................................................................................................................................................................................................................................................................................................................................................................................................................................................................................................................................................................................................................................................................................................................................................................................................................................................................................................................................................................................................................................................................................................................................................................................................................................................................................................................................................................................................................................................................................................................................................................................................................................................................................................................................................................................................................................................................................... 10
The components of risk ............................................................................................................................................................................................................................................................................................................................................................................................................................................................................................................................................................................................................................................................................................................................................................................................................................................................................................................................................................................................................................................................................................................................................................................................................................................................................................................................................................................................................................................................................................................................................................................................................................................................................................................................................................................................................................................................................................................................................................................................................................................................................................................................................................................................................................................................................................................................................................................................................................................................. 11
Risk factor table .............................................................................................................................................................................................................................................................................................................................................................................................................................................................................................................................................................................................................................................................................................................................................................................................................................................................................................................................................................................................................................................................................................................................................................................................................................................................................................................................................................................................................................................................................................................................................................................................................................................................................................................................................................................................................................................................................................................................................................................................................................................................................................................................................................................................................................................................................................................................................................................................................................................................................................................................................................................................................................................................................................................................................................................................. 12
Switching processes ............................................................................................................................................................................................................................................................................................................................................................................................................................................................................................................................................................................................................................................................................................................................................................................................................................................................................................................................................................................................................................................................................................................................................................................................................................................................................................................................................................................................................................................................................................................................................................................................................................................................................................................................................................................................................................................................................................................................................................................................................................................................................................................................................................................................................................................................................................................................................................................................................................................................................................................................................................................................. 14
How to make your investment choices on MyPension ................................................................................................................................................................................................................................................................................................................................................................................................................................................................................................................................................................................................................................................................................................................................................................................................................................................................................................................................................................................................................................................................................................. 16
The fund range .......................................................................................................................................................................................................................................................................................................................................................................................................................................................................................................................................................................................................................................................................................................................................................................................................................................................................................................................................................................................................................................................................................................................................................................................................................................................................................................................................................................................................................................................................................................................................................................................................................................................................................................................................................................................................................................................................................................................................................................................................................................................................................................................................................................................................................................................................................................................................................................................................................................................................................................................................................................................................................................................................................................................................................................................................................................................... 18
Individual fund summaries ........................................................................................................................................................................................................................................................................................................................................................................................................................................................................................................................................................................................................................................................................................................................................................................................................................................................................................................................................................................................................................................................................................................................................................................................................................................................................................................................................................................................................................................................................................................................................................................................................................................................................................................................................................................................................................................................................................................................................................................................................................................................................................................................................................................................................................................................................................................................................ 20UK/Global/Regional Equities ........................................................................................................................................................................................................................................................................................................................................................................................................................................................................................................................................................................................................................................................................................................................................................................................................................................................................................................................................................................................................................................................................................................................................................................................................................................................................................................................................................................................................................................................................................................................................................................................................................................................................................................................................................................................................................................................................................................................................................................................................................................................................................................................................................................................................................................................................................................................................................................... 21Balanced/Diversified Growth .................................................................................................................................................................................................................................................................................................................................................................................................................................................................................................................................................................................................................................................................................................................................................................................................................................................................................................................................................................................................................................................................................................................................................................................................................................................................................................................................................................................................................................................................................................................................................................................................................................................................................................................................................................................................................................................................................................................................................................................................................................................................................................................................................................................................................................................................................................................................................................... 30Bonds/Liquidity/Other ............................................................................................................................................................................................................................................................................................................................................................................................................................................................................................................................................................................................................................................................................................................................................................................................................................................................................................................................................................................................................................................................................................................................................................................................................................................................................................................................................................................................................................................................................................................................................................................................................................................................................................................................................................................................................................................................................................................................................................................................................................................................................................................................................................................................................................................................................................................................................................................................................................................................................................................................................................................................................................. 33
Default Strategy Portfolios ............................................................................................................................................................................................................................................................................................................................................................................................................................................................................................................................................................................................................................................................................................................................................................................................................................................................................................................................................................................................................................................................................................................................................................................................................................................................................................................................................................................................................................................................................................................................................................................................................................................................................................................................................................................................................................................................................................................................................................................................................................................................................................................................................................................................................................................................................................................................... 38
Fund manager information ............................................................................................................................................................................................................................................................................................................................................................................................................................................................................................................................................................................................................................................................................................................................................................................................................................................................................................................................................................................................................................................................................................................................................................................................................................................................................................................................................................................................................................................................................................................................................................................................................................................................................................................................................................................................................................................................................................................................................................................................................................................................................................................................................................................................................................................................................................................................. 39
Range of returns ............................................................................................................................................................................................................................................................................................................................................................................................................................................................................................................................................................................................................................................................................................................................................................................................................................................................................................................................................................................................................................................................................................................................................................................................................................................................................................................................................................................................................................................................................................................................................................................................................................................................................................................................................................................................................................................................................................................................................................................................................................................................................................................................................................................................................................................................................................................................................................................................................................................................................................................................................................................................................................................................................................................................................................................... 40
Glossary of terms ...................................................................................................................................................................................................................................................................................................................................................................................................................................................................................................................................................................................................................................................................................................................................................................................................................................................................................................................................................................................................................................................................................................................................................................................................................................................................................................................................................................................................................................................................................................................................................................................................................................................................................................................................................................................................................................................................................................................................................................................................................................................................................................................................................................................................................................................................................................................................................................................................................................................................................................................................................................................................................................................................................................................................... 42
Here to help ............................................................................................................................................................................................................................................................................................................................................................................................................................................................................................................................................................................................................................................................................................................................................................................................................................................................................................................................................................................................................................................................................................................................................................................................................................................................................................................................................................................................................................................................................................................................................................................................................................................................................................................................................................................................................................................................................................................................................................................................................................................................................................................................................................................................................................................................................................................................................................................................................................................................................................................................................................................................................................................................................................................................................................................................................................................................................................................................................................................................ 44
This guide helps you consider the last two points above
in relation to the J.P. Morgan UK Pension Plan (the Plan).
It includes details of the range of investment options you
can choose from and will help you understand the important
features of those options. In particular you will find:
h What you need to think about when considering risk
(page 8)
h The risk rankings for each fund (page 9)
h A fund performance table to compare all the funds’
historic performance (pages 18 to 19)
h Individual fund summaries, including fund charges and
performance against benchmark (pages 20 to 36)
Important: the Company meets the administration costs
associated with the Plan, but it’s important you understand
the underlying investment charges as these are met by you
from your pension account.
There are four key elements to pension saving that you need to consider in order to maximise your retirement income:
1. How much you contribute
2. How you invest your pension account
3. How you plan to take your savings in retirement
4. The costs and charges your account faces over the period to your retirement.
We update this detailed guide six weeks after the end of every quarter and you can find the latest version on MyPension or MyPensionTools.
Regular updates
The value of your investments can go down as well as up and past performance is not a guide to future performance. If you are unsure of what investment decisions to make, you should seek impartial financial advice. For more details visit:
www.moneyadviceservice.org.uk/en/articles/choosing-a-financial-adviser
Neither the Trustee nor the Company are authorised to give you investment advice, nor are they responsible for the performance of the investment funds.
Welcome to the J.P. Morgan UK Pension Plan Fund Range guide
Before making your choices, you should read the
My Investments and My Default Strategy guides.
You may also want to read the individual fund fact sheets.
Both are available on MyPension and MyPensionTools;
access details can be found on the back page.
Remember that pension investments are long term. Over time,
as and when your circumstances change, make sure you
regularly check that your investment choices remain appropriate.
Your future. Your choice. 5
How you invest will depend on your personal circumstances and attitude to risk.

Read this guideYou can also find out more about:
h investing in general and what to consider,
in the My Investments guide
h how the Default Strategy works, in the
My Default Strategy guide
h the funds available in the individual fact sheets
h the main benefits of the Plan in the guides,
My Handbook and My Quick Guide.
All of these items are available on MyPension.
Learn
J.P. Morgan UK Pension Plan6
Watch the filmsWe have developed 3 films that focus on each of the key
steps you need to consider for your retirement savings.
An overview of these steps is in your guide, My Handbook,
but here we’ve focused on step 3:
Step 3: Make your money work harderYour investment decisions will have a direct
effect on the value of the benefits you build up.
The film Investments: adding value to your
pension account gives an overview of the
Plan’s investments and what you should
consider when making your choices.
What should I do now?
To view any of these films, or to download the supplementary guides to the films visit MyPensionTools at www.mypensiontools.co.uk
Accessing the tools

Act ReviewDecide how to invest your pension accountThink about your own circumstances and your
financial preferences:
h How much risk do you want to take?
Remember to take into account all the various types
of risk that can influence investments and other factors
such as your other savings and any other sources of
income you will have in your retirement.
h How long until you plan to retire?
The further you are from retiring the longer you have
for your investments to recover their value if they fall
in the short term.
h How will you take your benefits when you retire?
When you retire, you can use your pension account
to buy your choice of retirement benefits. Make sure
your investment choices match your plans.
h Who else do you want to provide for?
You may wish to choose benefits, for example a pension,
that allows you to provide for your spouse, dependants
or registered civil partner, in case you die before them.
Your answers to these types of questions will help
make your investment choices appropriate for you.
Visit MyPension to submit your choices and, if appropriate,
you should seek impartial financial advice to help you.
If you have selected any Lifestyle funds or are in the Default Strategy, it is important you review your Target Retirement Age, as this determines when your investments will begin automatically switching in preparation for your retirement (see My Investments and My Default Strategy guides for more information).
Get onlineMyPension has all your personal Plan details and you can
use it to review your savings and make changes to your
investment choices or find out more.
See the back page for details of how to access MyPension.
You can also monitor investment performance
on your smartphone with our MyPension App.
Your future. Your choice. 7
Action
Check in regularly
Although your pension account is a long-term investment and it is generally not a good idea to trade your investments frequently, you should review at least once a year (or if your plans or circumstances change) and make sure your choices are still appropriate.
Remember to also look out for your benefit statement which we produce every year, for an overview of your Plan benefits and choices.

RiskWhat you need to think about
CapacityIf you are a long way from accessing your retirement benefits,
you will normally have more capacity for risk. For example,
if your investments fall in the short term you still have plenty of
time for their value to potentially recover, and in the meantime,
if you are still contributing to a pension scheme, you will
be purchasing more units and benefiting from additional
compound returns. If you are nearer retirement your capacity
for risk is normally lower as your investments may not recover
in time for your retirement.
ToleranceThis sums up your own feelings and is a personal measure
of the amount of risk you are willing to take with your
investments and how you would feel if your investments
were to fall in value at any point in time.
Between different types of assets (or asset classes), there are
different levels of risk and potential return. Even within an asset
class, there are different levels of risk and potential return that
depend on what the fund manager is trying to achieve.
To help you decide which funds to invest in, each fund has
been assigned a risk ranking (see page 9).
What does the risk ranking represent?
h The risk rankings will help you understand the
different levels of risk when investing your money
compared to other funds within the fund range.
The risk rankings are only meant to be a guide
and are for comparison only.
h The risk rankings are based on the Trustee’s
assessment of investment risk, and reflect advice
from their investment advisers.
h The number reflects the Trustee’s assessment
of the total risk level of each fund, taking into
account the individual components of risk
which the Trustee has considered and to which
each fund is exposed. The component risks
considered are set out on page 11.
h The scale runs from 1 to 13, where ‘1’ represents
the lowest level of risk amongst the funds available
via the Plan, and ‘13’ represents the highest.
h Generally, funds with a lower risk ranking will tend
to have lower potential returns and lower volatility of
the investment returns, while funds with a higher risk
ranking will tend to have higher potential returns and
higher volatility of investment returns, although there
is no guarantee that this will be the case in practice.
What does the risk ranking not represent?
h A fund with a risk ranking of 6 is likely to be more
risky than a fund rated 5, but less risky than a fund
rated 7, but this does not mean it will have half the
risk of a fund with a ranking of 12.
h There may be times when a lower ranked fund could
experience losses in excess of a higher ranked fund.
This could be the result of a fund having a high
exposure to a particular risk that causes it to lose
money for an extended period.
h There is no guarantee that investors in a fund with
a high risk ranking will be compensated for the risk
they are taking on. The levels of investment risk
may change in the future.
h The rankings do not necessarily show the ‘best’
or ‘worst’ investment for you. It is important to
make investment decisions on the basis of your
own circumstances and level of risk tolerance.
You may wish to consider taking your own
impartial financial advice.
J.P. Morgan UK Pension Plan8
Risk means different things to different people. When choosing your investments, you should think about how much risk you are prepared to take. In particular, it is important to consider your capacity and tolerance for risk:

Risk rankings
Your future. Your choice. 9
The following table shows the risk ranking applied to each fund and allows you to see how the risk rankings vary between funds in the same asset class. To understand the individual component risks to which each fund is exposed, please turn to page 11.
Fund Risk ranking
UK Equities (see pages 21 to 23)
LGIM UK Equity (5% Capped) Index 8
Baillie Gifford UK Equity Focus Pension 10
JPM Life UK Specialist Equity 9
Aberdeen Standard Investments UK Equity 9
JPM Life UK Dynamic 10
Global Equities (see pages 23 to 25)
LGIM Global Equity Market Weight (30:70) Index 9
JPM Life Diversified Equity 10
JPM Life Global Dynamic All Countries 11
Baillie Gifford Global Alpha Pension 11
LGIM MSCI World Minimum Volatility Equity Index 8
LGIM FTSE Global Developed Small Cap Equity Index 12
Regional Equities (see pages 26 to 29)
LGIM North America Equity Index 10
LGIM Europe (ex UK) Equity Index 10
LGIM Japan Equity Index 10
LGIM Asia Pacific (ex Japan) Developed Equity Index 11
LGIM World Emerging Markets Equity Index 12
Baillie Gifford Emerging Markets 12
JPM Life All-Emerging Markets Equity 13
*Underlying fund in the default portfolios and not currently available as a self-select option.
Fund Risk ranking
Balanced Funds (see pages 29 to 32)
LGIM Consensus Blended 7
Baillie Gifford Managed Pension 7
JPM Life Balanced 7
Diversified Growth Funds (see pages 29 to 32)
LGIM Diversified 6
Aberdeen Standard Investments Global Absolute Return Strategies 6
Baillie Gifford Diversified Growth Pension 6
Nordea Diversified Returns Strategy 6
Bonds (see pages 32 to 34)
LGIM Pre-Retirement 3
LGIM Over 5 Year Index-Linked Gilts Index 2
Fidelity Aggregate Bond 4
JPMAM Flexible Credit 5
Insight Bonds Plus 300 6
Liquidity (see page 35)
JPM Life UK Liquidity 1
LGIM Euro Liquidity 5
Other (see pages 35 to 36)
LGIM Ethical UK Equity Index 8
Aberdeen Standard Investments Pooled Property Fund 5
Partners Group Generations* 6
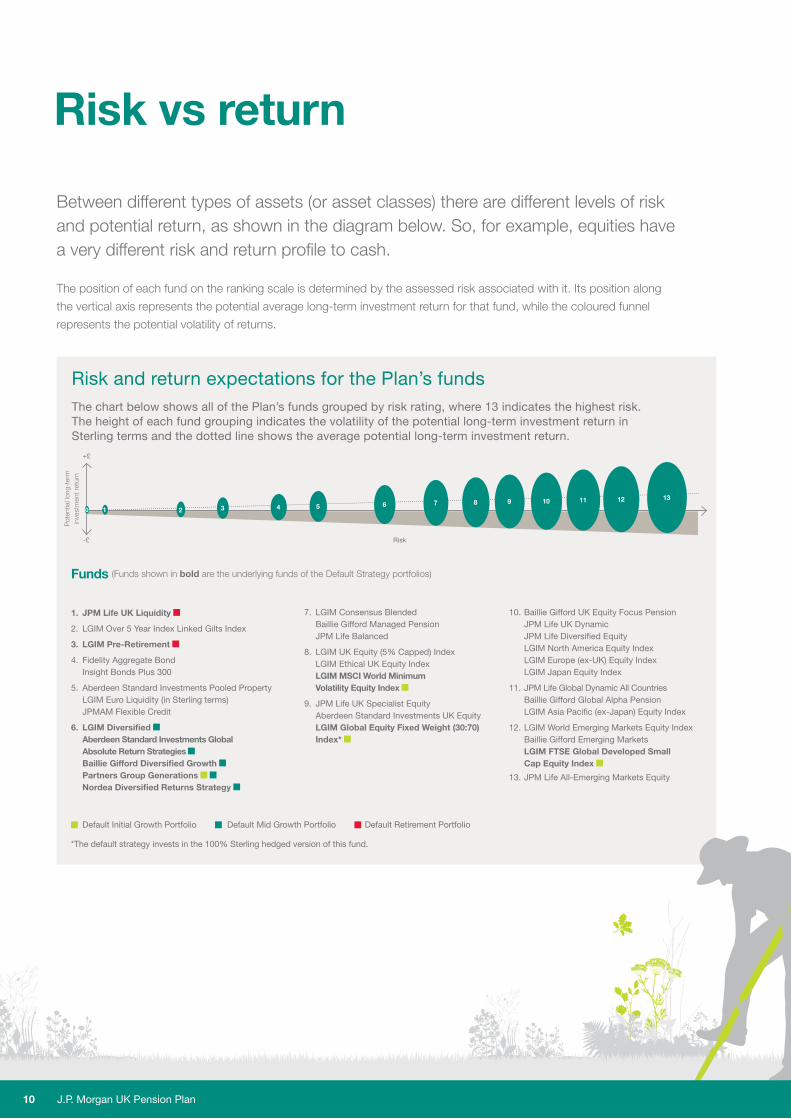
Risk and return expectations for the Plan’s fundsThe chart below shows all of the Plan’s funds grouped by risk rating, where 13 indicates the highest risk. The height of each fund grouping indicates the volatility of the potential long-term investment return in Sterling terms and the dotted line shows the average potential long-term investment return.
Risk vs return
Between different types of assets (or asset classes) there are different levels of risk and potential return, as shown in the diagram below. So, for example, equities have a very different risk and return profile to cash.
The position of each fund on the ranking scale is determined by the assessed risk associated with it. Its position along
the vertical axis represents the potential average long-term investment return for that fund, while the coloured funnel
represents the potential volatility of returns.
Pot
entia
l lon
g-te
rm
inve
stm
ent
retu
rn
+£
-£
3 4 5 6 7 8 9 10 11 12 13
10 2
Risk
Funds (Funds shown in bold are the underlying funds of the Default Strategy portfolios)
Default Initial Growth Portfolio
*The default strategy invests in the 100% Sterling hedged version of this fund.
Default Mid Growth Portfolio Default Retirement Portfolio
J.P. Morgan UK Pension Plan10
1. JPM Life UK Liquidity
2. LGIM Over 5 Year Index Linked Gilts Index
3. LGIM Pre-Retirement
4. Fidelity Aggregate Bond Insight Bonds Plus 300
5. Aberdeen Standard Investments Pooled Property LGIM Euro Liquidity (in Sterling terms) JPMAM Flexible Credit
6. LGIM Diversified Aberdeen Standard Investments Global Absolute Return Strategies Baillie Gifford Diversified Growth Partners Group Generations Nordea Diversified Returns Strategy
7. LGIM Consensus Blended Baillie Gifford Managed Pension JPM Life Balanced
8. LGIM UK Equity (5% Capped) Index LGIM Ethical UK Equity Index LGIM MSCI World Minimum Volatility Equity Index
9. JPM Life UK Specialist Equity Aberdeen Standard Investments UK Equity LGIM Global Equity Fixed Weight (30:70) Index*
10. Baillie Gifford UK Equity Focus Pension JPM Life UK Dynamic JPM Life Diversified Equity LGIM North America Equity Index LGIM Europe (ex-UK) Equity Index LGIM Japan Equity Index
11. JPM Life Global Dynamic All Countries Baillie Gifford Global Alpha Pension LGIM Asia Pacific (ex-Japan) Equity Index
12. LGIM World Emerging Markets Equity Index Baillie Gifford Emerging Markets LGIM FTSE Global Developed Small Cap Equity Index
13. JPM Life All-Emerging Markets Equity

The components of risk
When preparing the risk rankings the following types or ‘components’ of risk have been considered:
Asset class risks h Market risk: this is the risk that the value of your
investments will fall. It’s what most of us think of
when we think of ‘risk’.
h Volatility risk: is the variability of returns relative to their
expected return, which means it relates to how often and
how sharply the market price of an investment changes.
h Inflation risk: if your investment returns are lower than
inflation then the purchasing power of your pension
account goes down. This is inflation risk.
h Currency risk: is the risk of the potential loss in an
investment’s value following a change in price of one currency
against another. It’s also known as exchange rate risk.
h Interest rate risk: relates to the change in the value of an
investment asset as a result of a change in interest rates.
This type of risk is greater in assets like bonds where if
interest rates rise, bond prices fall and vice versa.
h Credit risk: is the risk of default. Again, this is more relevant
to investments like bonds where there is the risk that the
issuer (the company or government offering the bonds)
may be unable or unwilling to make further income and/or
principal payments. UK Government bonds or gilts, for
example, are usually considered to have very low credit risk.
h Emerging market risk: are country specific risks that
could affect the value of an investment in an emerging
market. Risks include changes in the political climate,
natural disasters, currency risk and the risk that you will
have difficulties buying and selling in that market if it is
relatively small (known as illiquidity risk).
Fund specific risks h Smaller company risk: is the potential, increased risk
of investing in a smaller company which may not have
the same level of market information or quality assurance
available as for a larger company. They are also more
susceptible to volatility, because being smaller, it takes
lower transaction volumes (buying and selling of shares)
to move prices.
h Illiquidity risk: relates to how easily an asset can be
bought or sold. If an asset is illiquid, it can’t easily be sold or
exchanged for cash quickly without a substantial loss in value.
h Derivatives risk: a derivative is a type of contract
between two parties (like a future or a swap) where its
value is based on or derived from an underlying asset,
index or interest rate. These types of assets can change
dramatically in value as a result of small changes in the
value of the underlying asset. There is also a potential
risk that the other party may default on the contract,
known as counterparty risk (a type of credit risk).
h Active manager risk: there is a risk that the decisions
taken by an investment manager may have a detrimental
impact on the returns of a fund. A passive manager will not
make many investment decisions other than how to best
track the performance of an index. Active managers will
buy and sell investments with the intention of out-performing
a specific benchmark. The benchmark may be:
• a specific index (for example, FTSE All-Share Index for
UK equity);
• other investment managers (for example, a median
return of investment funds investing in the same sector);
• referenced against cash (for example, UK base rate)
The degree of active decisions made by a manager will vary
by fund and will, in part, be dependent on the investment
objective of the investment fund. If successful, active
management can out-perform relative to the benchmark.
However, if the manager’s decisions prove unsuccessful,
they can under-perform relative to the benchmark.
Other risks h Benefit matching risk: this is the risk that your investments
are not aligned with your preferred method of funding your
retirement, and may therefore result in a lower income in
retirement. If you choose to buy an annuity, the cost of
converting your pension account from a pot of money into
an annual income (annuity) is linked in part to the price of
government and corporate bonds. If you decide to take
benefits through income drawdown, there is also the risk
that your investment strategy may not be suitable for the
way you intend to take benefits in retirement.
Your future. Your choice. 11

Ris
k Fa
cto
rs
Mar
ket r
isk
Vola
tility
ris
k
Infla
tion
risk
Cur
renc
y ris
k
Inte
rest
rat
e ris
k
Cre
dit r
isk
Em
ergi
ng m
arke
ts r
isk
Sm
alle
r co
mpa
ny r
isk
Illiq
uidi
ty r
isk
Der
ivat
ives
ris
k
Inve
stm
ent m
anag
er r
isk
Ann
uity
con
vers
ion
risk
UK Equities
LGIM UK Equity (5% Capped) Index
Baillie Gifford UK Equity Focus Pension
JPM Life UK Specialist Equity
Aberdeen Standard Investments UK Equity
JPM Life UK Dynamic
Global Equities
LGIM Global Equity Market Weight (30:70) Index
JPM Life Diversified Equity
JPM Life Global Dynamic All Countries
Baillie Gifford Global Alpha Pension
LGIM MSCI World Minimum Volatility Equity Index
LGIM FTSE Global Developed Small Cap Equity Index
Regional Equities
LGIM North America Equity Index
LGIM Europe (ex UK) Equity Index
LGIM Japan Equity Index
LGIM Asia Pacific (ex Japan) Developed Equity Index
LGIM World Emerging Markets Equity Index
Baillie Gifford Emerging Markets
JPM Life All Emerging Market Equity
Risk factor table
J.P. Morgan UK Pension Plan12

Your future. Your choice. 13
High Exposure
Moderate Exposure
Some Exposure
Minimal Exposure
Ris
k Fa
cto
rs
Mar
ket r
isk
Vola
tility
ris
k
Infla
tion
risk
Cur
renc
y ris
k
Inte
rest
rat
e ris
k
Cre
dit r
isk
Em
ergi
ng m
arke
ts r
isk
Sm
alle
r co
mpa
ny r
isk
Illiq
uidi
ty r
isk
Der
ivat
ives
ris
k
Inve
stm
ent m
anag
er r
isk
Ann
uity
con
vers
ion
risk
Balanced
LGIM Consensus Blended
Baillie Gifford Managed Pension
JPM Life Balanced
Diversified Growth Funds
LGIM Diversified
Aberdeen Standard Investments Global Absolute Return Strategies
Baillie Gifford Diversified Growth
Nordea Diversified Returns Strategy
Bonds
LGIM Pre Retirement
LGIM Over 5 Year Index-Linked Gilts Index
Fidelity Aggregate Bond
JPMAM Flexible Credit
Insight Bonds Plus 300
Liquidity
JPM Life UK Liquidity
LGIM Euro Liquidity
Other
LGIM Ethical UK Equity Index
Aberdeen Standard Investments Pooled Property
Partners Group Generations*
* Underlying fund in the default portfolios and not currently available as a self-select option.

If you have selected Lifestyle funds in the Freestyle strategy, you can choose your switching period from 3, 5, or 10 years before your Target Retirement Age. Your investments will be progressively moved out of your chosen Lifestyle funds into the LGIM Pre Retirement Fund and the Liquidity fund in the same percentages as for the Default Strategy.
How quickly your investments move depends on the switching period you choose, as illustrated below.
J.P. Morgan UK Pension Plan14
Switching processes
3-year switching process
Years to selected retirement age More than 3 3 2 1
Lifestyle Fund(s) 100% 66.5% 33% 0%
LGIM Pre Retirement Fund 0% 25% 50% 75%
JPM Life UK Liquidity Fund 0% 8.5% 17% 25%
Total 100% 100% 100% 100%
5-year switching process
Years to selected retirement age More than 5 5 4 3 2 1
Lifestyle Fund(s) 100% 80% 60% 40% 20% 0%
LGIM Pre Retirement Fund 0% 15% 30% 45% 60% 75%
JPM Life UK Liquidity Fund 0% 5% 10% 15% 20% 25%
Total 100% 100% 100% 100% 100% 100%
10-year switching process
Years to selected retirement age
More than 10
10 9 8 7 6 5 4 3 2 1
Lifestyle Fund(s) 100% 95% 90% 85% 80% 72.5% 60% 45% 30% 15% 0%
LGIM Pre Retirement Fund
0% 5% 10% 15% 20% 27.5% 35% 45% 55% 65% 75%
JPM Life UK Liquidity Fund 0% 0% 0% 0% 0% 0% 5% 10% 15% 20% 25%
Total 100% 100% 100% 100% 100% 100% 100% 100% 100% 100% 100%
Switching will take place quarterly and will reallocate your contributions and pension account investments towards the target percentages shown in the tables above. Switches for Lifestyle funds do not incur additional administration charges but will include transaction charges.

Target Retirement Age
Your Target Retirement Age is the age at which you aim to take your benefits from your pension account. Currently it can be at any age between age 55 and 75.
You need to select a Target Retirement Age if you have selected any Lifestyle funds or are in the Default Strategy, which you can do by logging into MyPension.
This is because this age determines when your investments begin switching into defensive investments, such as bond and/or liquidity funds, as you approach retirement. It’s important that you review the age you’ve chosen to ensure it’s in keeping with your retirement plans.
If you do not select a Target Retirement Age, it is assumed that you will retire at age 60 for the purpose of your pension within the Plan.
Your future. Your choice. 15

How to make your investment choices on MyPensionOn MyPension you can change your investment choices any time you like. To get started, choose the ‘My Investments’ tab on the home page, then ‘Change My Investments’ and consider the options opposite.
What type of contribution group(ings) do you want to change? You can change your investment choices for all your contributions or edit individual contribution groupings. Select what you want to change, click ‘Change my Investment Strategy’ and proceed to the ‘Investment strategy’ page.
What investment strategy do you want? You can choose between the Freestyle and the Default Strategy. (The icon on MyPension gives a summary of these options.) Make your selection and click ‘Continue’ to move to the ‘Decisions’ page.
If you select the Default Strategy:Select your Default Strategy option and your Target Retirement Age for your selected contribution types. Decide if any of the Alternative Endpoints might be right for you. Choose your preferred Default Strategy option, ‘Continue’ and proceed to the ‘Summary’ page.
Confirm your choiceOn the ‘Summary’ page, review your new selection(s) and ‘Authorise’ to confirm your choices.
If you choose Freestyle funds: If you choose to invest your selected contribution types into Freestyle funds, you will be able to choose where your past assets are invested and where your future contributions will be invested. These choices can be different if preferred. When investing in Freestyle funds you will need to monitor and maintain your choices on an ongoing basis.
…if you’re currently investing in the Default Strategy, you’ll be able to move your selected contribution types to your choice of Freestyle funds. You will need to monitor and maintain your choices on an ongoing basis.
…if you’re already investing in Freestyle, you’ll be able to choose where your current assets are invested and/or where your future contributions will be invested.
Choose your funds, ‘Continue’ and proceed to the ‘Summary’ page.
J.P. Morgan UK Pension Plan16
You can see a more detailed version of the investment choices decision tree in My Investments.

Remember: Current, future, or both?
If you’re already invested in the Freestyle (and Lifestyle) strategy and you want to change your choices, you can make decisions for where your current assets and/or future contributions will be invested.
h To update your future contributions only, tick the box next to ‘Update my Future contributions’,
and then select ‘Continue’.
The next page will allow you to add your chosen funds for future contributions.
Don’t forget if you want a Freestyle fund with a Lifestyle overlay, make sure you select the Lifestyle version of the fund (the one you want will have ‘Lifestyle’ in the name).
h To switch your current holdings only, select the box next to ‘Update my Current assets’.
Here you can either:
IMPORTANT: If you have more than one period of service under the Plan, any switches you instruct only apply to the record for the period of service that you are viewing at that time. You can move between your records by selecting the ‘Benefit records’ icon, which you’ll find in the top right hand corner of your MyPension screen.
Your future. Your choice. 17
Although there are no administrative charges for switching, all fund switches will incur transaction costs when buying and selling the underlying assets in which the funds are invested. These transaction/dealing costs (such as broker’s commission and local taxes) can either be included implicitly in the pricing of a fund known as ‘single pricing’) or they can be taken into account as part of an explicit pricing mechanism (known as ‘single swinging pricing’). Find out more in My Investments guide.
Rebalance, which means you’ll move all of your current assets to your new choice. If so:
h The next page you’ll see will allow
you to choose where to invest all the
funds you have elected to sell across
your new fund choices.
h If you have elected any Lifestyle
funds, the next page will ask for
your ‘terms of switching’ and Target
Retirement Age (see page 19).
Select specific funds to switch. To do this make sure ‘Select individual funds’ is ticked. If so:
h The next page you’ll see will allow you
to sell the desired percentage from
your chosen funds.
h The following page will then allow you
to redistribute all the funds you have
elected to sell across a new fund choice.
h If you have elected any Lifestyle funds,
the next page will ask for your ‘term of
switching’ and Target Retirement Age.

The fund range
The table on page 19 shows the performance history for
all the current funds, after the deduction of investment
management fees and has been sourced from the investment
managers. Where historic performance is not available
(if a fund hasn’t been in the fund range for long enough,
for example), the investment manager has made an estimate.
This table provides members with an estimate of the returns
they would have seen had these funds been available
throughout the relevant period. The outperformance target
for each manager against their benchmark is also shown.
Past performance is not a guide to the future and
the value of investments can go down as well as up.
Investors may not recoup the value of their original investment.
J.P. Morgan UK Pension Plan18
Equity Growth Property Private Markets
Balanced/Diversified Growth Balanced Lifestyle
Gilt/Bond/Liquidity Fund/Other Defensive Diversified Growth
Passive Fund
Active Fund
Default Portfolio
Key to symbols
1 The percentage shown is the target amount by which the fund aims to exceed the benchmark each year, measured over rolling 3 year periods. These figures are shown net of fees so they can be compared to the returns shown.
2 Details of the benchmark for each fund are in the fund descriptions.
3 The JPM Life Strategic Bond Fund was made available for investment on 17 January 2013. The Aberdeen Standard Investments Absolute Return Global Bond Strategies Fund was made available for investment on 1 May 2013. Performance is indicative and based on gross fund returns reported by the manager minus Plan specific fees.
4 The LGIM Euro Liquidity Fund was made available for investment on 28 September 2017.
Unit Prices and ISIN/SEDOL requests
For the latest information on your funds, please visit the MyPension website and the specific manager websites listed on
page 39. Details of all the funds you can currently invest in are found in this guide – and are also on the MyPension website.
Please note: historic versions of these documents have listed funds’ ISIN and SEDOL codes (where available) to
allow members to monitor funds themselves. Following the move to the LGIM investment platform in September 2017,
fund codes will no longer be available for the platform version of the Plan’s funds. However, since the platform funds
are invested in the non-platform equivalents, the codes for the non-platform versions of these funds will still be made
available to provide indicative information. Please note, there may be differences between the reported performance
of platform and non-platform versions of the funds going forward, due to differences in applicable fees, performance
measurement and pricing methodology.
Competitive charges for our funds
The Trustee has negotiated investment charges for
our funds that are lower than those available if you
were to invest in the same investments via the normal
retail market. To give you an idea of the potential
savings available, during 2017, these lower charges
equate to an estimated £20 million annual saving for
members (an average of around £500 per member
per year) when compared to equivalent retail charges.
This is an average reduction based on the total membership and Plan assets as at 30/06/17.

Your future. Your choice. 19
Investment Funds
Performance5 Years to 31.03.2018
Performance3 Years to 31.03.2018
Performance1 Year to 31.03.2018
PerformanceQuarter to 31.03.2018
Target Returns1Fund Benchmark2 Fund Benchmark2 Fund Benchmark2 Fund Benchmark2
UK Equities % p.a. % p.a. % p.a. % p.a. % % % % % p.a.
LGIM UK Equity (5% Capped) Index 6.7 6.7 5.9 5.7 1.0 0.8 -6.1 -6.4 n/a
Baillie Gifford UK Equity Focus Pension 6.6 6.6 8.5 5.9 5.3 1.2 -7.1 -6.9 1.30
Aberdeen Standard Investments UK Equity 6.4 6.6 5.0 5.9 0.2 1.2 -8.0 -6.9 1.10
JPM Life UK Specialist Equity 8.7 6.6 7.2 5.9 2.6 1.2 -5.8 -6.9 1.65
JPM Life UK Dynamic 10.3 6.6 8.1 5.9 6.0 1.2 -5.1 -6.9 4.25
Global Equities % p.a. % p.a. % p.a. % p.a. % % % % % p.a.
LGIM Global Equity Fixed Weight (30:70) Index
9.6 9.7 7.5 7.6 5.6 5.8 -4.6 -4.6 n/a
JPM Life Diversified Equity 11.3 9.9 9.4 8.7 4.9 2.5 -4.8 -5.2 1.40
JPM Life Global Dynamic – All Countries 11.5 10.9 10.4 10.2 4.9 2.4 -4.0 -4.5 2.35
Baillie Gifford Global Alpha Pension 14.7 11.5 14.5 10.8 12.6 2.9 -0.8 -4.4 2.00
LGIM MSCI World Minimum Volatility Equity Index n/a n/a 9.8 10.1 -2.0 -1.8 -6.2 -6.1 n/a
LGIM FTSE Global Developed Small Cap Equity Index n/a n/a 10.1 10.0 1.4 1.3 -5.6 -5.7 n/a
Regional Equities % p.a. % p.a. % p.a. % p.a. % % % % % p.a.
LGIM North America Equity Index 13.9 14.0 11.7 11.7 -0.3 -0.3 -6.6 -6.6 n/a
LGIM Europe (ex UK) Equity Index 10.0 10.0 8.2 8.3 3.7 3.7 -4.9 -4.9 n/a
LGIM Japan Equity Index 11.3 11.3 10.9 11.0 6.3 6.3 -4.0 -4.0 n/a
LGIM Asia Pacific (ex Japan) Developed Equity Index 6.4 6.4 9.7 9.6 1.6 1.6 -6.6 -6.6 n/a
LGIM World Emerging Markets Equity Index 6.4 6.5 9.8 9.9 7.8 7.8 -3.0 -3.0 n/a
Baillie Gifford Emerging Markets n/a n/a 14.5 11.3 18.8 11.8 -3.0 -2.2 3.00
JPM Life All-Emerging Markets Equity 7.5 6.7 12.8 10.9 13.7 11.4 -3.5 -2.2 2.20
Balanced % p.a. % p.a. % p.a. % p.a. % % % % % p.a.
LGIM Consensus Blended 7.8 7.7 7.4 7.3 1.5 1.5 -4.7 -4.7 n/a
Baillie Gifford Managed Pension 8.9 6.1 9.8 4.9 7.0 1.4 -1.5 -4.1 0.95
JPM Life Balanced 9.9 7.4 8.0 6.6 8.5 5.6 -3.3 -3.3 1.30
Diversified Growth % p.a. % p.a. % p.a. % p.a. % % % % % p.a.
LGIM Diversified 7.2 11.3 7.0 8.7 2.0 4.9 -3.4 -4.8 n/a
Aberdeen Standard Investments Global Absolute Return Strategies
2.1 0.6 -0.8 0.6 1.0 0.5 -1.9 0.2 4.40
Baillie Gifford Diversified Growth Pension 4.4 0.4 4.3 0.4 4.7 0.4 0.5 0.1 3.50
Nordea Diversified Returns Strategy n/a n/a n/a n/a -0.9 0.4 -2.1 0.1 4.00
Bonds % p.a. % p.a. % p.a. % p.a. % % % % % p.a.
LGIM Pre-Retirement 6.3 6.3 4.6 4.7 1.1 1.2 -1.0 -0.8 n/a
LGIM Over 5 Year Index-Linked Gilts Index 7.5 7.5 7.4 7.5 -0.2 -0.1 -0.9 -0.9 n/a
Fidelity Aggregate Bond 5.0 4.6 3.9 3.5 1.5 0.9 -0.6 -0.4 0.64
JPMAM Flexible Credit n/a n/a 2.9 3.0 3.5 3.0 -1.0 0.8 n/a
Insight Bonds Plus 300 n/a n/a 1.2 0.5 0.0 0.4 0.1 0.1 2.50
Cash % p.a. % p.a. % p.a. % p.a. % % % % % p.a.
JPM Life UK Liquidity 0.4 0.3 0.4 0.3 0.3 0.2 0.1 0.1 n/a
LGIM Euro Liquidity4 n/a n/a n/a n/a n/a n/a -1.4 -1.3 n/a
Other % p.a. % p.a. % p.a. % p.a. % % % % % p.a.
LGIM Ethical UK Equity Index 6.8 6.8 5.4 5.5 1.7 1.8 -6.0 -6.0 n/a
Aberdeen Standard Investments
Pooled Property Pension9.5 10.5 6.5 8.1 8.7 10.0 1.7 1.9 n/a
Partners Group Generations* n/a n/a n/a n/a n/a n/a n/a n/a n/a
• To outperform the benchmark* Underlying fund in the default portfolios and not currently available as a self-select option.

Active
J.P. Morgan Asset Management Life Diversified Equity
Fund overview
This fund aims to achieve superior returns by investing in equities in a broad range of global markets, including emerging markets. The fund also has a small allocation to listed property. Investing overseas adds an element of protection by spreading risk among a number of markets and currencies but introduces currency risk. The fund aims to outperform the returns of the average UK global equity pension fund.
As the fund invests entirely in equities and seeks to outperform its benchmark return, it is likely to be subject to greater volatility than many other funds. However, it has the potential to provide higher returns than other funds over the long term. In addition, there is a risk that some currencies may fluctuate in value relative to sterling.
Equities
North America 34.3%UK 28.7%Emerging Markets 13.9%Europe (ex UK) 7.8%Japan 7.0%REITS 5.5%Pacific (ex Japan) 2.6%Cash 0.2%
Benchmark Target out-performance (net of fees)
Management fees ISIN/SEDOL
25% FTSE All Share Index (Net), 5% FTSE Small Cap ex Investment Trusts Index (Gross), 51% FTSE Developed ex UK Index (Net), 12% MSCI Emerging Markets Index (Net), 7% FTSE/EPRA NAREIT Developed Index (Net) Hedged to GBP
1.4% p.a. net of fees over rolling 3 year periods
AMC: 0.35% p.a.
TER: 0.35% p.a.
GB0006684194/ 0668419
Total return for the 12 months to 31/03/18: 4.9%
Benchmark 2.5%
Annualised total return for the 3 years to 31/03/18:
9.4%
Benchmark 8.7%
Annualised total return for the 5 years to 31/03/18:
11.3%
Benchmark 9.9%
Fund returns are after the deduction of charges.
-505
1015202530354045
AMC = Annual Management Charge TER = Total Expense Ratio
UK
Eq
uitie
s/G
lob
al E
qui
ties/
Reg
iona
l Eq
uitie
s
J.P. Morgan UK Pension Plan21
Details of benchmark, out-performance target and fees shown in table for ease of comparison.
Fund manager name. Fund returns chart and data.
Investment management style of the fund. There are 2 possible categories – passive or active. See page 40 for more details.
Basic details of the fund management process, including asset class. Key individuals are listed here too.
Fund type.
Individual fund summaries
How to use this sectionThe following pages give you information about each of the funds in the fund range. This page gives you a guide to the
information provided and what it means. Performance information has been obtained from the investment managers.
Please note that the figures shown in the individual fund summaries may not sum due to rounding.
J.P. Morgan UK Pension Plan Your future. Your choice.20 21

AMC = Annual Management Charge TER = Total Expense Ratio
AMC = Annual Management Charge TER = Total Expense Ratio
Your future. Your choice. 22
Active
Passive
Baillie Gifford UK Equity Focus Pension
Fund overview
Baillie Gifford’s UK Equity Focus Fund invests in UK equities and aims to outperform the FTSE All Share Index by 1.05%-1.55% p.a., measured over rolling 3 year periods. Baillie Gifford focuses on fundamental company research and concentrates on quality growth stocks. The portfolio tends to be concentrated, holding 60-80 stocks.
As the fund invests entirely in equities and seeks to outperform its benchmark return, it is likely to be subject to greater volatility than many other funds. However, it has the potential to provide higher returns than other funds over the long term.
Equities
Large Cap 37.9%Mid Cap 39.6%Small Cap 22.5%
LGIM UK Equity (5% Capped) Index
Fund overview
This fund enables investment in the UK equity market while controlling exposure to the largest stocks in the FTSE All Share Index. The fund aims to restrict the weighting to each individual stock to a maximum of 5% of the index. Those stocks whose individual weightings are above 5% of the index are restricted to 5%, whilst all remaining stocks are managed in proportion to their weightings in the FTSE All Share Index. This fund may underperform the FTSE All Share Index, or may outperform, but the volatility of the returns should be lower than the FTSE All Share Index.
As the fund invests entirely in equities, this fund is likely to be subject to greater volatility than many other funds. However, as it aims to track its benchmark, the risk of underperformance against the benchmark is small relative to an active fund. As the fund invests in equities, it has the potential to provide higher returns than other funds over the long term.
Equities
Large Cap 79.1%Mid Cap 17.1% Small Cap 3.8%
Asset Allocation
Consumer Goods & Services 27.4%Financials 27.2%Industrials 11.4%Energy 9.8%
Healthcare 9.1% Materials 8.0%Telecommunications 3.4%Utilities 2.9%Technology 1.0%
Benchmark Target out-performance (net of fees)
Management fees ISIN/SEDOL
FTSE All Share Index 1.05-1.55% p.a. net over rolling 3 year periods
AMC: 0.40% p.a.
TER: 0.44% p.a.
GB00B03H1Z97/n/a
Benchmark Target out-performance (net of fees)
Management fees
FTSE All Share (5% Capped) Index To track the benchmark AMC: 0.04% p.a.
TER: 0.04% p.a.
UK
Eq
uities/Glo
bal E
quities/R
egio
nal Eq
uitiesU
K E
quities/G
lob
al Eq
uities/Reg
ional E
quities
Total return for the 12 months to 31/03/18: 1.0%
Benchmark 0.8%
Annualised total return for the 3 years to 31/03/18:
5.9%
Benchmark 5.7%
Annualised total return for the 5 years to 31/03/18:
6.7%
Benchmark 6.7%
Fund returns are after the deduction of charges.
-505
1015202530354045
Total return for the 12 months to 31/03/18: 5.3%
Benchmark 1.2%
Annualised total return for the 3 years to 31/03/18:
8.5%
Benchmark 5.9%
Annualised total return for the 5 years to 31/03/18:
6.6%
Benchmark 6.6%
Fund returns are after the deduction of charges.
-505
1015202530354045
Asset Allocation
Industrials 19.2%Consumer Discretionary 17.5%Financials 16.9%Information Technology 13.0%Health Care 12.2%Consumer Staples 8.1%
Materials 7.4%Energy 2.6%Utilities 1.2%Real Estate 1.1%Telecommunication Services 0.8%
J.P. Morgan UK Pension Plan Your future. Your choice.20 21

AMC = Annual Management Charge TER = Total Expense Ratio
AMC = Annual Management Charge TER = Total Expense Ratio
Active
Active
J.P. Morgan Asset Management Life UK Specialist Equity
Fund overview
The fund invests in UK equities. The manager uses an initial screening process and fundamental research to rank individual stocks. Those with the highest ranking are included in the portfolio.
As the fund invests entirely in equities and seeks to outperform its benchmark return, it is likely to be subject to greater volatility than many other funds. However, it has the potential to provide higher returns than other funds over the long term.
Equities
Large Cap (>100bn) 25.2%Mid Cap (10bn<>100bn) 46.5%Small Cap (< 10bn) 28.4%
Asset Allocation
Financials 30.8%Consumer Goods & Services 23.4%Energy 13.4% Materials 9.6%Industrials 7.4%Healthcare 7.1%Cash 3.4%Telecommunications 2.7%Technology 2.1%Utilities 0.1%
Benchmark Target out-performance (net of fees)
Management fees
FTSE All Share Index 1.1% p.a. net of fees over rolling 3 year periods
AMC: 0.40% p.a.
TER: 0.41% p.a.
Benchmark Target out-performance (net of fees)
Management fees ISIN/SEDOL
FTSE All Share Index (Net) 1.65% p.a. net of fees over rolling 3 year periods
AMC: 0.35% p.a.
TER: 0.35% p.a.
GB00B41H2T03/B41H2T0
UK
Eq
uitie
s/G
lob
al E
qui
ties/
Reg
iona
l Eq
uitie
sU
K E
qui
ties/
Glo
bal
Eq
uitie
s/R
egio
nal E
qui
ties
Total return for the 12 months to 31/03/18: 0.2%
Benchmark 1.2%
Annualised total return for the 3 years to 31/03/18:
5.0%
Benchmark 5.9%
Annualised total return for the 5 years to 31/03/18:
6.4%
Benchmark 6.6%
Fund returns are after the deduction of charges.
Total return for the 12 months to 31/03/18: 2.6%
Benchmark 1.2%
Annualised total return for the 3 years to 31/03/18:
7.2%
Benchmark 5.9%
Annualised total return for the 5 years to 31/03/18:
8.7%
Benchmark 6.6%
Fund returns are after the deduction of charges.
-505
1015202530354045
-505
1015202530354045
Aberdeen Standard Investments UK Equity
Fund overview
The UK Equity Fund is invested in a broad range of UK equities, chosen by the investment manager to give a spread over the most attractive sectors of the market. It may also invest in other companies which have a major part of their business in the UK.
As the fund invests entirely in equities and seeks to outperform its benchmark return, it is likely to be subject to greater volatility than many other funds. However, it has the potential to provide higher returns than other funds over the long term.
Manager name changed from Standard Life to Aberdeen Standard Investments as a result of the merger between Standard Life and Aberdeen Asset Management. There is no change to the underlying strategy as a result of this.
Equities
Large Cap 98.1% Small Cap 1.9%
Cash
Cash 0.0%
Asset Allocation
Financials 20.8%Oil & Gas 13.1%Consumer Goods 12.5%Industrials 11.2%Consumer Services 10.8%Healthcare 10.7%
Basic Materials 10.6%Telecommunications 4.4%Utilities 2.1%Cash and Other 2.0%Technology 1.8%
J.P. Morgan UK Pension Plan Your future. Your choice.22 23

AMC = Annual Management Charge TER = Total Expense Ratio
AMC = Annual Management Charge TER = Total Expense Ratio
Active
J.P. Morgan Life UK Dynamic
Fund overview
The JPM Life UK Dynamic Fund invests in UK equities and aims to outperform the FTSE All Share Index by 4.25% p.a. (net of fees), measured over rolling 3 year periods. Stocks are appraised relative to the rest of the market, and their own history. The portfolio will typically hold 50-125 stocks.
As the fund invests entirely in equities and seeks to outperform its benchmark return, it is likely to be subject to greater volatility than many other funds. However, it has the potential to provide higher returns than other funds over the long term.
Equities
Large Cap 13.4%Mid Cap 39.9%Small Cap 46.8%
Asset Allocation
Financials 28.3%Consumer Goods & Services 25.4%Industrials 15.6%Materials 13.2%Energy 9.3%Cash 4.8%Technology 2.0%Healthcare 1.4%Telecommunications 0.0%Utilities 0.0%
Benchmark Target out-performance (net of fees)
Management fees ISIN/SEDOL
FTSE All Share Index 4.25% p.a. net of fees over rolling 3 year periods
AMC: 0.75% p.a.
TER: 0.75% p.a.
GB00B0CMTV75/B0CMTV7
UK
Eq
uities/Glo
bal E
quities/R
egio
nal Eq
uitiesU
K E
quities/G
lob
al Eq
uities/Reg
ional E
quities
Passive
LGIM Global Equity Fixed Weight (30:70) Index
Fund overview
This fund provides access to the UK and overseas equity markets. The fund’s benchmark is 30% UK equities and 70% overseas equities. Investing overseas adds an element of protection by spreading risk among a number of markets. The fund aims to track a composite of world indices, with 70% in overseas equities.
The LGIM 30:70 Market Weights Global Equity fund employs currency hedging to reduce the effect of changes in asset values from fluctuations in the currency market due to investments in non-Sterling assets. The fund aims to hedge 75% of the non-Sterling currency exposure.
As the fund invests entirely in equities, this fund is likely to be subject to greater volatility than many other funds. However, as it aims to track its benchmark, the risk of underperformance against the benchmark is small relative to an active fund. As the fund invests in equities, it has the potential to provide higher returns than other funds over the long term. In addition, there is a risk that some currencies may fluctuate in value relative to sterling, although this is partially mitigated via currency hedging.
Benchmark Target out-performance (net of fees)
Management fees
30% FTSE All Share Index
70% FTSE All World (ex UK) Index
To track the benchmark AMC: 0.06% p.a.
TER: 0.06% p.a.
Equities
North America 39.2%UK 29.8%Europe (ex UK) 11.0%
Japan 8.0% Pacific (ex Japan) 7.2% Emerging Markets 4.8%
Asset Allocation
Consumer Goods & Services 24.1%Financials 24.1%Industrials 12.5%
Technology 10.7%Healthcare 9.7%Energy 7.7%
Materials 5.4%Telecommunications 2.9%Utilities 2.9%
Total return for the 12 months to 31/03/18: 6.0%
Benchmark 1.2%
Annualised total return for the 3 years to 31/03/18:
8.1%
Benchmark 5.9%
Annualised total return for the 5 years to 31/03/18:
10.3%
Benchmark 6.6%
Fund returns are after the deduction of charges.
Total return for the 12 months to 31/03/18: 5.6%
Benchmark 5.8%
Annualised total return for the 3 years to 31/03/18:
7.5%
Benchmark 7.6%
Annualised total return for the 5 years to 31/03/18:
9.6%
Benchmark 9.7%
Fund returns are after the deduction of charges.
-505
1015202530354045
-505
1015202530354045
J.P. Morgan UK Pension Plan Your future. Your choice.22 23

AMC = Annual Management Charge TER = Total Expense Ratio
Active
J.P. Morgan Asset Management Life Diversified Equity
Fund overview
This fund aims to achieve superior returns by investing in equities in a broad range of global markets, including emerging markets. The fund also has a small allocation to listed property. Investing overseas adds an element of protection by spreading risk among a number of markets and currencies but introduces currency risk. The fund aims to outperform the returns of the average UK global equity pension fund.
As the fund invests entirely in equities and seeks to outperform its benchmark return, it is likely to be subject to greater volatility than many other funds. However, it has the potential to provide higher returns than other funds over the long term. In addition, there is a risk that some currencies may fluctuate in value relative to sterling.
Equities
North America 34.3%UK 28.7%Emerging Markets 13.9%Europe (ex UK) 7.8%Japan 7.0%REITS 5.5%Pacific (ex Japan) 2.6%Cash 0.2%
Benchmark Target out-performance (net of fees)
Management fees ISIN/SEDOL
25% FTSE All-Share Index (Net), 5% FTSE Small Cap ex Investment Trusts Index (Gross), 51% FTSE Developed ex UK Index (Net), 12% MSCI Emerging Markets Index (Net), 7% FTSE/EPRA NAREIT Developed Index (Net) Hedged to GBP
1.4% p.a. net of fees over rolling 3 year periods
AMC: 0.35% p.a.
TER: 0.35% p.a.
GB0006684194/ 0668419
UK
Eq
uitie
s/G
lob
al E
qui
ties/
Reg
iona
l Eq
uitie
s
Total return for the 12 months to 31/03/18: 4.9%
Benchmark 2.5%
Annualised total return for the 3 years to 31/03/18:
9.4%
Benchmark 8.7%
Annualised total return for the 5 years to 31/03/18:
11.3%
Benchmark 9.9%
Fund returns are after the deduction of charges.
-505
1015202530354045
UK
Eq
uitie
s/G
lob
al E
qui
ties/
Reg
iona
l Eq
uitie
s
AMC = Annual Management Charge TER = Total Expense Ratio
Active
J.P. Morgan Life Asset Management Global Dynamic All Countries
Fund overview
This fund invests in global equities (including the UK). The country allocation is based on the market capitalization (the size of each market) of the MSCI All Countries World Index and therefore changes over time. The fund manager looks for stocks that rank highly on value and growth grounds, whilst also looking for quality companies. Stocks are ranked from 1 to 100, and those ranked 1-40 are considered for inclusion in the portfolio. The portfolio typically holds 200-300 stocks.
As the fund invests entirely in equities and seeks to outperform its benchmark return, it is likely to be subject to greater volatility than many other funds. However, it has the potential to provide higher returns than other funds over the long term. In addition, there is a risk that some currencies may fluctuate in value relative to sterling.
Benchmark Target out-performance (net of fees)
Management fees ISIN/SEDOL
MSCI All Countries World Index (Net) 2.35% p.a. net of fees over rolling 3 year periods
AMC: 0.42% p.a.
TER: 0.42% p.a.
GB00B531J851/B0V2DK5
Equities
North America 55.5%Europe & Middle East (ex UK) 16.1%Emerging Markets 11.1%Japan 7.2%Pacific (ex Japan) 6.1%UK 2.7%Cash 1.3%
Asset Allocation
Financials 19.1%Technology 18.3%Consumer Goods & Services 17.8%Healthcare 12.3%Industrials 11.7%Materials 7.2%Energy 6.0%
Cash 3.7%Utilities 2.0%Real Estate 1.0% Telecommunications 0.9%
Total return for the 12 months to 31/03/18: 4.9%
Benchmark 2.4%
Annualised total return for the 3 years to 31/03/18:
10.4%
Benchmark 10.2%
Annualised total return for the 5 years to 31/03/18:
11.5%
Benchmark 10.9%
Fund returns are after the deduction of charges.
-505
1015202530354045
J.P. Morgan UK Pension Plan24

AMC = Annual Management Charge TER = Total Expense Ratio
UK
Eq
uities/Glo
bal E
quities/R
egio
nal Eq
uities
Active
Baillie Gifford Global Alpha Pension
Fund overview
This fund invests in global equities (including the UK). The country allocation is based on the market capitalization (the size of each market) of the MSCI AC World Index and therefore changes over time. Baillie Gifford’s investment philosophy is to make long term investments in well-managed businesses which enjoy sustainable, competitive advantages. There are allocation limits in place relative to the benchmark for individual stocks of +6%, sectors +10% and regions +20%. The portfolio typically holds 70-120 stocks.
As the fund invests entirely in equities and seeks to outperform the benchmark return, this fund is likely to be subject to greater volatility than many other funds. However, it has the potential to provide higher returns than other funds over the long term. In addition there is a risk that some currencies may fluctuate relative to the value of sterling.
Benchmark Target out-performance (net of fees)
Management fees ISIN/SEDOL
MSCI World Index 1.5%-2.5% p.a. net over rolling 5 year periods
AMC: 0.45% p.a.
TER: 0.49% p.a.
GB00B3T6MM50/n/a
Total return for the 12 months to 31/03/18: 12.6%
Benchmark 2.9%
Annualised total return for the 3 years to 31/03/18:
14.5%
Benchmark 10.8%
Annualised total return for the 5 years to 31/03/18:
14.7%
Benchmark 11.5%
Fund returns are after the deduction of charges.
-505
1015202530354045
Equities
North America 44.5%Emerging Markets 21.6% Europe (ex UK) 18.9%Japan 7.7%UK 3.8%Pacific (ex Japan) 3.5%
Asset Allocation
Financials 25.5%Information Technology 25.1%Consumer Discretionary 17.0%Industrials 14.8%Health Care 9.9%Materials 3.3%
Energy 2.2%Consumer Staples 1.6%Real Estate 0.5%Telecommunication Services 0.2%
AMC = Annual Management Charge TER = Total Expense Ratio
UK
Eq
uities/Glo
bal E
quities/R
egio
nal Eq
uities
Passive
LGIM MSCI World Minimum Volatility Equity Index
Fund overview
This fund has been introduced into the Plan’s default strategies to improve diversification and risk-adjusted returns. The Trustee has decided to also make this fund available as a self-select option in the Freestyle fund range.
This fund aims to provide a return consistent with the MSCI World Minimum Volatility (GBP Optimised) Index.
Benchmark Target out-performance (net of fees)
Management fees
MSCI World Minimum Volatility To match the benchmark AMC: 0.15% p.a.
TER: 0.15% p.a.
Total return for the 12 months to 31/03/18: -2.0%
Benchmark -1.8%
Annualised total return for the 3 years to 31/03/18:
9.8%
Benchmark 10.1%
Annualised total return for the 5 years to 31/03/18:
n/a
Benchmark n/a
Fund returns are after the deduction of charges.
-505
1015202530354045
Equities
United States 54.3%Europe 17.1%UK 11.1%Japan 8.2% Asia Pacific ex Japan 5.7%Canada 3.1% Other 0.5%
Asset Allocation
Financials 19.1%Consumer Staples 12.6%Information Technology 12.6%Industrials 11.1%Health Care 10.0%Consumer Discretionary 8.4%Utilities 7.7%
Materials 7.0%Telecommunication Services 6.1%Real Estate 3.5%Energy 1.8%
Your future. Your choice. 25

AMC = Annual Management Charge TER = Total Expense Ratio
UK
Eq
uitie
s/G
lob
al E
qui
ties/
Reg
iona
l Eq
uitie
s
Passive
LGIM North America Equity Index
Fund overview
This fund is designed to match the total returns of North American equity markets, including income. Investing some assets overseas adds an element of protection by spreading risk among a number of markets and currencies but introduces currency risk.
As the fund invests entirely in equities, this fund is likely to be subject to greater volatility than many other funds. However, as it aims to track its benchmark, the risk of underperformance against the benchmark is small relative to an active fund.
As the fund invests in equities, it has the potential to provide higher returns than other funds over the long term. In addition, there is a risk that some currencies may fluctuate in value relative to sterling.
Equities
Large Cap 82.2% Mid Cap 17.8% Small Cap 0.0%
Asset Allocation
Consumer Goods & Services 21.5%Financials 20.8%Technology 20.1%Industrials 12.1%
Healthcare 12.0%Energy 6.4%Utilities 2.8%Materials 2.5%Telecommunications 2.0%
Benchmark Target out-performance (net of fees)
Management fees
FTSE North America Index To track the benchmark AMC: 0.04% p.a.
TER: 0.04% p.a.
Total return for the 12 months to 31/03/18: -0.3%
Benchmark -0.3%
Annualised total return for the 3 years to 31/03/18:
11.7%
Benchmark 11.7%
Annualised total return for the 5 years to 31/03/18:
13.9%
Benchmark 14.0%
Fund returns are after the deduction of charges.
-505
1015202530354045
AMC = Annual Management Charge TER = Total Expense Ratio
Passive
LGIM FTSE Global Developed Small Cap Equity Index
Fund overview
This fund has been introduced into the Plan’s default strategies to improve diversification and risk-adjusted returns. The Trustee has decided to also make this fund available as a self-select option in the Freestyle fund range.
This fund aims to provide a return consistent with the FTSE Global Developed Small Cap Index.
Benchmark Target out-performance (net of fees)
Management fees
FTSE Global Developed Small Cap Equity Index
To match the benchmark AMC: 0.14% p.a.
TER: 0.14% p.a.
UK
Eq
uitie
s/G
lob
al E
qui
ties/
Reg
iona
l Eq
uitie
s
Total return for the 12 months to 31/03/18: 1.4%
Benchmark 1.3%
Annualised total return for the 3 years to 31/03/18:
10.1%
Benchmark 10.0%
Annualised total return for the 5 years to 31/03/18:
n/a
Benchmark n/a
Fund returns are after the deduction of charges.
-505
1015202530354045
Equities
United States 61.6%Europe 12.4%Japan 7.8% Asia Pacific ex Japan 6.4%Canada 5.9% UK 5.9%Other 0.2%
Asset Allocation
Financials 23.5%Industrials 22.0%Consumer Services 11.9%Technology 10.6%Health Care 9.5%Consumer Goods 8.0%Basic Materials 6.8%Oil & Gas 4.1%
Utilities 2.8%Telecommunications 0.7% Unclassified 0.1%
J.P. Morgan UK Pension Plan26

AMC = Annual Management Charge TER = Total Expense Ratio
AMC = Annual Management Charge TER = Total Expense Ratio
UK
Eq
uities/Glo
bal E
quities/R
egio
nal Eq
uities
Passive
LGIM Europe (ex UK) Equity Index
Fund overview
This fund is designed to match the total returns of European (excluding UK) equity markets. The index weights the various markets included in it on a market capitalization basis. Investing some assets overseas adds an element of protection by spreading risk among a number of markets and currencies but introduces currency risk.
As the fund invests entirely in equities, this fund is likely to be subject to greater volatility than many other funds. However, as it aims to track its benchmark, the risk of underperformance against the benchmark is small relative to an active fund.
As the fund invests in equities, it has the potential to provide higher returns than other funds over the long term. In addition, there is a risk that some currencies may fluctuate in value relative to sterling.
Equities
Large Cap 82.4%Mid Cap 17.7%Small Cap 0.0%
Asset Allocation
Consumer Goods & Services 24.4%Financials 22.6%Industrials 16.1%Healthcare 13.2%
Materials 6.5%Technology 5.5%Utilities 4.1% Energy 4.2%Telecommunications 3.4%
Benchmark Target out-performance (net of fees)
Management fees
FTSE Developed Europe (ex UK) Index To track the benchmark AMC: 0.04% p.a.
TER: 0.04% p.a.
Total return for the 12 months to 31/03/18: 3.7%
Benchmark 3.7%
Annualised total return for the 3 years to 31/03/18:
8.2%
Benchmark 8.3%
Annualised total return for the 5 years to 31/03/18:
10.0%
Benchmark 10.0%
Fund returns are after the deduction of charges.
-505
1015202530354045
UK
Eq
uities/Glo
bal E
quities/R
egio
nal Eq
uities
Passive
LGIM Japan Equity Index
Fund overview
This fund is designed to match the total returns of the Japanese equity market. Investing some assets overseas adds an element of protection by spreading risk among a number of markets and currencies but introduces currency risk.
As the fund invests entirely in equities, this fund is likely to be subject to greater volatility than many other funds. However, as it aims to track its benchmark, the risk of underperformance against the benchmark is small relative to an active fund.
As the fund invests in equities, it has the potential to provide higher returns than other funds over the long term. In addition, there is a risk that Japanese Yen values may fluctuate relative to sterling.
Equities
Large Cap 79.3%Mid Cap 20.7%Small Cap 0.0%
Asset Allocation
Consumer Goods & Services 35.5%Industrials 23.4%Financials 14.9%Healthcare 7.1%
Materials 6.4%Technology 5.4%Telecommunications 4.4% Utilities 1.8%Energy 1.1%
Benchmark Target out-performance (net of fees)
Management fees
FTSE Japan Index To track the benchmark AMC: 0.05% p.a.
TER: 0.05% p.a.
Total return for the 12 months to 31/03/18: 6.3%
Benchmark 6.3%
Annualised total return for the 3 years to 31/03/18:
10.9%
Benchmark 11.0%
Annualised total return for the 5 years to 31/03/18:
11.3%
Benchmark 11.3%
Fund returns are after the deduction of charges.
-505
1015202530354045
Your future. Your choice. 27

AMC = Annual Management Charge TER = Total Expense Ratio
AMC = Annual Management Charge TER = Total Expense Ratio
AMC = Annual Management Charge TER = Total Expense Ratio
UK
Eq
uitie
s/G
lob
al E
qui
ties/
Reg
iona
l Eq
uitie
s
Passive
LGIM Asia Pacific (ex Japan) Developed Equity Index
Fund overview
This fund is designed to match the total returns of developed Asia Pacific (excluding Japan) equity markets, including income. This fund invests in a range of countries in the region, including Australia, New Zealand, Hong Kong, S. Korea and Singapore. Investing some assets overseas adds an element of protection by spreading risk among a number of markets and currencies but introduces currency risk.
As the fund invests entirely in equities, this fund is likely to be subject to greater volatility than many other funds. However, as it aims to track its benchmark, the risk of underperformance against the benchmark is small relative to an active fund.
As the fund invests in equities, it has the potential to provide higher returns than other funds over the long term. In addition, there is a risk that some currencies may fluctuate in value relative to sterling.
Equities
Large Cap 85.2%Mid Cap 9.7%Small Cap 5.1%
Asset Allocation
Financials 38.8%Consumer Goods & Services 25.1%Industrials 10.7%Materials 8.2%
Healthcare 5.0%Technology 3.8% Utilities 3.4% Energy 3.2%Telecommunications 1.8%
Benchmark Target out-performance (net of fees)
Management fees
FTSE Developed Asia-Pacific (ex Japan) Index
To track the benchmark AMC: 0.05% p.a.
TER: 0.05% p.a.
Total return for the 12 months to 31/03/18: 1.6%
Benchmark 1.6%
Annualised total return for the 3 years to 31/03/18:
9.7%
Benchmark 9.6%
Annualised total return for the 5 years to 31/03/18:
6.4%
Benchmark 6.4%
Fund returns are after the deduction of charges.
-505
1015202530354045
UK
Eq
uitie
s/G
lob
al E
qui
ties/
Reg
iona
l Eq
uitie
s
AMC = Annual Management Charge TER = Total Expense Ratio
Passive
LGIM World Emerging Markets Equity Index
Fund overview
This fund aims to capture the return of emerging markets across Latin America, Europe/Middle East/Africa and Asia. Emerging market equities are likely to have very volatile returns with periods of high positive returns followed by periods of large negative returns. The fund tracks the FTSE All World All Emerging Markets Index.
As the fund invests entirely in equities, this fund is likely to be subject to greater volatility than many other funds. However, as it aims to track its benchmark, the risk of underperformance against the benchmark is small relative to an active fund.
As the fund invests in equities, it has the potential to provide higher returns than other funds over the long term. In addition, there is a risk that some currencies may fluctuate in value relative to sterling.
Equities
Asia 65.6%Europe/Mid East/Africa 18.1%Latin America 16.3%Cash 0.0%
Top 4 countries
China 28.9%Taiwan 13.7%India 11.7%South Africa 9.5% Rest of World 36.2%
Benchmark Target out-performance (net of fees)
Management fees
FTSE All World All Emerging Markets Index
To track the benchmark AMC: 0.02% p.a.
TER: 0.02% p.a.
Total return for the 12 months to 31/03/18: 7.8%
Benchmark 7.8%
Annualised total return for the 3 years to 31/03/18:
9.8%
Benchmark 9.9%
Annualised total return for the 5 years to 31/03/18:
6.4%
Benchmark 6.5%
Fund returns are after the deduction of charges.
-505
1015202530354045
J.P. Morgan UK Pension Plan Your future. Your choice.28 29

AMC = Annual Management Charge TER = Total Expense Ratio
AMC = Annual Management Charge TER = Total Expense Ratio
UK
Eq
uities/Glo
bal E
quities/R
egio
nal Eq
uities
AMC = Annual Management Charge TER = Total Expense Ratio
Active
Benchmark Target out-performance (net of fees)
Management fees ISIN/SEDOL
MSCI Emerging Market Index (Net) 2.2% p.a. net of fees over rolling 3 year periods
AMC: 0.70% p.a.
TER: 0.70% p.a.
GB00B51NXH09/B51NXH0
J.P. Morgan Asset Management Life All-Emerging Markets Equity
Fund overview
This fund aims to capture the return of emerging markets across Latin America, Europe/Middle East/Africa and Asia. Emerging market equities are likely to have very volatile returns, with periods of high positive returns followed by periods of large negative returns. JPMAM believe that emerging markets are inefficient and outperformance comes from buying good businesses at the right price, and avoiding overvalued stocks and markets. The approach has both quality and growth elements. The portfolio is likely to be concentrated between 65 and 75 holdings with a 30% turnover. The currency exposure is not hedged.
As the fund invests entirely in equities, particularly emerging market equities and seeks to outperform the benchmark return, this fund is likely to be subject to greater volatility than many other funds. However, it has the potential to provide higher returns than other funds over the long term. In addition there is a risk that some currencies may fluctuate relative to the value of sterling and additional risk of investing in emerging markets such as political stability, expropriation of assets and lack of infrastructure and institutional development.
EquitiesAsia 51.2%Europe/Mid East/Africa 30.3% Latin America 16.5%Cash 2.0%
Top 4 countriesChina 34.6%India 17.8%Brazil 8.2%
South Africa 6.7%Rest of World 32.7%
Total return for the 12 months to 31/03/18: 13.7%
Benchmark 11.4%
Annualised total return for the 3 years to 31/03/18:
12.8%
Benchmark 10.9%
Annualised total return for the 5 years to 31/03/18:
7.5%
Benchmark 6.7%
Fund returns are after the deduction of charges.
-505
1015202530354045
AMC = Annual Management Charge TER = Total Expense Ratio
Active
Baillie Gifford Emerging Markets
Fund overview
This fund aims to capture the return of emerging markets across Latin America, Europe/Middle East/Africa and Asia. Emerging market equities are likely to have very volatile returns, with periods of high positive returns followed by periods of large negative returns. Baillie Gifford believe that they can add value by long-term investment in well-managed quality businesses that have high upside potential. This fund has a positive exposure to growth-oriented factors. The portfolio typically hold between 60 and 120 emerging market stocks with a 40% turnover. The currency exposure is not hedged.
As the fund invests entirely in equities, particularly emerging market equities and seeks to outperform the benchmark return, this fund is likely to be subject to greater volatility than many other funds. However, it has the potential to provide higher returns than other funds over the long term. In addition there is a risk that some currencies may fluctuate relative to the value of sterling and additional risk of investing in emerging markets such as political stability, expropriation of assets and lack of infrastructure and institutional development.
Benchmark Target out-performance (net of fees)
Management fees ISIN/SEDOL
MSCI Emerging Markets Index 3% p.a. (gross of fees) AMC: 0.63% a year
TER: 0.70% a year
GB0033772624/N/A
UK
Eq
uities/Glo
bal E
quities/R
egio
nal Eq
uities
Total return for the 12 months to 31/03/18: 18.8%
Benchmark 11.8%
Annualised total return for the 3 years to 31/03/18:
14.5%
Benchmark 11.3%
Annualised total return for the 5 years to 31/03/18:
n/a
Benchmark n/a
Fund returns are after the deduction of charges.
-505
1015202530354045
Asset allocation
Information Technology 36.0% Financials 30.0%Energy 10.1%Consumer Discretionary 9.9%Materials 6.1%
Top 4 countries
China 34.9%India 12.3%South Korea 12.3%Brazil 8.7%Rest of World 31.9%
Cash 2.9%Consumer Staples 2.0%Real Estate 1.9% Industrials 1.3%
J.P. Morgan UK Pension Plan Your future. Your choice.28 29

AMC = Annual Management Charge TER = Total Expense Ratio
AMC = Annual Management Charge TER = Total Expense Ratio
Bal
ance
d/D
iver
sifie
d G
row
thB
alan
ced
/Div
ersi
fied
Gro
wth
AMC = Annual Management Charge TER = Total Expense Ratio
Passive
LGIM Consensus Blended
Fund overview
The Consensus Blended Fund combines the long-term potential of equities with the relative security of bonds and cash. Although equities can deliver high returns in the long term, they can be volatile in the short term. Investment in bonds and cash lessens this effect.
As a balanced fund investing mainly in equities, this fund will be subject to less volatility than a pure equity fund, but has the potential to provide greater growth than pure bond/gilt or liquidity funds.
As it aims to track its benchmark, the risk of underperformance against the benchmark, within each market, is small relative to an active fund. In addition, there is a risk that some currencies may fluctuate in value relative to sterling.
Equities
UK 33.4%North America 19.0%Europe (ex UK) 12.9%Japan 7.0% Emerging Markets 3.3%Pacific (ex Japan) 3.2%
Bonds
Corporate Bonds 8.7%Cash/Other 6.2% Fixed Interest Gilts 5.3%Index Linked Gilts 1.0%
Benchmark Target out-performance (net of fees)
Management fees
Composite To track the benchmark AMC: 0.06% p.a.
TER: 0.06% p.a.
Total return for the 12 months to 31/03/18: 1.5%
Benchmark 1.5%
Annualised total return for the 3 years to 31/03/18:
7.4%
Benchmark 7.3%
Annualised total return for the 5 years to 31/03/18:
7.8%
Benchmark 7.7%
Fund returns are after the deduction of charges.
-505
1015202530354045
AMC = Annual Management Charge TER = Total Expense Ratio
Active
Baillie Gifford Managed Pension
Fund overview
The Baillie Gifford Managed Pension Fund invests in a number of asset classes including UK equities, overseas equities, UK bonds, cash and cash equivalents. Allocations to the underlying asset classes are achieved by investing in other equity, bond and liquidity funds managed by Baillie Gifford. The majority of outperformance is expected to be generated by stock selection in these underlying funds.
As a balanced fund investing mainly in equities and seeking to outperform its benchmark return, this fund will be subject to less volatility than an actively managed pure equity fund, but has the potential to provide greater growth than pure bond/gilt or liquidity funds. In addition, there is a risk that some currencies may fluctuate in value relative to sterling.
Equities
UK 20.3%North America 18.0%Europe (ex UK) 17.5%Japan 7.6%Emerging Markets 7.6%Pacific (ex Japan) 4.0%
Bonds
Fixed Interest Gilts 12.9%Cash/Other 5.9%Corporate Bonds 5.7%Index linked Gilts 0.6%
Benchmark Target out-performance (net of fees)
Management fees ISIN/SEDOL
IA Balanced Survey Median (From 30/06/16)****
0.7%-1.2% p.a. net of fees over rolling 3 year periods
AMC: 0.30% p.a.
TER: 0.33% p.a.
GB00B03H2C36/N/A
Total return for the 12 months to 31/03/18: 7.0%
Benchmark 1.4%
Annualised total return for the 3 years to 31/03/18:
9.8%
Benchmark 4.9%
Annualised total return for the 5 years to 31/03/18:
8.9%
Benchmark 6.1%
Fund returns are after the deduction of charges.
-505
1015202530354045
* Benchmark prior to 30/06/16 was CAPS Median Balanced Pooled Fund
J.P. Morgan UK Pension Plan Your future. Your choice.30 31

AMC = Annual Management Charge TER = Total Expense Ratio
AMC = Annual Management Charge TER = Total Expense Ratio
Balanced
/Diversified
Gro
wth
AMC = Annual Management Charge TER = Total Expense Ratio
Passive
LGIM Diversified
Fund overview
This fund invests in a range of asset classes including: global equities (including UK), private equity, property, absolute return funds, high yield debt and commodities. All passive funds are managed directly by LGIM with the exception of the commodity part, which may not necessarily be managed by LGIM. Two parts of the fund will be actively managed, namely property and high yield bond exposures.
As this fund invests in a broad range of asset classes (including alternatives that do not fit into the mainstream categories of equities, bonds, cash and property), this fund is expected to have lower volatility and returns than pure equity funds but has the potential to provide higher returns than pure bond/gilt funds. In addition there is a risk that some currencies may fluctuate in value relative to sterling.
Strategic asset allocation
The strategic asset allocation will be reviewed periodically (typically annually) by LGIM. LGIM will not seek to take short-term, tactical asset allocation positions. See the individual 2 page fund factsheet available on MyPension for specific details.
Benchmark Target out-performance (net of fees) Management fees
Bank of England Base Rate N/A AMC: 0.13% p.a.
TER: 0.13% p.a.
Equities
Equity 29.8%Investment Grade Bonds 16.8%Property 13.3%High Yield Bonds 10.9%Emerging Markets 6.7%Infrastructure 6.0%Emerging Market Bonds 6.0%UK Government Bonds 4.5%
Total return for the 12 months to 31/03/18: 2.0%
Benchmark 4.9%
Annualised total return for the 3 years to 31/03/18:
7.0%
Benchmark 8.7%
Annualised total return for the 5 years to 31/03/18:
7.2%
Benchmark 11.3%
Fund returns are after the deduction of charges.
-505
1015202530354045
Overseas Government Bonds 3.5%Private Equity 2.5%Commodities 0.0%
AMC = Annual Management Charge TER = Total Expense Ratio
Active
J.P. Morgan Asset Management Life Balanced
Fund overview
This fund invests in a number of asset classes including UK and overseas equities, property, bonds, cash and cash equivalents. Although equities can deliver high returns in the long term, they can be volatile in the short term. Investment in bonds and cash lessens this effect. The fund aims to outperform the returns of the average UK balanced pension fund.
As a balanced fund investing mainly in equities and seeking to outperform its benchmark return, this fund will be subject to less volatility than an actively managed pure equity fund, but has the potential to provide greater growth than pure bond/gilt or liquidity funds. In addition, there is a risk that some currencies may fluctuate in value relative to sterling.
Equities
North America 42.6%Europe (ex UK) 10.7%Emerging Markets 10.5%Japan 8.3%UK 3.3%Pacific (ex Japan) 3.0%
Bonds
Corporate Bonds 19.4%Cash/Other 2.2%Fixed Interest Gilts 0.0%Index linked Gilts 0.0%
Balanced
/Diversified
Gro
wth
Total return for the 12 months to 31/03/18: 8.5%
Benchmark 5.6%
Annualised total return for the 3 years to 31/03/18:
8.0%
Benchmark 6.6%
Annualised total return for the 5 years to 31/03/18:
9.9%
Benchmark 7.4%
Fund returns are after the deduction of charges.
-505
1015202530354045
Benchmark Target out-performance (net of fees)
Management fees ISIN/SEDOL
20% FTSE All-Share Index (Net), 48% FTSE Developed ex UK Index (Net) Hedged to GBP, 5% MSCI Emerging Markets Index (Net), 2% FTSE/EPRA NAREIT Developed Index (Net) Hedged to GBP, 5% FTSE Actuaries British Government All Stocks Index, 5.5% JP Morgan Global (ex-UK) Bond Index (Hedged to GBP), 5% Bloomberg Barclays Capital Non-Gilt 10+ Year Index, 5% Bloomberg Barclays Global Aggregate Corporate Index (Hedged to GBP), 3% BofA Merrill Lynch US High Yield Master II Constrained Index (Hedged to GBP), 1.5% JP Morgan EMBI Global Diversified (Hedged to GBP)
1.3% p.a. net of fees over rolling 3 year periods
AMC: 0.30% p.a.
TER: 0.30% p.a.
GB0031276495/ 3127649
J.P. Morgan UK Pension Plan Your future. Your choice.30 31

AMC = Annual Management Charge TER = Total Expense Ratio
AMC = Annual Management Charge TER = Total Expense Ratio
Bal
ance
d/D
iver
sifie
d G
row
thB
alan
ced
/Div
ersi
fied
Gro
wth
Active
Aberdeen Standard Investments Global Absolute Return Strategies
Fund overview
This fund invests in a broad range of instruments, ranging from traditional assets to futures, options and other derivatives deployed both to generate returns and control aggregate portfolio risk. Exposure to different asset classes will vary widely over time, subject only to a limit of 30% exposure to any one category of investment and the requirement that the portfolio operates within the stated volatility band of 4%-8%.
As this fund invests in a broad range of asset classes (including alternatives that do not fit into the mainstream categories of equities, bonds, cash and property), this fund is expected to have lower volatility returns than pure equity funds but has the potential to provide higher returns than pure bond/gilt funds. In addition there is a risk that some currencies may fluctuate in value relative to sterling.
Manager name changed from Standard Life to Aberdeen Standard Investments as a result of the merger between Standard Life and Aberdeen Asset Management. There is no change to the underlying strategy as a result of this.
Equities
Equities 36.0%Interest Rates 17.7% Currencies 16.2% Credit 12.3%
Real Estate 9.5%Volatility 4.4%Security Selection 4.0%Cash 0.0%
Benchmark Target out-performance (net of fees)
Management fees
6 Month LIBOR 4.4% p.a. net of fees over rolling 3 year periods
AMC: 0.60% p.a.
TER: 0.62% p.a.
Total return for the 12 months to 31/03/18: 1.0%
Benchmark 0.5%
Annualised total return for the 3 years to 31/03/18:
-0.8%
Benchmark 0.6%
Annualised total return for the 5 years to 31/03/18:
2.1%
Benchmark 0.6%
Fund returns are after the deduction of charges.
-505
1015202530354045
Active
Baillie Gifford Diversified Growth Pension
Fund overview
This fund invests in a range of asset classes including: global equities (including UK), private equity, property, absolute return funds, high yield debt, insurance linked securities and commodities. Baillie Gifford do not use a strategic benchmark or ‘baseline’ allocation but try to add value by investing in asset classes they think will deliver attractive returns relative to cash. The fund must hold a minimum of 5 asset classes where exposure to each asset class is at least 5% of the total portfolio. The fund is actively managed.
As this fund invests in a broad range of asset classes (including alternatives that do not fit into the mainstream categories of equities, bonds, cash and property), this fund is expected to have lower volatility and returns than pure equity funds but has the potential to provide higher returns than pure bond/gilt funds. In addition there is a risk that some currencies may fluctuate in value relative to sterling.
Strategy Allocations
Listed Equities 21.2%Emerging Market Bonds 18.4%Infrastructure 9.1%Property 8.5%Cash and Equivalents 7.7%High Yield Credit 7.1%Absolute Return 7.1%Government Bonds 6.3%Structured Finance 6.2%
Insurance Linked 3.4%Commodities 2.0%Investment Grade Bonds 1.9%Private Equity 0.6%Special Opportunities 0.6%
Total return for the 12 months to 31/03/18: 4.7%
Benchmark 0.4%
Annualised total return for the 3 years to 31/03/18:
4.3%
Benchmark 0.4%
Annualised total return for the 5 years to 31/03/18:
4.4%
Benchmark 0.4%
Fund returns are after the deduction of charges.
-505
1015202530354045
Benchmark Target out-performance (net of fees)
Management fees ISIN/SEDOL
UK Base Rate 3.5% p.a. net of fees over rolling 5 year periods
AMC: 0.50% p.a.
TER: 0.65% p.a.
GB00B4XBT443/N/A
J.P. Morgan UK Pension Plan32
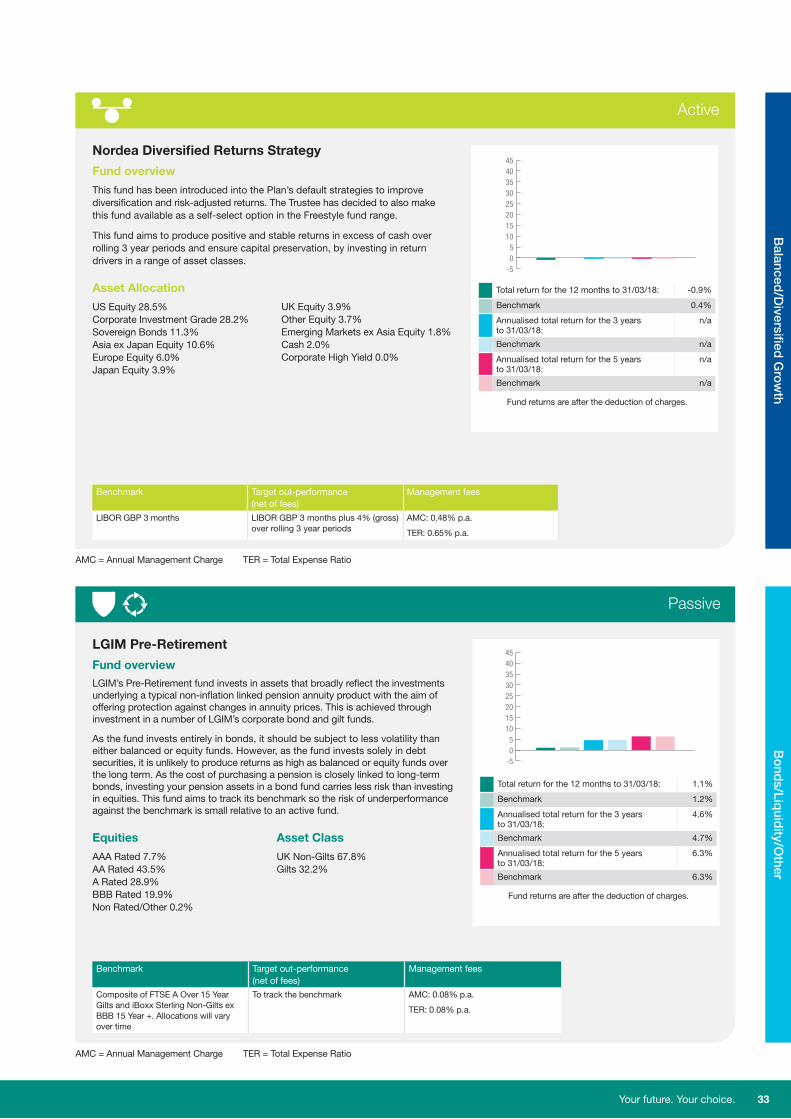
AMC = Annual Management Charge TER = Total Expense Ratio
AMC = Annual Management Charge TER = Total Expense Ratio
Passive
Benchmark Target out-performance (net of fees)
Management fees
Composite of FTSE A Over 15 Year Gilts and iBoxx Sterling Non-Gilts ex BBB 15 Year +. Allocations will vary over time
To track the benchmark AMC: 0.08% p.a.
TER: 0.08% p.a.
LGIM Pre-Retirement
Fund overviewLGIM’s Pre-Retirement fund invests in assets that broadly reflect the investments underlying a typical non-inflation linked pension annuity product with the aim of offering protection against changes in annuity prices. This is achieved through investment in a number of LGIM’s corporate bond and gilt funds.
As the fund invests entirely in bonds, it should be subject to less volatility than either balanced or equity funds. However, as the fund invests solely in debt securities, it is unlikely to produce returns as high as balanced or equity funds over the long term. As the cost of purchasing a pension is closely linked to long-term bonds, investing your pension assets in a bond fund carries less risk than investing in equities. This fund aims to track its benchmark so the risk of underperformance against the benchmark is small relative to an active fund.
Equities
AAA Rated 7.7%AA Rated 43.5%A Rated 28.9%BBB Rated 19.9%Non Rated/Other 0.2%
Asset Class
UK Non-Gilts 67.8% Gilts 32.2%
Bo
nds/Liq
uidity/O
ther
Total return for the 12 months to 31/03/18: 1.1%
Benchmark 1.2%
Annualised total return for the 3 years to 31/03/18:
4.6%
Benchmark 4.7%
Annualised total return for the 5 years to 31/03/18:
6.3%
Benchmark 6.3%
Fund returns are after the deduction of charges.
-505
1015202530354045
Active
Nordea Diversified Returns Strategy
Fund overview
This fund has been introduced into the Plan’s default strategies to improve diversification and risk-adjusted returns. The Trustee has decided to also make this fund available as a self-select option in the Freestyle fund range.
This fund aims to produce positive and stable returns in excess of cash over rolling 3 year periods and ensure capital preservation, by investing in return drivers in a range of asset classes.
Asset Allocation
US Equity 28.5% Corporate Investment Grade 28.2% Sovereign Bonds 11.3%Asia ex Japan Equity 10.6%Europe Equity 6.0%Japan Equity 3.9%
UK Equity 3.9%Other Equity 3.7% Emerging Markets ex Asia Equity 1.8%Cash 2.0%Corporate High Yield 0.0%
Balanced
/Diversified
Gro
wth
Total return for the 12 months to 31/03/18: -0.9%
Benchmark 0.4%
Annualised total return for the 3 years to 31/03/18:
n/a
Benchmark n/a
Annualised total return for the 5 years to 31/03/18:
n/a
Benchmark n/a
Fund returns are after the deduction of charges.
-505
1015202530354045
Benchmark Target out-performance (net of fees)
Management fees
LIBOR GBP 3 months LIBOR GBP 3 months plus 4% (gross) over rolling 3 year periods
AMC: 0.48% p.a.
TER: 0.65% p.a.
Your future. Your choice. 33

AMC = Annual Management Charge TER = Total Expense Ratio
AMC = Annual Management Charge TER = Total Expense Ratio
Bo
nds/
Liq
uid
ity/O
ther
Passive
LGIM Over 5 Year Index-Linked Gilts Index
Fund overview
Investing in this fund minimizes the risk associated with rises in the cost of providing an inflation-linked pension in the run up to your retirement. The fund invests in all long-term government index-linked issues and aims to track the FTSE A Over 5 Years Index-Linked Gilts Index, including re-invested income.
As the fund invests entirely in bonds, it should be subject to less volatility than either balanced or equity funds. However, as the fund invests solely in secure government backed issues, it is unlikely to produce returns as high as balanced or equity funds over the long term.
As the cost of purchasing a pension is closely linked to long-term bonds, investing your pension assets in a bond fund carries less risk than investing in equities. This fund aims to track its benchmark so the risk of underperformance against the benchmark is small relative to an active fund.
Equities
AAA Rated 0.0%AA Rated 100.0%A Rated 0.0%BBB Rated 0.0%Non Rated/Other 0.0%
Bonds
5-10 Years 14.4%10-15 Years 10.5%15+ Years 75.1%
Benchmark Target out-performance (net of fees)
Management fees
FTSE A Over 5 Years Index-Linked Gilts Index
To track the benchmark AMC: 0.04% p.a.
TER: 0.04% p.a.
Total return for the 12 months to 31/03/18: -0.2%
Benchmark -0.1%
Annualised total return for the 3 years to 31/03/18:
7.4%
Benchmark 7.5%
Annualised total return for the 5 years to 31/03/18:
7.5%
Benchmark 7.5%
Fund returns are after the deduction of charges.
-505
1015202530354045
Bo
nds/
Liq
uid
ity/O
ther
Active
Fidelity Aggregate Bond
Fund overview
This fund invests in a mixture of bond types. The fund’s benchmark allocation is 50% to UK Corporate Bonds, and 50% to UK gilts. The exposure to these bonds is obtained by investing in underlying bond funds managed by Fidelity. Fidelity will take asset allocation decisions around this benchmark allocation, dependent on their view on the relative attractiveness of each type of bond. They may also invest a portion of the fund in overseas bonds, index-linked bonds, emerging market bonds or high yield bonds.
As the fund invests entirely in bonds, it should be subject to less volatility than either balanced or equity funds. However, as the fund invests solely in debt securities, it is unlikely to produce returns as high as balanced or equity funds over the long term. As the cost of purchasing a pension is closely linked to long-term bonds, investing your pension assets in a bond fund carries less risk than investing in equities.
Equities
AAA Rated 3.2%AA Rated 57.3%A Rated 9.0%BBB Rated 19.3%Non Rated/Other 11.2%
Asset Class
UK Non-Gilts 50.9% Gilts 49.1%
Benchmark Target out-performance (net of fees)
Management fees ISIN/SEDOL
50% FTSE A All Stocks Gilt Index, 50% ML Eurosterling All Stocks Index
0.51%-0.76% p.a. net of fees over rolling 3 year periods
AMC: 0.25% p.a.
TER: 0.32% p.a.
GB00B28CWX86/N/A
Total return for the 12 months to 31/03/18: 1.5%
Benchmark 0.9%
Annualised total return for the 3 years to 31/03/18:
3.9%
Benchmark 3.5%
Annualised total return for the 5 years to 31/03/18:
5.0%
Benchmark 4.6%
Fund returns are after the deduction of charges.
-505
1015202530354045
J.P. Morgan UK Pension Plan34

AMC = Annual Management Charge TER = Total Expense Ratio
AMC = Annual Management Charge TER = Total Expense RatioAMC = Annual Management Charge TER = Total Expense Ratio
Active
Insight Bonds Plus 300
Fund overview
This is an absolute return bond strategy which aims to achieve a positive return over cash whilst minimising drawdowns. Insight believe that a return can be achieved in all market conditions by targeting the best risk-adjusted investment opportunities and spreading the risk; although there is no guarantee this will be achieved.
The strategy has an emphasis on capital preservation and seeks to avoid interest rate risk of traditional bond funds; Insight do not exclude any fixed income sources of return and utilise a broad fixed income opportunity set, e.g. government, inflation linked, corporate, emerging market debt, high yield, loans, asset backed securities and currency.
Strategy Allocations
Investment Grade Corporate 52.0%Government 26.0%Emerging Market Debt 13.7% Securitised 11.6% Loans 6.9% Sub-Investment Grade Corporate 4.2%Cash, Money market instruments & other -14.4%
Benchmark Target out-performance (net of fees)
Management fees
3 Month Sterling LIBOR 2.5% p.a. net of fees AMC: 0.48% p.a.
TER: 0.53% p.a.
Bo
nds/Liq
uidity/O
ther
Total return for the 12 months to 31/03/18: 0.0%
Benchmark 0.4%
Annualised total return for the 3 years to 31/03/18:
1.2%
Benchmark 0.5%
Annualised total return for the 5 years to 31/03/18:
n/a
Benchmark n/a
Fund returns are after the deduction of charges.
-505
1015202530354045
AMC = Annual Management Charge TER = Total Expense Ratio
Active
J.P. Morgan Asset Management Flexible Credit
Fund overview
This fund is an unconstrained bond strategy, which seeks to provide diverse exposure to the global credit universe with some degree of downside protection. The strategy is a pure credit strategy, which invests in a broad range of corporate credit assets (investment grade and high yield across both developed and emerging markets, along with an allocation to more specialist sectors) to deliver a target return of 5% (+/-2%) over a market cycle. Financial derivative instruments are used where appropriate. The strategy by nature, however, is likely to underperform when credit markets are out of favour.
The fund invests solely in debt securities, it is unlikely to produce returns as high as balanced or equity funds over the long term.
Bo
nds/Liq
uidity/O
ther
Strategy Allocations
High Yield Corporate 63.6% Investment Grade Corporate 29.8%Cash 5.6% Emerging Market Debt 0.7%Convertible Bonds 0.1%Funds 0.1%Government Bonds 0.1%Asset Backed Securities 0.0%Mortgages 0.0%
Total return for the 12 months to 31/03/18: 3.5%
Benchmark 3.0%
Annualised total return for the 3 years to 31/03/18:
2.9%
Benchmark 3.0%
Annualised total return for the 5 years to 31/03/18:
n/a
Benchmark n/a
Fund returns are after the deduction of charges.
-505
1015202530354045
Benchmark Target out-performance (net of fees)
Management fees
3% p.a. n/a AMC: 0.10% p.a.
TER: 0.10% p.a.
Credit rating allocations
AAA 0.0%AA 0.4%A 7.4%BBB 20.5%< BBB 64.3%
Non Rated 1.7%Cash 5.6%
Credit rating allocations
AAA 17.8%AA 27.9%A 17.8%BBB 59.4%BB 6.5%B 3.4%
EMD (Fund & direct) 13.7%Cash & other -46.4%
Your future. Your choice. 35

AMC = Annual Management Charge TER = Total Expense Ratio
AMC = Annual Management Charge TER = Total Expense Ratio
Active
J.P. Morgan Life UK Liquidity
Fund overview
This fund aims to achieve competitive returns by investing in a range of UK short-term money market investments. Its benchmark is the 7 Day Sterling London Interbank Bid Rate (LIBID).
This fund generally invests in highly rated short term debt instruments, where the risk of loss of capital is significantly lower than with other classes. The aim of the fund is to achieve a competitive cash return over time, in comparison with placing funds on deposit with a bank or building society.
Types of Instruments
Money Market Instruments 83.4% Cash 16.6%
Benchmark Target out-performance (net of fees)
Management fees ISIN/SEDOL
1 Week GBP LIBID n/a AMC: 0.10% p.a.
TER: 0.10% p.a.
GB00B71DGG41/N/A
Bo
nds/
Liq
uid
ity/O
ther
Total return for the 12 months to 31/03/18: 0.3%
Benchmark 0.2%
Annualised total return for the 3 years to 31/03/18:
0.4%
Benchmark 0.3%
Annualised total return for the 5 years to 31/03/18:
0.4%
Benchmark 0.3%
Fund returns are after the deduction of charges.
-505
1015202530354045
Bo
nds/
Liq
uid
ity/O
ther
Total return for the 3 Month Return 31/03/18*: -1.4%
Benchmark -1.3%
Fund returns are after the deduction of charges.
-505
1015202530354045
Active
LGIM Euro Liquidity
Fund overview
The fund was added to the Plan’s Freestyle fund range on 28 September 2017.
The Trustee added this fund to the Plan’s fund range in response to the concerns of members who are approaching retirement and plan to retire in the Eurozone.
While this fund is not a long-term investment option, as inflation will erode its value, it aims to provide some protection from the heightened volatility we’re seeing in currency markets for Eurozone retirees (in particular since the EU Referendum result in 2016). This fund is currently delivering negative Euro returns.
The fund carries currency conversion risk for those planning to retire in the UK and is not intended as an investment option for UK retirees.
Equities
Cash 100.0%
* The LGIM Euro Liquidity Fund was made available for investment on 28 September 2017. The performance shown is for 28 September 2017 to 31 December 2017.
Benchmark Target out-performance (net of fees)
Management fees
Euro LIBID 1-Week n/a AMC: 0.06% p.a.
TER: 0.06% p.a.
J.P. Morgan UK Pension Plan Your future. Your choice.36 37

J.P. Morgan UK Pension Plan36
Active
Aberdeen Standard Investments Pooled Property Pension
Fund overview
The fund directly invests in a range of predominantly UK properties including offices, retail units (including shopping centres) and industrial units. The fund may also invest in other Aberdeen Standard Investments funds in order to gain specialist exposure and aims to outperform its benchmark (IPD UK Pooled Property Funds Index (PPFI) All Balanced Fund Median).
As the fund invests entirely in property, the returns will depend in the change in market value of the individual properties and rental return. The fund is likely to have risk return characteristics between those of equities and bonds.
Manager name changed from Standard Life to Aberdeen Standard Investments as a result of the merger between Standard Life and Aberdeen Asset Management. There is no change to the underlying strategy as a result of this.
Sector allocation
Industrial Units 26.3% Offices 24.9%Retail Warehouses 15.1%Cash and Other 11.5%Retail Units 11.4%Shopping Centres 10.6%Other Commercial 0.2%
Benchmark Target out-performance (net of fees)
Management fees
IPD UK PPFI Index All Balanced Fund Index
To outperform the median return of the IPD UK PPFI Index All Balanced Fund Sector over rolling the year periods Net of fees
AMC: 0.50% p.a.
TER: 0.53% p.a.
Total return for the 12 months to 31/03/18: 8.7%
Benchmark 10.0%
Annualised total return for the 3 years to 31/03/18:
6.5%
Benchmark 8.1%
Annualised total return for the 5 years to 31/03/18:
9.5%
Benchmark 10.5%
Fund returns are after the deduction of charges.
-505
1015202530354045
Bo
nds/Liq
uidity/O
ther
AMC = Annual Management Charge TER = Total Expense Ratio
AMC = Annual Management Charge TER = Total Expense Ratio
Bo
nds/Liq
uidity/O
ther
Passive
LGIM Ethical UK Equity Index
Fund overview
The Legal & General Ethical UK Equity Index Fund tracks the FTSE4Good UK Equity Index. The FTSE4Good is an index series for socially responsible investment and uses data provided by EIRIS (Ethical Investment Research Service). EIRIS are a large player in the UK SRI market, and conduct research by way of a binary questionnaire. Companies are classified in two states – either appropriate for the index or inappropriate.
As the fund invests entirely in equities, this fund is likely to be subject to greater volatility than many other funds. However, as it aims to track its benchmark, the risk of underperformance against the benchmark is small relative to an active fund.
As the fund invests in equities, it has the potential to provide higher returns than other funds over the long term.
Equities
Large Cap 90.3%Mid Cap 8.9%Small Cap 0.9%
Bonds
Financials 27.4%Consumer Goods & Services 24.4%Energy 11.8%Healthcare 11.2%
Industrials 8.6%Materials 7.5%Telecommunications 4.3%Utilities 3.8%Technology 1.0%
Benchmark Target out-performance (net of fees)
Management fees
FTSE4Good UK Equity Index To track the benchmark AMC: 0.15% p.a.
TER: 0.15% p.a.
Total return for the 12 months to 31/03/18: 1.7%
Benchmark 1.8%
Annualised total return for the 3 years to 31/03/18:
5.4%
Benchmark 5.5%
Annualised total return for the 5 years to 31/03/18:
6.8%
Benchmark 6.8%
Fund returns are after the deduction of charges.
-505
1015202530354045
J.P. Morgan UK Pension Plan Your future. Your choice.36 37

J.P. Morgan UK Pension Plan38
Def
ault
Po
rtfo
lio
AMC = Annual Management Charge TER = Total Expense Ratio
Default
Default Initial Growth Portfolio
Fund overview
The Default Initial Growth Portfolio seeks to maximise long-term capital growth for members who are far away from retirement, taking higher levels of investment risk while diversifying the exposures of the fund to achieve this goal. The Default Initial Growth Portfolio, which is structured as a blend of underlying pooled funds, invests in a diversified portfolio. The portfolio is composed predominantly of listed global equities, including allocations to small cap and minimum volatility equities, alongside private market investments.
The Default Initial Growth Portfolio is used within the Initial Growth phase of the Default Strategies. Up to age 40, members are 100% invested in the Default Initial Growth Portfolio, at which point they will gradually switch 100% into the Default Mid Growth Portfolio, over 10 years. This fund is not available to invest on a self-select basis.
Asset allocation
LGIM Global Equity Fixed Weight (30:70) Index Fund 55.0% LGIM FTSE Global Developed Small Cap Equity Index Fund 15.0% LGIM MSCI Minimum Volatility Equity Index Fund 15.0%Partners Group Generations Fund 15.0%
PGGF allocation will be funded over the course of 2018.
Benchmark Target out-performance (net of fees)
Management fees
Composite of underlying fund allocations.
Composite Target out-performance based on the underlying fund allocations.
AMC: 0.31% p.a.
TER: 0.34% p.a.
As this fund has been in existence for less than 1 calendar year, there is insufficient data to provide a useful indication of past performance.
Def
ault
Po
rtfo
lio
AMC = Annual Management Charge TER = Total Expense Ratio
Default
Default Mid Growth Portfolio
Fund overview
The Default Mid Growth Portfolio seeks to provide moderate levels of capital growth over the medium to long-term, while reducing the level of volatility on members’ accumulated pension savings. The Default Mid Growth Portfolio, which is structured as a blend of underlying pooled funds, invests predominantly in a number of multi-asset funds that adopt a range of complementary investment approaches, alongside private market investments.
The Default Mid Growth Portfolio is used within the Mid Growth phase of the Default Strategies. From age 40, members are gradually switched into the Default Mid Growth Portfolio over 10 years. This fund is not available to invest on a self-select basis.
Asset allocation
LGIM Diversified Fund 30.0%Baillie Gifford Diversified Growth Fund 20.0% Nordea Diversified Returns Strategy Fund 20.0%Standard Life Global Absolute Return Strategies Fund 20.0%Partners Group Generations Fund 10.0%
Benchmark Target out-performance (net of fees)
Management fees
Composite of underlying fund allocations.
Composite Target out-performance based on the underlying fund allocations.
AMC: 0.51% p.a.
TER: 0.61% p.a.
As this fund has been in existence for less than 1 calendar year, there is insufficient data to provide a useful indication of past performance.
Default Strategy Portfolios

Your future. Your choice. 39
Fund manager information
Baillie Gifford
Web:
http://jpmorgan.dc.bailliegifford.com/pages/misc/home.aspx
Username: jpmorgan PIN: Baillie
Phone: No manager helpline is available – please contact the
general Pensions Helpline on 01737 227589
Dimensional
Web: https://eu.dimensional.com/en
Please select the following fund from the drop down box:
Emerging Markets Value Fund (GBP, Acc)
Phone: No manager helpline is available – please contact the
general Pensions Helpline on 01737 227589
Fidelity
Web: www.planviewer.fidelitypensions.com/dcpv/DoLogin.do
Phone: 08457 234 235
Email: [email protected]
J.P. Morgan
Web: http://jpmukpp.jpmorganassetmanagement.co.uk
Phone: 0800 731 8731
Legal & General
Web: www.lgim.com/microsites/lgim
Aberdeen Standard Investments
Web: www.standardlifeinvestments.com
Phone: No manager helpline is available – please contact
the general Pensions Helpline on 01737 227589
AMC = Annual Management Charge TER = Total Expense Ratio
Default
Default Retirement Portfolio
Fund overview
The Default Retirement Portfolio is 75% invested in a fund that invests in bond assets that broadly reflect the investments underlying a typical non-inflation linked pension annuity product with the aim of offering protection against changes in annuity prices. The portfolio also holds a 25% allocation to the liquidity fund in the expectation that members will look to take a tax-free cash lump-sum at retirement. An allocation to liquidity and bond funds tends to be less volatile than investments in equity and multi-asset funds, but is likely to produce lower returns.
Members are gradually switched from the Default Mid Growth Portfolio into the Default Retirement Portfolio over 5 or 3 years from their target retirement age. This fund is not available to invest on a self-select basis.
Asset allocation
LGIM Pre-Retirement Fund 75.0%JPM Life UK Liquidity Fund 25.0%
Benchmark Target out-performance (net of fees)
Management fees
Composite of underlying fund allocations.
Composite Target out-performance based on the underlying fund allocations.
AMC: 0.08% p.a.
TER: 0.08% p.a.
As this fund has been in existence for less than 1 calendar year, there is insufficient data to provide a useful indication of past performance.
Default P
ortfo
lio

J.P. Morgan UK Pension Plan40
We have provided a range of funds that covers the different asset classes. Within each asset class we have also, where possible, provided funds that:
h Aim to match the benchmark (Passive);
h Aim to outperform the benchmark (Active)
Chart 1 Highest and Lowest 12 Month ReturnThis chart shows the highest and lowest performance return for individual 12 month periods experienced by the Plan’s funds over the 5 years to 31 March 2018. For example, the 12 months to 31 March 2018, the 12 months to 31 March 2017, and the 12 months to 31 March 2016 would be considered as three separate 12 month periods for this purpose. The median return for a fund is a form of average return, calculated by arranging the set of 12 month period returns for that particular fund in order from highest to lowest and selecting one single 12 month return which falls in the middle of this range. For example, the LGIM UK Equity (5% Capped) Fund shows that the Fund’s highest annual return over the 5 years to quarter end was 22.0%, while its lowest return over the same period was -3.8%.
Funds with less than 5 years’ performance history have not been included.
Range of returns
JPM Life UK Liquidity
Aberdeen Standard Investments Property
Baillie Gifford Diversified Growth
Fidelity Aggregate Bond
Aberdeen Standard Investments GARS
LGIM Diversified
Baillie Gifford Managed Pension
LGIM Pre Retirement
JPM Life Balanced
LGIM Consensus Index
LGIM UK Equity (5% Capped)
LGIM Global Equity Fixed Weight (30:70) Index
LGIM Ethical UK Equity Index
JPM Life UK Specialist Equity
JPM Life Diversified Equity
Aberdeen Standard Investments UK Equity
Baillie Gifford UK Equity Focus Pension
LGIM Over 5 Year Index Linked Gilts Index
LGIM Europe (ex UK) Equity Index
JPM Life UK Dynamic
LGIM North America Equity Index
Baillie Gifford Global Alpha Pension
JPM Life Global Dynamic
LGIM Japan Equity Index
LGIM World Emerging Markets Equity Index
LGIM Asia Pacific (ex Japan) Developed Equity Index
JPM Life Emerging Market Equity
-30 -25 -20 -15 -10 -5 0 5 10 15 20 25 30 35 40 45 50 55 60 65 70 75 80 85 90
-30 -25 -20 -15 -10 -5 0 5 10 15 20 25 30 35 40 45 50 55 60 65 70 75 80 85 90

Your future. Your choice. 41
Chart 2 Highest and Lowest 12 Month Return Relative to BenchmarkThis chart shows the largest out and under-performance of 12 month returns relative to benchmark over the 5 years to 31 March. The chart therefore gives an indication of the deviation of the investment managers’ performance from benchmark. As expected, the deviation of the passive investment manager’s returns (LGIM) is low, whilst the deviation for active managers’ returns are expected to be high. The LGIM Diversified Fund is benchmarked against the UK Base Rate, which is why it has a larger deviation relative to its benchmark than we might expect for a passive fund.
For example, for the JPM Life UK Dynamic Fund the deviation is high. The JPM Life UK Dynamic Fund’s greatest 12 month outperformance over the 5 years to quarter end was 15.0%; while the greatest underperformance over the same period was -8.1%.
Funds with less than 5 years’ performance history have not been included.
LGIM Over 5 Year Index Linked Gilts Index
LGIM North America Equity Index
JPM Life UK Liquidity
LGIM Asia Pacific (ex Japan) Developed Equity Index
LGIM Europe (ex UK) Equity Index
LGIM Global Equity Fixed Weight (30:70) Index
LGIM Consensus Index
LGIM Ethical UK Equity Index
LGIM World Emerging Markets Equity Index
LGIM Pre Retirement
LGIM UK Equity (5% Capped)
LGIM Japan Equity Index
Fidelity Aggregate Bond
Baillie Gifford Managed Pension
JPM Life Global Dynamic
Aberdeen Standard Investments Property
JPM Life Balanced
JPM Life Diversified Equity
JPM Life Emerging Market Equity
JPM Life UK Specialist Equity
Aberdeen Standard Investments UK Equity
Baillie Gifford Diversified Growth
Baillie Gifford Global Alpha Pension
Aberdeen Standard Investments GARS
Baillie Gifford UK Equity Focus Pension
LGIM Diversified
JPM Life UK Dynamic
-30 -25 -20 -15 -10 -5 0 5 10 15 20 25 30 35 40 45 50 55 60 65 70 75 80 85 90
-30 -25 -20 -15 -10 -5 0 5 10 15 20 25 30 35 40 45 50 55 60 65 70 75 80 85 90

J.P. Morgan UK Pension Plan42
Glossary of termsThis section gives a glossary of some of the terms that you may have come across in this guide.
Absolute Return
Investment strategies targeting a positive return in absolute
terms rather than relative to an index or other benchmark.
These can also be referred to as ‘cash plus’ funds.
Alpha
Measure of the incremental return added by an investment
manager through active management.
Annuity
At retirement you may choose for your pension fund to
be used to buy an annuity. An annuity is a contract with
an insurance company to pay an annual income for the
rest of your life.
Asset-backed security
Security backed by notes or receivables against assets
other than property.
Benchmark
A level of investment return, against which the
performance of the investment manager is measured
(for active managers) or which the investment manager
aims to follow (for passive managers).
Blended funds
Blended funds combine several underlying funds in
proportions that are designed to meet certain objectives,
for example, to manage risk whilst still growing your pension
account. These type of funds allow the Trustee to diversify
the risk and return that investors are exposed to and the
management of allocations over time.
BNY Mellon CAPS
One of the main service providers in the UK that
independently analyses the performance of pension
funds and investment managers.
Commodities
Any raw materials – examples include oil, gold and cattle.
Derivatives
Financial instruments whose value is dependent on the value
of an underlying index, currency, commodity or other asset.
Examples include options, futures, forwards and swaps.
Duration
Average time-weighted life of the payment stream from
a bond or stream of cash flows, taking into account the
present value of each cash flow. In practice, duration is
the measure of sensitivity to interest rates.
Equities (also known as shares or stocks)
Share in the ownership of a company that gives the holder
the right to receive distributed profits and to vote at general
meetings of the company (ordinary shares).
Forward
Bespoke contract to buy or sell an asset at an agreed price
at a specified date in the future.
Future
Standardised forwards that are traded on an organised
exchange and subject to the rules of the exchange.
Growth stock
Stock that is expected to achieve above average earnings
growth. Growth stocks normally have a higher P/E ratio
(see overleaf) relative to the market as a whole, as investors
anticipate that earnings will increase in the future.
Growth investors/managers seek out growth stocks.
High yield bonds
Corporate bond that has been given a low credit rating/sub
investment grade by credit rating agencies.
Index
A measure updated regularly that gives a representation of
the movement in value of a particular market or a specified
group of securities.
IPD
Investment Property Database provides performance data
and analysis for real estate investors.

Your future. Your choice. 43
LIBOR/LIBID
London Inter-Bank Offered Rate (LIBOR), the interest rate at
which London-based banks are prepared to lend money to
other banks. London Inter-Bank Bid Rate (LIBID), the interest
rate at which London-based banks are prepared to borrow
money from other banks.
Median
A measure of the ‘average’. It is found by arranging all of
the values in order and then selecting the one in the middle.
For example, a median performance among a group of five
managers would be the third ranked manager.
Momentum
Extent to which stock market values are supported by
a strong level of trading activity and investor interest.
Also refers to an investment style of purchasing stocks
that have recently exhibited strong price growth.
Mortgage backed securities
Investment instrument that represents ownership of an
interest in a group of mortgages. Payments from the
individual mortgages are used to make payments on
the mortgage backed securities.
Options
Give the owner of the option the right, but not the obligation,
to buy or sell a security at an agreed price within an agreed
time period.
Price/Earnings (P/E) ratio
Commonly used indicator of the value of a stock calculated
as a company’s current share price divided by its earnings
per share. A high P/E ratio may be justified because a
company is expected to increase its earnings per share or it
may indicate simply that the company’s stock is expensive.
Private Equity
Shares in unquoted companies. Usually high risk/high return
in nature, and can be very illiquid.
Strategic asset allocation
Allocation between asset classes.
Swaps
Contracts which permit investors to exchange payment streams
for their mutual benefit.
Tactical asset allocation
Short-term deviation from a strategic asset allocation to exploit
predicted short-term relative movements in markets with the
aim of generating excess return relative to a benchmark.
TER
The Total Expense Ratio (‘TER’) is the sum of the total explicit
costs deducted annually by the manager of an investment
fund, divided by the total value of the fund. These costs
include the investment manager’s fees (commonly referred
to as the Annual Management Charge, or AMC), as well as
administrative, legal and operational costs, among others.
Tracking error/Volatility
The variability of returns relative to their mean or expected
return, this is typically quantified as standard deviation.
Value investment
Approach to investment which places emphasis on identifying
shares which are believed to be under-priced (on the basis of
indicators such as P/E ratios, (see above) and dividend yield)
by the market.

Don’t delay. It’s your future. Make it your choice. June 2018
Here to helpAccessing MyPension
Current employees
Former employees
From work: me@jpmc
From home: via My Rewards at: https://myrewards.jpmorganchase.com
If you have trouble logging in to My Rewards, access myTecHUB at: mytechub.jpmorganchase.com from any device with an Internet connection to reset your Single Sign-On (SSO) password.
You can access MyPension by contacting AccessHR on 0207 134 0606 for a password and then visiting: https://myrewards.jpmorganchase.com
By using your User ID and password (which was originally sent separately to your home address when you left J.P. Morgan) at: https://epa.towerswatson.com/doc/JMC/login.htm
RememberAll employees can also access the all new MyPension on their smartphone, using the MyPension App. If you need more help with the website, or with accessing the App, please contact the Plan’s administrator, using the details opposite.
More informationMore information about investments and the fund range can be found in the My Investments and My Default Strategy guides held on MyPension and www.mypensiontools.co.uk
You can also download a detailed 2-page factsheet for each fund on MyPension.
If you’re not able to get all the information you need from the MyPension website, you should contact Willis Towers Watson, the Plan’s administrator.
By post: J.P. Morgan UK Pension Plan Willis Towers Watson PO Box 545 Redhill Surrey RH1 1YX
Phone: Dedicated helpline: 01737 227589 (Monday to Friday, 9am to 5pm)
Fax: 01737 241496
Email: [email protected]
Please note that when you contact the Plan’s administrator, you will be asked a number of security questions to validate your identity. One of these checks will be to confirm your National Insurance number, so please try to have this at hand when you call the helpline.
Contact the Plan’s administrator