uk construction forecast - · pdf fileuk construction forecast a report by the forecasting...
TRANSCRIPT

UK Construction Forecast A report by the Forecasting Committee for the Construction Industries
Summer 2016 – Volume 22: Issue 3
1


© Experian
UK Construction Forecast
Summer 2016 Volume 22: Issue 3
A report by the
Forecasting Committee
for the Construction
Industries
This report has been prepared for publication by the Construction Futures team, which is part of Experian’s Economics Unit, with guidance from its Forecasting Committee for the Construction Industries. The members of the committee serve in a personal not a representative capacity. The contribution of the members, and that of the Forecasting Groups (listed in Appendix D), is gratefully acknowledged. Whilst every endeavour has been made to obtain the best available data from appropriate sources, Experian’s Market Insight Division can give no guarantee of accuracy, nor for the applicability of the forecasts for particular decisions. No responsibility is taken for any consequential loss or other effects from these data. Copyright © Experian 2016 ISSN 0308-079X Apart from fair dealing for the purposes of research or private study, or criticism or review, and only as permitted under the Copyright Designs and Patents Act 1998, this publication may only be reproduced, stored or transmitted, in any form or by any means, with the prior permission in writing of the Publishers or in the case of reprographic reproduction in accordance with the terms of the licences issued by the Copyright Licensing Agency in the UK. US copyright law is applicable in the US. Printed by PAPCOM
© Experian
UK Construction Forecast
Summer 2016 Volume 22: Issue 3
CONTENTS
Page
Executive Summary 1
1. Macroeconomic outlook 7
2. Housing 13
3. Housing repair, maintenance and improvement 18
4. New infrastructure 22
5. Public non-residential construction 38
6. Private industrial construction 44
7. Private commercial construction 48
8. Non-residential repair and maintenance 59
Appendix A: Health and education output Appendix B: Construction output in current prices Appendix C: Definitions: types and examples of construction work Appendix D: Membership of the forecasting committees
© Experian
UK Construction Forecast
Summer 2016 Volume 22: Issue 3
Executive Summary
Key messages
These forecasts have been assembled prior to the European Union referendum vote on 23rd June. It is too early yet to assess the implications of the vote on either the economy as a whole or construction in particular. However, we have provided an assessment of where we believe the main vulnerabilities lie at the end of this chapter.
Even without the impact of the referendum vote, we believe that the prospects for both the economy and construction have weakened over the three years to 2018 as the global slowdown has impacted growth in the UK.
2016 could be a difficult year for the industry after weak first quarter output results.
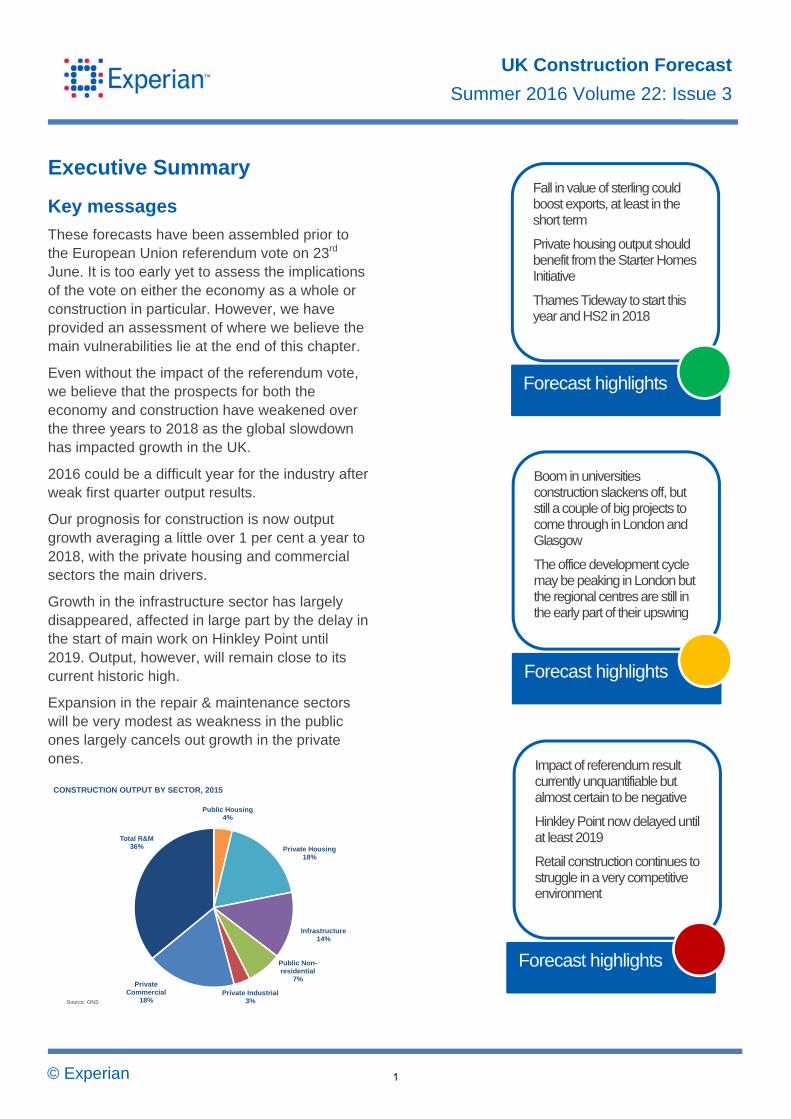
Our prognosis for construction is now output growth averaging a little over 1 per cent a year to 2018, with the private housing and commercial sectors the main drivers.
Growth in the infrastructure sector has largely disappeared, affected in large part by the delay in the start of main work on Hinkley Point until 2019. Output, however, will remain close to its current historic high.
Expansion in the repair & maintenance sectors will be very modest as weakness in the public ones largely cancels out growth in the private ones.
Fall in value of sterling could boost exports, at least in the short term
Private housing output should benefit from the Starter Homes Initiative
Thames Tideway to start this year and HS2 in 2018
Forecast highlights
Boom in universities construction slackens off, but still a couple of big projects to come through in London and Glasgow
The office development cycle may be peaking in London but the regional centres are still in the early part of their upswing
Forecast highlights
Impact of referendum result currently unquantifiable but almost certain to be negative
Hinkley Point now delayed until at least 2019
Retail construction continues to struggle in a very competitive environment
Forecast highlights
Public Housing4%
Private Housing18%
Infrastructure14%
Public Non-residential
7%
Private Industrial3%
Private Commercial
18%
Total R&M36%
CONSTRUCTION OUTPUT BY SECTOR, 2015
Source: ONS
1

© Experian
UK Construction Forecast
Summer 2016 Volume 22: Issue 3
The outturn for 2015
After some slight revision, the UK economy grew by 2.3 per cent last year, some way down on its 2014
outturn of 2.9 per cent but still the second best result since 2007.
Household expenditure rose by 2.7 per cent in real
terms and total investment was up by over 4 per cent. Household expenditure growth was driven by a better performance from average earnings coupled with
historically very low inflation and interest rates which meant that consumers saw some real increase in disposable incomes during the course of the year.
Construction output grew by 3.4 per cent in real terms in 2015 according to the Office for National Statistics. However, as mentioned in previous reports we believe
that due to a statistical discontinuity growth last year was overstated and was nearer to 2 per cent.
This statistical discontinuity was centred on the
infrastructure sector and means that the growth of nearly 30 per cent shown in the official data was probably half that. However, this still made the sector
the star performer last year, with strong rises in the electricity and roads sub-sectors.
Public housing output was hit by the almost inevitable
hiatus in investment between the end of one Affordable Housing Programme and the start of another, while growth in private housing had to come
down from the very high level seen in 2014. Total housing starts in Great Britain reached 167,600 last year, a relatively modest 5 per cent increase on 2014
but their highest level since 2007.
Activity in the public non-residential sector continues to be constrained by tight controls on public
expenditure and output subsided for the fifth consecutive year on the back of declines in university, leisure and miscellaneous work.
The industrial construction sector experienced good growth of around 10 per cent in real terms in 2015 buoyed by a second year of strong performance in the
warehouse sub-sector as the return of speculative logistics and distribution building gathered pace.
In contrast 2015 was a disappointing year for the
commercial construction sector after the optimism generated by the decent increase in activity seen in
the previous year. It remains the case that while two of the big three sub-sectors – offices and leisure – have shown some decent growth since their post
2008/09 nadirs, the retail construction sub-sector has struggled against a backdrop of poor performance by the major food retailers, high high street vacancy rates
and continuing growth in online shopping.
The surprise in the repair and maintenance (R&M) sectors was the poor performance of the private
housing element, where output was static despite a good year for average earnings growth and disposable incomes, which tend to drive activity in the
sector.
The outlook to 2018
Towards the end of 2015 and into the first part of this
year there have been signs of a slowdown in the global economy and some leading indicators have been weak.
The Markit/CIPS Purchasing Managers Indices have generally been heading in a downward direction in recent months and in April the manufacturing one fell
below the no change mark of 50, although it did pick up to marginally above it in May.
Growth in retail sales volumes has been relatively
weak, expansion in employment has slowed markedly, and average earnings growth has stuttered. The economic waters were undoubtedly being
muddied by business uncertainty relating to the EU referendum, and the uncertainty is set to continue through at least two years of negotiations as a result
of the vote on 23rd June.
Not surprisingly GDP growth in the first quarter of this year was down on the previous one at 0.4 per cent
and there is reason to believe that it could slip still further in the second quarter.
GDP growth this year and next is expected to be
below 2 per cent annually and will continue to be heavily dependent on domestic demand, which could prove to be fragile in the light of recent events.
Even without factoring in the referendum result our prognosis for growth in the construction industry has weakened significantly over the next three years, to
just over 1 per cent a year on average in the summer,
2
© Experian
UK Construction Forecast
Summer 2016 Volume 22: Issue 3
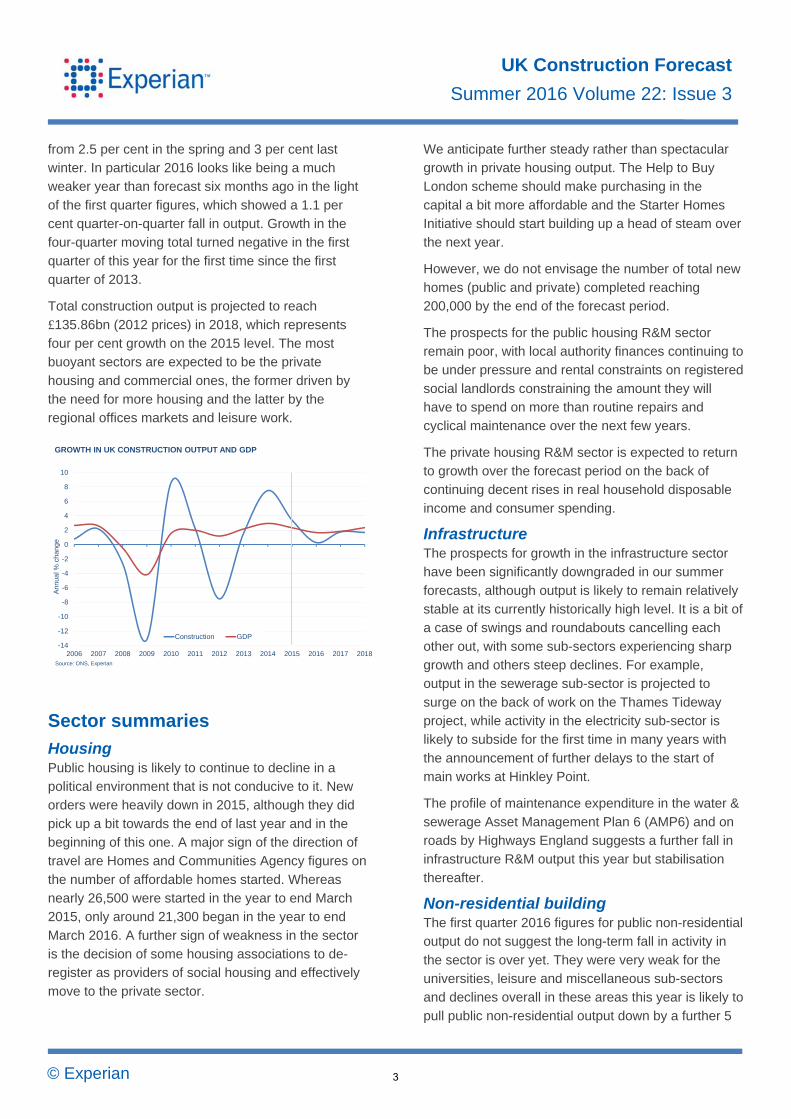
from 2.5 per cent in the spring and 3 per cent last winter. In particular 2016 looks like being a much weaker year than forecast six months ago in the light
of the first quarter figures, which showed a 1.1 per cent quarter-on-quarter fall in output. Growth in the four-quarter moving total turned negative in the first
quarter of this year for the first time since the first quarter of 2013.
Total construction output is projected to reach
£135.86bn (2012 prices) in 2018, which represents four per cent growth on the 2015 level. The most buoyant sectors are expected to be the private
housing and commercial ones, the former driven by the need for more housing and the latter by the regional offices markets and leisure work.
Sector summaries
Housing Public housing is likely to continue to decline in a political environment that is not conducive to it. New orders were heavily down in 2015, although they did
pick up a bit towards the end of last year and in the beginning of this one. A major sign of the direction of travel are Homes and Communities Agency figures on
the number of affordable homes started. Whereas nearly 26,500 were started in the year to end March 2015, only around 21,300 began in the year to end
March 2016. A further sign of weakness in the sector is the decision of some housing associations to de-register as providers of social housing and effectively
move to the private sector.
We anticipate further steady rather than spectacular growth in private housing output. The Help to Buy London scheme should make purchasing in the
capital a bit more affordable and the Starter Homes Initiative should start building up a head of steam over the next year.
However, we do not envisage the number of total new homes (public and private) completed reaching 200,000 by the end of the forecast period.
The prospects for the public housing R&M sector remain poor, with local authority finances continuing to be under pressure and rental constraints on registered
social landlords constraining the amount they will have to spend on more than routine repairs and cyclical maintenance over the next few years.
The private housing R&M sector is expected to return to growth over the forecast period on the back of continuing decent rises in real household disposable
income and consumer spending.
Infrastructure The prospects for growth in the infrastructure sector have been significantly downgraded in our summer
forecasts, although output is likely to remain relatively stable at its currently historically high level. It is a bit of a case of swings and roundabouts cancelling each
other out, with some sub-sectors experiencing sharp growth and others steep declines. For example, output in the sewerage sub-sector is projected to
surge on the back of work on the Thames Tideway project, while activity in the electricity sub-sector is likely to subside for the first time in many years with
the announcement of further delays to the start of main works at Hinkley Point.
The profile of maintenance expenditure in the water &
sewerage Asset Management Plan 6 (AMP6) and on roads by Highways England suggests a further fall in infrastructure R&M output this year but stabilisation
thereafter.
Non-residential building The first quarter 2016 figures for public non-residential output do not suggest the long-term fall in activity in
the sector is over yet. They were very weak for the universities, leisure and miscellaneous sub-sectors and declines overall in these areas this year is likely to
pull public non-residential output down by a further 5
-14
-12
-10
-8
-6
-4
-2
0
2
4
6
8
10
2006 2007 2008 2009 2010 2011 2012 2013 2014 2015 2016 2017 2018
Ann
ual %
cha
nge
GROWTH IN UK CONSTRUCTION OUTPUT AND GDP
Construction GDP
Source: ONS, Experian
3

© Experian
UK Construction Forecast
Summer 2016 Volume 22: Issue 3
per cent. Modest growth is projected for the following two years, driven largely by education and health, the former seeing some expansion on the back of the
commitment to create 600,000 new school places over the next five years, and a couple of large long-term university expansion programmes.
After two years of strong growth, output in the warehouse sector is likely to fall sharply this year and with factory construction remaining flat, total industrial
construction activity is expected to fall. Modest growth is projected for the next two years, largely driven by domestic demand.
The office sub-sector will remain the most buoyant one in commercial construction over the forecast period, continuing the trend of the recent past.
However, the focus of growth in the sub-sector may shift a little from London to the main regional centres. The leisure sub-sector is also expected to experience
good growth, assuming that the £2bn Paramount Park scheme goes ahead. At the other end of the scale, retail construction is likely to subside still further in the
short term, before activity stabilises as the prospects for the big food retailers in particular improve a little.
Some marginal increases in public non-residential
R&M could be seen over the forecast period on the back of rises in allocations under the schools basic needs and school conditions budget.
Private non-residential R&M is expected to do a little better than the public sector, on the back of further progress on the energy efficiency/renewables
agendas of some of the major property holders and on needs of retailers to attract footfall in a very competitive environment.
The EU referendum and forecast timings
Our forecasting committees met in May and early
June when our central assumption was the maintenance of the status quo, that is, no change in our relationship with the European Union.
However this has proved not to be the case and on 23rd June the United Kingdom electorate voted narrowly to set in motion the UK’s exit from the EU.
Our economics team will be assessing the implications of this decision over the next few weeks as the dust settles on the early turmoil it has caused
and the respective negotiating positions of the UK government and those leading the EU side become clearer.
We will therefore hopefully be in a position to assess at least some of the implications for construction in our Autumn Update and Winter Forecast. In the
meantime, we have highlighted in the following table where we see the major vulnerabilities to the construction sector lying.
-15
-10
-5
0
5
10
15
PublicHousing
PrivateHousing
Infrastructure Public Non-residential
PrivateIndustrial
PrivateCommercial
Total R&M AllConstruction
GROWTH IN CONSTRUCTION OUTPUT BY SECTOR, 2016 TO 2018
% change
Source: Experian
4
© Experian
UK Construction Forecast
Summer 2016 Volume 22: Issue 3
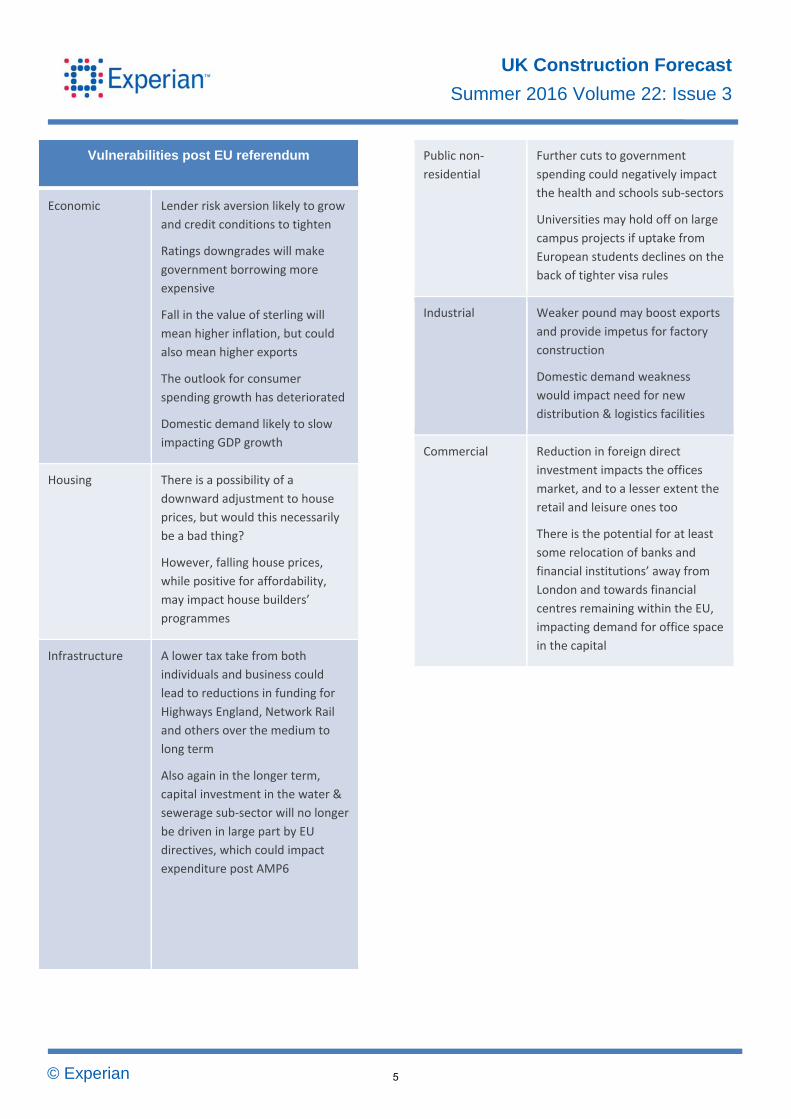
Vulnerabilities post EU referendum
Economic Lender risk aversion likely to grow
and credit conditions to tighten
Ratings downgrades will make
government borrowing more
expensive
Fall in the value of sterling will
mean higher inflation, but could
also mean higher exports
The outlook for consumer
spending growth has deteriorated
Domestic demand likely to slow
impacting GDP growth
Housing There is a possibility of a
downward adjustment to house
prices, but would this necessarily
be a bad thing?
However, falling house prices,
while positive for affordability,
may impact house builders’
programmes
Infrastructure A lower tax take from both
individuals and business could
lead to reductions in funding for
Highways England, Network Rail
and others over the medium to
long term
Also again in the longer term,
capital investment in the water &
sewerage sub‐sector will no longer
be driven in large part by EU
directives, which could impact
expenditure post AMP6
Public non‐
residential
Further cuts to government
spending could negatively impact
the health and schools sub‐sectors
Universities may hold off on large
campus projects if uptake from
European students declines on the
back of tighter visa rules
Industrial Weaker pound may boost exports
and provide impetus for factory
construction
Domestic demand weakness
would impact need for new
distribution & logistics facilities
Commercial Reduction in foreign direct
investment impacts the offices
market, and to a lesser extent the
retail and leisure ones too
There is the potential for at least
some relocation of banks and
financial institutions’ away from
London and towards financial
centres remaining within the EU,
impacting demand for office space
in the capital
5
© Experian
UK Construction Forecast
Summer 2016 Volume 22: Issue 3
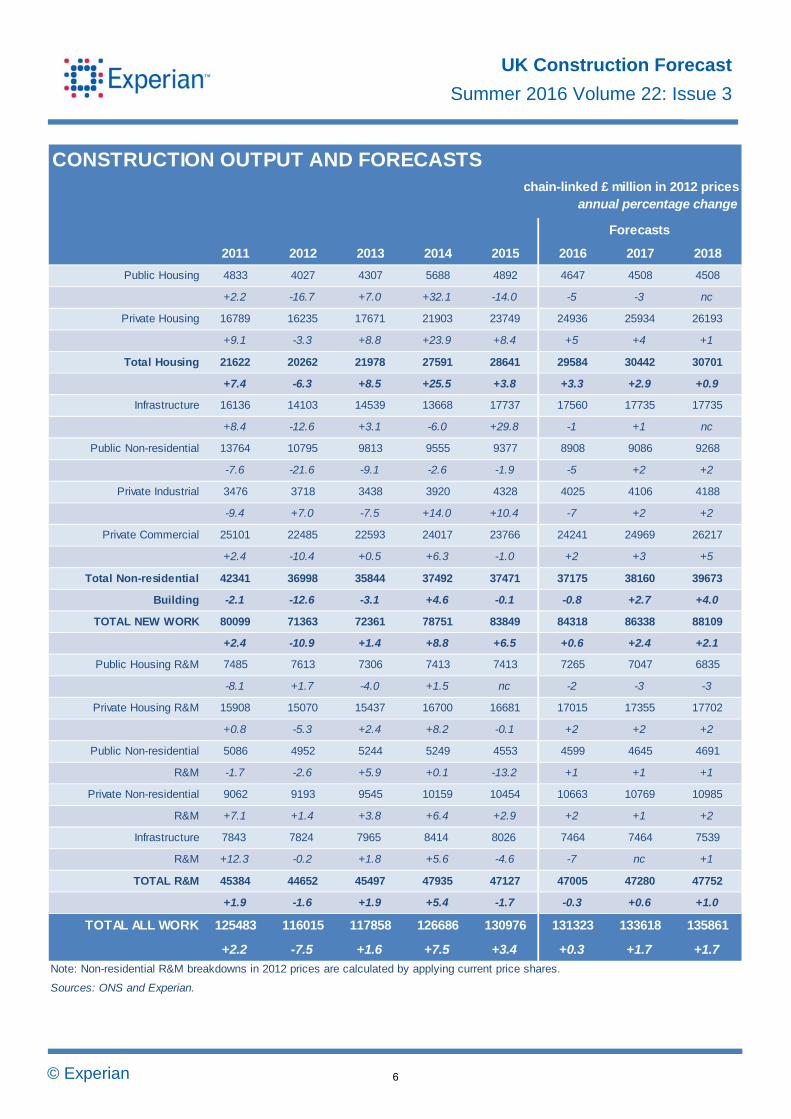
CONSTRUCTION OUTPUT AND FORECASTSchain-linked £ million in 2012 prices
annual percentage change
2011 2012 2013 2014 2015 2016 2017 2018
Public Housing 4833 4027 4307 5688 4892 4647 4508 4508
+2.2 -16.7 +7.0 +32.1 -14.0 -5 -3 nc
Private Housing 16789 16235 17671 21903 23749 24936 25934 26193
+9.1 -3.3 +8.8 +23.9 +8.4 +5 +4 +1
Total Housing 21622 20262 21978 27591 28641 29584 30442 30701
+7.4 -6.3 +8.5 +25.5 +3.8 +3.3 +2.9 +0.9
Infrastructure 16136 14103 14539 13668 17737 17560 17735 17735
+8.4 -12.6 +3.1 -6.0 +29.8 -1 +1 nc
Public Non-residential 13764 10795 9813 9555 9377 8908 9086 9268
-7.6 -21.6 -9.1 -2.6 -1.9 -5 +2 +2
Private Industrial 3476 3718 3438 3920 4328 4025 4106 4188
-9.4 +7.0 -7.5 +14.0 +10.4 -7 +2 +2
Private Commercial 25101 22485 22593 24017 23766 24241 24969 26217
+2.4 -10.4 +0.5 +6.3 -1.0 +2 +3 +5
Total Non-residential 42341 36998 35844 37492 37471 37175 38160 39673
Building -2.1 -12.6 -3.1 +4.6 -0.1 -0.8 +2.7 +4.0
TOTAL NEW WORK 80099 71363 72361 78751 83849 84318 86338 88109
+2.4 -10.9 +1.4 +8.8 +6.5 +0.6 +2.4 +2.1
Public Housing R&M 7485 7613 7306 7413 7413 7265 7047 6835
-8.1 +1.7 -4.0 +1.5 nc -2 -3 -3
Private Housing R&M 15908 15070 15437 16700 16681 17015 17355 17702
+0.8 -5.3 +2.4 +8.2 -0.1 +2 +2 +2
Public Non-residential 5086 4952 5244 5249 4553 4599 4645 4691
R&M -1.7 -2.6 +5.9 +0.1 -13.2 +1 +1 +1
Private Non-residential 9062 9193 9545 10159 10454 10663 10769 10985
R&M +7.1 +1.4 +3.8 +6.4 +2.9 +2 +1 +2
Infrastructure 7843 7824 7965 8414 8026 7464 7464 7539
R&M +12.3 -0.2 +1.8 +5.6 -4.6 -7 nc +1
TOTAL R&M 45384 44652 45497 47935 47127 47005 47280 47752
+1.9 -1.6 +1.9 +5.4 -1.7 -0.3 +0.6 +1.0
TOTAL ALL WORK 125483 116015 117858 126686 130976 131323 133618 135861
+2.2 -7.5 +1.6 +7.5 +3.4 +0.3 +1.7 +1.7
Note: Non-residential R&M breakdowns in 2012 prices are calculated by applying current price shares.
Sources: ONS and Experian.
Forecasts
6

© Experian
UK Construction Forecast
Summer 2016 Volume 22: Issue 3
1 The Macroeconomic Outlook
Global background
Output and trade The softness of the global economy continues to create widespread concern. Trade - formerly a key driver of global growth – remains extremely sluggish
depressing output growth in most economies. In some cases –e.g. the US, China and India – domestic demand is underpinning expansion, but growth rates
are generally disappointing. Where domestic demand is weak, in Japan and the Eurozone for example, GDP growth is lacklustre and provides little opportunity for
trading partners to boost exports.
Among the slow-growing economies, Japan remains firmly in the doldrums with GDP growth forecast at just
0.5 per cent this year and next, with little hope of a significant improvement thereafter. Conditions are stronger in the Eurozone where consumer spending is
expected to reach 1.7 per cent in 2016 and remain near that rate in 2017 and 2018, underpinning GDP growth at near 1.6 per cent in 2016 and 2017,
perhaps rising to 2 per cent by 2018. Growth at this pace seems insufficient on the evidence of recent trade data to prevent net trade remaining a severe
drag on UK growth prospects but the position should gradually improve once Eurozone growth matches or surpasses the UK rate.
In the US, the underlying performance remains solid, supported by buoyant consumer spending which in April was the strongest for six years. GDP growth is
forecast at 2 per cent this year and is likely to be between 2.3 and 2.5 per cent in 2017 and 2018.
Key Global Risks
Geopolitical Political tensions and unresolved
crises (notably in the Middle East)
have produced the largest number
of refugees globally for 60 years.
This is de‐stabilising and increases
the risk of loss of confidence,
political over‐reaction and the
emergence of unstable regimes.
Terrorist attacks Additional threats to morale stem
from terrorism which can de‐
stabilise government and hamper
economic progress.
2007/08 Legacy Several advanced economies and
some emerging markets are still
dealing with the legacy of the
2007/08 financial crisis. High
private and/or public debt will
continue to pose a threat to
economic growth prospects and
financial stability.
Brexit While primarily affecting the UK,
the outcome of the referendum
has profound implications for the
whole of the EU. The ‘leave ‘vote
could result in EU‐wide instability.
2014 2015 2016 2017 2018
GDP 2.9 2.3 1.7 1.8 2.3
Household consumption 2.5 2.7 2.4 2.3 2.2
Government consumption 2.5 1.5 0.7 -1.1 -0.3
Gross fixed investment 7.3 4.1 0.8 2.8 3.6
Bank Rate (average for year) 0.5 0.5 0.5 0.6 1.1
CPI (annual) 1.4 0.1 0.7 1.4 2.0Source: ONS, Experian.
KEY UK MACROECONOMIC INDICATORS
annual percentage change (unless otherwise stated)
ForecastsActual
7

© Experian
UK Construction Forecast
Summer 2016 Volume 22: Issue 3
Growth in much of Asia is faltering in the face of a weak trade backdrop but remains buoyant by Western standards. China is shifting to a consumption-based
growth model and despite widespread worries about a sharp slowdown, the country’s GDP growth is still expected to reach 6.5 per cent in 2016 and remain
comfortably above 6 per cent in the following two years. Even stronger rates of growth, over 7.5 per cent per annum, are generally forecast for India in
2016-18. Other developing countries in the region (Indonesia, Malaysia, Philippines) are also expected to remain on a robust growth path.
The global economy is expected to see growth accelerate from a modest 3.2 per cent in 2016 to 3.8 per cent in 2017 and 4 per cent in 2018. This will help
world trade volumes pick up from the depressed level of recent years providing better opportunities for UK export sales. But much will depend on the strength
and sustainability of a Eurozone recovery; on the outcome of the Brexit vote; and on trade negotiations in the event of the UK leaving the EU.
The UK economy
Upswing continues but at a slower pace The UK economy is still expanding but at a slower pace than in recent years as EU referendum
uncertainties hit business investment, net trade has become a major drag on growth and consumer spending, while still buoyant, is easing. Consumer
fundamentals are less positive than in recent years and Brexit uncertainties have undermined confidence.
GDP growth slowed to 0.4 per cent quarter-on-quarter
in the first quarter of 2016, from 0.6 per cent in the previous three months. Two of the four main industrial groupings showed growth - services output rose by
0.6 per cent marking the 13th consecutive quarter of steady growth continuing to underpin overall expansion. Within the sector, distribution, hotels &
catering output increased by a robust 1.1 per cent, with wholesale and retail trade making a prominent contribution. The service sector’s performance
outweighed estimated declines in construction (-1.1 per cent) and production (down 0.4 per cent). Within production, manufacturing showed a decline of 0.4 per
cent taking the cumulative decline in the year to the first quarter of 2016 to 1.3 per cent, highlighting the
challenging global trade backdrop for exporters over the past year. However, output data for April was unexpectedly buoyant, rising by 2.3 per cent, the
fastest since 2012. It remains to be seen whether this is a blip or the beginning of better times for the sector.
Among the expenditure components of GDP
consumer spending was the main growth driver in the first quarter of the year, expanding by 0.7 per cent quarter-on-quarter, similar to the quarterly rate seen
over the past two years. Other domestic demand components also posted increases. Government spending continued to increase, rising by 0.4 per cent
in the quarter, while fixed investment grew by 0.5 per cent, despite a 0.5 per cent decline in business investment. The increase in total fixed investment
follows contraction of 1.1 per cent in the previous quarter.
Net trade remained the main drag on growth. The
trade deficit widened from £16.4bn in the final quarter of 2015 to a record £18bn, despite a more competitive pound. Sluggish global demand seriously hampered
exports while imports rose in line with strong consumer demand and rising investment. As with manufacturing output, data for April showed a
welcome upturn, with exports rising at their strongest pace since 2003.
Despite the improved manufacturing and trade
figures, early indications for the second quarter of 2016 are generally weak, pointing to even slower expansion than in the first quarter. The Markit/CIPS
Purchasing Managers’ index for the service sector, which accounts for some 75 per cent of growth, picked up slightly in May but remains subdued while
the manufacturing and construction PMIs are only just in expansionary territory. Taken together, these indicators point to sluggish growth in the second
quarter of 2016.
Two year outlook Growth prospects in the next two years remain heavily dependent on the continued buoyancy of domestic
spending given that the weak global backdrop implies challenging times for exporters. Within domestic demand, the onus is firmly on consumer spending as
the constraints on government spending persist and
8

© Experian
UK Construction Forecast
Summer 2016 Volume 22: Issue 3
business investment is subject to EU referendum uncertainties.
We expect resilience in consumer spending to persist
in the next few quarters but forecast more moderate gains than in the past two years as conditions become less favourable. Output growth is slowing,
employment creation is moderating, unemployment has virtually stabilised and earnings growth is still stuck at a weak 2 per cent year-on-year. Meanwhile
inflation is likely to pick up gradually in the remaining months of this year and into 2017.
All these developments have been factored into our
forecasts of consumer spending growth for some time so our latest forecast of expansion in household spending is substantially unchanged at 2.4 per cent
for this year. With official interest rates unlikely to begin rising until the first quarter of 2017, most households will not feel a significant impact until late
2017. This means that despite rising inflation and ongoing fiscal austerity household spending can continue to advance at a solid pace, 2.3 per cent, in
2017.
Difficult conditions for exporters mean that trade weakness is likely to continue. At the same time,
government spending will still be constrained by fiscal tightness. But the expected resilience of consumers will underpin GDP growth near 2 per cent a year in
2016-18.
There are tentative signs that conditions in the Eurozone are improving. Any sustained improvement
should mean that net trade will become less of a drag on GDP expansion in the UK, and might even make a positive contribution earlier than expected in the base
case. This gives an upside risk to our central forecast of GDP growth for the next few years.
Consumer spending and investment Real incomes rose by 3.3 per cent in 2015, the
strongest outcome since 2001. This underpinned a boom period for consumers with spending growing by a total of 5.2 per cent in 2014 and 2015.
While this boom is over, household spending is still growing at a solid pace benefiting from modest employment creation, low inflation and wage growth
around 2 per cent a year. Real incomes growth is expected to reach 2.6 per cent this year and 2.4 per
cent in 2017 and 2018. Despite weaker consumer confidence than in recent years, we still expect consumer spending growth to reach 2.4 per cent this
year followed by similar rates of growth in 2017 and 2018.
Fixed investment picked up markedly in 2013-15 but
has faltered this year depressed by Brexit fears and weak house building. Investment in the remainder of 2016 and in 2017-18 will be supported by the
resilience of consumer spending and the low cost of finance, but is subject to huge uncertainty ahead of the EU referendum outcome. In our central case we
expect investment growth to average 2.9 per cent in the three years 2016-18.
Public finances Efforts to reduce the public sector deficit are
progressing but at a slower pace than planned. Net borrowing has been significantly reduced, from 9 per cent of GDP in 2010 to 4.4 per cent in 2015, but
remains substantial at £76bn in 2015/16 against the target of £72bn. A deficit of this magnitude means that borrowing as a percentage of GDP is still rising
steadily and last year reached almost 90 per cent of GDP compared with 74 per cent in 2010.
The financial year 2016/17 got off to a poor start for the chancellor as he plans to reduce borrowing to £56.5bn this financial year and run a budget surplus
by the end of the decade. Government borrowing in April was £8.2bn, well above expectations despite a rise in income tax, stamp duty, national insurance and
VAT receipts. The government borrowed £9.7bn in May, slightly above expectations. The disappointing outcome for the first two months of the financial year
-20.0
-15.0
-10.0
-5.0
0.0
5.0
10.0
15.0
2008 2009 2010 2011 2012 2013 2014 2015 2016 2017 2018
An
nu
al %
ch
ang
e
CONSTRUCTION OUTPUT VS CONSUMER SPENDING AND INVESTMENT
Construction output
Consumer spending
Investment
Source : ONS, Experian
9
© Experian
UK Construction Forecast
Summer 2016 Volume 22: Issue 3
suggests that the chancellor will struggle to reduce borrowing this year to the extent set out in the budget.
Labour market moderating The labour market continues to make progress
despite a marked easing of output growth in recent months. The key points comparing the three months to March 2016 with the previous three months are:
• Employment rose by 44,000. The number of employees was up 27,000, accompanied by a rise of 20,000 in self-employment;
• The number of full-time employees was up 47,000, while the number working part time fell by 3,000;
• Unemployment decreased by 2,000 to 1.69 million;
• The unemployment rate remained at 5.1 per cent.
• Average weekly earnings including bonuses rose by 2per cent compared with a year earlier. Pay
excluding bonuses was 2.1 per cent higher.
On balance the latest figures are mildly encouraging given prevailing Brexit uncertainties and weak output
growth. While they indicate a cooling off from the period of vigorous employment growth and steadily falling unemployment seen in 2014 and 2015 when
the economy was growing strongly, this phase could not be expected to continue indefinitely.
The persistence of sluggish earnings growth, up only
2 per cent, does not yet constitute a major threat to consumer spending on which the UK economy is heavily reliant. The still benign rate of inflation
provides scope for strong gains in real disposable income providing a solid foundation for consumer spending growth.
Inflation to pick up but remain very low this year The Consumer Prices Index (CPI) rose by 0.3 per cent in the year to April, down from 0.5 per cent in the year to March.
The main downward contribution came from transport where prices fell by 0.1 per cent between March and April this year compared with a rise of 1.1 per cent
between the same two months a year earlier. By far the largest effect came from air transport. The timing of Easter this year caused a large increase in fares
between February and March and a subsequent fall in
April. These downward effects were partially offset by an upward contribution from motor fuels.
The latest data suggest that inflationary pressures in
the UK remain subdued. Goods deflation remained entrenched at 1.6 per cent while services inflation eased to 2.4 cent from 2.8 per cent in March. Core
inflation, which strips out food and fuel, also eased three percentage points to 1.2 per cent.
In the coming months we expect CPI inflation to
increase very gradually, though the risks are balanced on the upside. The price for Brent Crude oil is now approaching US$50/bbl compared to the low of below
US$30/bbl in January and will continue to contribute to inflationary pressures. The depreciation of sterling in the last few months of 2015 will also support CPI
growth through an increase in the cost of imports.
Interest rates – no move expected until the first quarter of 2017 Weaker economic growth, low inflation and modest rises in wage costs point to no early rise in official
rates. The latest published vote of the Monetary Policy Committee at their May meeting was unanimous to maintain Bank Rate at 0.5 per cent. We expect the
first rise, a 25 basis point increase taking Bank Rate to 0.75 per cent, to take place in the first quarter of 2017.
When Bank Rate does begin to rise, we expect it to do so far more gradually than in previous cycles given the persistence of headwinds together with the legacy
of the financial crisis. Our specific forecast is for 25 basis point increases every other quarter, taking the rate to 1.7 per cent by the first quarter of 2019.
Sterling still vulnerable Sterling has fallen sharply against the euro and the looming Brexit threat suggests no early recovery. The pound is vulnerable to a ‘leave’ vote on 23 June. In
our base case, sterling is likely to settle in the range Euro1.24-1.28/£ in the next few months. Against the dollar we expect the pound to trade in a range
between $1.42-1.47/£ in the near term.
Growth moderating and risks persist The economy has enjoyed a strong recovery, robust job creation and falling inflation in recent years. We expect progress to be sustained but at a more
10

© Experian
UK Construction Forecast
Summer 2016 Volume 22: Issue 3
moderate pace. Downside risks to this slower growth scenario are:
The most significant risk is dependence for overall
growth on consumer demand. If consumer spending falters, for example through weak earnings growth or significant loss of confidence in economic prospects,
our central forecast of growth at near 2 per cent a year in 2016-18 would be threatened. But there is a modest upside risk that UK growth will be better than
in the central case if the recent modest Eurozone recovery is sustained and provides an unexpectedly strong boost to exports.
Uncertainty regarding the UK’s future in the EU could continue to depress investment and lead to further sterling depreciation. This is a major risk to our
forecast of GDP growth at 1.7% this year.
Output gains are still driven by rising employment with little improvement in productivity, making it difficult for
significant earnings growth to occur. If pay growth subsides or even fails to accelerate, then our forecast of household consumption growth will need to be
downgraded.
The weakness in the global trade and financial backdrop is a key risk. A further marked decline in world trade would result in even weaker export
growth. Sterling’s decline against the euro will do little to offset the impact of weak demand.
Fiscal policy will remain tight. At the same time
monetary policy, which has been extremely accommodative during the great recession and its aftermath, is set to tighten gradually from 2017. There
is a risk that the economy may not be strong enough to cope with this dual policy constraint. A particular threat to heavily-indebted households comes from the
prospect of a rise in interest rates before real incomes are increasing at a healthy pace.
While risks are still skewed to the downside, there are
two upside risks. The removal of Brexit uncertainties could result in a rebound in fixed investment in the second half of the year. And if the unexpectedly
strong April export numbers prove to be the turning point for net trade and manufacturing, there would be a boost to growth prospects.,
11

© Experian
UK Construction Forecast
Summer 2016 Volume 22: Issue 3
% change year-on-year in real terms unless otherwise stated
2014 2015 2016 2017 2018
OUTPUT AND UNEMPLOYMENT
GDP 2.9 2.3 1.7 1.8 2.3
Manufacturing output 2.1 -0.4 -1.1 0.5 1.6
Unemployment rate (ILO - %) 6.2 5.4 5.0 4.9 4.9
HOUSEHOLDS (incl. NPISH)
Consumption 2.5 2.7 2.4 2.3 2.2
Real household disposable income 0.7 3.3 2.6 2.4 2.4
Savings ratio (%) 5.4 4.2 4.1 4.3 4.6 Total household income (current prices) 2.6 2.6 3.7 3.9 4.3
GROSS CAPITAL FORMATION
Gross fixed investment 7.3 4.1 0.8 2.8 3.6
General government 5.8 1.5 -0.1 0.5 0.0
Business investment 4.7 5.2 -0.6 2.9 3.1
Private sector dwellings 14.0 3.5 4.1 4.2 6.5
Public sector dwellings 5.5 18.2 -4.6 0.5 0.0
OTHER EXPENDITURE
Government consumption 2.5 1.5 0.7 -1.1 -0.3
Exports (G & S) 1.2 5.1 1.6 4.2 4.5
Imports (G & S) 2.4 6.3 3.8 3.5 3.1
WORLD VARIABLES
Volume of world trade 3.6 3.9 4.8 4.9 5.3
World GDP 3.4 3.2 3.8 4.0 4.2
Eurozone GDP 0.9 1.5 1.7 1.8 2.0
*Brent crude oil price ($ per barrel) 97.8 53.6 38.3 48.5 59.4
INTEREST AND EXCHANGE RATES (year averages)
Sterling - US Dollar exchange rate 0.61 0.65 0.69 0.65 0.65
Sterling - Euro exchange rate 0.81 0.73 0.80 0.76 0.77
Bank Rate (%) 0.5 0.5 0.5 0.6 1.1
- quarter 4 average 0.5 0.5 0.5 0.8 1.3
Govt 10yr bond yield (%) 2.5 1.8 1.7 2.0 2.6
COSTS AND PRICES
Retail Price Index (Q4) 1.9 1.0 2.6 3.2 3.3
CPI (annual) 1.4 0.1 0.7 1.4 2.0
House prices (year-on-year - DCLG measure) 10.0 6.7 6.7 3.6 3.1
Source: ONS, Experian.
MACROECONOMIC FORECASTS
Forecasts
12

© Experian
UK Construction Forecast
Summer 2016 Volume 22: Issue 3
2 New Housing
Summary A number of private housing market indicators – output, gross mortgage lending and property transactions all point towards a flurry of activity in the run up to April. This is most likely due to the changes that came into force in April which saw purchasers of second homes and buy-to-let landlords paying a 3 per cent surcharge on each Stamp Duty band.
Currently there is a lull after the pre-Stamp Duty rush. Monthly property transactions figures have gone from 153,300 in March to just 89,700 in May.
Overall, moderate growth has been predicted for private housing output over the next three years. By 2018, the sector should be at an all-time high. Help to Buy London, the latest government initiative that was implemented in February should provide an upside risk to the forecasts. There is a significant downside risk that the negotiations of the UK’s exit from the EU will lead to a prolonged period of uncertainty, reducing consumer confidence and overall spending in the economy.
The outlook for public housing output is still gloomy with local authority budget constraints and rent reductions taking their toll on the sector. Last year one of the biggest registered social landlords, Genesis Housing Association announced that it would stop building social housing due to the difficult operating environment and instead provide homes for the private sector. It remains to be seen whether these tough conditions lead to many more housing associations deciding to de-register as social housing
providers and start behaving like private house builders.
Public Housing
Output & orders After reaching a new high in 2014, last year public housing output went down by 14 per cent to £4.89bn
in 2012 prices. However, in the first quarter of 2016 it rose by 4 per cent to £1.17bn compared with three months earlier. In contrast, on a four-quarter moving
total basis, output decreased for the fourth successive quarter between January and March 2016.
Public housing orders dropped for the second year
running in 2015, by 28 per cent to £1.32bn. In the first three months of 2016, orders increased by 6 per cent to £438m compared with the previous quarter. On a
four-quarter moving total basis, orders went up for the second successive quarter in the first quarter of this year.
Starts & completions The Welsh government discontinued publication of housing starts data broken down by tenure in April 2011 due to concerns over the accuracy of the split
between public and private. Due to the relatively small number of public housing starts in Wales, in terms of analysis, we include these in the private housing
sector.
In 2015, the number of English and Scottish public housing starts declined by 5 per cent to 28,344 units
compared with the previous year. While English starts
2011 2012 2013 2014 2015 2016 2017 2018
Private Housebuilding
£ million (2012 prices) 16789 16235 17671 21903 23749 24936 25934 26193
Annual % Change 9.1 -3.3 8.8 23.9 8.4 5.0 4.0 1.0
Public Housebuilding
£ million (2012 prices) 4833 4027 4307 5688 4892 4647 4508 4508
Annual % Change 2.2 -16.7 7.0 32.1 -14.0 -5.0 -3.0 0.0
All Housing
£ million (2012 prices) 21622 20262 21978 27591 28641 29584 30442 30701
Annual % Change 7.4 -6.3 8.5 25.5 3.8 3.3 2.9 0.9
Source: ONS and Experian.
ForecastHousing Construction Output
13

© Experian
UK Construction Forecast
Summer 2016 Volume 22: Issue 3
decreased by 3 per cent to 24,520 units, the Scottish ones dropped by 14 per cent, to 3,824 units.
English public housing starts have been released for the first quarter of this year. At 5,590, they were down by 7 per cent compared with three months earlier and
declined by 19 per cent compared with the corresponding period in the preceding year.
Last year, GB public housing completions grew by 23
per cent, to 36,203 units, compared with the corresponding period in the preceding year. Wales saw the greatest rise of 55 per cent to 1,187 units
whilst completions in England (31,220 units) and Scotland (3,796 units) rose by 24 per cent and 13 per cent respectively.
During the first quarter of this year English completions fell by 20 per cent to 5,630 compared with three months earlier, and Welsh ones declined by
40 per cent to 192 units.
Drivers For the 2016-2021 Shared Ownership and Affordable Homes Programme (SOAHP) the announcement of
initial allocations will be made in early/mid-December. However, as mentioned previously, around 90 per cent of the capital funding will be spread over the final
three years of the programme. The vast majority of homes being built under the SOAHP will be for shared ownership. As these homes will eventually be owned
by individuals they should be classed under the private housing sector.
Genesis Housing Association announced last year
that due to the tough conditions the sector is going through, it was no longer going to build social housing and instead only build properties for rent at full market
rates, for shared ownership, or for sale. Since the beginning of 2016, there have been three voluntary de-registrations of registered social landlords. It may
be the case that as poor conditions in the sector continue, the number of voluntary de-registrations increases in the months ahead.
Whilst social rents in England are to decline by 1 per cent per annum, the opposite is true for Wales. Between 2014 and 2019 the Welsh Government
stated that there would be a rise in social rents for registered social landlords, linked to September’s Consumer Price Index in the previous year. However,
2011 2434 -21.3 4833 2.2
2012 2257 -7.3 4027 -16.7
2013 3656 62.0 4307 7.0
2014 1820 -50.2 5688 32.1
2015 1315 -27.7 4892 -14.0
2014 Q3 389 -62.8 1495 37.9
Q4 318 -67.0 1441 17.2
2015 Q1 303 -42.9 1369 2.3
Q2 328 -43.6 1290 -8.8
Q3 272 -30.1 1107 -26.0
Q4 413 29.9 1125 -21.9
2016 Q1 438 44.6 1173 -14.3
Source: ONS.
% change y-on-y
% change y-on-y
Orders Output
£ million (2005 prices)
£ million (2012 prices)
Public Housing Orders And Output
2011 2012 2013 2014 2015 2016 2017 2018
Private Housing
Starts 103.2 96.4 115.5 129.1 139.3 148 158 160
Completions 100.5 103.7 102.3 110.3 127.6 143 153 158
Social Housing
Starts 29.9 24.4 28.7 29.7 28.3 25 24 24
Completions 34.3 32.2 27.8 29.3 36.2 33 27 28
Total
Starts 133.0 120.8 144.2 158.8 167.6 173 182 184
Completions 134.9 136.0 130.0 139.6 163.8 176 180 186
Note: starts and completions forecasts are rounded to the nearest thousand.
Welsh housing starts no longer split betw een private and public thus are allocated to the private sector as the largest element
Starter homes are classed as private homes.
Source: CLG and Experian.
Forecasts Housing Starts and Completions 000s
14
© Experian
UK Construction Forecast
Summer 2016 Volume 22: Issue 3
the Welsh Government has recently reviewed this policy and on the back of this, the Minster for Communities and Tackling Poverty has agreed to
maintain the current social housing rents policy for 2016/17. At present it is unclear whether this policy in will change from its current form in 2017/2018 and
2018/19.
As part of the North Halifax Transformation Project, Wates has won a contract to build 500 homes on
Calderdale council and Pennine Housing Association sites. A number of homes are to be provided for older or disabled individuals which meet their care and
support needs.
Leeds & Yorkshire Housing Association has appointed United Living Group to provide 23 new affordable rent
apartments on the outskirts of Leeds city centre. Demolition work began in December last year.
As part of a housing scheme in Stockton-On-Tees,
around 70 to 100 affordable units have been planned with work expected to commence this year.
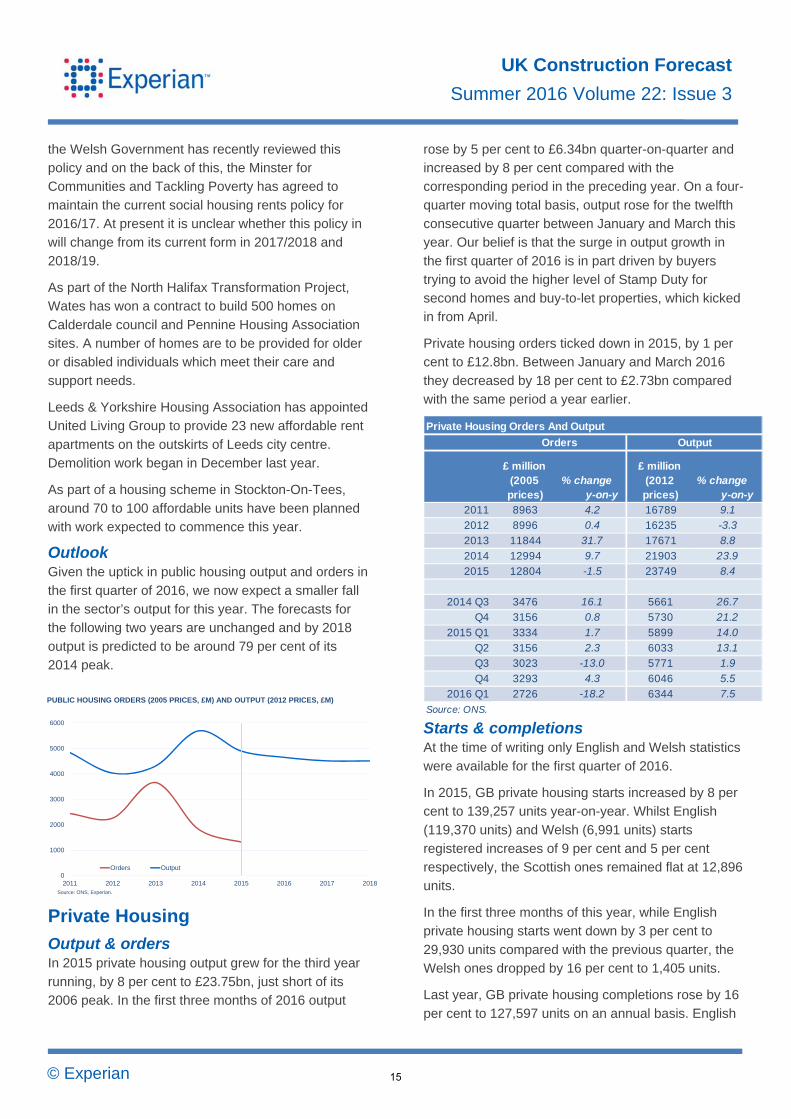
Outlook Given the uptick in public housing output and orders in
the first quarter of 2016, we now expect a smaller fall in the sector’s output for this year. The forecasts for the following two years are unchanged and by 2018
output is predicted to be around 79 per cent of its 2014 peak.
Private Housing
Output & orders In 2015 private housing output grew for the third year
running, by 8 per cent to £23.75bn, just short of its 2006 peak. In the first three months of 2016 output
rose by 5 per cent to £6.34bn quarter-on-quarter and increased by 8 per cent compared with the corresponding period in the preceding year. On a four-
quarter moving total basis, output rose for the twelfth consecutive quarter between January and March this year. Our belief is that the surge in output growth in
the first quarter of 2016 is in part driven by buyers trying to avoid the higher level of Stamp Duty for second homes and buy-to-let properties, which kicked
in from April.
Private housing orders ticked down in 2015, by 1 per cent to £12.8bn. Between January and March 2016
they decreased by 18 per cent to £2.73bn compared with the same period a year earlier.
Starts & completions At the time of writing only English and Welsh statistics
were available for the first quarter of 2016.
In 2015, GB private housing starts increased by 8 per cent to 139,257 units year-on-year. Whilst English
(119,370 units) and Welsh (6,991 units) starts registered increases of 9 per cent and 5 per cent respectively, the Scottish ones remained flat at 12,896
units.
In the first three months of this year, while English private housing starts went down by 3 per cent to
29,930 units compared with the previous quarter, the Welsh ones dropped by 16 per cent to 1,405 units.
Last year, GB private housing completions rose by 16
per cent to 127,597 units on an annual basis. English
2011 8963 4.2 16789 9.1
2012 8996 0.4 16235 -3.3
2013 11844 31.7 17671 8.8
2014 12994 9.7 21903 23.9
2015 12804 -1.5 23749 8.4
2014 Q3 3476 16.1 5661 26.7
Q4 3156 0.8 5730 21.2
2015 Q1 3334 1.7 5899 14.0
Q2 3156 2.3 6033 13.1
Q3 3023 -13.0 5771 1.9
Q4 3293 4.3 6046 5.5
2016 Q1 2726 -18.2 6344 7.5
Source: ONS.
Orders
% change y-on-y
Private Housing Orders And Output
£ million (2005 prices)
£ million (2012 prices)
Output
% change y-on-y
0
1000
2000
3000
4000
5000
6000
2011 2012 2013 2014 2015 2016 2017 2018
Orders Output
PUBLIC HOUSING ORDERS (2005 PRICES, £M) AND OUTPUT (2012 PRICES, £M)
Source: ONS, Experian.
15

© Experian
UK Construction Forecast
Summer 2016 Volume 22: Issue 3
completions registered a jump of 19 per cent to 110,050 units whereas lower growth of 4 per cent was recorded for the Welsh ones (5,630 units). In contrast,
Scottish completions edged down by 2 per cent to 11,917 units.
Between January and March 2016 while English
private completions declined by 7 per cent to 27,320 quarter-on-quarter, the Welsh ones dropped by 31 per cent to 1,135 units.
Drivers
Demand factors Like the private housing output statistics, various other
housing market indicators are also suggesting strong expansion pre-April to avoid paying higher levels of Stamp Duty.
For example, between January and March 2016 HMRC’s seasonally adjusted (SA) property transactions (368,930) were up by 15 per cent
compared with the final quarter of 2015 and increased by 30 per cent year-on-year. In March they reached 153,300, the highest on record and 42 per cent up on
February’s figure. However, since then the number of monthly property transactions has declined dramatically, averaging around 89,000 in April and
May.
The Council of Mortgage Lenders’ (CML) gross mortgage lending statistics show that lending was
strong in March as it soared by 46 per cent to £26.18bn compared with February. However, it fell by a third to £17.6bn in April, although it did pick a little to
£18.2bn in May. This further supports the assertion that there was a big surge in housing market activity pre the changes to Stamp Duty and as a result the
second quarter of this year will have been much quieter.
Both the Office for National Statistics (ONS) and
Nationwide’s SA annual house price data suggest that monthly house prices rose at an increasing rate just before the Stamp Duty changes came into effect, but
have slowed since then. Markit, who have taken over the production of the Halifax House Price Index have released house price inflation data for May.
Unfortunately, the statistics only go back to May 2015 therefore analysis of SA annual house price trends prior to May is no longer possible. However on a
monthly percentage change basis, in March prices rose by 2.2 per cent, up from a decline of 1.5 per cent in February and there has been little movement in
prices post March.
Based on the ONS mixed-adjusted index, Experian is estimating a UK house price increase of around 6.7
per cent for 2016. This rate is expected to slow in following two years.
In February the Help to Buy London (HtBL) scheme
was introduced which will allow buyers with a 5 per cent deposit to access a loan worth up to 40 per cent of the property. The loan will be interest free for five
years. There is potential for this scheme to provide an upside risk to the forecasts. However the downside is that it may push up further the already very high
prices in the capital making it even harder for those towards the bottom end of the income scale to get on to the property ladder. Under HtBL, buyers will only be
able to afford new build homes in the outer London boroughs, but this is where prices have been rising the fastest; prices in Waltham Forest grew by 25 per
cent in the year to April while in Newham they increased by 21 per cent.
The latest data from the Financial Services Authority
(FSA) shows that in the first quarter of 2016 around 68.3 per cent of gross mortgage lending was for loans with a loan-to-value (LTV) of less than 75 per cent, up
from 65.9 per cent three months earlier, whilst around 28.9 per cent of gross lending was for loans with an LTV of between 75 per cent and 90 per cent. Around
2.5 per cent of lending was for loans with an LTV of between 90 and 95 per cent, down from 3.3 per cent in the previous quarter.
0%
10%
20%
30%
40%
50%
60%
70%
80%
90%
100%
200
8 Q
1Q
2Q
3Q
42
009
Q1
Q2
Q3
Q4
201
0 Q
1Q
2Q
3Q
42
011
Q1
Q2
Q3
Q4
201
2 Q
1Q
2Q
3Q
42
013
Q1
Q2
Q3
Q4
201
4 Q
1Q
2Q
3Q
420
15Q
1Q
2Q
3Q
420
16Q
1
LOAN-TO-VALUE RATIOS AS A PERCENTAGE OF GROSS MORTGAGE LENDING
>95%
>90% <=95%
>75% <=90%
<= 75%
Source: FCA/CML.
16

© Experian
UK Construction Forecast
Summer 2016 Volume 22: Issue 3
Earlier this year, high street bank Barclays announced that house buyers do not need to put a deposit down when purchasing a home using its 100 per cent
mortgage. But there’s a catch – a helper (usually parents) is required. Helpers need to contribute 10 per cent of the house purchase price and this money will
be invested into a savings account linked to the mortgage. The money will be returned back to the helper after three years, with interest, provided the
house buyer has kept up with mortgage repayments.
Getting a helper on board does not mean house buyers automatically qualify for the 100 per cent
mortgage. Both will still need to go through the new affordability tests that have been brought in by the Mortgage Market Review.
Supply factors According to the Royal Institution of Chartered
Surveyors’ Residential Market Survey, in May the net balance for new instructions remained in negative territory for the third successive month. The -30
reading was the worst one since the series began in April 1999. It is feasible that this negative score was primarily the result of EU referendum uncertainties.
The supply of properties available for sale also fell across all regions and devolved nations apart from Wales, which saw a rise in instructions.
In contrast the results of the Home Builders Federation’s (HBF) survey were somewhat more upbeat. A positive balance of nearly 22 per cent of
respondents reported net reservations up in March on a year ago, although the balance on site visitors was marginally negative. However, the use of sales
incentives has started to rise a little, although the vast majority of respondents reported no change. Some 70 per cent of respondents to the March survey expect
their level of sales in 2016 to be higher than the previous year.
The HBF survey also reveals that the percentage of
respondents reporting planning delays as a major constraint on activity decreased to 60 per cent in March, from 65 per cent three months earlier. The
proportion indicating that labour availability was restricting activity also declined (38 per cent vs. 41 per cent) whilst at 24 per cent labour costs also became
less of a concern. In contrast, those stating land
prices as a limitation on activity rose from 15 per cent to 20 per cent.
As part of the £300m Leeds Kirkstall Forge scheme
around 1,500 residential properties are to be built alongside new office, retail and leisure buildings. Work is expected to start this year and complete by 2020.
Work should also begin this year on a large-scale housing development near Ransome Road in Northampton. The 770 unit development is expected
to cost £120m and work should be completed in late 2019.
In King’s Lynn, Norfolk, there are plans for 600 new
homes. Work on the £80m project is set to commence in the second half of 2016 with completion in 2019.
Enabling works on the £850m new St James Quarter
in Edinburgh started in January, with main construction expected to begin some time in the spring and complete in 2020. The development is now
planned to contain around 250 new homes.
One of the most active developers in Wales at present is the Conygar Investment Company plc, which is
currently taking forward three marina projects, at Fishguard, Holyhead and Pembroke Dock, all with large residential elements, totalling 937 apartments. It
also has plans for a 900 residential unit scheme in Haverfordwest.
Outlook Growth in private housing output is likely to be
marginally slower in 2018 compared to our forecasts in the Spring Update. However, our overall projections of moderate expansion over the next three years
remain. This is despite the presence of pent-up demand in the market as the housing affordability issue continues to act as a drag on the sector.
0
5000
10000
15000
20000
25000
30000
2011 2012 2013 2014 2015 2016 2017 2018
Orders Output
PRIVATE HOUSING ORDERS (2005 PRICES, £M) AND OUTPUT (2012 PRICES, £M)
Source: ONS, Experian.
17
© Experian
UK Construction Forecast
Summer 2016 Volume 22: Issue 3
2011 2012 2013 2014 2015 2016 2017 2018
Private Housing
£ million (2012 prices) 15908 15070 15437 16700 16681 17015 17355 17702
Annual % Change 0.8 -5.3 2.4 8.2 -0.1 2.0 2.0 2.0
Public Housing
£ million (2012 prices) 7485 7613 7306 7413 7413 7265 7047 6835
Annual % Change -8.1 1.7 -4.0 1.5 0.0 -2.0 -3.0 -3.0
All Housing
£ million (2012 prices) 23393 22683 22743 24113 24094 24279 24402 24537
Annual % Change -2.2 -3.0 0.3 6.0 -0.1 0.8 0.5 0.6
Source: ONS and Experian.
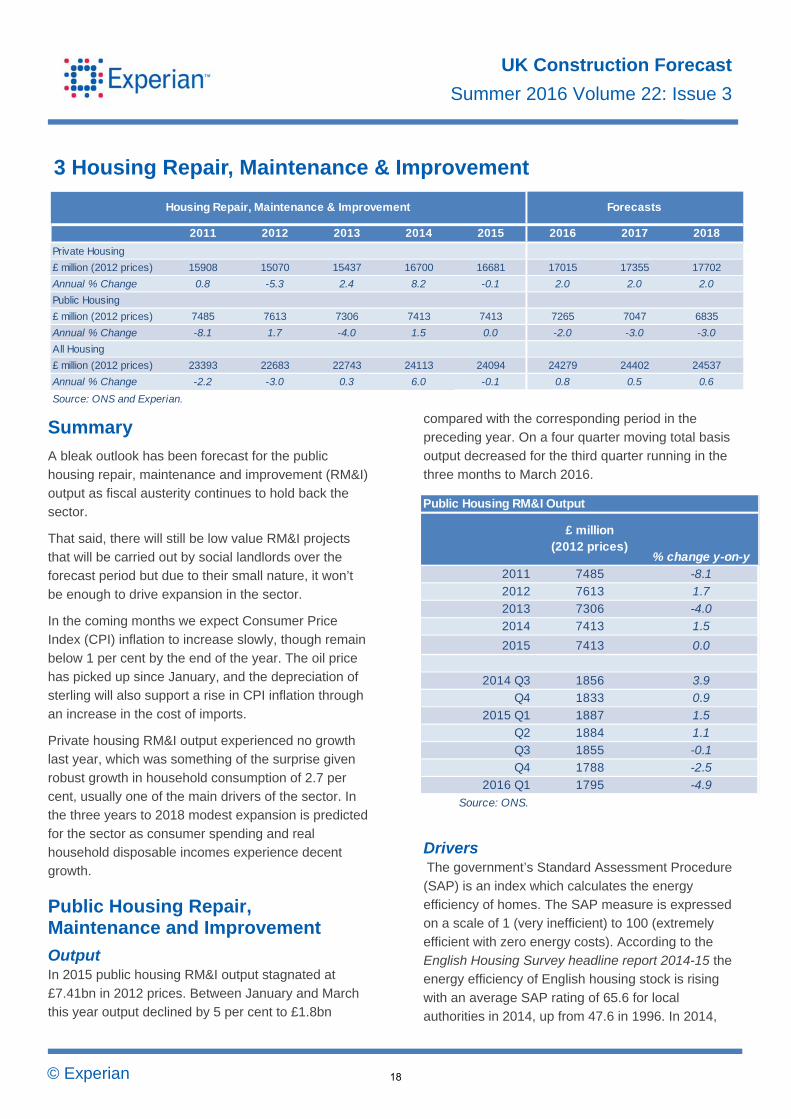
ForecastsHousing Repair, Maintenance & Improvement
3 Housing Repair, Maintenance & Improvement
Summary
A bleak outlook has been forecast for the public
housing repair, maintenance and improvement (RM&I) output as fiscal austerity continues to hold back the sector.
That said, there will still be low value RM&I projects that will be carried out by social landlords over the forecast period but due to their small nature, it won’t
be enough to drive expansion in the sector.
In the coming months we expect Consumer Price Index (CPI) inflation to increase slowly, though remain
below 1 per cent by the end of the year. The oil price has picked up since January, and the depreciation of sterling will also support a rise in CPI inflation through
an increase in the cost of imports.
Private housing RM&I output experienced no growth last year, which was something of the surprise given
robust growth in household consumption of 2.7 per cent, usually one of the main drivers of the sector. In the three years to 2018 modest expansion is predicted
for the sector as consumer spending and real household disposable incomes experience decent growth.
Public Housing Repair, Maintenance and Improvement
Output In 2015 public housing RM&I output stagnated at
£7.41bn in 2012 prices. Between January and March this year output declined by 5 per cent to £1.8bn
compared with the corresponding period in the preceding year. On a four quarter moving total basis
output decreased for the third quarter running in the three months to March 2016.
Drivers The government’s Standard Assessment Procedure
(SAP) is an index which calculates the energy efficiency of homes. The SAP measure is expressed on a scale of 1 (very inefficient) to 100 (extremely
efficient with zero energy costs). According to the English Housing Survey headline report 2014-15 the energy efficiency of English housing stock is rising
with an average SAP rating of 65.6 for local authorities in 2014, up from 47.6 in 1996. In 2014,
% change y-on-y
2011 7485 -8.1
2012 7613 1.7
2013 7306 -4.0
2014 7413 1.5
2015 7413 0.0
2014 Q3 1856 3.9
Q4 1833 0.9
2015 Q1 1887 1.5
Q2 1884 1.1
Q3 1855 -0.1
Q4 1788 -2.5
2016 Q1 1795 -4.9
Source: ONS.
Public Housing RM&I Output
£ million (2012 prices)
18

© Experian
UK Construction Forecast
Summer 2016 Volume 22: Issue 3
housing associations had a mean SAP rating of 67.1, up from 52.6 in 1996. Overall, the social housing sector was more energy efficient than the private one.
This is probably due to wider use of wall insulation in social housing as well as differing dwelling types, e.g. there is a higher proportion of flats in the social
housing sector which will have less exposed surface areas through which heat can be lost compared with detached or semi-detached houses. The assumption
is that work will continue to be undertaken to improve SAP ratings.
The domestic renewable heat incentive scheme which
is administered by Office of Gas and Electricity Markets (OFGEM) E-Serve was launched in April 2014. The aim is to promote the use of renewable
heat and households that install these measures receive tariff payments over a seven year period. Between April 2014 and May 2016 a total of 52,504
applications were made for the scheme, of which 49,083 were accredited i.e. an installation has gone through the required checks by OFGEM E-Serve and
was ready to start receiving payment. Approximately 24 per cent (11,709) of accreditations were for social landlords. Of these around 83 per cent were for air
source heat pumps.
Earlier this year Birmingham City Council announced a £59m investment in its residential stock. Kitchens
and bathrooms will be replaced, heating systems will be upgraded and new windows and roofs will also be installed on around 5,800 properties.
Refurbishment work has started on various council housing sites across Sheffield. Main improvements to properties include new windows, doors, flooring,
bathrooms and kitchens. There will also be upgrades of plumbing systems.
Outlook Our forecasts for public housing RM&I output have
been downgraded from the winter and spring in the light of the first quarter figures and deterioration in the economic scenario. Funding for major renovation
schemes is likely to be at a premium given on-going budget constraints not just for local authorities but other social housing providers.
Private Housing Repair, Maintenance & Improvement
Output At £16.68bn private housing RM&I output was largely
flat in 2015. In the first quarter of this year, it edged up by 1 per cent to £4.09bn compared with the same period a year earlier. On a four quarter moving total
basis, output went up for the fourth successive quarter between January and March 2016.
Drivers One of the key drivers of the private housing RM&I market is the health of the economy and, more specifically, household finances. When people are
more secure in their jobs and disposable incomes are
6400
6600
6800
7000
7200
7400
7600
7800
2011 2012 2013 2014 2015 2016 2017 2018
PUBLIC HOUSING REPAIR, MAINTENANCE & IMPROVEMENT OUTPUT (2012 PRICES, £M)
Source: ONS.
£ million (2012 prices)
% change y-on-y
2011 15908 0.8
2012 15070 -5.3
2013 15437 2.4
2014 16700 8.2
2015 16681 -0.1
2014 Q3 4242 7.4
Q4 4119 3.8
2015 Q1 4041 -3.9
Q2 4221 2.1
Q3 4255 0.3
Q4 4164 1.1
2016 Q1 4088 1.2
Source: ONS.
Private Housing RM&I Output
19

© Experian
UK Construction Forecast
Summer 2016 Volume 22: Issue 3
rising, they are more likely to invest in non-essential improvement work to their homes, such as a new bathroom or kitchen, but when there are concerns
over unemployment and incomes are being squeezed, this non-essential work is likely to be put off.
However, there is also a body of essential repair and
maintenance work that must be undertaken in order to keep a dwelling habitable, and this cannot be put off indefinitely.
The Consumer Prices Index (CPI) rose by 0.3 per cent in the year to May, unchanged from April. Other than a spike in the CPI in March, due largely to the
timing of Easter, inflation has been at 0.3 per cent for every month so far this year. Given the absence of any large movements in the latest numbers, our
benign baseline forecast for CPI remains largely unchanged. We expect CPI inflation to increase gradually as the oil price recovers and the large falls
in the food component of CPI over the past couple of years bottom out. Over the next three years consumer spending is likely to rise by an annual average of 2.3
per cent.
The chart below plots quarterly changes based on four-quarter moving totals for real household
disposable incomes (RHDI), consumer spending and private housing RM&I output.
While RHDI and consumer spending are thought to be
the most relevant variables influencing housing RM&I expenditure, RM&I spending may not always follow the trends of the former two variables as there are
other factors at work in the sector.
Under the domestic renewable heat incentive scheme of the 49,083 accreditations between April 2014 and
May 2016, just over three quarters were for owner occupiers and private landlords. Owner occupiers accounted for the largest share at 73 per cent whilst
private landlords accounted for just 3 per cent of total accreditations.
As mentioned before there will be no more Green
Deal loans or cashback funding. Customers who have cashback vouchers or are already paying loans will be unaffected. Bearing this in mind, in May a total of
657,681 Green Deal assessments had been undertaken, with the May figure of 5,362 assessments down by 6 per cent on the previous month. There
were 14,029 households that had Green Deal Plans and of these, 164 were at the pending stage, where the plan has been signed and installation was in
progress, and 13,146 were at the live stage, where all measures had been installed. Since the beginning of the Green Deal scheme a total of 20,676 measures
have been installed.
In contrast, as expected significantly more installations were recorded under the ECO scheme
with around 1,832,500 measures installed between January 2013 and April 2016. In April the number of ECO measures installed was down by 8 per cent to
39,049 compared with the previous month.
Between October and December last year, according to data from the Bank of England, housing equity
withdrawal remained negative for the 31th consecutive quarter as homeowners continued to pay down mortgages with the value of funds being injected
at £9.45bn in the quarter. This figure was 2 per cent lower compared with the previous quarter and down 32 per cent year-on-year. One of the main methods of
funding substantial RM&I work is through housing equity withdrawal thus the negative trend is likely to have impacted on major RM&I works.
It is worth noting that some RM&I work may be undertaken by firms not classified in the construction sector, such as manufacturers of kitchen and
bathroom equipment using their own workforce, and thus it would not show up in construction statistics.
-4%
-3%
-2%
-1%
0%
1%
2%
3%
4%
5%
6%
-1%
-1%
0%
1%
1%
2%
2010
Q1
2010
Q2
2010
Q3
2010
Q4
2011
Q1
2011
Q2
2011
Q3
2011
Q4
2012
Q1
2012
Q2
2012
Q3
2012
Q4
2013
Q1
2013
Q2
2013
Q3
2013
Q4
2014
Q1
2014
Q2
2014
Q3
2014
Q4
2015
Q1
2015
Q2
2015
Q3
2015
Q4
2016
Q1
Qau
rter
ly %
cha
nge
in t
he fo
ur q
uart
er m
ovin
g to
tal
Real household disposable income (lhs)Consumer spending (lhs)Private housing RM&I output (rhs)
PRIVATE HOUSING REPAIR, MAINTENANCE & IMPROVEMENT OUTPUT VS. REAL HOUSEHOLD DISPOSABLE INCOME VS. CONSUMER SPENDING
Source: ONS.
20

© Experian
UK Construction Forecast
Summer 2016 Volume 22: Issue 3
Outlook Our spring private housing RM&I output forecasts have been retained, with relatively modest growth at around 2 per cent a year, roughly in line with
consumer spending growth, the most likely scenario. By the end of the forecast period output is projected to be around 86 per cent of its 2002 peak.
8000
9000
10000
11000
12000
13000
14000
15000
16000
17000
18000
19000
2011 2012 2013 2014 2015 2016 2017 2018Source: ONS.
PRIVATE HOUSING REPAIR, MAINTENANCE & IMPROVEMENT OUTPUT (2012 PRICES, £M)
21

© Experian
UK Construction Forecast
Summer 2016 Volume 22: Issue 3
4 New Infrastructure
Summary
In 2015 the Office for National Statistics (ONS)
published two significant revisions to construction output data. A large firm from the services sector was reclassified to construction. Data were only revised
from March 2015 and thus are no longer comparable with earlier data. The estimated impact was about 12 per cent of reported output for 2015.
ONS also made changes to the treatment of outliers in the output data. Changes were made at that stage only to the output series for 2014 and 2015. Published
output in the nine months to September 2015 was revised up by £615m, but decreased by £343m for 2014. This added about a further 4 per cent to the
output increase in 2015 over 2014. New orders data have not been impacted by either of these changes.
Since its peak in 2011, infrastructure output has been
somewhat volatile but the general trend was downward to end 2014. However, 2015 set a new annual record at £17.7bn in 2012 chain linked prices,
29.8 per cent higher than 2014. For the four quarters ending March 2016 output totalled £17.4bn, an 18 per cent increase over the preceding four quarters.
In the context of performance over the last three years, current price output in the water sub-sector remains low in historical terms, but sewerage has
recovered from the trough experienced in 2014. The patterns of decline established in the gas, air & communications and rail sub-sectors have persisted.
Output in the electricity and roads sub-sectors has continued to grow strongly through 2015. Infrastructure new orders progressively increased
from the recent low point in the first quarter of 2014 through the recent high points in the second and third quarters of 2015. Orders have weakened since then
but the four-quarter total to March 2016 was still 36 per cent higher than the previous four quarters.
Following the strong growth in output in 2015 output is forecast to stall, with 2016 recording a fall of 1
percent, before recovering by a similar 1 per cent in 2017 and then stabilising in 2018. The strongest drivers of output through the review period are
sewerage and roads. Sewerage is the major contributor to growth in 2016, predicated on the method used by ONS to calculate output by orders for
the sub-sector despite Thames Tideway Tunnel construction not starting in earnest until 2017. The increase in output from major roads schemes also
drives growth in 2017 as well as 2018. The forecasts now assume the start of main works on Hinkley C nuclear power station is delayed beyond 2018.
The March 2016 National Infrastructure Plan shows an Infrastructure pipeline, excluding social infrastructure, of £425bn in 2014/15 prices. This
excludes areas of expenditure which are devolved to the Welsh Assembly and the Scottish Parliament. Of this total £240bn of projects will be delivered by
2020/21. Spending progressively falls from £52bn in 2016/17 to £41bn in 2020/21. 60 per cent of the projects and programmes are either in construction or
part of an active programme. In the period to 2020/21 the two largest sectors, energy (£117.4bn, 49 per cent) and transport (£88.4bn, 37 per cent), account for
87 per cent of the pipeline’s total value, but not all of this expenditure will be measured as infrastructure construction output. £100bn of this spend will be
entirely publicly funded, 50 per cent entirely private investment and the balance a mix of public and private sources. In percentage terms, the main
changes in the pipeline since the July 2015 report are a reduction in the spend on water and waste offset by additional flood spend. The Government has set up
two new bodies, the Infrastructure and Projects Authority and an independent National Infrastructure Commission, to ensure the right infrastructure projects
are identified and delivered successfully.
2010 2011 2012 2013 2014 2015 2016 2017 2018
£ million (2012 prices) 14887 16136 14103 14539 13668 17737 17560 17735 17735
Annual % Change 27.5 8.4 -12.6 3.1 -6.0 29.8 -1 1 0
Source: ONS and Experian.
New Infrastructure Construction Output Forecasts
22

© Experian
UK Construction Forecast
Summer 2016 Volume 22: Issue 3
Mix of Infrastructure Output by Sub-Sector 2012 to 2015
18%23% 35%
41%
16% 17%
20%
28%32% 31%
23%
14%
15% 10% 6% 3%
5%3% 3%
5%
4% 4%5%
5%11% 11% 8% 4%
0%
10%
20%
30%
40%
50%
60%
70%
80%
90%
100%
2012 2013 2014 2015
Gas, Air &CommsHarbours
Railways
Roads
Electricity
Sewerage
Water
Source: ONS
Sector Overview
Output & Orders Infrastructure output in 2015 established a new record
of £17.7bn, up 29.8 per cent on 2014 in chain-linked 2012 prices, following a 6 per cent decrease in 2014 from 2013. Output grew progressively from the
second quarter of 2014 to peak at £4.51bn in the third quarter of 2015, but has since fallen back progressively to £4.07bn in the first quarter of 2016. In
the four quarters to March 2016 output was £17.4bn, 18 per cent higher than the previous four quarters.
The following table shows the value of contractors’
orders and output in constant prices since 2011.
Following an excellent year in 2012, when new orders
totalled £10.1bn in 2005 prices, boosted by a 10-year water and sewerage framework contract, new infrastructure orders in 2013 fell back to £8.4bn, a
16.8 per cent decrease. Orders fell by a further 14.3 per cent in 2014 to £7.2bn, a similar level to 2011 before picking up by 50.3 per cent to set a new record
of £10.9bn in 2015. In the four quarters to March 2016 orders totalled £11.3bn, 36 per cent on previous four quarters.
The contributions from each sub-sector to overall infrastructure output as reported by ONS have changed significantly. However, some anecdotal
evidence is not consistent with these changes, specifically in the water and sewerage and electricity sub-sectors.
Rail was the largest sub-sector in 2012 with 32 per cent of total infrastructure output, but its share fell to
14 per cent in 2015. Conversely electricity grew from 18 per cent in 2012 to be the largest sector in 2015
with 41 per cent, up from just 10 per cent in 2010.
The shares taken by both water and sewerage have fallen away. The combined total has more than halved
from 20 per cent in 2012 to 8 per cent in 2015. Roads’ share has grown from 16 per cent in 2012, to 28 per cent in 2015 slightly below the 30 per cent recorded in
2010.
There has been little change in the percentage taken by harbours and waterways recovering in 2015 from a
dip to 3 per cent in 2013 and 2014 to 5 per cent, the same percentage as in 2012.The share taken by gas, air and communications has fallen from 11 per cent in
2012 to just 4 per cent in 2015.
The changes since 2012 are summarised in the following chart.
The chart below shows how the relative balance between public and private funding has developed in the period since 1997 based upon ONS constant price
data. Privately funded infrastructure output represented 61 per cent of total sector output in 2015.
Split of Infrastructure Output by Public/Private Funding 1997 to 2015
41%36% 37% 33% 34% 40% 42% 38% 37% 35% 35% 35% 40% 38% 35% 32% 36% 37%
40%59% 64% 63% 67%
66%60% 58%
62% 63% 65% 65%65%
60%
62 %65%
68%64% 63%
60%
0
5,000
10,000
15,000
20,000
25,000
1997 1999 2001 2003 2005 2007 2009 2011 2013 2015
Ou
tpu
t in
Co
nst
an
t Pric
es
£'0
00
PrivatePublic
£ million
Source: ONS
% change y-on-y
£ million (2012 prices)
% change y-on-y
2011 7239 -17.0 16136 8.4
2012 10133 40.0 14103 -12.6
2013 8432 -16.8 14539 3.1
2014 7229 -14.3 13668 -6.0
2015 10863 50.3 17737 29.8
Q3 1889 -19.2 3383 -5.9
Q4 2192 9.9 3619 -4.6
2015 Q1 2468 70.3 4425 30.0
Q2 3088 81.6 4513 38.4
Q3 3066 62.3 4485 32.6
Q4 2243 2.3 4313 19.2
2016 Q1 2857 15.8 4070 -8.0
Source: ONS.
Orders Output
New Infrastructure Orders And Output
£ million (2005 prices)
23

© Experian
UK Construction Forecast
Summer 2016 Volume 22: Issue 3
The tables above and below show the value of contractors’ orders and output in current prices split by sub-sector in the period since 2011.
Drivers The Highways England (HE) investment programme
in major road network schemes is the main driver of roads output. The HE Delivery Plan 2015-2020 includes a summary of capital expenditure over each
of the 5 years. These plans remain broadly unchanged from the ‘Roads Investment Strategy’ (RIS1) Plan published by the government in
December 2014. Additionally, there are a limited number of major schemes in Scotland. County council funded projects also provide support for this sub-
sector.
The main contributors to rail output continue to be investments by Network Rail and the separately funded Crossrail and Thameslink projects. The Hendy
Report confirmed since the publication of the Network Rail Strategic Business Plan for the period April 2014 to March 2019 that the costs and timescales on a
small number of significant project programmes have increased and/or lengthened. The vast majority of programmes and projects will go ahead for delivery by
2019, but some projects are delayed so that Network Rail remains within its funding envelope. Output from Crossrail is forecast to fall significantly towards the
end of the review period.
In water and sewerage the five-yearly Asset Management Programme (AMP) agreed between the
2011 2012 2013 2014 2015 2014 Q3 Q4 2015 Q1 Q2 Q3 Q4 2016 Q1
Water 890 1496 515 210 561 407 210 364 284 469 561 657
-52.5 40.5 -190.7 -144.9 62.6 -16.0 -93.5 42.2 -28.2 39.5 16.5 14.6
Sewerage 373 321 251 321 2270 244 321 327 390 1520 2270 2276
-8.3 -16.2 -27.9 21.9 85.8 12.4 24.0 1.6 16.4 74.3 33.0 0.3
Electricity 1842 2471 3873 4234 6039 4459 4234 4003 5258 6246 6039 7408
-5.2 25.5 36.2 8.5 29.9 -4.3 -5.3 -5.8 23.9 15.8 -3.4 18.5
Roads 967 1992 2181 2742 3795 2201 2742 4289 4744 4302 3795 2786
-87.7 51.5 8.7 20.4 27.7 13.6 19.7 36.1 9.6 -10.3 -13.4 -36.2
Railways 3288 3395 2440 1328 1455 1240 1328 1187 1438 1504 1455 1659
34.9 3.2 -39.1 -83.7 8.8 -35.6 6.6 -11.9 17.4 4.4 -3.3 12.3
Harbours 211 355 679 543 457 524 543 584 617 546 457 365
-33.2 40.6 47.7 -25.0 -18.9 5.5 3.4 7.0 5.3 -13.0 -19.6 -25.1
Gas, Air & Communica 928 2481 879 289 241 403 289 196 167 171 241 214
-98.1 62.6 -182.1 -204.3 -19.9 -8.6 -39.5 -47.1 -17.3 2.3 28.9 -12.9
Total -8499 -12510 -10818 -9666 -14819 9477 9666 10948 12898 14759 14819 15366
Source: ONS.
Value Of New Infrastructure Orders Obtained By Contractors £ million/% change
2011 2012 2013 2014 2015 2014 Q3 Q4 2015 Q1 Q2 Q3 Q4 2016Q1
Water 2450 2091 1564 867 704 207 167 184 179 177 164 164
8.8 -14.7 -25.2 -44.6 -18.8 -9.6 -19.3 10.2 -2.7 -1.1 -7.3 0.0
Sewerage 916 635 502 409 966 101 115 131 136 275 424 447
-5.1 -30.7 -20.9 -18.5 136.2 10 14 14 4 102 54 5
Electricity 2140 2538 3529 5464 8326 1443 1615 1896 2100 2227 2103 1946
50.8 18.6 39.0 54.8 52.4 13.6 11.9 17.4 10.8 6.0 -5.6 -7.5
Roads 3764 2231 2560 3137 5664 817 951 1276 1495 1516 1377 1185
-6.9 -40.7 14.7 22.5 80.6 17 16 34 17 1 -9 -14
Railways 3835 4558 4683 3491 2870 821 791 835 773 673 589 523
35.2 18.9 2.7 -25.5 -17.8 -9.2 -3.7 5.6 -7.4 -12.9 -12.5 -11.2
Harbours 556 496 635 788 991 202 224 260 267 249 215 172
7.9 -10.8 28.0 24.1 25.8 9 11 16 3 -7 -14 -20
Gas, Air & Communica 1658 1553 1624 1228 727 297 262 250 203 153 121 87
10.0 -6.3 4.6 -24.4 -40.8 -7.2 -11.8 -4.6 -18.8 -24.6 -20.9 -28.1
Total 15320 14102 15097 15384 20247 3887 4124 4831 5153 5270 4993 4525
Source: ONS.
Value Of New Infrastructure Output By Contractors £ million/% change
24

© Experian
UK Construction Forecast
Summer 2016 Volume 22: Issue 3
regulator, OFWAT, and the water companies is the key driver of investment. The new AMP6 period
started in April 2015 and traditionally output in these sub-sectors has grown the early years of each programme. Overlaying this pattern is the Thames
Tideway Tunnel, the largest ever National Infrastructure project. Excluding this project recent ONS orders data have been at historically low levels.
The main influences on electricity investment are the need to ensure supply security of both generation and distribution as ageing power stations are progressively
de-commissioned. There is confidence for investment in new capacity across different means of generation including wind, energy from waste (EfW) and gas.
However, the delay in the final EDF commitment to Hinkley Point C nuclear power station takes the start of main construction beyond the review period.
Within the gas, air and communications sub-sector, air currently contributes over half of output. Investments in the London area airports, led by Heathrow and
Gatwick, provide the basis for changes in output. The roll-out of rural broadband and cable networks expansion support communications output. Gas
output is driven by investment in storage and distribution, following cancellation of the carbon capture and storage projects.
Harbours and waterways sub-sector output derives from the commercial development of ports and harbours, the strengthening of flood defences and
investments in waterway schemes. Announced in the 2016 Budget was a further £700m support in addition to the Government’s previous six-year £2.3bn capital
investment programme in flood defences through to 2020/21.
Outlook In 2015 output increased by 29.8 per cent over 2014
largely as a consequence of the revisions to the published output data outlined earlier. Looking forward output is forecast to remain relatively stable through
the review period, falling by 1 per cent in 2016, as the impact of the data revisions washes out of the comparison. This will be followed by a rise of a similar
percentage value in 2017 and no change in 2018.
Following the dramatic increase in 2015 roads output is forecast to suffer a double-digit decline in 2016,
before expansion returns in 2017 in mid-single digits, increasing to double digit growth in 2018.
After a fall in 2015 approaching 20 per cent, a further decline in output in mid-single digits in the rail sub-sector is forecast for 2016 before mid-single digit
growth in both 2017 and 2018.
The forecasts for the two components of the water and sewerage sub-sector are significantly different.
Water is forecast to show only limited single digit growth in both 2016 and 2017 before stabilising in 2018. In contrast, there is already evidence, given the
method used by ONS to calculate output by sub-sector, that published sewerage output will at least double this year, despite Thames Tideway Tunnel
construction not starting in earnest until next year, with further double digit growth in 2017 before stabilising in 2018.
With the continuing uncertainty it is now assumed that no significant output derives from Hinkley Point C nuclear power plant in the review period. Following
the 50 percent growth in output in the electricity sub-sector in 2015 it is now forecast that output stabilises in 2016 before double digit falls in both 2017 and
2018.
Following significant reductions in activity in both 2014 and 2015, the output of the gas, air and
communications sub-sector is forecast to suffer a similar reduction in 2016 before being broadly stable in the final two years of the review period.
2015 saw the third year of strong double-digit growth in the harbours and waterways sub-sector with output growing by about a quarter. However, the forecast
sees output decline by a similar amount in 2016 before the pace of decline slows but remains just in double digits for 2017 and 2018.
0
2000
4000
6000
8000
10000
12000
14000
16000
18000
20000
2011 2012 2013 2014 2015 2016 2017 2018
Output Orders
NEW INFRASTRUCTURE ORDERS (2005 PRICES, £M) AND OUTPUT (2012 PRICES, £M)
Source: ONS, Experian
25
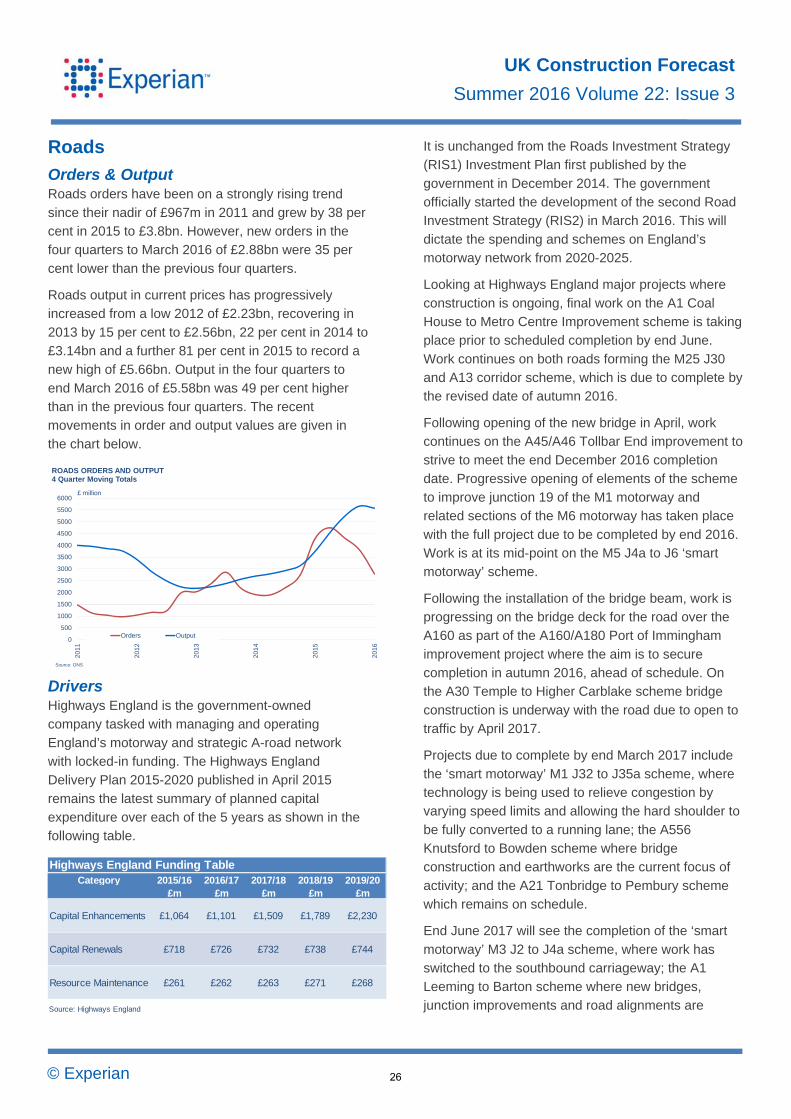
© Experian
UK Construction Forecast
Summer 2016 Volume 22: Issue 3
Roads
Orders & Output Roads orders have been on a strongly rising trend
since their nadir of £967m in 2011 and grew by 38 per cent in 2015 to £3.8bn. However, new orders in the four quarters to March 2016 of £2.88bn were 35 per
cent lower than the previous four quarters.
Roads output in current prices has progressively increased from a low 2012 of £2.23bn, recovering in
2013 by 15 per cent to £2.56bn, 22 per cent in 2014 to £3.14bn and a further 81 per cent in 2015 to record a new high of £5.66bn. Output in the four quarters to
end March 2016 of £5.58bn was 49 per cent higher than in the previous four quarters. The recent movements in order and output values are given in
the chart below.
Drivers Highways England is the government-owned company tasked with managing and operating
England’s motorway and strategic A-road network with locked-in funding. The Highways England Delivery Plan 2015-2020 published in April 2015
remains the latest summary of planned capital expenditure over each of the 5 years as shown in the following table.
It is unchanged from the Roads Investment Strategy (RIS1) Investment Plan first published by the
government in December 2014. The government officially started the development of the second Road Investment Strategy (RIS2) in March 2016. This will
dictate the spending and schemes on England’s motorway network from 2020-2025.
Looking at Highways England major projects where
construction is ongoing, final work on the A1 Coal House to Metro Centre Improvement scheme is taking place prior to scheduled completion by end June.
Work continues on both roads forming the M25 J30 and A13 corridor scheme, which is due to complete by the revised date of autumn 2016.
Following opening of the new bridge in April, work continues on the A45/A46 Tollbar End improvement to strive to meet the end December 2016 completion
date. Progressive opening of elements of the scheme to improve junction 19 of the M1 motorway and related sections of the M6 motorway has taken place
with the full project due to be completed by end 2016. Work is at its mid-point on the M5 J4a to J6 ‘smart motorway’ scheme.
Following the installation of the bridge beam, work is progressing on the bridge deck for the road over the A160 as part of the A160/A180 Port of Immingham
improvement project where the aim is to secure completion in autumn 2016, ahead of schedule. On the A30 Temple to Higher Carblake scheme bridge
construction is underway with the road due to open to traffic by April 2017.
Projects due to complete by end March 2017 include
the ‘smart motorway’ M1 J32 to J35a scheme, where technology is being used to relieve congestion by varying speed limits and allowing the hard shoulder to
be fully converted to a running lane; the A556 Knutsford to Bowden scheme where bridge construction and earthworks are the current focus of
activity; and the A21 Tonbridge to Pembury scheme which remains on schedule.
End June 2017 will see the completion of the ‘smart
motorway’ M3 J2 to J4a scheme, where work has switched to the southbound carriageway; the A1 Leeming to Barton scheme where new bridges,
junction improvements and road alignments are
Category 2015/16 2016/17 2017/18 2018/19 2019/20£m £m £m £m £m
Capital Enhancements £1,064 £1,101 £1,509 £1,789 £2,230
Capital Renewals £718 £726 £732 £738 £744
Resource Maintenance £261 £262 £263 £271 £268
Source: Highways England
Highways England Funding Table
0
500
1000
1500
2000
2500
3000
3500
4000
4500
5000
5500
6000
2011
2012
2013
2014
2015
2016
ROADS ORDERS AND OUTPUT 4 Quarter Moving Totals
Orders Output
£ million
Source: ONS
26

© Experian
UK Construction Forecast
Summer 2016 Volume 22: Issue 3
progressively coming on stream; and on the A5-M1 link Dunstable bypass where bridge, roundabout and
drainage work are included in the current phase of construction.
Installation of 8 ‘superspan’ gantries has commenced
on the M60 J8 to M62 J20 scheme. Current work on the M6 J16 to J19 ‘smart motorway’ scheme is focused on the central reservation between J17 and
J18. Work was due to start in June 2016 on the A19/A1058 Coast Road scheme on Tyneside.
The timetables for these schemes are summarised in
the table above.
The table below lists the projects are within the Highways England Delivery Plan where construction
commences from mid-2016 or later in the review period.
The A14 Cambridge to Huntingdon improvement
scheme has been given the go ahead with work due to start in late 2016. The Development Consent Order (DCO) decision on the M4 J3 to J12 scheme is
expected in autumn 2016. The DCO submission for
the M20 J10A scheme was due to be made in June 2016.
Construction of the A63 Castle Street scheme has been postponed to avoid a clash with the City of Culture celebrations in Hull in 2017. Further
information and details on the remaining schemes in this tranche of projects are still awaited.
Highways England awarded a £130m contract to build
a new lorry park off the M20 in Kent. This will bring to an end the long-running saga of Operation Stack that turns the M20 into a lorry park when there are
disruptions at the Port of Calais, Channel Tunnel breakdowns or storms impacting on ferry crossings. Work is targeted for completion in summer 2017.
12 further schemes are included in the Highways England Delivery Plan where construction is due to commence in 2018/19 or later. Additionally, there are
a further 49 projects that were first announced in December 2014 totalling £1bn of investment which are at an early stage in the Delivery Plan but where
construction is expected to start by 2019/20. Timings for all these later projects have yet to be confirmed.
Turning to projects not centrally funded, the
Lancashire County Council funded £123m Heysham to M6 link, the Bay Gateway, will complete in summer 2016. Work has started on the main deck of the new
£600m six-lane toll Mersey Gateway Bridge with the bridge opening planned for autumn 2017. The £290m dual carriageway road linking the A6 to Manchester
Major Roads Projects Under Construction During the Forecast PeriodSchemes where construction has commencedRoad / Section Scheme Type Value
£m Q2 Q3 Q4 Q1 Q2 Q3 Q4 Q1 Q2 Q3 Q4A1 Coal House to Metro Centre Junction Improvement 61 Q3 2014M25 J30 / A13 Corridor Widening / Junction Imp 79 Q1 2015A45 / A46 Tollbar End Improvement Widening / Junction Imp 106 Q1 2014M1 J19 / Related Sections of M6 and A14 Congestion Relief 191 Q1 2014M5 J4a to J6 Managed Motorway TBA Q1 2016A160 / A180 Port of Immingham Dualling / Junction Imp. 88 Q2 2015A30 Temple to Higher Carblake Dualling 60 Q1 2015M1 J32 to J35A Managed Motorway 106 Q1 2015M1 J16 to J19 Managed Motorway 91 Q4 2015A556 Knutsford to Bowdon Improvement Congestion Relief 192 Q4 2014A21 Tonbridge to Pembury Dualling Dualling 70 Q2 2015M3 J2 to J4A Managed Motorway 158 Q1 2015A1 Leeming to Barton Widening 380 Q1 2014A5 - M1 Link Dunstable By-Pass New Dual Carriageway 162 Q1 2015M60 J8 to M62 J20 Managed Motorway 208 Q2 2014M6 J16 to J19 Managed Motorway 192 - 274 Q4 2015A19 / A1058 Coast Road Junction Improvement TBA Q2 2016Source: Highw ays England
Start Date2017 20182016
Major Roads Projects Where Construction Commences During the Forecast PeriodSchemes Due to Start in 2016 or later in the forecast periodRoad / Section Scheme Type Value
£mA14 Cambridge to Huntingdon Widening / Junction Imp 1200-1800 Q1 2017M4 J3 to J12 Managed Motorway 586 - 862 Q1 2017M20 J10A Managed Motorway 61 - 86 Q1 2018M1 J24 to J25 Managed Motorway TBA 2016/17M6 J2 to J4 Managed Motorway TBA 2017/18M20 J3 to J5 Managed Motorway TBA 2017/18M23 J8 to J10 Managed Motorway TBA 2017/18A63 Castle St, Hull Junction Improvement 135 - 202 Q1 2018M27 J4 to J11 Managed Motorway TBA 2017/18M6 J13 to J15 Managed Motorway TBA 2017/18Source: Highw ays England
2019/202020/212020/212021/22
2019/20
Start DateCompletion
DateQ1 2021Q1 2022Q1 20192017/182019/20
27

© Experian
UK Construction Forecast
Summer 2016 Volume 22: Issue 3
Airport remains on schedule to opening in autumn 2017. The A-frame pylon for the New Wear Crossing
Bridge in Sunderland is due to be lifted into place this winter with completion planned for spring 2018. Work has started on the £104m Norwich North Distributor
road due for completion in late 2017. Construction is expected to start by end 2016 on the 24-month contract for the £96m Lincoln bypass after approval
for the scheme was granted following a public enquiry. Early contractor work has started on the £110m Preston Western Distributor and associated Link
Roads with main project construction taking place from 2017 to 2019.
In London, if approved, construction of the Silvertown
Tunnel would not commence before 2018/19. £145m of the £175m cost of the 366m long Garden Bridge across the River Thames in London has been
secured. Work is now planned to start this summer and complete by end 2018.
In Scotland the Queensferry Crossing is no longer on
schedule for completion by end 2016, with May 2017 now the revised target opening date. Work on the £35m 7.5km dualling of the Kincraig to Dalraddy
section of the A9 remains due for completion by summer 2017. This is the first of 12 sections to dual the A9 from Perth to Inverness planned to be
completed by 2025 at a cost of £3bn. Work continues on the £745m 58km Aberdeen Western Peripheral Route. The junctions around Aberdeen airport will
complete in 2016, the A90 Balmedie to Tipperty section in spring 2017, and the entire scheme by winter 2017. Bids have been invited for the A737
£38m Dalry Bypass based on construction starting in the current fiscal year. Four bidders have been shortlisted for the £50m design contract for the
western section of the A96 dualling programme between Hardmuir and Fochabers.
In Wales work has started on the £57m Eastern Bay
Link Road in Cardiff for completion by spring 2017. The latest timetable for the £1bn M4 Newport Relief Road construction, if approved, sees construction
starting in spring 2018 and completion by autumn 2021. The value of this M4 scheme will dwarf most ongoing Welsh Assembly financed projects which are
aimed at major "pinch points" to reduce congestion, including work on the A40 and A55 trunk roads. In
addition there is the ongoing dualling of the A465 Heads of the Valleys road.
Outlook Following the dramatic increase in 2015 output is forecast to suffer a double-digit decline in 2016, before expansion returns in 2017 in mid-single digits,
increasing to double digit growth in 2018.
Rail
Orders & Output Following a period of rapid increase new orders
peaked at £4.14bn in the four quarters ending September 2012. Subsequently the value of new orders in current prices progressively decreased to
mid-2014, before stabilising at a lower level of around £1.5m. Orders in 2015 totalled £1.46m, up 10 per cent on 2014. In the four quarters to March 2016 new
orders totalled £1.66bn, 40 per cent higher than the preceding four quarters.
From a peak in current prices of £4.87bn in the
second quarter of 2013 four-quarter output has progressively fallen to £2.87bn in calendar year 2015, 18 per cent lower than 2014. In the four quarters to
March 2016 output totalled £2.56bn, 24 per cent lower than the preceding four quarters. The recent movements in order and output values are given in
the chart below.
Drivers The Hendy Report in November 2015 reviewed the Network Rail investment programme through to 2019 and sought to put it on a more realistic and
sustainable footing. Whilst the Department for Transport (DfT) was minded to accept the report it has consulted publicly on the proposals and has yet to
RAIL ORDERS AND OUTPUT 4 Quarter Moving Totals
0
500
1000
1500
2000
2500
3000
3500
4000
4500
5000
20
11
20
12 .
20
13
20
14
20
15
20
16
Output Orders
£ million
Source: ONS
28

© Experian
UK Construction Forecast
Summer 2016 Volume 22: Issue 3
announce a formal decision. Additionally, the Shaw report was published in March 2016. This report ruled
out the wholesale privatisation and break up of Network Rail but left open the possibility of bringing more private finance into the running of the railways,
at local level or for specific projects. The Government plans formally to respond to the Shaw report later in 2016.
The commissioning of the Hendy and Shaw reports followed increases in the costs and timescales on a small number of significant enhancement projects
beyond what was envisaged in the ambitious £38bn Network Rail Strategic Business Plan for the CP5 period from April 2015 to March 2019, which included
£11.8bn in 2012/13 prices for enhancements.
Network Rail, as a public body, is planning to release £1.8bn of investment through the sale of non-core and
lower value assets and the government has increased its borrowing limit by £700m to fund the revised plan. The vast majority of programmes and projects within
the CP5 plan will still be delivered by 2019, but some projects will be delayed so that Network Rail remains within its funding envelope. No infrastructure schemes
have been cancelled. Individual draft revised project summaries were published in January 2016.
One major area of projected cost overrun is the Great
Western Main Line electrification. The initial cost of £874m in 2013 has been progressively revised upwards to potentially £2.8bn and the electrification of
the Cardiff to Swansea section has now been delayed to the CP6 period. The start of the £130m Reading to Heathrow link has now been put back to 2019
because of delays in consulting landowners.
New stations being built include Kirkstall Forge and Ilkeston, due for completion in 2016, and the £50m
Cambridge North one due to open in May 2017. Work continues on London Bridge station redevelopments ahead of completion in 2018. An £800m investment
programme commenced at London Waterloo in April 2016 for completion by December 2018 and includes bringing the Eurostar terminal back into use, platform
extensions, new track and signalling.
Following the restarts, work on the Midland Mainline and TransPennine electrification schemes is
progressing. The first stage of the Midland Mainline
scheme will deliver electrification to Kettering and Corby by 2019. December 2017 will see completion of
electrification on the Preston to Manchester and Manchester Victoria to Stalybridge lines with Blackpool to Preston completing in May 2018. Work
continues on the Ordsall Chord to connect Manchester Piccadilly and Victoria stations by end 2017.
£340m will be spent on Merseyside over the next three years. Work will start in 2017 building two new platforms at Lime Street Station. Other projects
include the completion of the Merseyrail loop, construction of an extra section of track between Huyton and Roby, a new station at Maghull North and
upgrading the Halton Curve.
In Scotland the Edinburgh Waverley to Glasgow Queen Street electrification infrastructure works and
the Edinburgh Gateway station will complete in 2016. £121m is committed to Phase 2 of the Highlands Main Line Rail project in the period through to 2019.
Construction was scheduled to start on the £170m 26km first phase of the Aberdeen to Inverness Improvement Project in spring 2016 for completion in
2019. The £112m contract for the transformation of Glasgow Queen Street station is due for award in autumn 2016 for completion in 2019.
Provision of the new platform at Cardiff Central is set for delivery in 2017. Re-signalling will complete in the central Cardiff area in 2017 and will take place from
Baglan to Llanelli in 2018 to 2019.
Fit-out of the tunnels, shafts and portals is underway and construction continues on the ten new Crossrail
stations with platform construction more than 50 per cent complete and overall construction has passed the 70 per cent complete mark. In 2016 the major
programme of surface works includes upgrades to track and electrification of key sections of the Crossrail route alongside the redevelopment of
several stations, including Ealing Broadway. Construction Old Oak Common depot will continue to completion in early 2017 and the new dive-under at
Acton will be complete by end 2016.
The Transport for London (TfL) 2016/17 capital expenditure budget on Crossrail includes a reduction
from £1.54bn in 2015/16 to £1.40bn in 2016/17,
29

© Experian
UK Construction Forecast
Summer 2016 Volume 22: Issue 3
£689m in 2017/18 and just £168m in 2018/19. For London Rail and the Underground capital expenditure
is forecast to show only a nominal decrease from £1.48bn in 2015/16 to £1.45bn in 2016/17.
On the London Underground tunnelling works on the
£550m Northern Line extension from Kennington to Battersea have been delayed until early 2017, but remain on target for completion in 2020. Costs have
increased by £240m to cover design changes to the station at Battersea Power Station resulting from increased over-station developments. Construction on
contracts worth over £500m to substantially upgrade the capacity of Bank station began in April 2016 with works completing in 2021. Improvements include a
tunnel and platform for the Northern line, two new moving walkways and a new station entrance in Cannon Street. Work on the £284m Metropolitan Line
Croxley Rail link in Watford will start in 2016 and is planned to come into use in 2020.
The hybrid bill for HS2 Phase 1 passed its third
reading in the Commons in March 2016 facilitating the start of enabling works in 2017. There are seven civil engineering packages in Phase 1 with a total
indicative value of £5.3bn to 8.7bn starting in 2018.
Outlook After a fall in 2015 approaching 20 per cent, a further, more moderate, decline in output is forecast for 2016
before mid-single digit growth in both 2017 and 2018.
Water and Sewerage
Orders & Output Following the latest peak in new orders for water and
sewerage of £2.12bn in the four quarters to the second quarter of 2012, new orders in current values progressively fell to just £532m in the four quarters to
the final one of 2014, the lowest level since the mid-1980s. Since then orders have recovered sharply particularly in the second half of 2015 to end the year
at £2.83bn, boosted by contracts for the Thames Tideway Tunnel. For the four quarters to end March 2016 new orders totalled £2.93bn, more than three
times the previous four quarters.
Whilst new work output has followed a similar pattern, in 2015 the two components of this sub-sector have
endured different fortunes. The double digit fall in
water output has been offset by sewerage output reported as more than doubling. This is likely to have
overstated the real value of work completed as it is considered to have been impacted by the ONS derivation of output from the Thames Tideway Tunnel
orders.
Overall after peaking at £3.37bn in the fourth quarter of 2011 the four-quarter moving total progressively fell
each quarter to a total of £1.22 in the second quarter of 2015. Annual output in 2015 totalled £1.67bn, up 31 per cent on 2014. Output for the four quarters ending
March 2016 totalled £1.97bn, 60 per cent higher than in the previous four quarters. The recent movements in order and output values are given in the chart
below.
Drivers Capital expenditure by water and sewerage companies in England and Wales is primarily driven
by their five-year Asset Management Plans (AMP). The AMP6 covers the period from April 2015 to March 2020.
The agreed AMP6 plans provide for £44bn of investment in improving services, improving resilience and protecting the environment over the five-year
period, compared with a total of £40.6bn for the AMP5 period. The OFWAT AMP6 approach allows companies to choose the best solutions to deliver the
outcomes they have committed to by investing in new infrastructure, maintaining existing infrastructure, or adopting other solutions.
Throughout AMP6, water companies are forecasting major expenditure on both water and wastewater. Thames Water leads the way with forecast total
expenditure of just over £7bn between 2015 and
WATER AND SEWERAGE ORDERS AND OUTPUT4 Quarter Moving Totals
0
500
1000
1500
2000
2500
3000
3500
4000
20
11
20
12
20
13
20
14
20
15
20
16
Orders Output
£ million
Source: ONS
30
© Experian
UK Construction Forecast
Summer 2016 Volume 22: Issue 3
2020, followed by United Utilities with a spend of £5.2bn, whilst Anglian Water will invest £4.1bn and
Yorkshire Water £3.4bn. Only part of this expenditure will be reported as construction output.
Despite capital expenditure levels being not dissimilar
in AMP6 to AMP5 and well publicised efforts by the water companies to reduce the cyclicality of the spend profile, the value of orders reported by ONS for water
and sewerage, excluding the Thames Tideway Tunnel contracts, has been at levels much lower than would have been expected. As a result, doubts persist on
whether the changes in the method of order data collection made by ONS in 2012 have resulted in orders previously reported as construction not now
being captured, with a knock-on effect on output. It is considered that the recent lower order and output values may establish a new norm for this sub-sector.
The Department for Environment, Food & Rural Affairs (DEFRA) has published new policy papers setting out government plans for supporting long-term
resilience in the water sector in dealing with issues of climate change and a growing population. To meet the water scarcity challenge, the sector may need to
develop new supply infrastructure. This could be considered to be ‘nationally significant’. DEFRA will announce by autumn 2016 whether it will develop a
National Policy Statement which sets out the need for improvements to the water supply infrastructure.
The £4.2bn Thames Tideway Tunnel, the largest ever
Nationally Significant Infrastructure Project (NSIP) and the largest ever undertaken by the UK water industry, will cover 24 construction sites across London. As well
as being backed by pension funds and other long-term investors it has also secured a £700m loan from the European Investment Bank (EIB). This is part of
the £3.1bn funding that Tideway is providing with the balance being funded by Thames Water. The main contracts for construction were placed in August 2015.
Main construction work is due to start later in 2016, with tunnelling commencing in 2017 and continuing through to 2021.
Planning applications for Thames Water’s £280m Counters Creek storm relief sewer are due to be made in mid-2016. Subject to approval, construction
may start in 2017 and continue through to 2020. Work continues on the three-year £250m overhaul of the
Deephams sewage works which is due complete in autumn 2018.
United Utilities accelerated capital investment, including infrastructure renewal expenditure, in 2015/16, the first year of AMP6, to around £800m to
deliver early operational benefits. It has awarded an £85m contract for the Bridge End to Williamsgate raw water aqueduct scheme. This is part of a 100km
pipeline forming the £300m Thirlmere Transfer West Cumbria Water Supplies Project. Subject to planning approval the project is scheduled to start in March
2017 and last four and a half years.
Other United Utilities projects include work on a number of schemes to help improve coastal bathing
waters in the north west; investment of £200m at Davyhulme Wastewater Treatment Works where work started in summer 2015 for completion in autumn
2017; and the start of work on the £80m Oldham and Royton waste water treatment works upgrade for completion by end 2017.
Total investment by Anglia Water over 2016/17 will be £444m, of which only a part will be construction related. Projects to be funded include £24m
maintaining, refurbishing and replacing parts of the 37,000km water pipe network, £12m to connect rural homes to the mains sewerage network, and
£10million to adopt and refurbish private pumping stations.
Work by Wessex Water includes completion of the
eight-year £230m water supply grid project by 2017 and the £25m Frome Valley Relief Sewer, due to start in 2017/18. Northumbrian Water has awarded the
£46m contract for a 30-month major upgrade of its Horsley Water Treatment Works in the Tyne Valley.
The five-year £63m redevelopment of Southern
Water’s Woolston Waste Water Treatment Work is moving forward with construction of the building envelope beginning in summer 2017 and project
completion scheduled for 2018.
Severn Trent Water has recently placed the raw water contract for the £242m Birmingham Resilience
Project, one of the largest ever Severn Trent engineering projects, to develop an alternative water supply for Birmingham whilst the hundred-year old
Elan Valley Aqueduct is off line for maintenance. It
31
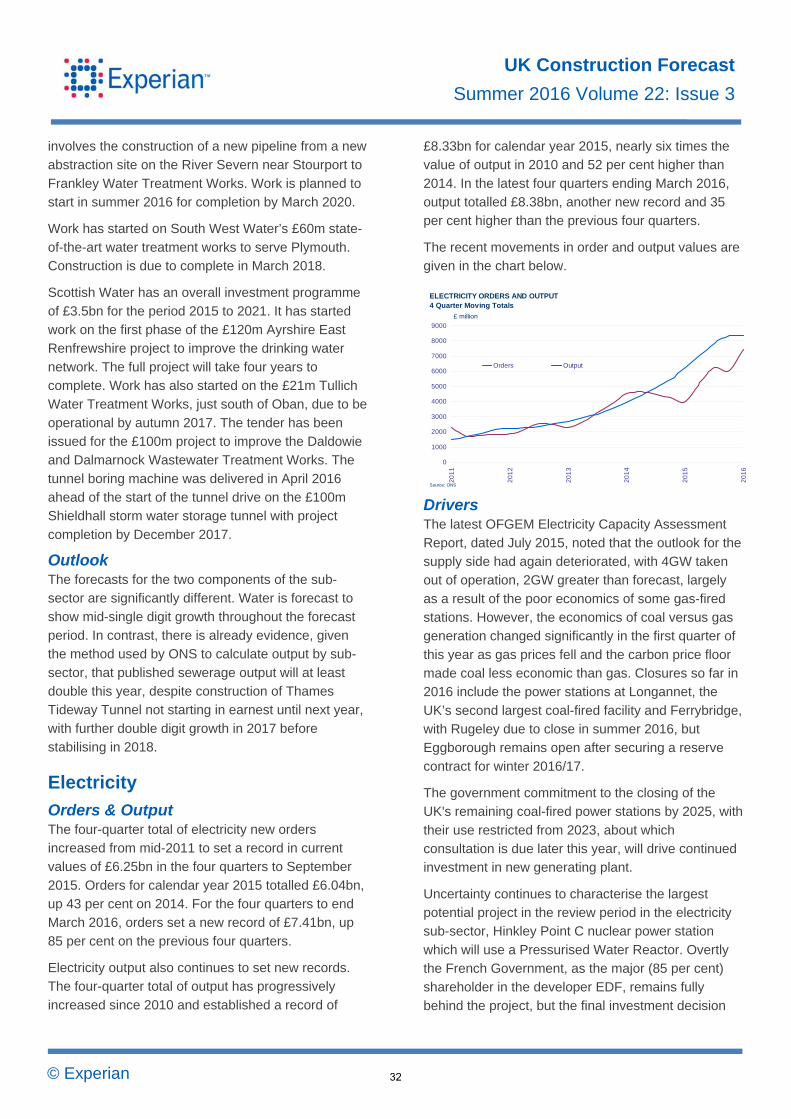
© Experian
UK Construction Forecast
Summer 2016 Volume 22: Issue 3
involves the construction of a new pipeline from a new abstraction site on the River Severn near Stourport to
Frankley Water Treatment Works. Work is planned to start in summer 2016 for completion by March 2020.
Work has started on South West Water’s £60m state-
of-the-art water treatment works to serve Plymouth. Construction is due to complete in March 2018.
Scottish Water has an overall investment programme
of £3.5bn for the period 2015 to 2021. It has started work on the first phase of the £120m Ayrshire East Renfrewshire project to improve the drinking water
network. The full project will take four years to complete. Work has also started on the £21m Tullich Water Treatment Works, just south of Oban, due to be
operational by autumn 2017. The tender has been issued for the £100m project to improve the Daldowie and Dalmarnock Wastewater Treatment Works. The
tunnel boring machine was delivered in April 2016 ahead of the start of the tunnel drive on the £100m Shieldhall storm water storage tunnel with project
completion by December 2017.
Outlook The forecasts for the two components of the sub-sector are significantly different. Water is forecast to
show mid-single digit growth throughout the forecast period. In contrast, there is already evidence, given the method used by ONS to calculate output by sub-
sector, that published sewerage output will at least double this year, despite construction of Thames Tideway Tunnel not starting in earnest until next year,
with further double digit growth in 2017 before stabilising in 2018.
Electricity
Orders & Output The four-quarter total of electricity new orders increased from mid-2011 to set a record in current values of £6.25bn in the four quarters to September
2015. Orders for calendar year 2015 totalled £6.04bn, up 43 per cent on 2014. For the four quarters to end March 2016, orders set a new record of £7.41bn, up
85 per cent on the previous four quarters.
Electricity output also continues to set new records. The four-quarter total of output has progressively
increased since 2010 and established a record of
£8.33bn for calendar year 2015, nearly six times the value of output in 2010 and 52 per cent higher than
2014. In the latest four quarters ending March 2016, output totalled £8.38bn, another new record and 35 per cent higher than the previous four quarters.
The recent movements in order and output values are given in the chart below.
Drivers The latest OFGEM Electricity Capacity Assessment
Report, dated July 2015, noted that the outlook for the supply side had again deteriorated, with 4GW taken out of operation, 2GW greater than forecast, largely
as a result of the poor economics of some gas-fired stations. However, the economics of coal versus gas generation changed significantly in the first quarter of
this year as gas prices fell and the carbon price floor made coal less economic than gas. Closures so far in 2016 include the power stations at Longannet, the
UK’s second largest coal-fired facility and Ferrybridge, with Rugeley due to close in summer 2016, but Eggborough remains open after securing a reserve
contract for winter 2016/17.
The government commitment to the closing of the UK's remaining coal-fired power stations by 2025, with
their use restricted from 2023, about which consultation is due later this year, will drive continued investment in new generating plant.
Uncertainty continues to characterise the largest potential project in the review period in the electricity sub-sector, Hinkley Point C nuclear power station
which will use a Pressurised Water Reactor. Overtly the French Government, as the major (85 per cent) shareholder in the developer EDF, remains fully
behind the project, but the final investment decision
ELECTRICITY ORDERS AND OUTPUT 4 Quarter Moving Totals
0
1000
2000
3000
4000
5000
6000
7000
8000
9000
20
11
20
12
20
13
20
14
20
15
20
16
£ million
Orders Output
Source: ONS
32
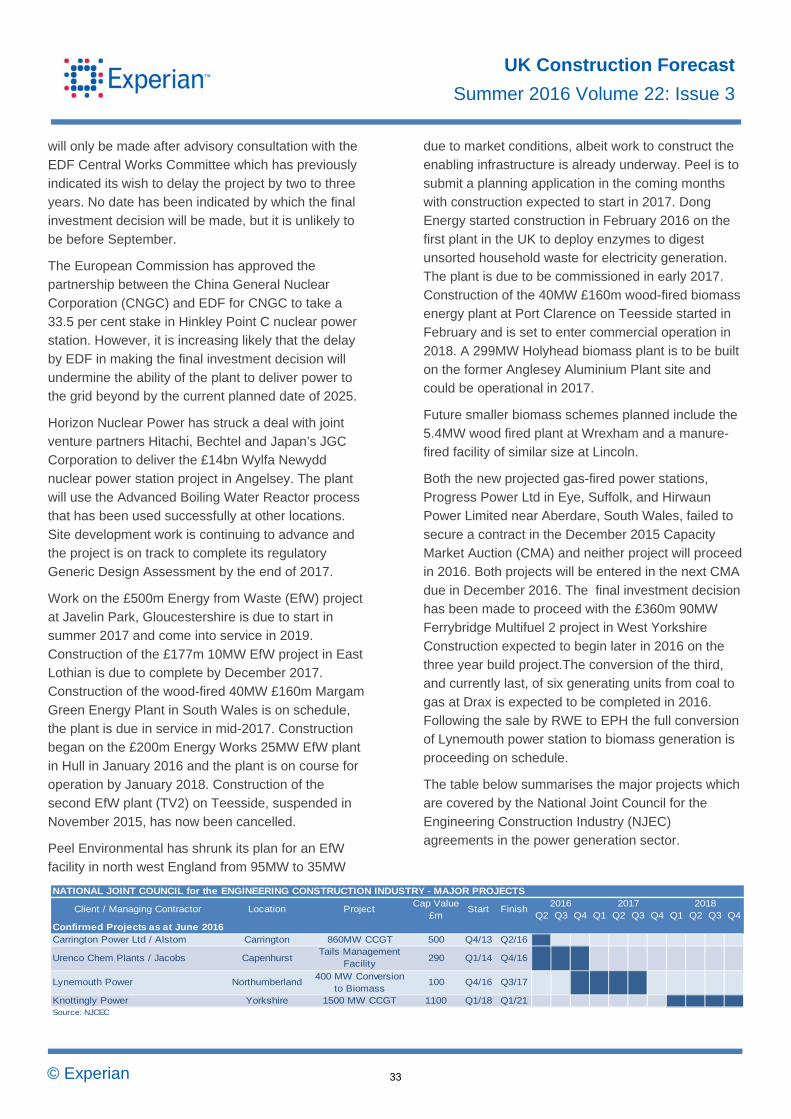
© Experian
UK Construction Forecast
Summer 2016 Volume 22: Issue 3
will only be made after advisory consultation with the EDF Central Works Committee which has previously
indicated its wish to delay the project by two to three years. No date has been indicated by which the final investment decision will be made, but it is unlikely to
be before September.
The European Commission has approved the partnership between the China General Nuclear
Corporation (CNGC) and EDF for CNGC to take a 33.5 per cent stake in Hinkley Point C nuclear power station. However, it is increasing likely that the delay
by EDF in making the final investment decision will undermine the ability of the plant to deliver power to the grid beyond by the current planned date of 2025.
Horizon Nuclear Power has struck a deal with joint venture partners Hitachi, Bechtel and Japan’s JGC Corporation to deliver the £14bn Wylfa Newydd
nuclear power station project in Angelsey. The plant will use the Advanced Boiling Water Reactor process that has been used successfully at other locations.
Site development work is continuing to advance and the project is on track to complete its regulatory Generic Design Assessment by the end of 2017.
Work on the £500m Energy from Waste (EfW) project at Javelin Park, Gloucestershire is due to start in summer 2017 and come into service in 2019.
Construction of the £177m 10MW EfW project in East Lothian is due to complete by December 2017. Construction of the wood-fired 40MW £160m Margam
Green Energy Plant in South Wales is on schedule, the plant is due in service in mid-2017. Construction began on the £200m Energy Works 25MW EfW plant
in Hull in January 2016 and the plant is on course for operation by January 2018. Construction of the second EfW plant (TV2) on Teesside, suspended in
November 2015, has now been cancelled.
Peel Environmental has shrunk its plan for an EfW facility in north west England from 95MW to 35MW
due to market conditions, albeit work to construct the enabling infrastructure is already underway. Peel is to
submit a planning application in the coming months with construction expected to start in 2017. Dong Energy started construction in February 2016 on the
first plant in the UK to deploy enzymes to digest unsorted household waste for electricity generation. The plant is due to be commissioned in early 2017.
Construction of the 40MW £160m wood-fired biomass energy plant at Port Clarence on Teesside started in February and is set to enter commercial operation in
2018. A 299MW Holyhead biomass plant is to be built on the former Anglesey Aluminium Plant site and could be operational in 2017.
Future smaller biomass schemes planned include the 5.4MW wood fired plant at Wrexham and a manure-fired facility of similar size at Lincoln.
Both the new projected gas-fired power stations, Progress Power Ltd in Eye, Suffolk, and Hirwaun Power Limited near Aberdare, South Wales, failed to
secure a contract in the December 2015 Capacity Market Auction (CMA) and neither project will proceed in 2016. Both projects will be entered in the next CMA
due in December 2016. The final investment decision has been made to proceed with the £360m 90MW Ferrybridge Multifuel 2 project in West Yorkshire
Construction expected to begin later in 2016 on the three year build project.The conversion of the third, and currently last, of six generating units from coal to
gas at Drax is expected to be completed in 2016. Following the sale by RWE to EPH the full conversion of Lynemouth power station to biomass generation is
proceeding on schedule.
The table below summarises the major projects which are covered by the National Joint Council for the
Engineering Construction Industry (NJEC) agreements in the power generation sector.
NATIONAL JOINT COUNCIL for the ENGINEERING CONSTRUCTION INDUSTRY - MAJOR PROJECTS
Q2 Q3 Q4 Q1 Q2 Q3 Q4 Q1 Q2 Q3 Q4
Carrington Power Ltd / Alstom Carrington 860MW CCGT 500 Q4/13 Q2/16
Urenco Chem Plants / Jacobs CapenhurstTails Management
Facility290 Q1/14 Q4/16
Lynemouth Power Northumberland400 MW Conversion
to Biomass100 Q4/16 Q3/17
Knottingly Power Yorkshire 1500 MW CCGT 1100 Q1/18 Q1/21Source: NJCEC
2016
Confirmed Projects as at June 2016
2017 2018Client / Managing Contractor Location Project
Cap Value £m
Start Finish
33
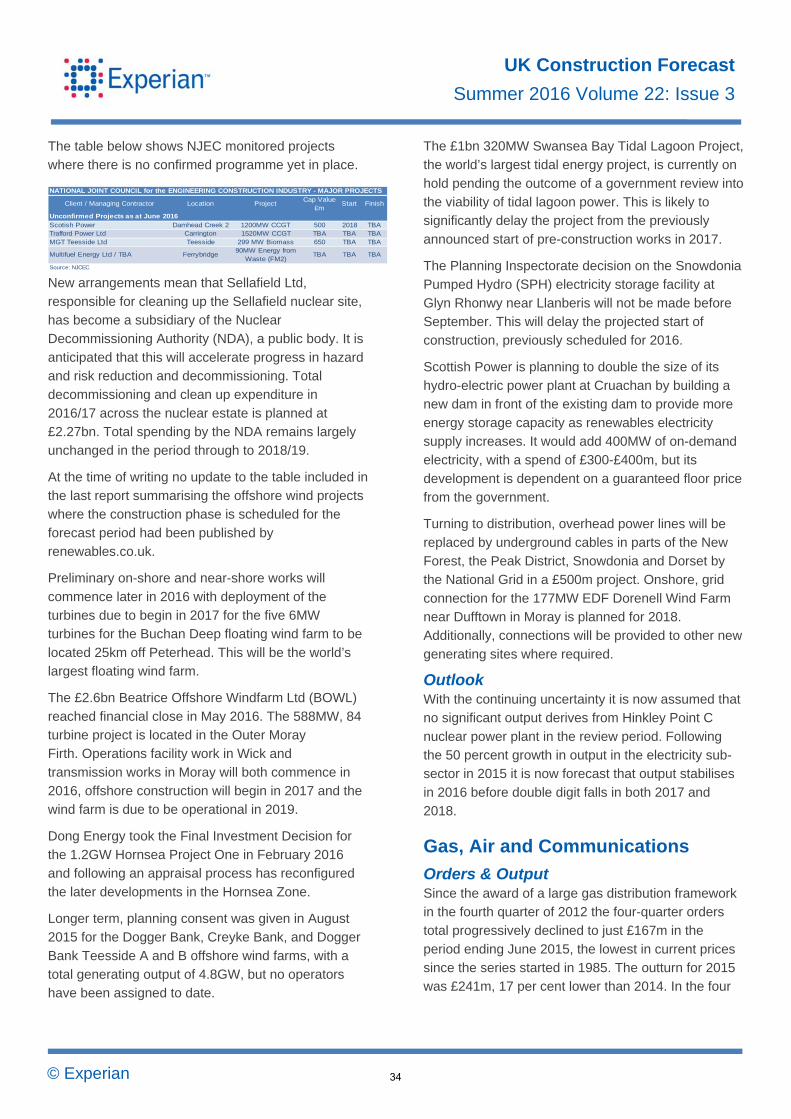
© Experian
UK Construction Forecast
Summer 2016 Volume 22: Issue 3
The table below shows NJEC monitored projects where there is no confirmed programme yet in place.
New arrangements mean that Sellafield Ltd,
responsible for cleaning up the Sellafield nuclear site, has become a subsidiary of the Nuclear Decommissioning Authority (NDA), a public body. It is
anticipated that this will accelerate progress in hazard and risk reduction and decommissioning. Total decommissioning and clean up expenditure in
2016/17 across the nuclear estate is planned at £2.27bn. Total spending by the NDA remains largely unchanged in the period through to 2018/19.
At the time of writing no update to the table included in the last report summarising the offshore wind projects where the construction phase is scheduled for the
forecast period had been published by renewables.co.uk.
Preliminary on-shore and near-shore works will
commence later in 2016 with deployment of the turbines due to begin in 2017 for the five 6MW turbines for the Buchan Deep floating wind farm to be
located 25km off Peterhead. This will be the world’s largest floating wind farm.
The £2.6bn Beatrice Offshore Windfarm Ltd (BOWL)
reached financial close in May 2016. The 588MW, 84 turbine project is located in the Outer Moray Firth. Operations facility work in Wick and
transmission works in Moray will both commence in 2016, offshore construction will begin in 2017 and the wind farm is due to be operational in 2019.
Dong Energy took the Final Investment Decision for the 1.2GW Hornsea Project One in February 2016 and following an appraisal process has reconfigured
the later developments in the Hornsea Zone.
Longer term, planning consent was given in August 2015 for the Dogger Bank, Creyke Bank, and Dogger
Bank Teesside A and B offshore wind farms, with a total generating output of 4.8GW, but no operators have been assigned to date.
The £1bn 320MW Swansea Bay Tidal Lagoon Project, the world’s largest tidal energy project, is currently on
hold pending the outcome of a government review into the viability of tidal lagoon power. This is likely to significantly delay the project from the previously
announced start of pre-construction works in 2017.
The Planning Inspectorate decision on the Snowdonia Pumped Hydro (SPH) electricity storage facility at
Glyn Rhonwy near Llanberis will not be made before September. This will delay the projected start of construction, previously scheduled for 2016.
Scottish Power is planning to double the size of its hydro-electric power plant at Cruachan by building a new dam in front of the existing dam to provide more
energy storage capacity as renewables electricity supply increases. It would add 400MW of on-demand electricity, with a spend of £300-£400m, but its
development is dependent on a guaranteed floor price from the government.
Turning to distribution, overhead power lines will be
replaced by underground cables in parts of the New Forest, the Peak District, Snowdonia and Dorset by the National Grid in a £500m project. Onshore, grid
connection for the 177MW EDF Dorenell Wind Farm near Dufftown in Moray is planned for 2018. Additionally, connections will be provided to other new
generating sites where required.
Outlook With the continuing uncertainty it is now assumed that no significant output derives from Hinkley Point C
nuclear power plant in the review period. Following the 50 percent growth in output in the electricity sub-sector in 2015 it is now forecast that output stabilises
in 2016 before double digit falls in both 2017 and 2018.
Gas, Air and Communications
Orders & Output Since the award of a large gas distribution framework in the fourth quarter of 2012 the four-quarter orders total progressively declined to just £167m in the
period ending June 2015, the lowest in current prices since the series started in 1985. The outturn for 2015 was £241m, 17 per cent lower than 2014. In the four
NATIONAL JOINT COUNCIL for the ENGINEERING CONSTRUCTION INDUSTRY - MAJOR PROJECTS
Scotish Power Damhead Creek 2 1200MW CCGT 500 2018 TBATrafford Power Ltd Carrington 1520MW CCGT TBA TBA TBAMGT Teesside Ltd Teesside 299 MW Biomass 650 TBA TBA
Multifuel Energy Ltd / TBA Ferrybridge90MW Energy from
Waste (FM2)TBA TBA TBA
Source: NJCEC
Unconfirmed Projects as at June 2016
Client / Managing Contractor Location ProjectCap Value
£mStart Finish
34
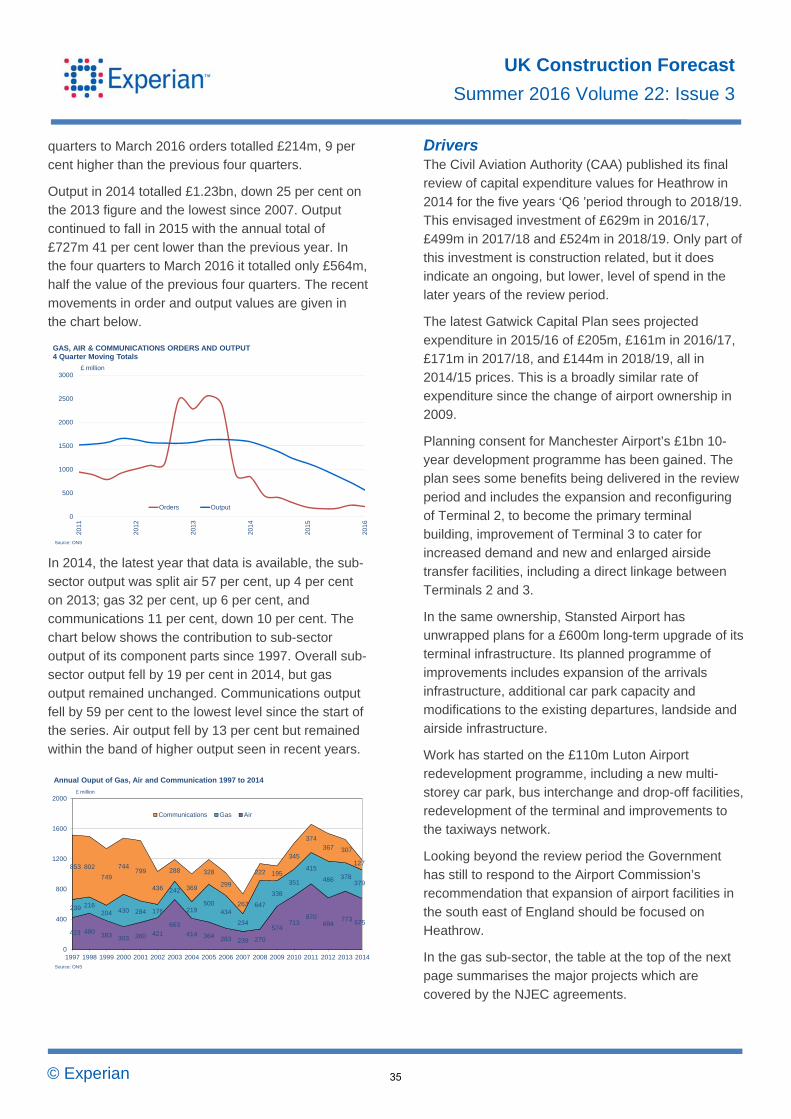
© Experian
UK Construction Forecast
Summer 2016 Volume 22: Issue 3
quarters to March 2016 orders totalled £214m, 9 per cent higher than the previous four quarters.
Output in 2014 totalled £1.23bn, down 25 per cent on the 2013 figure and the lowest since 2007. Output continued to fall in 2015 with the annual total of
£727m 41 per cent lower than the previous year. In the four quarters to March 2016 it totalled only £564m, half the value of the previous four quarters. The recent
movements in order and output values are given in the chart below.
In 2014, the latest year that data is available, the sub-
sector output was split air 57 per cent, up 4 per cent on 2013; gas 32 per cent, up 6 per cent, and communications 11 per cent, down 10 per cent. The
chart below shows the contribution to sub-sector output of its component parts since 1997. Overall sub-sector output fell by 19 per cent in 2014, but gas
output remained unchanged. Communications output fell by 59 per cent to the lowest level since the start of the series. Air output fell by 13 per cent but remained
within the band of higher output seen in recent years.
Drivers The Civil Aviation Authority (CAA) published its final review of capital expenditure values for Heathrow in
2014 for the five years ‘Q6 ’period through to 2018/19. This envisaged investment of £629m in 2016/17, £499m in 2017/18 and £524m in 2018/19. Only part of
this investment is construction related, but it does indicate an ongoing, but lower, level of spend in the later years of the review period.
The latest Gatwick Capital Plan sees projected expenditure in 2015/16 of £205m, £161m in 2016/17, £171m in 2017/18, and £144m in 2018/19, all in
2014/15 prices. This is a broadly similar rate of expenditure since the change of airport ownership in 2009.
Planning consent for Manchester Airport’s £1bn 10-year development programme has been gained. The plan sees some benefits being delivered in the review
period and includes the expansion and reconfiguring of Terminal 2, to become the primary terminal building, improvement of Terminal 3 to cater for
increased demand and new and enlarged airside transfer facilities, including a direct linkage between Terminals 2 and 3.
In the same ownership, Stansted Airport has unwrapped plans for a £600m long-term upgrade of its terminal infrastructure. Its planned programme of
improvements includes expansion of the arrivals infrastructure, additional car park capacity and modifications to the existing departures, landside and
airside infrastructure.
Work has started on the £110m Luton Airport redevelopment programme, including a new multi-
storey car park, bus interchange and drop-off facilities, redevelopment of the terminal and improvements to the taxiways network.
Looking beyond the review period the Government has still to respond to the Airport Commission’s recommendation that expansion of airport facilities in
the south east of England should be focused on Heathrow.
In the gas sub-sector, the table at the top of the next
page summarises the major projects which are covered by the NJEC agreements.
423 480 383 303 360 421663
414 364 283 239 270
574713
870684
773 675
239 216204 430 284 176
242
219500
434
234
647
338
351
415
486 378379
853 802
749
744799
436
288
369
328
299
263
222 195
345
374367 307
127
0
400
800
1200
1600
2000
1997 1998 1999 2000 2001 2002 2003 2004 2005 2006 2007 2008 2009 2010 2011 2012 2013 2014
Annual Ouput of Gas, Air and Communication 1997 to 2014
Communications Gas Air
£ million
Source: ONS
0
500
1000
1500
2000
2500
3000
2011
2012
2013
2014
2015
2016
£ million
GAS, AIR & COMMUNICATIONS ORDERS AND OUTPUT 4 Quarter Moving Totals
Orders Output
Source: ONS
35

© Experian
UK Construction Forecast
Summer 2016 Volume 22: Issue 3
In April 2016 the Department of Energy and Climate Change refused the Examining Authority’s
recommendation regarding the Development Consent Order for the White Rose Carbon Capture and Storage Project following the government’s decision to
end the carbon capture and storage commercialisation competition. This confirms that neither of the previously selected schemes will now
proceed.
National Grid’s investment programme remains an area of steady growth in the review period for both
gas transmission and gas distribution. Included in the programme is the £100m project to replace the gas pipeline across the Humber estuary, for which
Planning Inspectorate approval is expected in September 2016.
In communications continued rapid technological
change, increases in the availability and use of applications and in the number of users will continue to drive sector growth. The roll-out of rural and
superfast broadband, the expansion of cable networks and the government-supported super connected cities programmes will provide support in the future for the
current lower levels of construction output in this area.
Outlook Following significant reductions in output in both 2014 and 2015, the output of the gas, air and
communications sub-sector is forecast to suffer a similar reduction in 2016 before being broadly stable in the final two years of the review period.
Harbours and Waterways
Orders & Output Following the recent peak of £679m in the four-quarter
total in the final quarter of 2013, new orders have eased but have remained above a four-quarter total of £500m up to the third quarter of 2015. However, 2015
orders fell to £457m, down 16 per cent on 2014. The four-quarter total to March 2016, of £365m, was 38 per cent lower than the preceding four quarters.
Output benefitted from the above order intake, increasing progressively from the fourth quarter of 2012 to touch a record £1bn in the four quarters
ending September 2015. For 2015 output of £991m was 26 per cent up on 2014. In the four quarters to March 2016 output was £903m, a 4 per cent increase
on the preceding four quarters. The recent movements in order and output values are given in the chart below.
NATIONAL JOINT COUNCIL for the ENGINEERING CONSTRUCTION INDUSTRY - MAJOR PROJECTS
Q2 Q3 Q4 Q1 Q2 Q3 Q4 Q1 Q2 Q3 Q4
Sabic UK / Whessoe Engineering Ltd Wilton Ethane Storage Tank 80 Q1/15 Q3/16
Conoco Phillips / AMEC Foster Wheeler
Theddlethorpe Freon Replacement TBA Q2/15 Q3/16
Ineos GrangemouthShale Gas Import
Terminal75 Q3/15 Q3/16
Sabic UK / Jacobs WiltonTeessisde Gas
Cracking Project140 Q4/15 Q1/17
BPFPS / AMEC GrangemouthBP-KLPG Childown
ProjectTBA Q2/16 Q4/16
Halite Energy Group PressallUnderground Gas
Storage150 Q1/16 Q1/19
SSE / Shell Peterhead340 MW Carbon
CaptureTBA TBA TBA
Source: NJCEC
Unconfirmed Projects as at June 2016
Client / Managing Contractor Location ProjectCap Value
£mStart Finish
Confirmed Projects as at June 2016
2016 2017 2018
HARBOURS ORDERS AND OUTPUT 4 Quarter Moving Totals
0
200
400
600
800
1000
1200
20
11
20
12
20
13
20
14
20
15
20
16
£ million
Orders Output
Source: ONS
36
© Experian
UK Construction Forecast
Summer 2016 Volume 22: Issue 3
Drivers Private investment is the main driver of harbour development in the UK as the private sector operates
15 of the largest 20 ports by tonnage and 68 per cent of the UK major ports’ traffic.
Planned Harbour developments in the review period
include the Port of Felixstowe, which is on track to further increase container handling capacity to 6m twenty-foot equivalent units (TEUs) a year by 2020
and Dover Port’s five-year redevelopment of the Western docks, where a £135m tender for marine structures and bridges is due to close in August 2016.
Associated British Ports is continuing its capital investment programme across its portfolio and is planning to spend £857m on capital and operational
investment between 2016 and 2020. Peel Holdings is currently taking forward the £138m development of container handling facilities at the inland Port Salford
site. There is ongoing work at Teesport, due to be completed in 2017. Finally, a new deep water container terminal on a brownfield site at Avonmouth
Docks is scheduled to start in 2018, subject to suitable global economic conditions.
There has been no update on the plans to go out to
tender in late 2016 for the £165m contract for quay construction work on the Able Marine Energy Park, with a 27-month construction period.
Turning to flood and coastal defences, £802m was spent in 2014/15, but this was expected to have fallen to £695m in 2015/16. The government’s previous
commitment to a six-year £2.3bn capital investment programme through to 2020/21 in flood defences was increased by £700m in the 2016 Budget following the
damage from storms around the turn of the year. Based on the March 2016 National Infrastructure Pipeline annual expenditure on flood projects is
forecast to remain in the range £550m to £600m through to 2021/22.
Examples of specific projects in the programme
include a further phase of the Leeds Flood Alleviation scheme, worth £33m and due for completion in 2017; replacing seawalls at Rossall (£47m) due to complete
in November 2017; a barrage at Boston (£92m) commencing, subject to approval, in 2017 for completion in late 2019; £193m refreshing tidal
defences in East Anglia and in the Thames estuary,
starting in 2015/16, with spending rising to £40m per year towards the end of the forecast period and
continuing through to 2021/22; the £25m two-year Lowestoft protection scheme which started in early 2016; £15m in Somerset as part of a 20-year flood
action plan; £86m on Humber estuary schemes through to 2021; and £95m on the Derby flood defence scheme, albeit completion is not until 2022.
Following completion of investigative works, latest information on the 10-year £300m+ River Thames Scheme, part of the Thames Estuary Asset
Management 2100 Programme is that construction will not start before 2020/21, as will the River Thames schemes covering the stretch from Datchet to
Teddington.
Southern Water has pledged £268m on flood protection issues through to 2020, working alongside
other agencies to tackle issues including sewer flooding.
The Scottish Government has launched a £235 million
flood risk management plan containing 14 local strategies and proposals for 42 flood protection schemes or engineering works planned for 2016 to
2021 and a range of other flood alleviation measures.
Outlook 2015 saw the third year of strong double-digit growth in the harbours and waterways sub-sector with output
growing by about a quarter. However, the forecast sees output decline by a similar amount in 2016 before the pace of decline slows but remains just in
double digits for 2017 and 2018.
37

© Experian
UK Construction Forecast
Summer 2016 Volume 22: Issue 3
5 Public non-residential construction
Summary
Total public non-residential output declined for its fifth
successive year in 2015, with a 2 per cent fall to £9.38bn in 2012 prices, its lowest total since 2008. At £2.27bn output in the first quarter of the year was
down 3 per cent on the previous three months and 7 per cent on same period of 2015. On a four-quarter moving total basis output has been trending
downwards since early 2011.
After two successive years of growth orders in the public non-residential sector fell 23 per cent last year
to £6.38bn in 2005 prices, their lowest total since 1980. In the first quarter of this year orders fell sharply on a quarterly and annual basis to £1.32bn. On a four-
quarter moving total basis orders eased for the sixth successive quarter in the three months to March 2016.
Output performance was quite variable in the first quarter of the year at the sub-sector level. The health and offices sub-sectors saw the sharpest increases in
activity when compared to their level for the corresponding period of 2015, although activity in both was down on a quarterly basis. The opposite is true
for the education sub-sector which was up slightly on the previous quarter, but down 12 per cent on the same three months a year earlier. On the other hand
the entertainment and agriculture and miscellaneous sub-sectors saw activity fall heavily on both counts.
Growth in orders in the first quarter of the year was
also a mixed bag. Offices was the only sub-sector to post growth on a quarterly and annual basis, although its base level was particularly low in the first three
months of 2015. The education sub-sector was down on a quarterly basis but remained above its level for
the same period of 2015. In contrast the health, entertainment and miscellaneous ones posted heavy
fall on both measures.
The outlook for the sector as a whole has become less buoyant since the spring, especially in the short
term.
Much of the weakness can be attributed to a downgrade in near-term expectations for the
universities and entertainment sub-sectors. The former suffered a sharp decline in orders which curtails any expectations for growth in 2016. However,
large campus schemes for both UCL and Glasgow University should support expansion towards 2018.
The outlook for the miscellaneous sub-sector is also
quite weak as the reclassification of defence work hasn’t had as pronounced an effect as initially expected.
Elsewhere, the health sub-sector ought to perform quite well given a good amount of investment which has been allocated via ProCure 21+. One of the
largest projects in the sector is the £130m cancer hospital to be built alongside the Royal Liverpool University Hospital in Merseyside.
Sector Overview
Output & orders Output in the public non-residential sector fell for the fifth successive year in 2015, after posting a 2 per
cent decline to £9.38bn (2012 prices).
The downward trend continued in the first three months of year, as output fell 3 per cent on both a
quarterly and annual basis to £2.27bn. On a four-quarter moving total basis output slipped for the third
2011 2012 2013 2014 2015 2016 2017 2018
£ million (2012 prices) 13764 10795 9813 9555 9377 8908 9086 9268
Annual % change -4.4 -21.6 -9.1 -2.6 -1.9 -5 2 2
Source: ONS and Experian
Forecasts Public Non-Residential Construction Output
38

© Experian
UK Construction Forecast
Summer 2016 Volume 22: Issue 3
consecutive quarter in the three months to March 2016.
Orders also endured a tough year, falling 23 per cent
to £6.38bn (2005 prices), their lowest total since 1980.
In the first quarter of the year orders totalled £1.32bn, down significantly on a quarterly and annual basis. On
a four-quarter moving total basis orders eased for the sixth consecutive quarter in the three months to March 2016.
Drivers As outlined in the 2016 Budget, public sector net debt
as a share of Gross Domestic Product (GDP) is estimate to have reached its peak at 83.7 per cent of GDP in 2015/16. It is projected to decline steadily over
the forecast period before reaching 79.9 per cent of GDP in 2018.
Total Managed Expenditure (TME) is set to decline in
the medium term. It should account for 39.7 per cent of GDP in 2016/17, before declining to 38 per cent in 2018/19. Of the current allocation £145bn is
committed to the health sector, while £102bn has been allocated to the education one.
Outlook Our expectations for the public non-residential sector have worsened since the spring, especially in the short-term. This is predicated on weaker outlooks for the education, entertainment and miscellaneous sub-
sectors. The former’s downgrade stems from a notable downturn in orders for the universities sub-sector, although a couple of large new campus projects should support a return to growth towards 2018. Most of the other major sub-sectors are also set for a return to growth towards the latter end of the forecast period and this is reflected in our mildly positive forecasts for both 2017 and 2018.
Health
Output & orders Output on a current price basis in the health sub-sector rose by 3 per cent to £1.76bn in 2015.
In the first quarter of 2016 output fell by 10 per cent on a quarterly basis to £443m, however it did remain 24 per cent above its level for the same period of the
previous year. On a four-quarter moving total basis output strengthened for the third successive quarter in the three months to March 2016.
Orders rose by 12 per cent to £1.61bn in 2015, recovering some of the previous year’s considerable
downside.
5000
6000
7000
8000
9000
10000
11000
12000
13000
14000
15000
2011 2012 2013 2014 2015 2016 2017 2018
Orders Output
PUBLIC NON-RESIDENTIAL ORDERS (2005 PRICES, £M) AND OUTPUT (2012 PRICES, £M)
Source: ONS, Experian
2011 8440 -32.4 13764 -7.6
2012 7211 -14.6 10795 -21.6
2013 7826 8.5 9813 -9.1
2014 8256 5.5 9555 -2.6
2015 6383 -22.7 9377 -1.9
2014 Q3 1984 13.0 2419 -3.7
Q4 1895 -4.4 2439 3.0
2015 Q1 1721 -17.3 2325 -0.2
Q2 1495 -34.9 2369 0.0
Q3 1643 -17.2 2349 -2.9
Q4 1525 -19.5 2333 -4.3
2016 Q1 1323 -23.1 2265 -2.6
Source: ONS.
£ million (2005 prices)
% change y-on-y
Public Non-Residential Orders And Output
Orders Output
£ million (2012 prices)
% change y-on-y
0
500
1000
1500
2000
2500
3000
2011
2012
2013
2014
2015
2016
HEALTH ORDERS AND OUTPUT4 Quarter Moving Totals
Output Orders
£ million
Source: ONS
39

© Experian
UK Construction Forecast
Summer 2016 Volume 22: Issue 3
In the first three months of the year they were down heavily on a quarterly and annual basis to £236m.
On four-quarter moving total basis orders weakened
for the second successive quarter in the three months to March 2016 to 37 per cent below their late 2013 peak.
Drivers According to the latest government construction pipeline there is an estimated £1.21bn worth of ProCure 21+ projects planned between 2016 and
2019. However, not of all of it will fall into the new work category.
The allocations for procure 22 are yet to be
announced but the expectation is for investment to be maintained at its current level.
Outlook Activity in the health sub-sector is expected to
increase in each year of the forecast period after period of sustained contraction. There is a decent amount of work set to take place throughout the
forecast period which is detailed in the government construction pipeline, most of which falls under the ProCure 21+ framework. One of the largest drivers in
the current forecast period is the £130m cancer hospital that would be located next to the Royal Liverpool University Hospital in Merseyside.
Education
Output & orders Education construction activity rose for the second successive year in 2015, also by 3 per cent to £5.87bn (current prices).
In the first quarter of this year output was down 12 per cent on the on the previous quarter, although it was up slightly on the same period a year earlier. On a
four-quarter moving total basis activity remained unchanged for the second consecutive quarter.
After two successive annual increases new education orders fell 20 per cent to £4.4bn in 2015.
In the first three months of this year orders reached
£1.06bn, up 7 per cent on a quarterly basis, but 6 per cent down on the same three months of 2015. On a four-quarter moving total basis orders declined for the
sixth successive quarter in the three months to March 2016.
Drivers According to the latest government construction pipeline there is an estimated spend of over £5bn in
the education sector scheduled to take place over the current forecast period.
Morgan Sindall has been appointed to build a new
school complex in Littleport, Cambridgeshire on behalf of Cambridgeshire County Council. The first phase of the scheme is already underway. The project has an
estimated completion date of 2017, with an anticipated cost of £38m.
Lambeth College in South London has appointed
Carillion to deliver its new college complex in Vauxhall. The overall scheme is expected to cost around £120m, although only £45m of this figure can
be attributed to the education facility. The project should start and finish within the current forecast period.
Kier has been appointed to design and deliver new student halls for the University of Northampton,
0
1000
2000
3000
4000
5000
6000
7000
2011
2012
2013
2014
2015
2016
SCHOOLS ORDERS AND OUTPUT4 Quarter Moving Totals
Output Orders
£ million
Source: ONS
0
200
400
600
800
1000
1200
1400
1600
1800
2000
2011
2012
2013
2014
2015
2016
UNIVERSITIES ORDERS AND OUTPUT4 Quarter Moving Totals
Output Orders
£ million
Source: ONS
40

© Experian
UK Construction Forecast
Summer 2016 Volume 22: Issue 3
located on its Waterside Campus in the town centre. Work on the £53m scheme is expected to begin in 2018 and finish before the end of the same year.
Queen Margaret University in East Lothian, Scotland is to build a new innovation hub on its Musselburgh campus. The 5,000 square-foot facility is still in design
stages, nevertheless work is expected to begin in early 2017. The project should be completed in 2019.
Imperial College London is to build a new 13-storey
biomedical engineering research hub on its White City Campus. The new facility will house a number of research laboratories, an outpatient clinic, a 150-seat
auditorium and a number of open spaces. Funding for the £40m project was provided by alumnus Michael Uren OBE and his foundation. Work is due to begin
imminently, and ought to be completed before 2019.
The University of Cambridge has gained permission for ‘Project Capella’, a £79m research facility, to be
delivered by Kier. The new six-storey laboratory will be situated next to the Cancer Research UK Cambridge Institute, within the Cambridge Biomedical
Campus. Work on the project is expected to start soon and finish in the first half of 2018.
Outlook The outlook for the schools and colleges sub-sector is
quite positive, especially in the latter half of the forecast period. However, should the government reduce its current spending commitment it would have
negative implications for growth towards 2018.
Performance is likely to be more mixed is the universities sub-sector. Orders declined sharply last
year and that is expected to lead to a fall in activity in the early part of the forecast period. The latter half should see a return to growth as output gains support
from a couple of large campus projects, namely those for UCL and the University of Glasgow.
Other sub-sectors
Output & orders Output in the offices sub-sector returned to growth after four-successive annual declines, with a 10 per cent rise to £526m.
In the first three months of the year output totalled £147m, down 3 per cent on the previous quarter, yet
39 per cent above its total for the same period of 2015. On a four-quarter moving total basis output increased for the fourth consecutive quarter in the
three months to March 2016.
Offices orders edged down by 1 per cent year-on-year in 2015 to £510m on a current price basis.
At £138m, orders in the first quarter of the year were up 7 per cent on the previous quarter, and double their level for the same period of the previous year.
On a four-quarter moving total basis orders strengthened in the first quarter of this year.
After strengthening in 2014 entertainment output declined by 13 per cent to £752m in 2015 in current price terms.
The downtrend was also evident in the first three months of the year, as output fell heavily on a quarterly and annual basis to £134m. On a four-
quarter moving total basis output fell for its fourth consecutive quarter in the three months to March 2016.
0
200
400
600
800
1000
1200
2011
2012
2013
2014
2015
2016
Output Orders
£ million
OFFICES ORDERS AND OUTPUT4 Quarter Moving Totals
Source: ONS
0
200
400
600
800
1000
1200
1400
2011
2012
2013
2014
2015
2016
ENTERTAINMENT ORDERS AND OUTPUT4 Quarter Moving Totals
Output Orders
£ million
Source: ONS
41

© Experian
UK Construction Forecast
Summer 2016 Volume 22: Issue 3
After two successive annual increases orders in the entertainment sub-sector in 2015 were down 48 per cent to £431m, their lowest total since 1996 on a
current price basis.
The decline continued in the first three months of the year as orders fell on a quarterly and annual basis to
£94m. Orders were similarly bearish on a four-quarter moving total basis, after posting their eighth successive quarterly fall.
The ‘other’ sub-sector includes factories, warehouses, oil, steel, coal, garages, shops, agriculture and miscellaneous building. Output in this sector fell by 5
per cent in 2015 to £1.51bn.
At £279m output in this sector continued to decline in the first three months of the year, with respective
quarterly and annual falls of 19 per cent and 25 per cent. On a four-quarter moving total basis output contracted for its third successive quarter in the three
months to March 2016.
At £841m, new orders in the ‘other’ sector in 2015 reached their lowest total on record after almost
halving on an annual basis.
Orders remained weak in the first three months of 2016. At £141m they were down notably on the
previous quarter and also on the same period of 2015. On a four-quarter moving total basis orders weakened for the fifth successive quarter in the first three months
of the year.
Drivers A new engineering and training facility is to be built at RAF Marham in Norfolk. The site will be used to develop the UK’s first F-35 Lightning II aircraft in
2018. The project involves the construction of a
training centre, logistics operation centre and maintenance and finishing hanger. Work on the £83m project is expected to start soon and finish by the end
of the forecast period.
Work is scheduled to commence towards the end of the year on a series of new military buildings on
Salisbury Plain, Wiltshire. The £136m project will take place as part of the Army Basing Programme (ABP), and it should be completed before 2018.
New military accommodation buildings are to be built at Thorney Island in West Sussex, Dishforth near Thirsk and South Cerney in Gloucestershre as part of
the ABP. Work on these £30m developments should begin soon and carry on for two years.
Work ought to begin in the first half of 2017 on a new
sports & leisure complex on Eastern Road, Brighton. The project will require the demolition of the existing sports hall, as well as a number of adjacent buildings.
The £40, 4-storey building ought to be completed before the end of 2018.
Gurnell Leisure Centre in Ealing, West London is to
undergo a significant extension. The £33m development will include a new swimming pool, sports hall and gym. Work should begin very soon and be
completed before the end of next year.
Galliford Try has been given the go-ahead for £25m expansion to HMP Rye Hill in Northamptonshire. The
plans include a two-storey 356-bed housing block, as well as an extension to the existing gymnasium building. The new wing is would almost double the
facility’s current capacity.
Outlook Neither the entertainment nor miscellaneous sub-sectors are expected to perform particularly well over
the forecast period. The former is set to post successive declines in each year of the forecast period. Much of the expected weakness stems from a
collapse in new orders in 2015 and a lack of notable drivers in the government construction pipeline. The latter’s performance is predicted to be similarly weak
in the short-term before growth returns in the latter half of the forecast period. Some of the upside can be attributed to notable investment into defence estates
as part of the of the Ministry of Defence’s rebasing plan. Offices ought to do quite will in the near term,
0
500
1000
1500
2000
2500
2011
2012
2013
2014
2015
2016
OTHER ORDERS AND OUTPUT4 Quarter Moving Totals
Output Orders
£ million
Source: ONS
42

© Experian
UK Construction Forecast
Summer 2016 Volume 22: Issue 3
although growth in the latter part of the forecast period is less certain.
Factories, 1%
Schools and Colleges, 41%
Universities, 15%
Health, 17%
Offices, 5%
Entertainment, 7%
Garages, shops, 2%
Agric., Miscellaneous, 12%
SHARE OF PUBLIC NON‐RESIDENTIAL OUTPUT BY SUB SECTOR, 2015
Source: ONS
Factories, warehouses, oil, st 170 210 142 53 73 17 12 9 29 18 17 27
Schools and Colleges 4278 3479 3301 3805 3480 1064 845 803 1067 842 768 748
Universities 718 756 1522 1699 924 457 245 319 70 316 219 310
Health 1331 1296 1979 1432 1609 189 481 538 297 328 446 236
Offices 554 804 285 516 510 49 133 64 148 169 129 138
Entertainment 685 585 635 825 431 180 154 171 78 69 113 94
Garages, Shops 55 92 131 232 143 28 93 24 31 55 33 34
Agric., Miscellaneous 1274 806 1067 1280 625 388 228 178 112 221 114 80
Total 9065 8028 9062 9841 9842 2372 2191 2105 1831 2017 1840 1668
Source: ONS.
Q4 2016 Q120152012
Value Of Orders Obtained By Contractors – New Work For The Public Sector £ million current prices
2011 Q4 Q32013 2014 2015 Q1 Q2Q3
Factories 103 113 63 84 67 23 19 15 16 18 18 19
Warehouses 20 22 38 28 8 7 4 2 2 2 2 2
Oil, Steel & Coal 8 60 37 8 6 2 2 2 2 1 1 0
Schools and Colleges 6358 4970 4238 3909 4279 1066 1025 906 1035 1198 1140 1022
Universities 1239 902 1217 1795 1594 514 485 407 410 419 358 302
Health 2008 1673 1974 1713 1762 446 398 357 420 495 490 443
Offices 868 779 763 478 526 127 120 106 122 147 151 147
Entertainment 1105 836 717 868 752 244 225 191 198 198 165 134
Garages, shops 163 77 143 179 212 48 48 45 51 60 56 49
Agric., Miscellaneous 1441 1368 1036 1293 1212 370 361 308 315 321 268 209
Total 13311 10797 10227 10361 10416 2848 2690 2340 2569 2859 2648 2327
Note: These figures do not include work undertaken by Direct Labour Organisations (DLOs).
Source: ONS.
Q4 2016 Q1
Value Of Output Obtained By Contractors – New Work For The Public Sector £ million current prices
2013 Q3 Q4 Q32014 2015 Q1 Q2201520122011
43

© Experian
UK Construction Forecast
Summer 2016 Volume 22: Issue 3
6 Industrial construction
Summary
Industrial construction output increased for second successive year in 2015 with a 10 per cent rise to £4.33bn in 2012 prices. However, activity was far less
buoyant in the first quarter of this year, falling 15 per cent on the previous quarter and also 7 per cent on the same period of 2015 to total £919m. On a four-
quarter moving total basis output fell in the three months to March 2016 after seven successive quarters of growth.
Orders also had a productive 2015, after posting their fourth successive annual increase to £4.33bn, their highest total since 2007. Performance was more
mixed in the first quarter of this year. At £1.01bn orders had progressed on the previous quarter but remained below their level for the same three months
of last year. On a four-quarter moving total basis orders eased for the second consecutive quarter in the three months to March 2016.
Output performance in 2015 at the sub-sector level was positive for both warehouses and factories. The former increased by 33 per cent to £2.24bn, and the
latter by 10 per cent to £2.56bn.
Growth was far less buoyant in the first quarter of this year, as output for both factories and warehouses fell
sharply on the previous quarter and also on the same period 2015.
New orders growth was strong at the sub-sector level
in 2015 for both factories and warehouses. The former posted its fifth successive annual increase to £2.77bn. The latter achieved a larger gain to reach £2.21bn.
Factories orders in the first quarter were up on
quarterly and annual basis, while the opposite is true for warehouses.
Prospects for the UK economy have weakened in
recent months as uncertainties notably on the domestic front have mounted. Meanwhile the global economy remains very weak with little improvement
likely in 2016. Thus net trade will be a drag on UK economic expansion for several more quarters.
This was one of the factors which led to a downgrade
in our forecasts for the industrial sector, the other was a notable downturn in orders for warehouses in the first three months of this year.
Warehouses have driven growth in the sector over the last two years, although weakening new orders and output in the first quarter of this year suggests that the
sector cannot sustain its current level of output. However, the pipeline of new work remains solid, and requirement for new storage and distribution facilities
isn’t likely to ease a great deal over the current forecast period, hence we should see the sub-sector return to growth towards 2018.
Factories on the other hand are set to maintain their current level of activity over the forecast period, thus remaining the larger of the two key sub-sectors.
The near-term downturn in warehouses activity will most likely drive a decline in overall activity for the industrial sector in 2016, before returning to growth in
2017 and 2018. The sector as a whole does remain particularly sensitive to further global economic slowdown, hence there’s more downside than upside
risk for industrial construction in the medium term.
2011 2012 2013 2014 2015 2016 2017 2018
£ million (2012 prices) 3476 3718 3438 3920 4328 4025 4106 4188
Annual % Change -9.4 7.0 -7.5 14.0 10.4 -7 2 2
Source: ONS and Experian.
Private Industrial Construction Output Forecasts
44

© Experian
UK Construction Forecast
Summer 2016 Volume 22: Issue 3
Sector Overview
Output & orders Industrial output strengthened for the second successive year in 2015, with a 10 per cent increase
to £4.33bn (2012 prices).
In the first three months of the year output stood at £919m, down on a quarterly and annual basis by 15
per cent and 14 per cent respectively. On a four-quarter moving total basis output ticked downwards in the three months to March 2016 after seven
successive quarters of expansion.
Total industrial orders increased for the fourth successive year in 2015. At £4.33bn they reached
their highest level since 2007.
Growth was more mixed in the first three months of this year. At £1.01bn output was up 6 per cent on the
previous quarter, yet 8 per cent below its level for the same period of the previous year. On a four-quarter moving total basis orders trended downwards for two
successive quarters in the three months to March 2016.
Drivers GDP growth slowed to 0.4 per cent quarter-on-quarter
in the first quarter of 2016, from 0.6 per cent in the previous three months. In the latest quarter, two of the four main industrial groupings showed growth, notably
the service sector, where output rose by 0.6 per cent continuing to underpin overall expansion.
Both the manufacturing and transport and storage sectors experienced an increase in GVA in 2015. The former is expected to contract towards 2018, while the
latter ought to achieve successive expansions, albeit at progressively slower rates.
The latest release from the Office for National
Statistics (ONS) showed retail sales increased by 1.3 per cent month-on-month in April. The ONS also significantly revised up March’s retail sales figures
from -1.3 per cent to -0.5 per cent. Comparing the three-months to April with the previous three months, growth eased to 0.3 per cent, but this largely reflects
the declines seen in February and March.
Weaker economic activity, low inflation, and still tolerable rises in wage costs point to no early rise in
official rates. The latest published vote of the Monetary Policy Committee was unanimous to leave Bank rate at 0.5 per cent. We expect the first rise, a
25 basis point increase, to take place sometime in 2017.
The Markit Eurozone PMI Composite Output Index
reached 53.1 in May, slightly higher than the previous month’s reading. The index has remained quite steady over the last quarter, reflecting economic stagnation in
the Eurozone.
Meanwhile the Markit/CIPS UK Manufacturing Index stood at 50.1 in May, marginally above the no-change
mark, having improved from its posting of 49.4 in the previous month. Domestic demand remains key for the manufacturing sector in the face of easing global
demand. Uncertainty leading up to the EU referendum vote appears to also to have weighed on investment. However, this could change significantly through the
remainder of the year.
2011 2069 -3.8 3476 -9.4
2012 2480 19.9 3718 7.0
2013 3257 31.3 3438 -7.5
2014 3476 6.7 3920 14.0
2015 4333 24.7 4328 10.4
2014 Q3 555 -33.8 1003 19.5
Q4 1017 -10.0 989 20.3
2015 Q1 1100 13.6 1067 15.9
Q2 1155 23.4 1049 4.2
Q3 1125 102.7 1138 13.5
Q4 954 -6.2 1075 8.7
2016 Q1 1014 -7.8 919 -13.9
Source: ONS.
Private Industrial Construction Orders & Output
% change y-on-y
% change y-on-y
£ million (2012 prices)
Orders Output
£ million (2005 prices)
Factories56%
Warehouses40%
Oil, Steel & Coal4%
SHARE OF PRIVATE INDUSTRIAL OUTPUT BY SUB SECTOR, 2015
Source: ONS
45

© Experian
UK Construction Forecast
Summer 2016 Volume 22: Issue 3
Outlook Our outlook for the industrial sector has been downgraded since the spring, particularly in the short term. The primary driver of this was a downturn in new
orders for the warehouses sub-sector early this year. Weaker forecasts towards 2018 can be attributed to a downgrade in expectations in the wider economy.
Global growth is slowing and demand from China and the Eurozone is less certain. Falling exports would be particularly bearish for the factories sub-sector.
However, warehouses are not immune to this. Should consumer sentiment and spending begin to reflect the trend in global activity we could see notable
reductions in the requirement for new warehouse units.
Factories
Output & orders Output in the factories sub-sector posted its fourth successive annual increase in 2015, after rising by 10
per cent to £2.56bn (current prices).
Activity was less buoyant in the first three months of the year, after falling on a quarterly and annual
measure to £562m. On a four-quarter moving total basis activity posted its first quarterly fall after seven successive quarters of growth in the three months to
March 2016.
Total new orders for factories strengthened for their fifth successive year in 2015. At £2.77bn they reached
their highest level since 2007.
Orders were also buoyant in the first quarter of the year. At £685m they were up 15 per cent on the previous quarter and also 5 per cent higher than in the
corresponding three months of 2015. On a four-quarter moving total basis new orders posted their third successive quarterly gain in the three months to
March 2016.
Drivers Work recently began on a fish processing facility in Argyll and Bute, Scotland. The £20m unit should be completed by 2019.
The end of 2016 should see the start of work on a potato processing factory in North Lanarkshire, Scotland. The £25m facility should be completed by
late 2017.
Outlook Despite playing second fiddle to warehouses in terms of output growth over the last two years factories have
maintained their position as the largest sub-sector. This is likely to continue over the forecast period given that the level of new orders has been robust. It’s
difficult to single out individual drivers to growth which suggests that the expansion over the forecast period will be driven by numerous small-scale projects.
Warehouses
Output & orders Output in the warehouses sub-sector increased for the second successive year in 2015, with a 33 per cent
rise to £2.24bn.
Activity was far less buoyant in the first three months of this year after falling heavily on a quarterly and
1000
1500
2000
2500
3000
3500
4000
4500
2011 2012 2013 2014 2015 2016 2017 2018
Output Orders
PRIVATE INDUSTRIAL ORDERS (2005 PRICES, £M) AND OUTPUT (2012 PRICES, £M)
Source: ONS, Experian
500
1000
1500
2000
2500
3000
2011
2012
2013
2014
2015
2016
FACTORIES ORDERS AND OUTPUT4 Quarter Moving Totals
Output Orders
£ million
Source: ONS
46

© Experian
UK Construction Forecast
Summer 2016 Volume 22: Issue 3
annual basis to £417m (current prices). On a four-quarter moving total basis activity in the three months to March 2016 posted its first quarterly decline since
the third quarter of 2013.
After an uneventful 2014, new warehouse orders increased by 41 per cent in 2015 to £2.21bn.
Orders were significantly less buoyant in the first quarter of this year. At £456m they were down 4 per cent on the previous three months and 18 per cent on
the same period a year earlier. On a four-quarter moving total basis orders eased for the second successive quarter in the three months to March
2016.
Drivers Work recently began on a 47,000 square metre distribution facility in Felixstowe, Suffolk. The project is estimated to cost £100m, and work should be
finished by late 2017.
A 100,000 square metre storage and distribution facility is to be built in Bittesby, Leicestershire, on land
adjacent to Magna Park. Work on the £90m facility should begin very soon and be completed before the end of this year.
Work is soon to commence on the regeneration of London Road Industrial Estate in Newbury, Berkshire. The project will involve the demolition of some of the
existing buildings. The £125m redevelopment ought to be completed in early 2018.
Later this year should see the commencement of work on a new industrial development on land near to the A127 near Brentwood, Essex. The project includes a
number of B1, B2 and B8 units, up to a size of 92,000 square metres per unit. The £76m facility ought to be completed by late 2018.
Outlook Our outlook for the warehouses sub-sector is notably less positive in the near term than it was in the spring. The primary driver for the downgrade in expectations
is the sharp decline in new orders in the first quarter of 2016. This comes after a period of rapid expansion in both orders and output, driven by strong consumer
demand. That in turn fuelled the requirement for new storage and distribution facilities, coinciding with the continued expansion of online retail. Nevertheless,
after overcoming initial weakness warehouses should return to growth in the latter part of the forecast period, given that consumer spending isn’t likely to
slow down significantly any time soon.
500
700
900
1100
1300
1500
1700
1900
2100
2300
2500
2011
2012
2013
2014
2015
2016
WAREHOUSES ORDERS AND OUTPUT4 Quarter Moving Totals
Output Orders
£ million
Source: ONS
2011 1687 1355 322 3365
2012 2082 1300 339 3723
2013 2154 1117 269 3538
2014 2334 1685 182 4202
2015 2559 2240 18 4816
2014 Q3 662 423 38 1123
Q4 602 421 19 1042
2015 Q1 617 508 11 1135
Q2 601 571 1 1173
Q3 689 627 2 1318
Q4 652 534 4 1190
2016 Q1 562 417 4 983
Source: ONS.
Value Of New Industrial Output £ million current prices
Oil, Steel & Coal
Total IndustrialFactories Warehouses
47

© Experian
UK Construction Forecast
Summer 2016 Volume 22: Issue 3
7 Private Commercial Construction
Summary
Last year proved to be a disappointing one for the commercial construction sector with output growth slipping back into negative territory after quite a good
year in 2014.
Despite a steady recovery in office and leisure construction since their respective nadirs in the
aftermath of the 2008/09 recession, total commercial construction activity remained nearly 30 per cent below its 2008 peak in 2015 in real terms.
Growth last year was centred in the offices, education and health sub-sectors, with the remainder experiencing contraction.
New orders for commercial construction fell by 4 per cent in 2015 to £14.4bn in 2005 prices after two years of growth. However, they rose strongly at the end of
last year and have remained buoyant in the first quarter of 2016, which has led to two quarters of annualised growth, to £14.8bn in 2005 prices in the
first quarter of this year.
Commercial construction output is expected to return to growth this year and expand during the whole of the
forecast period, but at a slower rate than forecast in the winter and spring. Total commercial construction output is projected to reach £26.2bn (2012 prices) in
2018, a 10 per cent increase in real terms on its 2015 level, but still 21 per cent below its 2008 peak.
Growth in the sectors that drive demand for office
premises is expected to be good over the next three years with both the information & communication and finance & insurance sectors expanding by more than
3 per cent a year on average, with professional & other private services a little below 3 per cent. Thus
we believe that the offices sub-sector will continue to be one of the main drivers of commercial construction output, although the geographical focus of expansion
could shift from London, where the development cycle may be peaking, to the main regional centres.
The prospects for retail construction continue to be
poor. Latest figures show the traditional food retailers are continuing to lose market share to the discounters and store footfall has been disappointing despite
overall growth in retail sales. Thus despite our upbeat prognosis for consumer spending it is difficult to see where the pressure for growth in retail space will
come from.
The leisure sub-sector should return to modest expansion this year on the back of strong
performances in the cinema, restaurant and health & fitness arenas, as well as a number of significant sports stadia projects, such as that for Tottenham
Hotspur FC. The timescale for the £2bn Paramount Park scheme suggest that it will not now start until 2018, but it could drive quite strong growth in the sub-
sector in that year.
Work should build up over the forecast period under the Priority School Building Programme (PSBP), most
of which is privately funded, and this combined with the targets set in the Autumn Statement for another 500 new free schools and 600,000 new school places
should help to drive steady growth in the education sub-sector over the forecast period.
The prospects for privately-funded health construction
are weaker, with little change in the currently very small pipeline of PF2 projects likely over the forecast period.
2011 2012 2013 2014 2015 2016 2017 2018
£ million (2012 prices) 25101 22485 22593 24017 23766 24241 24969 26217
Annual % Change 2.4 -10.4 0.5 6.3 -1.0 2 3 5
Source: ONS and Experian.
Private Commercial Construction Output Forecasts
48

© Experian
UK Construction Forecast
Summer 2016 Volume 22: Issue 3
Sector Overview
Output & orders Having finally shown some decent growth in 2014 in real terms for the first time since the 2008/09
recession, expansion in the commercial construction sector stalled again last year. Output totalled £23.77bn in 2012 prices in 2015, a 1 per cent decline
on the previous year. While total construction output last year was only 2 per cent below its peak level in 2007, commercial construction output was 29 per cent
down on its 2008 high.
Output in the first quarter of this year reached £5.96bn, the same as in the previous quarter and 1
per cent higher than in the same period the previous year. On a four-quarter moving total basis output has been largely static for the past five quarters.
On a current price basis commercial construction output was up by a little over 3 per cent in 2015, implying inflation in the sector of around 4 per cent.
Growth was centred in the offices, health and education sub-sectors, with retail, leisure and miscellaneous output declining. In the first quarter of
this year current price output fell across all the sub-sectors on a quarter-on-quarter basis, with the health, retail and miscellaneous sub-sectors the weakest.
New orders for the sector reached £14.36bn in 2005 prices in 2015, a 4 per cent decline after two years of growth. They remain less than half their peak level in
2006.
In the first quarter of this year they totalled £4.05bn in 2005 prices, a 2 per cent fall on the previous quarter.
However, on a four-quarter moving total basis they rose by 3 per cent in the first quarter of this year, the second consecutive increase after two quarters of
decline.
On a current price basis they were only down by 1 per cent with the retail and miscellaneous sub-sectors
being the main drags on their level. In the first quarter of this year they were flat, but this disguised very variable sub-sector performance, with good growth in
the education and health sub-sectors, but a sharp decline in the level of new orders in the leisure one, albeit after a strong fourth quarter of 2015.
Drivers Office, retail and leisure construction are driven in the
main by the wider economic environment, corporate profitability and levels of consumer confidence and spending. Public capital investment, and the share
delivered through privately-financed routes, is the primary driver of the health, education and miscellaneous sub-sectors.
Although growth in 2015 was well down on a very strong 2014, it still turned out to be a reasonably good year, with the final estimate for GDP expansion
coming in at 2.3 per cent, making it the second best year since 2007.
Significant components of growth last year were
household expenditure, up by 2.7 per cent in real terms and total investment, 4 per cent higher. Household expenditure growth was driven by a better
performance from average earnings coupled with historically very low inflation and interest rates, which meant that consumers saw some real increase in
disposable incomes during the course of the year.
£ million (2005 prices)
% change y-on-y
£ million (2012 prices)
% change y-on-y
2011 12897 -4.0 25101 2.4
2012 11488 -10.9 22485 -10.4
2013 12463 8.5 22593 0.5
2014 14916 19.7 24017 6.3
2015 14362 -3.7 23766 -1.0
2014 Q3 4313 43.4 5994 2.9
Q4 3780 20.5 6067 5.6
2015 Q1 3641 15.0 5923 -0.8
Q2 3204 -12.3 5995 0.1
Q3 3383 -21.6 5885 -1.8
Q4 4137 9.4 5963 -1.7
2016 Q1 4054 11.3 5964 0.7
Source: ONS.
Orders Output
Private Commercial Orders and Output
49
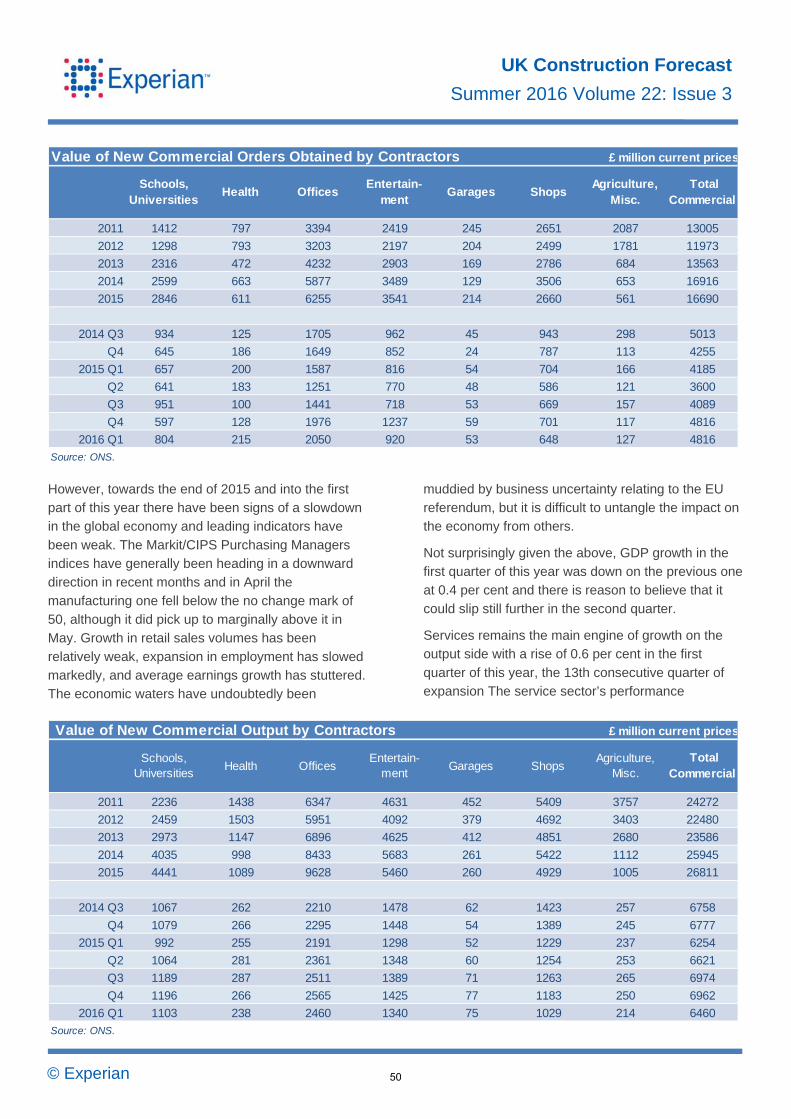
© Experian
UK Construction Forecast
Summer 2016 Volume 22: Issue 3
However, towards the end of 2015 and into the first part of this year there have been signs of a slowdown in the global economy and leading indicators have
been weak. The Markit/CIPS Purchasing Managers indices have generally been heading in a downward direction in recent months and in April the
manufacturing one fell below the no change mark of 50, although it did pick up to marginally above it in May. Growth in retail sales volumes has been
relatively weak, expansion in employment has slowed markedly, and average earnings growth has stuttered. The economic waters have undoubtedly been
muddied by business uncertainty relating to the EU referendum, but it is difficult to untangle the impact on the economy from others.
Not surprisingly given the above, GDP growth in the first quarter of this year was down on the previous one at 0.4 per cent and there is reason to believe that it
could slip still further in the second quarter.
Services remains the main engine of growth on the output side with a rise of 0.6 per cent in the first
quarter of this year, the 13th consecutive quarter of expansion The service sector’s performance
Value of New Commercial Orders Obtained by Contractors £ million current prices
2011 1412 797 3394 2419 245 2651 2087 13005
2012 1298 793 3203 2197 204 2499 1781 11973
2013 2316 472 4232 2903 169 2786 684 13563
2014 2599 663 5877 3489 129 3506 653 16916
2015 2846 611 6255 3541 214 2660 561 16690
2014 Q3 934 125 1705 962 45 943 298 5013
Q4 645 186 1649 852 24 787 113 4255
2015 Q1 657 200 1587 816 54 704 166 4185
Q2 641 183 1251 770 48 586 121 3600
Q3 951 100 1441 718 53 669 157 4089
Q4 597 128 1976 1237 59 701 117 4816
2016 Q1 804 215 2050 920 53 648 127 4816
GaragesEntertain-
mentSchools,
UniversitiesHealth
Source: ONS.
Offices Total
CommercialAgriculture,
Misc.Shops
Value of New Commercial Output by Contractors £ million current prices
2011 2236 1438 6347 4631 452 5409 3757 24272
2012 2459 1503 5951 4092 379 4692 3403 22480
2013 2973 1147 6896 4625 412 4851 2680 23586
2014 4035 998 8433 5683 261 5422 1112 25945
2015 4441 1089 9628 5460 260 4929 1005 26811
2014 Q3 1067 262 2210 1478 62 1423 257 6758
Q4 1079 266 2295 1448 54 1389 245 6777
2015 Q1 992 255 2191 1298 52 1229 237 6254
Q2 1064 281 2361 1348 60 1254 253 6621
Q3 1189 287 2511 1389 71 1263 265 6974
Q4 1196 266 2565 1425 77 1183 250 6962
2016 Q1 1103 238 2460 1340 75 1029 214 6460
Source: ONS.
Entertain-ment
Health OfficesSchools,
Universities Total
CommercialAgriculture,
Misc.ShopsGarages
50
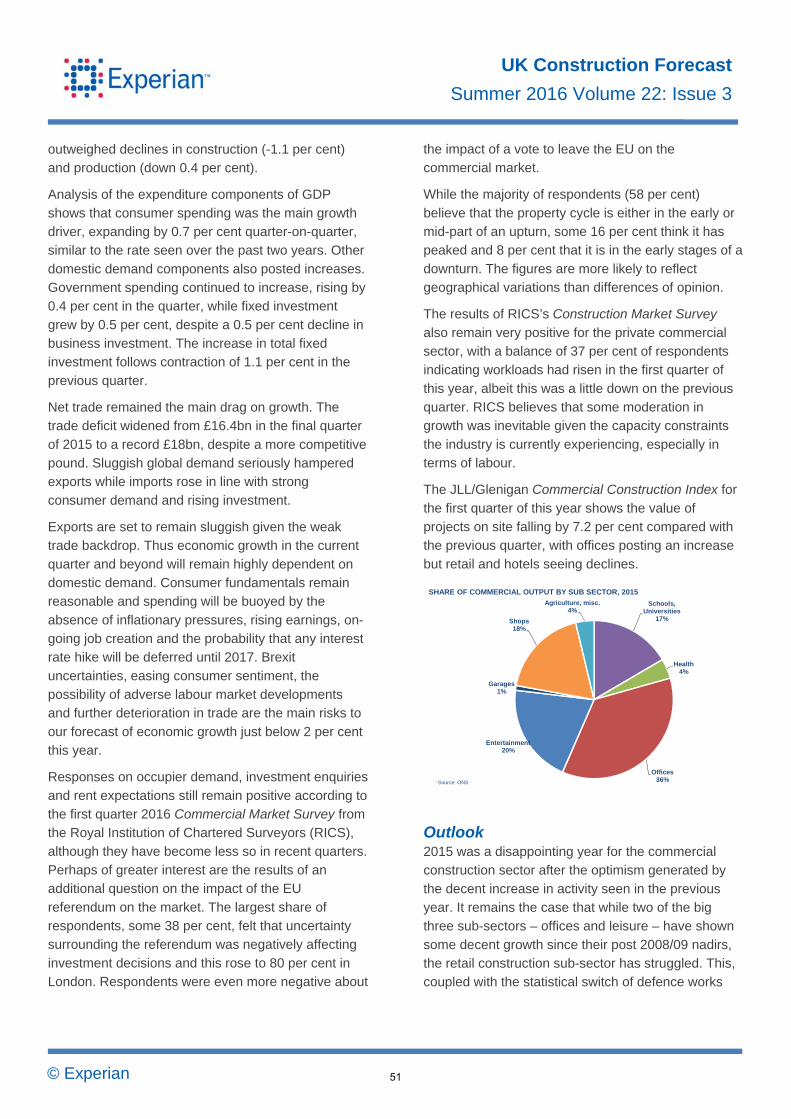
© Experian
UK Construction Forecast
Summer 2016 Volume 22: Issue 3
outweighed declines in construction (-1.1 per cent) and production (down 0.4 per cent).
Analysis of the expenditure components of GDP
shows that consumer spending was the main growth driver, expanding by 0.7 per cent quarter-on-quarter, similar to the rate seen over the past two years. Other
domestic demand components also posted increases. Government spending continued to increase, rising by 0.4 per cent in the quarter, while fixed investment
grew by 0.5 per cent, despite a 0.5 per cent decline in business investment. The increase in total fixed investment follows contraction of 1.1 per cent in the
previous quarter.
Net trade remained the main drag on growth. The trade deficit widened from £16.4bn in the final quarter
of 2015 to a record £18bn, despite a more competitive pound. Sluggish global demand seriously hampered exports while imports rose in line with strong
consumer demand and rising investment.
Exports are set to remain sluggish given the weak trade backdrop. Thus economic growth in the current
quarter and beyond will remain highly dependent on domestic demand. Consumer fundamentals remain reasonable and spending will be buoyed by the
absence of inflationary pressures, rising earnings, on-going job creation and the probability that any interest rate hike will be deferred until 2017. Brexit
uncertainties, easing consumer sentiment, the possibility of adverse labour market developments and further deterioration in trade are the main risks to
our forecast of economic growth just below 2 per cent this year.
Responses on occupier demand, investment enquiries
and rent expectations still remain positive according to the first quarter 2016 Commercial Market Survey from the Royal Institution of Chartered Surveyors (RICS),
although they have become less so in recent quarters. Perhaps of greater interest are the results of an additional question on the impact of the EU
referendum on the market. The largest share of respondents, some 38 per cent, felt that uncertainty surrounding the referendum was negatively affecting
investment decisions and this rose to 80 per cent in London. Respondents were even more negative about
the impact of a vote to leave the EU on the commercial market.
While the majority of respondents (58 per cent)
believe that the property cycle is either in the early or mid-part of an upturn, some 16 per cent think it has peaked and 8 per cent that it is in the early stages of a
downturn. The figures are more likely to reflect geographical variations than differences of opinion.
The results of RICS’s Construction Market Survey
also remain very positive for the private commercial sector, with a balance of 37 per cent of respondents indicating workloads had risen in the first quarter of
this year, albeit this was a little down on the previous quarter. RICS believes that some moderation in growth was inevitable given the capacity constraints
the industry is currently experiencing, especially in terms of labour.
The JLL/Glenigan Commercial Construction Index for
the first quarter of this year shows the value of projects on site falling by 7.2 per cent compared with the previous quarter, with offices posting an increase
but retail and hotels seeing declines.
Outlook 2015 was a disappointing year for the commercial construction sector after the optimism generated by
the decent increase in activity seen in the previous year. It remains the case that while two of the big three sub-sectors – offices and leisure – have shown
some decent growth since their post 2008/09 nadirs, the retail construction sub-sector has struggled. This, coupled with the statistical switch of defence works
Schools, Universities
17%
Health4%
Offices36%
Entertainment20%
Garages1%
Shops18%
Agriculture, misc.4%
SHARE OF COMMERCIAL OUTPUT BY SUB SECTOR, 2015
Source: ONS
51

© Experian
UK Construction Forecast
Summer 2016 Volume 22: Issue 3
from the private to the public sector has tended to depress overall activity in the commercial sector.
Although new orders remained weak last year the
four-quarter moving total did start picking up towards the end of the year and this has continued into the first quarter of this one. Thus we are expecting to see the
sector return to growth this year, largely driven by a better performance in the leisure sub-sector and a slowdown in the decline in the retail and
miscellaneous ones.
We still support the prognosis we made in the winter/spring that the office sub-sector will remain the
most buoyant one over the forecast period, continuing the trend of the recent past, with growth in excess of 15 per cent in real terms over the period. However,
the focus of expansion in the sub-sector may shift a little from London to the main regional centres. The leisure sub-sector is also expected to experience
good growth, assuming that the £2bn Paramount Park scheme goes ahead.
At the other end of the scale, retail construction is
likely to subside still further, although the decline will take place in the early part of the forecast period before activity stabilises as the prospects for the big
food retailers in particular improve a little.
Aggregating the sub-sectors gives us a picture for commercial construction as a whole of steady growth
over the forecast period at around 3 per cent a year on average in real terms.
Offices
Output & orders Office construction output rose for a third consecutive year in 2015, by 14 per cent to £9.63bn in current
prices. The sector has expanded by 62 per cent since its nadir in 2012 but output still remains 28 per cent below its 2007 peak. In the first quarter of this year it
totalled £2.46bn, a 4 per cent fall on the previous quarter, although 12 per cent higher than in the same period of 2015.
New orders were 6 per cent up at £6.25bn in current prices last year, almost double their 2012 nadir but still less than half their 2007 peak. In the first quarter
of this year they reached £2.05bn, a 4 per cent increase on the previous quarter and the first time they had broached the £2bn mark since the second
quarter of 2008. The four-quarter moving total resumed its upward trend in the final quarter of last year after two quarters of decline and grew by 7 per
cent in the first quarter of this year.
Drivers The primary drivers of the offices market are the finance & insurance and professional & other private services sectors, and to a lesser extent information &
communications.
The outturn for these three sectors in 2015 was very different, with the information & communications one
seeing strong growth of 5.7 per cent and professional & other private services also having a good year with 3.3 per cent expansion. In contrast the finance &
insurance one contracted by 0.4 per cent. Growth is expected to be more even over the forecast period,
0
1000
2000
3000
4000
5000
6000
7000
8000
9000
10000
2011
2012
2013
2014
2015
2016
OFFICE CONSTRUCTION ORDERS AND OUTPUT4 Quarter Moving Totals
Orders Output
£ million
Source: ONS
5000
10000
15000
20000
25000
30000
2011 2012 2013 2014 2015 2016 2017 2018
COMMERCIAL ORDERS (2005 PRICE, £M) AND OUTPUT (2012 PRICES, £M)
Orders Output
Source: ONS, Experian
52

© Experian
UK Construction Forecast
Summer 2016 Volume 22: Issue 3
with a projected annual average rate of 3.7 per cent for information & communications, 3.2 per cent for finance & insurance, and 2.8 per cent for professional
& other private services. These growth rates are generally a little lower than put forward in our Spring Update as the global slowdown and EU referendum
uncertainties have taken their toll.
According to Bilfinger GVA’s Central London Office Analysis, the amount of space under construction rose
steadily last year, by 28 per cent from just over 1 million square metres in the first quarter of 2015 to over 1.3 million square metres in the fourth one.
Expansion has continued in the first quarter of 2016, with floorspace under construction reaching 1.46 million square metres, still some way off its first
quarter 2008 peak of over 2 million square metres, but well above its 10-year average of 1.15 million square metres.
The latest edition of the report, for the first quarter of this year, showed take-up stable at 2.6 million square
feet, some 8 per cent above its five-year quarterly average. The vacancy rate also remained static at 4.4 per cent, not far above its second quarter 2008 trough
of 3.9 per cent. However, Bilfinger GVA reported that new entrants to the market were scarcer than in recent quarters and believe that this is due at least in
part to uncertainty surrounding the EU referendum, and to a lesser extent, the Mayoral election. It expects the market to remain quieter until June, but some pent
up demand may be released post the referendum.
Around 740,000 square feet of development was completed in the first quarter of this year, but this was
far exceeded by 1.7 million square feet started, well above the 1.2 million square feet commenced in the
previous quarter. The largest project started in the first quarter of this year was Canary Wharf Group’s 1 Bank Street project, which will deliver nearly 700,000
square feet of new space by early 2019. The developer also has plans for a similar sized scheme at 10 Bank Street, which currently has outline planning
consent.
In the March 2016 Budget, the government agreed in principle to transfer selected land at Old Oak in west
London to the Old Oak and Park Royal Development Corporation (OPDC). That will give OPDC full planning and development control to drive forward
what could be the UK's largest regeneration site with plans for 25,500 homes and 65,000 jobs. However, government adviser and urban planner Sir Terry
Farrell recently commented that the rush to complete Crossrail will mean that much of the development cannot take place. This is because engineers working
on Crossrail are not making space for the pilings that would support construction of offices, homes, shops and restaurants on decking over the lines. This could
affect the 12,000 homes planned for the south side of the Grand Union Canal and the redevelopment of the Cargiant site.
Take-up has continued to roar ahead in the regional office markets according to Bilfinger GVA’s Big Nine report, reaching 2.3 million square feet in the first
quarter of this year, 13 per cent above the five-year quarterly average. Take-up was particularly strong in the Birmingham, Bristol, Edinburgh and Glasgow
markets, with Birmingham, Edinburgh and Glasgow all experiencing their highest level of take-up for five years on a quarterly basis. This has inevitably
tightened the availability of grade A space still further and is driving a high level of pre-lets in new schemes.
The majority of the space has already been pre-let at
HFD Group’s 180,000 square feet development at 122 Waterloo Street in Glasgow, which started earlier this year, while PwC have taken 90,000 square feet at
One Chamberlain Square, part of the Paradise Birmingham regeneration scheme, and are scheduled to move there in early 2019.
Outlook We have no substantive reason to change our view from the winter/spring that office construction output
0
500
1000
1500
2000
2500
2008 Q1
2008 Q2
2008 Q3
2008 Q4
2009 Q1
2009 Q2
2009 Q3
2009 Q4
2010 Q1
2010 Q2
2010 Q3
2011 Q1
2011 Q2
2011 Q3
2011 Q4
2012 Q1
2012 Q2
2012 Q3
2012 Q4
2013 Q1
2013 Q2
2013 Q3
2013 Q4
2014 Q1
2014 Q2
2014 Q3
2014 Q4
2015 Q1
2015 Q2
2015 Q3
2015 Q4
2016 Q1
Squ
are
Met
res
(000
s)
CENTRAL LONDON OFFICE SPACE UNDER CONSTRUCTION
Source: Bilfinger GVA.
53
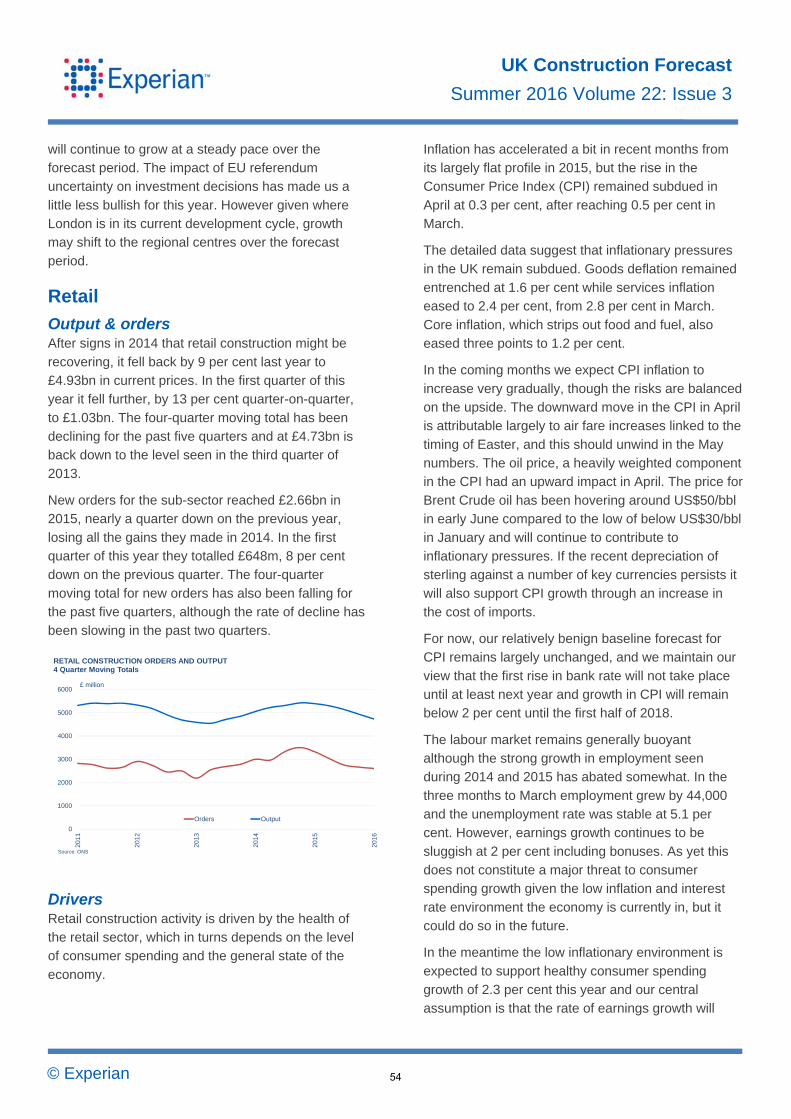
© Experian
UK Construction Forecast
Summer 2016 Volume 22: Issue 3
will continue to grow at a steady pace over the forecast period. The impact of EU referendum uncertainty on investment decisions has made us a
little less bullish for this year. However given where London is in its current development cycle, growth may shift to the regional centres over the forecast
period.
Retail
Output & orders After signs in 2014 that retail construction might be
recovering, it fell back by 9 per cent last year to £4.93bn in current prices. In the first quarter of this year it fell further, by 13 per cent quarter-on-quarter,
to £1.03bn. The four-quarter moving total has been declining for the past five quarters and at £4.73bn is back down to the level seen in the third quarter of
2013.
New orders for the sub-sector reached £2.66bn in 2015, nearly a quarter down on the previous year,
losing all the gains they made in 2014. In the first quarter of this year they totalled £648m, 8 per cent down on the previous quarter. The four-quarter
moving total for new orders has also been falling for the past five quarters, although the rate of decline has been slowing in the past two quarters.
Drivers Retail construction activity is driven by the health of the retail sector, which in turns depends on the level of consumer spending and the general state of the
economy.
Inflation has accelerated a bit in recent months from its largely flat profile in 2015, but the rise in the Consumer Price Index (CPI) remained subdued in
April at 0.3 per cent, after reaching 0.5 per cent in March.
The detailed data suggest that inflationary pressures
in the UK remain subdued. Goods deflation remained entrenched at 1.6 per cent while services inflation eased to 2.4 per cent, from 2.8 per cent in March.
Core inflation, which strips out food and fuel, also eased three points to 1.2 per cent.
In the coming months we expect CPI inflation to
increase very gradually, though the risks are balanced on the upside. The downward move in the CPI in April is attributable largely to air fare increases linked to the
timing of Easter, and this should unwind in the May numbers. The oil price, a heavily weighted component in the CPI had an upward impact in April. The price for
Brent Crude oil has been hovering around US$50/bbl in early June compared to the low of below US$30/bbl in January and will continue to contribute to
inflationary pressures. If the recent depreciation of sterling against a number of key currencies persists it will also support CPI growth through an increase in
the cost of imports.
For now, our relatively benign baseline forecast for CPI remains largely unchanged, and we maintain our
view that the first rise in bank rate will not take place until at least next year and growth in CPI will remain below 2 per cent until the first half of 2018.
The labour market remains generally buoyant although the strong growth in employment seen during 2014 and 2015 has abated somewhat. In the
three months to March employment grew by 44,000 and the unemployment rate was stable at 5.1 per cent. However, earnings growth continues to be
sluggish at 2 per cent including bonuses. As yet this does not constitute a major threat to consumer spending growth given the low inflation and interest
rate environment the economy is currently in, but it could do so in the future.
In the meantime the low inflationary environment is
expected to support healthy consumer spending growth of 2.3 per cent this year and our central assumption is that the rate of earnings growth will
0
1000
2000
3000
4000
5000
6000
2011
2012
2013
2014
2015
2016
RETAIL CONSTRUCTION ORDERS AND OUTPUT4 Quarter Moving Totals
Orders Output
£ million
Source: ONS
54

© Experian
UK Construction Forecast
Summer 2016 Volume 22: Issue 3
improve compensating for the inevitable rises in inflation and interest rates over the next three years. Thus consumer spending growth is projected to
remain reasonably robust at around 2.2 per cent to 2.3 per cent over the remainder of the forecast period.
This scenario should support a reasonable level of
retail sales growth, projected at around 3 per cent for this year and 2.5 per cent for each of the following two years in volume terms.
The May retail sales release from the ONS showed growth of 1.3 per cent month-on-month in April, and an upward revision of March’s figures. On the more
meaningful three-month on three-month comparison, sales volumes were up only a modest 0.3 per cent in the three months to April, however on an annualised
basis they were 3.7 per cent higher.
After a long period of underperformance, predominantly food stores have seen volume growth
pick up in the last six months. Gains in the three-month on three-month measure have averaged 1.2 per cent this year, a healthy outturn. Growth of 3.7 per
cent in the year to February – April builds on gains of 3.8 per cent reported on this measure in February and March. The last time this sector of the retail industry
saw growth at this rate was in November 2004. While the performance of individual grocers has been patchy, with the many of the traditionally players
continuing to lose market share to the discounters, this could presage better prospects for investment in the sector.
The Croydon Partnership, a joint venture between Westfield and Hammerson, is continuing to develop
the scheme design for the £1bn redevelopment of Croydon town centre and has commenced land assembly. It now looks like construction on the project
will start next year with completion due in 2020.
A £200m extension to the Union Square shopping centre in Aberdeen is planned and will include a new
hotel and enhanced retail and leisure facilities. Subject to planning approval work should start on the project in 2017.
Work recently got underway on the town centre redevelopment of Sittingbourne in Kent. The plans include a new cinema, retail space and health centre.
The £110m scheme should be completed by 2020.
Work has now commenced on the £200m Talbot Green town centre project in Wales, a mixed use
development including office, retail and leisure facilities to support the recent growth of new residential building in the area.
Leeds City Council has approved plans for a £400m mixed-use scheme at Thorpe Park. The 1.3 million square foot project will include nearly 200,000 square
feet of retail space. Next have recently committed to anchoring the retail element of the project.
Outlook Given the recent weakness of new orders and output
the prospects for any increase in retail construction in the short term look poor and the situation has been worsened by the relatively poor economic
performance in the early part of this year. Thus the fall in output this year is likely to be sharper than that forecast in the winter/spring, and little change is
expected thereafter.
Leisure
Orders & output After two years of good growth leisure construction
output fell back by 4 per cent in 2015 to £5.46bn in current prices. In the first quarter of this year it totalled £1.34bn, 6 per cent down on the previous quarter.
However, the four-quarter moving total ticked up marginally after four quarters of decline.
-6
-4
-2
0
2
4
6
8
10
12
Jan-
08
Apr
-08
Jul-0
8
Oct
-08
Jan-
09
Apr
-09
Jul-0
9
Oct
-09
Jan-
10
Apr
-10
Jul-1
0
Oct
-10
Jan-
11
Apr
-11
Jul-1
1
Oct
-11
Jan-
12
Apr
-12
Jul-1
2
Oct
-12
Jan-
13
Apr
-13
Jul-1
3
Oct
-13
Jan-
14
Apr
-14
Jul-1
4
Oct
-14
Jan-
15
Apr
-15
Jul-1
5
Oct
-15
Jan-
16
Apr
-16
%
ANNUAL GROWTH IN RETAIL SALES AND CONSUMER CREDIT
Consumer Credit Retail Sales Volume
Source: ONS, Bank of England.
55
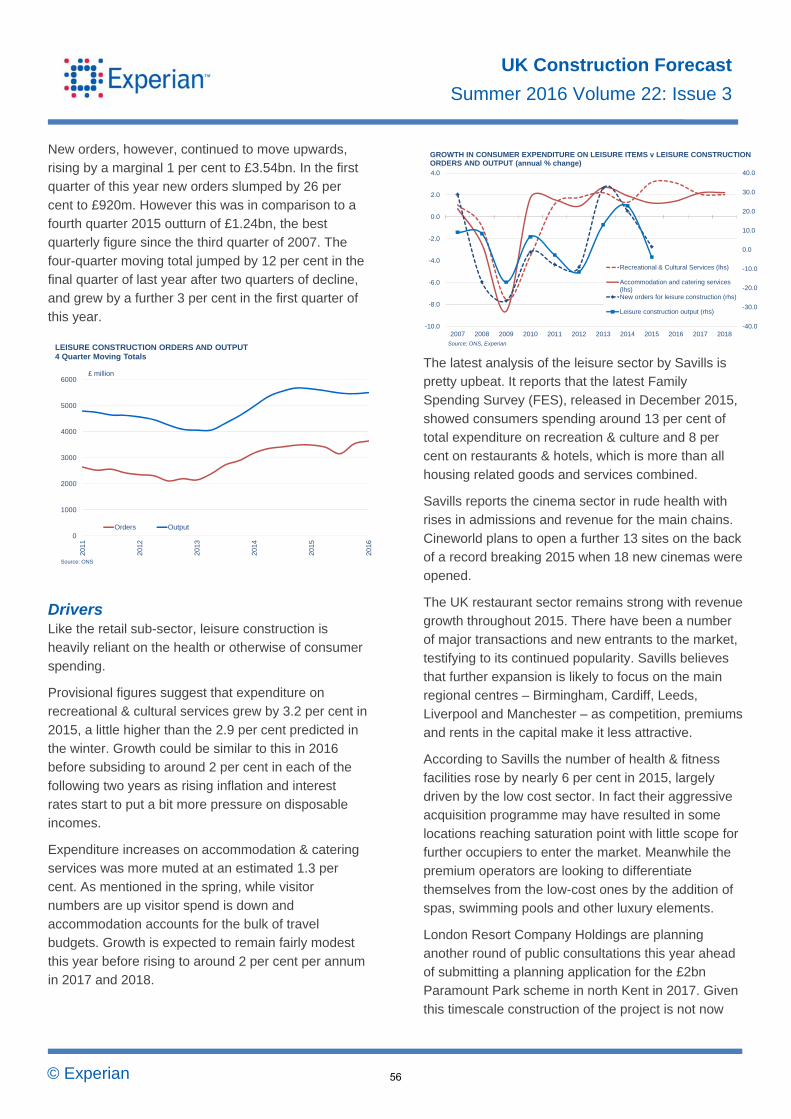
© Experian
UK Construction Forecast
Summer 2016 Volume 22: Issue 3
New orders, however, continued to move upwards, rising by a marginal 1 per cent to £3.54bn. In the first quarter of this year new orders slumped by 26 per
cent to £920m. However this was in comparison to a fourth quarter 2015 outturn of £1.24bn, the best quarterly figure since the third quarter of 2007. The
four-quarter moving total jumped by 12 per cent in the final quarter of last year after two quarters of decline, and grew by a further 3 per cent in the first quarter of
this year.
Drivers Like the retail sub-sector, leisure construction is heavily reliant on the health or otherwise of consumer
spending.
Provisional figures suggest that expenditure on recreational & cultural services grew by 3.2 per cent in
2015, a little higher than the 2.9 per cent predicted in the winter. Growth could be similar to this in 2016 before subsiding to around 2 per cent in each of the
following two years as rising inflation and interest rates start to put a bit more pressure on disposable incomes.
Expenditure increases on accommodation & catering services was more muted at an estimated 1.3 per cent. As mentioned in the spring, while visitor
numbers are up visitor spend is down and accommodation accounts for the bulk of travel budgets. Growth is expected to remain fairly modest
this year before rising to around 2 per cent per annum in 2017 and 2018.
The latest analysis of the leisure sector by Savills is pretty upbeat. It reports that the latest Family Spending Survey (FES), released in December 2015,
showed consumers spending around 13 per cent of total expenditure on recreation & culture and 8 per cent on restaurants & hotels, which is more than all
housing related goods and services combined.
Savills reports the cinema sector in rude health with rises in admissions and revenue for the main chains.
Cineworld plans to open a further 13 sites on the back of a record breaking 2015 when 18 new cinemas were opened.
The UK restaurant sector remains strong with revenue growth throughout 2015. There have been a number of major transactions and new entrants to the market,
testifying to its continued popularity. Savills believes that further expansion is likely to focus on the main regional centres – Birmingham, Cardiff, Leeds,
Liverpool and Manchester – as competition, premiums and rents in the capital make it less attractive.
According to Savills the number of health & fitness
facilities rose by nearly 6 per cent in 2015, largely driven by the low cost sector. In fact their aggressive acquisition programme may have resulted in some
locations reaching saturation point with little scope for further occupiers to enter the market. Meanwhile the premium operators are looking to differentiate
themselves from the low-cost ones by the addition of spas, swimming pools and other luxury elements.
London Resort Company Holdings are planning
another round of public consultations this year ahead of submitting a planning application for the £2bn Paramount Park scheme in north Kent in 2017. Given
this timescale construction of the project is not now
-40.0
-30.0
-20.0
-10.0
0.0
10.0
20.0
30.0
40.0
-10.0
-8.0
-6.0
-4.0
-2.0
0.0
2.0
4.0
2007 2008 2009 2010 2011 2012 2013 2014 2015 2016 2017 2018
Recreational & Cultural Services (lhs)
Accommodation and catering services(lhs)New orders for leisure construction (rhs)
Leisure construction output (rhs)
Source: ONS, Experian.
GROWTH IN CONSUMER EXPENDITURE ON LEISURE ITEMS v LEISURE CONSTRUCTION ORDERS AND OUTPUT (annual % change)
0
1000
2000
3000
4000
5000
6000
2011
2012
2013
2014
2015
2016
LEISURE CONSTRUCTION ORDERS AND OUTPUT4 Quarter Moving Totals
Orders Output
£ million
Source: ONS
56

© Experian
UK Construction Forecast
Summer 2016 Volume 22: Issue 3
likely to start until 2018. There is also talk of Disney taking forward a rival theme park somewhere in Kent.
Plans are progressing on the £400m Peak Resort
north of Chesterfield and will now include a university campus and sports hostel. Construction will be in three phases with the first due to start this September.
The London Theatre Company is looking to develop a new 900‐seat venue close to Tower Bridge as part of the One Tower Bridge development. The theatre is
expected to open in summer 2017.
Wigan town centre is expected to get a £60m makeover with the addition of a gym, cinema,
restaurants and a leisure complex at the Galleries shopping centre. However, at present it is unclear when the new scheme, dubbed Makinson Quarter, is
likely to commence.
New on the football front is Queens Park Rangers plan to build a 40,000‐seat stadium at Old Oak
Common, west London and Tottenham Hotspur should start work on its revised scheme in the spring, subject to a successful planning application, with the
new stadium open for the 2018/19 season.
Outlook Despite the fall in activity last year our prognosis is still for growth in the sub-sector over the forecast
period, although when the best year of expansion will be has shifted from 2017 to 2018 in the light of the likely start of the Paramount Park project. As well as
the leisure areas mentioned above there are a number of large hotel projects in the pipeline that were outlined in the Spring Update which should help to
keep activity in the sub-sector buoyant.
Health & Education
Output & Orders Privately-funded health construction output climbed
back above the £1bn mark last year, to £1.09bn in current prices, a 9 per cent rise on the previous year. In the first quarter of this year it totalled £238m, an 11
per cent fall on the previous quarter. On a four-quarter moving total basis four quarters of growth came to an end in the final quarter of last year, and output slid by
nearly 2 per cent in the first quarter of this one.
After strong growth in 2014, new orders slipped by 8 per cent last year to £611m. In the first quarter of this year they reached £215m, 68 per cent up on the
previous quarter and the best quarterly total since the second quarter of 2014. The four-quarter moving total turned upwards again in the first quarter of this year
after three quarters of decline.
Privately-funded education output reached a new high in 2015 at £4.44bn in current prices, a 10 per cent increase on the previous year. Output in the sub-
sector is now significantly higher than it was during the Building Schools for the Future programme, although of course publicly-funded activity is well
down. In the first quarter of this year output totalled £1.1bn, 8 per cent down on the previous quarter. However, the trend in the four-quarter moving total
remains positive, for the 13th consecutive quarter.
New orders were also 10 per cent higher at £2.85bn and they have considerably more than doubled in the past three years. In the first quarter of this year they
reached £804m, a 35 per cent increase on the previous quarter. After a decline in the final quarter of last year the four-quarter moving total returned to
0
500
1000
1500
2000
2500
3000
2011
2012
2013
2014
2015
2016
HEALTH CONSTRUCTION ORDERS AND OUTPUT4 Quarter Moving Totals
Orders Output
£ million
Source: ONS
0
500
1000
1500
2000
2500
3000
3500
4000
4500
5000
2011
2012
2013
2014
2015
2016
EDUCATION CONSTRUCTION ORDERS AND OUTPUT4 Quarter Moving Totals
Orders Output
£ million
Source: ONS
57

© Experian
UK Construction Forecast
Summer 2016 Volume 22: Issue 3
growth in the first quarter of this one and remains on an upward trend.
Drivers Work at the Royal Liverpool & Broadgreen and
Papworth hospitals has been ongoing for some time now with completion due on the former in early 2017 and the latter in early 2018. Capital expenditure on
these projects is expected to total £615m in current prices.
The contract has now been signed for Sandwell and
West Birmingham Acute NHS Trust’s new Midland Metropolitan hospital. Enabling works have started, with completion scheduled for July 2018.
Procurement of the £2bn second phase of the Priority School Building Programme (PSBP) is expected to start imminently and cover work on 277 schools to
2021.
Outlook Given that there has been very little new information on the privately-financed element of the education sub-sector since our winter and spring forecasts, we
see no reason to revise our prognosis of a steady increase in output driven by PSBP work and the need for more school places.
In the case of the health sub-sector, we have revised down our 2016 prognosis on the basis of the weakness in output in the first quarter of the year and
see little prospect of growth over the whole of the forecast period.
58
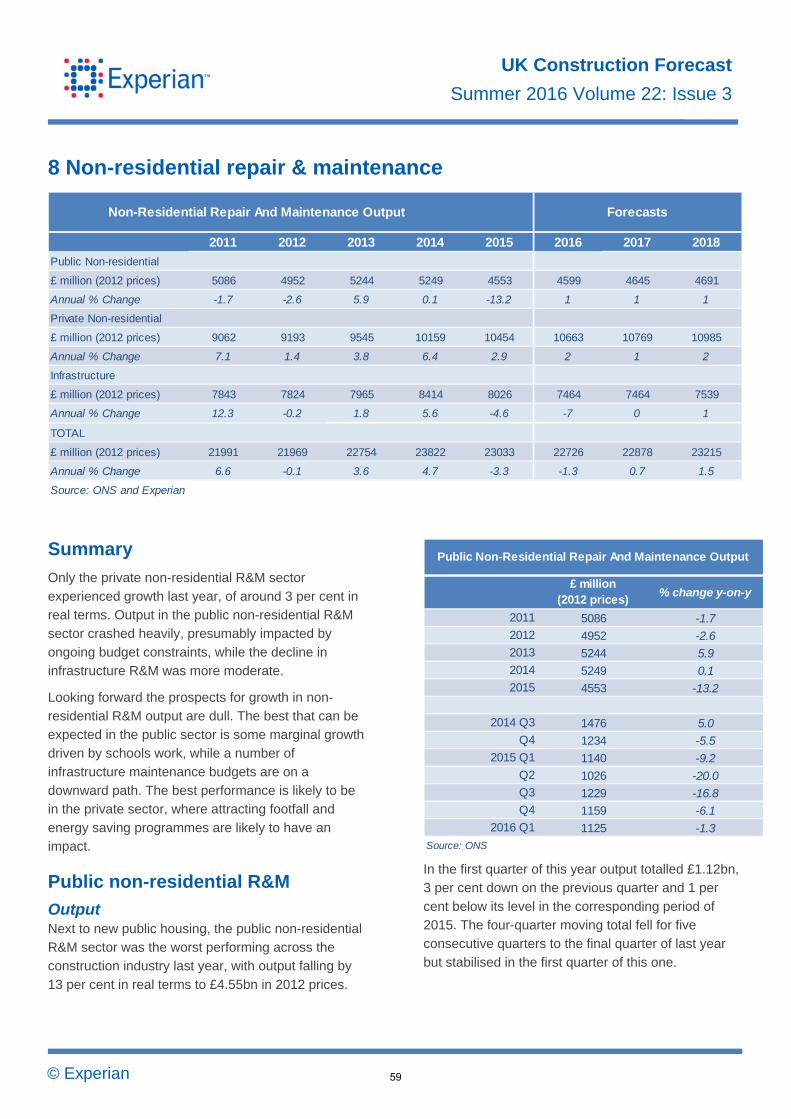
© Experian
UK Construction Forecast
Summer 2016 Volume 22: Issue 3
8 Non-residential repair & maintenance
Summary
Only the private non-residential R&M sector
experienced growth last year, of around 3 per cent in real terms. Output in the public non-residential R&M sector crashed heavily, presumably impacted by
ongoing budget constraints, while the decline in infrastructure R&M was more moderate.
Looking forward the prospects for growth in non-
residential R&M output are dull. The best that can be expected in the public sector is some marginal growth driven by schools work, while a number of
infrastructure maintenance budgets are on a downward path. The best performance is likely to be in the private sector, where attracting footfall and
energy saving programmes are likely to have an impact.
Public non-residential R&M
Output Next to new public housing, the public non-residential R&M sector was the worst performing across the construction industry last year, with output falling by
13 per cent in real terms to £4.55bn in 2012 prices.
In the first quarter of this year output totalled £1.12bn, 3 per cent down on the previous quarter and 1 per
cent below its level in the corresponding period of 2015. The four-quarter moving total fell for five consecutive quarters to the final quarter of last year
but stabilised in the first quarter of this one.
2011 5086 -1.72012 4952 -2.62013 5244 5.92014 5249 0.12015 4553 -13.2
2014 Q3 1476 5.0
Q4 1234 -5.5
2015 Q1 1140 -9.2Q2 1026 -20.0Q3 1229 -16.8Q4 1159 -6.1
2016 Q1 1125 -1.3
Source: ONS
£ million (2012 prices)
% change y-on-y
Public Non-Residential Repair And Maintenance Output
2011 2012 2013 2014 2015 2016 2017 2018
Public Non-residential
£ million (2012 prices) 5086 4952 5244 5249 4553 4599 4645 4691
Annual % Change -1.7 -2.6 5.9 0.1 -13.2 1 1 1
Private Non-residential
£ million (2012 prices) 9062 9193 9545 10159 10454 10663 10769 10985
Annual % Change 7.1 1.4 3.8 6.4 2.9 2 1 2
Infrastructure
£ million (2012 prices) 7843 7824 7965 8414 8026 7464 7464 7539
Annual % Change 12.3 -0.2 1.8 5.6 -4.6 -7 0 1
TOTAL
£ million (2012 prices) 21991 21969 22754 23822 23033 22726 22878 23215
Annual % Change 6.6 -0.1 3.6 4.7 -3.3 -1.3 0.7 1.5
Source: ONS and Experian
Non-Residential Repair And Maintenance Output Forecasts
59

© Experian
UK Construction Forecast
Summer 2016 Volume 22: Issue 3
Drivers Government spending drives this sector, but how this expenditure is shared out among the various sectors – health, education, offices, etc. – is very difficult to
ascertain due to the lack of relevant data.
The March 2016 government construction pipeline is reporting some £5.9bn of funding available in the
devolved budget to local authorities and schools for basic need and school condition allocations between over the three years 2015/16 to 2017/18. The profile
of expenditure in the pipeline suggests that it should rise by 14 per cent between 2015/16 and 2016/17 and then stay relatively static for the following year.
Outlook It is difficult to see anything more than marginal growth in output in the sector over the forecast period given local authority finances. Any expansion is likely
to be driven by expenditure in the education sector.
Private Non-residential R&M
Output Private non-residential R&M output rose for the fifth consecutive year in 2015, by just under 3 per cent to
£10.45bn in 2012 prices.
In the first quarter of this year it slipped back a bit on a quarter-on-quarter basis, by 3 per cent to £2.7bn,
although output was still 8 per cent higher compared with the same period of 2015. On a four-quarter moving total basis it has been averaging 1 per cent
growth a quarter since the fourth quarter of 2011.
Private Non-Residential Repair And Maintenance Output
£ million
(2012 prices) % change y-on-y
2011 9062 7.1 2012 9193 1.4 2013 9545 3.8 2014 10159 6.4 2015 10454 2.9
2014 Q3 2526 7.3
Q4 2616 4.8 2015 Q1 2507 4.4
Q2 2606 -0.4 Q3 2567 1.6 Q4 2774 6.0
2016 Q1 2704 7.9
Source: ONS
Drivers Maintenance of shops and offices are the main drivers
of this sector. However, little information is available to provide any sensible breakdown of expenditure. In particular, the requirement for big retail outlets to
constantly refresh their offerings can be a major driver of activity.
The last update to Sainsbury’s 20/20 Sustainability
Plan remains its December 2014 one, reported on some time ago. However, it has reported on a number of key performance indicators (KPIs) in its 2015/16
annual report. Of particular interest is the 3.4 per cent absolute reduction in carbon emissions from a 2005/06 base through increased usage of renewable
generation and improvements to refrigeration technology. However Sainsbury’s 20/20 target for an absolute reduction in carbon emissions on the
2005/06 base is 30 per cent, which looks challenging considering progress so far.
Outlook The outlook for the private non-residential R&M sector
is better than that for the public one, but at an annual average of less than 2 per cent it is hardly strong. However, it should be put in the context of five
consecutive years of growth which has taken output in 2015 to almost 25 per cent above its 2010 level.
4000
4200
4400
4600
4800
5000
5200
5400
2011 2012 2013 2014 2015 2016 2017 2018
PUBLIC NON-RESIDENTIAL REPAIR AND MAINTENANCE OUTPUT
£ million 2012 prices
Source: ONS, Experian
60

© Experian
UK Construction Forecast
Summer 2016 Volume 22: Issue 3
Infrastructure R&M
Output The infrastructure R&M sector saw its first significant fall in output last year since the data series was
disaggregated in 2010, with its level dropping by nearly 5 per cent to £8.03bn in 2012 prices.
The outturn for the first quarter of this year was weak
at £1.79bn, 3 per cent down on the previous quarter and 22 per cent below the corresponding period last year. The four-quarter moving total turned negative in
the third quarter of last year and the rate of decline is accelerating at present.
Infrastructure Repair And Maintenance Output
£ million (2012 prices)
% change y-on-y
2011 7843 12.3
2012 7824 -0.2
2013 7965 1.8
2014 8414 5.6 2015 8026 -4.6
2014 Q3 2038 4.4
Q4 2185 3.3
2015 Q1 2288 8.7
Q2 2043 -2.0
Q3 1855 -9.0 Q4 1839 -15.8
2016 Q1 1790 -21.8
Source: ONS
Drivers The main areas of activity in this sector are believed to be road maintenance, both by Highways England
and local authorities, and expenditure by water and sewerage companies. Expenditure by Network Rail on rail maintenance should not appear in these figures as
the work is done in-house and Network Rail is not classified as a construction company in official statistics.
The latest breakdown of water & sewerage, roads and rail maintenance expenditure in the spring 2016 version of the National Infrastructure Pipeline was
published in our Spring Update and broadly showed expenditure peaking in 2016/17 and then falling thereafter.
In total around £250m has been made available to help communities affected by the December 2015 storms, some of which has been used to repair
damaged roads, such as the A591, and the rest will be allocated to the strengthening of flood defences.
Outlook The outturn for the first quarter of 2016 suggests that
another year of decline is on the cards and that is reinforced by the downward trajectory of some of the major maintenance programmes in the sector. Activity
is expected to stabilise in 2017 and 2018.
7000
7500
8000
8500
9000
9500
10000
10500
11000
11500
2011 2012 2013 2014 2015 2016 2017 2018
PRIVATE NON-RESIDENTIAL REPAIR AND MAINTENANCE OUTPUT
£ million 2011 prices
Source: ONS, Experian
5000
5500
6000
6500
7000
7500
8000
8500
9000
2011 2012 2013 2014 2015 2016 2017 2018
INFRASTRUCTURE REPAIR AND MAINTENANCE OUTPUT
£ million 2012 prices
Source: ONS, Experian
61

© Experian
UK Construction Forecast
Summer 2016 Volume 22: Issue 3
Appendix A
Health Orders
annual % change
Health Output
annual % change
Education Orders
annual % change
Education Output
annual % change
2008 5074 0 5883 52 9496 2 8704 8
2009 3735 -26 4927 -16 9210 -3 8910 2
2010 3312 -11 4604 -7 8722 -5 10013 12
2011 2128 -36 3446 -25 6408 -27 9833 -2
2012 2089 -2 3176 -8 5533 -14 8331 -15
2013 2451 17 3121 -2 7139 29 8428 1
2014 2095 -15 2711 -13 8103 14 9739 16
2015 2220 6 2851 5 7250 -11 10314 6
Source: ONS.
Health and Education Orders and Output£ million current prices
2011 2012 2013 2014 2015 2016 2017 2018
Publicly funded education construction -3 -25 -11 1 0 -4 4 3
Privately funded education construction 1 6 16 31 5 3 3 3
All education construction -2 -18 -3 11 2 -1 3 3
Publicly funded health construction -18 -19 13 -17 0 5 3 2
Privately funded health construction -33 1 -27 -16 4 -5 0 -2
All health construction -25 -11 -6 -16 2 1 2 1
Note: public non-residential and private commercial deflators are applied to the current price health & education data to provide an estimate of constant prices
Source: Experian.
estimated annual % change in constant prices
Forecast Health & Education Growth Rates
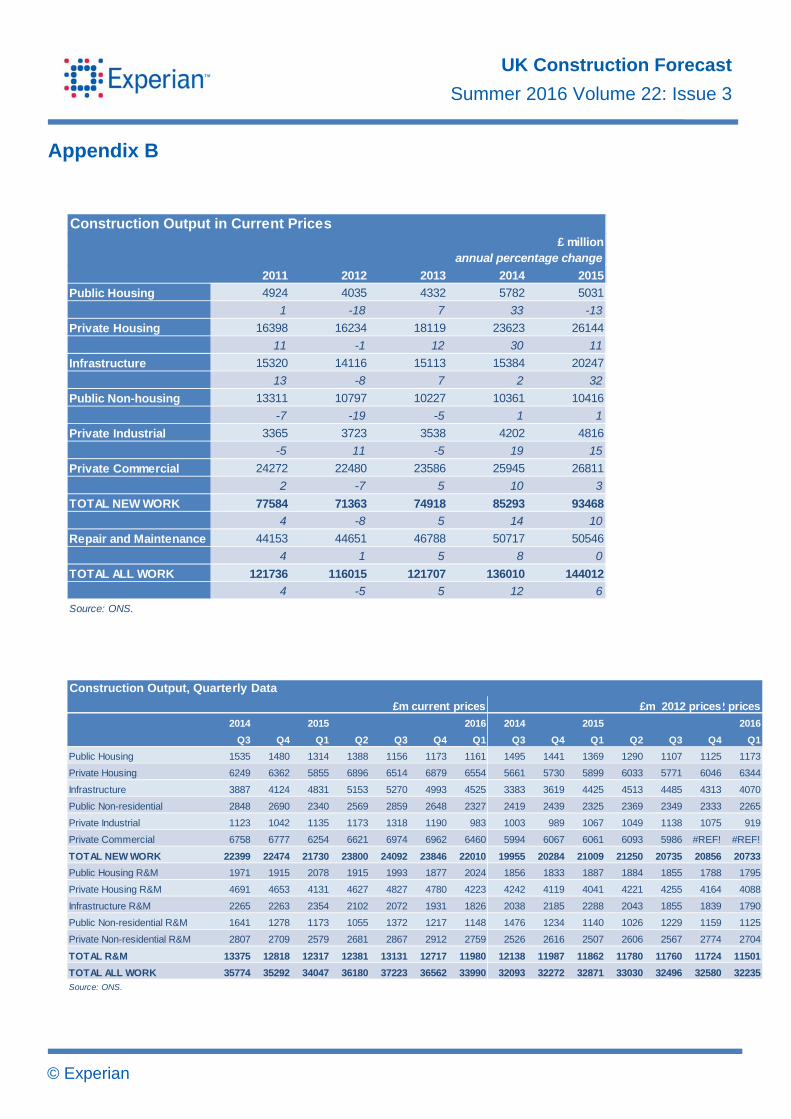
© Experian
UK Construction Forecast
Summer 2016 Volume 22: Issue 3
Appendix B
2011 2012 2013 2014 2015
Public Housing 4924 4035 4332 5782 5031
1 -18 7 33 -13
Private Housing 16398 16234 18119 23623 26144
11 -1 12 30 11
Infrastructure 15320 14116 15113 15384 20247
13 -8 7 2 32
Public Non-housing 13311 10797 10227 10361 10416
-7 -19 -5 1 1
Private Industrial 3365 3723 3538 4202 4816
-5 11 -5 19 15
Private Commercial 24272 22480 23586 25945 26811
2 -7 5 10 3
TOTAL NEW WORK 77584 71363 74918 85293 93468
4 -8 5 14 10
Repair and Maintenance 44153 44651 46788 50717 50546
4 1 5 8 0
TOTAL ALL WORK 121736 116015 121707 136010 144012
4 -5 5 12 6
Source: ONS.
Construction Output in Current Prices £ million
annual percentage change
£m current prices £m 2012 prices2 prices
2014 2015 2016 2014 2015 2016
Q3 Q4 Q1 Q2 Q3 Q4 Q1 Q3 Q4 Q1 Q2 Q3 Q4 Q1
Public Housing 1535 1480 1314 1388 1156 1173 1161 1495 1441 1369 1290 1107 1125 1173
Private Housing 6249 6362 5855 6896 6514 6879 6554 5661 5730 5899 6033 5771 6046 6344
Infrastructure 3887 4124 4831 5153 5270 4993 4525 3383 3619 4425 4513 4485 4313 4070
Public Non-residential 2848 2690 2340 2569 2859 2648 2327 2419 2439 2325 2369 2349 2333 2265
Private Industrial 1123 1042 1135 1173 1318 1190 983 1003 989 1067 1049 1138 1075 919
Private Commercial 6758 6777 6254 6621 6974 6962 6460 5994 6067 6061 6093 5986 #REF! #REF!
TOTAL NEW WORK 22399 22474 21730 23800 24092 23846 22010 19955 20284 21009 21250 20735 20856 20733
Public Housing R&M 1971 1915 2078 1915 1993 1877 2024 1856 1833 1887 1884 1855 1788 1795
Private Housing R&M 4691 4653 4131 4627 4827 4780 4223 4242 4119 4041 4221 4255 4164 4088
Infrastructure R&M 2265 2263 2354 2102 2072 1931 1826 2038 2185 2288 2043 1855 1839 1790
Public Non-residential R&M 1641 1278 1173 1055 1372 1217 1148 1476 1234 1140 1026 1229 1159 1125
Private Non-residential R&M 2807 2709 2579 2681 2867 2912 2759 2526 2616 2507 2606 2567 2774 2704
TOTAL R&M 13375 12818 12317 12381 13131 12717 11980 12138 11987 11862 11780 11760 11724 11501
TOTAL ALL WORK 35774 35292 34047 36180 37223 36562 33990 32093 32272 32871 33030 32496 32580 32235Source: ONS.
Construction Output, Quarterly Data

© Experian
UK Construction Forecast
Summer 2016 Volume 22: Issue 3
Appendix C Definitions: Types and Examples of Construction Work Public Sector Housing - Local Authorities and Housing Associations, New Towns and Government Departments Housing schemes, old people's homes and the provision within housing sites of roads and services for gas, water, electricity, sewage and drainage. Private Sector Housing All privately owned buildings for residential use, such as houses, flats and maisonettes, bungalows, cottages and the provision of services to new developments. Infrastructure - public and private Water - Reservoirs, purification plants, dams, water works, pumping stations, water mains, hydraulic works etc.
Sewerage - Sewage disposal works, laying of sewers and surface drains.
Electricity - Building and civil engineering work for electrical undertakings such as power stations, dams and other works on hydroelectric schemes, and decommissioning of nuclear power stations, onshore wind farms.
Gas, communications, air transport - Gas works, gas mains and gas storage; post offices, sorting offices, telephone exchanges, switching centres etc.; air terminals, runways, hangars, reception halls, radar installations.
Railways - Permanent way, tunnels, bridges, cuttings, stations, engine sheds etc., signalling and other control systems and electrification of both surface and underground railways.
Harbours - All works and buildings directly connected with harbours, wharves, docks, piers, jetties, canals and waterways, sea walls, embankments and water defences.
Roads - Roads, pavements, bridges, footpaths, lighting, tunnels, flyovers, fencing etc.
Public Non-residential Construction1 Factories and warehouses - Publicly owned factories, warehouses, skill centres.
Oil, steel, coal - Now restricted to remedial works for public sector residual bodies.
Schools, colleges, universities - State schools and colleges (including technical colleges and institutes of agriculture); universities including halls of residence, research establishments etc.
Health - Hospitals including medical schools, clinics, welfare centres, adult training centres.
Offices - Local and central government offices, including town halls, offices for all public bodies except the armed services, police headquarters.
Entertainment - Theatres, restaurants, public swimming baths, caravan sites at holiday resorts, works and buildings at sports grounds, stadiums, racecourses etc. owned by local authorities or other public bodies.
Garages - Buildings for storage, repair and maintenance of road vehicles, transport workshops, bus depots, road goods transport depots and car parks.
Shops - Municipal shopping developments for which the contract has been let by a Local Authority.
Agriculture - Buildings and work on publicly financed horticultural establishments; fen drainage and agricultural drainage; veterinary clinics.
Miscellaneous - All work not clearly covered by any other headings, such as fire stations, police stations, prisons, reformatories, remand homes, civil defence work, UK Atomic Energy Authority work, council depots, museums, libraries.

© Experian
UK Construction Forecast
Summer 2016 Volume 22: Issue 3
Private Industrial Work Factories, warehouses, wholesale depots, all other works and buildings for the purpose of industrial production or processing, oil refineries, pipelines & terminals, concrete fixed leg oil production platforms (not rigs); private steel work; all new coal mine construction such as sinking shafts, tunnelling, etc. Private Commercial Work1 Schools and universities - Schools and colleges in the private sector, financed wholly from private funds.
Health - Private hospitals, nursing homes, clinics.
Offices - Office buildings, banks.
Entertainment - Privately owned theatres, concert halls, cinemas, hotels, public houses, restaurants, cafés, holiday camps, swimming pools, works and buildings at sports grounds, stadiums and other places of sport or recreation, youth hostels.
Garages - Repair garages, petrol filling stations, bus depots, goods transport depots and any other works or buildings for the storage, repair or maintenance of road vehicles, car parks.
Shops - All buildings for retail distribution such as shops, department stores, retail markets, showrooms, etc.
Agriculture - All buildings and work on farms, horticultural establishments.
Miscellaneous - All work not clearly covered by any other heading, e.g. exhibitions, caravan sites, churches, church halls.
New Work New housing - Construction of new houses, flats, bungalows only.
All other types of work - All new construction work and all work that can be referred to as improvement, renovation or refurbishment and which adds to the value of the property2.
Notes: 1 Where contracts for the construction or improvement of non-residential buildings used for public service provision, such as hospitals, are awarded by private sector holders of contracts awarded under the Private Finance Initiative or its successors, the work is classified as ‘private commercial’. 2 Contractors reporting work may not always be aware of the distinction between improvement or renovation work and repair and maintenance work in the non-residential sectors.
© Experian
UK Construction Forecast
Summer 2016 Volume 22: Issue 3
Appendix D Membership of the Forecasting Committees The Forecasting Committee for the Construction Industries Chairman
Mr Mike Napier Costain Ltd
Members
Mr Robert Biggs Considerate Contractors’ Group
Mr Mike Canavan Consultant
Mr Colin Fletcher SAMI Consulting
Mr Peter Gutmann Experian
Mr Jerry McLaughlin Mineral Products Association Ltd
Chairman of the Infrastructure Group
Mr Colin Ostler Tata Steel
Ms Frances Pottier Department for Business, Innovation and Skills
Mrs Jennet Siebrets CB Richard Ellis
Chairman of the Housing/RMI Group
Mr Anthony J Williams Building Value Limited
Chairman of the Non-residential Group
Secretary
Mr James Hastings Experian

© Experian
UK Construction Forecast
Summer 2016 Volume 22: Issue 3
Housing/RMI Forecasting Group Chairman
Mrs Jennet Siebrets CB Richard Ellis
Members
Mr Adam Challis Jones Lang LaSalle
Mr Martin Ellis Lloyds Banking Group plc
Mr Robert Gardner Nationwide
Ms Isabel Hacche Department for Business, Innovation & Skills
Mr Mohammed Jamei Council of Mortgage Lenders
Mr Lee Layton Carter Jonas LLP
Mr Paul Reed Marley Eternit Ltd
Mr Alastair Stewart Westhouse Securities
Mr John Stewart Home Builders Federation
Mr Stephen Teagle Galliford Try plc
Mr Jeremy Thomas Homes and Communities Agency
Secretary
Ms Sonya Patel Experian
© Experian
UK Construction Forecast
Summer 2016 Volume 22: Issue 3
Non-residential Forecasting Group Chairman
Mr Anthony J Williams Building Value Limited
Members
Mr Malcolm Aldridge Robinson Low Francis
Mr Robert Biggs Considerate Contractors’ Group
Mr Mike Canavan Consultant
Mr Simon Chillingworth Carillion plc
Mr Jerwyn Lau The British Land Company plc
Mr Mike Napier Costain Ltd
Mr Colin Ostler Tata Steel
Ms Catherine Penman Carter Jonas LLP
Ms Frances Pottier Department for Business, Innovation & Skills
Mr Neil Stanley Altered States UK Ltd
Mr Sam Ward Carillion plc
Secretary
Mr James Hastings Experian Infrastructure Forecasting Group Chairman
Mr Jerry McLaughlin Mineral Products Association Ltd
Members
Mr Mike Canavan Consultant
Mr Simon Chillingworth Carillion plc
Mr Mike Napier Costain Limited
Mr Colin Ostler Tata Steel
Ms Frances Pottier Department for Business Innovation and Skills
Ms Francesca Raleigh Consultant
Mr Sam Ward Carillion plc
Secretary
Mr James Hastings Experian

© Experian
UK Construction Forecast
Summer 2016 Volume 22: Issue 3
Published by the Market Insight Group of Experian plc, Cardinal Place, 80 Victoria Street, London SW1E 5JL. T: 0203 042 4000
F: 0207 746 8277
July 2016
Our economic forecasting expertise
Experian's team of 20 economists is a leading provider of global, national, regional and local economic forecasts and analysis to the commercial and public sectors. Our foresight helps organisations predict the future of their markets, identify new business opportunities, quantify risk and make informed decisions.
For more information, visit www.experian.co.uk/economics
Experian Market Intelligence Group
Would you like to understand how your credit portfolio compares to your peers and how it is likely to be impacted by changes in lending policy, market competition and the economy in the future? Our experts in economics, credit risk, construction, market analysis and portfolio benchmarking combine to provide an in-depth understanding of the market and economic context in which you manage your business both now and in the future.
How we can help you:
An independent unbiased view of the market based upon quantitative analysis of data.
Benchmark your portfolio against your peers, both now and forecast into the future
Provide economic forecasts specific to your sector Develop accurate business case(s) for entry into new
markets Assess future market risk and predict potential economic
pressures – at a granular level Highlight future revenue opportunities Meet regulatory requirements for stress testing and loss
forecasting
Experian – helping organisations understand the market, economy and future changes in household and business finances.
Contact our team on:
T: +44 (0) 207 746 8244 or
W: www.experian.co.uk/economics
Contact
James Hastings
Head of Construction Futures
T: +44 (0) 207 7746 8263 James has specialised in research and analysis of the construction industry for the past 24 years, both at the National Economic Development Office and as a founder member of Construction Forecasting and Research, with whom he has filled a number of roles over the years. He is now head of construction futures in Experian’s Economics Unit and currently sits on the Department for Business, Innovation and Skills’ Consultative Committee on Construction Industry Statistics.
Sonya Patel Senior Economist E: [email protected]
T: +44 (0) 207 746 8274 Sonya joined the Construction Futures team at Experian in October 2011 and has taken over responsibility for the day‐to‐day management of our quarterly State of Trade survey on behalf of the Federation of Master Builders and our six‐monthly regional forecasting reports, Foresight.
Nirav Panchal Economist E: [email protected]
T: +44 (0) 207 746 8274 Nirav has a background in data analytics and spent a year working as analyst before graduating with honours in Economics. Nirav has been a part of Experian’s Economics Unit since the March 2013 and now focuses on the production of a range of forecasts and reports within the construction industry.

