uk beauty report...uk beauty report | 2 the battle between beauty brand and retailer there’s a...
TRANSCRIPT

UK Beauty Report
Who is disrupting the online beauty industry?
What can brands & retailers do to grow online audiences & sales?
The battle between brand & retailer
2019

UK Beauty Report | 2
The battle between beauty brand and retailer There’s a love-hate relationship between brand and retailer. Brands would prefer selling direct, but retailers attract greater volumes
of visits, sales, and customers.
In 2019, the Top 50 Beauty Retailers averaged 48M visits per month, which was four times greater than the Top 50 Beauty Brands.
Only 16% of Retailer Visitors also browsed on Brand sites*, showing little overlap between the two.
But there are digital disruptors in each category, from Revolution Beauty, Cult Beauty, to Amazon Beauty. In this report, we
analyse what has driven each disruptor’s online rise. We look at how brands and retailers can work effectively together, using
search, product and purchase insights.
INTRODUCTION
Monthly Online Visits – % YoY Change
Jan Feb Mar Apr MayJun Jul Aug Sep Oct Nov Dec
15%
0%
-15%
Top 50 Beauty Retailers
dipped over the Christmas
but has since recovered.
Top 50 Beauty Brands
have slowed heading into
the Summer peak.
Top 50 Beauty Brands
Top 50 Beauty Retailers
* Top 50 Retailers vs. Top 50 Brands – based on online visits year-to-date. Jan-May 2019.

UK Beauty Report | 3
PART I: SEARCH
What’s driving Revolution
Beauty’s rise?
PART II: BROWSE
How can retailers capitalise
on Cult Beauty’s growth?
PART III: PURCHASE
Is Amazon Beauty a rising
threat?
What’s InsideINTRODUCTION
PART I: SEARCH INSIGHTS
What’s driving Revolution Beauty’s rise?
UK Beauty Report | 5
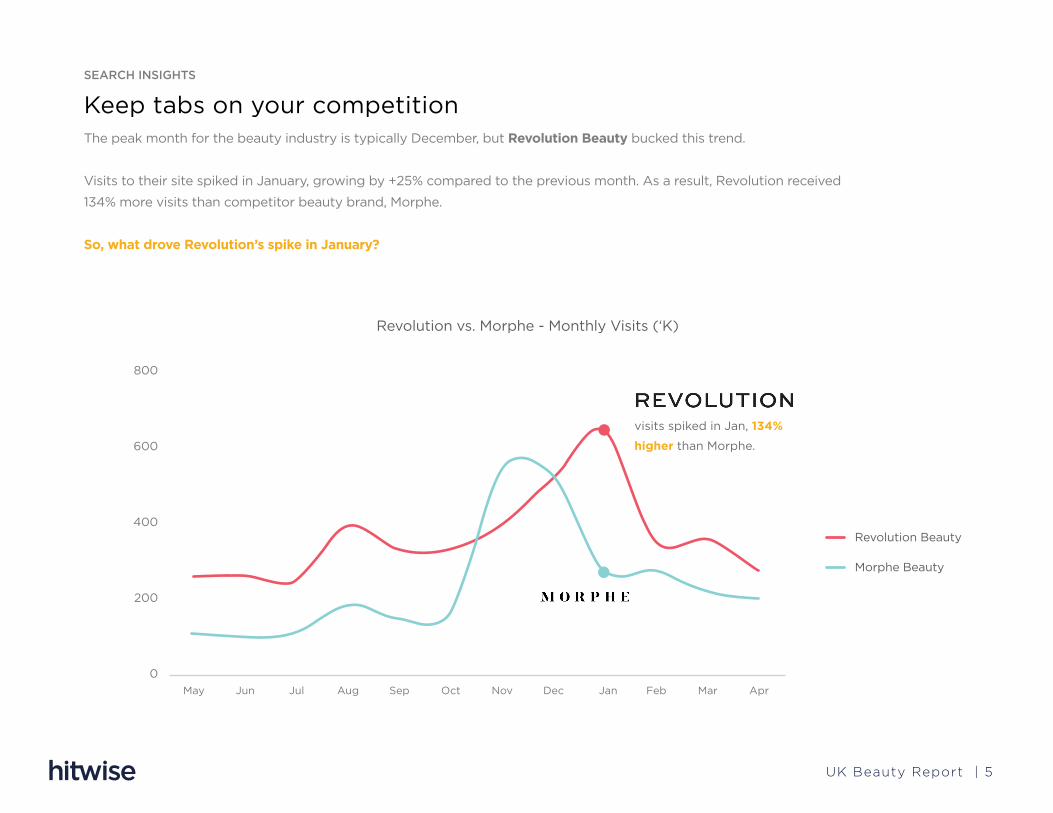
Revolution vs. Morphe - Monthly Visits (‘K)
visits spiked in Jan, 134%
higher than Morphe.
Keep tabs on your competitionThe peak month for the beauty industry is typically December, but Revolution Beauty bucked this trend.
Visits to their site spiked in January, growing by +25% compared to the previous month. As a result, Revolution received
134% more visits than competitor beauty brand, Morphe.
So, what drove Revolution’s spike in January?
SEARCH INSIGHTS
Jan Feb Mar AprMay Jun Jul Aug Sep Oct Nov Dec
800
600
400
200
0
Revolution Beauty
Morphe Beauty

UK Beauty Report | 6
Track fast-rising product searchesWe can understand what by looking at searches in January compared to December.
Revolution’s Christmas gift sets, “I Heart Revolution Chocolate Vault” and “Revolution 12 Days of Christmas”, were still
trending in January. Additionally, new branded products, like their iconic “Revolution hyaluronic acid” and “cranberries &
chocolate palette” and generic searches like “contour brush”, appeared this month.
SEARCH INSIGHTS
Top Rising Searches - Jan 2019 vs. Dec 2018
140%
“I heart revolution chocolate vault”
“Revolution hyaluronic acid”
New in Jan
“Contour brush”
New in Jan 193%
“Revolution 12 days of Christmas”
“Cranberries & chocolate palette”
New in Jan
UK Beauty Report | 7
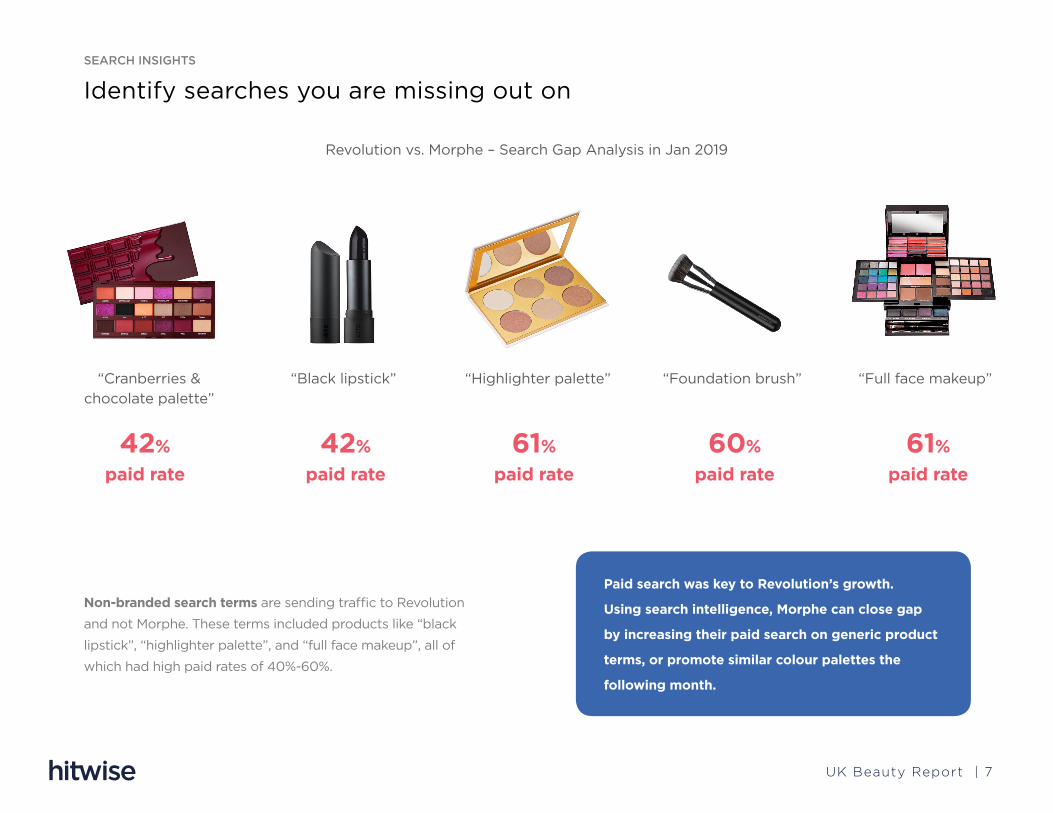
Identify searches you are missing out on SEARCH INSIGHTS
Revolution vs. Morphe – Search Gap Analysis in Jan 2019
“Cranberries & chocolate palette”
“Highlighter palette” “Full face makeup”
42% paid rate
60% paid rate
61% paid rate
42% paid rate
61% paid rate
“Black lipstick” “Foundation brush”
Paid search was key to Revolution’s growth.
Using search intelligence, Morphe can close gap
by increasing their paid search on generic product
terms, or promote similar colour palettes the
following month.
Non-branded search terms are sending traffic to Revolution
and not Morphe. These terms included products like “black
lipstick”, “highlighter palette”, and “full face makeup”, all of
which had high paid rates of 40%-60%.
PART II: PAGE LEVEL INSIGHTS
How can retailers capitalise on Cult Beauty’s growth?
UK Beauty Report | 9
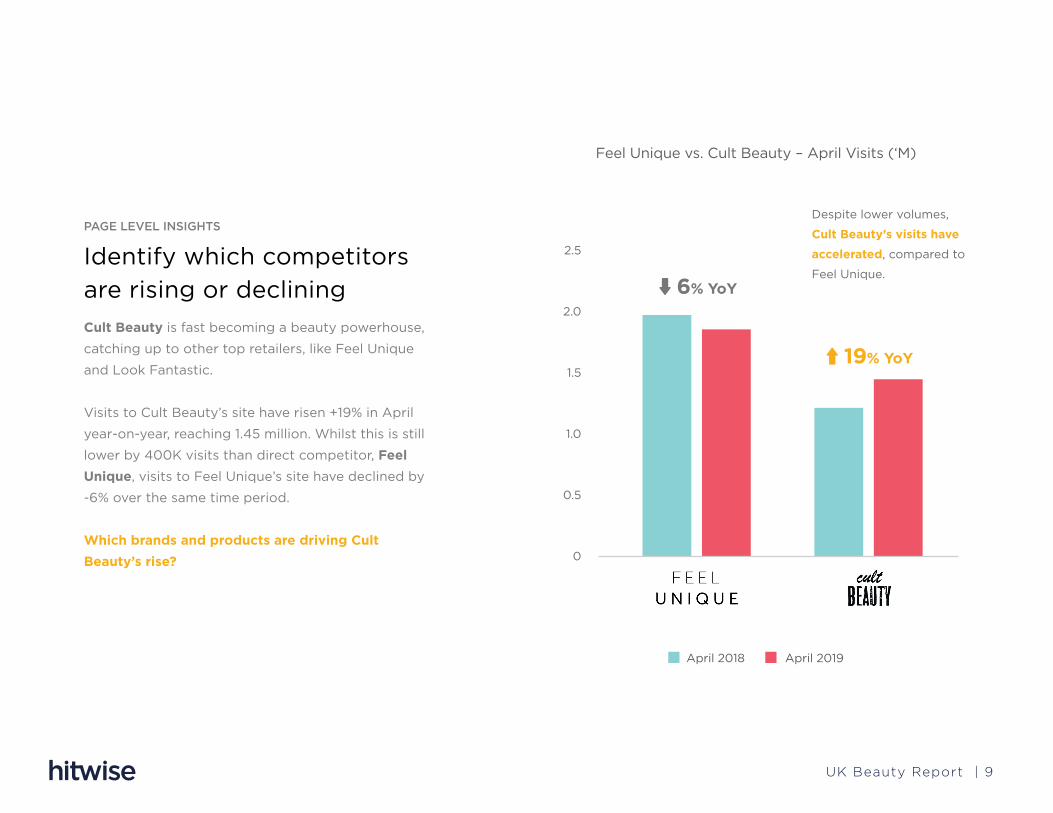
Identify which competitors are rising or decliningCult Beauty is fast becoming a beauty powerhouse,
catching up to other top retailers, like Feel Unique
and Look Fantastic.
Visits to Cult Beauty’s site have risen +19% in April
year-on-year, reaching 1.45 million. Whilst this is still
lower by 400K visits than direct competitor, Feel Unique, visits to Feel Unique’s site have declined by
-6% over the same time period.
Which brands and products are driving Cult Beauty’s rise?
PAGE LEVEL INSIGHTS
Feel Unique vs. Cult Beauty – April Visits (‘M)
April 2018 April 2019
Despite lower volumes,
Cult Beauty’s visits have
accelerated, compared to
Feel Unique.
2.5
2.0
1.5
1.0
0.5
0
6% YoY
19% YoY

UK Beauty Report | 10
Brand Page Views - April 2019 YoY
Benchmark brand performance within retailers Brand page view analysis would help Feel Unique understand how they stack up against Cult Beauty.
This is shown below for top brands in April year-on-year. Both retailers saw similar dips in Anastasia Beverly Hills’ page views. Feel
Unique also saw dips for other popular brands, like Charlotte Tilbury and Benefit Cosmetics. In contrast, Cult Beauty’s page views
for these brands grew by over +50%.
PAGE LEVEL INSIGHTS
12%
58%
77%
15%
3%
57%
Both retailers declined in Anastasia
Beverly Hills page views.
Cult Beauty pages for Charlotte
Tilbury & Benefit spiked,
compared to Feel Unique.

UK Beauty Report | 11
Pinpoint trending products by brand PAGE LEVEL INSIGHTS
Even though Anastasia Beverly Hills page views dipped on Cult
Beauty year-on-year, there are still fast rising products compared
to the previous month, such as Loose Glitter and Gloss Mini Set.
Cult Beauty also saw 200%+ increases in Charlotte Tilbury’s and
Benefit’s iconic products, like the Brow Lift and Benetint.
Using brand and product intelligence, Feel Unique could place promotions or increase paid search on items that they stock like-for-like. The retailer could also expand their range on items they currently don’t stock to capture this growing demand.
Cult Beauty Product Pages by Brand - April 2019 MoM
Brow Lift
2150%
The Retoucher
322%
Filmstar Bronze Glow
216%
Benetint
2384%
Roller Lash Stash
336%
Roller Liner
524%
Dipbrow Pomade Brush 12 Duo
1440%
Loose Glitter
416%
Holiday Mini Lip Gloss Set
250%

PART III: PURCHASE INSIGHTS
Is Amazon Beauty a rising threat?
UK Beauty Report | 13
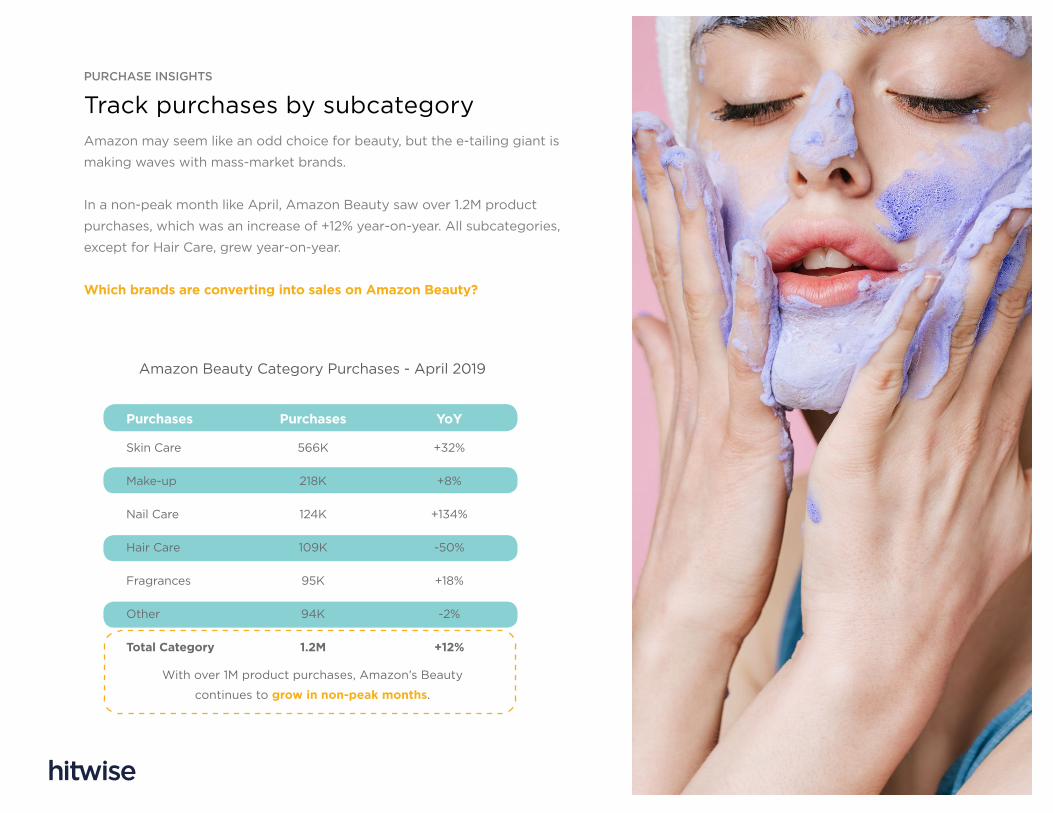
Amazon may seem like an odd choice for beauty, but the e-tailing giant is
making waves with mass-market brands.
In a non-peak month like April, Amazon Beauty saw over 1.2M product
purchases, which was an increase of +12% year-on-year. All subcategories,
except for Hair Care, grew year-on-year.
Which brands are converting into sales on Amazon Beauty?
Track purchases by subcategory PURCHASE INSIGHTS
Amazon Beauty Category Purchases - April 2019
Skin Care
Make-up
Nail Care
Hair Care
Fragrances
Other
Total Category
566K
218K
124K
109K
95K
94K
1.2M
Purchases Purchases YoY
With over 1M product purchases, Amazon’s Beauty
continues to grow in non-peak months.
+32%
+8%
+134%
-50%
+18%
-2%
+12%

UK Beauty Report | 14
+89%
+71%
Track how brands are converting on competitors PURCHASE INSIGHTS
The top purchased brands on Amazon were Rimmel, Max Factor, and Maybelline. Max Factor had seen the largest year-on-year
increase in product purchases by +89%. Max Factor has the highest
purchase rate (i.e. page views leading to purchase), but Revlon had
the largest rise, from 6.7% to 11.5% in rates year-on-year.
Beauty brands looking at this data would want to benchmark how their peers are converting within Amazon. Beauty retailers would also want to keep a close watch on Amazon’s movements as they vie for a larger slice of the “beauty” pie.
Amazon Makeup Brands – April 2019
Purchases Product Conversion Rate
Rimmel RimmelMax Factor
Max Factor
+36%*+44%*
Maybelline Maybelline
-16%
L’Oreal L’Oreal
+8%
Revlon Revlon
+66%
+14%
+15%+3%
30K
20K
10K
0
15%
10%
5%
0%
* YoY Change
UK Beauty Report | 15
SUMMARY
Key Takeaways
Lack of visibility into how brands perform within retailer sites, or how competitor retailers position and promote their portfolio of brands, can lead to a “love-hate” relationship.
By breaking down these barriers through search, page level, and purchase analytics, brands and retailers can find a better middle ground.
Our core recommendations are:
SEARCHKeep tabs on what’s driving your competitor’s rises or falls. As shown in the Morphe vs. Revolution Beauty example, insights into your competitors’ unique search terms and paid rates can help you respond with a plan of attack.
BROWSEBenchmark how brands are viewed within retailer sites. Dig one level deeper to see what products are driving each brand’s growth, as shown with the Cult Beauty example.
PURCHASEFinally, understand how brands are converting within retailer sites. Compare total volumes and purchase rates against your own performance. The Amazon Beauty example also showed that this multi-category player will be a rising threat for beauty retailers.

UK Beauty Report | 16
Hitwise is a global digital intelligence provider that helps brands and agencies, like Walmart, Goldman
Sachs, Condé Nast, and Group M, segment and reach online audiences. As pioneers in data science for
over 20 years, we deliver long-lasting improvements to our clients’ marketing and sales performance.
Powered by leading data transformation and modelling technologies, Hitwise data is audience-first,
actionable, globally-compliant, and unmatched in terms of granularity. This allows us to provide a
complete understanding into how consumers behave online - from initial search to final purchase, at any
moment in time, across any device.
DiscoverConsumer
Insights
LiftCampaign
Performance
MeasureCompetit ive
Benchmarking
OptimiseSearch & Channel
Optimisation
Ready to grow your online
beauty sales? can help improve brand-retailer partnerships through search, page level, and purchase insights.
CONTACT US HERE
APPENDIX
Page 5: Hitwise, UK. Monthly visits. Revolution vs. Morphe Beauty.
Page 6: Hitwise, UK. Search terms going to www.revolutionbeauty.com. 4
weeks to 26 Jan 2019 vs. 4 weeks to 29 Dec 2018.
Page 7: Hitwise, UK. Unbranded searches going to Revolution and not
Morphe. 4 weeks to 26 Jan 2019.
Page 9: Hitwise, UK. Monthly visits. Feel Unique vs Cult Beauty. April 2019 YoY.
Page 10: Hitwise, UK. Brand page views on Cult Beauty and Feel Unique.
April 2019 YoY.
Page 12: Hitwise, UK. Product page views on Cult Beauty. April 2019 MoM.
Page 14: Hitwise, UK. Amazon beauty category purchases. April 2019 YoY.
Page 15: Hitwise, UK. Amazon beauty makeup brand purchases. April 2019
YoY.