udv.de | car 71 | car rear and side collisions with ... · 4 compact accident research 71 | car...
TRANSCRIPT

GDV | The German Insurers No. 71
Car rear and side collisions with pedestrians and cyclists Compact accident research


3 Insurers Accident Research
Content
Content
Introduction 4
Database 5
Collisions between cars and pedestrians 5
Collisions between pedestrians and rear ends of vehicles 5
Collisions between pedestrians and the sides of cars 9
Crash test with a reversing car that hits a pedestrian 10
Crash test between car and pedestrian and contact with the wing mirror 10
Collisions between cars and cyclists 11
Crash tests for cyclists colliding with an open car door 14
Safety measures for vehicles 16
References 17

4 Compact accident research 71 | Car rear and side collisions with pedestrians and cyclists
Introduction
Introduction
In this compact accident research the results from the analyses that have been performed on rear and side colli-sions between cars and unprotected road users (pedestri-ans and cyclists) will be shown [1]. The efforts made thus far to design cars with a pedestrian-friendly shape have been focused, above all, on the front of the vehicle. This will remain the primary goal with regard to cyclist safety. Consequently, the currently available passive and active safety features for cars are designed for collisions of pe-destrians or cyclists with the front of the vehicle, including the wings. It has long been clear from the accident re-search that this is the right approach, and that these areas of the vehicle have the highest priority and require the most work [2,3]. However, the findings from the accident research also show that collisions between cars and un-protected road users include not just frontal collisions but other accident patterns that also need attention, particu-larly since technical measures can be taken to address these accident patterns [4].

5 Insurers Accident Research
Database • Collisions between car • Collisions between pedestrians and rear ends of vehicles
Database
This study is based on an analysis of the accident data of German insurers. The UDB accident database used for this contains a representative cross-section of all third-party claims reported to the GDV in the years 2002 to 2012. Only personal injury claims of at least 15,000 euros were inclu-ded. The accident material takes into account all types of road users. For the purposes of this study, all the collisions of cars with cyclists and pedestrians were taken from a total of around 5,000 accidents involving cars. The underlying data pool consists of 416 involving cars and cyclists and 390 in-volving cars and pedestrians.
Collisions between cars and pedestrians
Figure 1 shows the frequencies of different initial contact point locations (impact location) on cars in collisions with pedestrians. It reveals that collisions with the side of a vehicle (side impacts) are the second most frequent type at 23 percent. Collisions with the left and right side of the vehicle occur with similar frequency, but a signifi-cant proportion of collisions (17 percent) occur at the rear end of the vehicle (rear impacts).
Figure 1: Distribution of impact locations on the car (initial impact at the car) in collisions between cars and pedestrians
Collisions between pedestrians and rear ends of vehicles
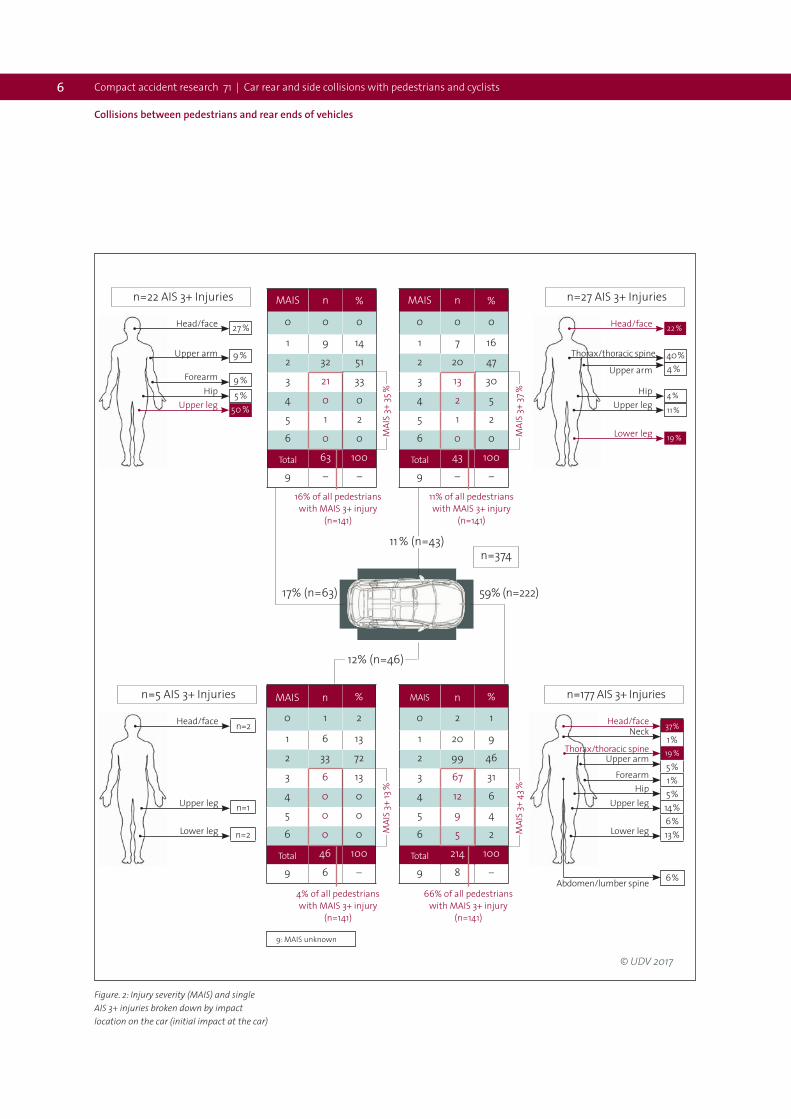
With regard to the severity of the injuries sustained in collisions between pedestrians and vehicles, figure 2 (ta-ble, bottom right) shows that 43 percent of injured pe-destrians suffered a MAIS 3+ injury in frontal collisions. These accounted for 66 percent of all pedestrians with MAIS 3+ injuries in the accident material.
The injury severity was determined by means of the so called AIS-Code (Abbreviated Injury Score). The AIS code indicates the likeliness of being killed by a single injury on a scale between 0 (not injured) and 6 (untreatable in-jury). Depending on the question, either the single injury value per body region (AIS) or the highest injury value per person (MAIS) are considered, as shown in the example of figure 2 (see tables).
If we look at collisions with the rear end of vehicles, we see that 35 percent of the injured pedestrians sustained MAIS 3+ injuries (see figure 2, table, top left). These ac-counted for 16 percent of all pedestrians with MAIS 3+ injuries. Collisions with the sides of vehicles came just behind. 15 percent of all pedestrians with MAIS 3+ inju-ries sustained them in this type of impact.
If we look more closely at the injuries of pedestrians in collisions with the rear end of cars (figure 2, picture top left), we see that 50 percent of AIS 3+ injuries were upper leg injuries. Head injuries were also frequent, accounting for 27 percent.
11 % (n=43)
12% (n=46)
(n=374)
59% (n=222) 17% (n=63)
© UDV 2017
6 Compact accident research 71 | Car rear and side collisions with pedestrians and cyclists
Collisions between pedestrians and rear ends of vehicles
Figure. 2: Injury severity (MAIS) and single AIS 3+ injuries broken down by impact location on the car (initial impact at the car)
© UDV 2017
MAIS n %
0 1 2
1 6 13
2 33 72
3 6 13
4 0 0
5 0 0
6 0 0
Total 46 100
9 6 –
MAIS n %
0 0 0
1 7 16
2 20 47
3 13 30
4 2 5
5 1 2
6 0 0
Total 43 100
9 – –
MAIS n %
0 2 1
1 20 9
2 99 46
3 67 31
4 12 6
5 9 4
6 5 2
Total 214 100
9 8 –
MAIS n %
0 0 0
1 9 14
2 32 51
3 21 33
4 0 0
5 1 2
6 0 0
Total 63 100
9 – –
11 % (n=43)
16% of all pedestrians with MAIS 3+ injury
(n=141)
MAI
S 3+
35 %
MAI
S 3+
13 %
MAI
S 3+
37 %
MAI
S 3+
43 %
4% of all pedestrians with MAIS 3+ injury
(n=141)
11% of all pedestrians with MAIS 3+ injury
(n=141)
66% of all pedestrians with MAIS 3+ injury
(n=141)
n=374
9: MAIS unknown
59% (n=222) 17% (n=63)
12% (n=46)
Head/faceNeck
Thorax/thoracic spineUpper arm
ForearmHip
Abdomen/lumber spine
Upper leg
Lower leg
37 %
1 %19 %
5 %1 %5 %14 %6 %13 %
n=177 AIS 3+ Injuries
Head/face
Upper leg
Lower leg
nn=22
n=1
n=2
n=5 AIS 3+ Injuries
Head/face
Thorax/thoracic spine
Upper arm
HipUpper leg
Lower leg
22 %
40 %4 %
4 %
11 %
19 %
n=27 AIS 3+ Injuries
Head/face
Upper arm
ForearmHip
Upper leg
27 %
9 %
9 %5 %
50 %
n=22 AIS 3+ Injuries
6 %

7 Insurers Accident Research
Collisions between pedestrians and rear ends of vehicles
The analyses described above show that it is worth ana-lyzing rear impacts in further detail. In contrast to frontal impacts, for example, 89 percent of rear impacts occur-red during daylight hours. Further analysis shows that the overwhelming majority of the collisions involved low-speed manoeuvering (i.e. the car not moving faster than 15 km/h) with virtually no reaction from the driver. In 95 percent of cases, the vehicle was not moving faster than 10 km/h. The driver reacted by braking in only 7 per-cent of these collisions.
If we look at the accident victims in these collisions, we see that 63 percent of the pedestrians involved were at least 69 years old. Children under 12 years of age accoun-ted for only 6 percent of the pedestrians involved in the-se collisions. The analyses of the accident material show that the age of the driver is not significant. Analyses of the gender of the accident victims show that women ac-counted for 70 percent of the pedestrians but only 32 percent of the drivers involved.
If you compare only the seriously injured pedestrians (MAIS 3+) in frontal and rear impacts with each other (fi-gure 3), the percentage for rear impacts (35 percent) is not much lower than that for frontal impacts (44 per-cent). However, it is noteworthy that 86 percent of the seriously injured pedestrians in rear impacts were at least 70 years of age, compared with 28 percent for fron-tal collisions. Although the collision speeds in rear im-pacts were significantly lower than in frontal impacts, the advanced age and thus greater vulnerability of the injured pedestrians may offer a plausible explanation for this. Further detailed analyses show that two-thirds of the relevant injuries suffered were caused by a secondary impact with the ground. In frontal impacts only 10 per-cent of injuries were caused in this way.
Figure 3: Comparison of the severity of pedestrian injuries in rear and frontal impacts
63 percent of the vehicles involved in the accidents were no more than five years old at the time of the accident. Based on the accident dates, the vehicles involved in the accidents were therefore manufactured in the period from 1997 to 2007. It is worth noting that 90 percent of these vehicles are likely to have been without parking sensors or reverse assistance cameras.
To obtain a better understanding of rear impacts with pedestrians, it is necessary to study the accident loca-tions and driving manoeuvers more closely. This reveals that this accident pattern can be subdivided into two main categories (figure 4):
• Three-quarters of the cases involved typical parking manoeuvers.
• A quarter of the rear-end collisions did not involve one of these parking manoeuvers. In these cases, the dri-ver reversed against the traffic flow for other reasons, for example in order to give other road users priority (e.g. ambulances) or to change direction (having missed an entrance, for example).
3 CAR 71
© UDV 2017
Rear impact Frontal impact
Frontalkollision
44 %
47 %
9 %
35 %
51 %
14 %
n=212n=6386 % were 70 year old or older 28%
MAIS 3+MAIS 2MAIS 1

8 Compact accident research 71 | Car rear and side collisions with pedestrians and cyclists
Collisions between pedestrians and rear ends of vehicles
The most common scenario in the first category (typical parking manoeuvers) was parking on or by the side of the road. This accounted for 31 percent of the cases. Clo-ser analysis of this scenario revealed the following:
• 12 percent of the pedestrians involved were not mo-ving at the time of the accident.
• 71 percent of the pedestrians and 31 percent of the dri-vers were women.
• 84 percent of the pedestrians and 12 percent of the drivers were older than 65.
• 32 percent of the pedestrians and none of the drivers were older than 75.
• 75 percent of the pedestrians suffered their most seri-ous injuries as a result of a secondary impact. 31 per-cent of the pedestrians sustained MAIS 3+ injuries.
The second most common scenario in the first category was parking in a dedicated parking lot (belonging to a supermarket or hospital, for example). The patterns in-volved in this scenario were very similar to those out-lined above:
• 24 percent of the pedestrians involved were not mo-ving at the time of the accident.
• 64 percent of the pedestrians and 44 percent of the drivers were women.
• 69 percent of the pedestrians and 15 percent of the drivers were older than 65.
• 56 percent of the pedestrians and none of the drivers were older than 75.
• 75 percent of the pedestrians suffered their most seri-ous injuries as a result of a secondary impact.
• 38 percent of the pedestrians sustained MAIS 3+ inju-ries.
The driving manoeuvers in the second category (driving manoeuver in the traffic flow) can be described as fol-lows:
• All the pedestrians involved were moving at the time of the accident.
• 10 pedestrians (71 percent) and 4 drivers were women.
Figure 4: Accident scenarios in collisions between cars and pedestrians involving a rear impact of the car
4 UKO 71
14,1
15,1
© UDV 2017
Driving manoeuver in the traffic (n=14)
Parking manoeuver in a parking lot (on or by the side of the road)(n=19)
Parking manoeuver in a dedicated parking lot (e.g. belonging to a supermarket, hospital) (n=27)
Parking manoeuver at a property entry/exit (n=12)
27 %
19 %
31 %
23 %
n=62; 100 %
Fahrradfahrer: n=28; S-Pedelecfahrer: n=10, Pedelecfahrer: n=49;

9 Insurers Accident Research
Collisions between pedestrians and the sides of cars
• 9 pedestrians (64 percent) and 1 driver were older than 65.
• Half of the pedestrians involved suffered their most serious injury as a result of a secondary impact.
Collisions between pedestrians and the sides of cars
As figure 1 shows, collisions between a pedestrian and the left- or right-hand side of a vehicle accounted for 23 percent of the accidents. There is no significant difference in the number of cases involving the left and right sides of vehi-cles. Children aged 12 or younger were involved in twice as many collisions with the right-hand side (in 11 cases, ac-counting for 24 percent of all accidents) as with the left-hand side (5 cases, amounting to 12 percent of the total). In 25 of the 89 cases (28 percent), the pedestrian had contact with one of the vehicle’s wing mirrors. In over half of these cases (15 out of 25), the pedestrian was hit only by the wing mirror (17 percent of all side-impact collisions). Figure 5 shows examples of collisions between pedestrian and the car`s wing mirror.
The fact that collisions between pedestrians and wing mirrors occur repeatedly merits further analysis of these accidents. If you look at the smooth contours of modern vehicles, it becomes clear that the wing mirrors are now the only protruding part of the car interrupting these contours. They thus have the potential to cause injury in collisions with more vulnerable road users generally. If we take a closer look at these accident situations, the fol-lowing becomes clear:
• The average speed of the vehicles involved in these ac-cidents was 40 km/h.
• The pedestrians were generally injured by the secon-dary impact with the road surface (in 8 out of 11 cases).
• The wing mirrors on the left and right of the car were involved in a roughly equal number of cases.
• The average age of the pedestrians was 62. In 3 out of the 8 cases, the pedestrians sustained MAIS 3+ inju-ries, all caused by the secondary impact.
An analysis of the accidents revealed that some of them would not have happened if the cars had been equipped with camera monitor systems instead of wing mirrors. Camera monitor systems will thus help to make the con-tours of vehicles more pedestrian friendly and therefore they should be further developed and introduced in the market.
Figure 5: Examples of collisions be- tween a pedestrian and a car`s wing mirror (on the left, the pedestrian is walking in the same direction as the car is moving; on the right, the pedestrian is standing with his back to the vehicle as it moves past)

10 Compact accident research 71 | Car rear and side collisions with pedestrians and cyclists
Crash test with a reversing car that hits a pedestrian • Crash test between car and pedestrian and contact with the wing mirror
Crash test with a reversing car that hits a pedestrian
A crash test was performed in order to recreate the scena-rio of a parking manoeuver with a reversing car that col-lides with a pedestrian. During the test the car was driven backwards against a standing dummy at a speed of 8 km/h and then it was slowed down to standstill. The image sequences in figure 6 show the kinematics of the dummy during the impact against the rear end of the car. The crash test demnonstrates that even at low speeds of the car, the pedestrian is being hurled to the ground by the vehicle.
The dummy kinematics during the impact with the car and the subsequent fall to the ground indicate that the same injurry pattern would have occurred as found in analyses of real-world accidents.
.
Crash test between car and pedestri-an and contact with the wing mirror
Accident analyses have shown that, for certain accident cir-cumstances, the wing mirror of the car may have an influ-ence on pedestrian kinematics and injury occurrence. For one of these scenarios a crash test was performed showing how the car hits the pedestrian with the right wing mirror. The car was travelling at a speed of 40 km/h and the pe-destrian was standing, facing the car`s direction of travel. The image sequences in figure 7 show the situation right before, during and after the side-swipe impact between dummy and wing mirror. The contact with the wing mirror resulted in the pedestrian falling to the ground and in inju-ries being mainly caused by the ground. This outcome cor-relates with the findings from real-world accident analyses. A new type of dummy that has been originally developed for the work of accident experts was used for both crash tests.
Figure 7: Collision with the wing mirror of the car that passes by
Figure 6: Collision with a reversing car during a parking manoeuver

11 Insurers Accident Research
Collisions between cars and cyclists
Collisions between cars and cyclists
Figure 8 shows the frequencies with which different impact locations on cars are involved in collisions with cyclists. 37 percent (n=139) of all accidents between cars and cyclists were side-impact collisions (side impacts), whereas rear-end collisions (rear impacts) accounted for only 4 percent (n=15). It is noteworthy that in 18 percent of the side im-pacts (n=25), the cyclist collided with a door that was being opened. These accounted for around 7 percent of all collisi-ons between cyclists and cars in which the impact location on the car is known (n=377). 24 of these cases occurred on the left-hand side of the car. In 23 of these 24 cases it was the driver’s door that was hit. However, as with pedestrians, collisions with the front of the vehicle clearly dominated.
Figure 8: Distribution of impact locations on the car (initial impact at the car) in collisions between cars and cyclists
When we look at injury severity by impact location on the car, we see that, as with pedestrians, the front of the vehicle dominates (figure 9). In frontal impacts 31 per-cent of the injured cyclists sustained MAIS 3+ injuries. These accounted for 69 percent of all cyclists with MAIS 3+ injuries in the accident material. Collisions with the sides of vehicles came next. In collisions with the left-hand side of the car, 24 percent of cyclists sustained seri-ous injuries (MAIS 3+), and in collisions with the right-hand side, it was 19 percent. In rear impacts, 13 percent of the cyclists were seriously injured. Figure 9: Severity of cyclists’ injuries
by impact location on the vehicle
17 % (n=64)
20% (n=75)
(n=377)
59% (n=223) 4% (n=15)
© UDV 2017
MAIS n %
0 1 1.4
1 16 21.9
2 42 57.5
3 10 13.7
4 3 4.1
5 1 1.4
6 0 0
Total 73 100
9* 2 –
MAIS n %
0 0 0
1 14 21.8
2 35 54.7
3 11 17.2
4 4 6.3
5 0 0
6 0 0
Total 64 100
9* – –
MAIS n %
0 0 0
1 29 13
2 124 55.6
3 54 24.2
4 9 4
5 5 2.2
6 2 0.9
Total 223 100
9* 0 –
MAIS n %
0 0 0
1 4 26.7
2 9 60
3 2 13.3
4 0 0
5 0 0
6 0 0
Total 15 100
9* – –
17% (n=64)
MAIS 3+n=2; 2 % *
MAI
S 3+
13,3
%M
AIS
3+ 19
,2 %
MAI
S 3+
23,
5 %M
AIS
3+ 3
1.3 %
MAIS 3+n=14; 14 % *
MAIS 3+n=15;15 % *
MAIS 3+n=70; 69 % *
n=377; 100 % * therefrom MAIS 3+ 26,8 % (n=101)
9* = MAIS unknown
59% (n=223)
4% (n=15)
20% (n=75)
© UDV 2017

12 Compact accident research 71 | Car rear and side collisions with pedestrians and cyclists
Collisions between cars and cyclists
Figure 10: AIS 3+ injuries of the cyclists by impact location on the vehicle
When we look more closely at collisions with the left-hand side of the vehicle, we see that 44 percent of the serious injuries were head injuries. Around 39 percent of the serious injuries were to the lower extremities. Figure 10 provides an overview of the injuries sustained by im-pact location on the vehicle.
Collisions of a cyclist with a car door that was being ope-ned were found to have happened almost exclusively on the left-hand side of the vehicle, indicating a need for further analysis of this accident constellation. Figure 11 shows the injuries of the cyclists in these situations by region of the body.
4% (n=15)
20% (n=75)
*=9.5 % distributed to other body regions
Head
Thoracic spineUpper arm
Lower leg
42.1 %
47.3 %5.3 %
5.3 %
n=19 Injuries
Head
Upper leg
Lower leg
44.4 %
16.7%
33.3 %
5.6 %
n=18 Injuries
Forearm
Head
Upper leg
Lower leg
37.9 %
24.1 %
13.8 %
14.7 %
n=116 Injuries
Thoracic spine
Forearm
Lower leg
n=2 Injuries
50 %
© UDV 2017
59% (n=223)
17% (n=64)
n=377
50 %

13 Insurers Accident Research
Collisions between cars and cyclists
Figure 11: Severity of the injuries sustained by the cyclists to different regions of the body in collisions with the driver’s door
If we compare the severity of the injuries sustained by the cyclists in collisions with the front of a vehicle with that of cyclists who collided with a door, we find a diffe-rent distribution within the two groups (figure 12). On the one hand it is noticeable that 21 percent of all injuries sustained in collisions with a car door are MAIS 3+ inju-ries. However, in comparison to that, frontal impacts are more severe as they result in 50 percent more MAIS 3+ injuries.
Figure 12: Severity of the injuries sustained by cyclists in collisions with the driver’s door compared with collisions with the
front of a vehicle
100% (n=223)
100% (n=24)
11 UKO 71
Collision with the driver`s door
Collision with the front of the vehicle
© UDV 2017
MAIS 3+MAIS 2MAIS 1
31 %
56 %
13 %
21 %
42 %
38 %
n=377
Head
Upper leg
Lower leg
44.4 %
16.7 %
33.3 %
5.6 %
Forearm
AIS 3+100 %; n=18 Injuries
Forearm
Head
AIS 3+100 %; n=5 Injuries
20 %
40 %
© UDV 2017
AIS 1 / AIS2100 %; n=76 Injuries
Forearm
HipHand Abdomen
Lumbar spine
Upper leg
Lower leg
Foot
7.9 %
15.8 %13.2 %1.3 %5.3 %6.6 %
19.7 %
3.9 %
1.3 %
13.2 %
38% (n=24) Collisions with the open car door
17% (n=64)
Upper armThorax
Head
2.6 %
40 %Upper leg

14 Compact accident research 71 | Car rear and side collisions with pedestrians and cyclists
Crash tests for cyclists colliding with an open car door
When we look more closely at these 24 cases in which the cyclist collided with the driver’s door, it is noteworthy that in 19 cases (79 percent of the total) the cyclist was riding on the road and attempting to pass the parked ve-hicle. In most cases in the material studied, there were no separate cycling facilities at the accident location (see examples in figure 13).
Crash tests for cyclists colliding with an open car door
In order to reconstruct the kinematics involved in these col-lisions, crash tests were carried out in a project of the De-partment of Motor Vehicles at TU Berlin. A dummy sitting on a bicycle was pulled towards an open car door at a speed of around 14 km/h. The bicycle traveled along a rail until shortly before the collision. The dummy was also released from its guide rail shortly before the collision. The bicycle and dummy were thus able to move freely. The angle at
Figure 14: Collision with a driver’s door open at an angle of 26.5 degrees and with a small overlap in the handle area of the handlebar
Figure 13: Example of an infrastructure with no separate path for cyclists that is typical for this accident constellation

15 Insurers Accident Research
Crash tests for cyclists colliding with an open car door
which the car door was opened was varied. The dummy was fitted with measuring equipment. The sequences of images shown in figures 14 to 16 clearly show the effect of the angle at which the car door is open on the kinematics of the cy-
clist and the final position of the bicycle. The points of im-pact of the cyclist with the car door essentially explain the injuries to the head and extremities derived from the acci-dent data and shown in figure 11.
�Figure 15: Collision with a driver’s door open at an angle of 45 degrees and with a small overlap in the hand le area of the handlebar
�Figure 16: Collision with a driver’s door open at an angle of 90 degrees and with a small overlap in the handle area of the handlebar

16 Compact accident research 71 | Car rear and side collisions with pedestrians and cyclists
Safety measures for vehicles
The larger the angle at which the door was open, the shorter the distance the cyclist was thrown, and in this case the final positions of both the cyclist and the bicycle were near the door.
Figure 17 shows an example of the critical times and di-stances involved as a cyclist approaches a car. Assuming a reaction time of 1 second to recognize the danger (the driver’s door opening in this case) and decelerating with 3 m/s2, a cyclist traveling at 20 km/h would have to be at least 11 meters from the door in order to avoid an acci-dent. On the other hand, at a distance of 6 meters from the door (i.e. about 3 to 4 meters from the vehicle’s rear end), the cyclist would have no chance of reducing speed and would therefore hit the door virtually without bra-king.
Figure 17: Simplified avoidability assessment for different distances between a cyclist and a car door, assuming the cyclist sees the open door, immediately initiates an emergency braking and comes to a halt (without crashing)
Safety measures for vehicles
Two measures are discussed below for the reversing and door-opening scenarios identified as being relevant in the case of these accidents.
A previous study conducted by the UDV indicated the sa-fety potential of generic systems in accidents involving cars and pedestrians caused by reversing [5]. It was found that a driver assistance system with functionality based on systems already available on the market, which de-tected the presence of people around the rear end of the car and automatically initiated targeted braking in the event of the threat of a collision or prevented the car from starting up, would have significant potential to pre-vent accidents involving cars and pedestrians (around 13 percent of the total).
Figure 18: Theoretical assessment of the time required for a cyclist to pass at the point when the driver intends to open the door
There are already technical solutions available on the market for the door-opening scenario. These warn the driver when there are vehicles or cyclists approaching [6]. Much more promising, however, are systems that pre-vent the door from being opened in the event of danger. The time period required to allow a cyclist is relatively short, so there is no reason to expect it would be difficult for vehicle occupants to accept this (see figure 18). For ex-ample, a cyclist at a distance of 6 meters from the door
71 UKO 18
71 UKO 19
Avoidability assessment
11 mCollision avoidable
Collision unavoidable
6 m
Cyclist passes the car`s door without braking
s = 6 m; t01 = 1.1 s (t02 = 1.4 s)
V01 = 20 km/h (5.6 m/s)V02 = 15 km/h (4.2 m/s)
© UDV 2017
71 UKO 18
71 UKO 19
Avoidability assessment
11 mCollision avoidable
Collision unavoidable
6 m
Cyclist passes the car`s door without braking
s = 6 m; t01 = 1.1 s (t02 = 1.4 s)
V01 = 20 km/h (5.6 m/s)V02 = 15 km/h (4.2 m/s)
© UDV 2017Initial speedV0=(km/h)
15 20 25
Assumptions for the cyclist:• cycling speed constant
V0 = 20 km/h• time of reaction tRe = 1 s• deceleration: a = 3 m/s2
Distance of reaction sr (m)
4 6 7
Braking distance sb (m)
3 5 8
Minimum distance (m) required for avoiding the collision
7 11 15
© UDV 2017
© UDV 2017

17 Insurers Accident Research
References
traveling at 20 km/h would have passed the car in about 1 second. Even for a slow cyclist (15 km/h), the door would only have to remain blocked for a maximum of 1.4 se-conds. It can be assumed that drivers’ acceptance of the system would increase once they had experienced its be-nefits directly.
In order to achieve the aims of the Vision Zero project, in-creased efforts are needed to exploit all potential ave-nues for improving safety. This applies, in particular, to the potential of technology that is already available on the market. All that has to be done here is adapt existing systems to suit relevant accident scenarios. Ultimately, it is up to manufacturers, legislators and consumer protec-tion organizations to identify accident scenarios with re-levance for safety and find or promote suitable measures that will improve safety.
References
[1] The content of this compact accident research has been published for the first time as: Kühn, M., Lang, A., Bende, J. (UDV), Strzeletz, R. (Unfallanalyse Berlin): Die Pkw-Kollision mit ungeschützten Verkehrsteilnehmern - gibt es mehr zu adressieren als die Fahrzeugfront? (Colli-sions between cars and unprotected road users – is there more to address than the front of the vehicle). Symposi-um für Unfallforschung und Sicherheit im Straßenver-kehr der ADAC Stiftung, München, 2017
[2] Kühn, M (2004). Weiterentwicklung von Fußgänger-Komponententests (Further development of pedestrian component tests). Reihe 12, Nr. 573, Fortschritt-Berichte VDI
[3] German Insurers Accident Research (UDV) (2016). Typische Unfälle zwischen Pkw und Radfahrern (Typical accidents between cars and cyclists). Compact accident research report no. 55, Berlin
[4] Jänsch, M., Otte, D., Johannsen, H. (2015). Investigation of bicycle accidents involving collisions with opening door of parking vehicles and demands for suitable driver assistance system. IRCOBI Conference, Lyon
[5] German Insurers Accident Research (UDV) (2010). Advanced driver assistance systems - An investigation of their potential safety benefits based on an analysis of in-surance claims in Germany. Research report FS 03 Berlin
[6] Audi Technology Portal (Audi AG) (2016). (https://www.audi-technology-portal.de/de/elektrik-elektronik#filter=fahrerassistenzsysteme)


19 UDV Unfallforschung der Versicherer
Impressum
Gesamtverband der DeutschenVersicherungswirtschaft e.V./Unfallforschung der Versicherer[German Insurers Association/Insurers Accident Research]Wilhelmstraße 43/43 G, D-10117 BerlinPostfach 08 02 64, D-10002 Berlin
Phone +49 (0)30 20 20 - 58 21Fax +49 (0)30 20 20 - 66 33
Facebook: facebook.com / unfallforschungTwitter: @unfallforschungYouTube: youtube.com / unfallforschungInstagram: instagram.com/udv_unfallforschung
Content: Dr. Matthias Kühn
By: Lehrstuhl für Ingenieur- und Verkehrspsychologie Institut für Psychologie, TU Braunschweig M. Sc. Tobias Vogelpohl Prof. Dr. Mark Vollrath
Design: pensiero KG, www.pensiero.eu
Image sources: Cover and Figure 1: Matthias Powelleit
Published: 07/2017

Gesamtverband der Deutschen Versicherungswirtschaft e.V./Unfallforschung der Versicherer
Wilhelmstraße 43/43 G, D-10117 Berlin Postfach 08 02 64, D-10002 Berlin
Phone: + 49 (0) 30 2020 - 5000Fax: + 49 (0) 30 2020 - 6000 www.gdv.de, www.udv.de