vehicle compatibility in car-to-car collisions - swov · vehicle compatibility in car-to-car...
TRANSCRIPT
Vehicle compatibility in car-to-carcollisions
Jan van der Sluis
D-2000-1

Vehicle compatibility in car-to-carcollisions
Literature review in the framework of the European research project“Improvement of crash compatibility between cars”, Workpackage 1
D-2000-1Jan van der SluisLeidschendam, 2000SWOV Institute for Road Safety Research, The Netherlands
Report documentation
Number: D-2000-1Title: Vehicle compatibility in car-to-car collisionsSubtitle: Literature review in the framework of the European research project
“Improvement of crash compatibility between cars”, Workpackage 1Author(s): Jan van der SluisResearch manager: Boudewijn van KampenProject number SWOV: 69.870Project code client: Contract No. RO-97-SC.1064Client: This project was funded by the European Commission DGVII under the
Transport RTD Programme
Keywords: Collision, deformation, vehicle, weight, dimension, design (overalldesign).
Contents of the project: In this report a literature review is given on the subject of crashcompatibility and incompatibility between cars. The study is based onscientific publications on this subject published over the last 15 years.The compatibility problem is described from three points of view, thestatistical, the mechanical and the geometrical.
Number of pages: 39 pp.Price: Dfl. 20,-Published by: SWOV, Leidschendam, 2000
SWOV Institute for Road Safety ResearchPO Box 10902260 BB LeidschendamThe NetherlandsTelephone 31703209323Telefax 31703201261
SWOV Publication D-2000-1 3
Summary
Within the scope of the project “Improvement of crash compatibilitybetween cars” scientific literature from the last 15 years was reviewed inorder to obtain state-of-the-art knowledge about car compatibility in car-to-car accidents.
In the first place, current definitions of (in)compatibility were reviewed.There appears to be a variety of definitions and descriptions. They have incommon that, while improving occupant safety is (traditionally) the mainpurpose of improving crash safety of cars, currently (improving) the safetyof occupants of opponent cars is of equal concern. The first property (thelevel of occupant safety) is often called the level of self-protection, while thesecond item (the level of opponent safety) is often described as the level ofaggressiveness of a particular car. Therefore, combining these differentpurposes in one, compatibility may be described as “the capability of cars toprotect their occupants in crashes, while at the same time produce as lessharm as possible to occupants of opponent cars”.
Literature was reviewed from three points of view: statistical, mechanicaland geometrical. These views have been constructed to cover the wholerange of scientific literature, including proceedings of internationalconferences as ESV, STAPP, IRCOBI and SAE and specialized journals.
From the statistical point of view, literature focussing on the influence of carmass (including mass ratio) and car size on the injury severity of occupantsis reviewed; also several existing crash rating systems are discussed. Inalmost all reports, the main data sources used for analysis are statisticalaccident data.
The influence of car mass (and mass difference) appears to be very welldocumented, the main conclusion being that the fatality or injury risk isinversely proportional to car mass or mass difference: the heavier the carthe lower the fatality or injury risk (and the higher the aggressiveness).Some authors also described the fact that in (frontal) collisions betweencars of equal mass, the outcome was better for heavier than for lighter cars.
The question, whether the influences described above should be solelyattributed tot car mass or to car size as well, was addressed by at least oneauthor (Evans), who concludes that car mass appears the strongerinfluence of the two, though in most instances size and mass areinterchangeable.
Crash rating systems are used to inform consumers about the level ofoccupant safety of different car models. Some of these systems are verysophisticated, using control variables such as exposure in traffic and driversex and age. In general, ranking systems based on accident data reflect theimportant influence of car mass (and size) as described above.
From the mechanical point of view, literature is reviewed concerning theclassical theory of mechanics of collisions (Newton mechanics).Conservation of momentum, deformation energy, and the difference
4 SWOV Publication D-2000-1
between plastic and elastic deformation are discussed and used by severalauthors to propose solutions to the problem of incompatibility. An exampleis the so-called bulkhead concept (Zobel): a maximum force level is definedfor the front end of cars which should prevent intrusion into thecompartments, after the crush zones of both or either car is fully deformed.Other solutions propose to change the force level of the crush zones of bothcars to a more or less comparable (relatively low) level and also proposemethods to measure these levels during crash testing (Steyer).
Crash testing is an important instrument for both measuring and improvingthe level of (occupant) safety of cars, as is currently successfullydemonstrated all over the world by the existing (consumer) programmes.These programmes test (new) cars according to specific test protocols, inwhich the test speed is higher than the level of current legal requirements.They tend to work two ways: 1) the public awareness of the importance ofcrash safety of cars is increasing, and 2) improvement of the design bymanufacturers is often reached without changing legal requirements.
In the chapter on the mechanical view, the importance of developing andapplying mathematical modelling to analyse and ultimately improve crashsafety of cars is reviewed, based on various types of models: lumped massmodels en finite element method (FEM) models. These models are oftenused to develop new individual car design, but they will also be used toanalyse the problem of incompatibility between different car types, or evenmodels of the same car type in different collision modes. By using theseinstruments, numerous design and parameter changes may be analysed,without the need to build and crash test every separate item.
From the geometrical point of view, literature is reviewed in which authorsdescribe influence on outcome of (differences of) car geometry andstiffness geometry that cause incompatibility. Regardless of mass and sizedifferences, geometrical differences may also cause considerable harm.This is clearly demonstrated in case of collisions between “normal” cars andspecific four-wheel-drive cars (and vans) having far stiffer longitudinals andgreater structural height than these normal cars; but geometrical differencesmay also exist between cars of the same category, dependent on the typeof collision.
Typical effects of geometrical differences are mismatches such asoverride/underride and fork effect of structures designed to (inter)act incase of collisions. Various solutions for this problem have been tested, suchas increasing or lowering sill height (in side collisions) and increasing orlowering longitudinal height, bumper height and frontal stiffness. Thedifficulty of influencing (frontal or side) stiffness is that this property isalmost never as homogeneous as it ideally should be, because of variouslocal parts that contribute to the overall stiffness design. In view of theimportance of geometrical properties, especially concerning stiffness,stiffness distribution, and alignment, the challenge for the coming years isto develop a test procedure of (new) car design that forces the future carfleet to converge to a far more compatible design than the current one.
In view of the various interacting influences as described in this literaturereview, it may be doubted that one single test may be developed for this

SWOV Publication D-2000-1 5
purpose, though some proposals already have been made, based on thecurrent deformable barrier test, used for frontal impacts.Probably, a second test is needed to better represent the opponent carwhen testing and monitoring the level of aggressiveness.
6 SWOV Publication D-2000-1
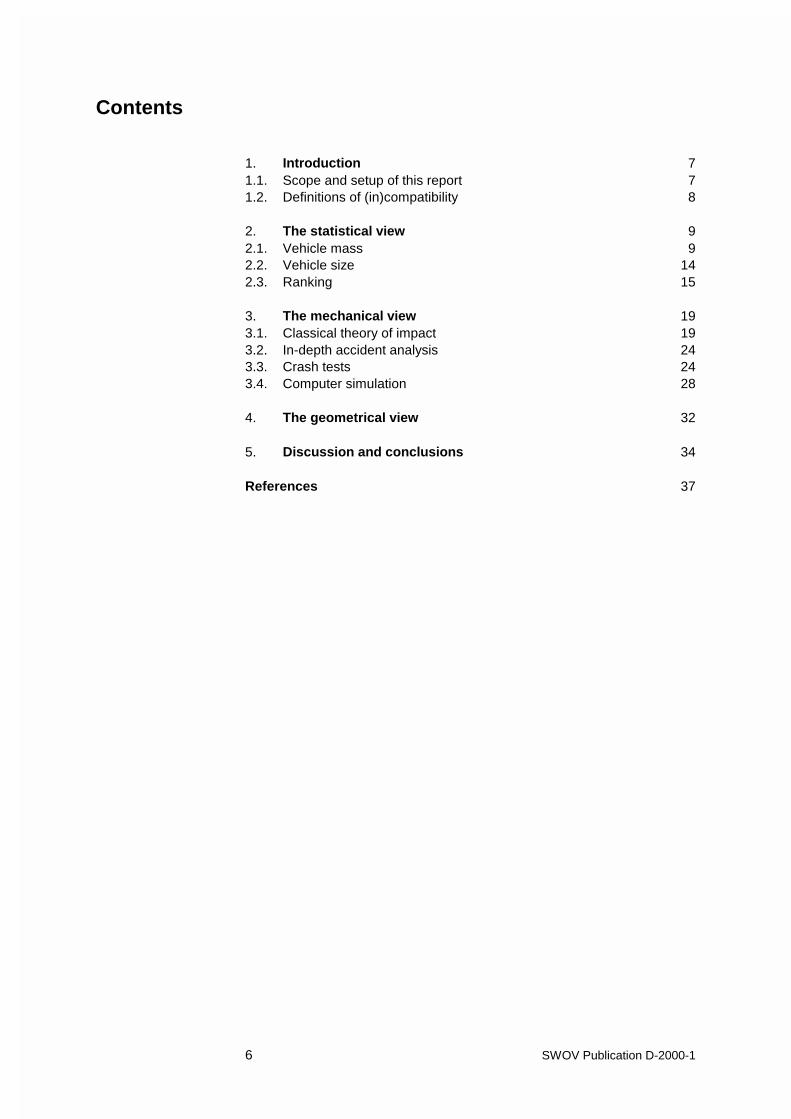
Contents
1. Introduction 71.1. Scope and setup of this report 71.2. Definitions of (in)compatibility 8
2. The statistical view 92.1. Vehicle mass 92.2. Vehicle size 142.3. Ranking 15
3. The mechanical view 193.1. Classical theory of impact 193.2. In-depth accident analysis 243.3. Crash tests 243.4. Computer simulation 28
4. The geometrical view 32
5. Discussion and conclusions 34
References 37
SWOV Publication D-2000-1 7
1. Introduction
This literature review on vehicle compatibility in car-to-car accidents hasbeen performed in the framework of the project “Improvement of crashcompatibility between cars” of the European Transport Research andTechnological Development Programme. The SWOV Institute for RoadSafety Research has been asked to carry out a review of literaturepublished over the last 15 years.
1.1. Scope and setup of this report
This report covers deliverable D1 “Literature review” of the project“Improvement of crash compatibility between cars”. In this report adescription is given of the state of the art on the subject of (in)compatibilitybetween cars. The literature review consists of: a literature survey, acompilation of the results of relevant crash tests, and mathematicalsimulations performed in the past.
The objective of this literature review is to see how scientists define andtackle the problem of incompatibility between cars. It is based on scientificpublications published over the last 15 years, including proceedings ofinternational conferences as ESV, STAPP, IRCOBI and SAE andspecialized journals.
The setup of this report is as follows. The compatibility problem is describedfrom three points of view, the statistical, the mechanical and thegeometrical. The statistical view (Chapter 2) has been divided into threesections. The first two sections cover two main explaining variables used toanalyse car accident data, vehicle mass and vehicle size. The third sectionsdeals with statistical methods applied to rank vehicle models on crash-worthiness and aggressiveness.
In the third chapter, the compatibility problem is described from amechanical point of view. In the first section, literature is referenced inwhich the theory of classical crash mechanics is used to analysecompatibility. In the three remaining section of this chapter, the mechanicalaspect of accident analysis, crash tests and computer simulation are dealtwith. There is clearly a wide range of literature available in this area, butonly those publications are referenced in which the authors themselvesmade a link to compatibility.
The last view concerns the geometrical aspect of compatibility. Subject ofdiscussion here are differences in car geometry and stiffness geometrywhich lead to incompatibility in car crashes. Geometrical issues are alsopart of the views described in the previous two chapters. The reasons fordevoting a separate chapter to the geometrical aspect is that differences inthe geometry of cars, both car shape and stiffness distribution, play a keyrole in the solution of the incompatibility problem.
8 SWOV Publication D-2000-1
1.2. Definitions of (in)compatibility
The term “compatibility” is used in several publications. A strict definition ofcar compatibility has not been found, however. In this section a number ofdescriptions of the term are offered, all found in the publications studied inthis literature review.
In the technical annex of the EU project “Improvement of Compatibilitybetween Cars” the term “compatibility” has been defined as follows:
“In protecting car occupants most activity has been associated with improvingthe occupant’s own car to aid his protection. In future, improvements should bepossible from improving the front of the other car involved. The term‘compatibility’ has been coined to describe this subject.”
F. Niederer et al. (1995) describe compatibility as follows:“In qualitative terms vehicles are denoted as collision compatible if theirdeformation characteristics are such that they do not impose excessive loads onthe occupant compartment of the collision partner under a well-defined set ofcrash conditions. In particular, a collapse of the passenger compartment of theimpacted car has to be avoided.”
Shearlaw and Thomas (1996) give a description of the opposite ofcompatibility:
“Vehicles in collision can be said to be incompatible if the deformation andstructural characteristics mean the occupant loads are unequally distributedbetween the vehicles.”
Schoeneburg et al. (1996) do not give a definition of the term compatibilitybut define the goal which should be achieved by research in this field:
“The goal of compatibility is [...] to enhance partner protection withoutdecreasing occupant protection or to optimize occupant protection in such amanner that the overall safety of the vehicle is maximized.”
They define partner protection as the ability of the other car which collideswith the car under examination to avoid injuries in the car which it strikes.
Klanner, Felsch and Van West (1998) define compatibility as a vehiclefeature which is related to both self-protection performance andaggressiveness towards the other vehicle. The level of aggressivenessdepends on the amount of energy and the force transmitted to the otherparty but also on whether such transmission is distributed over a broadsurface or has only a local quality.
SWOV Publication D-2000-1 9
2. The statistical view
Aspects of car compatibility have been studied with statistical methods inseveral countries. Various statistical methods have been used to find therelationships between vehicle properties and injury risk and injury severity.
A general problem of using statistical methods is the difficulty of isolatingvehicle properties from other confounding variables, such as driverbehaviour. The exposition used in the various calculated risk measures isalso an issue of discussion.
Statistical analysis largely depends on the availability of bulk crash data.The structure of these data differs from country to country, or even within acountry. Furthermore, there are of course large differences in the realsituation between these countries, for instance in terms of vehiclepopulation, layout of the infrastructure and demographic issues. Thesedifferences make it difficult to compare the findings of different statisticalstudies.
The various publications discussed in this chapter have been grouped intothree subjects, vehicle mass, vehicle size and ranking. In the section onvehicle mass, the relationship between mass and injury risk/severity isdiscussed. In the section on vehicle size, the size of the vehicle is used asan explanatory variable for injury risk/severity. In the last section of thischapter the performance of individual cars concerning occupant safety incrashes is described, and on this basis different vehicle models are ranked.
2.1. Vehicle mass
Several authors have published papers on the relation between vehiclemass and injury severity. The research in these papers had its roots in thediscussion in the mid 1980s about the safety implications of downsizingvehicles because of higher standards on fuel economy. Moreover, in theearly 1990s the discussion on compatibility returned to the internationalagenda after this item had blossomed during the early 1970s but thendisappeared at the end of the decade. Different statistical methods are usedto quantify the risk of vehicle occupants being severely injured or killed inrelation to the mass of the vehicle.
Evans & Frick (1993) used data of two-car crashes from the Fatal AccidentReporting System (FARS). From these they determined the relative risk, R,of a driver fatality in the lighter of two cars compared to the risk in theheavier car as a function of the ratio, µ, of the mass of the heavier to that ofthe lighter. The data was fitted to the functional relationship R = A µu. Anadvantage of analysing the fatality rate as a function of mass ratio is that noexposure measure is required. The analysis was performed on severalsubsets of the available data, to determine the influence of safety belt use,model year, absolute mass of the involved cars, impact modus and driverfactors.
Evans and Frick conclude that mass is the dominant factor on relativedriver fatality risk when two vehicles of different mass crash into each other.
10 SWOV Publication D-2000-1
The influence of vehicle mass is expressed in two “laws” already publishedby Evans (1991):- The lighter the vehicle, the less risk to other road users.- The heavier the vehicle, the less risk to its occupants.
These two laws are also quantified. If somebody transfers to a car lighter by1%, this person=s risk of death in a two-car crash compared to the risk ofdeath to the other involved driver increases by between 2.7% and 4.3%.Correspondingly, if the driver of the other involved car transfers to a carheavier by 1%, this person=s risk of death compared to the other driverdecreases by between 2.7% and 4.3%. When a car crashes into anothertwice its mass, driver fatality risk in the lighter car is between seven and 14times that in the heavier.
In another paper, published in the American Journal of Public Health, Evans& Frick (1992) examined whether the relationship between fatality risk andcar mass has changed over time. They used the same methods asdiscussed in the previous paper. They conclude that when a car of a givenmodel year crashes into another car of the same model year but 50%heavier, the driver in the lighter car is more likely than the other driver to bekilled by a factor of about 3.7 to 5.1 for 1966 through 1979 model year cars,2.6 for 1984 model year cars, and 4.1 for 1990 model year cars. Theyexplain the reduction of the relative risk in the mid 1980s models by the factthat lighter cars benefit earlier from vehicle redesign than heavier cars.
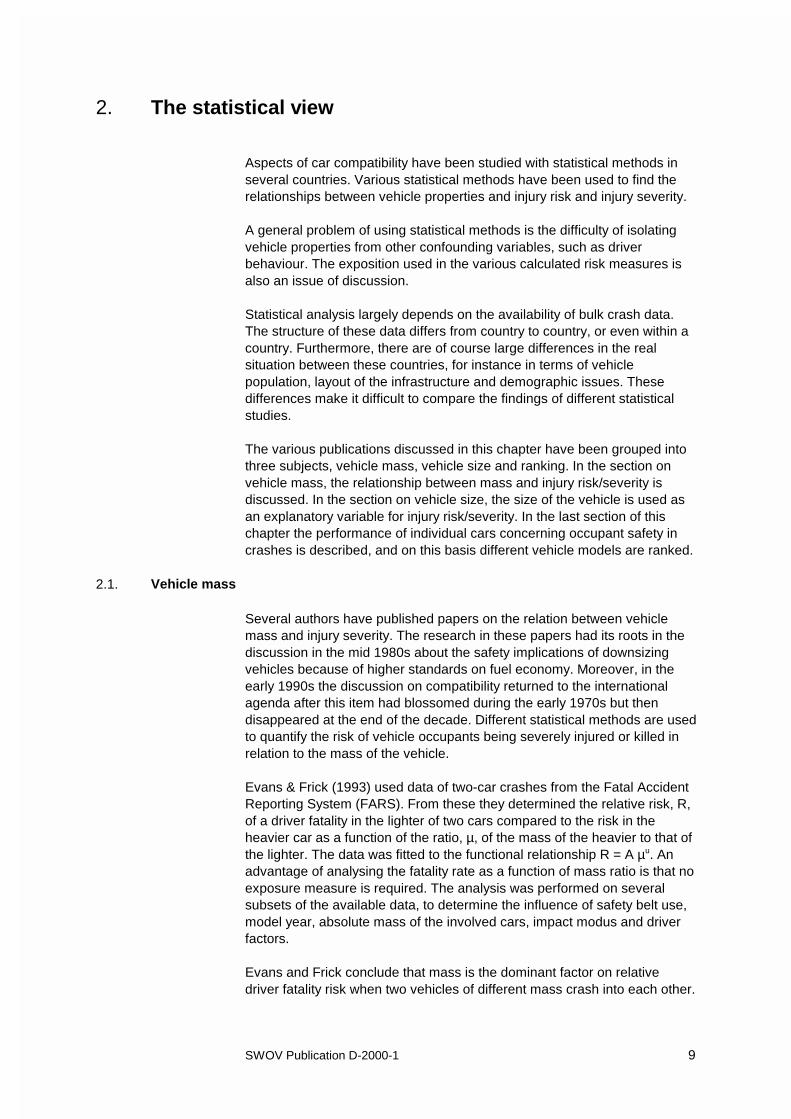
In the book Traffic Safety and the Driver (Evans, 1991) Table 1 isdiscussed, published previously by Evans & Wasielewski (1987):
Mass (kg) car i Mass category car j
m1 m2 m3 m4 m5 m6
500- 900 m1 7,04 12,12 15,15 16,05 16,86 16,51
900-1100 m2 5,06 9,78 11,88 13,38 14,58 14,68
1100-1300 m3 3,50 5,33 7,79 9,48 9,30 9,36
1300-1500 m4 2,14 2,67 4,83 6,06 6,94 7,12
1500-1800 m5 0,98 2,04 2,57 3,56 4,34 5,01
1800-2400 m6 1,00 1,48 1,86 2,61 3,01 3,46
Table 1. Relative likelihood of driver fatality in a car of mass mi involved in acrash with a car of mass mj (from Evans & Wasielewski (1987).
Table 1 shows the relative likelihood of driver fatality in a car of mass mi
involved in a crash with a car of mass mj. The table contains six masscategories. The values are calculated on the basis of an exposure estimatebased on the number of pedestrians killed in crashes involving cars in thesix mass categories. All values are expressed relative to an arbitrary valueof unity, namely a car in the heaviest mass category crashing into a car inthe lightest category (m6 x m1). Evans (1991) concludes from the data thatas a car’s mass increases, the fatality risk in that car decreases, but the riskin the other car involved increases. Another question Evans addresses iswhat happens to the net number of fatalities if a car driver transfers from alighter car to a heavier car. Within the six mass categories there are 15
SWOV Publication D-2000-1 11
y e 0.00 06 61 M 1= − (2)
y e 0 .0 01 1 02 M 0 .0 00 4 41 M1 2= − + (1)
possibilities of a driver to move to a heavier car. An m1 driver can move toan m2-m6 car, an m2 driver can move to an m3-m6 car etc. If, for example,an m3 driver moves to an m4 car, one can compare the combined risk of acrash against an m1 car. The combined risk of an m3 car crashing into an m1
car is in this case m3 x m1 + m1 x m3 = 3.50 + 15.15 = 18.65. The combinedrisk of the m4 car is in this case m4 x m1 + m1 x m4 = 2.14 + 16.05 = 18.19,which is slightly less. From the 90 comparisons, 15 possible moves x sixcars, Evans finds 78 cases with a net fatality decrease.
Evans supports his conclusion that substituting a heavier car for a lightercar nearly always reduces the system-wide harm from two-car crashes witha relationship fitted by Joksch (1983) to state injury and fatality data. Thisrelationship can be expressed as:
where y is the relative risk of an injury to an occupant in a car of mass m1
when it crashes with a car of mass m2 (masses in kg). If we add the risk tothe driver in car m1 to the risk to the driver in car m2, we obtain anexpression for the combined risk to both drivers. Doing so with the medianvalues of the weight classes used by Evans (1991) in Table 1. One can dothe same 90 comparisons he performed with his data. This leads to a netfatality decrease in 77 cases. However, the weight substitutions which donot lead to a net fatality decrease are in most cases different from the datafrom Evans (1991) than those obtained with the expression from Joksch(1983). According to Evans, these differences are spurious, especially asthe regions where the inversions occur are different.
Evans (1991) finds another mass effect concerning cars of equal weightcrashing into each other. From both the data in table 1 and the expressionfound by Joksch (1983), Evans (1991) finds that the heavier the car, thelower the risk of a fatality.
Substitution of m2 by m1 in Equation 1 generates the following equation:
It follows from Equation 2 that the relative fatality risk in a crash betweentwo 900 kg cars is 1.8 times higher than in a crash between two 1,800 kgcars.
Thomas et al. (1990) analysed data taken from the computer file of theFrench national police. They sought to quantify the risks induced by varyinglevels of aggressiveness between cars involved in collisions with oneanother. The cars involved in head-on crashes were divided into threeweight categories, < 800 kg, 801 to 1,000 kg and > 1,000 kg. For eachweight category the internal and external safety was determined for twoseverity rates. The internal safety is associated with the occupants of thecase vehicle, the external safety is associated with occupants of theopposing vehicle. Firstly, the internal and external safety were expressed ina mortality rate. Secondly, the internal and external safety were expressedin a severe injury rate. In this rate both fatalities and severe injuries were
12 SWOV Publication D-2000-1
A - MOR T AL IT Y R AT E
0,04 0,03 0,02 0,01 0,00 0,01 0,02 0,03 0,04 0,05
INT ER NAL EXT ER NAL
Collisions Total
involv ing at number
least one car of o f
we ight .... driv ers
≤ 800 kg ( 8948)
801 to 1000 kg ( 11824)
>1000 kg ( 6726)
Total
.042
.050
.057
B - S EVER E INJ U R Y R AT E
0, 4 0 0 , 3 0 0 , 2 0 0 , 1 0 0 , 0 0 0 , 1 0 0 , 2 0 0 , 3 0 0 , 4 0 0 , 5 0
≤ 800 kg
801 to 1000 kg
>1000 kg
.524
.524
.552
INT ER NAL EXT ER NAL
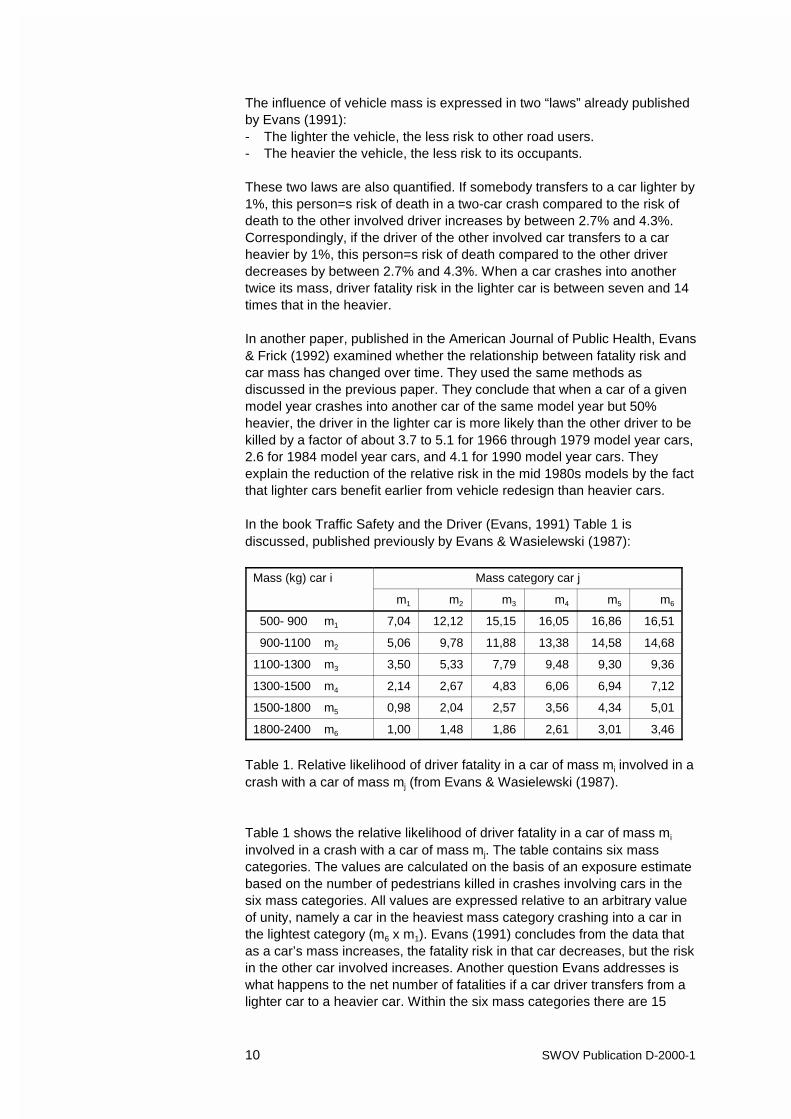
taken into account. The results are shown in Figure 1, taken from Thomaset al. (1990).
Figure 1. Mortality and severe injury rate (internal and external) for 1000belted drivers according to the weight of the car in head-on collisions(reproduced from Thomas et al., 1990).
Figure 1 shows that the interior mortality rate decreases with the rise inmass of the cars in question (from 0.0305 to 0.0145). The corollary of this isthe rise in the exterior mortality rate in the opposing vehicle (from 0.0119 to0.0425).
For 1,000 collisions involving at least one light vehicle, the total number offatalities in both vehicles is 42, as against 50 and 57 when the cars are inthe average weight category or the heavy weight category respectively.When the severe injury rate is used, these figures vary only fractionally withthe weight category.
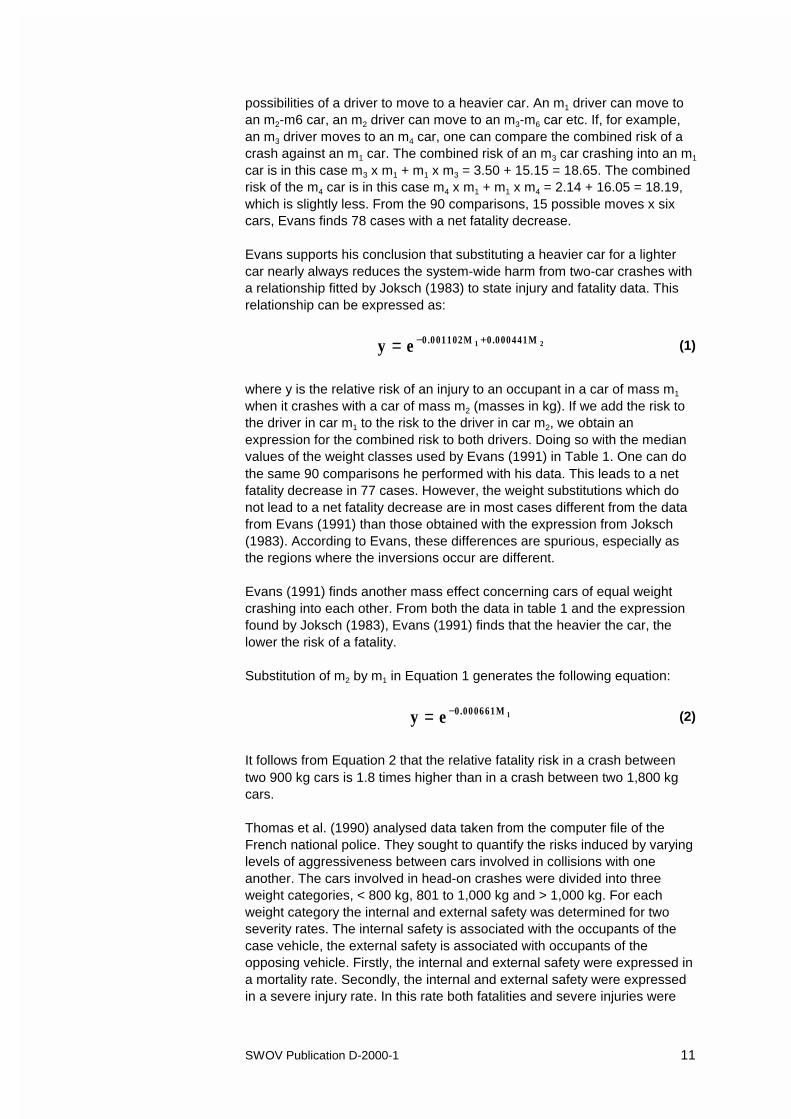
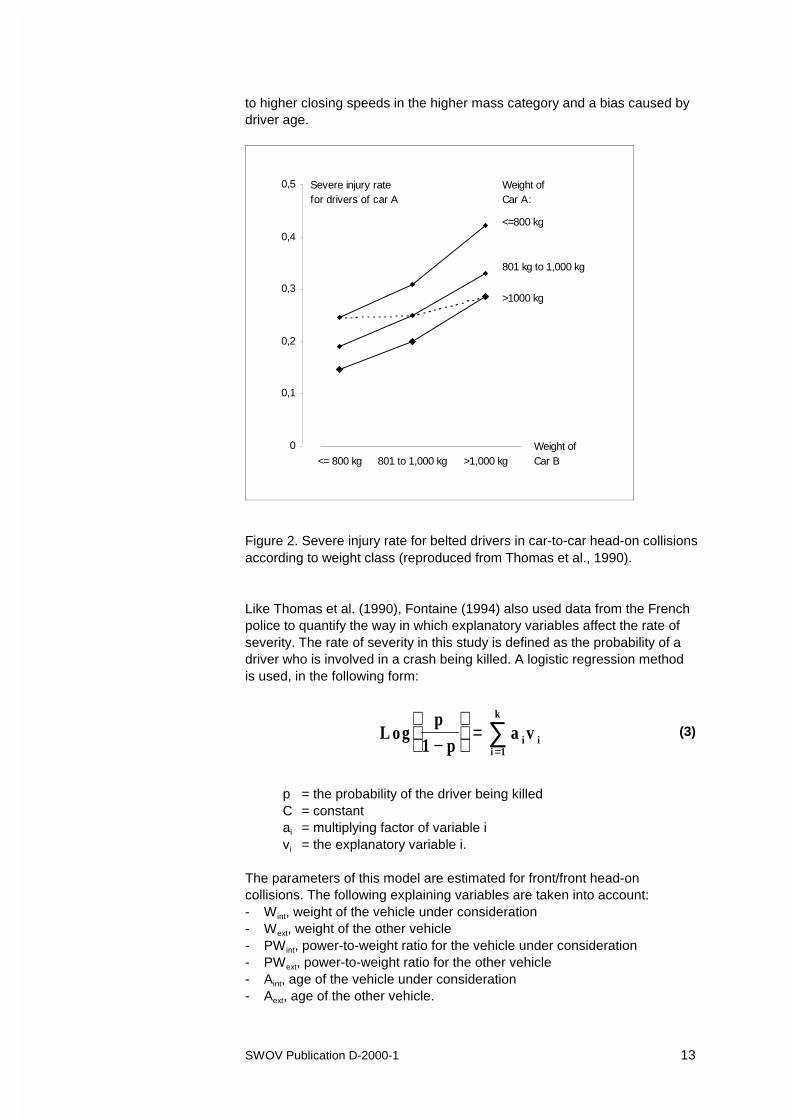
Thomas et al. (1990) also present a graph in which the influence of themass ratio is shown. Reproduced here as Figure 2, this shows that in ahead-on crash between a car from < 800 kg category and a car from >1,000 kg the interior safety of the < 800 kg car equals 0.421 and the interiorsafety of the > 1,000 kg car equals 0.147. In this case this can also be readas follows: the exterior safety of the < 800 kg car equals 0.147 and of the >1000 kg car 0.421.
Both Figures 1 and 2 show that the interior safety increases with higherweight and that the exterior safety decreases with higher weight of theinvolved car.
Figure 2 also shows, by the discontinuous line, that in crashes between carsfrom the same weight category the interior safety of the car decreases withan increase in the weight category. This effect, which is in disagreementwith the findings of Evans (1991), according to Thomas et al. (1990) is due
SWOV Publication D-2000-1 13
0
0,1
0,2
0,3
0,4
0,5
<= 800 kg 801 to 1,000 kg >1,000 kg
Weight of Car A:
Severe injury ratefor drivers of car A
Weight of Car B
<=800 kg
801 kg to 1,000 kg
>1000 kg
L ogp
1 pa vi i
i 1
k
−
=
=∑ (3)
to higher closing speeds in the higher mass category and a bias caused bydriver age.
Figure 2. Severe injury rate for belted drivers in car-to-car head-on collisionsaccording to weight class (reproduced from Thomas et al., 1990).
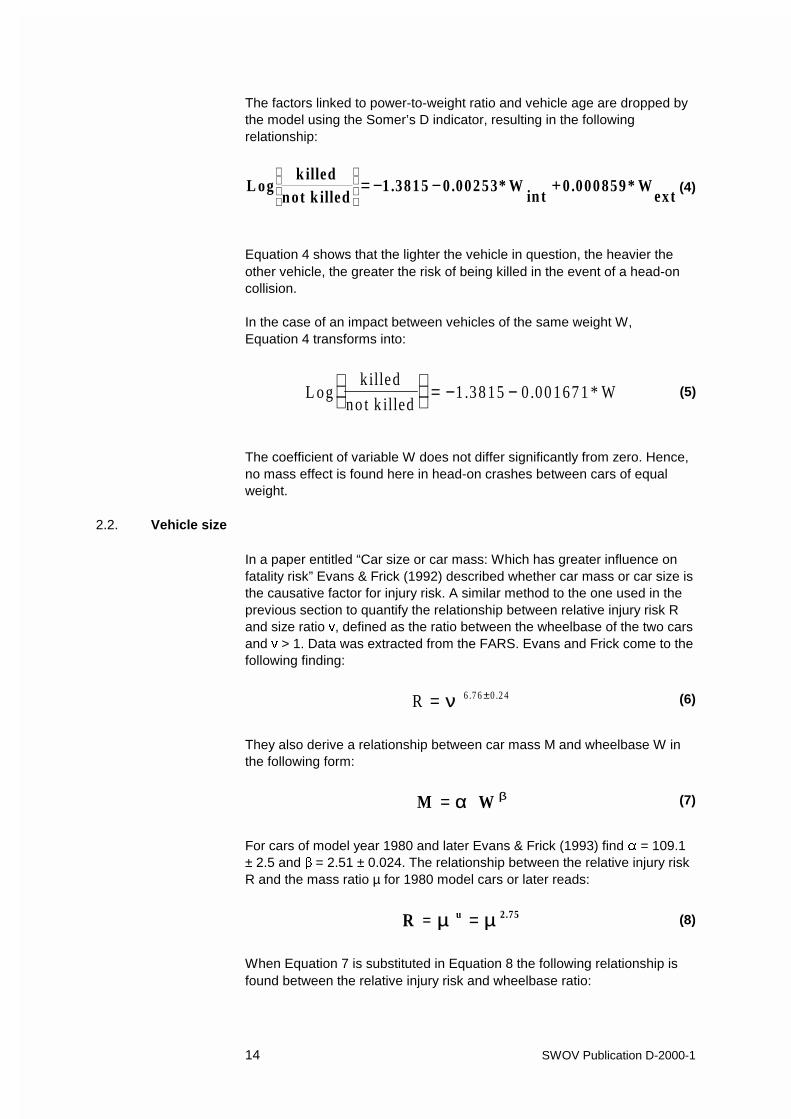
Like Thomas et al. (1990), Fontaine (1994) also used data from the Frenchpolice to quantify the way in which explanatory variables affect the rate ofseverity. The rate of severity in this study is defined as the probability of adriver who is involved in a crash being killed. A logistic regression methodis used, in the following form:
p = the probability of the driver being killedC = constantai = multiplying factor of variable ivi = the explanatory variable i.
The parameters of this model are estimated for front/front head-oncollisions. The following explaining variables are taken into account:- Wint, weight of the vehicle under consideration- Wext, weight of the other vehicle- PWint, power-to-weight ratio for the vehicle under consideration- PWext, power-to-weight ratio for the other vehicle- Aint, age of the vehicle under consideration- Aext, age of the other vehicle.
14 SWOV Publication D-2000-1
R 6 .7 6 0 .2 4= ±ν (6)
M W= α β (7)
L ogk illed
no t k illed1 .38 15 0 .00 167 1 * W
= − − (5)
R = u 2 .75µ µ= (8)
L ogk illed
n ot k illed1 .3815 0 .00253* W
in t0 .000859 * W
ext
= − − + (4)
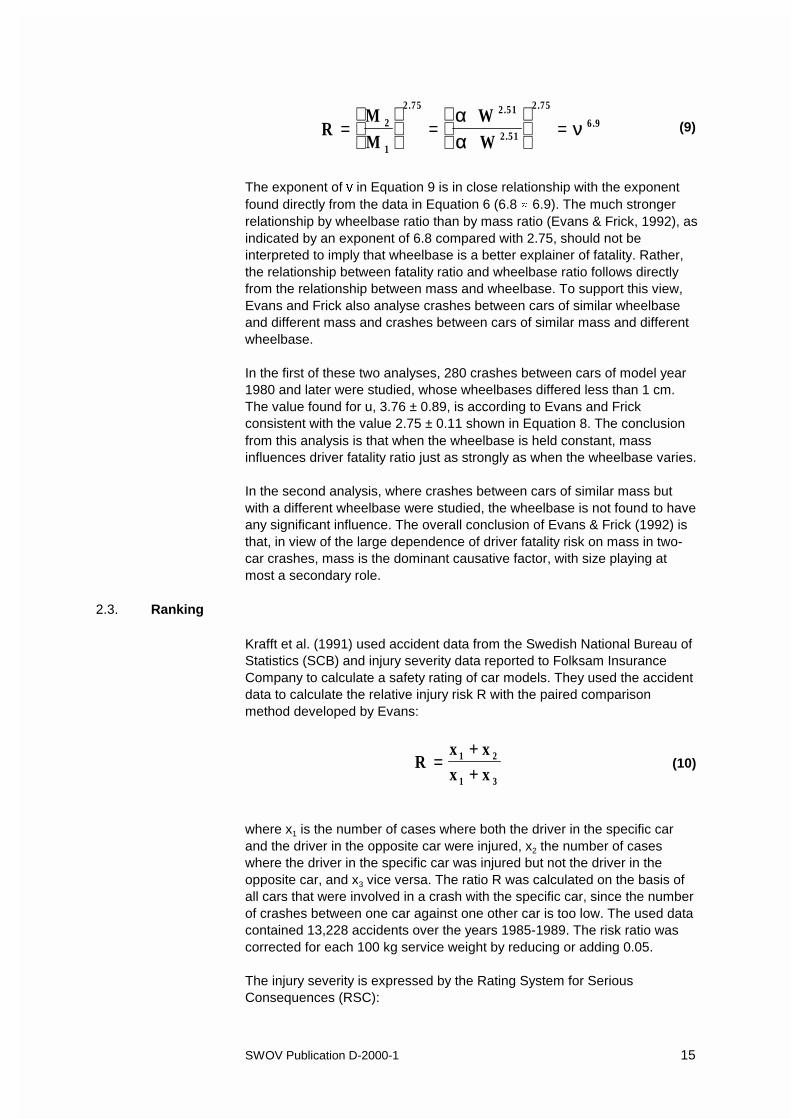
The factors linked to power-to-weight ratio and vehicle age are dropped bythe model using the Somer’s D indicator, resulting in the followingrelationship:
Equation 4 shows that the lighter the vehicle in question, the heavier theother vehicle, the greater the risk of being killed in the event of a head-oncollision.
In the case of an impact between vehicles of the same weight W,Equation 4 transforms into:
The coefficient of variable W does not differ significantly from zero. Hence,no mass effect is found here in head-on crashes between cars of equalweight.
2.2. Vehicle size
In a paper entitled “Car size or car mass: Which has greater influence onfatality risk” Evans & Frick (1992) described whether car mass or car size isthe causative factor for injury risk. A similar method to the one used in theprevious section to quantify the relationship between relative injury risk Rand size ratio �, defined as the ratio between the wheelbase of the two carsand � > 1. Data was extracted from the FARS. Evans and Frick come to thefollowing finding:
They also derive a relationship between car mass M and wheelbase W inthe following form:
For cars of model year 1980 and later Evans & Frick (1993) find � = 109.1± 2.5 and � = 2.51 ± 0.024. The relationship between the relative injury riskR and the mass ratio µ for 1980 model cars or later reads:
When Equation 7 is substituted in Equation 8 the following relationship isfound between the relative injury risk and wheelbase ratio:
SWOV Publication D-2000-1 15
Rx xx x
1 2
1 3
=++
(10)
RMM
W W
2
1
2.75 2.51
2.51
2.75
6.9=
=
=
αα
ν (9)
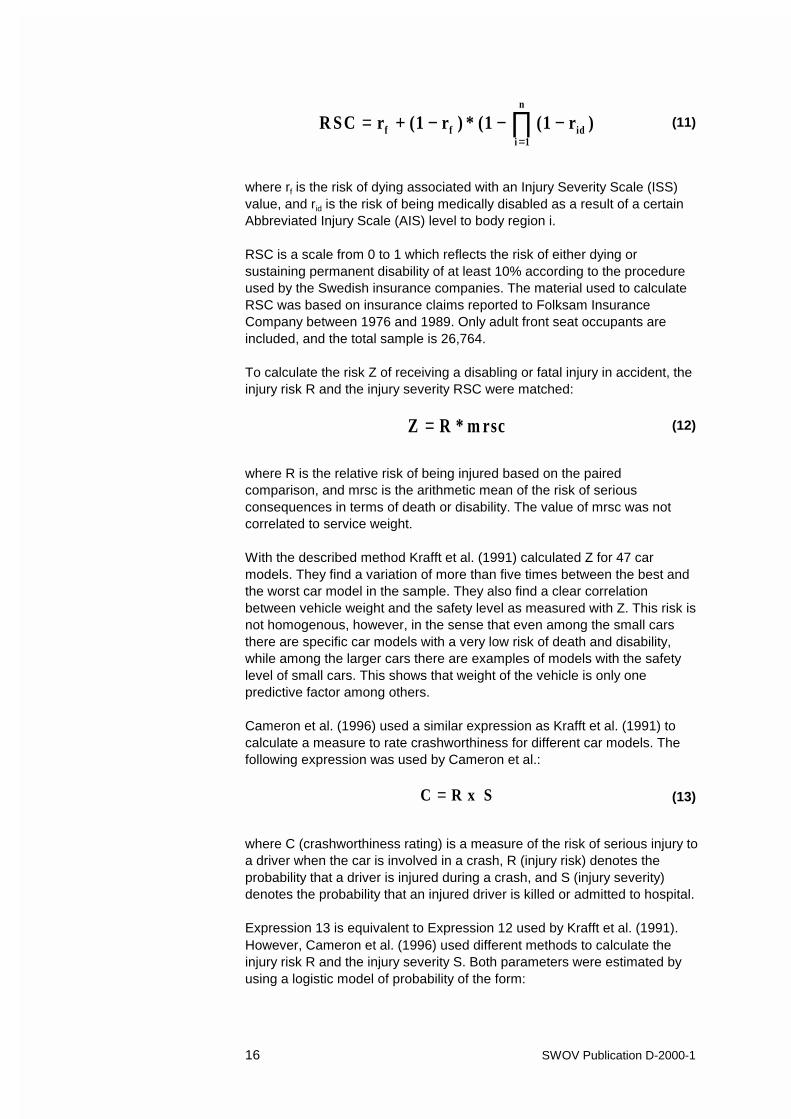
The exponent of � in Equation 9 is in close relationship with the exponentfound directly from the data in Equation 6 (6.8 � 6.9). The much strongerrelationship by wheelbase ratio than by mass ratio (Evans & Frick, 1992), asindicated by an exponent of 6.8 compared with 2.75, should not beinterpreted to imply that wheelbase is a better explainer of fatality. Rather,the relationship between fatality ratio and wheelbase ratio follows directlyfrom the relationship between mass and wheelbase. To support this view,Evans and Frick also analyse crashes between cars of similar wheelbaseand different mass and crashes between cars of similar mass and differentwheelbase.
In the first of these two analyses, 280 crashes between cars of model year1980 and later were studied, whose wheelbases differed less than 1 cm.The value found for u, 3.76 ± 0.89, is according to Evans and Frickconsistent with the value 2.75 ± 0.11 shown in Equation 8. The conclusionfrom this analysis is that when the wheelbase is held constant, massinfluences driver fatality ratio just as strongly as when the wheelbase varies.
In the second analysis, where crashes between cars of similar mass butwith a different wheelbase were studied, the wheelbase is not found to haveany significant influence. The overall conclusion of Evans & Frick (1992) isthat, in view of the large dependence of driver fatality risk on mass in two-car crashes, mass is the dominant causative factor, with size playing atmost a secondary role.
2.3. Ranking
Krafft et al. (1991) used accident data from the Swedish National Bureau ofStatistics (SCB) and injury severity data reported to Folksam InsuranceCompany to calculate a safety rating of car models. They used the accidentdata to calculate the relative injury risk R with the paired comparisonmethod developed by Evans:
where x1 is the number of cases where both the driver in the specific carand the driver in the opposite car were injured, x2 the number of caseswhere the driver in the specific car was injured but not the driver in theopposite car, and x3 vice versa. The ratio R was calculated on the basis ofall cars that were involved in a crash with the specific car, since the numberof crashes between one car against one other car is too low. The used datacontained 13,228 accidents over the years 1985-1989. The risk ratio wascorrected for each 100 kg service weight by reducing or adding 0.05.
The injury severity is expressed by the Rating System for SeriousConsequences (RSC):
16 SWOV Publication D-2000-1
C R x S= (13)
R SC r (1 r ) * (1 (1 r )f f idi 1
n
= + − − −=
∏ (11)
Z R * m rsc= (12)
where rf is the risk of dying associated with an Injury Severity Scale (ISS)value, and rid is the risk of being medically disabled as a result of a certainAbbreviated Injury Scale (AIS) level to body region i.
RSC is a scale from 0 to 1 which reflects the risk of either dying orsustaining permanent disability of at least 10% according to the procedureused by the Swedish insurance companies. The material used to calculateRSC was based on insurance claims reported to Folksam InsuranceCompany between 1976 and 1989. Only adult front seat occupants areincluded, and the total sample is 26,764.
To calculate the risk Z of receiving a disabling or fatal injury in accident, theinjury risk R and the injury severity RSC were matched:
where R is the relative risk of being injured based on the pairedcomparison, and mrsc is the arithmetic mean of the risk of seriousconsequences in terms of death or disability. The value of mrsc was notcorrelated to service weight.
With the described method Krafft et al. (1991) calculated Z for 47 carmodels. They find a variation of more than five times between the best andthe worst car model in the sample. They also find a clear correlationbetween vehicle weight and the safety level as measured with Z. This risk isnot homogenous, however, in the sense that even among the small carsthere are specific car models with a very low risk of death and disability,while among the larger cars there are examples of models with the safetylevel of small cars. This shows that weight of the vehicle is only onepredictive factor among others.
Cameron et al. (1996) used a similar expression as Krafft et al. (1991) tocalculate a measure to rate crashworthiness for different car models. Thefollowing expression was used by Cameron et al.:
where C (crashworthiness rating) is a measure of the risk of serious injury toa driver when the car is involved in a crash, R (injury risk) denotes theprobability that a driver is injured during a crash, and S (injury severity)denotes the probability that an injured driver is killed or admitted to hospital.
Expression 13 is equivalent to Expression 12 used by Krafft et al. (1991).However, Cameron et al. (1996) used different methods to calculate theinjury risk R and the injury severity S. Both parameters were estimated byusing a logistic model of probability of the form:
SWOV Publication D-2000-1 17
( )log P lnP
1 PX . . . X F (X )0 1 1 K Kit =
−
= + + =β β β (14)
The logistic regression model of the injury risk R was estimated from dataon 288,612 drivers involved in tow-away crashes in New South Wales,Australia.The conclusion is that driver sex and age, speed zone and number ofvehicles, along with first-order interactions between speed zone andnumber of vehicles, sex and number of vehicles, age and sex, speed zoneand age and speed zone and sex and second-order interactions betweensex and speed zone and number of vehicles and sex and speed zone andage are all significantly associated with injury risk. These factors wereincluded in the logistic model to calculate R.
The injury severity S (Equation 13) was based on 62,725 injured drivers incrashes in Victoria and New South Wales during 1987-94. In this analysisdriver age and sex, speed zone and number of vehicles were also identifiedas affecting the result. First-order interactions between sex and age, speedzone and age, speed zone and number of vehicles and age and number ofvehicles were found to have significant interactions with injury severity.
The crashworthiness rating for each car model was obtained for 109 carmodels by multiplying the individual injury risk and injury severity. Theassociated 95% confidence intervals were also calculated, to indicate thateach crashworthiness rating is an estimate of the risk of a driver being killedor admitted to hospital in a tow-away crash.
A simpler approach to rank vehicles on occupant safety was applied byTarrière et al. (1994). This paper examined 27 car models involved in head-on collisions. For each model an internal severe injury rate and an externalinjury rate was calculated. The internal severe injury rate of a particularvehicle was calculated as the number of drivers killed or severely injuredseated in this car divided by the total number of involved drivers. Theexternal injury safety rate is the number of fatalities and severely injureddrivers seated in the opposite cars divided by the total number of involveddrivers.
Van Kampen (1998) developed two metrics for expressing the passivesafety of vehicle models. The metric for crashworthiness (EV) provides anindication of the occupants’ safety for a certain vehicle model. This metricwas calculated by dividing the number of severely injured and killed driversof the subject vehicle model by the number of occurrences of the subjectvehicle model in the used data file. The second metric, called theaggressiveness index (AV), expresses the degree of injury caused by acertain vehicle model to occupants of the opposite vehicle. This metric wascalculated by dividing the total number of severely injured or killed driversin the opposite vehicles by the total number of occurrences of the subjectvehicle. Both metrics were calculated for those vehicle models occurringmore than 100 times in a data file containing 5,680 accidents involving11,356 vehicles with a vehicle mass less than 3,500 kg. The accidents wereselected from the Dutch National Register on Road Traffic Accidents (VOR)over the year 1996. The vehicle data were linked to the accident data from

18 SWOV Publication D-2000-1
the files of the National Vehicle Register (RDW). From the results aconsistent relationship emerges: as vehicle mass increases, thecrashworthiness index decreases and the aggressiveness index increases.
SWOV Publication D-2000-1 19
3. The mechanical view
In this chapter the mechanical aspect of compatibility is the subject ofstudy. The mechanism of a two-car collision can be analysed usingmechanical theory in terms of the interaction between two bodies eachhaving their own mass distribution, stiffness properties and geometry.
3.1. Classical theory of impact
Newtonian mechanics is a relative simple theory used to describe andanalyse the problem of incompatibility between cars. Before discussing anumber of papers, the basic formulas of crash mechanics are given here(Goldsmith, 1960).
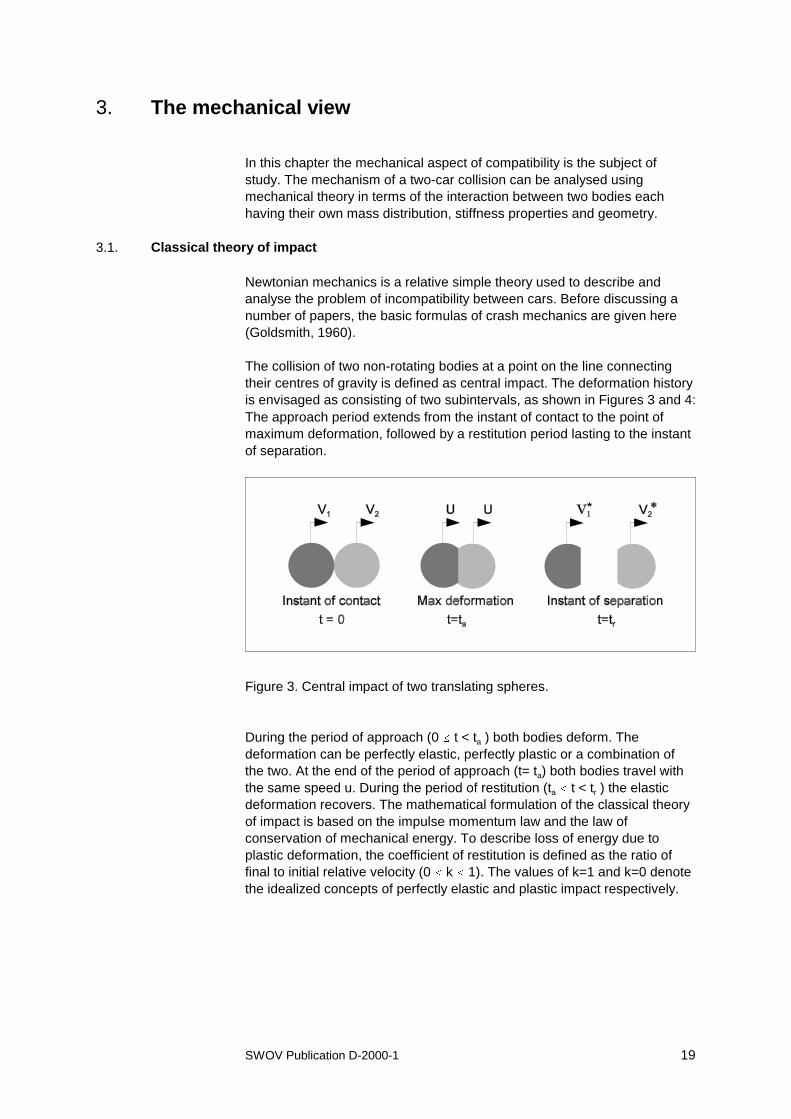
The collision of two non-rotating bodies at a point on the line connectingtheir centres of gravity is defined as central impact. The deformation historyis envisaged as consisting of two subintervals, as shown in Figures 3 and 4:The approach period extends from the instant of contact to the point ofmaximum deformation, followed by a restitution period lasting to the instantof separation.
Figure 3. Central impact of two translating spheres.
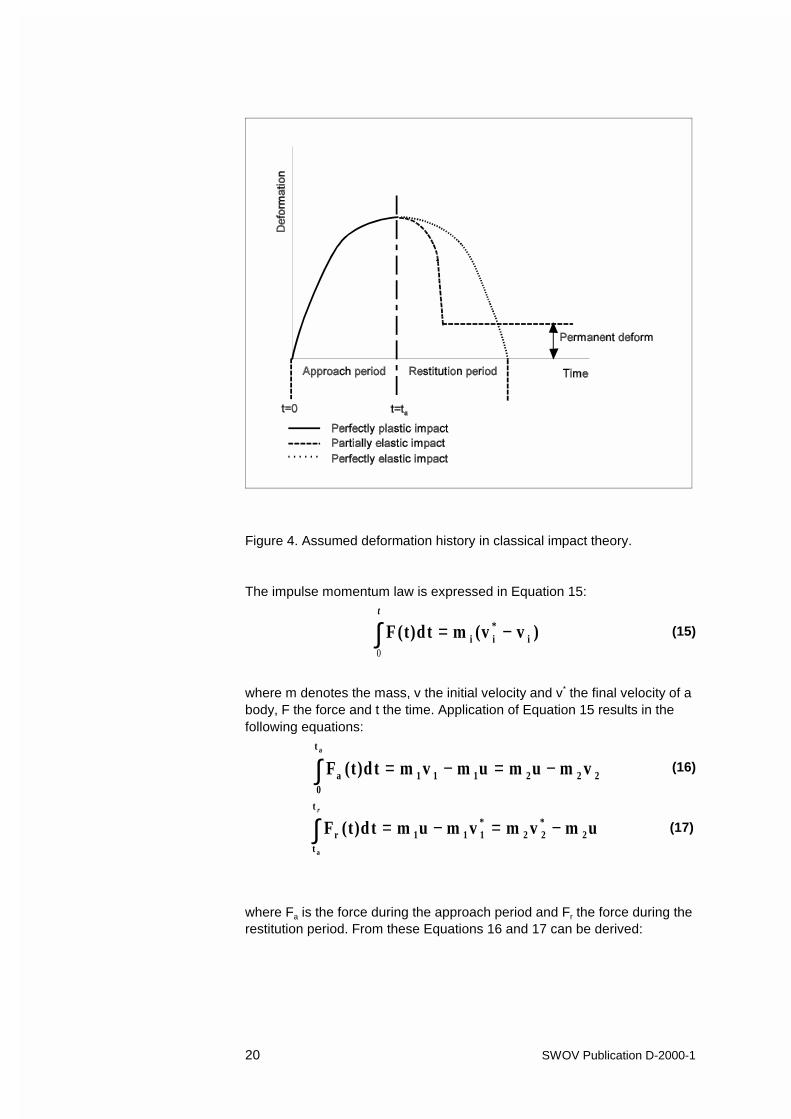
During the period of approach (0 � t < ta ) both bodies deform. Thedeformation can be perfectly elastic, perfectly plastic or a combination ofthe two. At the end of the period of approach (t= ta) both bodies travel withthe same speed u. During the period of restitution (ta � t < tr ) the elasticdeformation recovers. The mathematical formulation of the classical theoryof impact is based on the impulse momentum law and the law ofconservation of mechanical energy. To describe loss of energy due toplastic deformation, the coefficient of restitution is defined as the ratio offinal to initial relative velocity (0 � k � 1). The values of k=1 and k=0 denotethe idealized concepts of perfectly elastic and plastic impact respectively.
20 SWOV Publication D-2000-1
F (t)dt m (v v )i i*
i= −∫0
t
(15)
F (t)d t m v m u m u m va0
t
1 1 1 2 2 2
a
∫ = − = − (16)
F (t)d t m u m v m v m urt
t
1 1 1*
2 2*
2
a
r
∫ = − = − (17)
Figure 4. Assumed deformation history in classical impact theory.
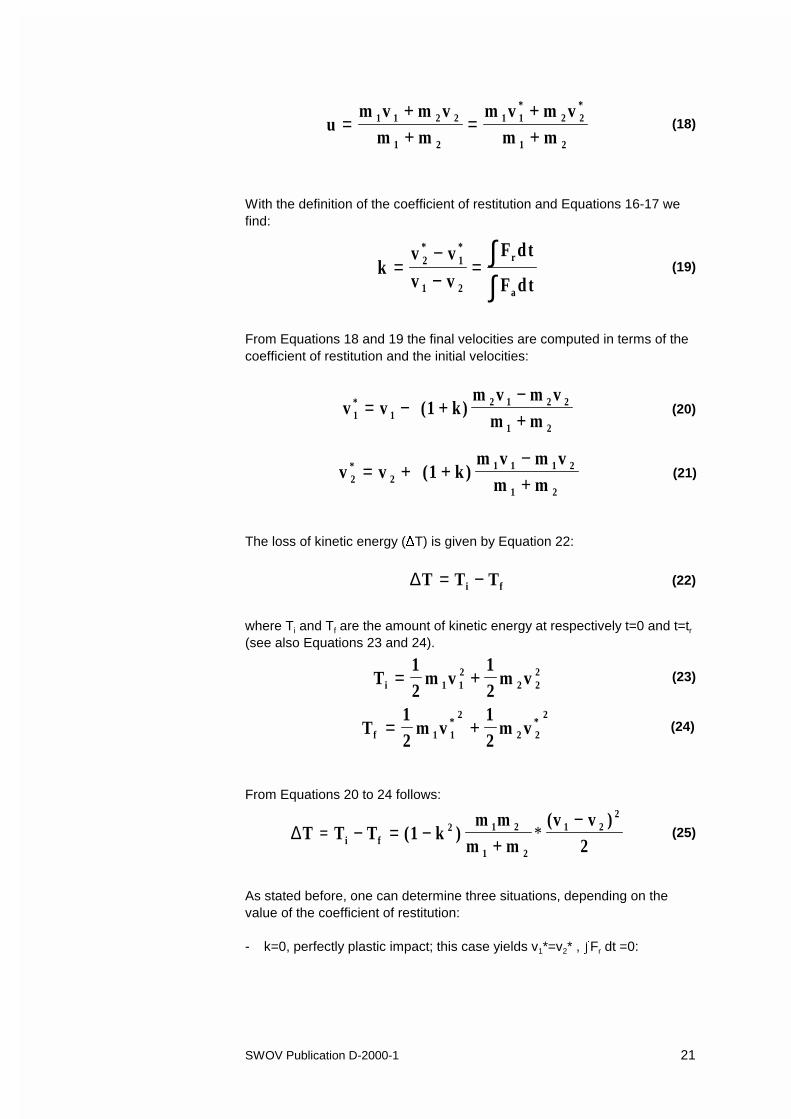
The impulse momentum law is expressed in Equation 15:
where m denotes the mass, v the initial velocity and v* the final velocity of abody, F the force and t the time. Application of Equation 15 results in thefollowing equations:
where Fa is the force during the approach period and Fr the force during therestitution period. From these Equations 16 and 17 can be derived:
SWOV Publication D-2000-1 21
kv vv v
F dt
F dt2*
1*
1 2
r
a
=−−
= ∫∫
(19)
v v (1 k)m v m v
m m1*
12 1 2 2
1 2
= − +−+
(20)
v v (1 k )m v m v
m m2*
21 1 1 2
1 2
= + +−+
(21)
um v m v
m mm v m v
m m1 1 2 2
1 2
1 1*
2 2*
1 2
=++
=++
(18)
∆T T Ti f= − (22)
T12
m v12
m vi 1 12
2 22= + (23)
T12
m v12
m vf 1 1*
2
2 2*
2
= + (24)
∆T = T T (1 k )m m
m m(v v )
2i f2 1 2
1 2
1 22
− = −+
−* (25)
With the definition of the coefficient of restitution and Equations 16-17 wefind:
From Equations 18 and 19 the final velocities are computed in terms of thecoefficient of restitution and the initial velocities:
The loss of kinetic energy (�T) is given by Equation 22:
where Ti and Tf are the amount of kinetic energy at respectively t=0 and t=tr(see also Equations 23 and 24).
From Equations 20 to 24 follows:
As stated before, one can determine three situations, depending on thevalue of the coefficient of restitution:
- k=0, perfectly plastic impact; this case yields v1*=v2* , ,Fr dt =0:
22 SWOV Publication D-2000-1
E12
(m m )v1 2 B2= + (27)
(m m ) 01 22− ≥ (28)
(m m ) 4m m1 22
1 2+ ≥ (29)
m m4m m
m m1 21 2
1 2
+ ≥+
(30)
D12
m mm m
v12
m mm m
(2v )12
(m m )v E1 2
1 2c2 1 2
1 2B
21 2 B
2=+
≤+
≤ + = (31)
∆Tm m
m m(v v )
21 2
1 2
1 22
=+
−* (26)
- 0�k�1, partially elastic impact; this case yields ,Fa dt > ,Fr dt- k=1, perfectly elastic impact; this case yields ,Fa dt = ,Fr dt and �T= 0.
Zobel (1998) used the classical theory of impact to show that when twovehicles of different mass collide at a closing speed vc of twice their designspeed vB, then the available deformation energy is sufficient to sustain thecollision without intrusion. vB is the speed used in a successful crash testagainst a rigid barrier, hence the vehicle has sufficient deformation energyavailable to dissipate an amount of kinetic energy of 0.5 m vB
2.
The amount of required deformation energy D is given by Equation 26,which is the amount of kinetic energy loss in case of a perfectly plasticimpact. The available amount of deformation energy E is given byEquation 23 by replacing the two velocities with vB, which results in:
To prove that the available deformation energy E is greater than theamount of required deformation energy D, Zobel (1998) shows that D � Eas follows. A square is always positive:
By adding 4m1m2 it can be seen that:
or dividing by (m1 + m2)
Equations 26, 27 and 30 result in a basic finding on compatibility:
Equation 31 holds only when it is possible to compel both vehicles todeform. Zobel (1998) states that in real-world accidents this is not always
SWOV Publication D-2000-1 23
D12
m vl B2= (32)
D F (s)ds F * s l= =∫ (33)
F12
m v sl B2
l=
(34)
F m * as s= (35)
v =2 * s * a
Bl s
µ(36)
the case. Sometimes both vehicles deform similarly, sometimes one of thevehicles is almost undeformed, while the other is completely destroyed. Toforce both vehicles to deform, the “bulkhead concept” is introduced. Thebulkhead concept means that a maximum force level is defined for the frontend of the car. A bulkhead has to be built which is able to sustain thismaximum force. This bulkhead would avoid a compartment collapse, aslong as one of the vehicles is still deforming.
The bulkhead principle has its limitations, however. Zobel (1998) shows thatthe test speed in rigid barrier tests for larger cars is limited to assurecompatibility for cars having a mass ratio µ = ml/ms of 1.6. A mass ratio of1.6 covers approximately 90% of the German real-world frontal collisions.
The available deformation energy D of a large car with mass ml, designedfor a barrier impact speed vB can be computed in two ways:
From Equations 32 and 33 follows:
When the large car collides with a small car and dynamic effects areneglected, then the principle action equals reaction can be used and theforce acting on the large car equals the force acting on the small. The forceacting on the small car can be computed as follows:
From Equation 34 and 35, Equation 36 can be derived:
Zobel (1998) states that the deformation stroke of the large car, sl, is limitedto 0.7 m and that the maximum acceptable deceleration of the small car is30g, in terms of acceptable dummy loads.With as = 30g, sl = 0.7 m and µ = 1.6, it follows from Equation 36 that themaximum test speed vB = 57.8 km/h. From Equation 36 it also follows that,given a certain value for as and sl, an increase of the test speed vB of the
24 SWOV Publication D-2000-1
larger car will result in a smaller value of the mass ratio µ, meaning thatcompatibility is only possible in a smaller vehicle range.
3.2. In-depth accident analysis
In the previous chapter, papers were discussed which deal with statisticalanalysis using more general information collected from real-worldaccidents. Another approach is to collect detailed information of real-worldaccidents to perform in-depth analysis.
Shearlaw & Thomas (1996) state that current crash testing does notconsider vehicle safety in terms of the occupants of an opposing vehicle.Real-world accident data can be used to study effects of vehicle structureon the injury outcome in a number of impact types.
In this paper, presented at the 15th ESV conference in Melbourne, fivecases of car-to-car crashes are used to demonstrate methods of studyingcompatibility in real-world accidents. The data of these accidents werecollected within the UK Cooperative Crash Injury Study between 1992 and1995. Basically four methods are described in the paper.
The first method Shearlaw & Thomas (1996) describe to study compatibilityis to investigate accident types which lie on the extreme of the spectrum ofincompatible crashes. An example of such a crash is a mid-sized salooncolliding with a van. From this type of accidents one can learn aboutincompatibility caused by difference in geometry, i.e. the mismatch of stiffstructures in both cars.
The second method described is to study collisions between two apparentlysimilar cars. The difference of deformation behaviour of both cars and thedifferences in the injury outcome can give insight into which design aspectscause incompatibility.
The third method consists of studying one particular model in one accidentscenario. This can furnish information about the response to differentstriking vehicles
The last method described is to study crashes where both cars show goodcompatibility, despite mass differences. One can learn from these caseshow compatible cars should be built.
3.3. Crash tests
Crash tests are used by several parties for a number of reasons. Carmanufacturers perform crash tests to optimize designs and to prove thatnewly designed cars comply with governmental directives. Other institutesperform crash programmes to investigate the passive safety of new cars,and publish the results to inform the public. Examples of such crashprogrammes are:- New Car Assessment Programme (NCAP).
This programme is performed by the National Highway Traffic SafetyAdministration in the United States.
- Crashworthiness Evaluations.
SWOV Publication D-2000-1 25
This programme is performed by the Insurance Institute of HighwaySafety (IIHS) in the United States.
- European New Car Assessment Programme (EuroNCAP).This programme is performed by a consortium of consumersassociations, motoring organizations and governmental bodies inEurope.
- Australian New Car Assessment Programme (ANCAP).This programme is performed by the (NRMA) and supported by allAustralian automobile clubs and the state government road andtransport authorities in Queensland, New South Wales and SouthAustralia.
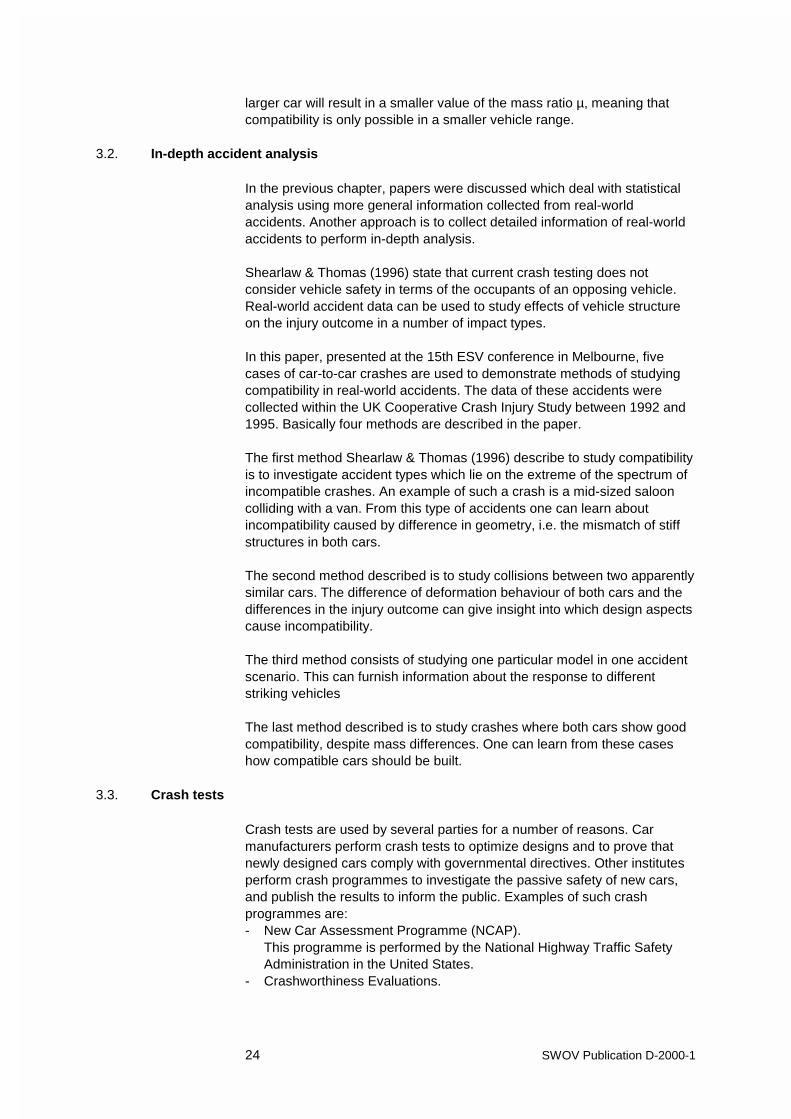
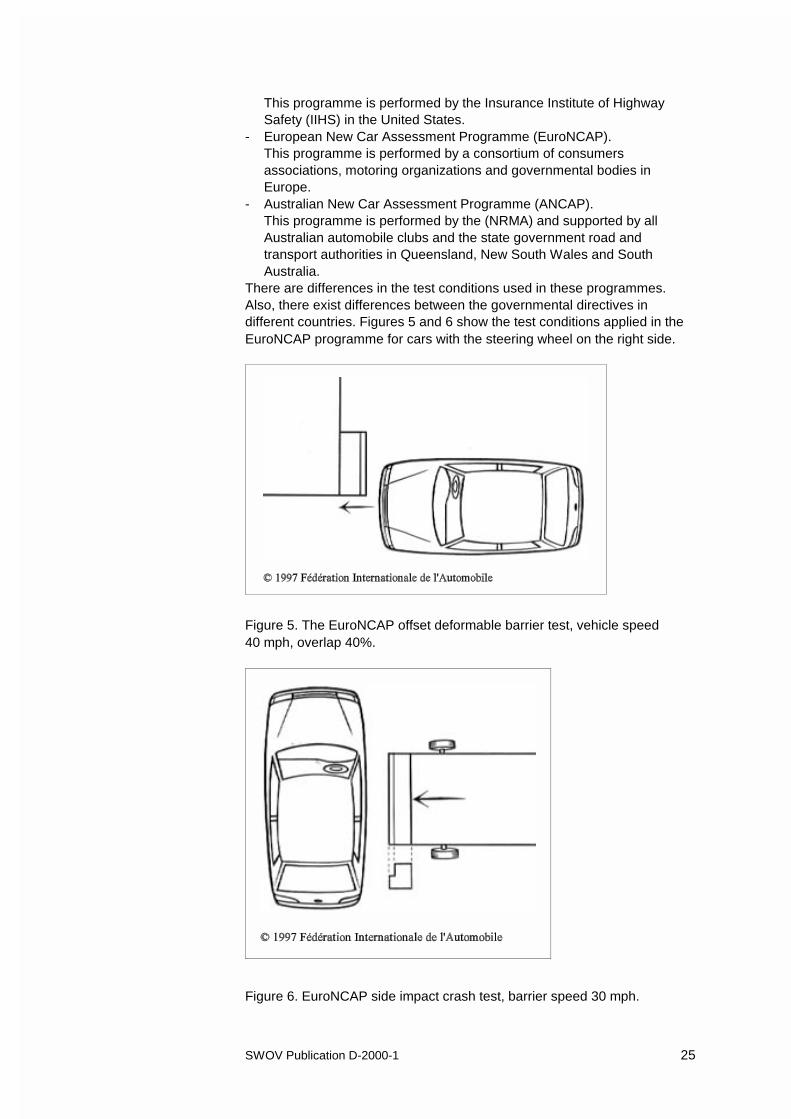
There are differences in the test conditions used in these programmes.Also, there exist differences between the governmental directives indifferent countries. Figures 5 and 6 show the test conditions applied in theEuroNCAP programme for cars with the steering wheel on the right side.
Figure 5. The EuroNCAP offset deformable barrier test, vehicle speed40 mph, overlap 40%.
Figure 6. EuroNCAP side impact crash test, barrier speed 30 mph.
26 SWOV Publication D-2000-1
In the frontal impact of the EuroNCAP programme, the test car impactsagainst a deformable structure. The impact is across 40% of the test car'sfront and is intended to represent a crash with a car of equivalent size andweight. The offset test is always on the driver's side, where there is morerisk of injury from the steering wheel and pedals.
For the EuroNCAP side impact test, a trolley with a deformable aluminiumblock is driven into the stationary test car driver's door at 50 km/h (30 mph).These test conditions are similar to test conditions required in EuropeanDirective 96/27/EC.
Additionally the EuroNCAP programme contains test procedures toinvestigate the injury risk of pedestrians hit by the tested vehicle and toevaluate child restraint systems. These subjects are beyond the scope ofthis report. Both the tests required by governments, such as 96/79/EC,96/27/EC in Europe and FMVSS 214D and FMVSS 208 in the UnitedStates, and the tests performed in the New Car Assessment Programmesemphasize occupant protection and not aggressiveness or opponent safety.The test results are based on dummy readings and intrusion of the occupantcompartment. A major concern during the development of these tests wasthat the test should be representative of real-world accident conditions.
Stcherbatcheff et al. (1989) analysed 39 tests with five different car modelsof the Renault range. Subject of this study was a test which could be usedas reference frontal impact. They compared the results of six differentfrontal collisions: offset car-to-car impact with 50% overlap on the left side;30o angled barrier impact on the left side; 30o angled barrier impact plusside wall; 30o angled barrier impact with anti-slip system; offset half-barrierimpact with 45% overlap on the left side; and impact against 0o angledbarriers. Furthermore, they compared these six impact configurations withaccident data from the real world.
The collision between a car and a deformable moving barrier of given masswas intentionally not taken into account, for two reasons:- This configuration would result in excessive scatter of the speed
variation between vehicles tests, depending on their weight.- Collisions between heavy vehicles and a fixed barrier at high velocity
change would not be represented in this type of collision, due toexcessively small velocity change in relation to a much lighter movingbarrier.
Stcherbatcheff et al. (1989) find that the 30o angled barrier impact seemsmost representative of real-world accidental conditions. As regardscompatibility, they conclude that a single reference configuration in frontalimpact cannot by itself solve the complex problems posed by inter-vehiclearchitecture and stiffness compatibility, especially in side impacts.
Klanner et al. (1996) state that the frontal impact test with a deformablebarrier copies as closely as possible the real accident process. However,this test does not provide information on vehicle compatibility. In theircontribution to the 15th ESV conference, Klanner et al. describe the use ofthe so-called “ADAC barrier”. This barrier is a three-stage barrier which has
SWOV Publication D-2000-1 27
been based on the EEVC barrier. The ADAC barrier has been developedbecause the EEVC barrier needed three essential improvements:- greater impact resistance and an increased barrier depth to prevent
bottoming out- greater energy absorption capacity to prevent blocking out- a defined deformation in order to allow for a quantification of the
absorbed energy and thus for the determination of the correct test speedas well as the aggressiveness and compatibility.
Klanner et al. (1996) used measurements of the horizontal deformation ofthe ADAC barrier to estimate the amount of energy absorbed by the barrier.The amount of energy taken into the barrier and the distribution of thedeformation over the barrier face is a measure of the aggressiveness andcompatibility of the tested vehicle. A uniform deformation pattern of thebarrier indicates that the tested vehicle has a uniform stiffness distribution.When the barrier has high local deformations, the tested car has highstiffness variations, which is associated with an aggressive front end.Klanner et al. raise the question if one should define limits for barrier energyabsorption as design targets: an upper limit to restrict aggressiveness and alower limit to assure interior protection.
According to Zobel (1998), the ADAC approach leaves some openquestions.
“The force behind the barrier is a consequence of the interaction between thebarrier and car. If the vehicle shows only little deformation, then the questionremains as to whether this happened because the vehicle was only slightlystiffer than the barrier or whether it indicates an absolutely stiff vehicle. Thedeformable barrier will indicate a higher stiffness. But if this high stiffnessoccurs, it provides no information about the undeformed part of the vehicle. Thisinformation is needed when we think about the ability of vehicles to forcepotential opposing vehicles to deform and about the ability to be forced byopposing vehicles to deform.”
Kohlhoff & Bläser (1996) conclude that the offset deformable barrier (ODB)can offer advanced features for assessing the protective capabilities ofpassenger cars, including compatibility aspects. One advantage of the ODBis that it favours a frontal design with a good load spreading. The design ofsuch a barrier is complex, particular if one wants to use the same barriertype to test vehicles from different weight classes. To achieve this, Kohlhoffand Bläser applied a different test speed and overlap for vehicles ofdifferent weight. In their attempt to determine the characteristics of theODB, they used the results of computer simulation (see next section).
Steyer et al. (1998) describe two test methods to measure the crushingforce in a car collision. The measurement of the crushing force is needed toverify that newly designed cars comply with their proposal of a crush forcecharacteristic. The proposal consists of the regulation of the end-of-impactload, the so-called “compatibility load”, of 300 kN up to an EES of 55 km/hagainst a rigid wall or ODB. The first described method consists simply ofmeasuring the force on a dynamometric barrier, which can be used only in asingle vehicle crash. The second method is based on the principle of actionand reaction. It is assumed that a number of discrete car components andareas of structures can be appointed which will act as a lumped massduring the crash. The deceleration force for each lumped mass can becalculated by multiplying the measured deceleration and its mass. The
28 SWOV Publication D-2000-1
summation of these forces results in the overall interface force. The secondmethod shows good agreement with measured interface forces with thedynamometric wall.
In their contribution to the 16th ESV conference, Wykes et al. (1998) alsodescribe both methods mentioned by Steyer et al. (1998). They also findgood agreement between load cell wall data and the interface forcecalculated from accelerometers from a frontal ODB test. Their motivation toinvestigate interface forces in car crashes is the observation that someauthors have put forward proposals to control the global stiffness of thevehicle and hence to improve compatibility: Zobel (1998) the bulkheadprinciple, and Steyer (1998) the compatibility load. Wykes et al. raise twoquestions which need to be answered before either of these proposals canbe pursued:- What test could be performed to ensure that the occupant compartment
could withstand the maximum crush force level?- What should the crush force levels be?Only the second question can be addressed with the describedmeasurement methods, the first one remains open.
At the Transport Research Laboratory in the United Kingdom several full-scale crash tests were performed to study what aspects influencescompatibility (Hobbs et al. 1996, Wykes et al. 1998) both in frontal and sideimpact. These tests mainly emphasize geometry aspects and structuralinteraction, and are therefore discussed in the next chapter.
3.4. Computer simulation
Computer simulation is taking an increasingly important role in vehicledesign. Both lumped mass models and finite element method (FEM)models are used to investigate crash behaviour of new car design and todevelop new test methods.
Schoeneburg et al. (1996) describe the development of the FEM model ofthe Audi A4 and the Seat Ibiza. The models were applied in the simulationof a side impact of the Audi A4 by the Seat Ibiza. The aim of the simulationwas to analyse the compatibility of both cars. The simulation results werecompared with the results of an experiment with precisely the sameperipheral conditions as applied in the computer simulation. With regard tostructural deformation, the simulation reveals the same tendencies as theexperiment. There is also good agreement between the dummy loads in theexperiment and the simulation. Only the head performance criterion (HPC)is 50% higher in the simulation than in the experiment. This was caused bythe FE dummy’s head just touching the door frame, where it is just clear ofin the experiment. Schoeneburg et al. conclude that simulation of car-to-caraccidents as a means of investigation compatibility is a tool capable ofanalysing deformation behaviour and the resulting loads on dummies in thepreliminary development phase for various vehicle structures.
Lumped mass models are used for simulation of occupant behaviour.Mizuno & Kajzer (1998) used the simulation programme MADYMO toanalyse the effect of stiffness variation of a mini car, mass 700 kg, on injuryrisks of the driver. They expressed injury risk in terms of HIC, chestacceleration, chest deflection, femur force, the maximum lower tibia axial
SWOV Publication D-2000-1 29
force and the maximum lower tibia moment. The stiffness of the mini carwas varied between 500 kN/m to 1000 kN/m. Two crash configurations wereexamined: a mini car crashing into a rigid wall, and an offset collisionbetween a mini car and a large car. The initial speed of the mini car in therigid wall crash was 50 km/h with 100% overlap. In the car-to-car crash, thecrash speed of both cars was 50 km/h, the overlap of the mini car was 50%and the overlap of the larger car (mass 1,400 kg, stiffness 872 kN/m) was40%.
From the rigid wall crashes Mizuno & Kajzer (1998) find that HIC and chestacceleration increase consistently with the stiffness of the mini car. Theother four injury risk parameters do not change much with an increase ofthe stiffness of the mini car. From the calculated compartment intrusion theauthors conclude that intrusion is a less important factor in determining theinjury risk to the driver of a mini car, whereas the acceleration causes themajority of injuries.
From the simulations of the car-to-car crashes Mizuno & Kajzer (1998) findthe following. As the stiffness of the mini car increases, the risk of injury tothe driver in the large car tends to become greater. However, the injury riskof the large car driver is less than that of the mini car driver. The relevantinjury criteria are lower than the tolerance level.
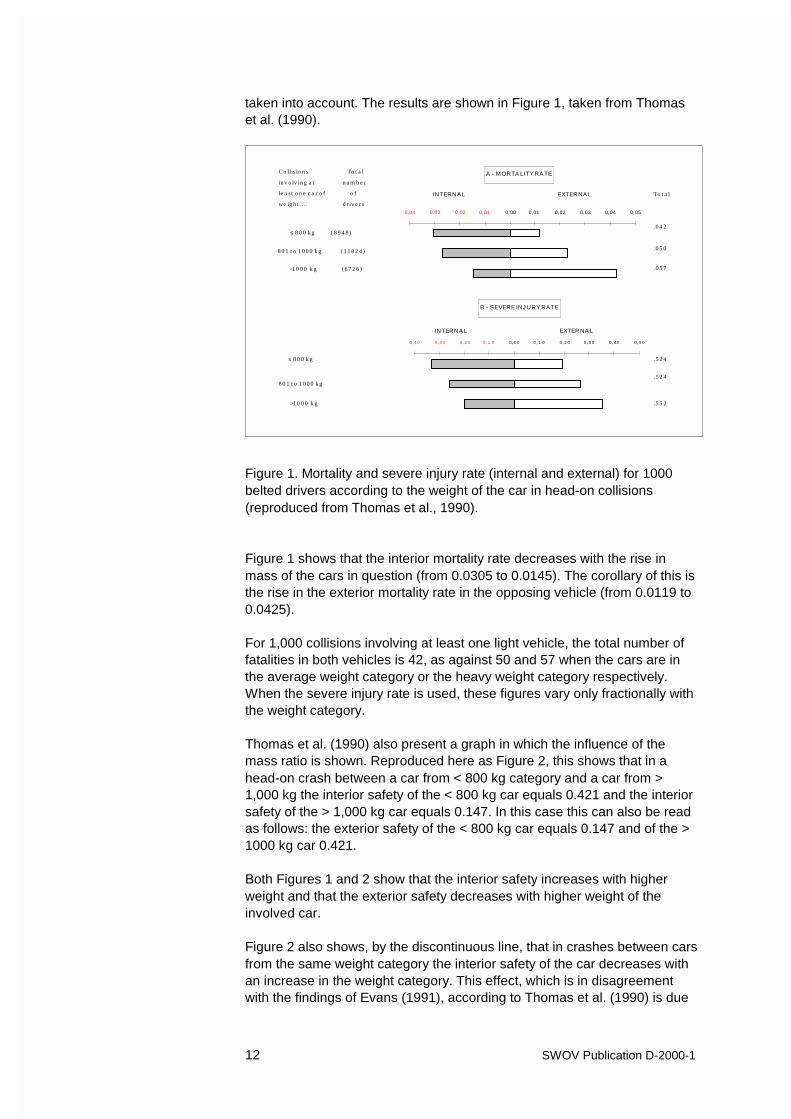
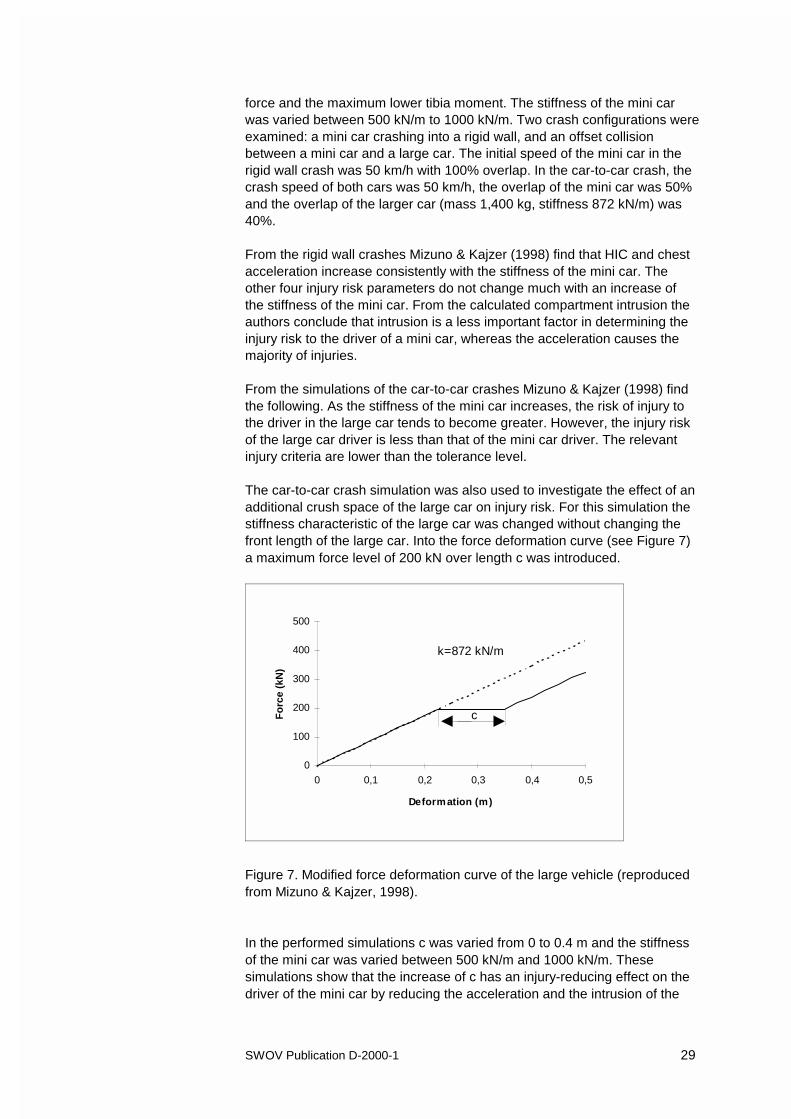
The car-to-car crash simulation was also used to investigate the effect of anadditional crush space of the large car on injury risk. For this simulation thestiffness characteristic of the large car was changed without changing thefront length of the large car. Into the force deformation curve (see Figure 7)a maximum force level of 200 kN over length c was introduced.
0
100
200
300
400
500
0 0,1 0,2 0,3 0,4 0,5
Deformation (m)
Fo
rce
(kN
)
c
k=872 kN/m
Figure 7. Modified force deformation curve of the large vehicle (reproducedfrom Mizuno & Kajzer, 1998).
In the performed simulations c was varied from 0 to 0.4 m and the stiffnessof the mini car was varied between 500 kN/m and 1000 kN/m. Thesesimulations show that the increase of c has an injury-reducing effect on thedriver of the mini car by reducing the acceleration and the intrusion of the
30 SWOV Publication D-2000-1
mini car. However, when the mini car is stiff, the risk to the driver in thelarge car becomes high, especially for injuries to lower extremities.
The study of Mizuno & Kajzer (1998) is a clear example of the strength ofsimulation for compatibility research. This method allows the investigator tostudy the effect of the variation of only one parameter. In an experimentalsetting the variation of one parameter is almost impossible.
Kohlhoff & Bläser (1996) used both FE methods and lumped mass methodsto develop a deformable barrier test which account for compatibility. Theydescribe the efforts of obtaining a single deformable barrier which givessimilar deformation and deceleration profiles for vehicles of different mass,as in the case of a car-to-car collision (see also previous section).Kohlhoff & Bläser (1996) developed a simple lumped mass model,consisting of one elastoplastic spring and a mass, of a large car (mass1,652 kg) and a small car (mass 1,073 kg). The spring characteristics werebased on the results of FEM simulations of a car-to-car crash of both carmodels and a car-rigid barrier crash of each car. The lumped mass modelswere used to determine a load deflection curve of the offset deformablebarrier.
The National Highway Traffic Safety Administration (NHTSA) applied crashsimulation, both FEM and lumped mass, within a large-scale systems model(Hollowell and Gabler, 1996). The model, referred to as Vehicle ResearchOptimization Model (VROOM) was based on the Safety SystemsOptimization Model (SSOM), which was developed by Ford Motor Companyin the 1970s and subsequently enhanced by the University of Virginia (FordMotor Company, 1978; White et al., 1985; Gabler et al., 1994).With VROOM, which still is under development, it will be possible toevaluate vehicle crashworthiness based on the safety performance of thevehicle when exposed to the entire traffic accident environment, i.e. acrossthe full spectrum of expected collision partners, collision speed, occupantheights, occupant ages, and occupant injury tolerance levels. VROOM canbe used to find the balance between two potentially conflicting objectives ofoptimal crash countermeasure designs: maximizing passenger protection inthe vehicle under design, and optimizing compatibility with other vehicles inthe fleet.
Results of one of VROOM’s predecessors, the Model for Optimization ofSafety Systems (MOSS), were published during the 14th ESV conference(Gabler et al., 1994). This paper discusses the outcome of the safetysystems design optimization of a 3,000 lb production passenger car. Theoptimal structural design was characterized by a softer front frame and astiffer rear frame. The softer front frame resulted in a subject vehicle whichwas less aggressive in collisions with other vehicles, especially whenstriking other vehicles in the side. This optimized design reduced the overallharm by 21% relative to the baseline design. These injury reductions wereobserved across all accident modes. The largest benefit was for the sideimpacted occupants of the other car for which injuries decreased by over50%. Furthermore, the benefits were almost evenly distributed between theother car and the subject car. The distribution of the optimization benefitsover the weight class of the other car shows that the vehicles of the 2,000 lbclass take 26% share of the benefit, vehicles of the 4,000 lb class 17 % andvehicles of the 5,000 lb class 2%. The remaining 55% of the optimization
SWOV Publication D-2000-1 31
benefits accrue to the subject vehicle of 3,000 lb, 46% when involved in asingle-car accident.
Wykes et al. (1998) performed parametric studies, using full-car finiteelement models, to identify car structure characteristics which will improvecompatibility in car-to-car side impact. They used a validated model of anEuropean side impact test. A number of parameter sweeps were performedchanging the following barrier characteristics:- barrier centre impact point- barrier mass- barrier front face geometry- barrier stiffness.The results of this modelling study indicate that in order to improvecompatibility for side impact, the bullet vehicle should be designed suchthat it engages the structure of the target vehicle more effectively, throughimproved geometrical interaction. This should be achieved withoutcompromising the intrusion profile or causing excessive roll in the targetcar. Stiffening of the bullet car’s upper load path without stiffening the lowerpath should be avoided.
Furthermore, Wykes et al. (1998) performed a simulation study with theMADYMO software package to investigate the influence of the decelerationpulse on restraint-system-related injuries from frontal impact. The reasonfor studying this effect is the assumption that a compatible vehicle will haveminimized intrusion due to a rigid occupant cell, and therefore restraint-system-related injuries will dominate. The authors applied various simple-shaped, analytical and experimental deceleration pulses to an occupantcompartment model consisting of a HYBRID III dummy held by a typicalrestraint system. Peak chest compression was used as the injury indicator.
The results of the Wykes et al. (1998) study indicate that in order tominimize chest injury the passenger compartment deceleration pulse shouldhave a constant profile and ride-down distance should be maximized.
32 SWOV Publication D-2000-1
4. The geometrical view
The crash geometry is not discussed in this chapter, because it is notsubject of this study. Clearly, vehicles should behave compatibly in all crashmodes which occur in the real-world. In this project frontal and sidecollisions are considered. Subject of discussion here are differences in cargeometry and stiffness geometry which lead to incompatibility in carcrashes.
In the paper “Improved protection through greater compatibility betweenroad vehicles”, presented to the 14th ESV conference, Neilson (1994)addresses both the car geometry and the structural stiffness aspect ofcompatibility. Proposing to use the small car as the basic vehicle, he usesits structural layout to define an impact height band. Within this height bandthe initial contacts should occur on impact. The structures in this heightband should be designed to take almost all of the impact interaction. In thepaper a height band is suggested from 350 mm to 550 mm above groundfor the fronts of all vehicles. The height might be raised up to 700 mmabove ground when the crush depth is more then 300 mm, and should bemaintained at 700 mm until a crush depth of 700 mm. The critical stiffnessof the front of a small car should be the greatest that can be built into thelower sides of the passenger compartments of cars for the sake of car-frontto car-side impacts. Furthermore, Neilson proposes that the fronts of allcars should be of similar size and crush stiffness.
Shearlaw & Thomas (1996) measured the height of the longitudinals andsills of 185 car models to study the geometrical mismatch of cars in sidecollisions. They find no clear relationship between vehicle mass and the twomeasured vehicle dimensions. The measurements of the sill top shows aconsiderable scatter in the data, with most points falling into a clearlydefined broad band. Presumably the height of the sill top is designed foraccess considerations. The longitudinals measurements show more scatterthan the sill measurements. Shearlaw and Thomas find that the sills andlongitudinals of four-wheel-drive vehicles are located higher than the sillsand longitudinals of normal cars. Four-wheel-drive vehicles arecharacterized by having considerably more ground clearance thanconventional vehicles and frequently have a rigid chassis construction.According to Shearlaw and Thomas these four-wheel-drive vehicles presenta considerable risk to the occupants of a conventional passenger car, notonly because of the frequently greater mass they enjoy, but also by virtue oftheir potential to concentrate loading above the sills or longitudinals of thestruck car. When the 4x4 vehicles were removed from the sample of 185cars, the clearance of the bottom of the longitudinals was an average 36.3centimetres, while the average ground clearance height of the top of the sillwas 34.6 cm. In 64% of the possible car combinations in side collisions, theaverage longitudinal would not interact with the sill.
Kohlhoff & Bläser (1996) state that one aspect of compatibility is what onemight call “stiffness distribution compatibility”. A possible consequence ofan unevenly distributed stiffness can be a front member penetrating theother car, resulting in a heavy loaded passenger compartment. Thisbehaviour may also be the result of poorly connected load paths. An even
SWOV Publication D-2000-1 33
distribution of stiffness will consequently result in a better energy absorptionin case of a head-on crash. However, a stiffness distribution of vehiclefrontal structure is never very homogeneous. Neither are frontal structuresof different cars necessarily similar, in fact they usually do not match.
Hobbs et al. (1996) observe that in real-world accidents the impacting frontstructures do not interact properly. Due to lack of stiffness uniformity at thefront of cars, it is usual for the stiff parts of one car to penetrate the weakerparts of the other. They also observe horizontal and vertical misalignmentof the stiff structures in the opposing cars. A similar observation is madeduring an offset frontal car-to-car impact test between a small and medium-sized car. The test showed that problems with the interaction of the car’sstructures had a dominating effect on the outcome. This test was thenrepeated, replacing the medium-sized car with a car of the same masswhich performed structurally well in the European offset deformable barriertest (Wykes et al., 1998). Since this car possessed a better frontal tie-upthan the car it replaced, there was virtually no overriding. To study solelygeometry, Wykes et al. (1998) performed a medium-size car-to-car offsettest, using identical vehicles. The ride heights of both cars were modified toachieve a ride height difference of 100 mm. The deformation patterns ofboth cars were noticeably different, even though the vehicles mass,stiffness and occupant compartment strength were matched. Wykes et al.(1998) suggest that in order to achieve a compatible fleet it will benecessary to firstly establish good geometrical compatibility.
Steyer et al. (1998) give a simplified presentation of compatibility. Theyused a 50 % offset rigid barrier test as a reference, because this representsthe ideal behaviour of the structure in terms of energy absorption.Compared to this ideal situation, they observe three major problemsconcerning the energy absorption in a real-world car-to-car crash:- There is a lack of a plane interface between the two vehicles
immediately after contact (fork effect).- Overriding can occur.- The two vehicles have different stiffnesses at the end of the impact.Steyer et al. (1998) give a number of possible improvements. They proposeto increase the number of load paths, to create a front face which spreadsthe load, to limit the load immediately after impact and to harmonize theend-of-impact load.
Crash statistics presented by Gabler & Hollowell (1998) demonstrate a clearincompatibility between cars and light trucks and vans (LTVs). Fatalitiesand injuries which arise from the incompatibility of LTVs and cars is agrowing problem in the United States, because of the former’s steadilyincreasing market share. Gabler & Hollowell (1998) do not attempt to assignwhat proportion of LTV aggressiveness is due to vehicle mass distribution,stiffness distribution or ride height geometry. But a comparison of theseproperties between cars and LTVs confirms that these two categories ofvehicles are incompatible from a design point of view. More research isneeded to determine the relationship between LTV design features andcrash aggressiveness.
34 SWOV Publication D-2000-1
5. Discussion and conclusions
Although authors use different definitions or descriptions for the term“compatibility”, these definitions or descriptions have much in common. Cardesign should not only emphasize occupant protection but should also takeinto account safety of the occupants in the other car. That differentdefinitions and descriptions are found in the literature illustrates thecomplexity of the problem of vehicle incompatibility in the current fleet.
One way to investigate compatibility is to analyse accident registration fileswith statistical methods. All discussed statistical studies show that there is acorrelation between vehicle mass and the metrics calculated to rate thesafety of vehicles. From this the following general relationship can bederived:
Heavier vehicles offer better protection to the occupants but are moreaggressive toward occupants of the other vehicle. The reverse is truefor the lighter vehicle, i.e. worse occupant protection, but lessaggressive.
However, there are exceptions to this rule. Some vehicles perform better orworse than cars in the same weight category. Hence other variables, suchas vehicle size, vehicle structure and vehicle geometry, also have an effectvehicle safety. From this arises the following recommendation:
As far as compatibility is concerned, the exceptions are of interest,since from these cars can be learned which parameters make thedifference. Thus the exceptions should be found.
Cameron et al. (1996) states that the calculated crashworthiness ratingsmay differ due to other factors not collected (e.g. crash speed) in the data.This applies for the results of all statistical methods. Since the availabledata is restricted, it is very difficult to isolate vehicle properties. All otherfactors, such as driver behaviour, which can be highly correlated to vehicletype, are included in the results.
However, new opportunities for statistical analyses may emerge from usingmore information of the following three data types: vehicle property data,crash test data and data collected by means of in-car electronics.Until now, researchers have used mainly vehicle mass and size asparameters for interpreting injury severity in car crashes. More insight in thecompatibility problem can be gained by adding parameters such as bodyshape, engine orientation and the presence of an upper longitudinal into theanalysis.Linking crash test data, for example front-end stiffness determined fromNCAP tests (Gabler & Hollowell, 1998) linked with accident data, can alsoprovide more insight into the compatibility problem using statisticalmethods. Clearly there will be a several-year wait before a vehicle tested inany new car assessment programme will be found in sufficient numbers inan accident database to be used in a statistical analysis.Theoretically, more detailed data can be collected by means of in-carelectronic equipment. With this equipment data related to collisions, such
SWOV Publication D-2000-1 35
as crash speed and crash location, can be collected. Furthermore, one cangain insight in vehicle use characteristics such as mileage, speed behaviourand brake behaviour.Practically, the use of this type of information faces legal and privacyproblems. In summary, the following is recommended in relation tostatistical studies and compatibility:
More detailed data on vehicle properties, driver behaviour andcollision characteristics should be collected, for use in statisticalanalysis to study compatibility.
From the classical theory of impact the mass effect in a car-to car crash canbe shown in a simple way. It follows from Equations 20 and 21 that thelighter vehicle experiences a larger velocity change than the heavier car.Equations 20 and 21 also show that the more kinetic energy is absorbed byboth vehicles (k â 0), the smaller the velocity change of both vehicles.From this observation the following can be concluded:
Given the mass effect, the technical limits of the mass ratio should bedetermined in such a way that the injury outcome of the occupantsinvolved in a car crash is independent of the mass of their car.
The classical theory of impact neither describes the way the initial kineticenergy is transformed into deformation energy, absorbed by both carstructures, nor the time history of the acceleration of both cars. Deformationof the car structure, resulting in intrusion, and the deceleration of the car arethe main causes of injuries to car occupants. Deceleration and deformationare determined by the absolute value and the ratio of the stiffness of bothinvolved vehicles. For this reason a number of authors suggest certainstiffness characteristics for the front end of cars (Zobel, 1998; Steyer et al,1998; Kohlhoff & Bläser, 1996). The boundary conditions of stiffnesscharacteristics of car front ends are given by the amount of energy whichshould be absorbed and the maximum deceleration level which an occupantof the lighter vehicle can survive.
More research is necessary to determine if a regulation of the frontend stiffness will lead to a compatible car fleet, and if so, what shapethe force displacement curve should have.
Deceleration and stiffness aspects of compatibility are studied by in-depthaccident analysis, crash tests and computer simulation. The role ofcomputer simulation in crash research is increasing. Not only the increasein computing power, but also the availability of simulation software and thegrowing knowledge of model development has led to many validatedsimulation models. Two model methods are used, the lumped mass methodand finite element method. The strength of computer simulation is that onecan investigate the effect of isolated parameters relatively easily, forexample the stiffness of cars front end.
In-depth accident studies and crash tests emphasizing compatibility are stillrare. The results of these studies show that both car geometry and stiffnessdistribution play an important role in the problem of car incompatibility.Misalignment of the load paths of cars involved in a car crash results inmore intrusion of the occupant compartment than when the load path are
36 SWOV Publication D-2000-1
aligned. This holds for both frontal and side impacts. The geometry andstiffness distribution aspect of compatibility is clearly demonstrated by therecently growing market share of light trucks and vans (LTVs) in the UnitedStates, as described by Gabler and Hollowell (1998). An important aspect inthe design of a compatible vehicle is a homogenous stiffness distributionover the front end, to ensure that the load paths are aligned in any crashgeometry (frontal, oblique, side and rear).
From the mechanical and the geometrical view the following can beconcluded:
Stiffness, stiffness distribution and stiffness alignment are importantkeys to the solution of the incompatibility problem.
The challenge in the coming years is to develop a test procedure for newcar designs which forces the future car fleet to converge towardscompatibility.The offset deformable barrier (ODB) test (European Directive 96/79/EC) forfrontal impact testing should help to improve the interaction of frontalstructures in car-to-car crashes. (Hobbs et al., 1996; Kohlhoff & Bläser,1996; Klanner et al., 1996). Some authors (Wykes et al., 1998; Steyer etal., 1998) believe that two tests are necessary, one to test thecrashworthiness and one to test the compatibility properties of the vehicle.
SWOV Publication D-2000-1 37
References
Cameron, M., Newstead, S. & Skalova, M. (1996). The development ofvehicle crashworthiness ratings in Australia. In: Proceedings of the FifteenthInternational Technical Conference on Enhanced Safety of Vehicles (ESV),Melbourne, Australia. 13-16 May 1996, pp. 1444-1457.
Evans, L. (1991). Traffic safety and the driver. Van Nostrand Reinhold, NewYork
Evans, L. & Frick, M.C. (1992) Car size or mass: Which has greaterinfluence on fatality risk? In: American Journal of Public Health, vol. 82,no. 8.
Evans, L. & Frick, M.C. (1993) Mass ratio and relative driver fatality risk intwo-vehicle crashes. In: Accident Analysis and Prevention, vol. 25, no. 4.
Evans, L. & Wasielewski, P. (1987). Serious or fatal driver injury rate versuscar mass in head-on crashes between cars of similar mass. In: AccidentAnalysis and Prevention, vol. 19, 1987, pp. 119-131.
Fontaine, H. (1994). The effects of car weight and power-to-weight ratio oncrash severity. In: Proceedings of the 38th Annual Conference of theAssociation for the Advancement of Automotive Medicine (AAAM), Lyon,France, 21-23 September 1994, pp. 359-372.
Ford Motor Company (1978). Safety Systems Optimization Model, Finalreport. US Department of Transportation, report under contract no. DOTHS-6-01446.
Gabler, H.C., Hampton, C. & Hollowell, W.T. (1994). Systems optimizationof vehicle crashworthiness. In: Proceedings of the Fourteenth InternationalTechnical Conference on Enhanced Safety of Vehicles (ESV), Munich,Germany, 23-26 May 1994, vol. 1, pp. 578-586.
Gabler, H.C., & Hollowell, W.T. (1998). NHTSA’s Vehicle aggressivity andcompatibility research program. In: Proceedings of the SixteenthInternational Technical Conference on Enhanced Safety of Vehicles (ESV),Windsor, Canada, 1-4 June, 1998.
Goldsmith, W. (1960). Impact. The theory and physical behaviour ofcolliding solids. Edward Arnold Publishers, London.
Hobbs, C.A., Williams, D.A. & Coleman, D.J. (1996). Compatibility of cars infrontal and side impact. In: Proceedings of the Fifteenth InternationalTechnical Conference on Enhanced Safety of Vehicles (ESV), Melbourne,Australia, 13-16 May 1996, vol. 1, pp. 617-624.
Hollowell, W.T. & Gabler, H.C. (1996). NHTSA’s vehicle aggressivity andcompatibility research program. In: Proceedings of the FifteenthInternational Technical Conference on Enhanced Safety of Vehicles (ESV),Melbourne, Australia, 13-16 May 1996, pp. 576-584.
38 SWOV Publication D-2000-1
Joksch, H.C. (1983). Light-weight car safety analysis, phase II, part II:Occupant fatality and injury risk in relation with car weight. Performed undercontract CEM-8102C1160, Center for the Environment and Man, Hartford.
Kampen, L.T.B. van (1998). Botsveiligheid van personenauto’s. R-98-28.SWOV Institute for Road Safety Research, Leidschendam. [In Dutch].
Klanner, W. & Langwieder, K. (1996). The correlation between test andreal-life accidents for the car-to-car frontal crash. In: Proceedings of theFifteenth International Technical Conference on Enhanced Safety ofVehicles, (ESV), Melbourne, Australia, 13-16 May 1996, vol. 1, pp. 210-219.
Klanner, W., Felsch, B. & West, F. van (1998). Evaluation of occupantprotection and compatibility out of frontal , crash tests against thedeformable barrier. In: Proceedings of the Sixteenth International TechnicalConference on Enhanced Safety of Vehicles (ESV), Windsor, Canada, 1-4June, 1998.
Kohlhoff, S. & Bläser, S. (1996). A theoretical development of deformablebarrier tests which account for compatibility. In: Proceedings of the FifteenthInternational Technical Conference on Enhanced Safety of Vehicles (ESV),Melbourne, Australia, 13-16 May 1996, pp. 732-736.
Krafft, M. et al. (1991). Car model safety rating based on real life accidents.In: Proceedings of the 1991 International Conference on the Biomechanicsof Impacts (IRCOBI), Berlin, Germany, 11-13 September 1991, pp. 25-39.
Mizuno, K. & Kajzer, J. (1998). The compatibility of mini cars in trafficaccidents. In: Proceedings of the Sixteenth International TechnicalConference on Enhanced Safety of Vehicles (ESV), Windsor, Canada, 1-4June 1998.
Neilson, I.D. (1994). Improved protection through greater compatibilitybetween road vehicles. In: Proceedings of the Fourteenth InternationalTechnical Conference on Enhanced Safety of Vehicles (ESV), Munich,Germany, 23-26 May 1994, vol. 1, pp. 587-592.
Niederer, P.F. et al. (1995). Compatibility considerations for low-mass rigid-belt vehicles. In: Accident Analysis and Prevention, vol. 27, no. 4.
Schoeneburg, R. et al. (1996). Evaluation of crash compatibility of vehicleswith the aid of finite element analysis. In: Proceedings of the FifteenthInternational Technical Conference on Enhanced Safety of Vehicles (ESV),Melbourne, Australia, 13-16 May 1996, vol. 1, pp. 737-745.
Shearlaw, A. & Thomas, P. (1996). Vehicle to vehicle compatibility in realworld accidents. In: Proceedings of the Fifteenth International TechnicalConference on Enhanced Safety of Vehicles (ESV), Melbourne, Australia,13-16 May 1996, pp. 607-616.
SWOV Publication D-2000-1 39
Steyer, C., Delhommeau, M. & Delannoy, P. (1998). Proposal to improvecompatibility in head on collisions. In: Proceedings of the SixteenthInternational Technical Conference on Enhanced Safety of Vehicles (ESV),Windsor, Canada, 1-4 June 1998.
Stcherbatcheff, G., Dornez, R. & Pouget, D. (1989). Reference frontalimpact. In: Proceedings of the Twelfth International Technical Conferenceon Enhanced Safety of Vehicles (ESV), Gothenburg, Sweden, 29 May 29 -1 June 1989, pp. 252-261.
Tarrière, C. et al. (1994). Accident research and experimental data usefulfor understanding of the influence of incompatibility on the risk of accidentinjury. In: Proceedings of the Fourteenth International Technical Conferenceon Enhanced Safety of Vehicles (ESV), Munich, Germany, 23-26 May1994, vol. 1, pp. 593-602.
Thomas, C. et al. (1990). The problem of compatibility in car-to-carcollisions. In: Proceedings of the 34th Annual Conference of the Associationfor the Advancement of Automotive Medicine (AAAM), Scottsdale, Arizona,1-3 October 1990, pp. 253-267.
White, K.P. et al. (1985). Simulation optimization of the crashworthiness ofa passenger vehicle in frontal collisions using response surfacemethodology. International Congress & Exposition, Detroit, Michigan, 25February - 1 March 1985. SAE Technical paper Series 850512.
Wykes, N.J., Edwards, M.J. & Hobbs, C.A. (1998). Compatibilityrequirements for cars in frontal and side impact. In: Proceedings of theSixteenth International Conference on Enhanced Safety of Vehicles (ESV),Windsor, Canada, 1-4 June 1998.
Zobel, R. (1998). Demands for compatibility of passenger vehicles. In:Proceedings of the Sixteenth International Technical Conference onEnhanced Safety of Vehicles (ESV), Windsor, Canada, 1-4 June 1998.
