u r n al f o adiology omics journal of radiology · issn: 2167-7964 ra, an open access ournal ......
TRANSCRIPT
Volume 2 • Issue 8 • 1000149OMICS J Radiology ISSN: 2167-7964 ROA, an open access journal
Research Article Open Access
Zhang et al., OMICS J Radiology 2013, 2:8 DOI: 10.4172/2167-7964.1000149
A FDG-PET and fMRI Study on Glucose Metabolism and Hemodynamic Response during Visual Attentional Performance in SchizophreniaJing Zhang1*, King-Wai Chu2, Erin A Hazlett2 and Monte S Buchsbaum2 1Department of Bioinformatics, School of Biomedical Engineering, Capital Medical University, Beijing 100069, P.R. China2Department of Psychiatry, Mount Sinai School of Medicine, New York, NY 10029, USA
Keywords: Cerebral glucose metabolism; Hemodynamic response;Schizophrenia
IntroductionEarly diagnosis and treatment is the key to good outcome
and recovery of schizophrenia (Sz), a severe and disabling mental disorder. Considerable efforts have been made to identify potential biomarkers of schizophrenia in neuroimaging, genomics and psychophysiological measures, in order to support early diagnosis of schizophrenia. Structural imaging studies have reported reduced whole brain and hippocampal volumes [1], frontal-temporal gray matter volume loss [2], enlarged third and lateral ventricles [1,3], white matter abnormalities in the frontal and temporal lobe [4] in schizophrenia patients. Functional imaging studies have found that prefrontal function declines (“hypofrontality”) before the emergence of symptoms and frontostriatal function impaired thereafter [5], and decreased activation in the anterior cingulate [6]. There are other potential biomarkers such as a lower N-acetylaspartate/creatine ratio and dopamine overactivity identified in schizophrenia patients or high-risk people with Magnetic Resonance Spectroscopy (MRS), PET and Single Photon Emission Computed Tomography (SPECT) [1,3,7-9].
Decreased Regional Glucose Metabolism (rGMR) in the prefrontal cortex and ACC in schizophrenia was found in FDG-PET studies [1,3,10,11]. Interestingly, fMRI studies also reported decreased hemodynamic responses in the frontal cortex and ACC in schizophrenia patients during tasks [12,13]. These observations on hypofrontality (reduced metabolism or Cerebral Blood Flow (CBF) in the prefrontal cortex) using PET and fMRI trigger the following questions: What is the relationship between glucose metabolic and hemodynamic processes during neuronal activity? Are schizophrenia patients different from healthy controls in such metabolism-blood flow relationship?
It was believed that cerebral metabolism and CBF were tightly coupled in healthy subjects [14], but a mismatch in CBF and CMRO2 (cerebral oxygen metabolism rate) was found with PET using visual
stimulation [15,16]. Then, non-linear flow-metabolism coupling was reported in a PET study in response to visual stimulation [17]. Pioneering work measuring CBF and metabolism in schizophrenia (with nitrous oxide) found no alteration in the overall average CBF and oxygen metabolism in patients [18], but it did not rule out neurophysiological abnormalities in specific brain regions in schizophrenia [19]. Traditionally, local rates of glucose utilization (LCMRglu) measured by the autoradiographic 2-deoxyglucose method (2-DG) [20,21] was determined following pharmacological treatments in schizophrenia [22], and regional CBF measured by Xenon-133 inhalation technique [23] was activated in schizophrenia patients during the Wisconsin card sorting task [24]. Recently, functional neuroimaging studies using PET, SPECT and fMRI have found that there is a time-dependent negative correlation between CBF and oxygen metabolism during visual stimulation [25-28], suggesting energy demands are met through anaerobic metabolism initially and require increased aerobic metabolism as stimulation continues [28]. In addition, spatial congruence was found in the activation maps of oxygen metabolism and hemodynamic response using H2(15)O PET and fMRI [29-31], and the sensitivity of fMRI can equal that of H2(15)O PET [32]. Further, a significant correlation between CBF, cerebral glucose concentration and oxygen metabolic rate was found in an animal model of ischemia [33].
AbstractThis research investigated the correlation between regional cerebral glucose metabolism rate (rGMR) of [18F]
fluorodeoxyglucose positron emission tomography (FDG-PET) and hemodynamic response of blood-oxygen-level-dependent (BOLD) fMRI in schizophrenia during visual attentional performance. PET, MRI and fMRI images of 17 unmedicated schizophrenia patients and 38 healthy controls were acquired. A visual attention task was administered during the FDG uptake period and during the fMRI scan. Statistical parametric mapping (SPM) analysis was performed on the PET and fMRI images. Hemodynamic response curves were extracted from the frontal and temporal cortices, Anterior Cingulate Cortex (ACC), caudate and thalamus. The Area under the Curve (AUC) was calculated for each region and correlated with rGMR obtained from PET images. The results indicated that (1) Although the spatial patterns of rGMR and hemodynamic response SPMs are different, the rGMR and hemodynamic responses were significantly correlated in the frontal and temporal cortex, anterior cingulate cortex, caudate and thalamus for all subjects; (2) The patterns of the correlations are different between schizophrenia patients and controls. These results confirm the findings of our previous PET and fMRI study during auditory attentional performance, suggesting that altered blood flow-metabolic processes during neuronal activities may underlie the attention deficits in schizophrenia, which may be useful for the early diagnosis of schizophrenia.
*Corresponding author: Jing Zhang, Department of Bioinformatics, School of Biomedical Engineering, Capital Medical University, Beijing 100069, P.R. China, Tel: +86-10-8391-1363; Fax: +86-10-8391-1544; E-mail: [email protected]
Received September 17, 2013; Accepted October 11, 2013; Published October 17, 2013
Citation: Zhang J, Chu KW, Hazlett EA, Buchsbaum MS (2013) A FDG-PET and fMRI Study on Glucose Metabolism and Hemodynamic Response during Visual Attentional Performance in Schizophrenia. OMICS J Radiology 2: 149. doi:10.4172/2167-7964.1000149
Copyright: © 2013 Zhang J, et al. This is an open-access article distributed under the terms of the Creative Commons Attribution License, which permits unrestricted use, distribution, and reproduction in any medium, provided the original author and source are credited.
OMICS Journal of RadiologyOM
ICS Jo
urnal of Radiology
ISSN: 2167-7964
Citation: Zhang J, Chu KW, Hazlett EA, Buchsbaum MS (2013) A FDG-PET and fMRI Study on Glucose Metabolism and Hemodynamic Response during Visual Attentional Performance in Schizophrenia. OMICS J Radiology 2: 149. doi:10.4172/2167-7964.1000149
Page 2 of 6
Volume 2 • Issue 8 • 1000149OMICS J Radiology ISSN: 2167-7964 ROA, an open access journal
However, little is known about the relationship between glucose metabolism and CBF in patients with schizophrenia during cognitive tasks. In our previous research [34], this was studied using FDG-PET and BOLD fMRI during an auditory prepulse-to-attention task with a small sample (10 patients and 7 healthy controls). In this research, we further explored it with a larger sample using FDG-PET and BOLD fMRI during a visual attention task.
Materials and MethodsSubjects
17 unmedicated schizophrenia patients (6 females, 11 males; age: 31.8 ± 10.4 years) were recruited for the spatial focus-of-attention study and 38 healthy subjects (15 females, 23 males; age: 30.5 ± 8.1 years) served as controls. All participants were screened for severe medical illness (such as diabetes), neurological illness (such as head trauma, central nervous system (CNS), neurological disease and seizure disorder) and substance abuse (within the past 6 months of entry into the study). They also had a negative urine toxicology screen and females a negative pregnancy test on scan day. All subjects were without metallic implants and eligible for MRI scan. They provided written informed consent in accordance with the Mount Sinai School of Medicine and James J. Peters Institutional Review Board guidelines. There were no significant differences in age and gender between the two groups. For detailed demographic characteristics of the subjects,
FDG-PET data
Positron Emission Tomography (PET) scans (20 slices, 6.5-mm thickness) were obtained in the Neuroscience PET laboratory at the Mount Sinai Medical Center [36,37], with a head-dedicated GE scanner (model PC2048B) with measured resolution of 4.5 mm in plane (4.2-4.5 mm across 15 planes). T1-weighted axial MRI scans were acquired with the GE Sigma 5× system (TR=24 ms, TE=5 ms, flip angle=40°, slice thickness=1.2 mm, pixel matrix=256×256, field of view=23 cm, total slices=128). During the uptake period, the subjects performed a spatial focus-of-attention task and details of the task paradigm are described [38]. Briefly, the paradigm contained four runs and each lasted for 264 s. Each run began with a 24 s period of blank, the stimuli were presented at 2 s intervals (total stimulus block time=24 s), and there was a rest interval of 24 s afterward. During the task, the subjects clicked on a mouse button each time he detected the large letter target, ignored the flanking letters, and pressed on the right button for a right-sided target and the left button for a left-sided target.
fMRI data
Patients and controls in the study were scanned on a head-dedicated Siemens Allegra 3T MRI scanner at MSMC. T1-weighted MP-RAGE (Magnetization Prepared Rapid Gradient Echo) imaging was acquired (208 slices with slice thickness=0.82 mm, matrix size=256×256×208, FOV=21 cm, TR=2500 ms, TE=4.38 ms, TI=1100 ms and an 8° flip angle FLASH acquisition) for high resolution structural images with good gray/white matter contrast.
Echoplanar images were acquired with a multi-slice 2D-EPI sequence (128×28 matrix, TR=2s, TE=40 ms, flip angle=90°, FOV=23 cm, slice thickness=5 mm, skip=2.5 mm), yielding 14 slices. BOLD fMRI acquisition occurred during a block-design visual spatial attention task. Details of the paradigm are described in (Buchsbaum
paradigm: left hemifield-large letter, left hemifield-small display with flankers, right hemifield-large letter and right hemifield-small display with flankers.
Image processing and data analysis
Each PET image was preprocessed with non-brain removal using Brain Extraction Tool [39], and spatial smoothing using Gaussian profile filter of full-width-half-maximum (FWHM) 5 mm), and coregistered to the corresponding anatomical MRI data. SPM analysis was performed with FSL tools [40]. fMRI data were preprocessed with motion correction using MCFLIRT [41], non-brain removal using Brain Extraction Tool [39], spatial smoothing with Gaussian profile filter (FWHM=5 mm), and high-pass temporal filtering with Gaussian-weighted running line detrending (cutoff=70 s). fMRI images were co-registered to their structural MRI with a 7 Degrees-of-Freedom (DOF) linear transformation, followed by alignment to the MNI brain template using a 12 DOF linear fit. Since there are several conditions in the attention task of each study and fMRI SPM analysis separates the conditions while PET analysis not, the activations under separate conditions were combined in the SPM of fMRI in order to better match the SPM of PET images.
The Regions of Interests (ROIs), such as the caudate and thalamus, were traced on Anterior–Posterior Commissure (ACPC) positioned MRI. Brodmann Areas (BAs) in the frontal (BAs 9,11, 46, 47) and temporal (BAs 21, 22, 38) cortices, and anterior cingulate cortex (ACC) (BAs 24, 25, 32) were identified with Brodmann area analysis program
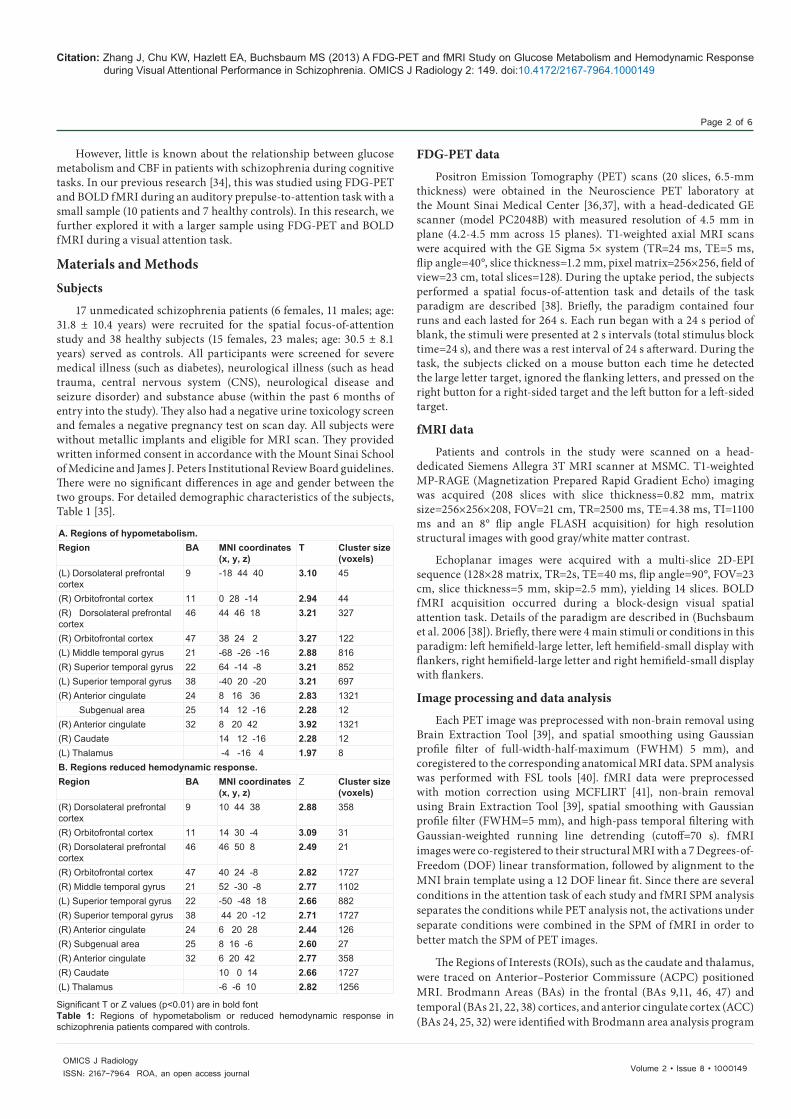
A. Regions of hypometabolism.Region BA MNI coordinates
(x, y, z)T Cluster size
(voxels)(L) Dorsolateral prefrontal cortex
9 -18 44 40 3.10 45
(R) Orbitofrontal cortex 11 0 28 -14 2.94 44(R) Dorsolateral prefrontal cortex
46 44 46 18 3.21 327
(R) Orbitofrontal cortex 47 38 24 2 3.27 122(L) Middle temporal gyrus 21 -68 -26 -16 2.88 816(R) Superior temporal gyrus 22 64 -14 -8 3.21 852(L) Superior temporal gyrus 38 -40 20 -20 3.21 697(R) Anterior cingulate 24 8 16 36 2.83 1321 Subgenual area 25 14 12 -16 2.28 12(R) Anterior cingulate 32 8 20 42 3.92 1321(R) Caudate 14 12 -16 2.28 12(L) Thalamus -4 -16 4 1.97 8B. Regions reduced hemodynamic response.Region BA MNI coordinates
(x, y, z)Z Cluster size
(voxels)(R) Dorsolateral prefrontal cortex
9 10 44 38 2.88 358
(R) Orbitofrontal cortex 11 14 30 -4 3.09 31(R) Dorsolateral prefrontal cortex
46 46 50 8 2.49 21
(R) Orbitofrontal cortex 47 40 24 -8 2.82 1727(R) Middle temporal gyrus 21 52 -30 -8 2.77 1102(L) Superior temporal gyrus 22 -50 -48 18 2.66 882(R) Superior temporal gyrus 38 44 20 -12 2.71 1727(R) Anterior cingulate 24 6 20 28 2.44 126(R) Subgenual area 25 8 16 -6 2.60 27(R) Anterior cingulate 32 6 20 42 2.77 358(R) Caudate 10 0 14 2.66 1727(L) Thalamus -6 -6 10 2.82 1256
Significant T or Z values (p<0.01) are in bold fontTable 1: Regions of hypometabolism or reduced hemodynamic response in schizophrenia patients compared with controls.
Table 1 [35].
et al. 2006 [38]). Briefly, there were 4 main stimuli or conditions in this

Citation: Zhang J, Chu KW, Hazlett EA, Buchsbaum MS (2013) A FDG-PET and fMRI Study on Glucose Metabolism and Hemodynamic Response during Visual Attentional Performance in Schizophrenia. OMICS J Radiology 2: 149. doi:10.4172/2167-7964.1000149
Page 3 of 6
Volume 2 • Issue 8 • 1000149OMICS J Radiology ISSN: 2167-7964 ROA, an open access journal
developed in the NeuroScience PET Laboratory at the Mount Sinai School of Medicine. Details of the Brodmann area analysis approach were described [42,43], hemodynamic response curves were extracted from the frontal and temporal cortex, anterior cingulate, caudate and thalamus. Area under the curve (AUC) was calculated for each region (in each hemisphere, and/or for each tissue type) in each condition with the Root Mean Square (RMS) approach. The calculated AUC values were correlated with rGMR obtained from the PET image and the maximum correlation in each brain region (across hemispheres, tissue types and conditions) is considered as the correlation between glucose metabolism and hemodynamic response for that region.
ResultsThe spatial patterns of the group SPM differences (Figure 1)
are different, however, both rGMR and hemodynamic response are significantly (p<0.01) lower in patients than controls in regions, such as the frontal (BAs 9, 11, 46, 47) and temporal (BAs 21, 22, 38) cortices, and the ACC (BAs 24, 25, 32) (Table 1).
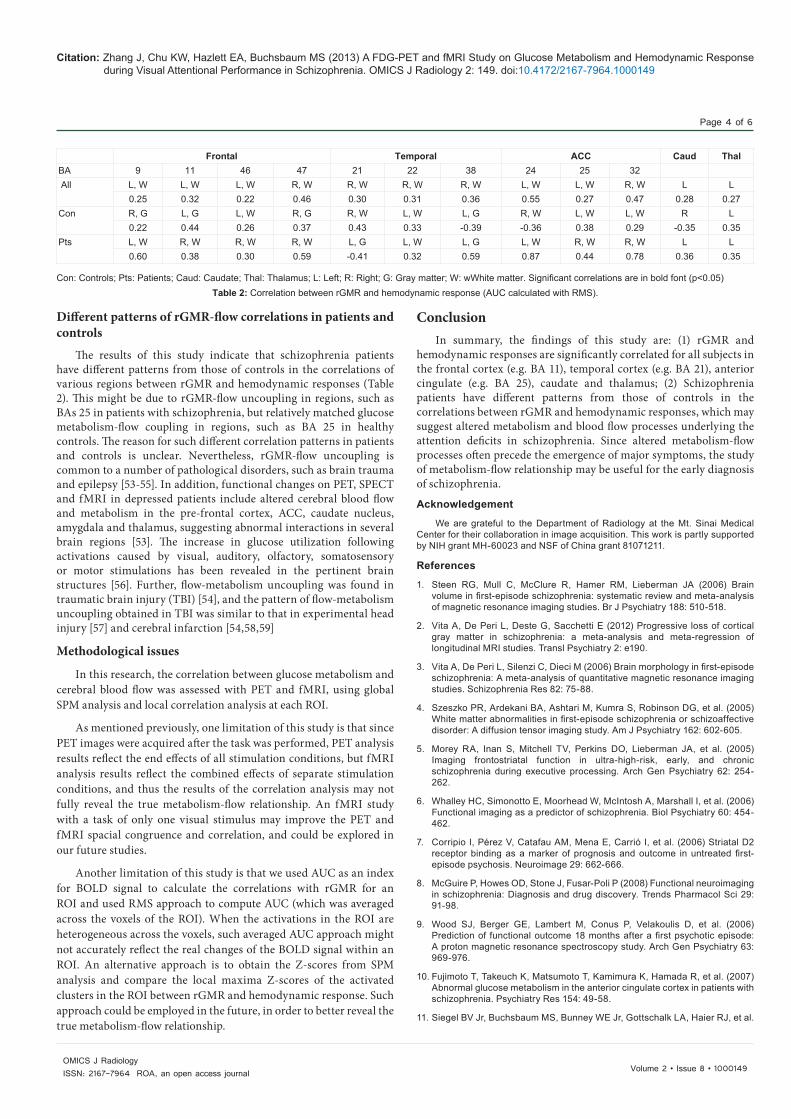
In addition, when considering all the subjects of this study for the correlation analysis, rGMR and hemodynamic response are significantly correlated in the frontal cortex (BAs 11, 47), temporal cortex (BAs 21, 22, 38), ACC (BAs 24, 25, 32), caudate and thalamus (Table 2). Further, as observed in our previous auditory attention study [34], the correlations between rGMR and hemodynamic response of patients in different regions are different from those of controls (Table 2).
DiscussionIn this study, we investigated the correlation between rGMR
and hemodynamic response during visual attentional performance in schizophrenia and found that although there were differences in the spatial patterns of the SPMs between rGMR and hemodynamic response, rGMR and hemodynamic response were significantly correlated in the frontal cortex (e.g. BA 11), temporal cortex (e.g. BA 21), ACC (e.g. BA 25), caudate and thalamus for all the subjects; and the correlation patterns of the patients were different from those of
controls. These results are consistent with the findings in our previous study during auditory attention performance [34].
Correlations between rGMR and hemodynamic responses
The SPMs of PET and fMRI images in this study demonstrated that patients had less hemodynamic responses and glucose metabolism in the fronto-temporal cortical regions than controls in response to the attention task. Such hypometabolism and low hemodynamic responses in schizophrenia patients in the frontal regions is consistent with the findings in PET studies [1,3,10,11] and fMRI studies [12,13] during tasks. The fronto-temporal hypometabolism and reduced hemodynamic responses found in this study revealed the functional deficits in the fronto-temporal regions in schizophrenia during attentional performance. Factors such as frontal-temporal gray matter volume loss [2], white matter abnormalities in the frontal and temporal lobe [44], altered dopaminergic and glutamatergic neurotransmission and disturbed cognitive processing in these regions may shed light on the mechanisms underlying such functional deficits [45].
Compared with spatial congruence of the activations between oxygen metabolism (O15 water PET) and hemodynamic response (fMRI) [29,30,46], the spatial patterns in group SPMs of glucose metabolism and hemodynamic response are different (Figure 1), which indicates low spatial congruence. Such low spatial congruence in group spatial patterns may be due to the lack of baseline images (i.e., images taken at resting-state) in the FDG-PET data of this study (while the fMRI data, including both the baseline and activation images). Different inter-subject variations in PET and fMRI data may also contribute to the different spatial patterns of PET and fMRI SPMs. In an fMRI validation study using FDG-PET with both baseline and activation images, it was found that spatial congruence between PET and fMRI was relatively high for individual patients with mass lesion (such as tumor) in the central region of the brain, while the inter-subject variations were also high [47]. In addition, the PET analysis results of this study reflect the end effects of several visual stimulation conditions, while fMRI analysis results reflect the combined effects of each single condition. Such difference may also lead to low spatial congruence between PET and fMRI in this study.
Although the rGMR and hemodynamic response are correlated in various brain regions, the signs and values of the correlations vary from one region to another. In addition, the correlations vary according to the tissue type (gray matter or white matter) of the ROI, the hemisphere of the ROI and the task performed (including different conditions of the task) (Table 2). Positive correlations reflect positive coupling of rGMR and flow (i.e. when CBF is increased in an ROI in a subject sample, rGMR also increases in the ROI of the sample). In contrast, negative correlations may reflect the opposite directions in which CBF and rGMR change.
It was found that oxygen metabolism was increased as brain activation lasted [48], and that rGMR was increased initially and decreased as stimulation continued, and there were matched changes in the blood flow and glucose utilization during brain stimulation [49]. MRS studies suggested that glycolysis is transient followed by an increase in oxygen utilization [50-52]. The correlations between glucose metabolism and blood flow might be explained by the observations of the matched changes in glucose utilization and blood flow over continuous brain stimulation, which is consistent with the hypothesis of glycolytically related blood flow regulation [49]. Further, a decrease in glycolysis with continuing visual stimulation may be associated with a decrease in the blood flow response through NADH/NAD+-related mechanisms [49].
Figure 1: (A) SPM (T-map) of Glucose Metabolism (Patients-Controls). (B) SPM (Z-map) of Hemodynamic Response (Patients-Controls).
Citation: Zhang J, Chu KW, Hazlett EA, Buchsbaum MS (2013) A FDG-PET and fMRI Study on Glucose Metabolism and Hemodynamic Response during Visual Attentional Performance in Schizophrenia. OMICS J Radiology 2: 149. doi:10.4172/2167-7964.1000149
Page 4 of 6
Volume 2 • Issue 8 • 1000149OMICS J Radiology ISSN: 2167-7964 ROA, an open access journal
Different patterns of rGMR-flow correlations in patients and controls
The results of this study indicate that schizophrenia patients have different patterns from those of controls in the correlations of various regions between rGMR and hemodynamic responses (Table 2). This might be due to rGMR-flow uncoupling in regions, such as BAs 25 in patients with schizophrenia, but relatively matched glucose metabolism-flow coupling in regions, such as BA 25 in healthy controls. The reason for such different correlation patterns in patients and controls is unclear. Nevertheless, rGMR-flow uncoupling is common to a number of pathological disorders, such as brain trauma and epilepsy [53-55]. In addition, functional changes on PET, SPECT and fMRI in depressed patients include altered cerebral blood flow and metabolism in the pre-frontal cortex, ACC, caudate nucleus, amygdala and thalamus, suggesting abnormal interactions in several brain regions [53]. The increase in glucose utilization following activations caused by visual, auditory, olfactory, somatosensory or motor stimulations has been revealed in the pertinent brain structures [56]. Further, flow-metabolism uncoupling was found in traumatic brain injury (TBI) [54], and the pattern of flow-metabolism uncoupling obtained in TBI was similar to that in experimental head injury [57] and cerebral infarction [54,58,59]
Methodological issues
In this research, the correlation between glucose metabolism and cerebral blood flow was assessed with PET and fMRI, using global SPM analysis and local correlation analysis at each ROI.
As mentioned previously, one limitation of this study is that since PET images were acquired after the task was performed, PET analysis results reflect the end effects of all stimulation conditions, but fMRI analysis results reflect the combined effects of separate stimulation conditions, and thus the results of the correlation analysis may not fully reveal the true metabolism-flow relationship. An fMRI study with a task of only one visual stimulus may improve the PET and fMRI spacial congruence and correlation, and could be explored in our future studies.
Another limitation of this study is that we used AUC as an index for BOLD signal to calculate the correlations with rGMR for an ROI and used RMS approach to compute AUC (which was averaged across the voxels of the ROI). When the activations in the ROI are heterogeneous across the voxels, such averaged AUC approach might not accurately reflect the real changes of the BOLD signal within an ROI. An alternative approach is to obtain the Z-scores from SPM analysis and compare the local maxima Z-scores of the activated clusters in the ROI between rGMR and hemodynamic response. Such approach could be employed in the future, in order to better reveal the true metabolism-flow relationship.
ConclusionIn summary, the findings of this study are: (1) rGMR and
hemodynamic responses are significantly correlated for all subjects in the frontal cortex (e.g. BA 11), temporal cortex (e.g. BA 21), anterior cingulate (e.g. BA 25), caudate and thalamus; (2) Schizophrenia patients have different patterns from those of controls in the correlations between rGMR and hemodynamic responses, which may suggest altered metabolism and blood flow processes underlying the attention deficits in schizophrenia. Since altered metabolism-flow processes often precede the emergence of major symptoms, the study of metabolism-flow relationship may be useful for the early diagnosis of schizophrenia.
Acknowledgement
We are grateful to the Department of Radiology at the Mt. Sinai Medical Center for their collaboration in image acquisition. This work is partly supported by NIH grant MH-60023 and NSF of China grant 81071211.
References
1. Steen RG, Mull C, McClure R, Hamer RM, Lieberman JA (2006) Brain volume in first-episode schizophrenia: systematic review and meta-analysis of magnetic resonance imaging studies. Br J Psychiatry 188: 510-518.
2. Vita A, De Peri L, Deste G, Sacchetti E (2012) Progressive loss of cortical gray matter in schizophrenia: a meta-analysis and meta-regression of longitudinal MRI studies. Transl Psychiatry 2: e190.
3. Vita A, De Peri L, Silenzi C, Dieci M (2006) Brain morphology in first-episode schizophrenia: A meta-analysis of quantitative magnetic resonance imaging studies. Schizophrenia Res 82: 75-88.
4. Szeszko PR, Ardekani BA, Ashtari M, Kumra S, Robinson DG, et al. (2005) White matter abnormalities in first-episode schizophrenia or schizoaffective disorder: A diffusion tensor imaging study. Am J Psychiatry 162: 602-605.
5. Morey RA, Inan S, Mitchell TV, Perkins DO, Lieberman JA, et al. (2005) Imaging frontostriatal function in ultra-high-risk, early, and chronic schizophrenia during executive processing. Arch Gen Psychiatry 62: 254-262.
6. Whalley HC, Simonotto E, Moorhead W, McIntosh A, Marshall I, et al. (2006) Functional imaging as a predictor of schizophrenia. Biol Psychiatry 60: 454-462.
7. Corripio I, Pérez V, Catafau AM, Mena E, Carrió I, et al. (2006) Striatal D2 receptor binding as a marker of prognosis and outcome in untreated first-episode psychosis. Neuroimage 29: 662-666.
8. McGuire P, Howes OD, Stone J, Fusar-Poli P (2008) Functional neuroimaging in schizophrenia: Diagnosis and drug discovery. Trends Pharmacol Sci 29: 91-98.
9. Wood SJ, Berger GE, Lambert M, Conus P, Velakoulis D, et al. (2006) Prediction of functional outcome 18 months after a first psychotic episode: A proton magnetic resonance spectroscopy study. Arch Gen Psychiatry 63: 969-976.
10. Fujimoto T, Takeuch K, Matsumoto T, Kamimura K, Hamada R, et al. (2007) Abnormal glucose metabolism in the anterior cingulate cortex in patients with schizophrenia. Psychiatry Res 154: 49-58.
11. Siegel BV Jr, Buchsbaum MS, Bunney WE Jr, Gottschalk LA, Haier RJ, et al.
Frontal Temporal ACC Caud ThalBA 9 11 46 47 21 22 38 24 25 32 All L, W L, W L, W R, W R, W R, W R, W L, W L, W R, W L L
0.25 0.32 0.22 0.46 0.30 0.31 0.36 0.55 0.27 0.47 0.28 0.27Con R, G L, G L, W R, G R, W L, W L, G R, W L, W L, W R L
0.22 0.44 0.26 0.37 0.43 0.33 -0.39 -0.36 0.38 0.29 -0.35 0.35Pts L, W R, W R, W R, W L, G L, W L, G L, W R, W R, W L L
0.60 0.38 0.30 0.59 -0.41 0.32 0.59 0.87 0.44 0.78 0.36 0.35
Con: Controls; Pts: Patients; Caud: Caudate; Thal: Thalamus; L: Left; R: Right; G: Gray matter; W: wWhite matter. Significant correlations are in bold font (p<0.05)Table 2: Correlation between rGMR and hemodynamic response (AUC calculated with RMS).
Citation: Zhang J, Chu KW, Hazlett EA, Buchsbaum MS (2013) A FDG-PET and fMRI Study on Glucose Metabolism and Hemodynamic Response during Visual Attentional Performance in Schizophrenia. OMICS J Radiology 2: 149. doi:10.4172/2167-7964.1000149
Page 5 of 6
Volume 2 • Issue 8 • 1000149OMICS J Radiology ISSN: 2167-7964 ROA, an open access journal
(1993) Cortical-striatal-thalamic circuits and brain glucose metabolic activity in 70 unmedicated male schizophrenic patients. Am J Psychiatry 150: 1325-1336.
12. Hazlett EA, Buchsbaum MS, Zhang J, Newmark RE, Glanton CF, et al. (2008) Frontal-striatal-thalamic mediodorsal nucleus dysfunction in schizophrenia-spectrum patients during sensorimotor gating. Neuroimage 42: 1164-1177.
13. Ragland JD, Gur RC, Valdez J, Turetsky BI, Elliott M, et al. (2004) Event-related fMRI of frontotemporal activity during word encoding and recognition in schizophrenia. Am J Psychiatry 161: 1004-1015.
14. Gjedde A (1997) The relation between brain function and cerebral blood flow and metabolism. In: Cerebrovascular Disease. Lippincott-Raven Publishers, Philadelphia, USA.
15. Fox PT, Raichle ME (1986) Focal physiological uncoupling of cerebral blood flow and oxidative metabolism during somatosensory stimulation in human subjects. Proceedings of the National Academy of Sciences of the United States of America 83: 1140-1144.
16. Fox PT, Raichle ME, Mintun MA, Dence C (1988) Nonoxidative glucose consumption during focal physiologic neural activity. Science 241: 462-464.
17. Vafaee MS, Gjedde A (2000) Model of blood-brain transfer of oxygen explains nonlinear flow-metabolism coupling during stimulation of visual cortex. J Cereb Blood Flow Metab 20: 747-754.
18. Kety SS, Woodford RB (1948) Cerebral blood flow and metabolism in schizophrenia; the effects of barbiturate semi-narcosis, insulin coma and electroshock. The American Journal of Psychiatry 104: 765-770.
19. Berman KF (2002) Functional neuroimaging in schizophrenia. In: Davis KL, Charney D, Coyle JT, Nemeroff (Ed.), Neuropsychopharmacology: The fifth generation of progress. Lippincott Williams & Wilkins, Philadelphia, USA 745.
20. Sokoloff L (1981) Relationships among local functional activity, energy metabolism, and blood flow in the central nervous system. Fed Proc 40: 2311-2316.
21. Sokoloff L, Reivich M, Kennedy C, Des Rosiers MH, Patlak CS, et al. (1977) The [14C]deoxyglucose method for the measurement of local cerebral glucose utilization: Theory, procedure and normal values in the conscious and anesthetized albino rat. J Neurochem 28: 897-916.
22. Cochran SM, McKerchar CE, Morris BJ, Pratt JA (2002) Induction of differential patterns of local cerebral glucose metabolism and immediate-early genes by acute clozapine and haloperidol. Neuropharmacology 43: 394-407.
23. Obrist WD, Thompson HK Jr, Wang HS, Wilkinson WE (1975) Regional cerebral blood flow estimated by 133-xenon inhalation. Stroke 6: 245-256.
24. Steinberg JL, Devous MD Sr, Paulman RG (1996) Wisconsin card sorting activated regional cerebral blood flow in first break and chronic schizophrenic patients and normal controls. Schizophr Res 19: 177-187.
25. Bandettini PA, Kwong KK, Davis TL, Tootell RB, Wong EC, et al. (1997) Characterization of cerebral blood oxygenation and flow changes during prolonged brain activation. Hum Brain Mapp 5: 93-109.
26. Hathout GM, Kirlew KA, So GJ, Hamilton DR, Zhang JX, et al. (1994) MR imaging signal response to sustained stimulation in human visual cortex. J Magn Reson Imaging 4: 537-543.
27. Howseman AM, Porter DA, Hutton C, Josephs O, Turner R (1998) Blood oxygenation level dependent signal time courses during prolonged visual stimulation. Magn Reson Imaging 16: 1-11.
28. Lin AL, Fox PT, Yang Y, Lu H, Tan LH, et al. (2009) Time-dependent correlation of cerebral blood flow with oxygen metabolism in activated human visual cortex as measured by fMRI. Neuroimage 44: 16-22.
29. Joliot M, Papathanassiou D, Mellet E, Quinton O, Mazoyer N, et al. (1999) FMRI and PET of self-paced finger movement: Comparison of intersubject stereotaxic averaged data. Neuroimage 10: 430-447.
30. Mechelli A, Friston KJ, Price CJ (2000) The effects of presentation rate during word and pseudoword reading: A comparison of PET and fMRI. J Cogn Neurosci 12: 145-156.
31. Ojemann JG, Akbudak E, Snyder AZ, McKinstry RC, Raichle ME, et al. (1997) Anatomic localization and quantitative analysis of gradient refocused echo-planar fMRI susceptibility artifacts. Neuroimage 6: 156-167.
32. Ramsey NF, Kirkby BS, Van Gelderen P, Berman KF, Duyn JH, et al. (1996)
Functional mapping of human sensorimotor cortex with 3D BOLD fMRI correlates highly with H2(15)O PET rCBF. J Cereb Blood Flow Metab 16: 755-764.
33. Frykholm P, Hillered L, Långström B, Persson L, Valtysson J, et al. (2005) Relationship between cerebral blood flow and oxygen metabolism, and extracellular glucose and lactate concentrations during middle cerebral artery occlusion and reperfusion: A microdialysis and positron emission tomography study in nonhuman primates. J Neurosurg 102: 1076-84.
34. Zhang J, Chu KW, Hazlett EA, Buchsbaum MS (2011) A study of cerebral glucose metabolism and hemodynamic response in schizophrenia. Proceedings of BMEI 2011, Shanghai, China.
35. Zhang J, Chu KW, Teague EB, Newmark RE, Buchsbaum MS (2013) fMRI assessment of thalamocortical connectivity during attentional performance. Magn Reson Imaging 31: 1112-1118.
36. Buchsbaum MS, Haznedar MM, Aronowitz J, Brickman AM, Newmark RE, et al. (2007) FDG-PET in never-previously medicated psychotic adolescents treated with olanzapine or haloperidol. Schizophr Res 94: 293-305.
37. Hazlett EA, Buchsbaum MS, Byne W, Wei TC, Spiegel-Cohen J, et al. (1999) Three-dimensional analysis with MRI and PET of the size, shape and function of the thalamus in the schizophrenia spectrum. Am J Psychiatry 156: 1190-1199.
38. Buchsbaum MS, Buchsbaum BR, Chokron S, Tang C, Wei TC, et al. (2006) Thalamocortical circuits: fMRI assessment of the pulvinar and medial dorsal nucleus in normal volunteers. Neurosci Lett 404: 282-287.
39. Smith SM (2002) Fast robust automated brain extraction. Hum Brain Mapp 17: 143-155.
40. Smith SM, Jenkinson M, Woolrich MW, Beckmann CF, Behrens TE, et al. (2004) Advances in functional and structural MR image analysis and implementation as FSL. Neuroimage 23: S208-S219.
41. Jenkinson M, Bannister P, Brady M, Smith S (2002) Improved optimization for the robust and accurate linear registration and motion correction of brain images. Neuroimage 17: 825-841.
42. Buchsbaum MS, Nenadic I, Hazlett EA, Spiegel-Cohen J, Fleischman MB, et al. (2002) Differential metabolic rates in prefrontal and temporal Brodmann areas in schizophrenia and schizotypal personality disorder. Schizophr Res 54: 141-150.
43. Hazlett EA, Buchsbaum MS, Haznedar MM, Singer MB, Schnur DB, et al. (1998) Prefrontal cortex glucose metabolism and startle eyeblink modification abnormalities in unmedicated schizophrenia patients. Psychophysiology 35: 186-198.
44. Szeszko PR, Ardekani BA, Ashtari M, Kumra S, Robinson DG, et al. (2005) White matter abnormalities in first-episode schizophrenia or schizoaffective disorder: a diffusion tensor imaging study. Am J Psychiatry 162: 602-605.
45. Schultz CC, Fusar-Poli P, Wagner G, Koch K, Schachtzabel C, et al. (2012) Multimodal functional and structural imaging investigations in psychosis research. Eur Arch Psychiatry Clin Neurosci 262: S97-S106.
46. Ojemann JG, Buckner RL, Akbudak E, Snyder AZ, Ollinger JM, et al. (1998) Functional MRI studies of word-stem completion: Reliability across laboratories and comparison to blood flow imaging with PET. Hum Brain Mapp 6: 203-215.
47. Krings T, Schreckenberger M, Rohde V, Foltys H, Spetzger U, et al. (2001) Metabolic and electrophysiological validation of functional MRI. J Neurol Neurosurg Psychiatry 71: 762-771.
48. Mintun MA, Vlassenko AG, Shulman GL, Snyder AZ (2002) Time-related increase of oxygen utilization in continuously activated human visual cortex. Neuroimage 16: 531-537.
49. Vlassenko AG, Rundle MM, Mintun MA (2006) Human brain glucose metabolism may evolve during activation: Findings from a modified FDG PET paradigm. Neuroimage 33: 1036-1041.
50. Chen W, Novotny EJ, Zhu XH, Rothman DL, Shulman RG (1993) Localized 1H NMR measurement of glucose consumption in the human brain during visual stimulation. Proceedings of the National Academy of Sciences of the United States of America 90: 9896-9900.
51. Frahm J, Krüger G, Merboldt KD, Kleinschmidt A (1996) Dynamic uncoupling and recoupling of perfusion and oxidative metabolism during focal brain activation in man. Magn Reson Med 35: 143-148.
Citation: Zhang J, Chu KW, Hazlett EA, Buchsbaum MS (2013) A FDG-PET and fMRI Study on Glucose Metabolism and Hemodynamic Response during Visual Attentional Performance in Schizophrenia. OMICS J Radiology 2: 149. doi:10.4172/2167-7964.1000149
Page 6 of 6
Volume 2 • Issue 8 • 1000149OMICS J Radiology ISSN: 2167-7964 ROA, an open access journal
52. Prichard J, Rothman D, Novotny E, Petroff O, Kuwabara T, et al. (1991) Lactate rise detected by 1H NMR in human visual cortex during physiologic stimulation. Proc Natl Acad Sci U S A 88: 5829-5831.
53. Abiodun OA (2005) Role of radiology in psychiatry: A review. East Afr Med J 82: 260-266.
54. Chen SF, Richards HK, Smielewski P, Johnström P, Salvador R, et al. (2004) Relationship between flow-metabolism uncoupling and evolving axonal injuryafter experimental traumatic brain injury. J Cereb Blood Flow Metab 24: 1025-1036.
55. Pereira de Vasconcelos A, Ferrandon A, Nehlig A (2002) Local cerebral blood flow during lithium-pilocarpine seizures in the developing and adult rat: Role of coupling between blood flow and metabolism in the genesis of neuronal damage. J Cereb Blood Flow Metab 22: 196-205.
56. Magistretti PJ, Martin JL (1995) Brain energy metabolism, an integrated cellular perspective. In: Bloom FE (Ed.), Psychopharmacology: The fourth generation of progress. Raven Press, New York, USA.
57. Richards HK, Simac S, Piechnik S, Pickard JD (2001) Uncoupling of cerebral blood flow and metabolism after cerebral contusion in the rat. J Cereb Blood Flow Metab 21: 779-781.
58. Belayev L, Zhao W, Busto R, Ginsberg MD (1997) Transient middle cerebral artery occlusion by intraluminal suture: I. Three-dimensionalautoradiographic image-analysis of local cerebral glucose metabolism-bloodflow interrelationships during ischemia and early recirculation. Journal ofCerebral Blood Flow and Metabolism 17: 1266-1280.
59. Frietsch T, Krafft P, Piepgras A, Lenz C, Kuschinsky W, et al. (2000) Relationship between local cerebral blood flow and metabolism during mild and moderate hypothermia in rats. Anesthesiology 92: 754-763.