typhoons “pedring” (nesat) and “quiel” (nalgae) …prffwc.synthasite.com/resources/prb...
TRANSCRIPT

Pampanga River Basin Flood – Sept-Oct 2011
PRFFWC-hth-2012 1
Pampanga River Basin Flood Forecasting & Warning Center (PRFFWC) Philippine Atmospheric, Geophysical & Astronomical Services
Administration (PAGASA) DOST Region 3 Compound, San Fernando, Pampanga 2000
Website: prffwc.webs.com
PRFFWC Post-Flood Report 2011-2 1
Event: Typhoons “PEDRING” (NESAT) and “QUIEL” (NALGAE) September 26 to October 04, 2011
1 Post-Flood Survey Report by H. Hernando and R. “Amang” O. Mendoza; Survey date: October 17-20, 2011.

Pampanga River Basin Flood – Sept-Oct 2011
PRFFWC-hth-2012 2
Summary
Tropical Cyclone “Pedring” entered the Philippine Area of Responsibility (PAR) in the afternoon of
September 24 as a tropical storm. It made landfall somewhere between the Provinces of Aurora and
Isabela in the early morning of September 27 as a typhoon category having maximum winds of 140
kph (kilometer per hour) and gusts of more than 170 kph. It crossed Northern Luzon, roughly north
of Pampanga River Basin (PRB), and exited PAR in the afternoon of 28 September.
Continuous moderate to occasionally heavy rains spawned by “Pedring” on the eastern part of PRB
in the afternoon of September 26 until early morning of September 27 caused a flashy overflowing
of the Digmala, Coronel, Cabu and the upper Pampanga Rivers. This rainfall condition progressed
throughout the rest of the day of September 27 until early morning of the following day over the
whole basin. By late afternoon of September 28, almost all floodwaters from the upper part of the
basin had already inundated riverside areas along the Pampanga River from Cabanatuan City in
Nueva Ecija down to Hagonoy in Bulacan. Flood levels attained at some of the forecasting points
within the PRB have surpassed flood records in the last 2 decades of flood monitoring within basin.
With floods still on the verged of cresting in many parts of Northern and Central Luzon due to
“Pedring”, another tropical cyclone “Quiel” entered the PAR as a tropical storm off the coast East of
Northern Luzon on the morning of September 29. By late afternoon “Quiel” intensified into a
typhoon category with winds of more than 120 kph as it threatened Northern Luzon, accelerating its
speed to 22 kph. It made landfall over Dinapigue, Isabela early morning of October 01, cut across the
Cordillera mountain range and exited through La Union in a period of just about 6 hours.
Unlike the flood levels attained as a result of “Pedring”, “Quiel’s” flood effects were relatively lower
as its rains were not wholly directed over the PRB. Nonetheless, “Quiel” further prolonged
inundation at the Candaba swamp area, the Rio Chico River sub-basin, and eventually the lower
main Pampanga River. Angat Dam through the Ipo Dam spilled reservoir water starting in the
afternoon of September 27 until the afternoon of September 30 during the two successive events.
Maximum discharge from Angat Dam of 415 cumecs (m3/sec) was recorded midday of September
29. While this volume is comparatively small than the flood flows from the Main Pampanga River, it
partly contributed to the floodwaters downstream of the Angat River.
The local Disaster Risk Reduction and Management Councils (DRRMCs) of several areas within the
PRB, mainly the Province of Nueva Ecija and the Municipality of Calumpit in Bulacan, declared a state
of calamity following these flood events. A total of about 32 fatalities were reported within PRB area
mostly due to drowning. A nationwide total of 83 persons died as per NDRRMC report from the two
events.
The Pampanga River Flood Forecasting and Warning Center (PRFFWC) issued a total flood
information during both events as follows: 1 Flood Advisory (FA) and 18 Flood Bulletins (FB) covering
the period from September 26 to October 04, being the longest flood watch operational period for
the center since the start of the century.

Pampanga River Basin Flood – Sept-Oct 2011
PRFFWC-hth-2012 3
1.0 Hydrological Area Background – Pampanga River Basin (PRB)2
The Pampanga River basin system is the 4th largest basin in the Philippines covering an aggregate
area of 10,434 km2 (square kilometer) and is broadly divided into three sub-basins, namely: (a)
Pampanga main river basin with its catchment area of 7,978 km2, (b) Pasac river basin (or
alternatively known as the Pasac-Guagua allied river basin) with 1,371 km2 and (c) Angat River basin
with 1,085 km2. These three basins originate from different mountain areas having separate river
mouths to the Manila Bay but are interconnected by channels and their water resources
management works are mutually and closely related. The basin spreads over the administrative area
of eleven (11) provinces covering about 90 municipalities/cities. The substantial part of the basin
area (about 95%) is, however, within the bounds of four provinces, namely, Nueva Ecija, Tarlac,
Pampanga and Bulacan while the remaining fringe area (about 5%) is a part of the other seven
provinces, Aurora, Zambales, Rizal, Quezon, Pangasinan, Bataan and Nueva Vizcaya.
Figure 1.0 Pampanga River with Mt. Arayat in
the background.
Pampanga River has a channel length of 265 kms
with headwaters originating in the Caraballo
Mountains north of the basin, and flows into
Pantabangan storage dam. After the dam, it
further flows southward meeting with several
tributaries until emptying into Manila Bay. The
major tributaries are Coronel, Peñaranda, and
Rio Chico Rivers. Rio Chico has the largest
catchment area at 2,895 km2 and it joins the
main stream of Pampanga nearby Mt. Arayat
(elevation 1,026 m).
The Angat River system originates in the Sierra Madre Mountains and flows into Angat storage dam
meandering through a narrow valley. From the dam, the river flows westward and finally empties
into the Manila Bay through Labangan Floodway. There is a connecting channel with Pampanga
River, the Bagbag River, situated in the towns of Pulilan and Calumpit in Bulacan.
The Pasac-Guagua River system includes various channels running on the eastern slope of Mt.
Pinatubo, such as the Abacan-San Fernando, Pasig-Potrero and Porac-Gumain Rivers. All these rivers
originate in Mt. Pinatubo and flow into Manila Bay. In the lower reaches, the river system is
connected with Main Pampanga River by the Bebe-San Esteban Cut-off Channel. The morphologies
of Pasac River have been much affected by the eruption of Mt. Pinatubo in 1991; river alignments
have changed due to mudflow (lahar) movement, and serious sediment deposition in the river
channel is progressively active.
The basin has two swamp areas, the Candaba and the San Antonio Swamps with an area of about
250 and 100 km2, respectively. Candaba Swamp has the maximum inundation area of about 330 km2
during rainy season.
2 Major Parts taken from the Draft Final Report “The Study on Integrated Water Resources Management for Poverty Alleviation and
Economic Development in the Pampanga River Basin”. NWRB-JICA Project, December 2010. (PRFFWC is a project TWG member)
Pampanga River Basin Flood – Sept-Oct 2011
PRFFWC-hth-2012 4
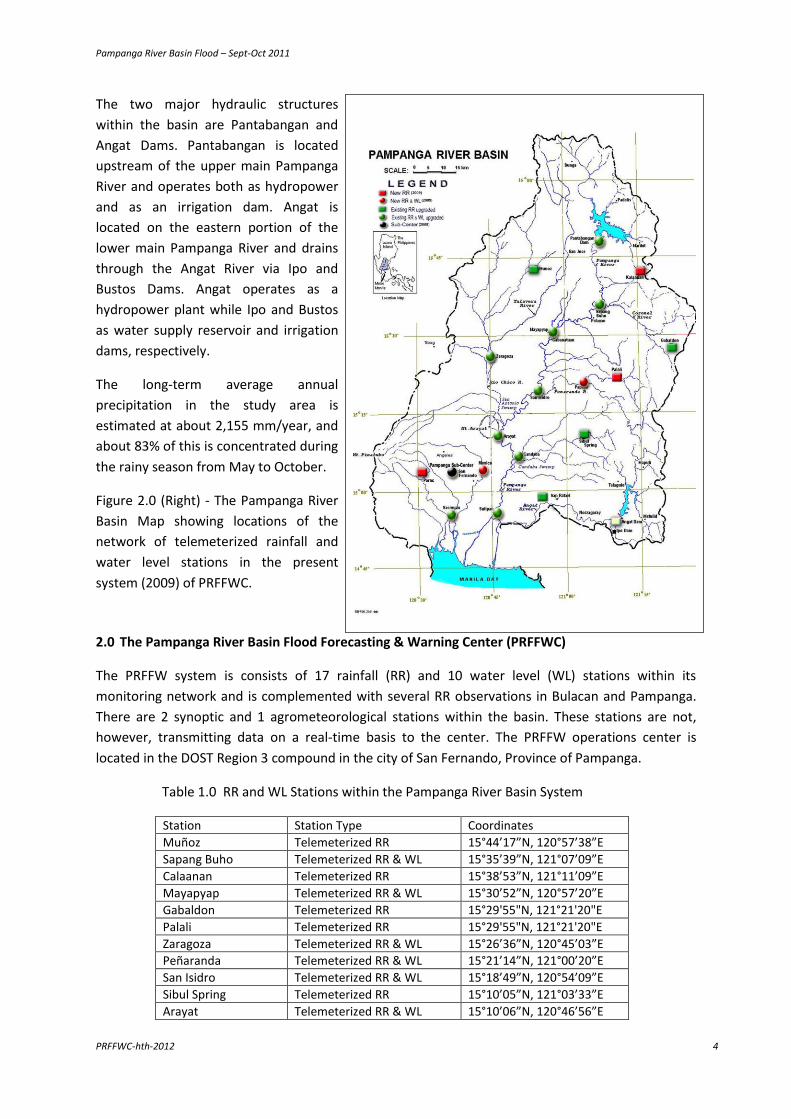
The two major hydraulic structures
within the basin are Pantabangan and
Angat Dams. Pantabangan is located
upstream of the upper main Pampanga
River and operates both as hydropower
and as an irrigation dam. Angat is
located on the eastern portion of the
lower main Pampanga River and drains
through the Angat River via Ipo and
Bustos Dams. Angat operates as a
hydropower plant while Ipo and Bustos
as water supply reservoir and irrigation
dams, respectively.
The long-term average annual
precipitation in the study area is
estimated at about 2,155 mm/year, and
about 83% of this is concentrated during
the rainy season from May to October.
Figure 2.0 (Right) - The Pampanga River
Basin Map showing locations of the
network of telemeterized rainfall and
water level stations in the present
system (2009) of PRFFWC.
2.0 The Pampanga River Basin Flood Forecasting & Warning Center (PRFFWC)
The PRFFW system is consists of 17 rainfall (RR) and 10 water level (WL) stations within its
monitoring network and is complemented with several RR observations in Bulacan and Pampanga.
There are 2 synoptic and 1 agrometeorological stations within the basin. These stations are not,
however, transmitting data on a real-time basis to the center. The PRFFW operations center is
located in the DOST Region 3 compound in the city of San Fernando, Province of Pampanga.
Table 1.0 RR and WL Stations within the Pampanga River Basin System
Station Station Type Coordinates
Muñoz Telemeterized RR 15°44’17”N, 120°57’38”E
Sapang Buho Telemeterized RR & WL 15°35’39”N, 121°07’09”E
Calaanan Telemeterized RR 15°38’53”N, 121°11’09”E
Mayapyap Telemeterized RR & WL 15°30’52”N, 120°57’20”E
Gabaldon Telemeterized RR 15°29'55"N, 121°21'20"E
Palali Telemeterized RR 15°29'55"N, 121°21'20"E
Zaragoza Telemeterized RR & WL 15°26’36”N, 120°45’03”E
Peñaranda Telemeterized RR & WL 15°21’14”N, 121°00’20”E
San Isidro Telemeterized RR & WL 15°18’49”N, 120°54’09”E
Sibul Spring Telemeterized RR 15°10’05”N, 121°03’33”E
Arayat Telemeterized RR & WL 15°10’06”N, 120°46’56”E

Pampanga River Basin Flood – Sept-Oct 2011
PRFFWC-hth-2012 5
Candaba Telemeterized RR & WL 15°06’56”N, 120°51’01”E
San Rafael Telemeterized RR 14°58’05”N, 120°54’52”E
Sulipan Telemeterized RR & WL 14°56’21”N, 120°45’39”E
Porac Telemeterized RR 15°04’48”N, 120°32’43”E
Mexico Telemeterized RR & WL 15°04’05”N, 120°43’51”E
Sasmuan Telemeterized RR & WL 14°56’11”N, 120°37’23”E
San Fernando Digital tipping-bucket RR 15°04’04”N, 120°39’22”E
Clark Synoptic 15°10’N, 120°34’E
Cabanatuan Synoptic 15°44’N, 120°56’E
CLSU, Muñoz Agrometeorological 15°43’N, 120°54’E
3.0 Meteorological Aspect
3.1 Typhoon “PEDRING” (International name: NESAT)
“Pedring” entered the Philippine Area of Responsibility (PAR) as a tropical storm East of Southern
Luzon in the afternoon of September 24 about a thousand kilometers ENE of Virac, Catanduanes,
packing maximum winds of 65 kph and gusts of up to 80 kph moving West Northwest at 19 kph
which is relatively fast for a tropical cyclone movement. PAGASA issued initial weather bulletin (no.
1) in the afternoon of that day.
Before noon of September 25, “Pedring” has intensified its center winds just short of a 100 kph and
gusts of 120 kph and was located about 600 kms ENE of Virac. It increased its speed at 22 kph on a
westward direction. Public Storm Warning Signals (PSWS) were now raised in several of the Bicol
region provinces. Towards night time, PSWS were further issued at other surrounding provinces.
“Pedring” had further intensified into a typhoon category before noon of September 26. With
maximum winds of 120 kph and gusts of up to 150 kph, it was now moving on a WNW direction
between 17 to 19 kph as it now threatens the Isabela-Aurora Area. PSWS no. 1 was raised over the
provinces of Region 3 except in Aurora which was placed under PSWS no. 2.
Typhoon “Pedring” made landfall between the boundary of Aurora and Isabela Provinces before
dawn of September 27 with maximum winds of 140 kph and gusts of up to 170 kph maintaining a
WNW direction on a 19 kph movement. PSWS no. 3 was raised over Aurora, Tarlac, Nueva Ecija and
Zambales for Region 3 while PSWS no. 2 over the rest of the provinces in the region. “Pedring” had
weakened considerably before noon as it crossed the rugged terrain of the Sierra Madre mountain
range to a 120 kph maximum winds and gusts down to 150 kph without changing its direction and
movement. Before nightfall, the typhoon had already crossed Northern Luzon via Casiguran, Baguio
and exiting south of San Fernando, La Union towards the West Philippine Sea.
By noon of September 28 as it trekked within the West Philippine Sea and moved away from the
country, “Pedring” eventually re-intensified back into 130 kph winds and gusts of 160 kph
maintaining its speed and direction. By late afternoon of that day, final weather bulletin for Typhoon
“Pedring” was issued as it moved further away from the country and eventually exited the PAR.
“Pedring” was the 16th tropical cyclone to pass through the PAR. PAGASA issued 16 weather
bulletins during its passage through the PAR. It struck the country with a maximum observed 1-min
sustained wind speed of 105 knots (194 kph; 121 mph) early of September 27. NDRRMC stated

Pampanga River Basin Flood – Sept-Oct 2011
PRFFWC-hth-2012 6
“Pedring” as one of the costliest typhoons to have affected the nation by putting the total damage to
both agriculture and infrastructure at US$ 201,749,712.3
Figure 3.0 Track of Typhoon “Pedring” during
its course within the PAR (Sept 24 to 28).4
Figure 3.1 The enhanced IR satellite image of
“Pedring” as of 0432H (LST), September 27, 2011 as
it made landfall over at the Isabela-Aurora
boundary.
3.2 Typhoon “QUIEL” (International name: NALGAE)
“Quiel” was the 17th tropical cyclone to hit the country for the year 2011. With floods still on the
verged of cresting in many parts of Northern and Central Luzon due to “Pedring”, “Quiel” entered
the PAR as a tropical storm at the East of Northern Luzon, about 1,240 kms East of Aparri, Cagayan,
on the morning of September 29. It was packing maximum winds of 105 kph near its center and
gusts of up to 135 kph moving West at 10 kph. By late afternoon, “Quiel” intensified into a typhoon
category and increased its threat to Northern Luzon as it accelerated to a 22 kph movement.
By afternoon of September 30, “Quiel” was already 490 kms East of Tuguegarao, Cagayan now with
winds of 140 kph and gusts of 170 kph moving westward at 26 kph. Various PSWS were now raised
at almost all the provinces of Northern Luzon.
Apparently in the usual way of maintaining a westward direction, “Quiel” unexpectedly changed its
course to West Southwest before dawn of October 01 and now threatened the Aurora-Isabela area.
More serious was that its winds increased to 160 kph and gusts now close to 200 kph. PSWS no. 2
was raised over 6 provinces of Region 3 except for Bataan which was under PSWS no. 1.
Typhoon “Quiel” made landfall over Dinapigue, Isabela at around past 1000H (LST) of October 01
and cut across the Cordillera mountain range exiting through La Union Province in just about 6
3 Portions taken from http://en.wikipedia.org/wiki/Typhoon_Nesat_(2011)
4 Track of Tropical Cyclone “Pedring” courtesy of “ [email protected]”

Pampanga River Basin Flood – Sept-Oct 2011
PRFFWC-hth-2012 7
hours. Before midnight, the typhoon was over the West Philippine Sea. “Quiel” left the PAR in the
morning of October 2 as a tropical storm but not after toppling fairly a number of structures, caused
landslides and further aggravating the already flooded areas in many parts of Northern and Central
Luzon.
Figure 4.0 Track of Typhoon “Quiel” within
the PAR (Sept 29 to Oct. 02).5
Figure 4.1 Enhanced IR satellite image of “Quiel” taken
at about 0832H (LST), October 01, 2011.
4.0 Basin Hydrological Aspect
Table 2.0 Rainfall Intensity Classification Table (mm/hr)
Category 1 hour 3 hours 6 hours 12 hours 24 hours
Light < 2.5 < 7.5 < 15 < 30 < 60
Moderate 2.5 – 7.5 7.5 – 22.5 15 – 45 30 – 90 60 – 180
Heavy > 7.5 > 22.5 > 45 > 90 > 180
4.1 Rainfall (“Pedring”)
Table 2.1 Pampanga River Basin 24-hr rainfall for the period Sept 26 to 28.
Stations September 2011 Maximum observed 1 –hr RR
Time (LST) / Day of maximum 1-hr RR for the period September 26 to 28, 2011
26 27 28
Muñoz 66 175 6 35 1400H / Sept 27
Sapang Buho 141 182 8 26 1300H / Sept 27
Gabaldon 422 184 4 37 0300H / Sept 27
Zaragoza 46 170 6 33 1300H / Sept 27
Mayapyap 82 170 15 26 1300H / Sept 27
Peñaranda 108 199 8 36 1100H / Sept 27
Calaanan 177 211 5 28 1300H / Sept 27
Palali 248 156 1 25 1500H / Sept 27
San Isidro 73 187 9 35 1100H / Sept 27
5 Track of Tropical Cyclone “Quiel” courtesy of “ [email protected]”

Pampanga River Basin Flood – Sept-Oct 2011
PRFFWC-hth-2012 8
Arayat 49 221 15 49 1400H / Sept 27
Candaba 49 200 12 52 1300H / Sept 27
Sibul Springs 108 261 2 55 1300H / Sept 27
Sulipan 34 158 14 26 1300H / Sept 27
San Rafael 61 245 4 35 1300H / Sept 27 Basin Average 118.8 194.2 7.8
Table 2.2 Pasac-Guagua River Basin (Allied basin) RR for the same period
Stations September 2011 Maximum observed 1 –hr RR
Time (LST) / Day of maximum 1-hr RR for the period September 26 to 28, 2011
26 27 28
Sasmuan 27 152 19 19 1000H / Sept 27
Mexico 35 227 23 42 1300H / Sept 27
Porac 30 207 32 36 1300H / Sept 27
San Fernando 23 190 20 38.1 1300H / Sept 27 Basin Average 28.7 194.0 23.5
Rainfall observations mainly from various stations within PRB were used to produce the 24-hr
meteorological day (met-day) isohyets for September 26 and 27. From the above tables, the highest
basin average rainfall was on the met-day of September 27. Maximum 1-hr rainfall in most of the
stations generally occurred before and after noontime of the 27th except for Gabaldon station,
which was on the early morning of the 27th falling within the met-day of September 26.
Table 2.3 Other stations (Synoptic) RR for the period
Stations September 2011
26 27 28
Clark, Pampanga 28.8
Cabanatuan, Nueva Ecija 97 189 16.2
Baler, Aurora 48 160 2.8
Subic, Zambales 401 113.4
Iba, Zambales 55 178 77.8
Carmen, Pangasinan (ARB)
31 133 22
Sta. Barbara, Pangasinan (ARB)
19 137 13
Tibag, Tarlac (ARB) 39 89 21
Shaded cells are as per available FFWS-HMD info. ARB - Agno River Basin; Blanks – no data provided
Isohyets for September 26, which is the 24-hour rainfall total ending at 8 am of September 27
(Figure 4.2 left side), shows a fairly tight contour at the eastern part of the basin, particularly at the
Gabaldon area in Nueva Ecija. The 24-hour rainfall total for Gabaldon station during that period was
422 mm. Likewise, Palali (Gen. Tinio) and Calaanan (Bongabon) stations have considerably higher
rainfall totals as well, 248 mm and 177 mm, respectively. Heavy rains at the eastern part of the basin
started in the afternoon of September 26. On the other hand, September 27 isohyets, which is the
24-hour rainfall totals ending at 8 am of September 28 (Figure 4.2 right side), shows a shift of tight
isohyets towards the southwest part of the basin.

Pampanga River Basin Flood – Sept-Oct 2011
PRFFWC-hth-2012 9
Figure 4.2 The 24-hour met-day (meteorological day) isohyets for September 26 (top left) and
September 27 (top right ) during the passage of Typhoon “Pedring”.
4.2 Rainfall (“Quiel”)
Table 3.1 Pampanga River Basin RR total for the period Sept 30 to Oct 02
Stations Sept. October 2011 Maximum observed 1 –hr RR
Time (LST) / Day of maximum 1-hr RR for the period Sept. 30 to Oct 3, 2011 30 01 02
Muñoz 1 164 7 26 1800H / Oct 01
Sapang Buho 1 97 11 20 1300H / Oct 01
Gabaldon 4 74 15 23 1200H / Oct 01
Zaragoza 0 102 12 23 1900H / Oct 01
Mayapyap 0 68 5 11 1300H / Oct 01
Peñaranda 0 37 3 9 1400H / Oct 01
Calaanan 6 112 14 28 1400H / Oct 01
Palali 1 36 5 9 1300H / Oct 01
San Isidro 0 40 23 9 1600H / Oct 02
Arayat 3 25 57 22 0500H / Oct 03
Candaba 0 11 5 2 1300H / Oct 01
Sibul Springs 0 15 1 4 2100H / Oct 03
Sulipan 2 13 8 3 1200H / Oct 01
San Rafael 0 10 3 4 1500H / Oct 01 Basin Average 1.3 57.4 12.1

Pampanga River Basin Flood – Sept-Oct 2011
PRFFWC-hth-2012 10
Table 3.2 Pasac-Guagua River Basin (Allied basin) RR for the same period
Stations Sept. October 2011 Maximum observed 1 –hr RR
Time (LST) / Day of maximum 1-hr RR for the period Sept. 30 to Oct 3, 2011
30 1 2
Sasmuan 0 33 30 13 0400H / Oct 03
Mexico 14 13 33 19 0500H / Oct 03
Porac 9 65 55 42 0300H / Oct 03
San Fernando 5 19 58 Basin Average 7.0 32.5 44.0
Table 3.3 Other stations (Synoptic) RR for the period
Stations Sept. October 2011
30 1 2
Clark, Pampanga 40
Cabanatuan, Nueva Ecija 87.8 4.2
Baler, Aurora 6.8 23
Subic, Zambales 0.5 88
Iba, Zambales 12.6 160 48.2
Carmen, Pangasinan (ARB)
1 137 0
Sta. Barbara, Pangasinan (ARB)
32 111 0
Tibag, Tarlac (ARB) 1 150 1
Shaded cells are as per available FFWS-HMD info. ARB - Agno River Basin; Blanks - no data provided
Basin average rainfall during the event “Quiel”
was highest on the met-day October 01 for the
PRB, although the allied basin of Pasac-Guagua
had a maximum basin average on October 02.
The 24-hour isohyets for met-day October 01 is
shown on the figure on the right (Figure 4.3).
Rainfall distribution shows higher amounts at
the upper part of the basin, in particular at the
sub-basin of Rio Chico situated on the
northwest corner of PRB. The rainfall effects of
“Quiel” were mainly concentrated over at the
Agno River Basin (ARB) which adjacently bounds
PRB on the northwest to its north northwest
corner side. A relatively lower average rainfall
distribution prevailed over the PRB for met-day
October 02; also, the 3 adjacent stations of ARB
during that same period (Table 3.3) recorded
almost no rainfall.
Figure 4.3 Isohyets for the met-day October 01.

Pampanga River Basin Flood – Sept-Oct 2011
PRFFWC-hth-2012 11
5.0 River Heights during the events
5.1 Station gauge heights during “Pedring”
Table 4.0 Time / Date of Station’s Flood Assessment Gage Heights were reached during “Pedring”
Station Point Alert Level Alarm Level Critical Level Remarks
Sapang Buho (3.70 m) Before 0600H of Sept. 27
(4.50 m) Between 0800H-0900H, Sept. 27
(6.50 m) Before 1400H of Sept. 27
Peak WL based on telemetry reading was 7.17 m (57.364 m AMSL) attained at about 1600H of Sept 27.
Mayapyap (3.00 m) Around 1300H of Sept. 27
(3.50 m) Before 1500H of Sept. 27
(4.50 m) Around 1600H of Sept. 27
Peak WL based on telemetry reading was 6.86 m (32.66 m AMSL) attained at around 2100H of Sept 27.
Zaragoza (11.00 m) Already above this level prior to the event
(12.50 m) Already above this level prior to the event
(14.50 m) Before 1100H of Sept. 28
WL crested as per telemetry records at 5.19 m (15.403 m AMSL) attained on 0800H, Sept 29.
Peñaranda No assigned assessment levels at the moment Maximum telemetry reading of 6.01 m (24.306 m TBM based) recorded on 1700H of Sept. 27.
San Isidro (3.20 m) Before 0500H of Sept 27
(4.50 m) Before 1100H of Sept 27
(6.00 m) Before 1500H of Sept 27
Peak WL based on telemetry records was 7.75 m (17.335 m AMSL) attained at around 0800H of Sept 28.
Arayat (station out of order)
(5.00 m)
(6.00 m)
(8.50 m)
As per interview at the site, all assessment levels were reached and WL crested as per estimated flood marks at 10.60 m (10.677 m AMSL) attained around morning of September 30.
Candaba (3.00 m) Already above this level prior to the event
(4.50 m) About 1300H of Sept 27
(5.00 m) Before 2000H of Sept 27
Swamp water crested, as per telemetry records, at 7.62 m (7.463 m AMSL) reached on 2000H, Sept 29th and remained above the 7.00 m level until 0600H of Oct. 02
Mexico No assigned assessment levels at the moment Maximum WL based on telemetry readings was 3.30 m (9.233 m TBM based) and was attained on 1800H of Sept 27.
Sasmuan No assigned assessment levels at the moment Guagua River at Sasmuan station crested, as per telemetry records, at 3.09 m (1.673 m AMSL) attained on 0100H of Sept 28.
Sulipan (3.60 m) Around 0400H of Sept 29
(4.20 m) Around 1300H of Sept 29
(5.00 m) Not reached
Maximum WL based on telemetry readings was 4.85 m (4.788 m AMSL) attained on 1900H of Sept 30.
Note: Elevation of “0” of staff gages were based on surveys undertaken on August 2009. TBM – Temporary Bench Mark
Water level stations with assessment levels were all reached during the event “Pedring” with the
exception only of Sulipan station’s which fell short by 15 centimeters from its designated critical level
of 5.0 meters. Mexico and Sasmuan stations, the only two WL stations in the allied river basin of Pasac-

Pampanga River Basin Flood – Sept-Oct 2011
PRFFWC-hth-2012 12
Guagua, have relatively lower flood crest levels as compared to a previous event “Falcon” (June 23-29)
on the same year. On the other hand, a much lower stage levels were recorded for WL stations within
the PRB during the said event (“Falcon”). This clearly shows that floodwaters brought by event
“Pedring” were concentrated more towards the PRB rather than in its allied river basin, Pasac-Guagua.
Figure 5.0 Hyetograph (mean basin rainfall) and hydrographs at various forecasting points within the
basin covering the period from September 26 to October 30 during event “Pedring”.
5.2 Station gauge heights during “Quiel”
Table 4.1 Time / Date of Station’s Flood Assessment Gage Heights were reached during “Quiel”
Station Point Alert Level Alarm Level Critical Level Remarks
Sapang Buho (3.70 m) Before 1800H of Oct. 01
(4.50 m) Before 1900H of Oct. 01
(6.50 m) Not reached
Peak WL based on telemetry reading was 4.83 m (55.024 m AMSL) attained at about 2100H of Oct. 01.
Mayapyap (3.00 m) Just after midnight of Oct. 02
(3.50 m) About 0300H of Oct. 02 (peak)
(4.50 m) At 2100H of Oct. 01
Peak WL based on telemetry reading was 3.49 m (29.29 m AMSL) attained at around 0300H of Oct. 02
Zaragoza (11.00 m) Already above this level prior to the event
(12.50 m) Already above this level prior to the event
(14.50 m) Before 1100H of Sept. 28
WL crested as per telemetry records at 5.18 m (15.393 m AMSL) attained on 0200H, Oct. 03.
Peñaranda No assigned assessment levels at the moment Maximum telemetry reading of 0.77 m (19.066 m TBM based) recorded on 1900H of Oct. 01.

Pampanga River Basin Flood – Sept-Oct 2011
PRFFWC-hth-2012 13
San Isidro (3.20 m) Before 0600H of Oct 2
(4.50 m) Was not reached
(6.00 m) Was not reached
Peak WL based on telemetry records was 4.38 m (13.965 m AMSL) attained on 1600H of Oct. 02.
Arayat (station out of order)
(5.00 m)
(6.00 m)
(8.50 m)
As per estimates peak WL reached above alarm but no longer reached critical level.
Candaba (3.00 m) Already above this level prior to the event
(4.50 m) Already above this level prior to the event
(5.00 m) Already above this level prior to the event
Swamp water level was still above the critical level coming from the previous flood event – “Pedring” and river was receding slowly.
Mexico No assigned assessment levels at the moment Maximum WL based on telemetry readings was 2.42 m (8.353 m TBM based) and was attained on 0600H of Oct 03.
Sasmuan No assigned assessment levels at the moment Guagua River at Sasmuan station crested, as per telemetry records, at two same peak values of 2.92 m (1.503 m AMSL) attained on 0300H of Oct 02 and 0400H of Oct. 03.
Sulipan (3.60 m) Already above this level prior to the event
(4.20 m) Already above this level prior to the event
(5.00 m) Not reached
Water level was still above the alarm level coming from the previous flood event - “Pedring” and river was receding slowly.
Note: Elevation of “0” of staff gages were based on surveys undertaken on August 2009. TBM – Temporary Bench Mark
Figure 5.1 Hyetograph (mean basin rainfall) and hydrographs at various forecasting points within the
basin covering from the period October 01 to 04 during event “Quiel”.

Pampanga River Basin Flood – Sept-Oct 2011
PRFFWC-hth-2012 14
Floodwaters during event “Quiel” (Table 4.1) were generally quite lower than with event “Pedring”
(Table 4.0). Zaragoza WL is more or less equal for both events. “Quiel’s” effect may not have
equalled the floodwaters during the former (“Pedring”) event but it did prolonged floods at the
downstream sections of PRB where most of the water levels are still either above the alarm or
critical levels. This can be clearly seen at Figure 5.1 where hydrographs for Candaba and Sulipan are
just starting on its falling trend on October 01.
5.3 Coastal Flooding: Tides and Storm Surge
Tides were at moderately high during the flood periods for both events. This may have contributed
partly in the delay of floodwaters at the downstream sections of the basin in reaching its outlet in
Manila Bay. High tide effects in the basin can sometimes reached further upstream of Sulipan
station up to Arayat station during low flow conditions of the Pampanga River.
Table 5.0 High Tide (highest for the day) September 26 to October 04, 2011
Day Time Height (in meters)
Sept. 26 8:37 AM 1.15
27 9:33 AM 1.10
28 10:32 AM 1.00
29 10:36 AM 1.04
30 11:10 AM 1.10
Oct. 01 11:48 AM 1.13
02
03 12:32 AM 1.13
04 1:21 AM 1.10 Note: Based on Navotas port, Latitude 14º 41' N, Longitude 120º 56' E
As per survey undertaken by a PAGASA team along Manila Bay (Roxas Blvd. Area, Metro Manila) and
at the coastal areas of Navotas, it reported that a storm surge affected these areas on the morning
of September 27 between the time period 0700H-1000H. 6 This coincided with the projected high
tide occurring at around 0900H of the same day.
Surveys made at some coastal barangays in the towns of Obando and Bulakan (Sitio Parihan in Bgy.
Taliptip) in the Province of Bulacan, similar high splashing of seawater and strong winds (storm surge
effects) were experienced between the period 0800H-1000H. It was reported also that it was at this
time period that these areas experienced the start of flooding in their areas. It is also likely that
coastal areas of Hagonoy, Malolos, and Paombong in Bulacan, Macabebe, Masantol, and Sasmuan in
Pampanga have been affected by the storm surge generated by “Pedring”.
5.4 Hydraulic Structures / Dam Releases
Pantabangan and Angat Dams are the two major hydraulic structures within PRB. Pantabangan Dam
is located upstream of upper main Pampanga River and operates both as hydropower and as an
irrigation reservoir. Conversely, Angat Dam is located on the eastern portion of the lower main
Pampanga River and drains through the Angat River via the Ipo and Bustos Dams. It operates chiefly
6 Powerpoint presentation: “Storm Surge in Manila Bay, Typhoon “Pedring” (Sept. 26-28, 2011)” presented by N. Nimes, J. Nimes & W.
Tuazon.

Pampanga River Basin Flood – Sept-Oct 2011
PRFFWC-hth-2012 15
as a hydropower plant. Ipo Dam, which supports and minimally regulates releases coming from the
Angat Dam, is situated about 7 kms downstream of the latter. Ipo serves as an active reservoir for
water supply requirements of Metro Manila. It is not an impounding reservoir but more of a
diversion dam and quite smaller than Angat Dam. Bustos Dam is located around 38 kms downstream
of Ipo and serves mainly as an irrigation reservoir.
A small tributary, the Bayabas River, joins the Angat River in between the river stretch from Ipo Dam
to Bustos Dam, about 28 kms downstream of the former. It contributes additional water to Bustos
Dam whenever there are relatively significant flows coming from the mountainous area of DRT.
During “Pedring” spilling operations from Angat dam commenced at around 1600H of September 27.
Maximum Q (discharge) attained during the whole spilling period occurred at 0900H of September
29 at 414.75 cumecs (or a total outflow of about 507 cumecs including outflows to the main and
auxiliary turbines). Based on available info (Table 6.0) maximum Q at Ipo was 560.2 cumecs
occurring around noontime of the 26th and for Bustos a peak outflow of 1,300 cumecs at around
1400H of September 27. The relatively big outflow at Bustos Dam can be attributed mainly to the
significant contributions of Bayabas River coming in to the mainstream of Angat River prior to Bustos
Dam.
Table 6.0 Dam spilling report during the event
Date Angat Dam Ipo Dam Bustos Dam
Time Gates opened
& opening
Spill Q (cumecs)
Time Gates opened
Spill Q (cumecs)
Time Gates opened
Spill Q (cumecs)
Sept 26 1220H 3 560.2 1200H 4 725
Sept 27 1700H 1 @ 1m. 116 1600H 3 662 1400H 5 1300
1900H 2 @ 1m. 237
2100H 1 @ 0.5 60 2115H 2 170 2200H 5 1200
Sept 28 0500H 1 @ 0.5 60 0400H 2 170 0500H 2 430
1100H 2 @ 0.5 204 1100H 2 270
1600H 3 @ 0.5 207
1700H 3 @ 0.5 207 1700H 2 400
Sept 29 0600H 3 @ 0.5 207 0600H 3 387.7 0600H 2 400
0900H 3 @ 1m. 415
1800H 3 @ 1m. 404
Sept 30 0100H 3 @ 1m. 395
0800H 3 @ 1m. 384 1100H closed
1600H closed 1900H 3 200
Oct 01 closed closed 0600H 1 17.35
Oct 02 closed closed 1000H 1 65
Oct 03 closed closed 0800H 1 65
1700H 1 65
Note: Ipo and Bustos Dam spilling information were taken from Province of Bulacan presentation entitled “Effects of Typhoon Pedring and Tropical Storm Quiel” dated Oct. 17, 2011; Angat Dam data/ info were taken from Angat Dam FFWSDO data sheet. Red values under Angat Dam are the maximum Q for that day.
Ipo and Angat Dams both closed their gates on September 30, around 1100H and 1600H,
respectively. No information is available as to when Bustos Dam closed its sector gates.

Pampanga River Basin Flood – Sept-Oct 2011
PRFFWC-hth-2012 16
Bulu Dam is a small impounding reservoir for irrigation and is situated in the town of San Miguel,
Bulacan along the Bulu River. Bulu Dam breached on the afternoon of September 27 (1430H)
inundating almost all barangays at its downstream sections up to the Maharlika Hi-Way in San
Miguel, Bulacan and eventually towards the Candaba swamp area.
6.0 Basin Hydrological Situations during the Events “Pedring” and “Quiel”
“Pedring’s” effect over the PRB generally started in the afternoon of September 26 as continuous
moderate to occasionally heavy rains spawned by the disturbance on the eastern part of PRB until
the morning of the next day, September 27, caused overflowing of rivers and streams in the upper
PRB starting in the morning until afternoon of that day. In particular, Digmala River in Bongabon,
Coronel River in Gabaldon and Laur, Cabu River in Palayan City, Upper main Pampanga River in
Palayan and Cabanatuan, Chico and Penaranda Rivers in Gen. Tinio and Penaranda, respectively.
Figure 6.0 “Pedring” flood event timeline map from September 26 to 27, 2011.
Pampanga River Basin Flood – Sept-Oct 2011
PRFFWC-hth-2012 17
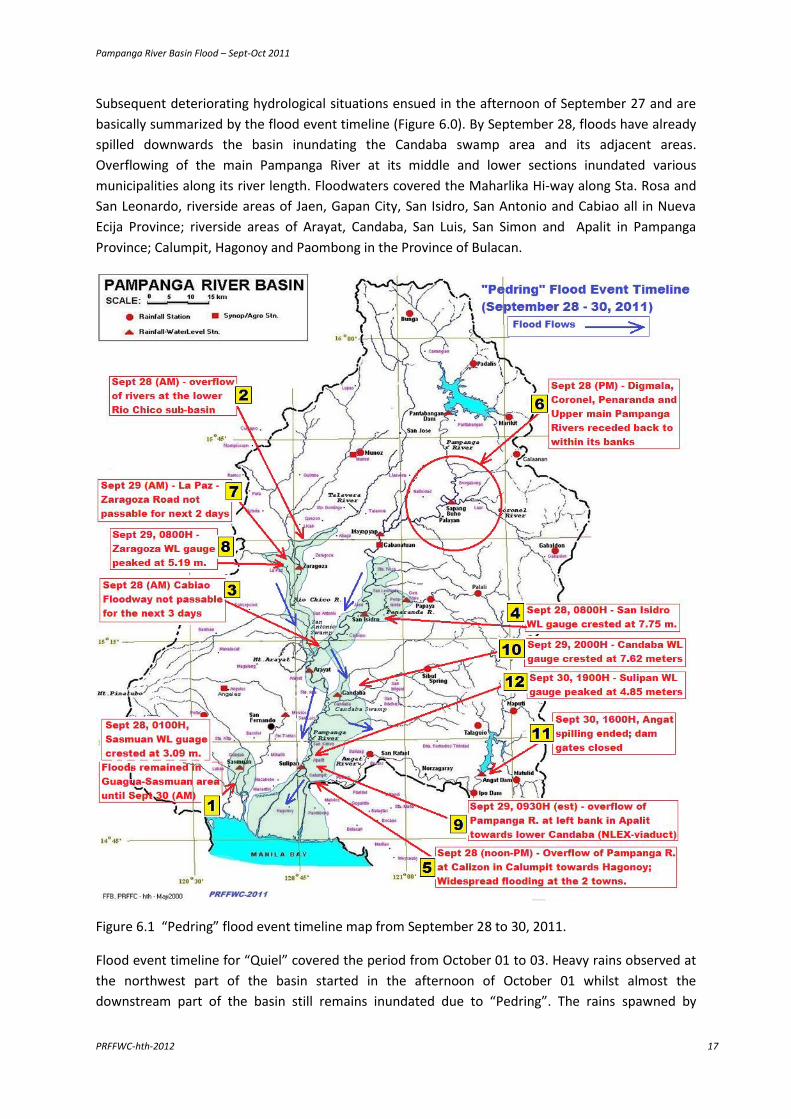
Subsequent deteriorating hydrological situations ensued in the afternoon of September 27 and are
basically summarized by the flood event timeline (Figure 6.0). By September 28, floods have already
spilled downwards the basin inundating the Candaba swamp area and its adjacent areas.
Overflowing of the main Pampanga River at its middle and lower sections inundated various
municipalities along its river length. Floodwaters covered the Maharlika Hi-way along Sta. Rosa and
San Leonardo, riverside areas of Jaen, Gapan City, San Isidro, San Antonio and Cabiao all in Nueva
Ecija Province; riverside areas of Arayat, Candaba, San Luis, San Simon and Apalit in Pampanga
Province; Calumpit, Hagonoy and Paombong in the Province of Bulacan.
Figure 6.1 “Pedring” flood event timeline map from September 28 to 30, 2011.
Flood event timeline for “Quiel” covered the period from October 01 to 03. Heavy rains observed at
the northwest part of the basin started in the afternoon of October 01 whilst almost the
downstream part of the basin still remains inundated due to “Pedring”. The rains spawned by

Pampanga River Basin Flood – Sept-Oct 2011
PRFFWC-hth-2012 18
“Quiel” were mainly focused on the adjacent river basin of Agno and generally affecting the sub-
basin of Rio Chico in the northwest corner of PRB. The Talavera, Ilog Baliwag, and mainly the Rio
Chico Rivers are some of the waterways that were affected at that part of the basin. Areas that were
partly and/or generally affected by floods that time were Victoria, Concepcion, portions of Tarlac
City and La Paz all in Tarlac province, with the latter being the worst-affected area; Quezon, Licab,
Aliaga, Talavera, Zaragoza and San Antonio all in Nueva Ecija Province.
Figure 6.2 “Quiel” flood event timeline map from October 01 to 03, 2011.
7.0 Event Casualties and Damages (PRB / Region 3)7
Within the basin, the local Disaster Risk Reduction and Management Councils (DRRMCs) of the
Province of Nueva Ecija (NE) and the Municipality of Calumpit in Bulacan (areas within the PRB)
7 NDRRMC Sitrep 25 and 25 re Effects of T. Pedring, dated October 10 and 11, 2011 (www.ndrrmc.gov.ph)

Pampanga River Basin Flood – Sept-Oct 2011
PRFFWC-hth-2012 19
declared a State of Calamity following the flood event. There were 52 fatalities reported within
Region 3 area mostly as a result of drowning. Breakdown of fatalities are as follows: 24 from
Bulacan, 11 from NE, 8 in Pampanga, 8 in Zambales, and 1 for Bataan. A national total of 83 persons
died as per NDRRMC report from the two events which affected a total of 42 cities and 312
municipalities in 35 provinces of 9 regions in the country including the National Capital Region (NCR).
Table 7.0 Breakdown of the population, towns / cities and barangays affected (in Region 3)
Province Total Towns & / or Cities affected
Total Barangays affected
Number of Families affected
Number of persons affected
Aurora 8 80 11,782 57,146
Bataan 9 175 52,593 240,659
Bulacan 24 350 123,048 587,440
Nueva Ecija 27 444 108,172 513,320
Pampanga 22 364 104,324 492,763
Tarlac 12 150 27,728 111,868
Zambales 14 159 24,712 120,806
Total for Region 116 1,722 452,359 2,124,002 Aurora, Bataan and Zambales are mainly outside the river basin. About 1/3 of Tarlac and 2/3 of Bulacan are within the PRB.
More than 450,000 families were affected within the Region, most of which are within the PRB.
Damaged houses for the Region totalled 22,393 of which 3,561 were totally damaged. Zambales had
the most number of houses damaged within the region as a result of the winds from the 2 events.
Total damage to both infrastructure and agriculture for whole of Region 3 amounted to an annual
disaster high of P 11,392,473,079.36. Agricultural related damage of about P 8 billion particularly to
rice and corn crops which occupy a bulk of the aforementioned damage. The province of Nueva Ecija
got the biggest share in terms of agricultural damage, rice and corn, amounting to some Philippine
pesos P 3,700,966,732.00.
Out of the 10 tropical disturbances that affected the country in 2011, T. “Pedring” ranked as number
one in terms of total damages to property with an astounding amount of P 15, 552, 586,957.49.
8.0 Areas Flooded within the PRB system during the Event
Flood information provided by various LGUs within the basin were gathered to produce an
estimated list of areas (towns) affected during “Pedring” and “Quiel”.
Table 8.0 Areas flooded per Province within PRB with estimated range of flood depth
Towns Number of Barangays
affected as per reports
Estimated range of flood depths
reported / observed (meters)
Situational Remarks
Province of Bulacan
Angat 9 Mostly riverside areas
Baliuag 17
Bustos 9 0.6 Mostly riverside areas
Calumpit 29 0.5 – 3.0 Almost whole town got flooded
Hagonoy 26 0.5 – 3.0 Overflow of Pampanga R. & tributaries
Malolos City 24 0.4 – 1.2 Some barangays are outside the basin

Pampanga River Basin Flood – Sept-Oct 2011
PRFFWC-hth-2012 20
Norzagaray 2 Mostly riverside areas
Paombong 14 1.3
Plaridel 4 Mostly riverside areas
Pulilan 17
San Ildefonso 14 0.3 – 0.5 Mostly ponded rainwater
San Miguel 50 0.8 – 2.4 More than half of the area (bgys) were inundated - breaching of Bulu Dam
San Rafael 12 0.75 – 1.5 Overflow of Maasim R. & Candaba
Province of Pampanga
Guagua 25 0.3 - 0.9
Sasmuan 12 0.2 - 0.5
Candaba 33 0.6 - 2.5 Almost whole town got flooded
Masantol 26 0.6 - 1.5
San Luis 17 0.6 - 2.5 Mostly areas along the Pampanga R. / Candaba swamp
Sta. Ana 14 0.3 - 1.2 Mostly rice fields (ponded rainwater)
Apalit 12 0.6 - 1.5 Riverside areas (Pampanga R.)
Mexico 21 0.3 - 1.0 Mostly rice fields (ponded rainwater)
Mabalacat 6 0.6 - 1.0
San Simon 14 1.0 - 2.5 Mostly areas along the Pampanga R. / Candaba swamp
Sta. Rita 2 0.3 - 0.6
Sto. Tomas 7 0.3 - 1.0
Floridablanca 15
Bacolor 8 0.3 - 0.6
Macabebe 25 0.3 – 1.2
Arayat 21 0.3 – 1.6
Magalang 1 0.6
Minalin 15 0.3 – 0.7
Lubao 21 0.3 – 0.6
San Fernando 10 0.3 – 1.8
Province of Nueva Ecija
Bongabon 23 0.3 – 1.0 Riverside areas and fields (ponding)
Laur 4 0.3 – 1.8 River overflow (Coronel & Nabao)
Palayan City 5 0.3 – 1.0 Pampanga & Cabu Rivers
Gapan City 16 1.0 – 6.0
Sta. Rosa 14 0.5 – 2.1 Overflow of Pampanga, Tabuating & Minatula Rivers
Gen. Tinio 3 4 – 4.5 Flash floods on Sept 26, mountainside areas
Peñaranda 4 3 - 4 From upstream areas (Gen. Tinio)
Zaragoza 6 1 – 1.2 Mostly rice field areas
Aliaga 5 1.5 – 2.4
San Leonardo 15 1.5 – 3.0 Overflow of Pampanga R. & tributaries
Gen. Natividad 1 1.5 Rice field areas
Cabanatuan City 0.5 – 1.2 Overflow of Pampanga R. & tributaries
San Antonio 4 1.0 Ponded rainwater; overflow of Pampanga R.
Cabiao 4 0.4 – 2.5 Overflow of Pampanga R.
San Isidro
Jaen 27 0.6 – 3.6 Overflow of Pampanga R.
Talavera Overflow of Talavera R.
Gabaldon Riverside areas due to heavy rains
Province of Tarlac (within PRB)
La Paz 18 0.3 – 1.8 Overflow of Rio Chico & tributaries

Pampanga River Basin Flood – Sept-Oct 2011
PRFFWC-hth-2012 21
Concepcion 7 0.6 – 1.5
Capas
Tarlac City (portions)
Flood reports from various LGUs, agencies and from several surveys were used to produce a list of
areas that were flooded during the event. Unfortunately, not all resource areas were able to provide
information mainly because of the extent and depth of the effects of the flood within the basin
causing most of these entities to execute evacuation responses rather than take info notes.
Figure 7.0 Estimated spot flood level (maximum) map during the event as per available reports from
the various DRRMOs within the PRB.

Pampanga River Basin Flood – Sept-Oct 2011
PRFFWC-hth-2012 22
9.0 Flood Forecasting & Warning Activities
Flood Advisory (FA) is hydrological
information in general or in its simplest
form. It is initialized anytime during
flood watch period for awareness or
preparedness of the flood prone areas
within telemetered basins, when their
rivers and streams are likely to be
affected by high streamflow or flooding
or flash flooding. 8
During “Pedring” initial Flood Advisory
(FA) information was issued at 1600H
of September 26 (Figure 8.0). The
information specifically warned on
possible landslides and of river flooding
including flash floods at areas close to
mountain slopes and adjacent to the
upper main Pampanga River. Further,
included in the advisory is a list of
waterways that are likely to be
affected: the Rio Chico River, rivers
within the allied basin of Guagua River,
and the Candaba swamp area.
Figure 8.0 Initial Flood Information during the event.
Figure 8.1 Flood Bulletin No. 1 issued at 0500H, 27 September 2012.
8 Provision of Hydro (Flood) Information Protocol (as of July 2011) by H.M. Borja, AWSC, HMD

Pampanga River Basin Flood – Sept-Oct 2011
PRFFWC-hth-2012 23
Flood Bulletin (FB) number 1 was issued on the following day, 0500H of September 27. Flood
situational message in the bulletin suggested possible flooding within the day in almost all the
upstream forecasting points and flood possibilities at downstream areas later that day. Flood
Bulletins (FB) are more specific flood information issued whether or not it is being preceded by a
basin general flood advisory (depending on the situation) during flood watch monitoring. It can be
initialized anytime and issued regularly by FFWCs thereafter until being finalized when floodwaters
have generally subsided or no significant increases in the present situation is expected further. FB is
more near specific as to river level changes, in terms of its rising and falling trends including the
possible areas (towns/cities) to be affected. FB is issued by PRFFWC at 5am and 5pm daily during
flood watch operations unless when situations warrants that an intermediate FB needs to be issued
at any time between those two issuance stages to cover for unfavorable situations within the basin.
Figure 8.2 Intermediate Flood Bulletin No. 2 issued at 1100H, 27 September 2012.
With moderate to rapid increases in water levels at most of the monitoring stations at the upstream
sections of the basin were observed, an intermediate FB (FB no. 2) was issued unexpectedly at
1100H of September 27 (Figure 8.2). The issuance was immediately warranted inasmuch as WL per
monitored section at the upper basin had significantly increased during the last 4 hours. Middle
sections had also reacted with continuous slow to gradual WL increases.
All subsequent FBs afterwards were issued at 5am and 5pm covering the period from September 27
to October 04, inclusively for events “Pedring” and “Quiel” except for FB no. 9 (1100H of Sept. 30),
which was again an intermediate FB. The issuance was made to cover the expected passage of
“Quiel” close to the PRB.
Total flood information issued was 19 (1 FA and 18 FBs) for the two events with the final FB being
issued at 1600H of October 04 (Figure 8.3). Further, other than being forwarded directly to DRRM
offices at national level and within the basin, all issued flood information are uploaded at the
Pampanga River Basin Flood – Sept-Oct 2011
PRFFWC-hth-2012 24
center’s website and / or either e-mailed directly to various local DRRM entities, individuals, etc; also
shared in various social networks – “facebook” and “twitter”.
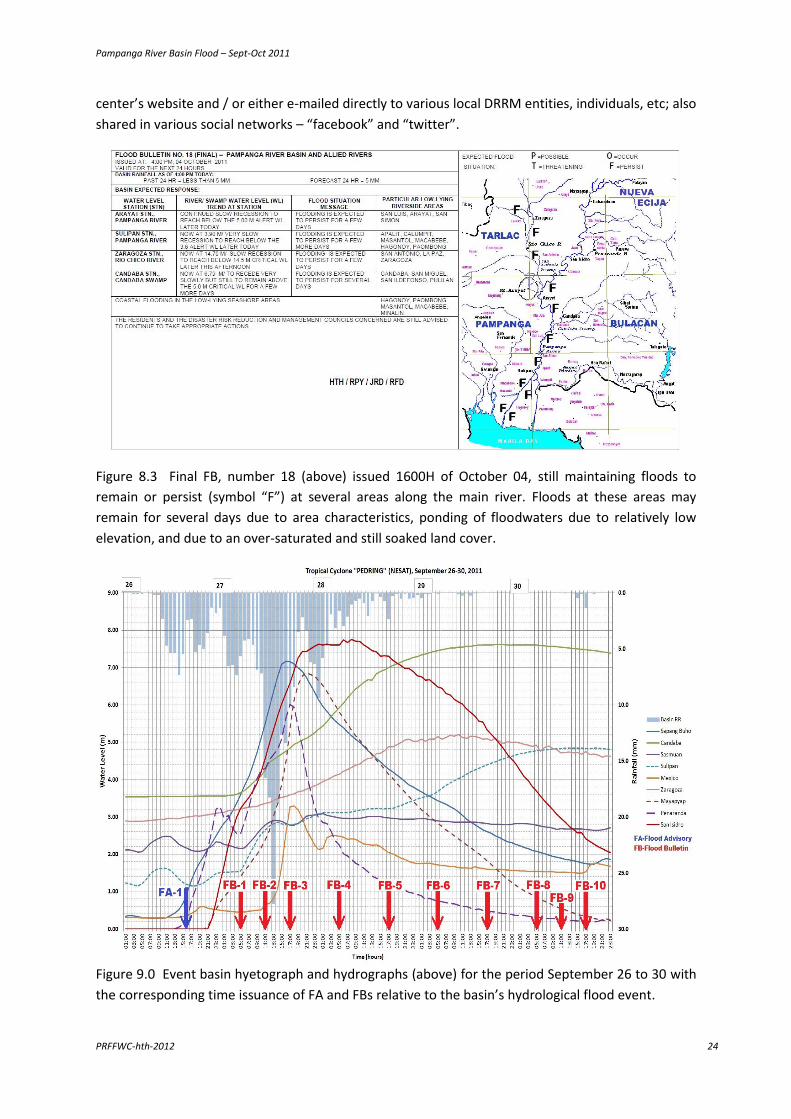
Figure 8.3 Final FB, number 18 (above) issued 1600H of October 04, still maintaining floods to
remain or persist (symbol “F”) at several areas along the main river. Floods at these areas may
remain for several days due to area characteristics, ponding of floodwaters due to relatively low
elevation, and due to an over-saturated and still soaked land cover.
Figure 9.0 Event basin hyetograph and hydrographs (above) for the period September 26 to 30 with
the corresponding time issuance of FA and FBs relative to the basin’s hydrological flood event.

Pampanga River Basin Flood – Sept-Oct 2011
PRFFWC-hth-2012 25
Figure 9.1 Event basin hyetograph and hydrographs (above) for the period October 01 to 04 with
the corresponding time issuance of FBs relative to the basin’s hydrological flood event.
10.0 Event Highlights (in Pictures)
Dried grasses left by floodwaters and still clinging to a lamp post (after more than two weeks since
the event) along the Nueva Ecija – Aurora Road (Palayan City to Bongabon) showing the flood
level of about a meter high attained at this highway stretch during the passage of T. “Pedring” on
September 26 to 27, 2011.

Pampanga River Basin Flood – Sept-Oct 2011
PRFFWC-hth-2012 26
(Above) Villa Luz subdivision area in Bgy.
Mabini, Cabanatuan City was more than a
meter flooded during ”Pedring”. (Right) The
water level gauge at Mayapyap station peaked
at 6.86 meters during the event.
Flood mark of about 45 cms. High left by
“Pedring” on a wooden cabinet inside the
PAGASA Cabanatuan synoptic station.
Flood debris mark, more than a meter high, left
on a wall somewhere along km. 101 along
Maharlika hi-way in San Leonardo, Nueva Ecija.
Zaida Lajom of Bgy. Gomez, Sta. Rosa (N.E.)
points to the flood mark, about 0.6 meter
high, inside her residence.
A meter high of flood debris along a barangay
road in Bgy. Lawang Cupang, San Antonio (N.E.)

Pampanga River Basin Flood – Sept-Oct 2011
PRFFWC-hth-2012 27
The old water level gauge at Sapang Buho WL
station (Palayan City, N.E.) still covered by flood
debris after “Pedring’s” flood event.
Cabiao flooway road at Bgy. San Vicente,
Cabiao (N.E.) during Pampanga River’s spill-over
at the area. The said road was not passable for
about 4-days during the event period.
MSWD office in the town of Jaen (N.E.) was
underwater by about 0.5 meters as pointed out
by Ms. Pablo, MSWDO, of the said town.
The barangay road and its surrounding area in
Barangay San Vicente, Jaen (N.E.) was flooded
for more than 4 days during “Pedring”.
Flood was more than a meter high at Bgy. San
Anton, San Leonardo (N.E.) as pointed out by
Ms. Perlita Tinio, a long-time resident of the
area.
Floodwaters reached 7.75 meters as per
telemetered data for San Isidro station. Dried
grasses are still clinging to the river gauge after
more than 2 weeks since peaking at that level.

Pampanga River Basin Flood – Sept-Oct 2011
PRFFWC-hth-2012 28
Maximum flood level of about 1 meter at Bgy.
San Roque in La Paz, Tarlac during the event.
A view of La Paz market area at the height of
flooding in the area due to “Pedring”.
The La Paz to Tarlac City road was impassable
to almost all types of vehicle between the
period Sept. 29 to 30.
La Paz to Zaragoza hi-way was likewise not
passable between the period Sept. 29 to 30 due
to overflowing of Rio Chico river.
Maximum flood level at Bgy. Candating in
Arayat (Pampanga) as pointed out by residents
in the area. Floodwaters started inundating the
area as early as noontime of Sept. 27.
A barangay official of Bgy. San Agustin in
Candaba (Pampanga) points to the maximum
flood level attained during event “Pedring”,
almost 3 meters high from road level.

Pampanga River Basin Flood – Sept-Oct 2011
PRFFWC-hth-2012 29
The old telemetering station along Rio Chico
River in Zaragoza (N.E.) with reference flood
level at the station.
Flood marks on the DPWH gauge (reading of
about 5.80m) at the Apalit Bridge’s pier (NLEX),
situated at the right bank of Pampanga River.
About a meter high of floodwaters overflowed
the left bank of Pampanga River in Bgy. San
Juan in Apalit going towards the viaduct area.
Flooding situation in Bgy. San Jose, San Simon
(Pampanga) at the height of the flood event
caused by “Pedring”.
The flooded San Luis Public Market (Poblacion)
area during the event. Maximum inundation
level reached 1.5 meters at some areas.
A resident of Bgy. Sta. Monica in San Luis
(Pampanga) points to the maximum flood
height (1.3 m from road level) in their area.

Pampanga River Basin Flood – Sept-Oct 2011
PRFFWC-hth-2012 30
Barangay Sta Cruz in San Luis (Pampanga) had
some areas inundated by more than 2 meters
of floodwaters .
Bgy. Sto. Tomas was one of the worst flood-
affected area in the town of San Luis
(Pampanga). Some areas in the barangay were
about 3 meters deep.
The town of Guagua in the Pasac-Guagua river
basin system was not spared during “Pedring”
as shown in the picture above.
Flooded portions of McArthur Hi-way in Bgy.
Sto. Cristo in the town of Guagua during
passage of “Pedring”.
Flood depths attained at Bgy. Bardias in San
Miguel (Bulacan). Flooding in the area was
mainly a result of the breaching of Bulu Dam.
Likewise, Bgy. King Kabayo in the town of San
Miguel (Bulacan) was inundated as a result of
the breaching of Bulu Dam.
Pampanga River Basin Flood – Sept-Oct 2011
PRFFWC-hth-2012 31
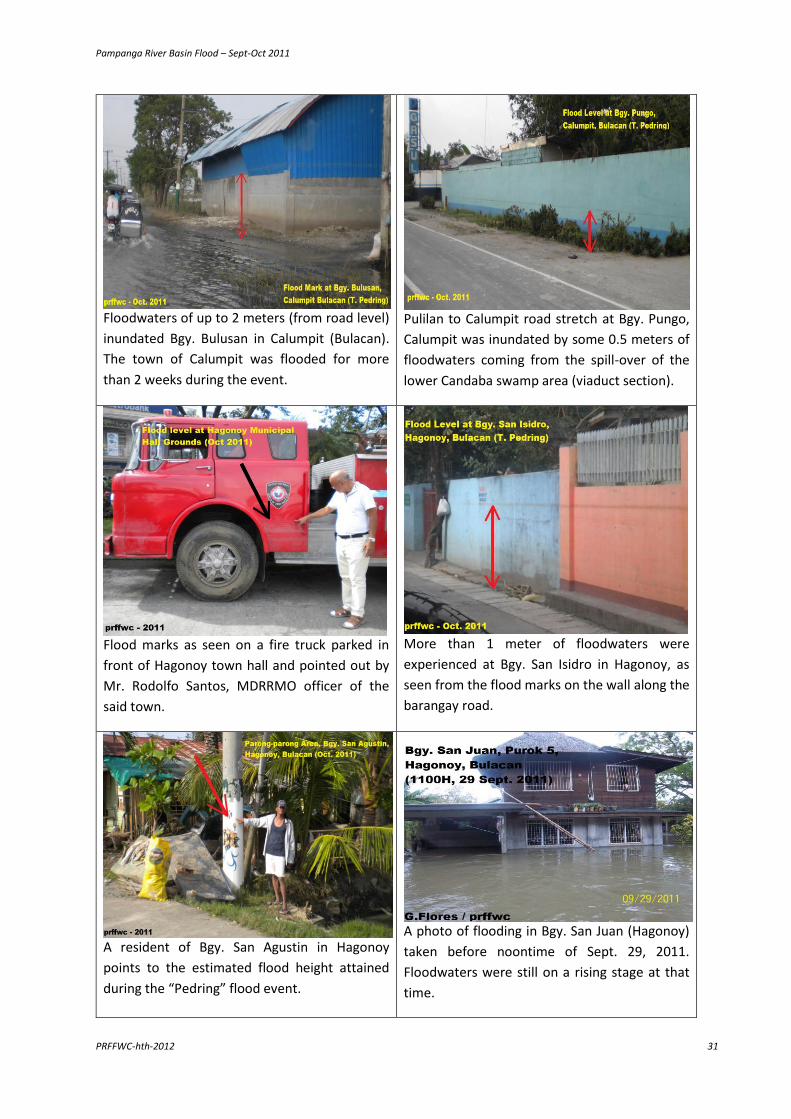
Floodwaters of up to 2 meters (from road level)
inundated Bgy. Bulusan in Calumpit (Bulacan).
The town of Calumpit was flooded for more
than 2 weeks during the event.
Pulilan to Calumpit road stretch at Bgy. Pungo,
Calumpit was inundated by some 0.5 meters of
floodwaters coming from the spill-over of the
lower Candaba swamp area (viaduct section).
Flood marks as seen on a fire truck parked in
front of Hagonoy town hall and pointed out by
Mr. Rodolfo Santos, MDRRMO officer of the
said town.
More than 1 meter of floodwaters were
experienced at Bgy. San Isidro in Hagonoy, as
seen from the flood marks on the wall along the
barangay road.
A resident of Bgy. San Agustin in Hagonoy
points to the estimated flood height attained
during the “Pedring” flood event.
A photo of flooding in Bgy. San Juan (Hagonoy)
taken before noontime of Sept. 29, 2011.
Floodwaters were still on a rising stage at that
time.

Pampanga River Basin Flood – Sept-Oct 2011
PRFFWC-hth-2012 32
(Above) An aerial view of the Calumpit District Hospital (in the middle) isolated with floodwaters
during the “Pedring” flood event. The aerial view also shows the extent of the flooding in the
background, which is the lower Candaba swamp area. (Below) A rooftop view of the Hagonoy
town plaza still inundated from the floodwaters brough about by Typhoon “Pedring”.
Pampanga River Basin Flood – Sept-Oct 2011
PRFFWC-hth-2012 33
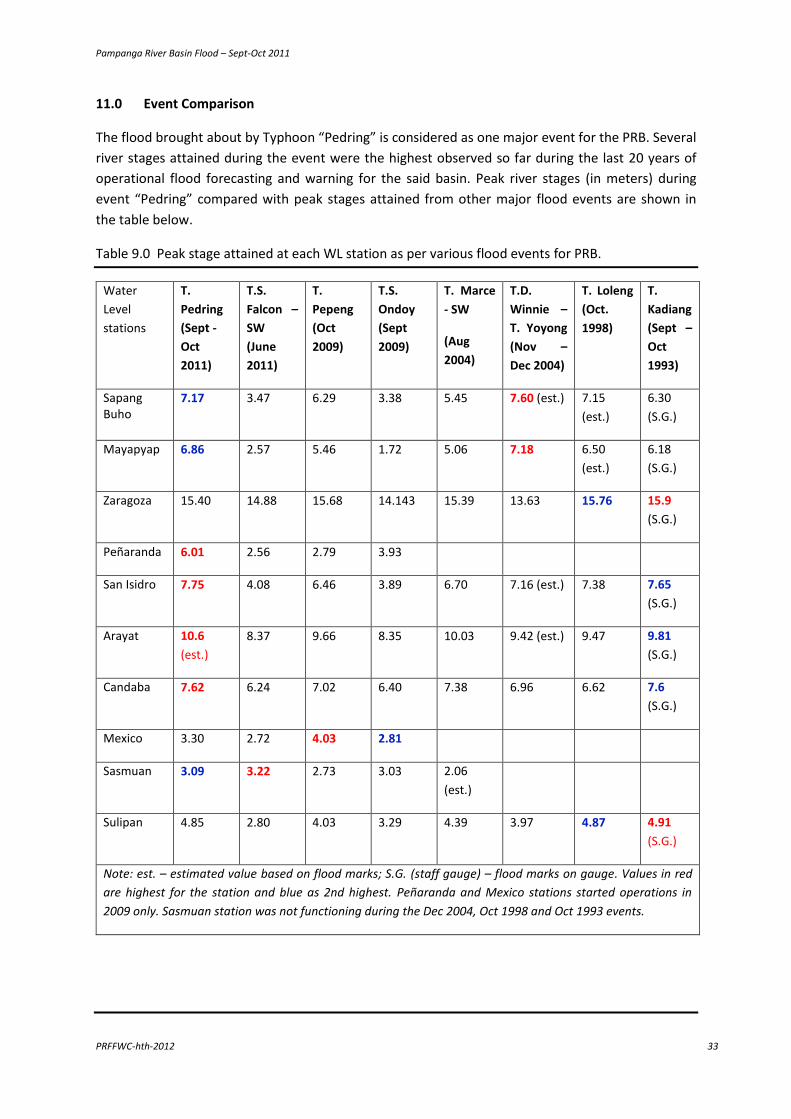
11.0 Event Comparison
The flood brought about by Typhoon “Pedring” is considered as one major event for the PRB. Several
river stages attained during the event were the highest observed so far during the last 20 years of
operational flood forecasting and warning for the said basin. Peak river stages (in meters) during
event “Pedring” compared with peak stages attained from other major flood events are shown in
the table below.
Table 9.0 Peak stage attained at each WL station as per various flood events for PRB.
Water
Level
stations
T.
Pedring
(Sept -
Oct
2011)
T.S.
Falcon –
SW
(June
2011)
T.
Pepeng
(Oct
2009)
T.S.
Ondoy
(Sept
2009)
T. Marce
- SW
(Aug
2004)
T.D.
Winnie –
T. Yoyong
(Nov –
Dec 2004)
T. Loleng
(Oct.
1998)
T.
Kadiang
(Sept –
Oct
1993)
Sapang Buho
7.17 3.47 6.29 3.38 5.45 7.60 (est.) 7.15
(est.)
6.30
(S.G.)
Mayapyap 6.86 2.57 5.46 1.72 5.06 7.18 6.50
(est.)
6.18
(S.G.)
Zaragoza 15.40 14.88 15.68 14.143 15.39 13.63 15.76 15.9
(S.G.)
Peñaranda 6.01 2.56 2.79 3.93
San Isidro 7.75 4.08 6.46 3.89 6.70 7.16 (est.) 7.38 7.65
(S.G.)
Arayat 10.6
(est.)
8.37 9.66 8.35 10.03 9.42 (est.) 9.47 9.81
(S.G.)
Candaba 7.62 6.24 7.02 6.40 7.38 6.96 6.62 7.6
(S.G.)
Mexico 3.30 2.72 4.03 2.81
Sasmuan 3.09 3.22 2.73 3.03 2.06
(est.)
Sulipan 4.85 2.80 4.03 3.29 4.39 3.97 4.87 4.91
(S.G.)
Note: est. – estimated value based on flood marks; S.G. (staff gauge) – flood marks on gauge. Values in red
are highest for the station and blue as 2nd highest. Peñaranda and Mexico stations started operations in
2009 only. Sasmuan station was not functioning during the Dec 2004, Oct 1998 and Oct 1993 events.

Pampanga River Basin Flood – Sept-Oct 2011
PRFFWC-hth-2012 34
References:
Reports:
PRFFWC Post-Flood Report 2011-1: Enhanced Southwest Monsoon due to Tropical Storm “Falcon”
(Meari), (June 24 to 27, 2011); PRFFWC, PAGASA, DOST. 2011
PRFFWC Post-Flood Report 2009-1 (Nov. 30, 2009) Pampanga River Basin Flood Events: Tropical
Storm “Ondoy”, Sept. 25 to 27, 2009; and Typhoon “Pepeng”, October 6 to 15, 2009; PRFFWC, HMD,
PAGASA, DOST. November 2009
PRFFWC Post-Flood Report. Pampanga River Basin: Flood of August 2004 (Southwest Monsoon as
enhanced by Typhoon Marce). PRFFWC, PAGASA. October 2004
Post-Flood Investigation Report: Pampanga River Basin Floods due to Tropical Depression Winnie
and Typhoon Yoyong (November 28 to December 04, 2004), PRFFWC, PAGASA. February 2005
Resource Entities:
1. National Disaster Risk Reduction & Management Council (www.ndrrmc.gov.ph)
2. Office of Civil Defense Reg. 3 / Regional Disaster Risk Reduction & Management Council 3
3. Pampanga Provincial Disaster Risk Reduction & Management Office
4. Bulacan Provincial Disaster Risk Reduction & Management Office
5. Nueva Ecija Provincial Disaster Risk Reduction & Management Office
6. Tarlac Provincial Disaster Risk Reduction & Management Office
7. Guagua Municipal Disaster Risk Reduction & Management Office
8. San Luis Municipal Disaster Risk Reduction & Management Office
9. Hagonoy Municipal Disaster Risk Reduction & Management Office
10. Flood Forecasting & Warning Section (FFWS), HMD, PAGASA
Resource Persons:
1. Henry Cajucom, MPDO, Bongabon, N.E.
2. Engr. Jonathan M. Liwag, Municipal Engineer, Laur, N.E.
3. Romeo Basco, Bgy. Captain of Bgy. Concepcion, Cabiao, N.E.
4. Zaida Lajom, resident of Bgy. Gomez, Sta. Rosa, N.E.
5. Perlita Tinio, resident of Bgy. San Anton, San Leonardo, N.E.
6. Andy Macapagal, resident of Bgy. San Vicente, Cabiao, N.E.
7. Ruben C. Espejo, Municipal Administrator, Sta. Rosa, N.E.
8. “Duds” Romero, CDRRMO-Palayan City
9. Engr. Josephine Legaspi, PDRRMO officer, PDRRMO-N.E.
10. Paperlyn U. Pablo, MSWDO, Jaen, N.E.
11. Billy Sicam, resident of Bgy. San Roque, La Paz, Tarlac
12. Engr. Marito G. Nicolas, Municipal Engineer, La Paz, Tarlac
13. Nemensio T. Benoza, MPDO, Macabebe, Pampanga
14. Engr. Allan Odchigue, MPDO/MDAO, Municipality of Apalit, Pampanga
15. Cesar Jornadal, resident of Bgy. San Mateo, Arayat, Pampanga
16. Benny Trinidad, resident of Bgy. Candating, Arayat, Pampanga

Pampanga River Basin Flood – Sept-Oct 2011
PRFFWC-hth-2012 35
17. Elueterio Sagum, Barangay Official of Bgy. San Agustin, Candaba, Pampanga
18. Lenny Manalo, Municipal Employee of Candaba, Pampanga
19. Thelma Macapagal, Bgy. Captain of Bgy. Paralaya, Candaba, Pampanga
20. Antonio Gamboa, resident of Bgy. Sta. Monica, San Luis, Pampanga
21. Venancio “Asiong” S. Macapagal, Mayor of San Luis, Pampanga
22. Louie V. Rodriguez, MDAO, San Rafael, Bulacan
23. Bryan Cyro Velasco, PDRRMO-Bulacan
24. Raul Agustin, PDRRMO-Bulacan
25. Lambert Sylvestre, PDRRMO-Bulacan
26. Liz L. Mungcal, Executive Officer, PDRRMO-Bulacan
27. Rodolfo Santos, MDAO, Hagonoy, Bulacan
28. Michael Paguia, Municipal Employee, San Miguel, Bulacan
29. Rosalinda Dijon, resident of Bgy. Lambakin, San Miguel, Bulacan
30. Gloria Flores, resident of Purok 6, Bgy. San Juan, Hagonoy, Bulacan
31. Jojo Tomas, Municipal Administrator, Calumpit, Bulacan
32. Liway Rivera, Weather Observer, Cabanatuan Synoptic station
33. Bong Masagca, Executive Director, PDRN
34. Ann Ria Barreira, PDRN
35. Thutz Santiago, Employee, NEDA Region 3
36. Lerry Hernandez, Employee, DILG Region 3
37. Leonida Santos, PAGASA employee, Sto. Rosario, Paombong
38. Russell Rigor, Principal Hydrologist, Angat Dam FFWSDO, NPC