txdot word template - welcome to the texas department of
TRANSCRIPT
TEXAS DEPARTMENT OF TRANSPORTATION
PLANNED
PROJECTS
RIDER 14J
FY 2013

20
1
1
1
This report was produced to fulfill the requirements of the Rider 14(l) to TxDOT’s appropriation. It
identifies the projects the department expects to go to letting in FY 2014. Along with the project
list, the following icons are used to provide a high-level overview of the benefits of each project:
Improves
Safety
Improves
Connectivity
Expands
Economic
Opportunity*
Improves
Pavement
Quality
Low Impact
Medium Impact
High Impact
In accourdance with the rider, this report also contains two additional pieces of information:
1. A district-by-district analysis of pavement score targets and how proposed maintenance
spending will impact pavement scores in each district, and
2. A detailed acount fo the level of traffic congestion reduced by each proposed project, in
districts that contain one of the 50 most-congested roads.
A statewide summary table of percent of lane miles of pavement in good or better condition, along
with projections based on proposed spending levels, cand be found on page!. These projections
were produced by the Center for Transportation Research at the University of Texas at Austin as
part of TxDOT’s Four-Year Pavement Plan.
The Texas Transprotation Institute provided the analysis of the level of traffic congestion reduced by
each of the proposed projects in one of the districts with a “top-50” congested roadway. Project-
specific information is detailed in the project lists. Statewide, the proposed projects are estimated
to reduce over 800,000 hours of delay each year.
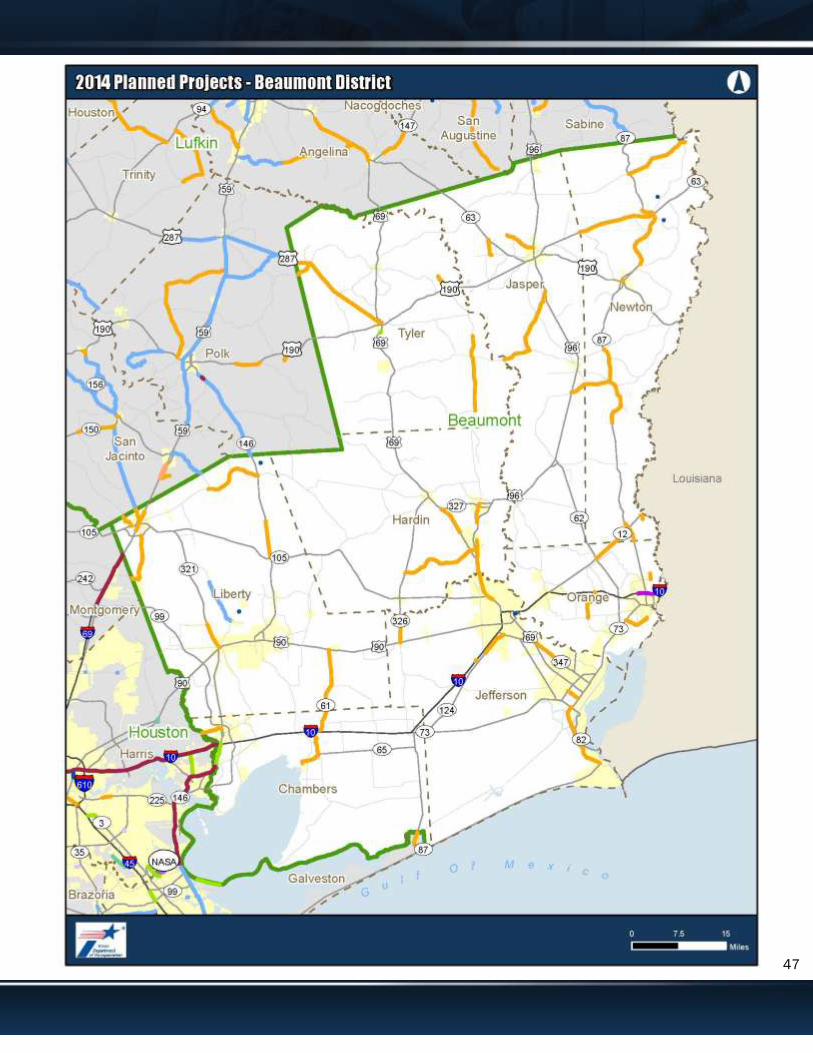
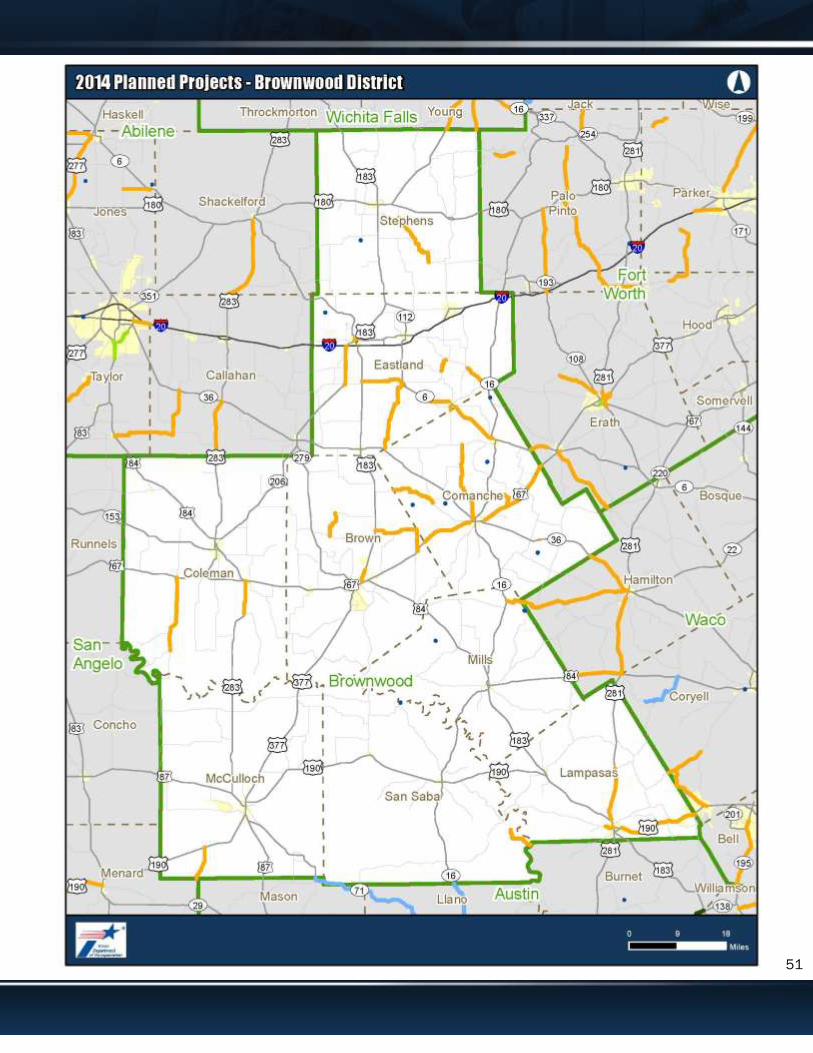
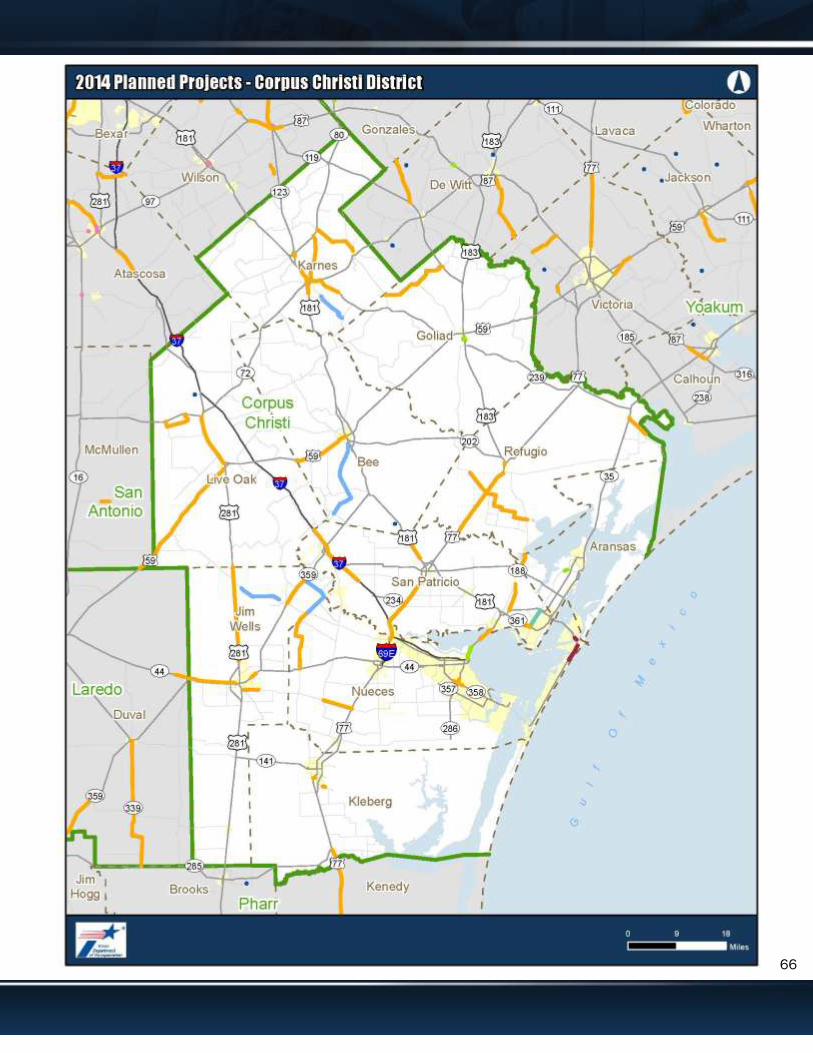
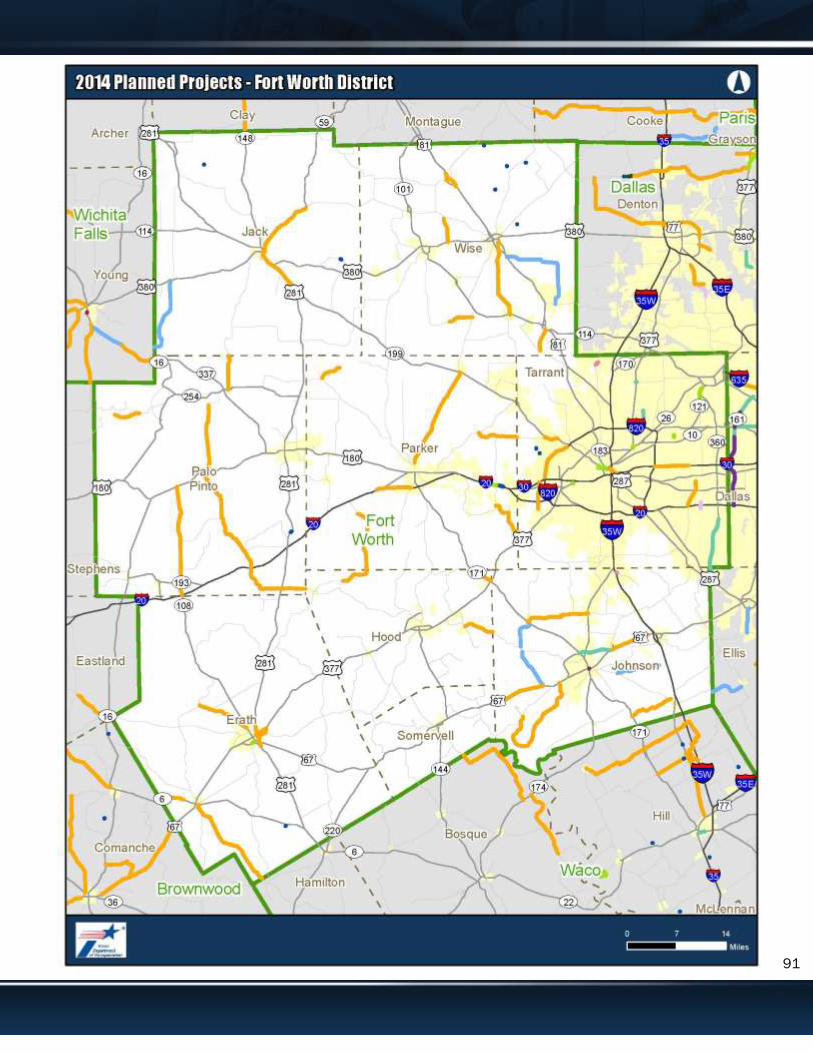
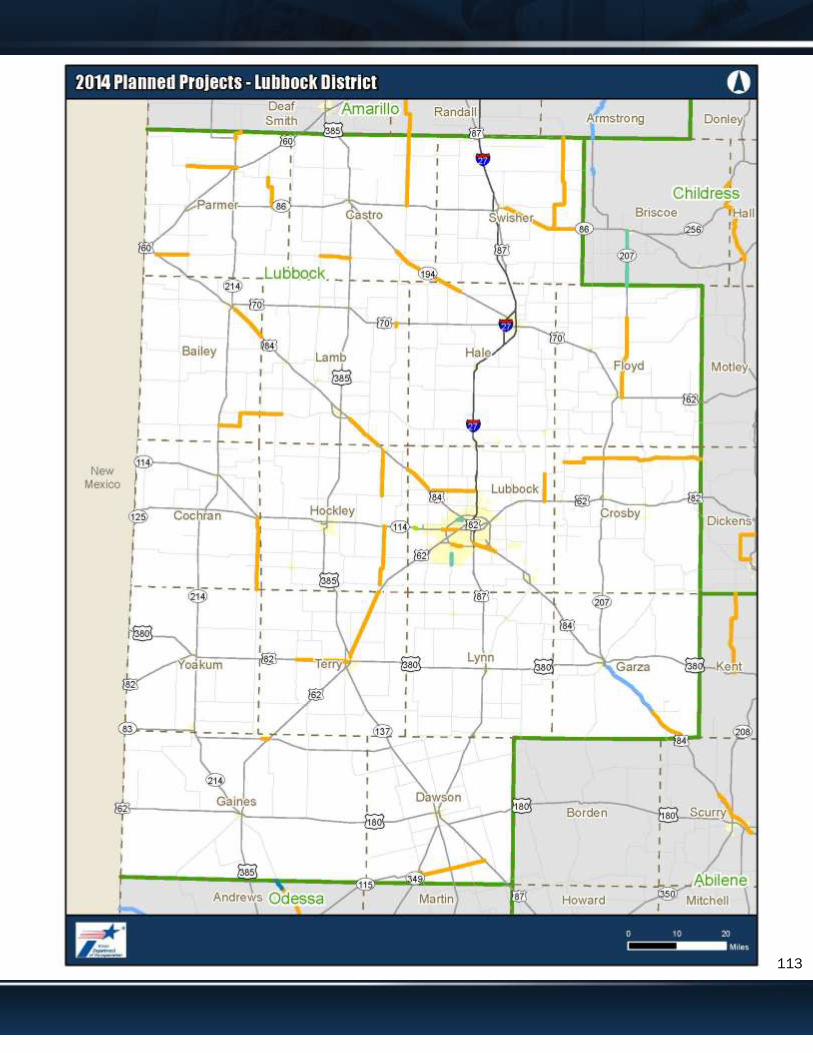
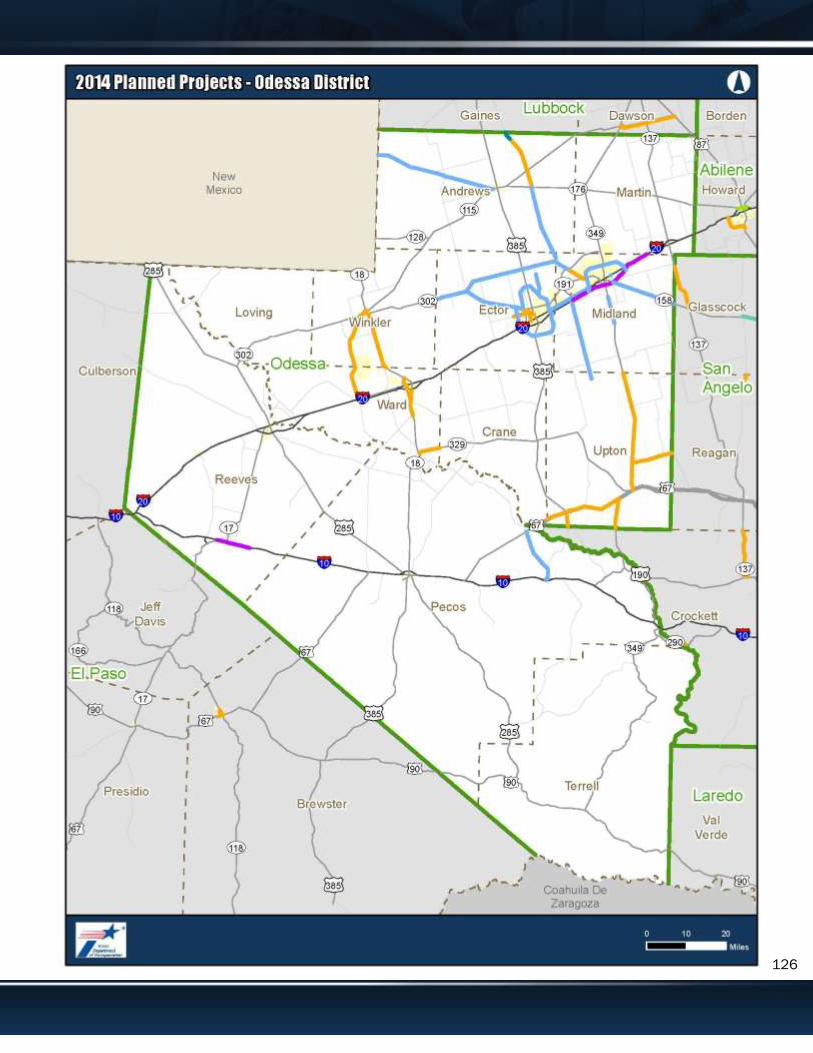
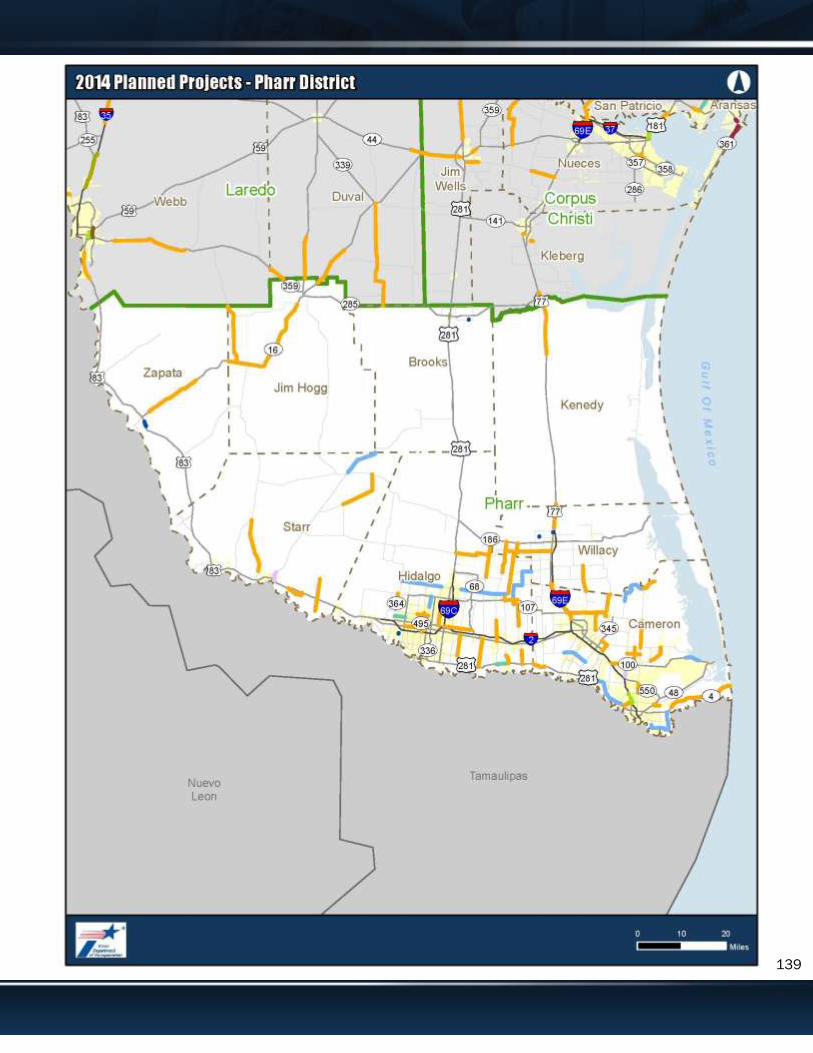
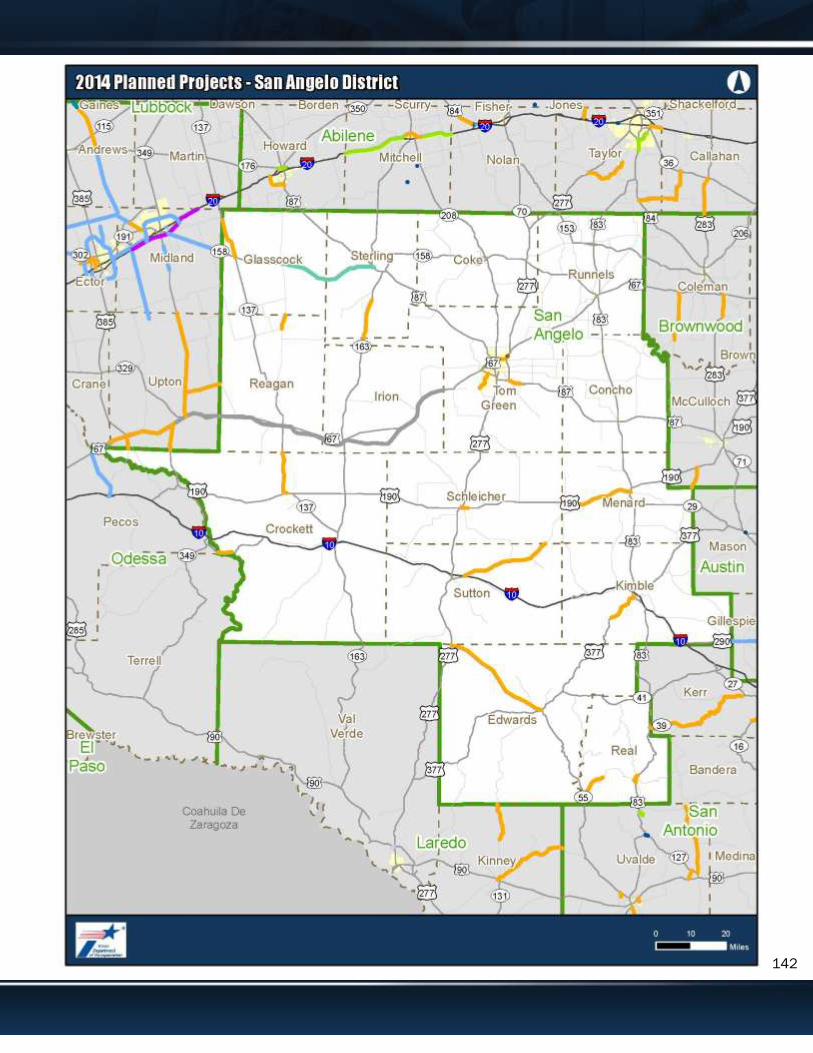
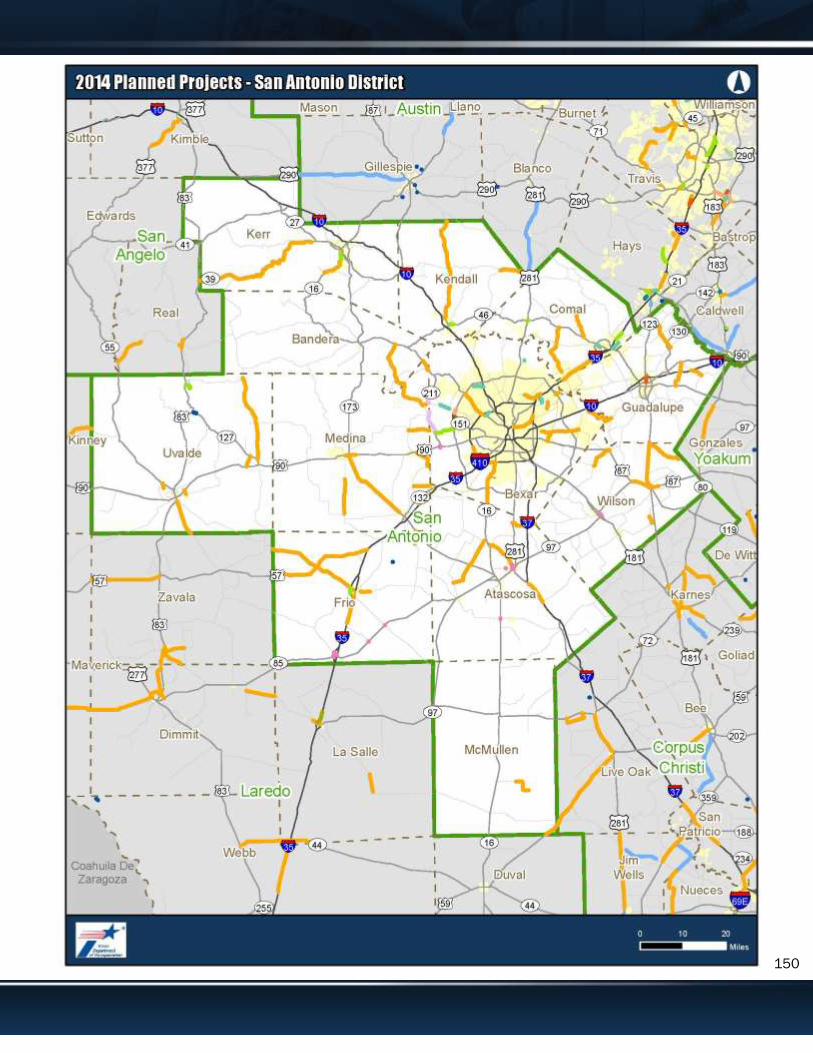
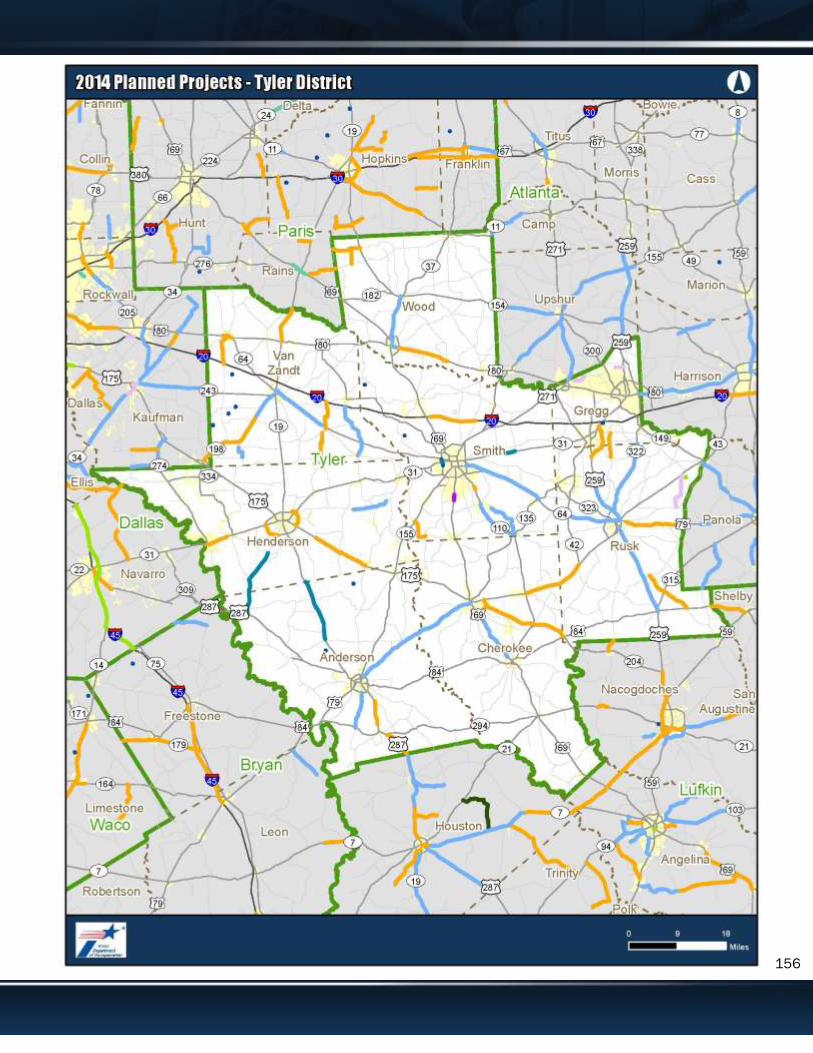
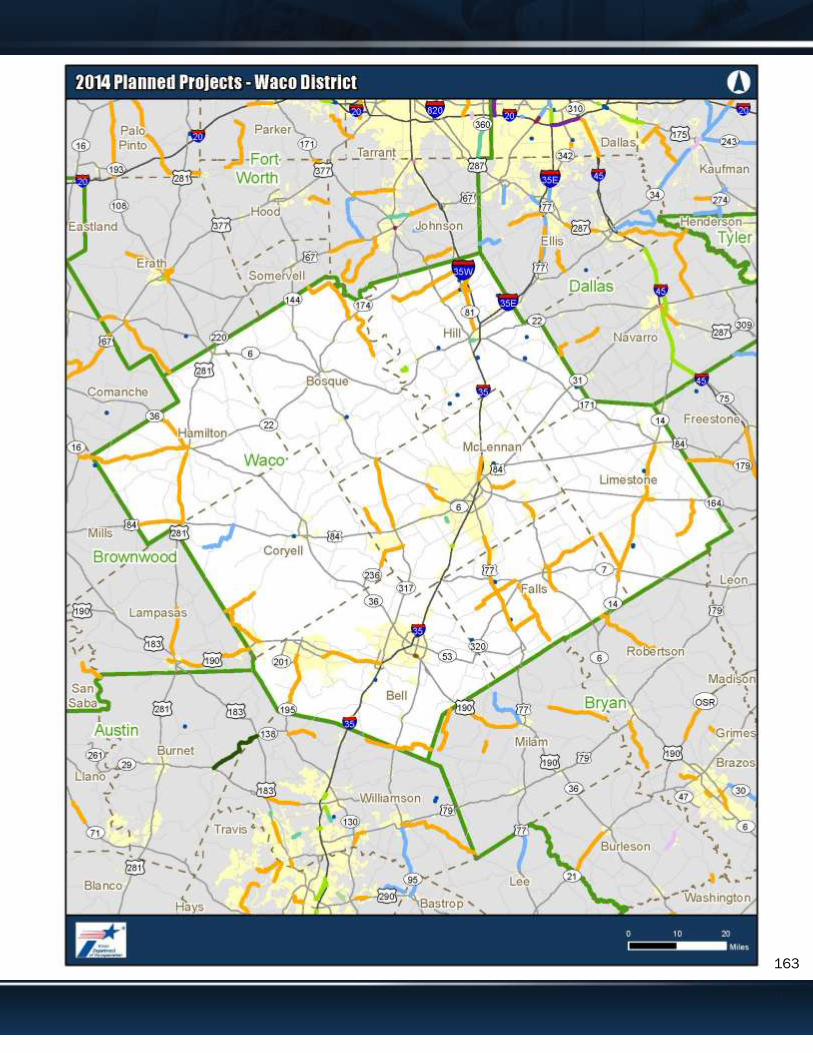
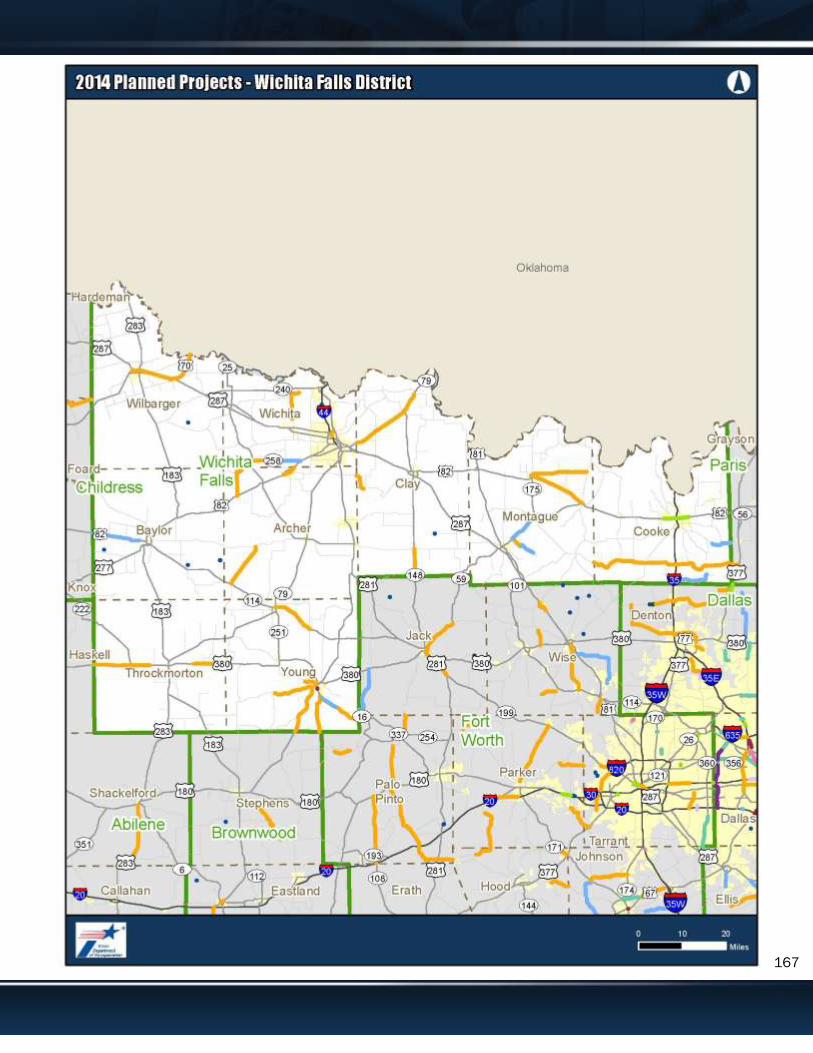
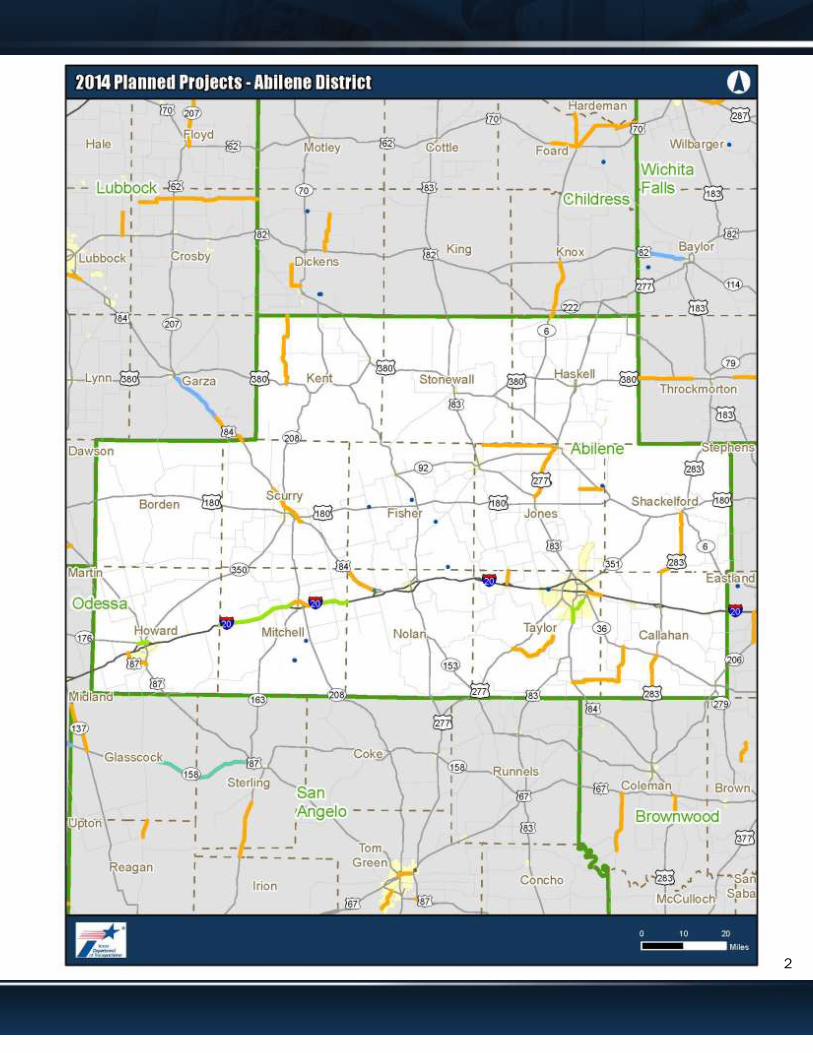
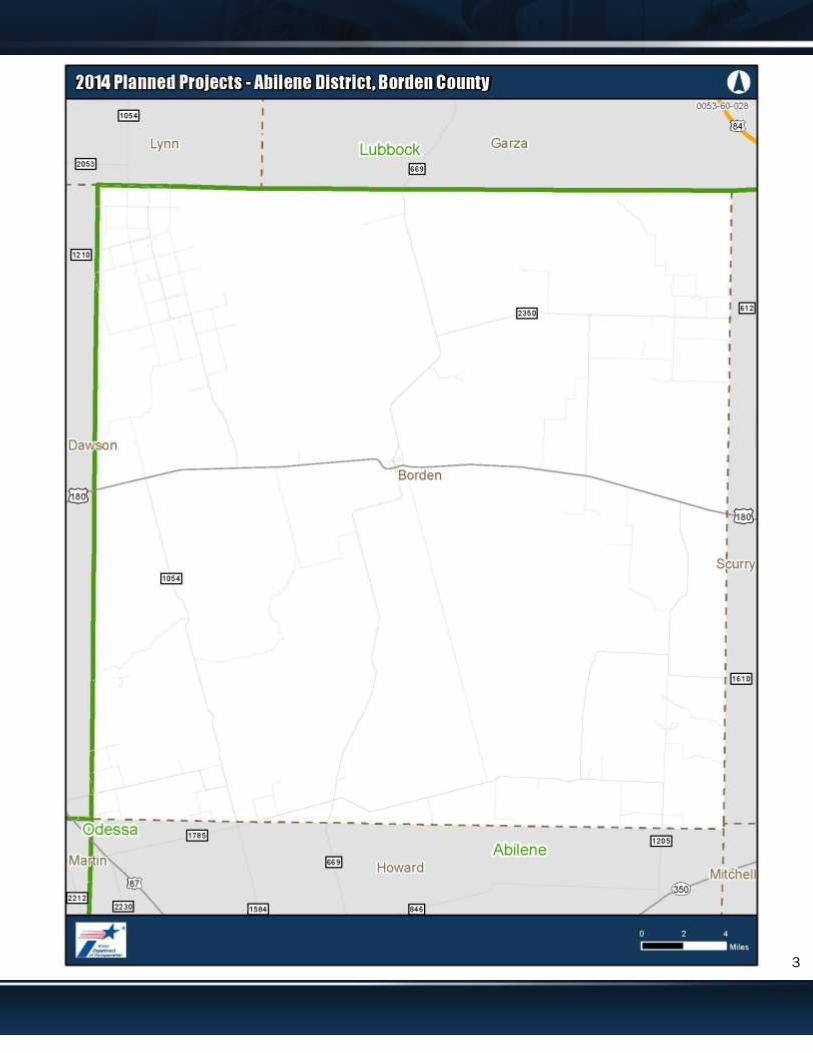
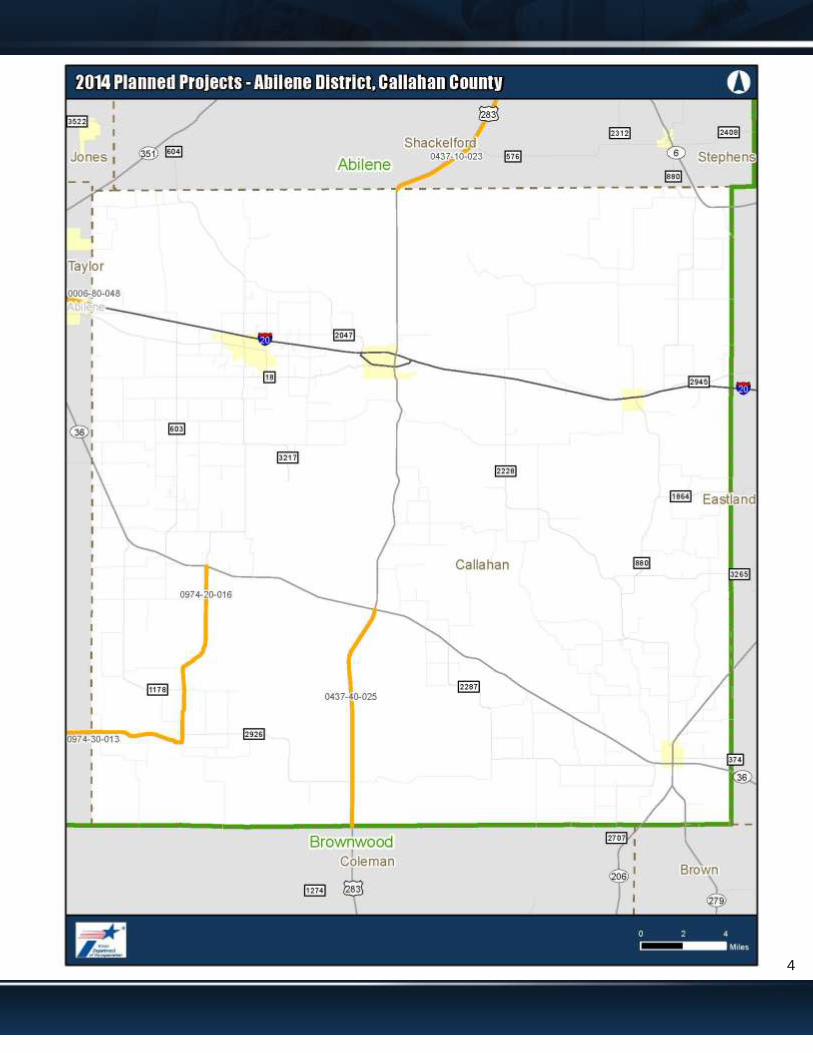
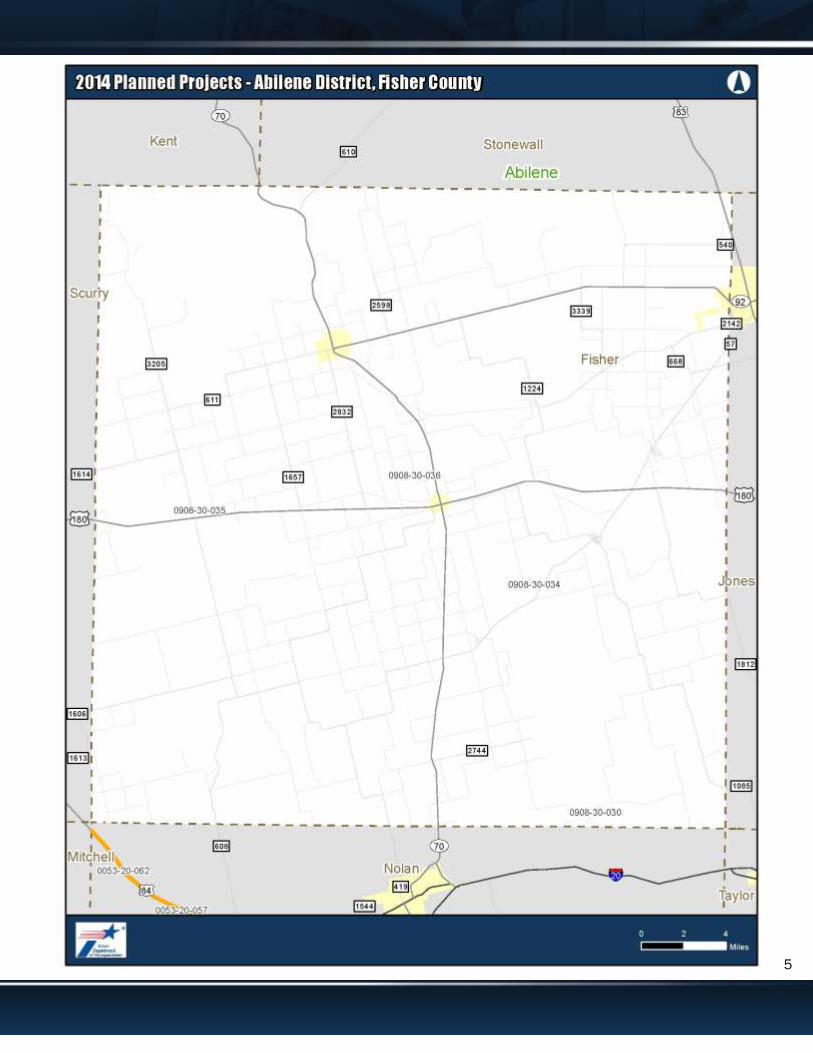
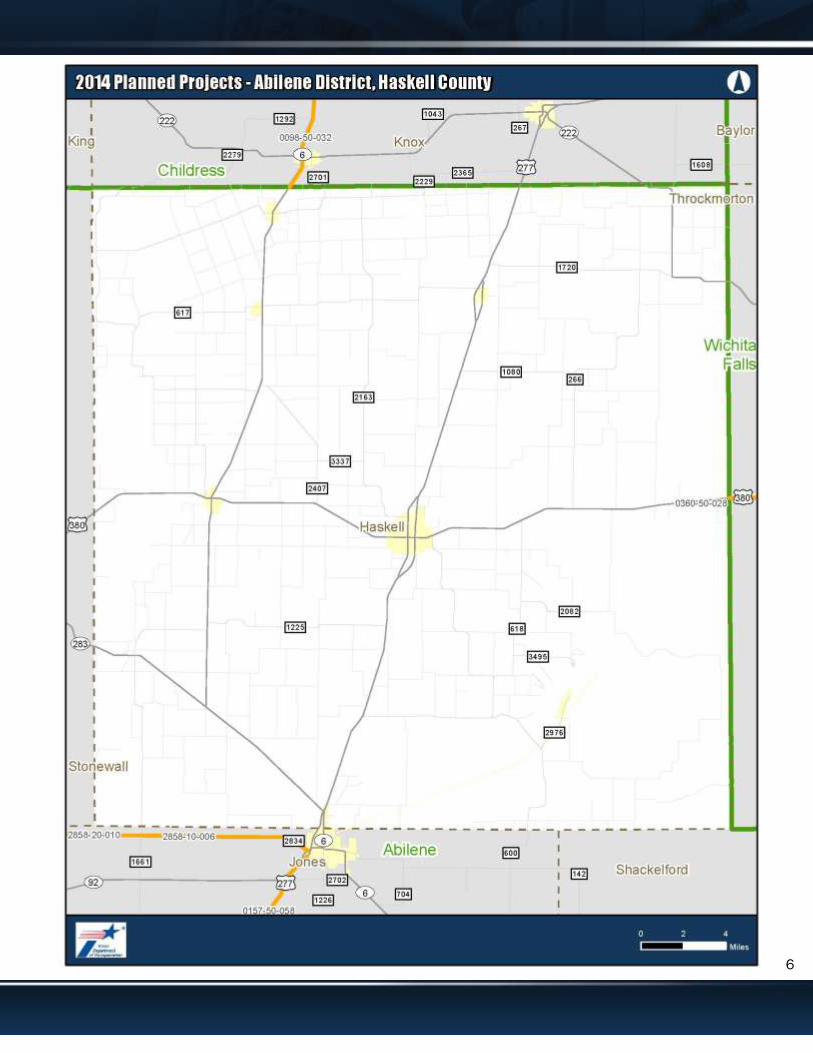
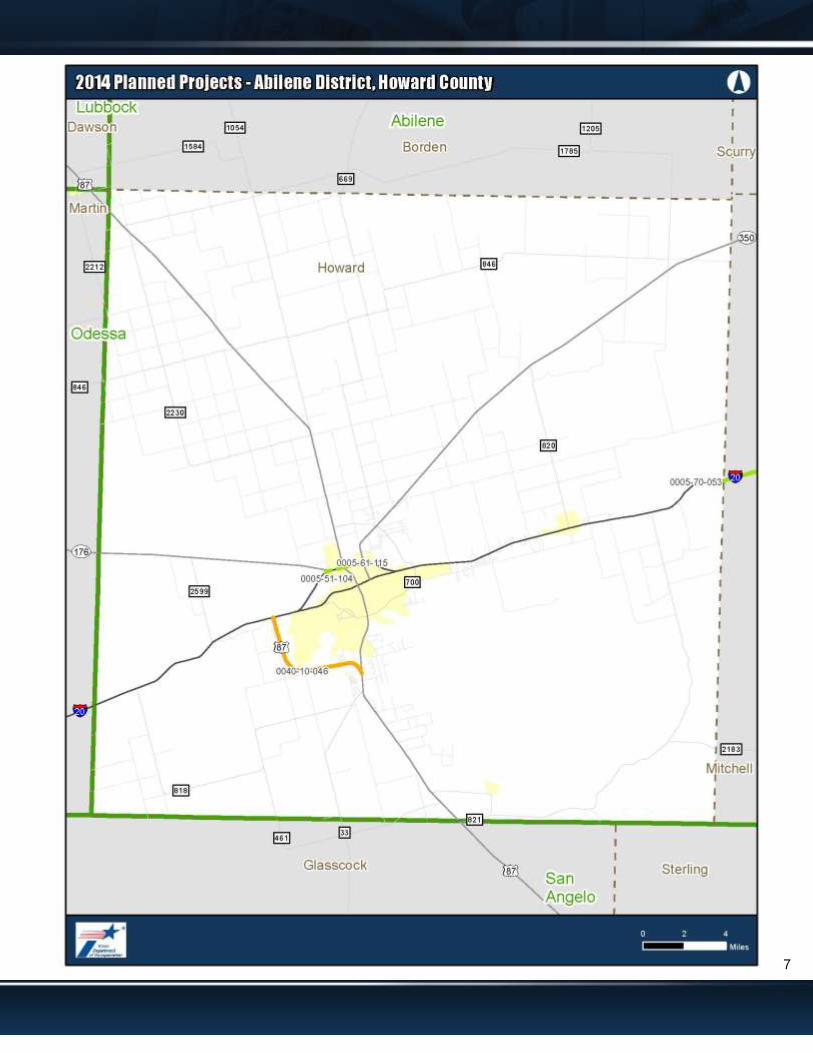
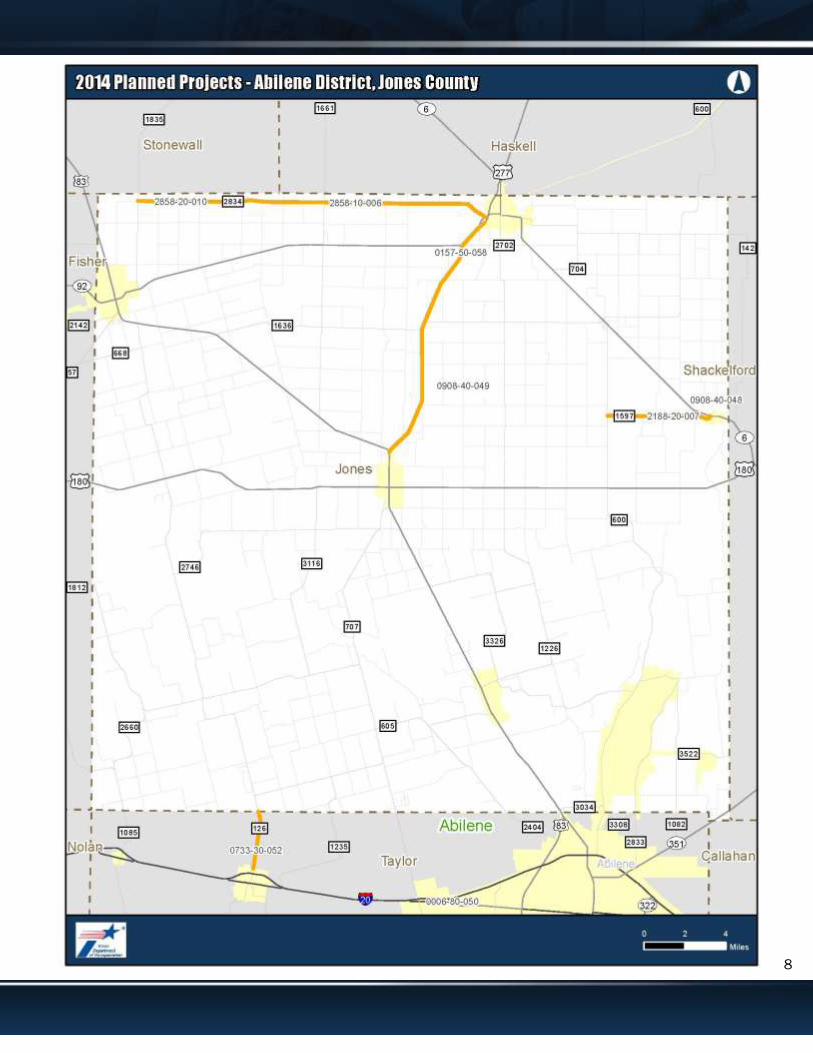
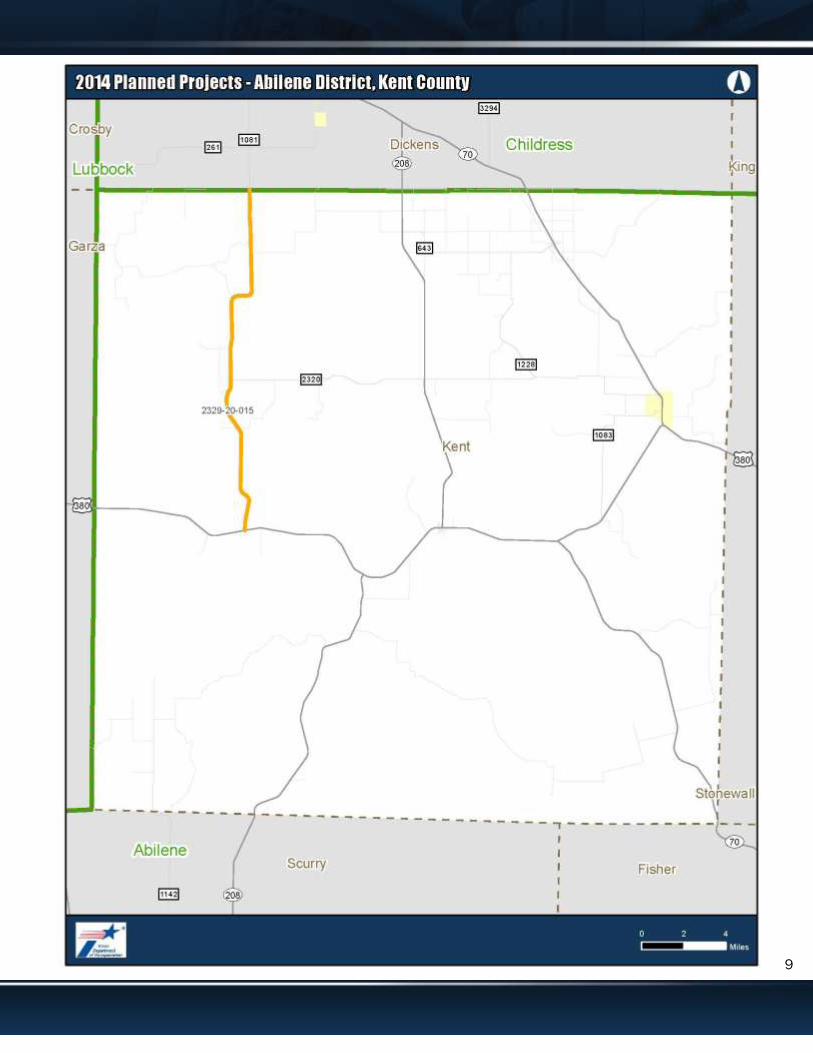
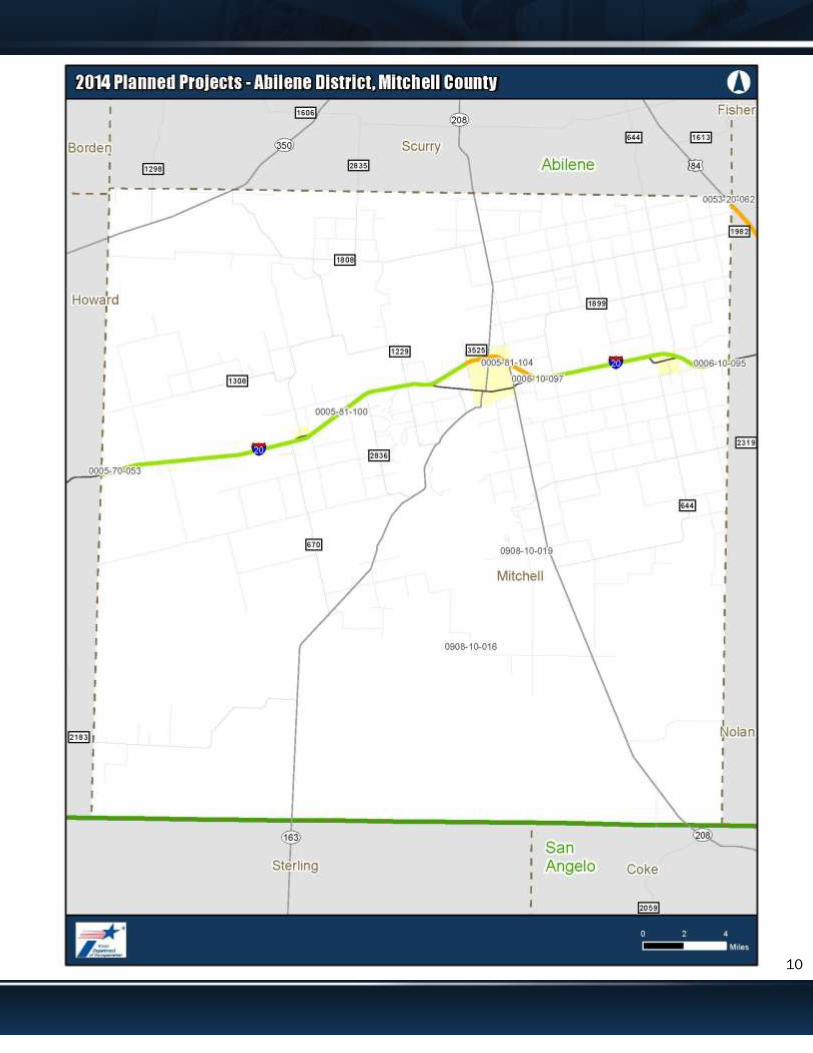
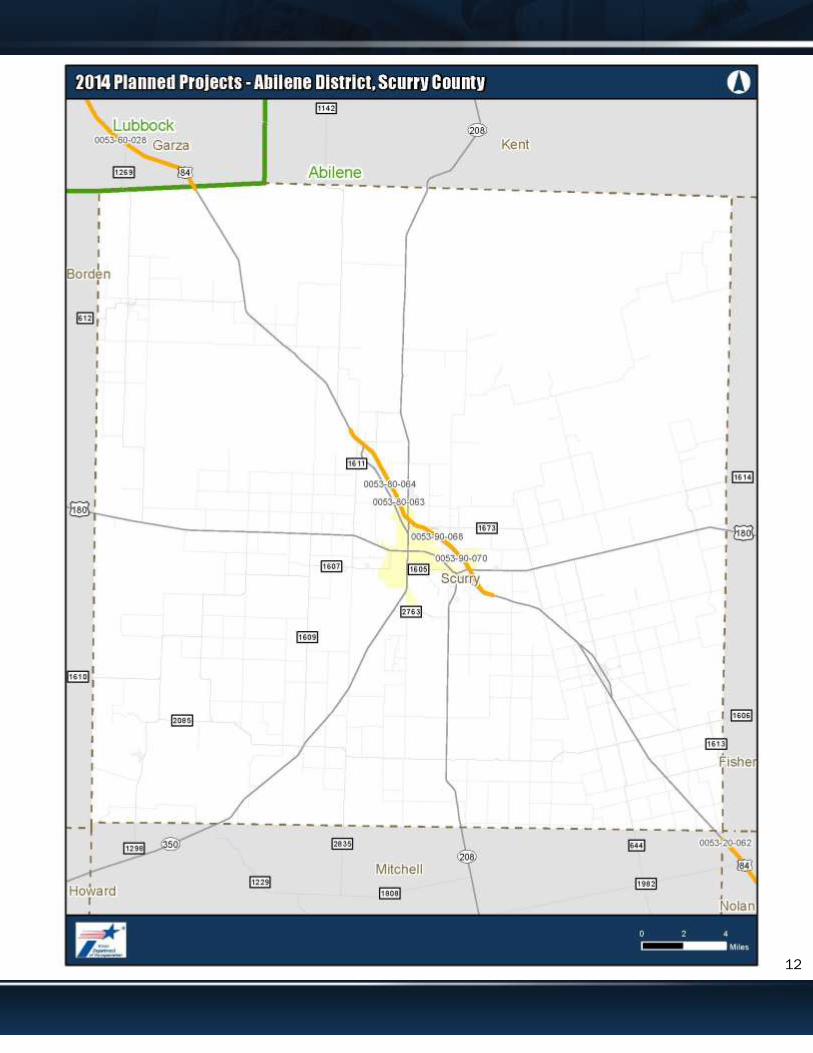
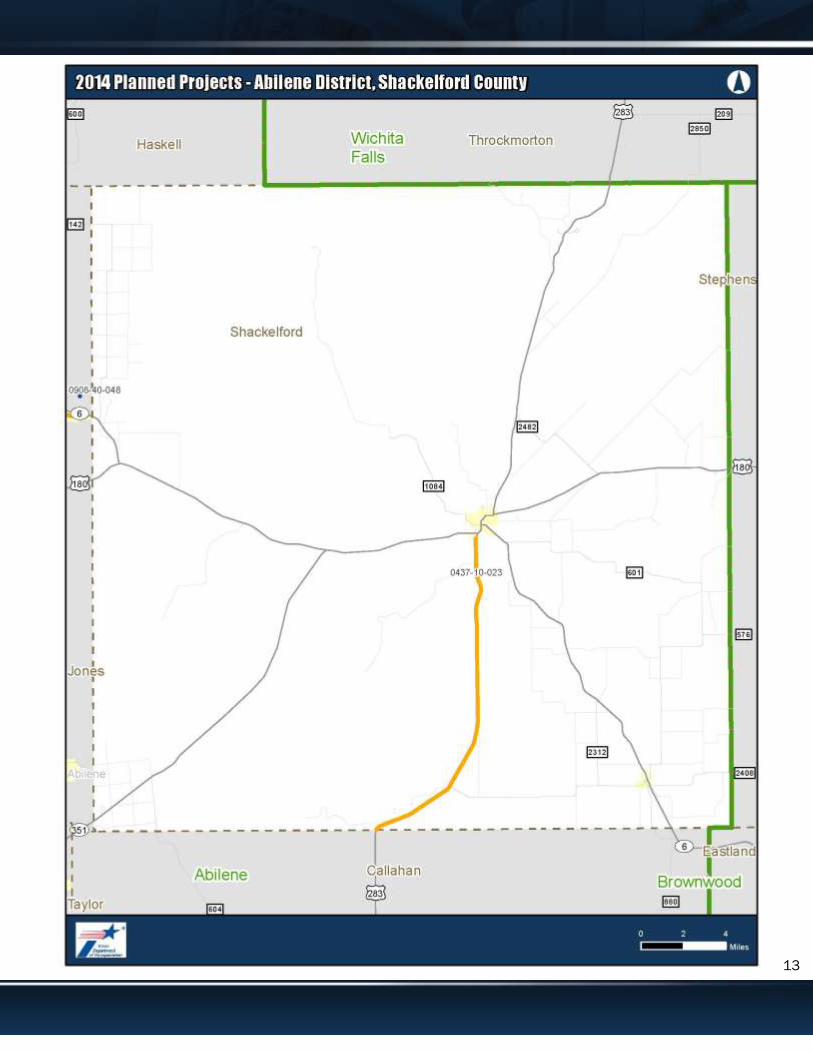
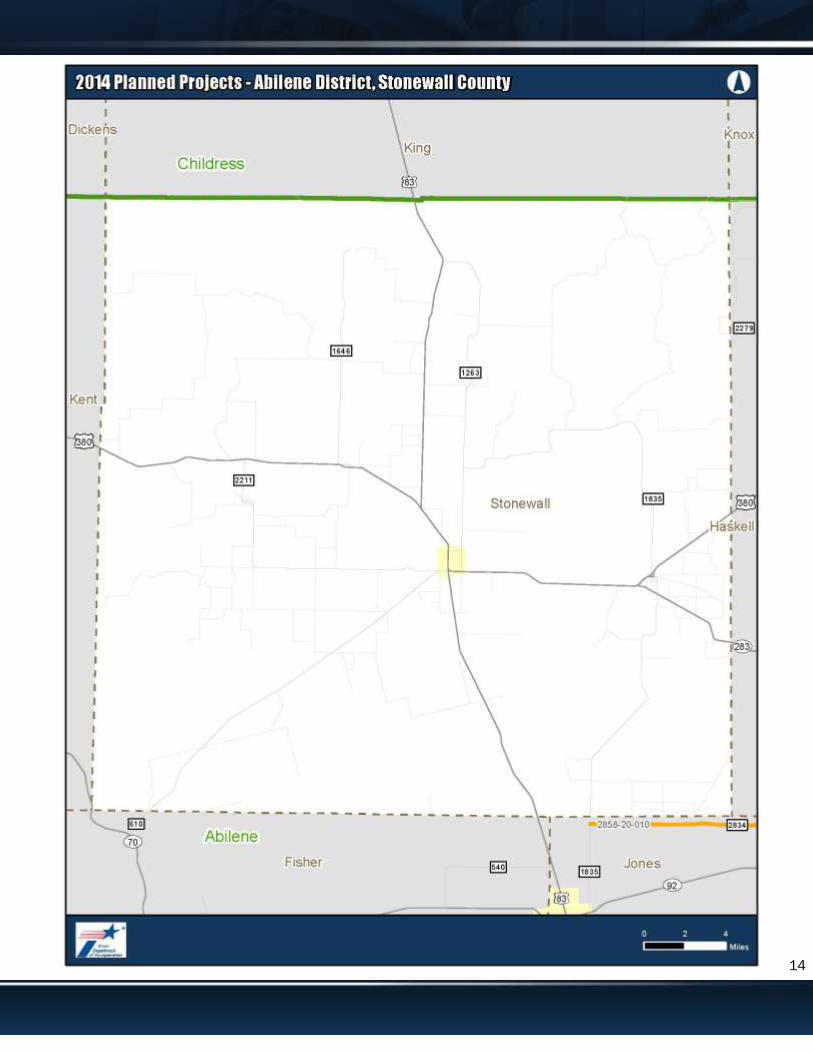
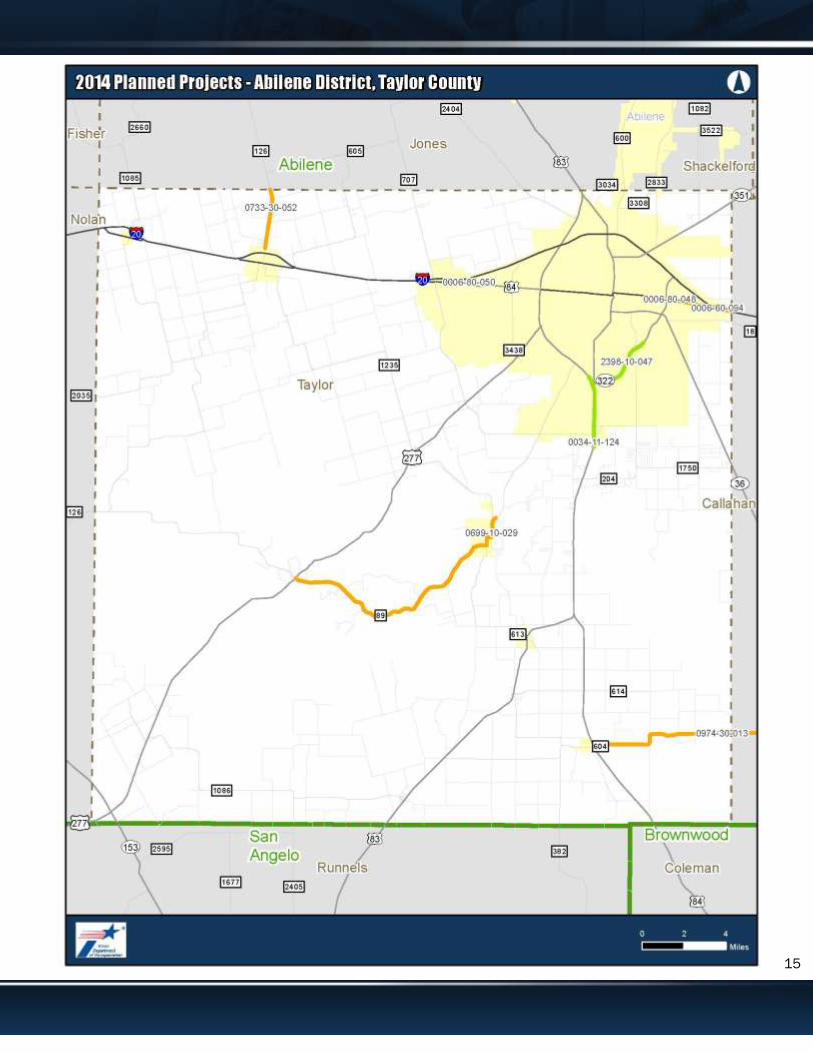
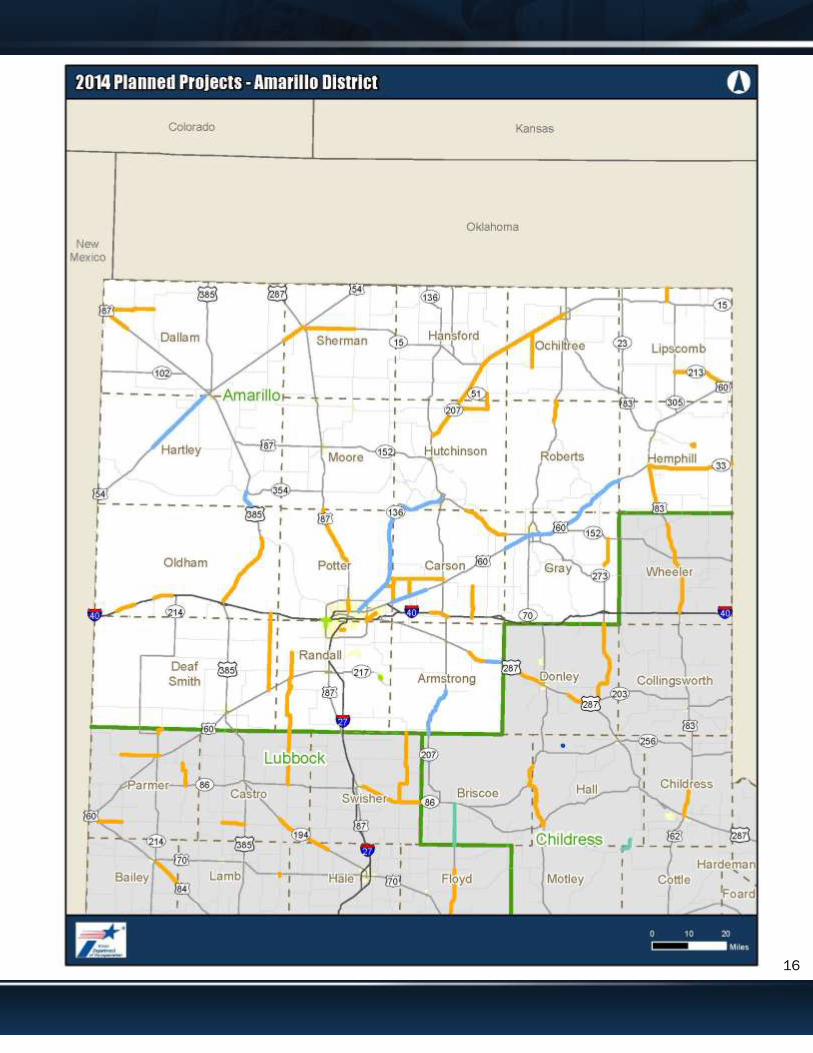
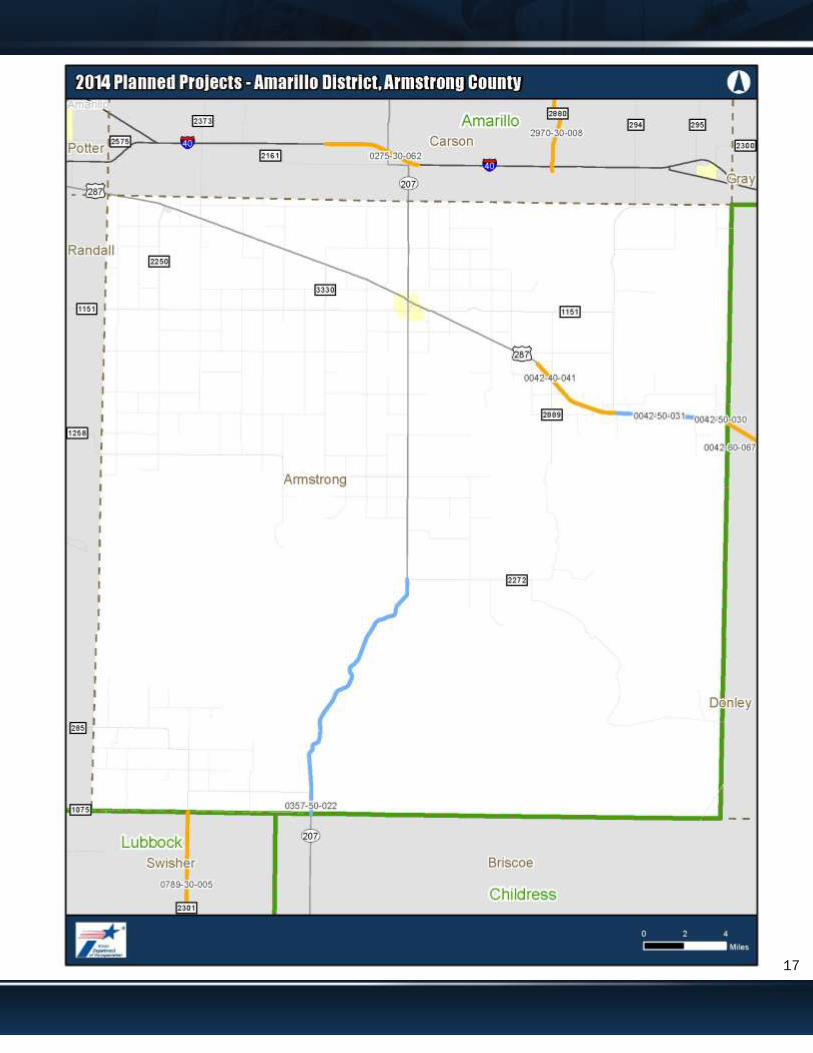
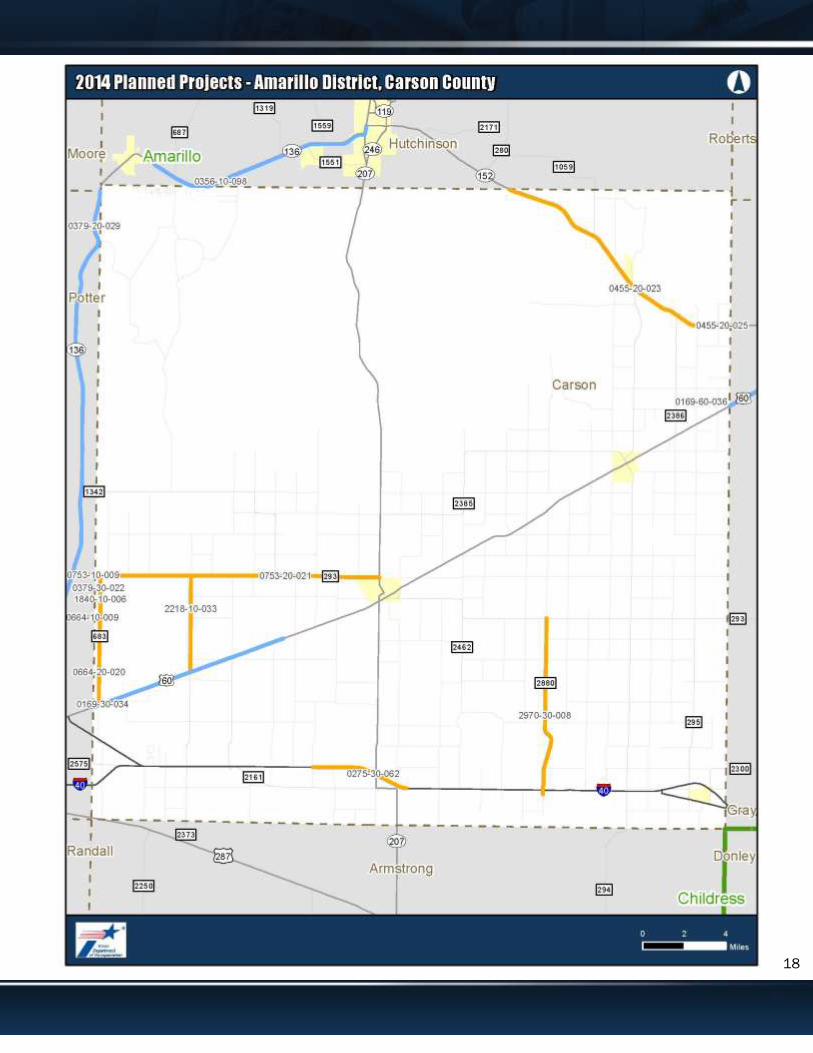
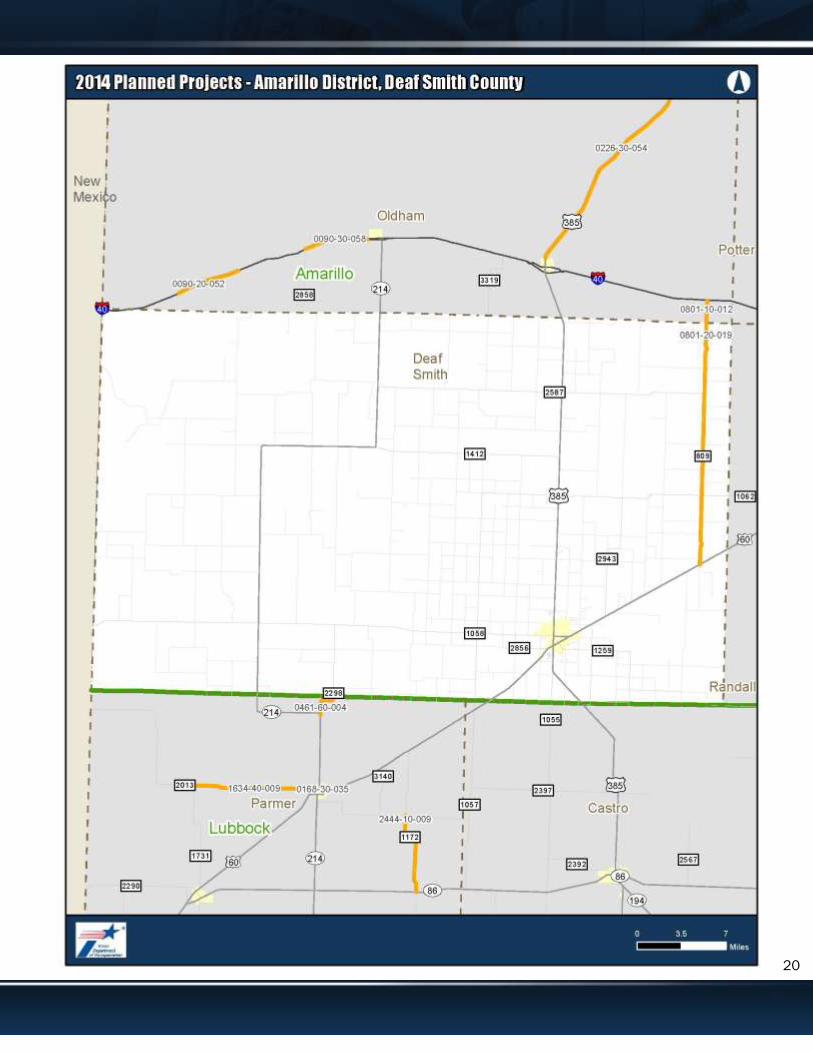
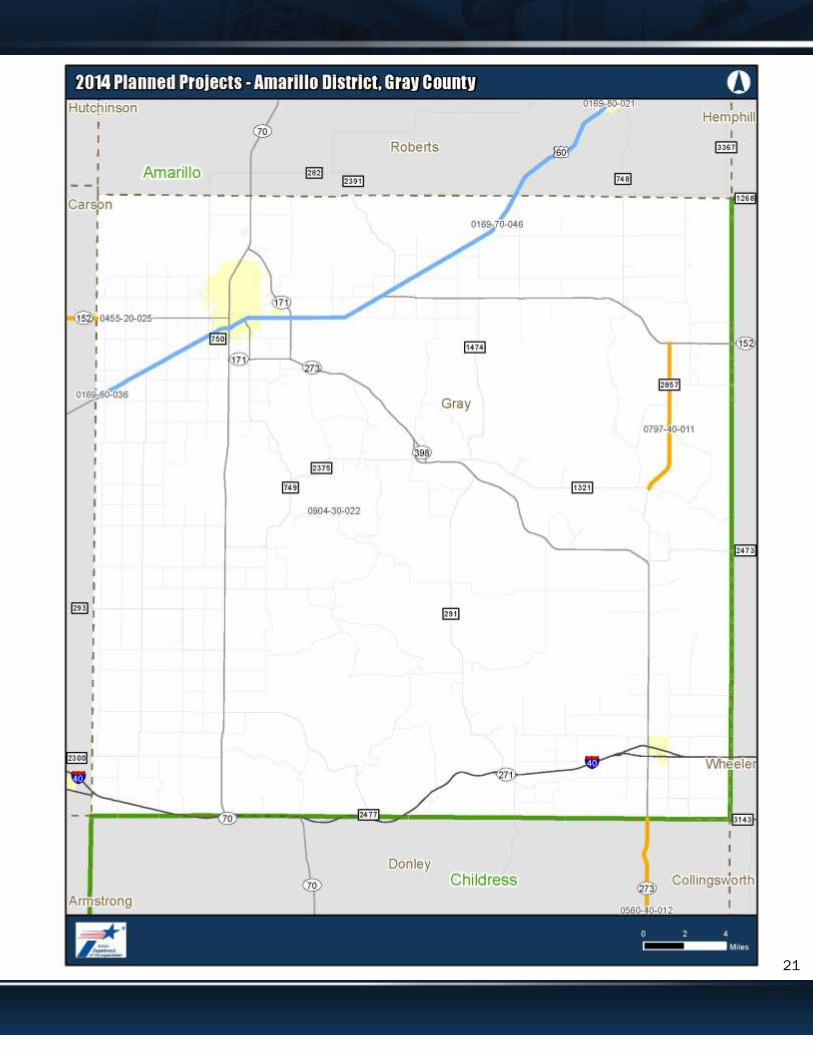
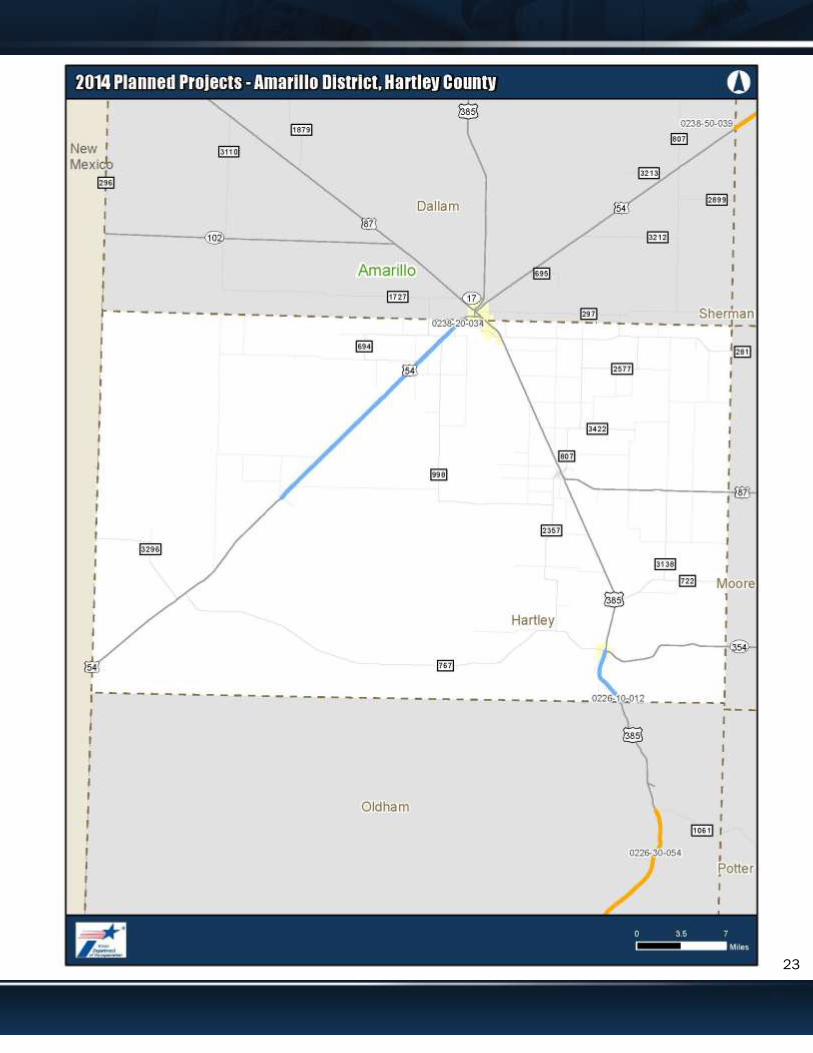
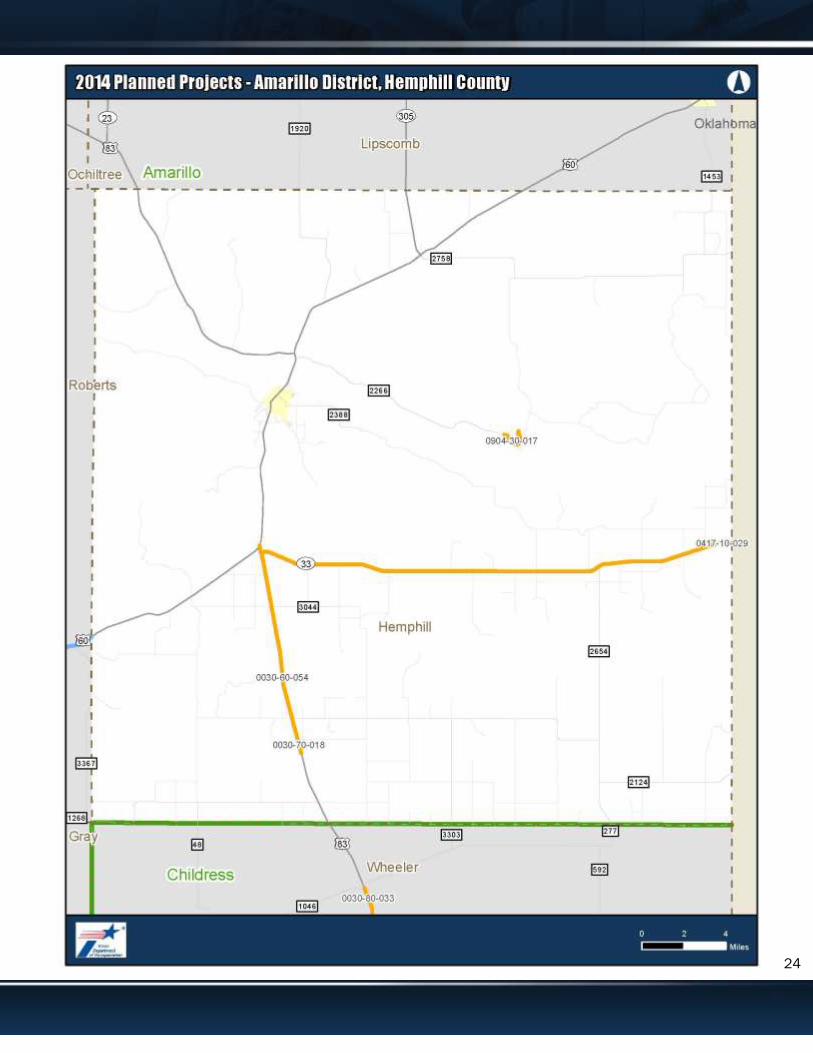
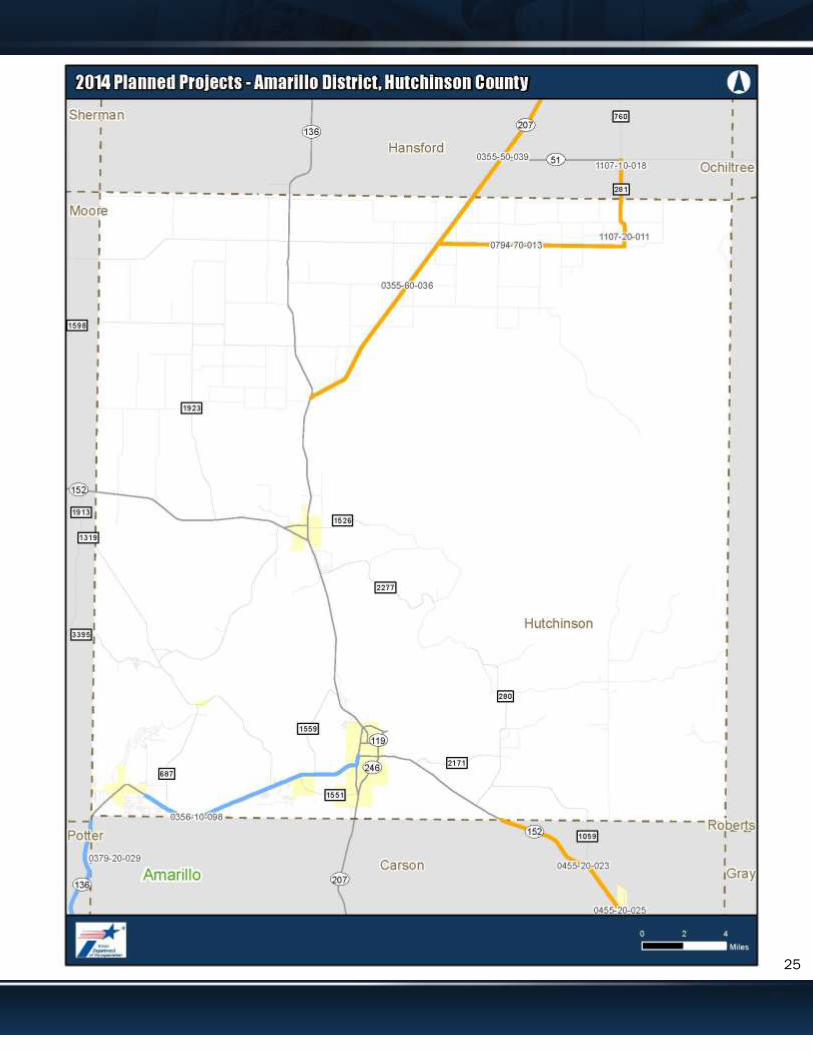
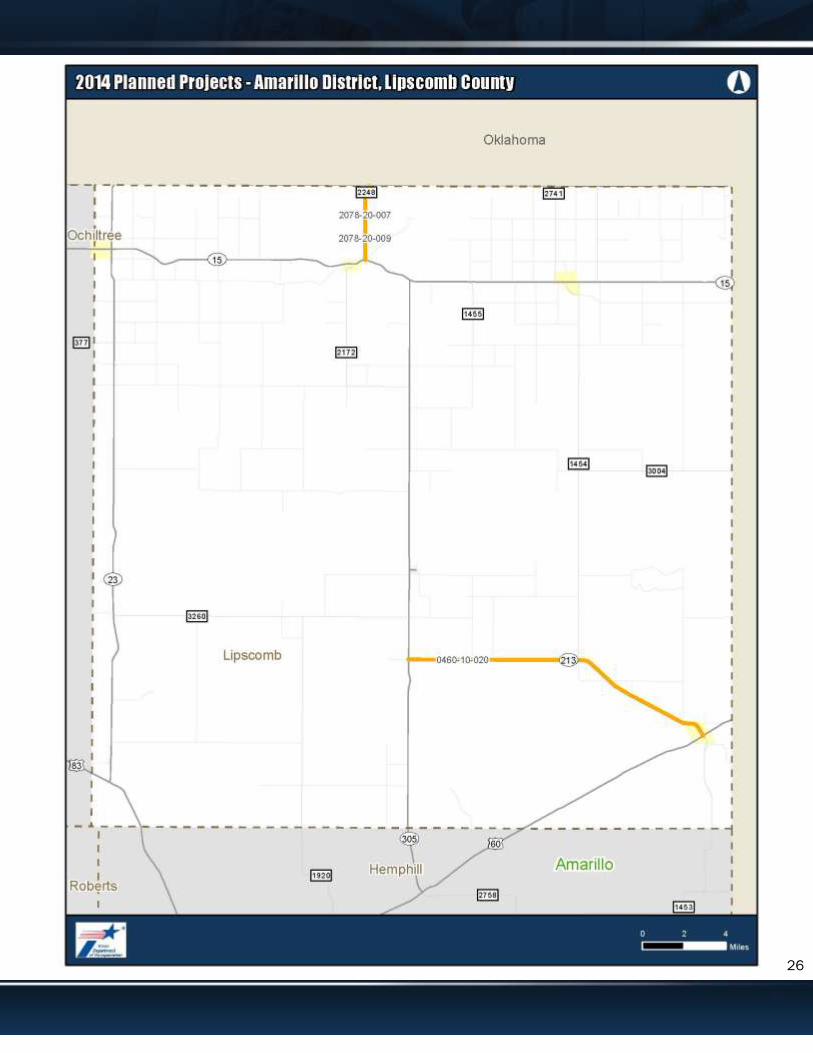
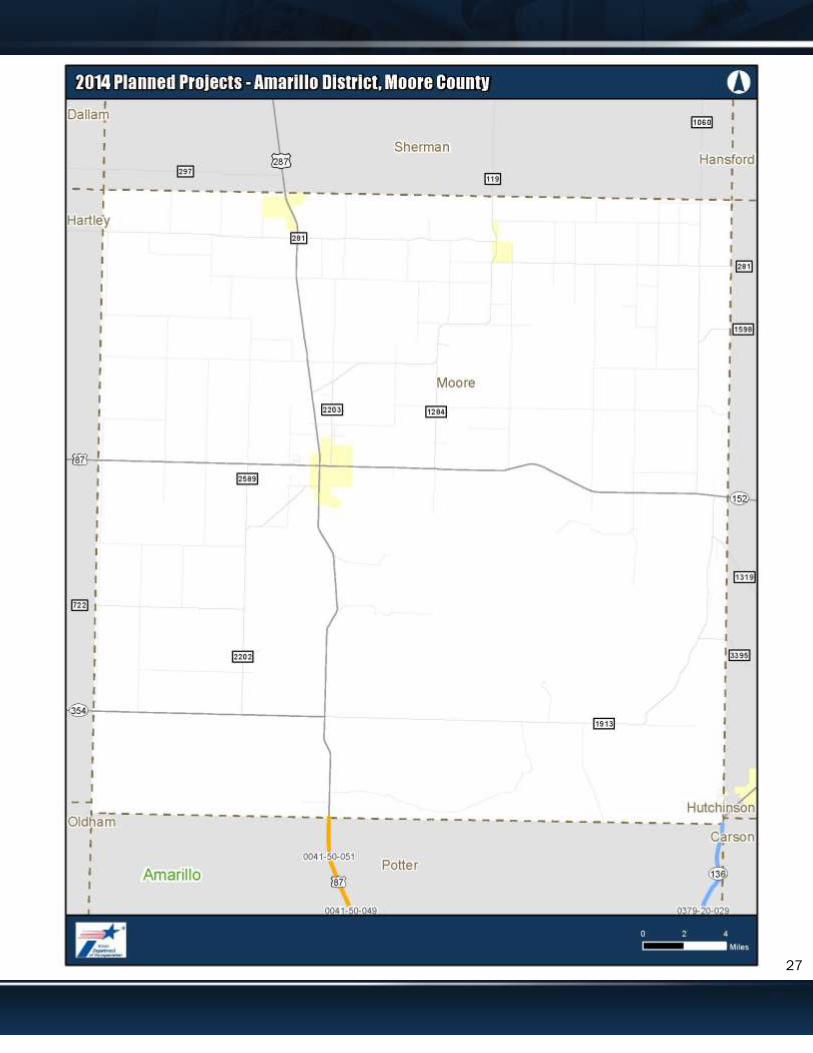
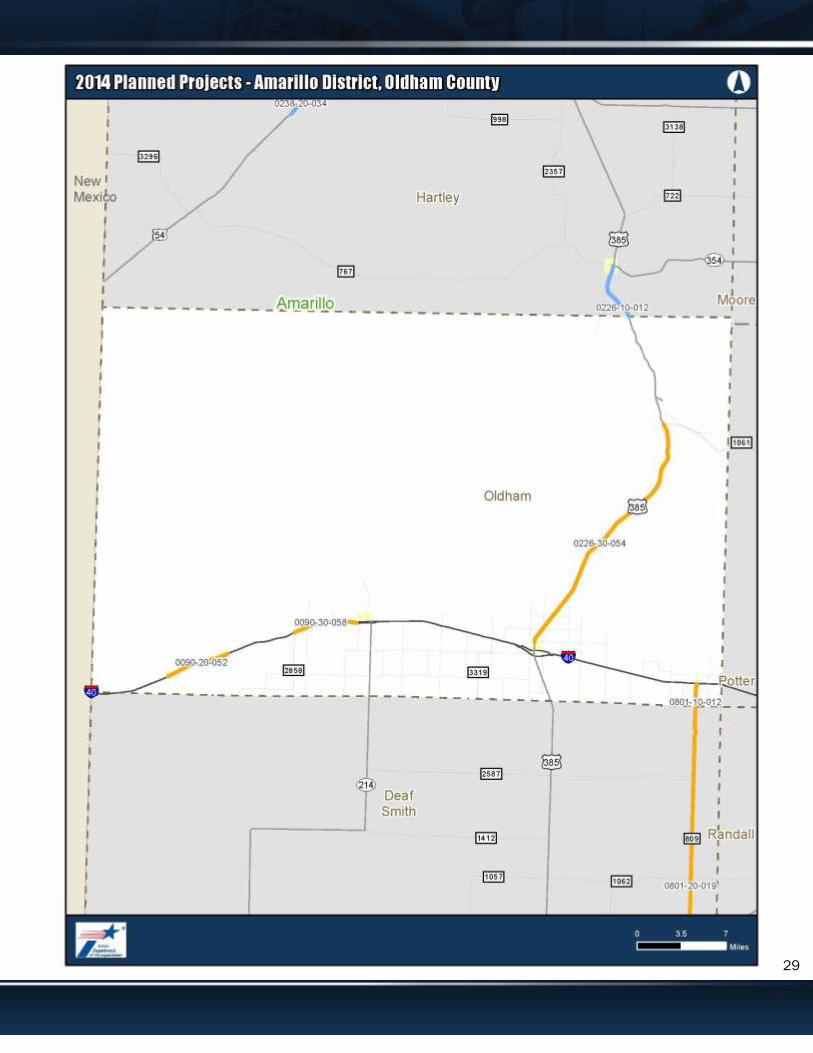
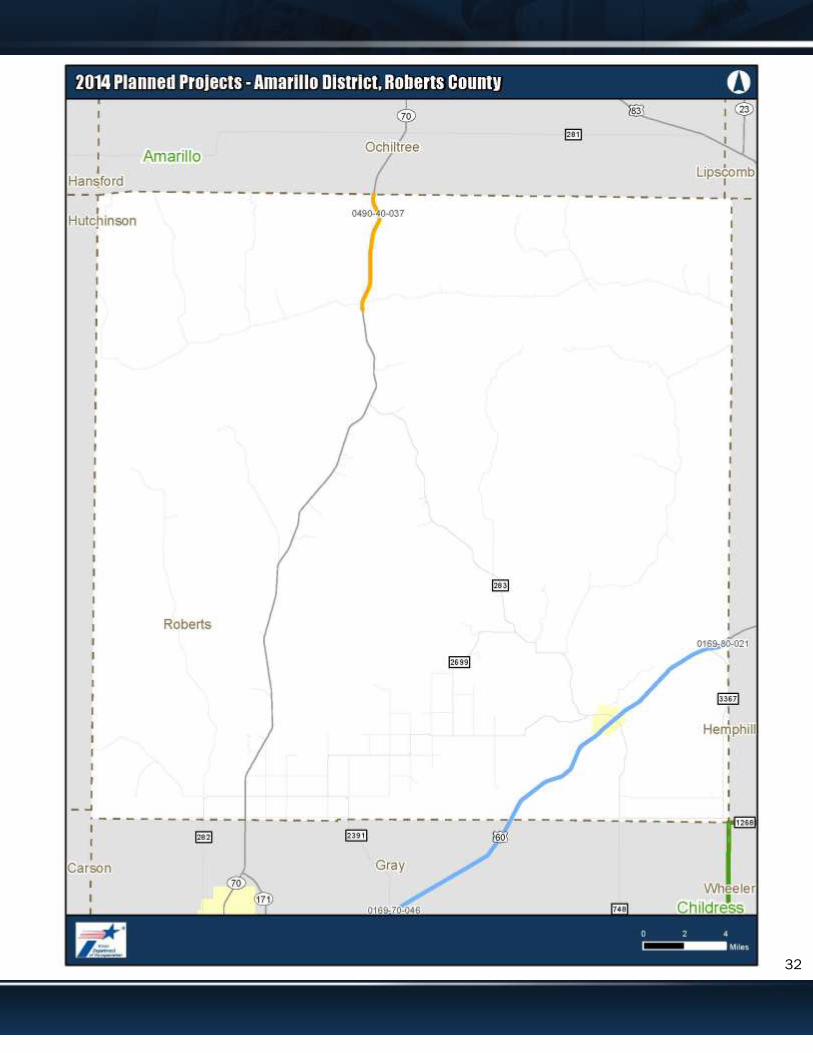
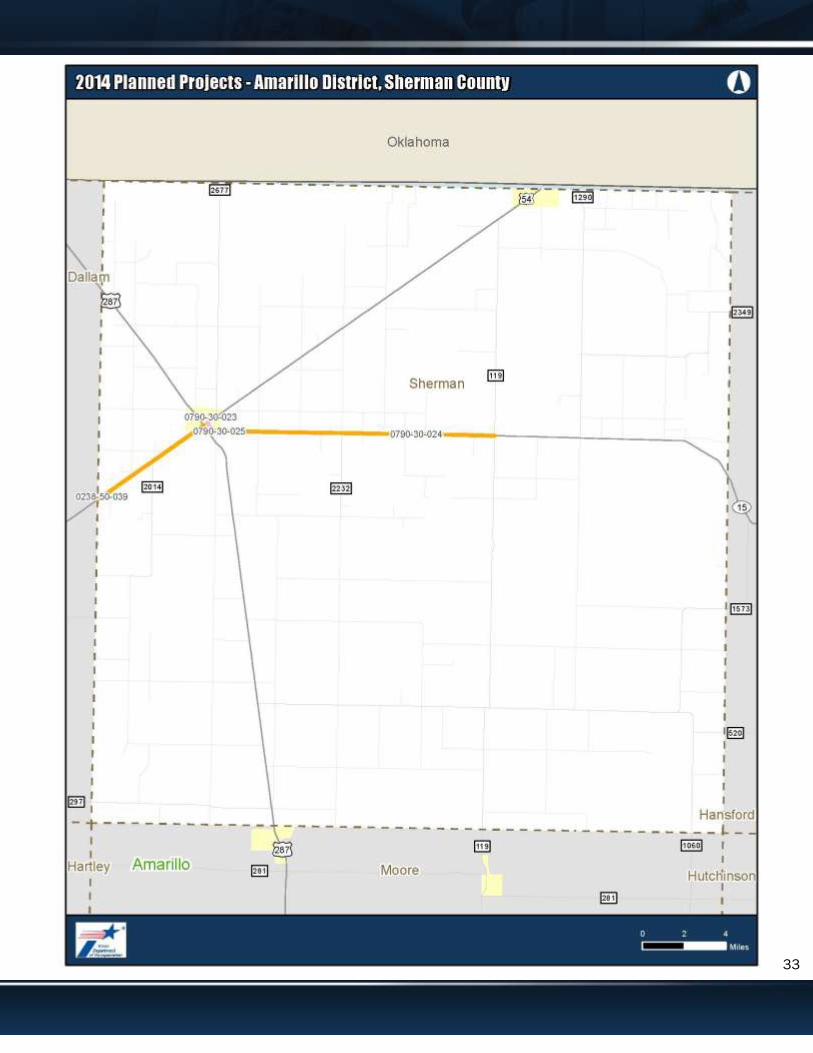
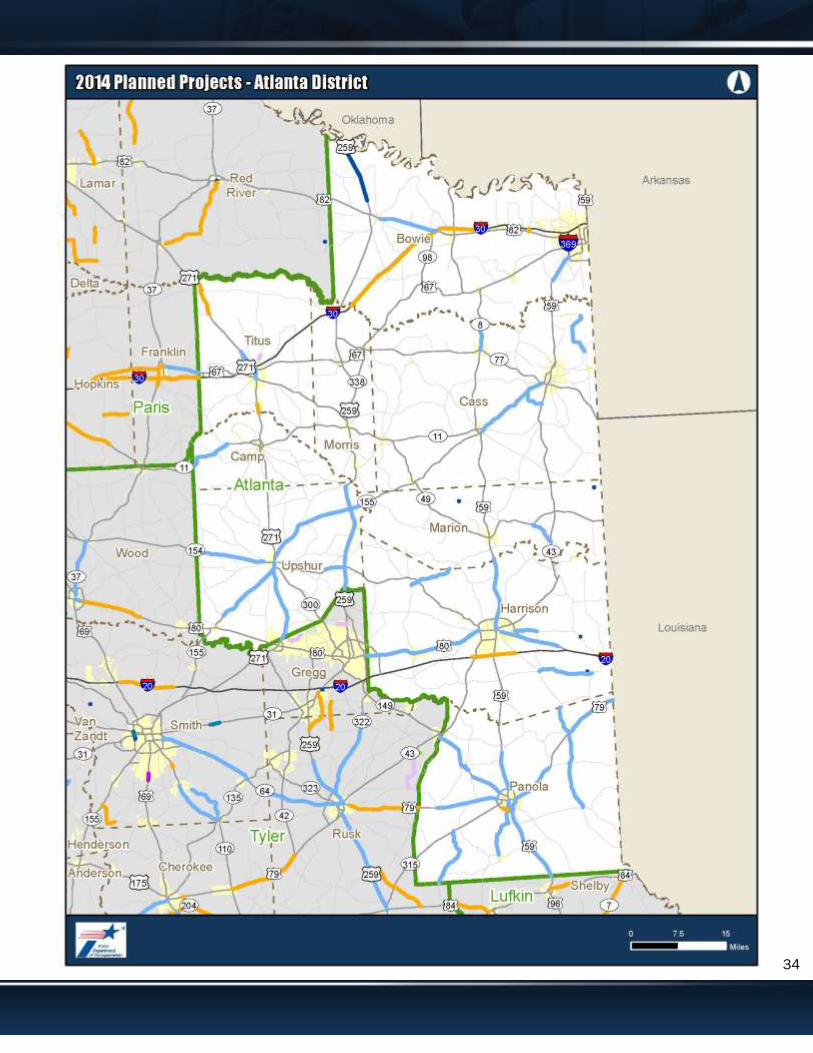
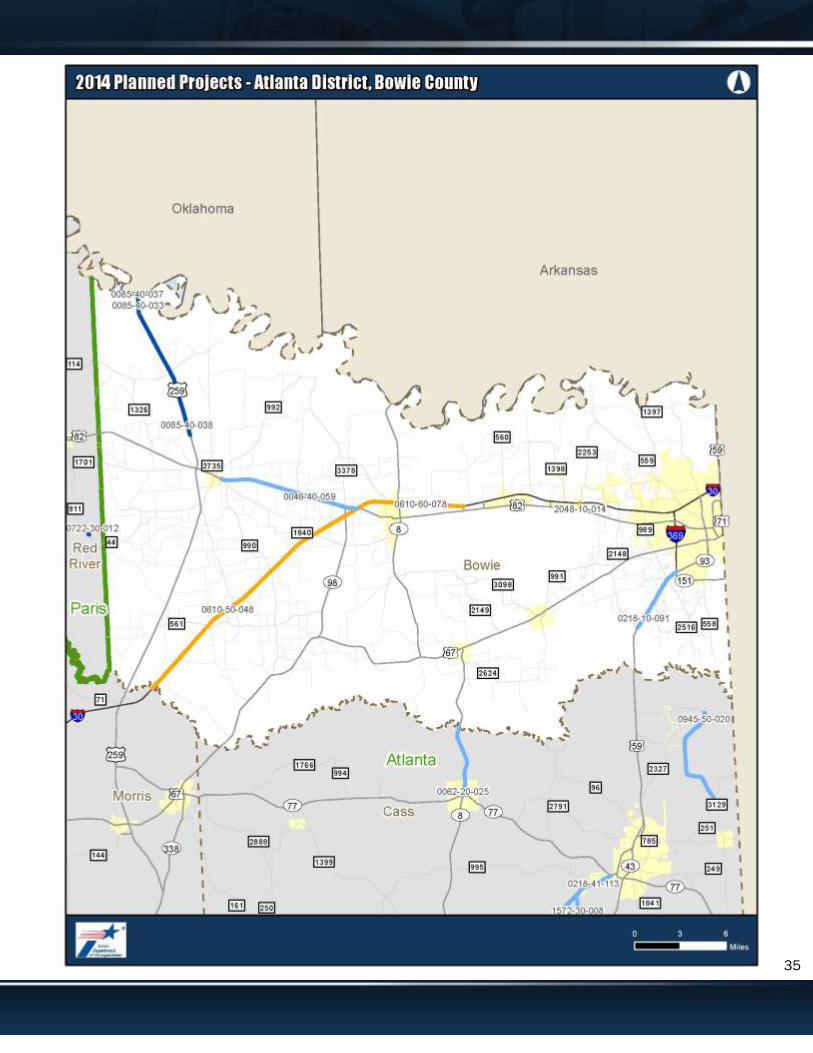
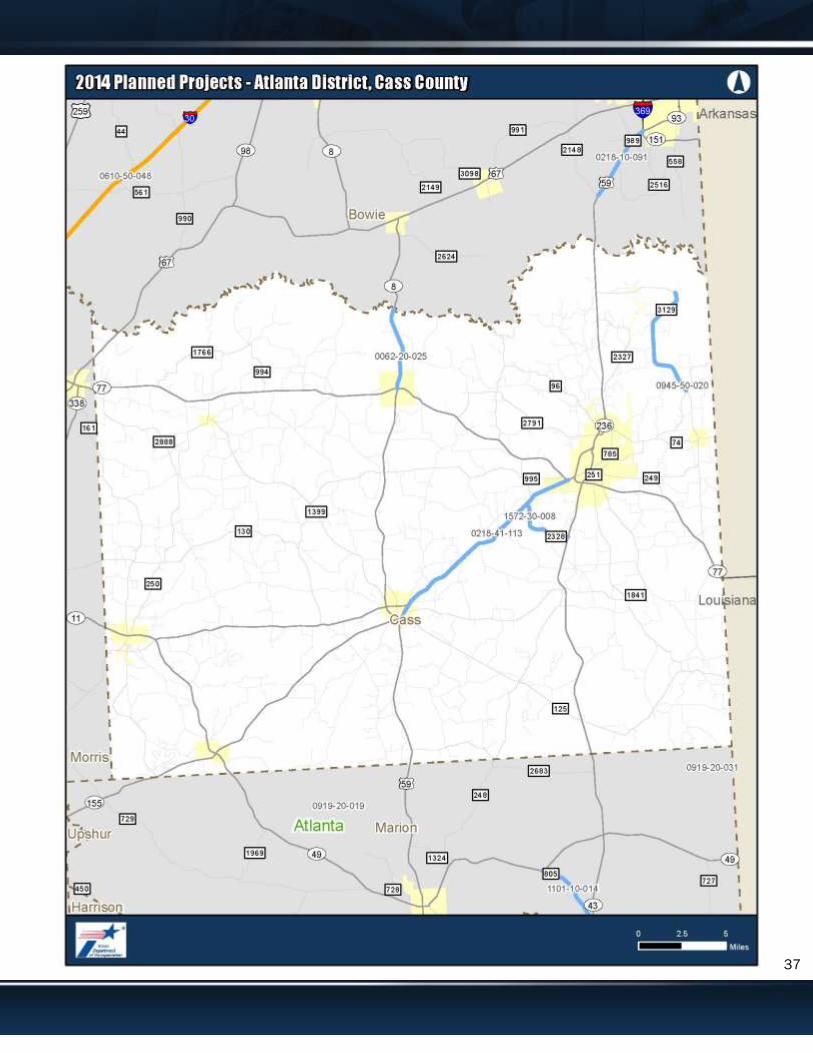
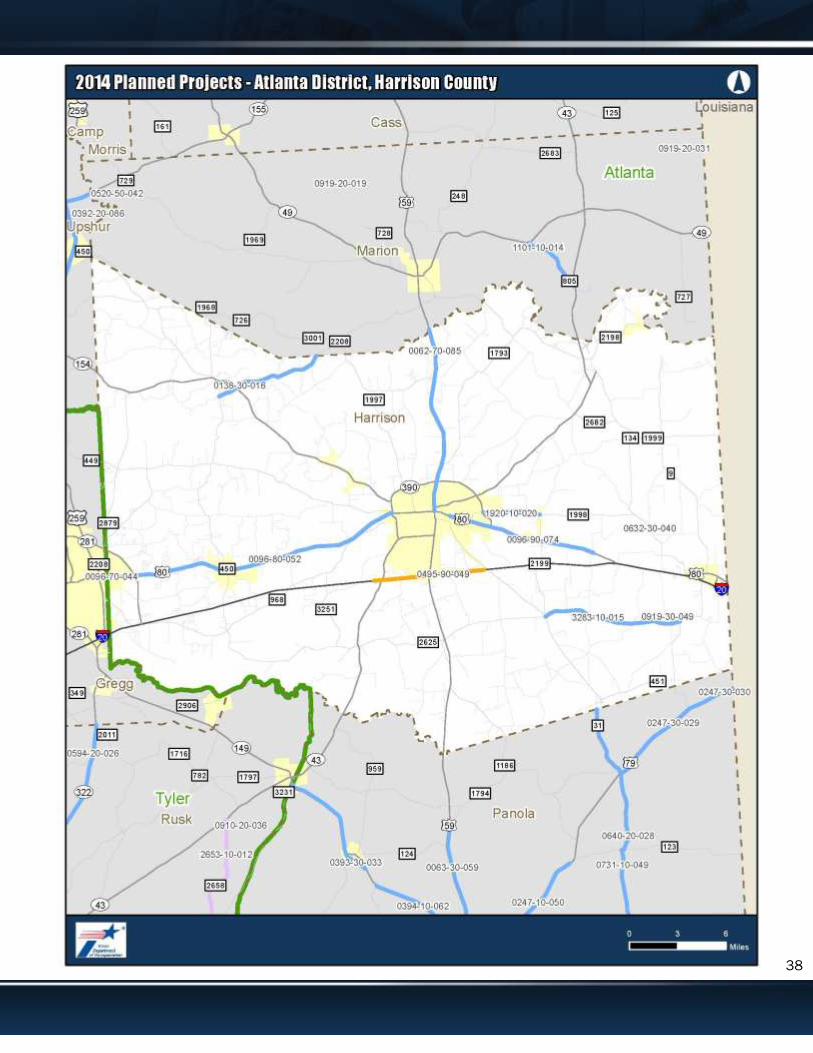
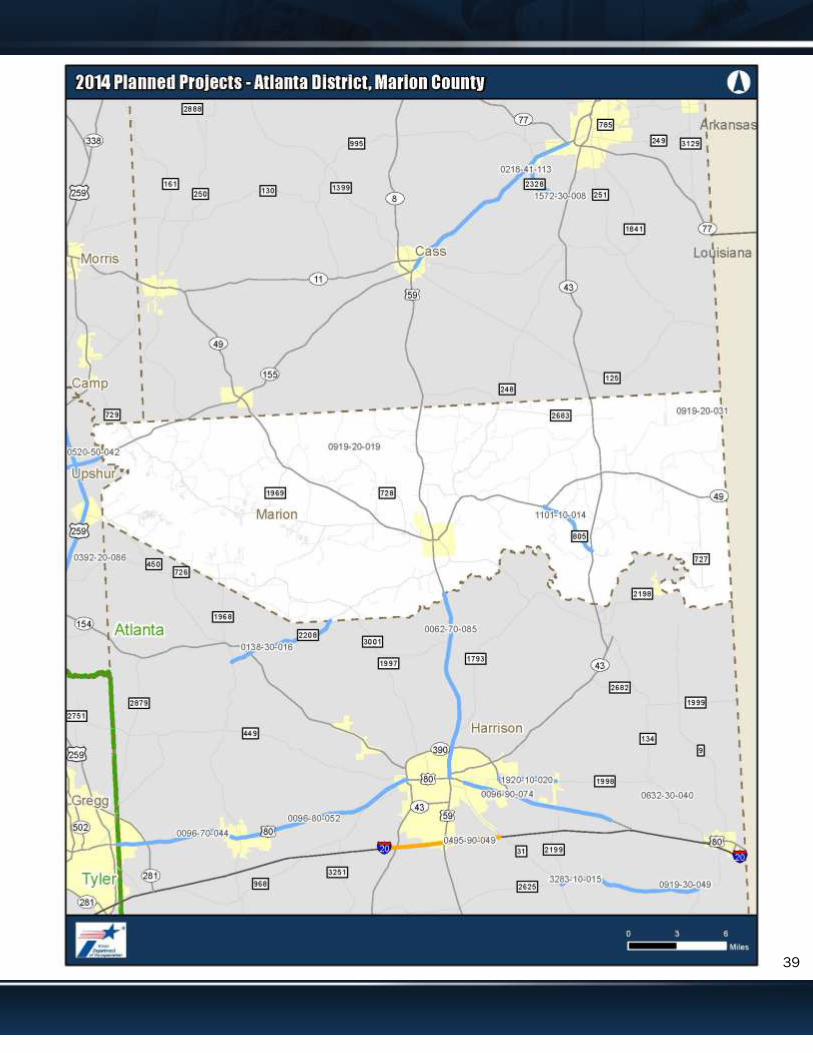
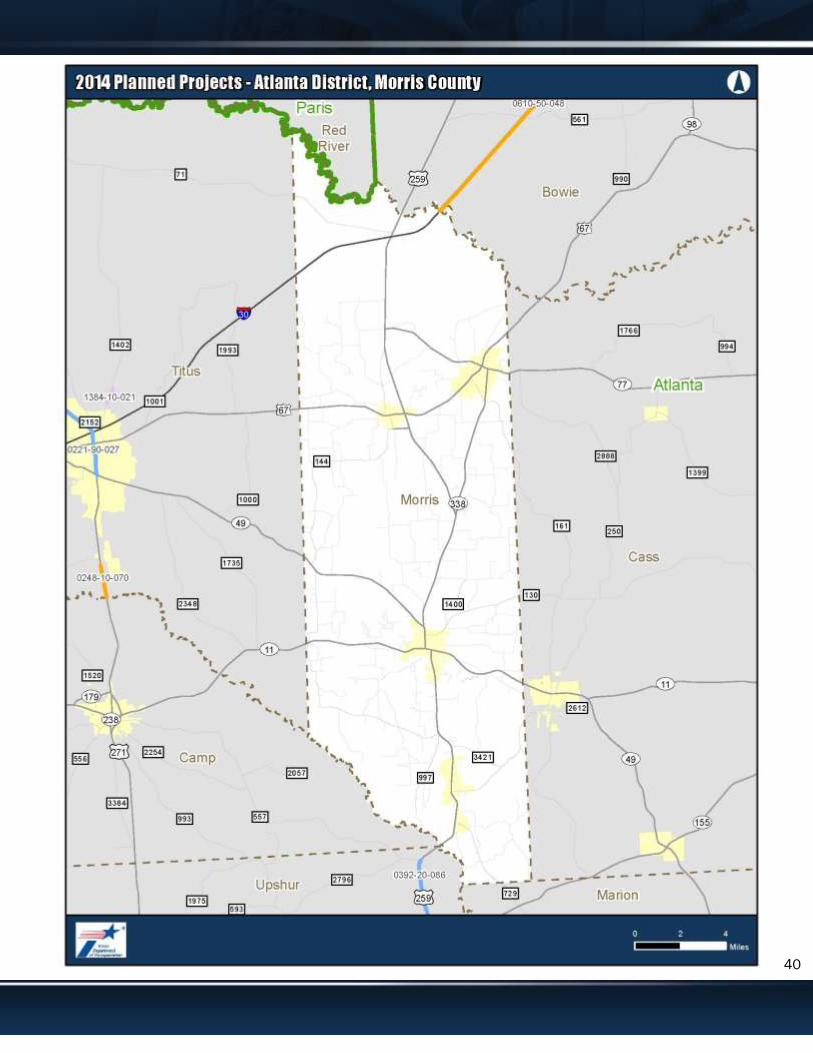
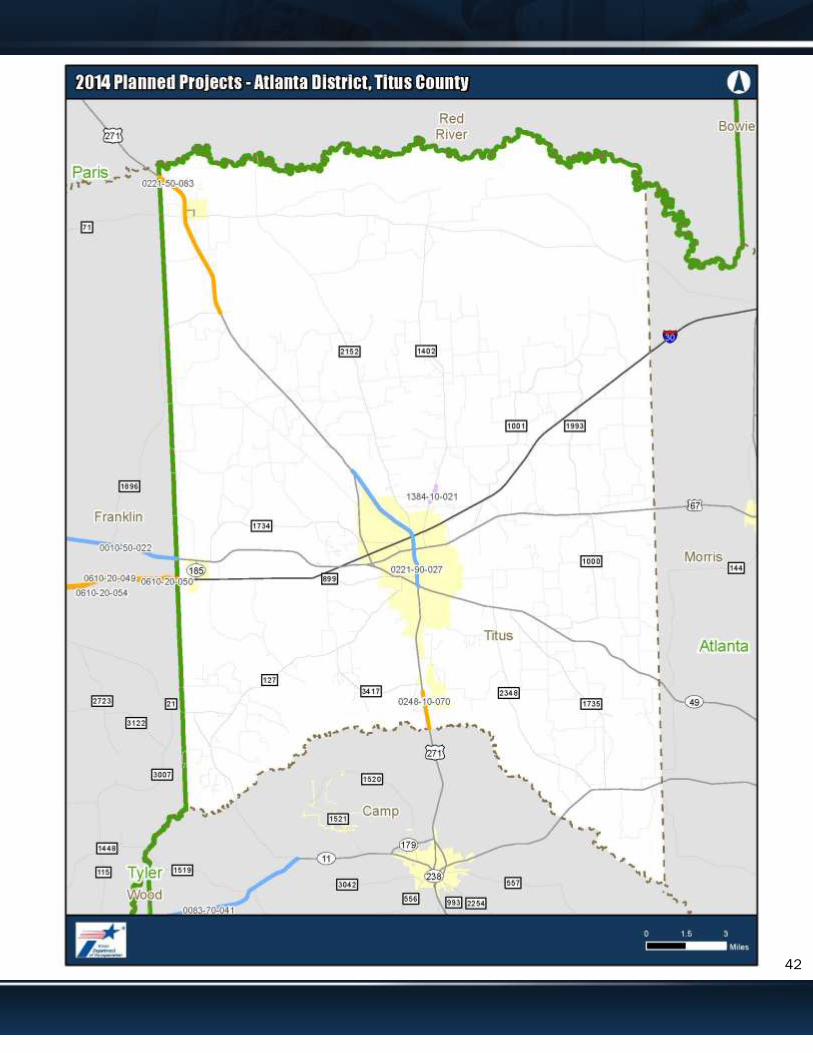
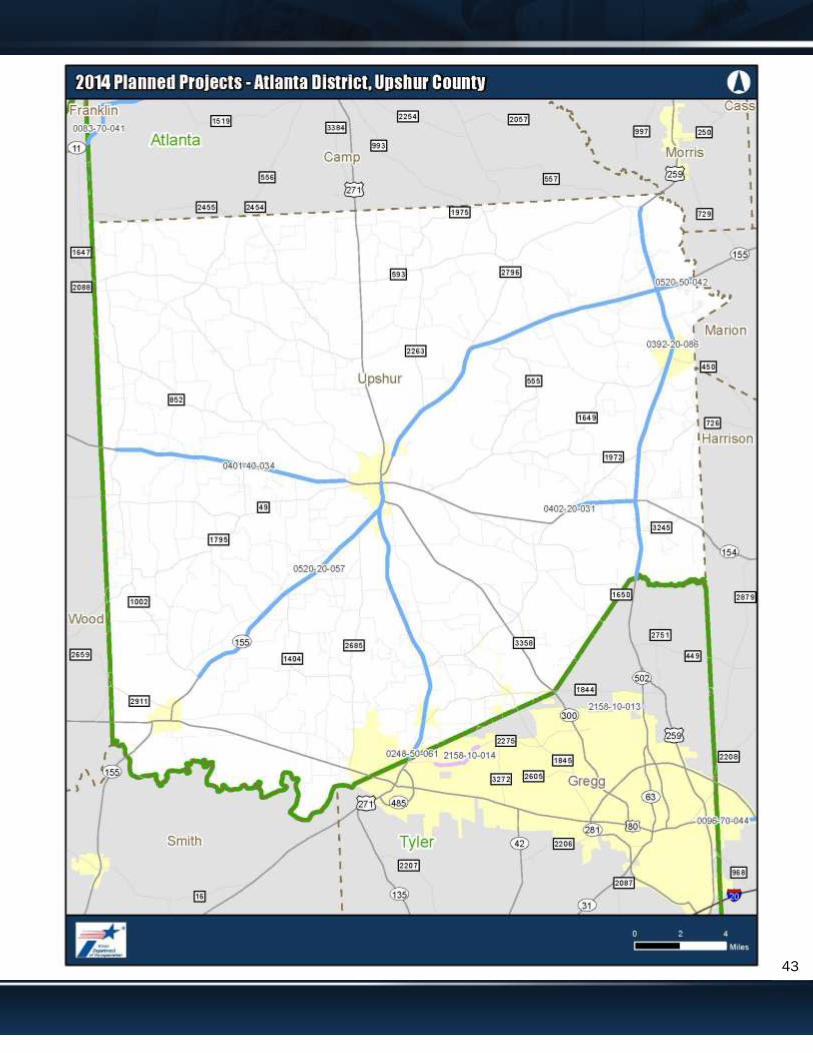
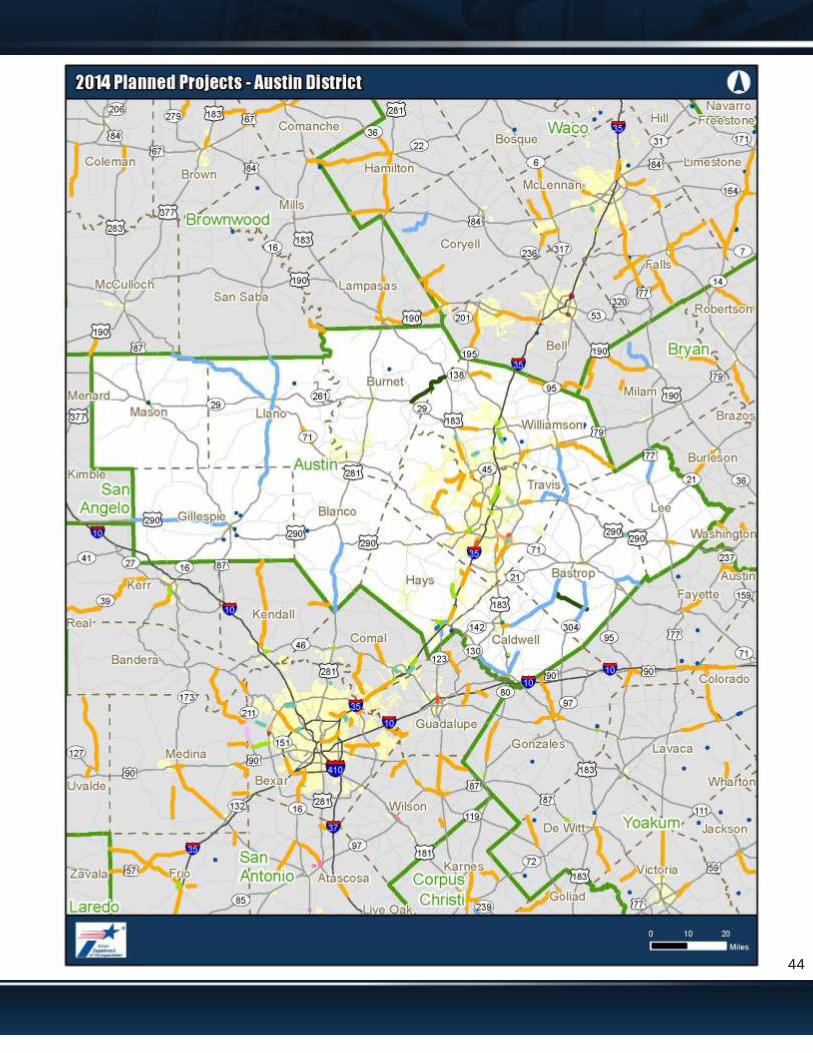
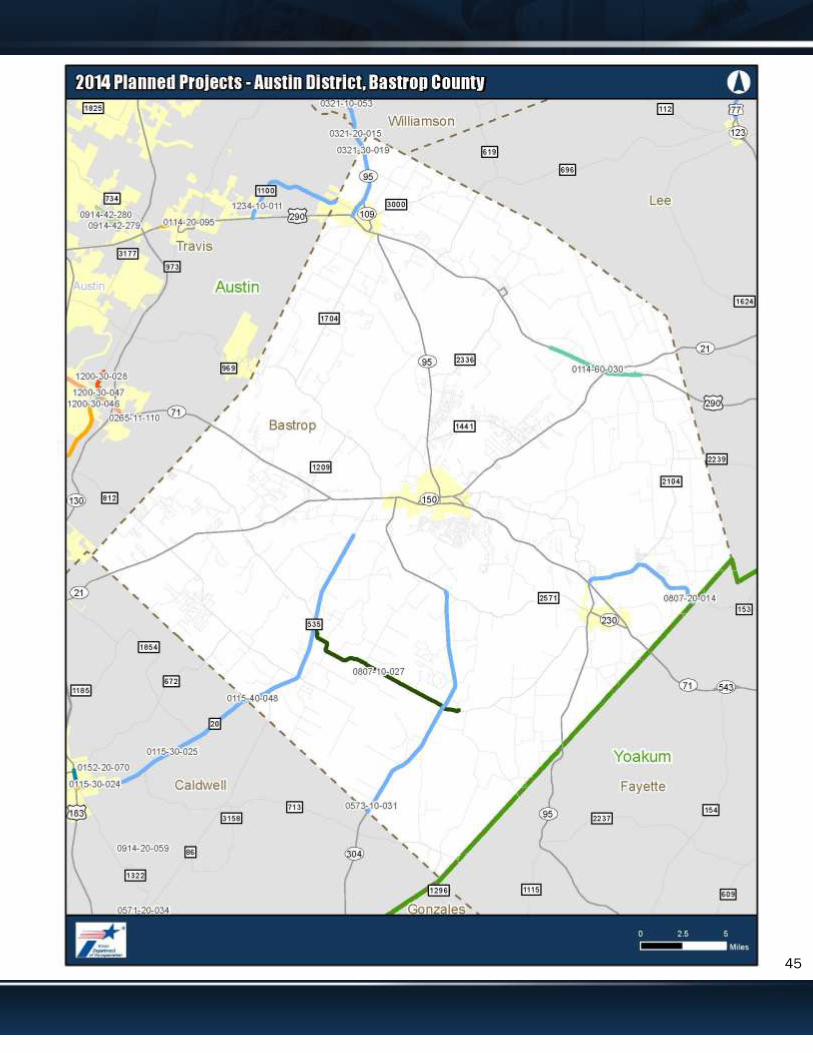
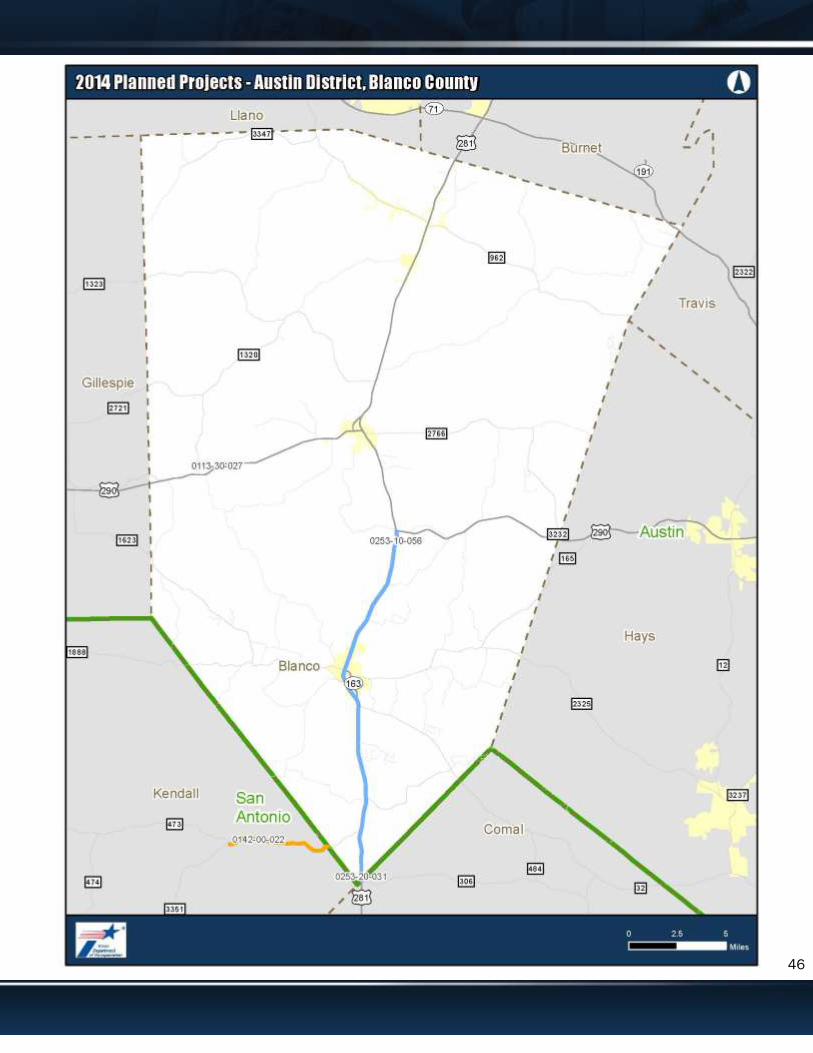
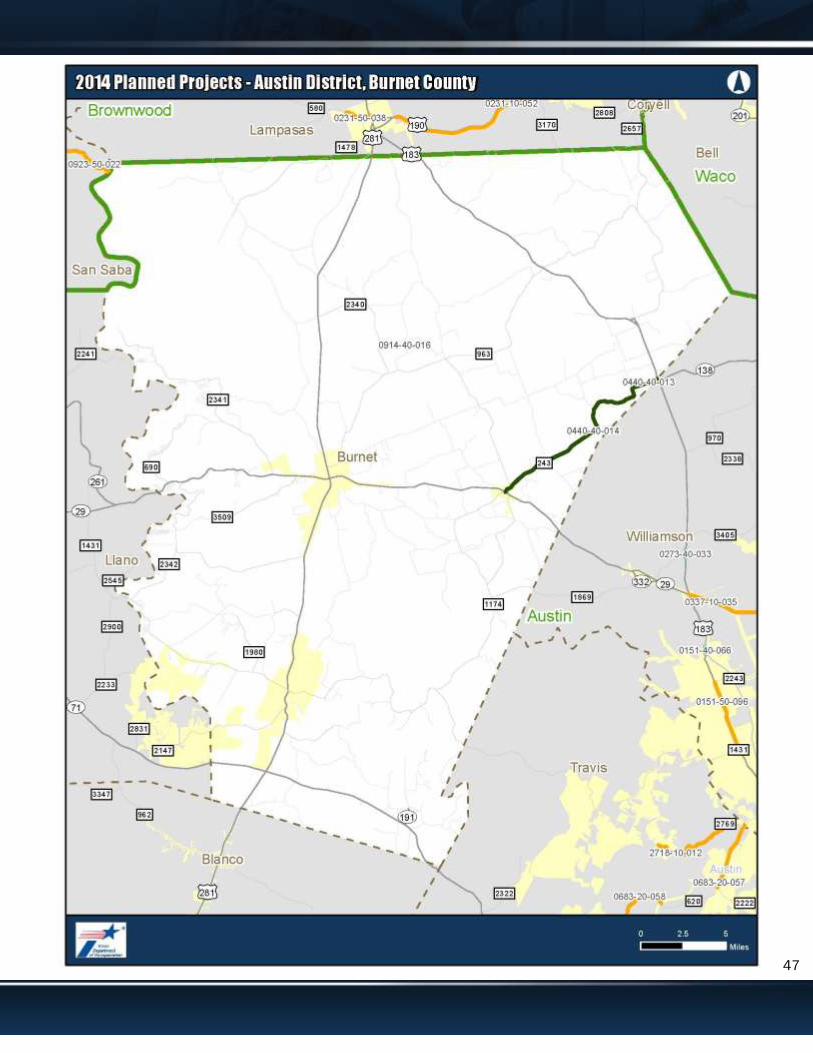
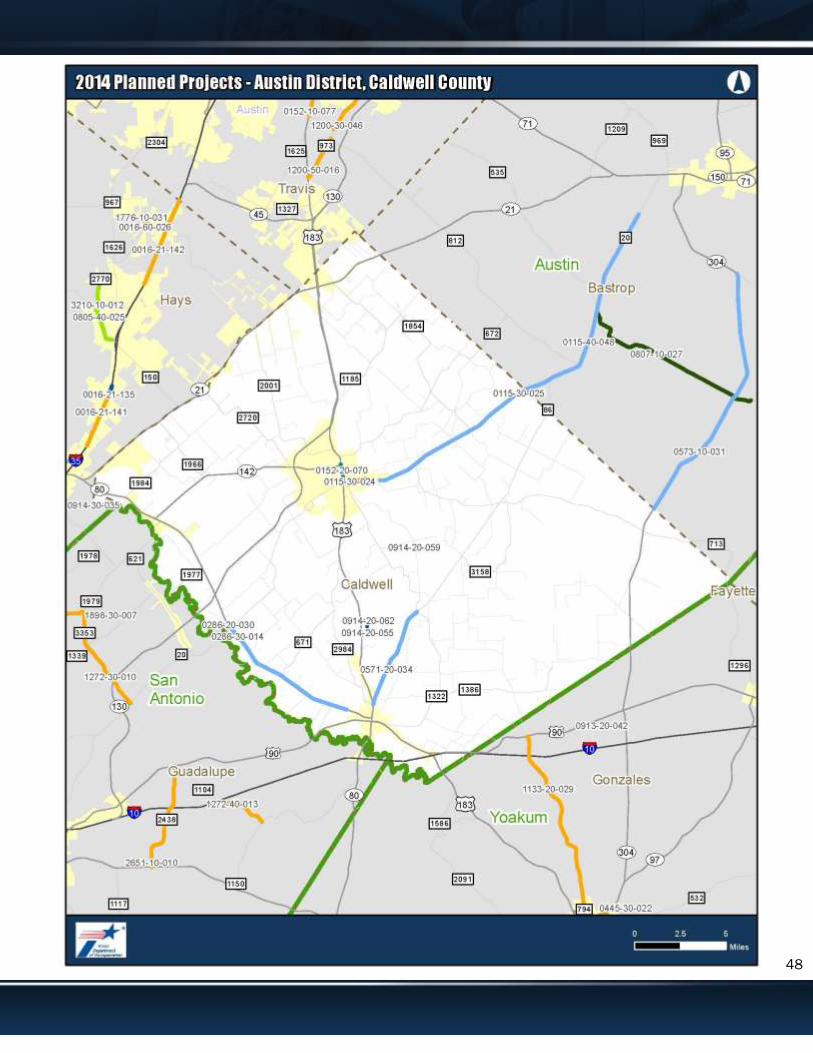
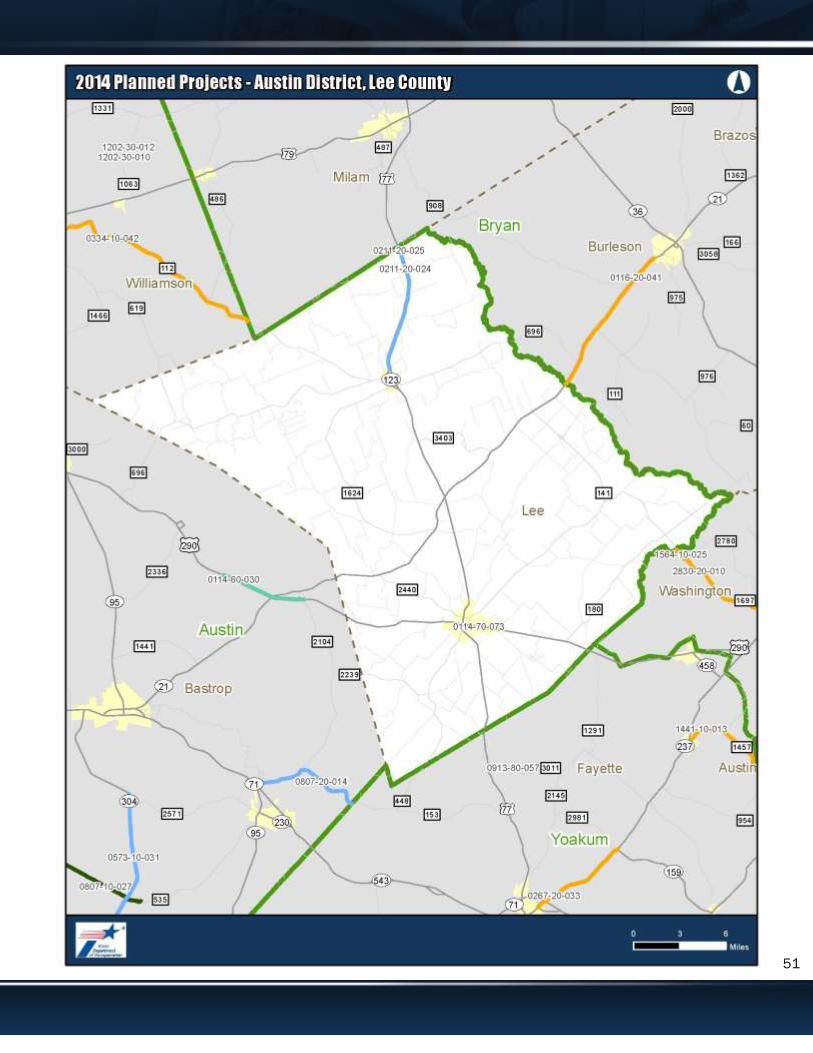
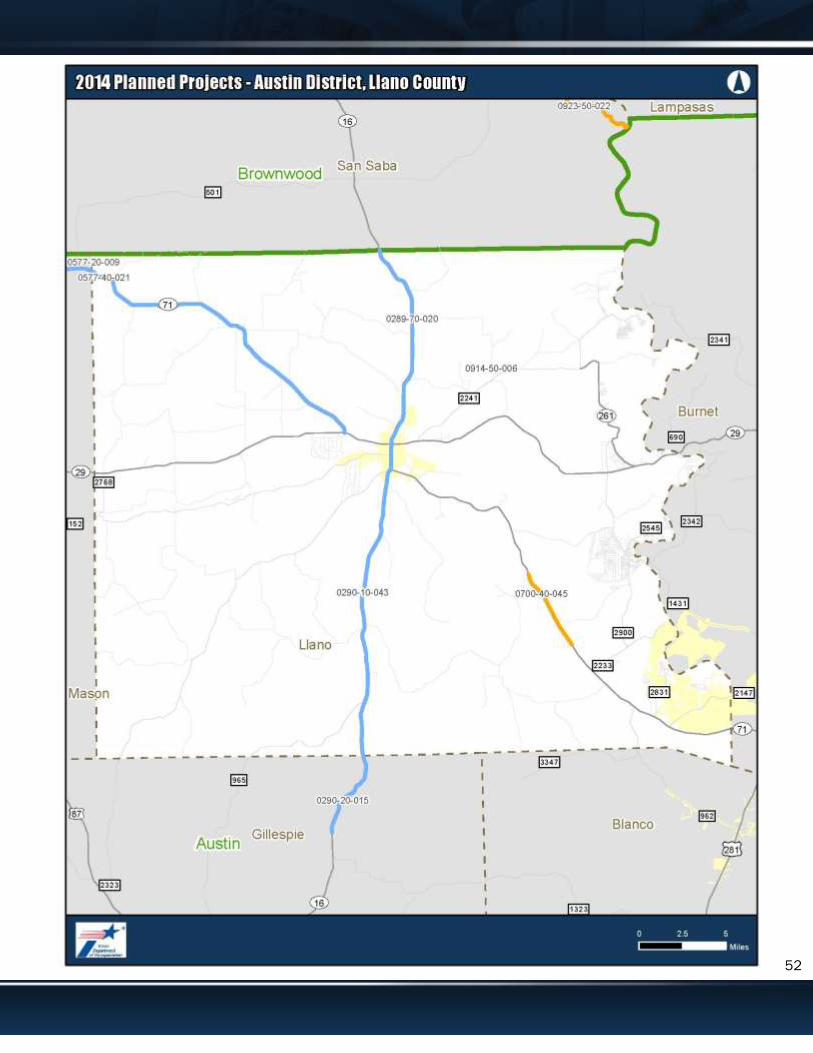
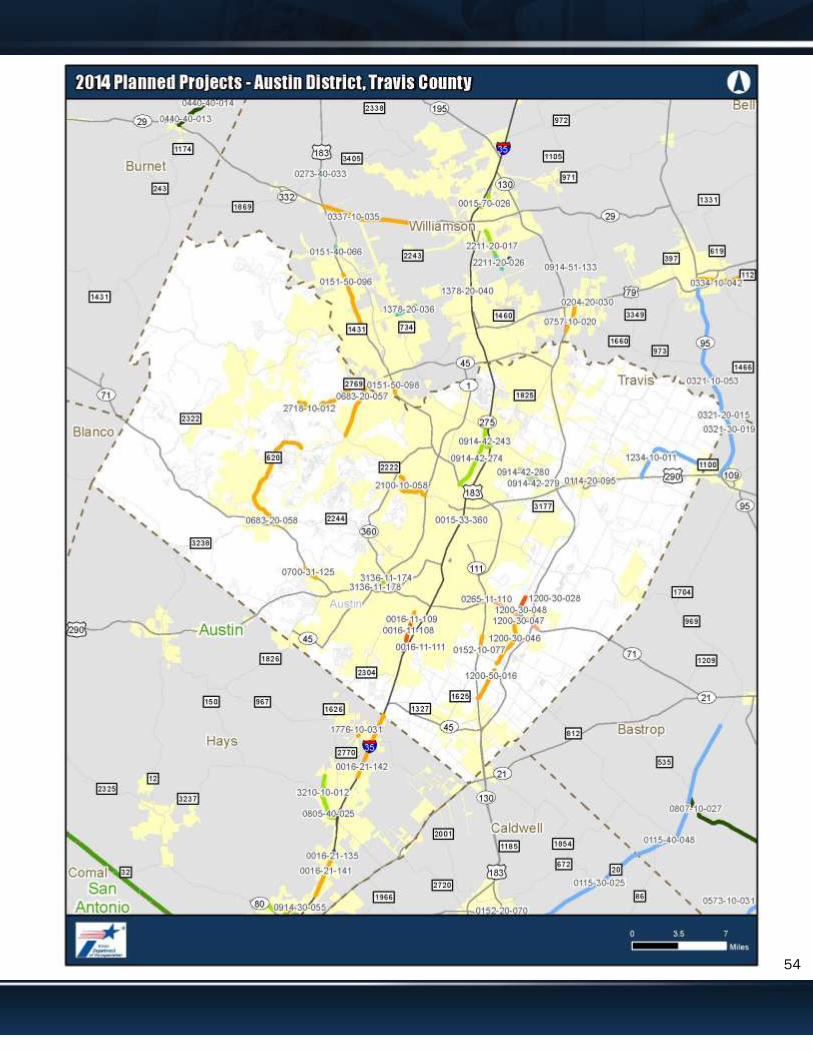
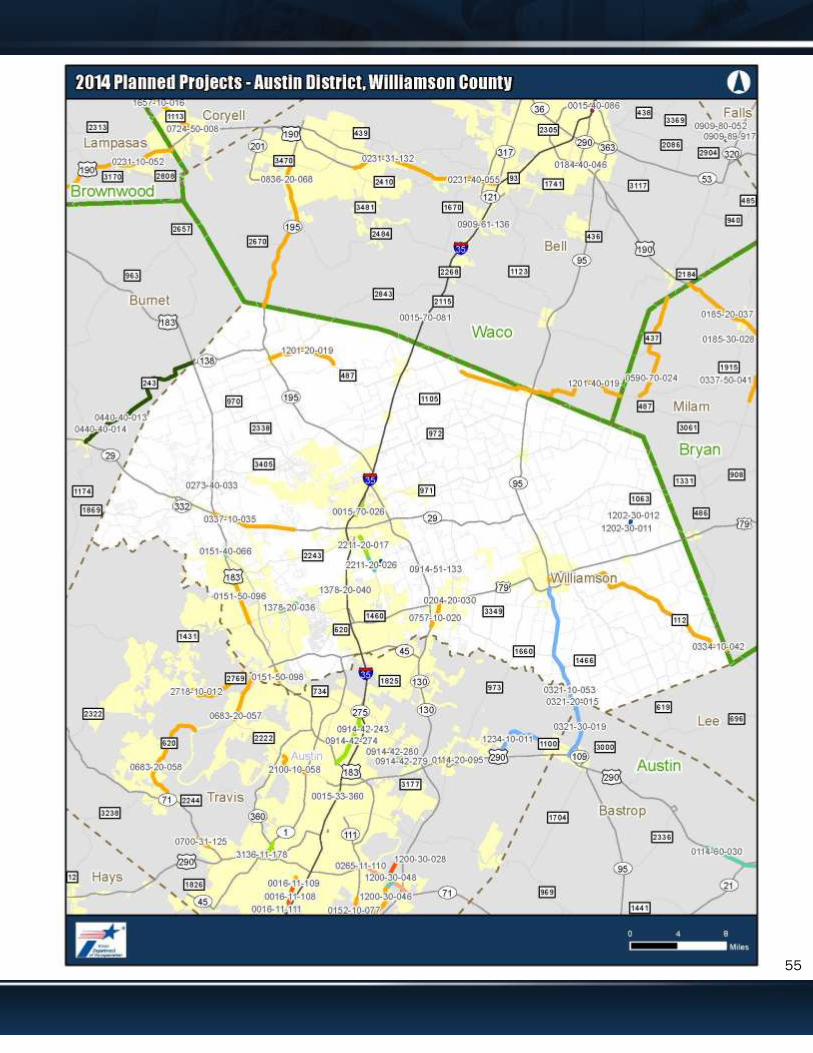
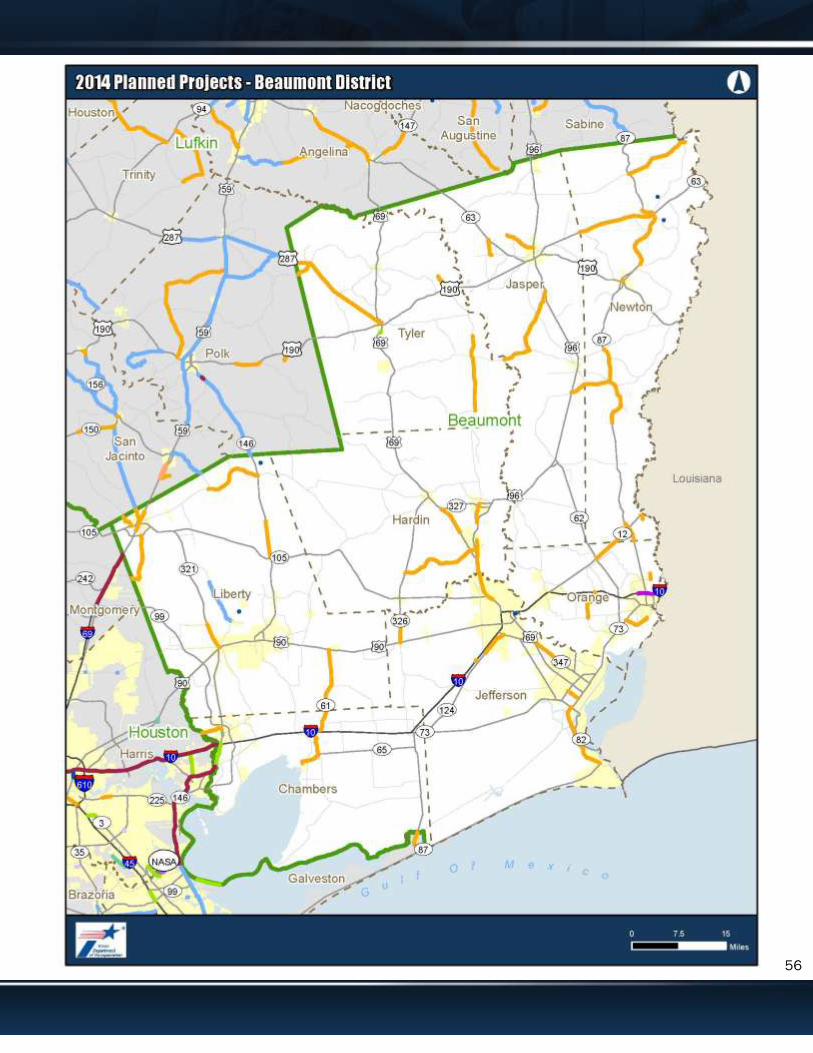
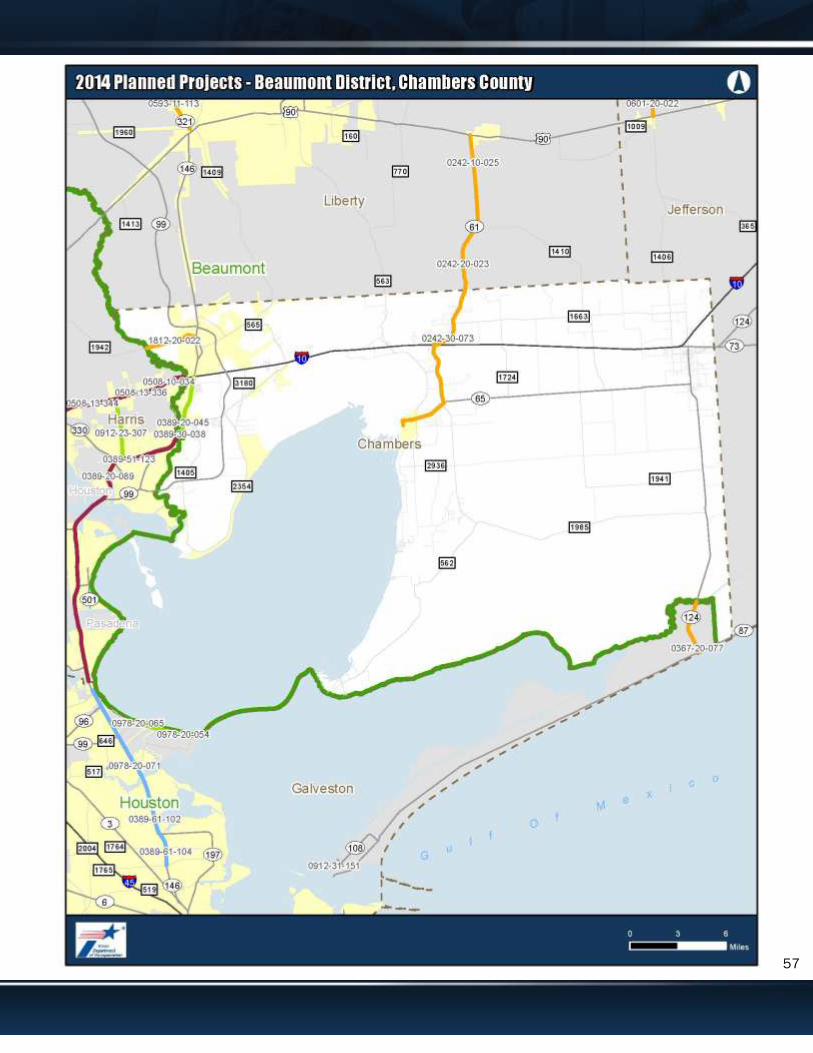
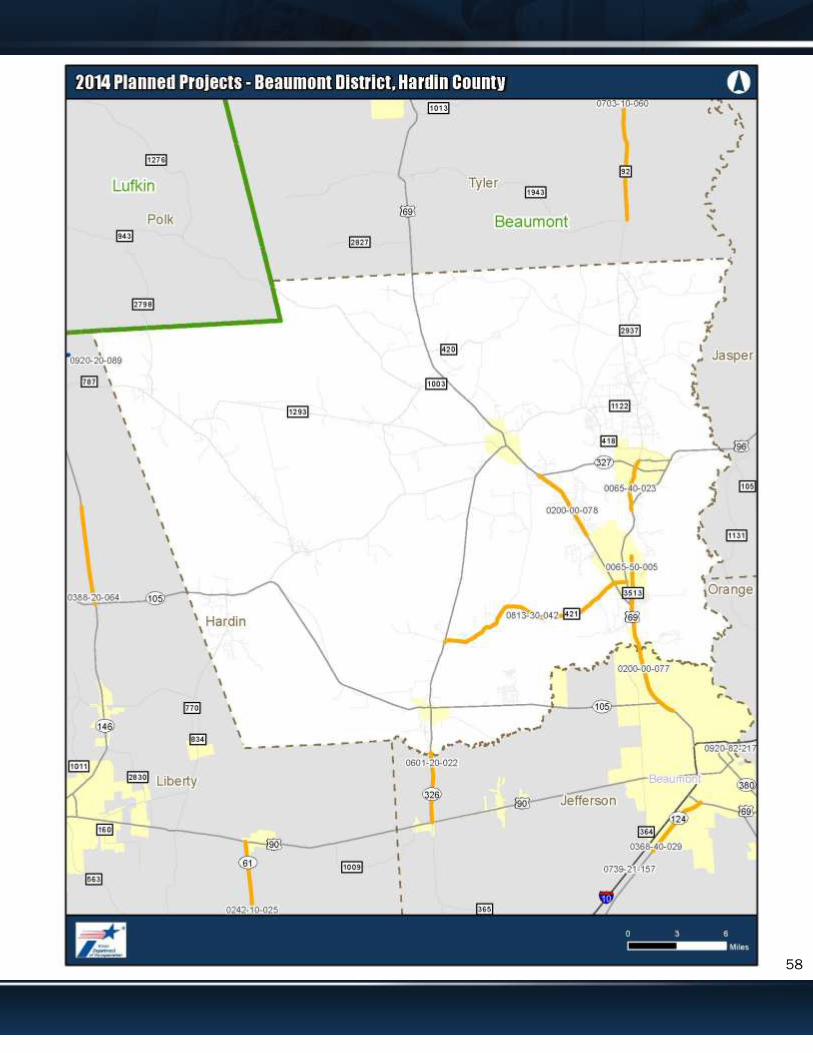
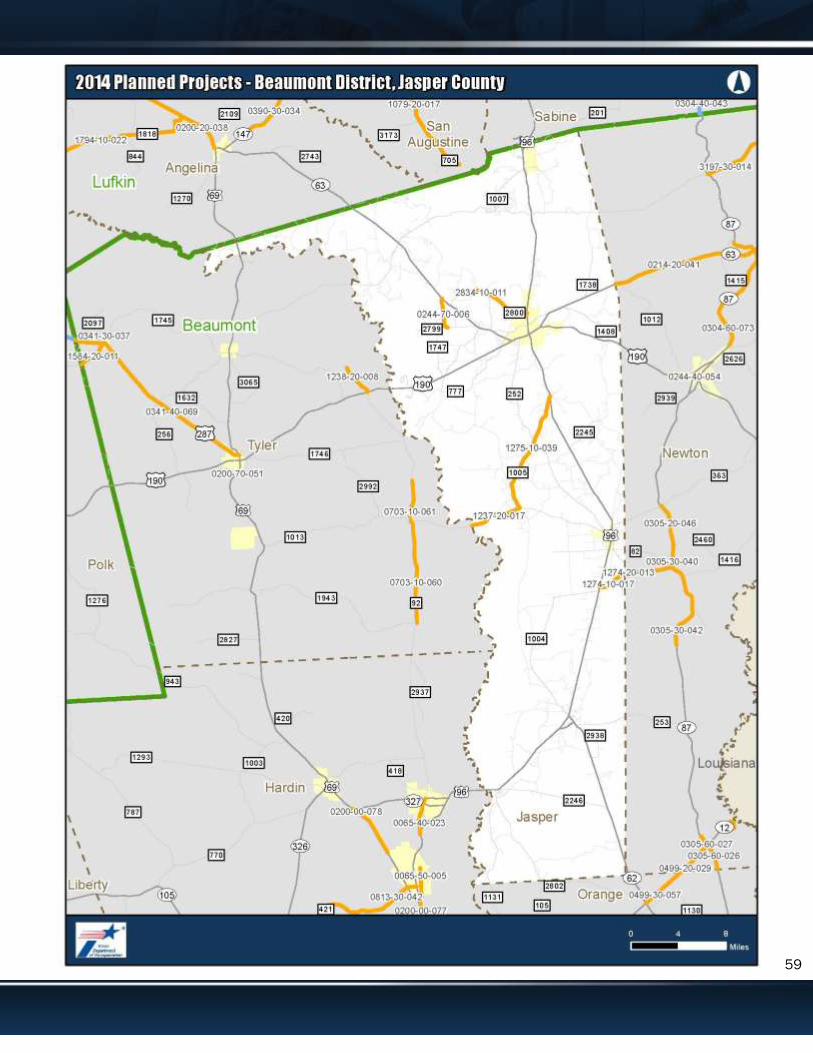
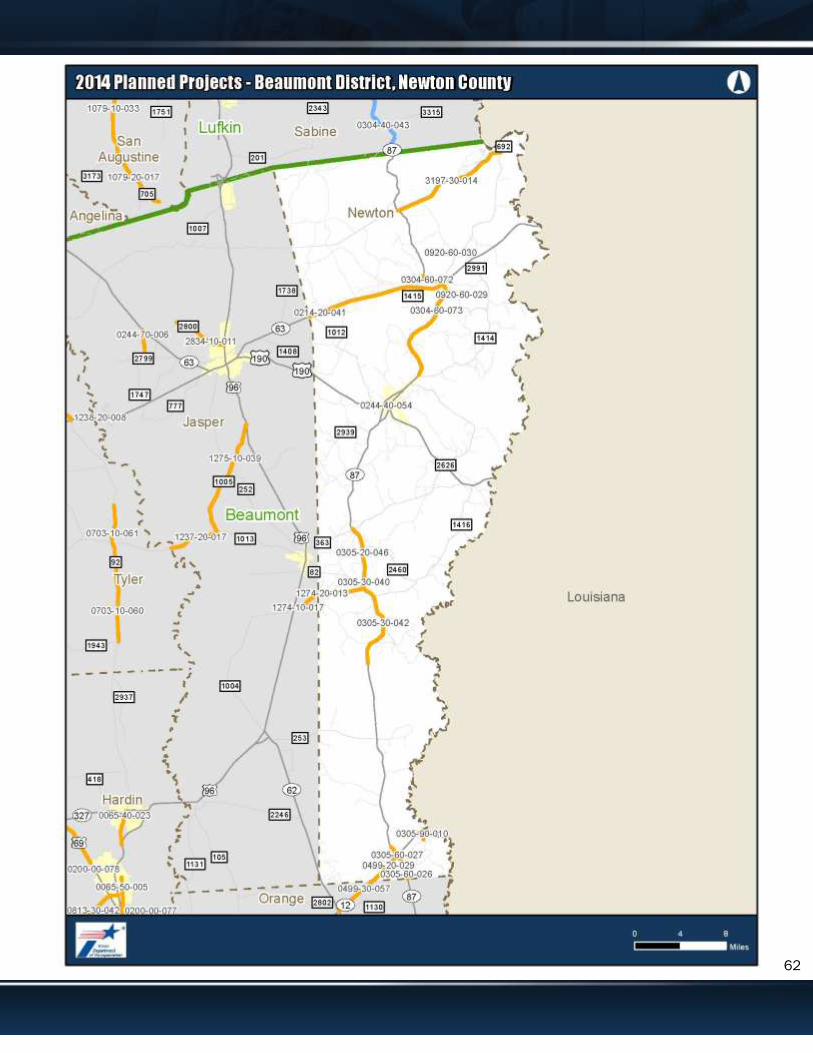
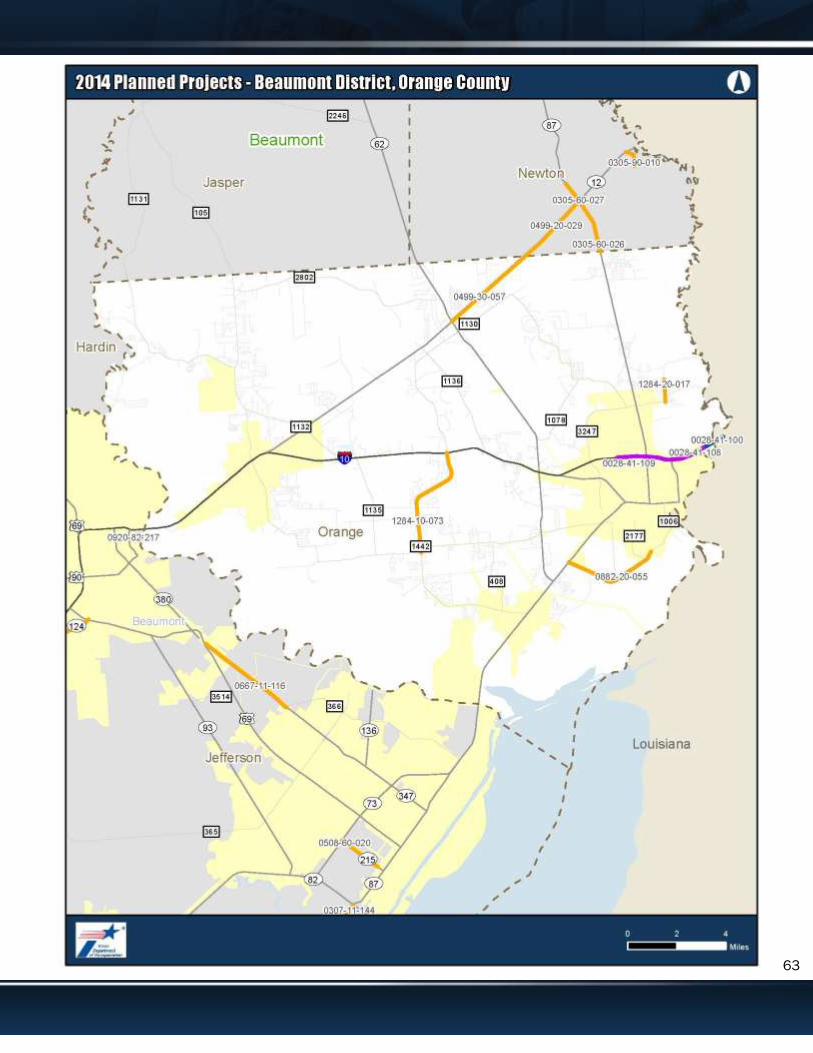
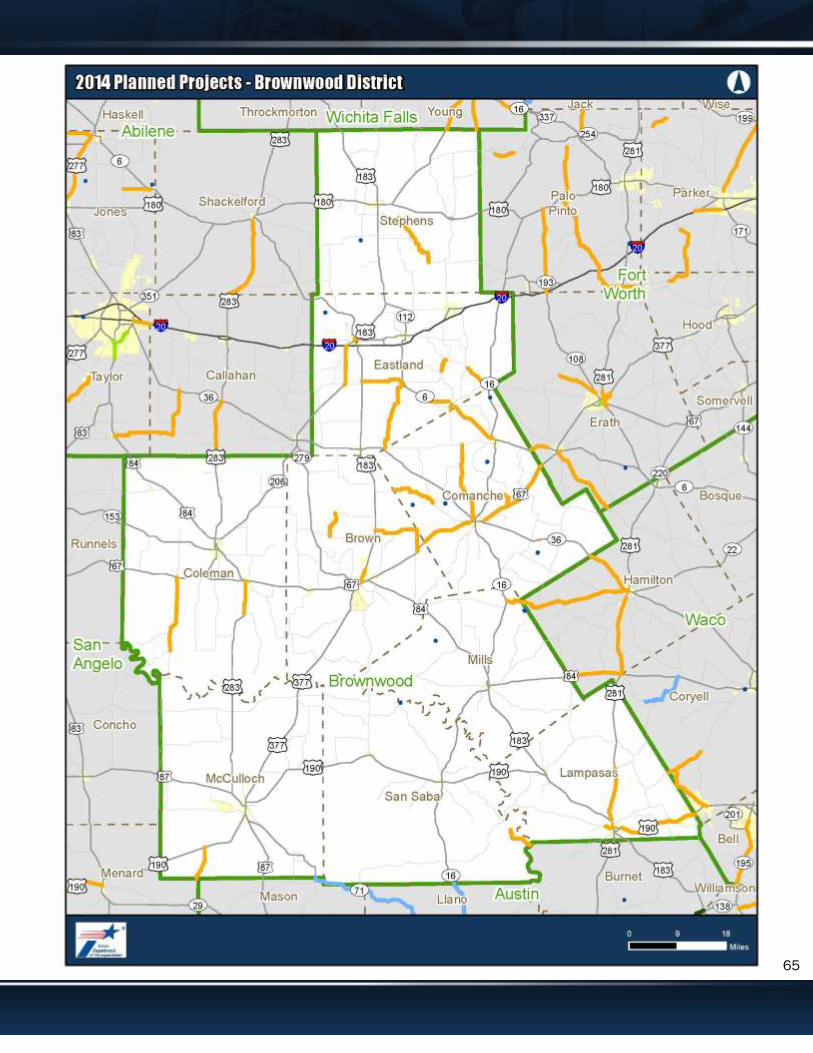
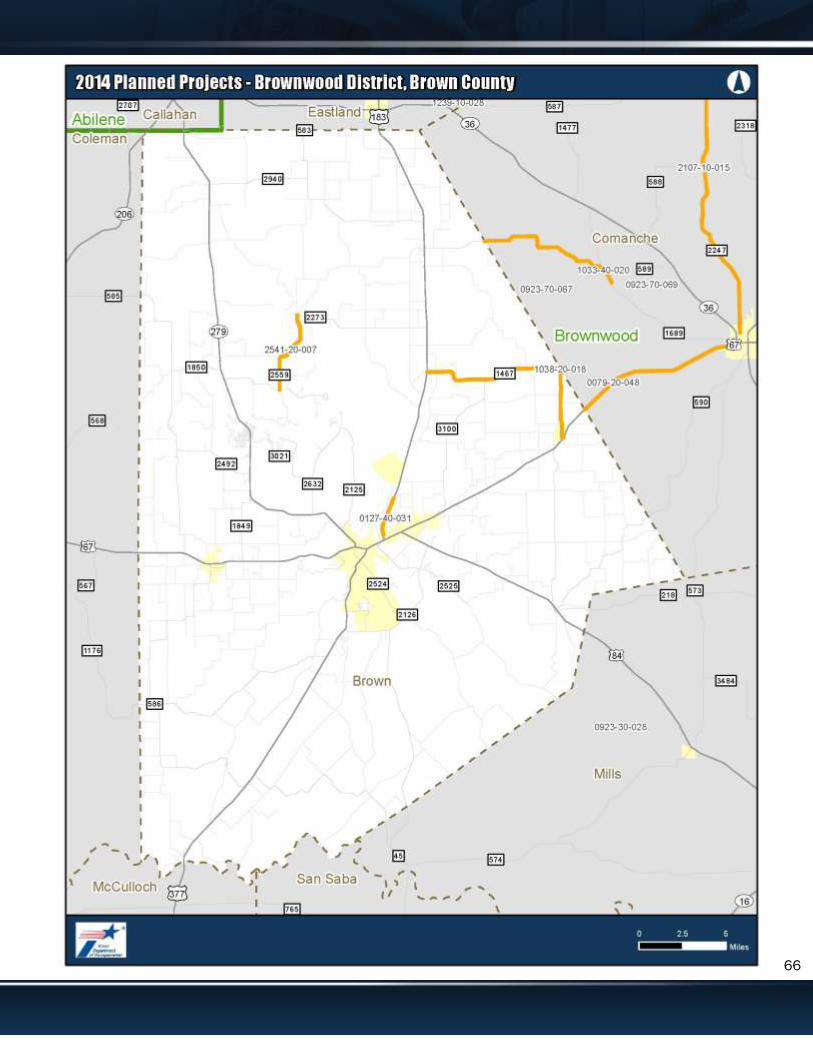
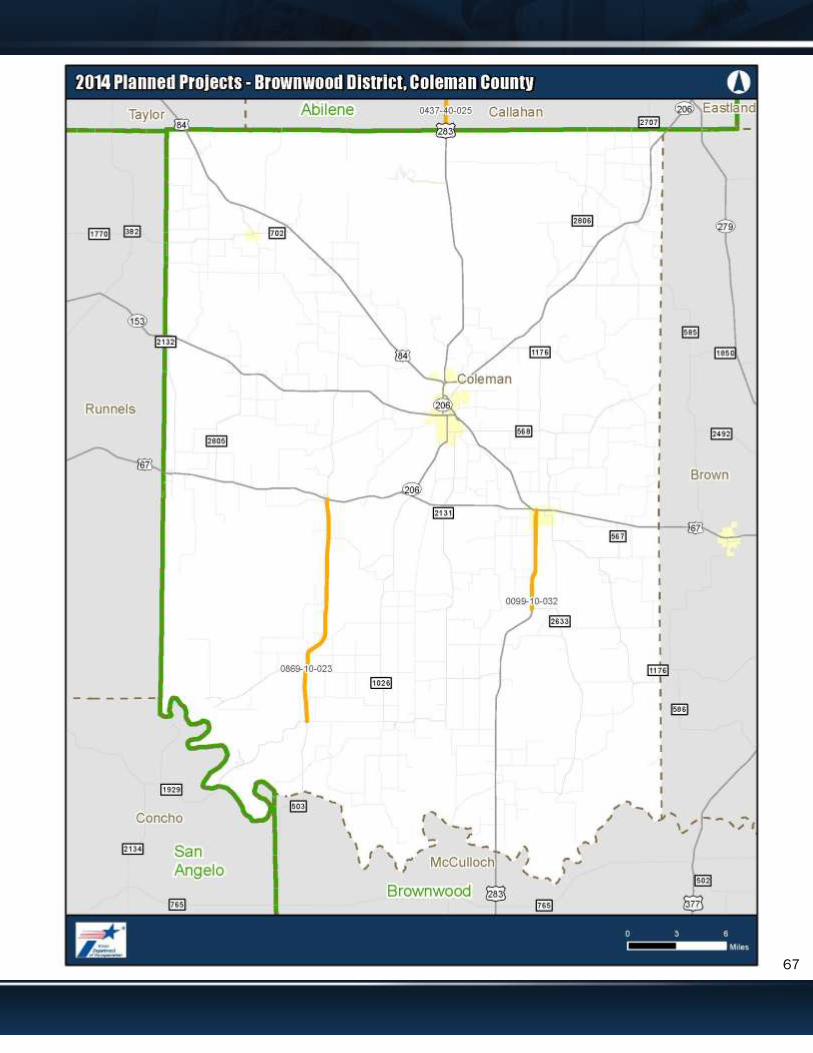
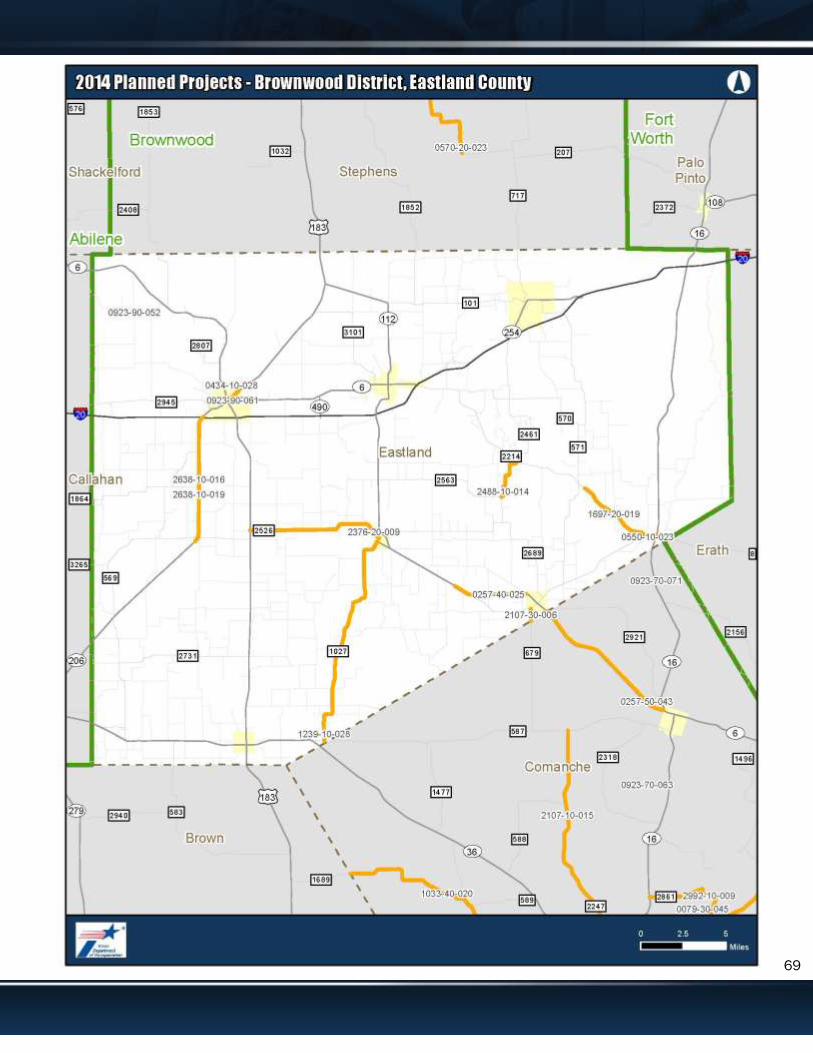
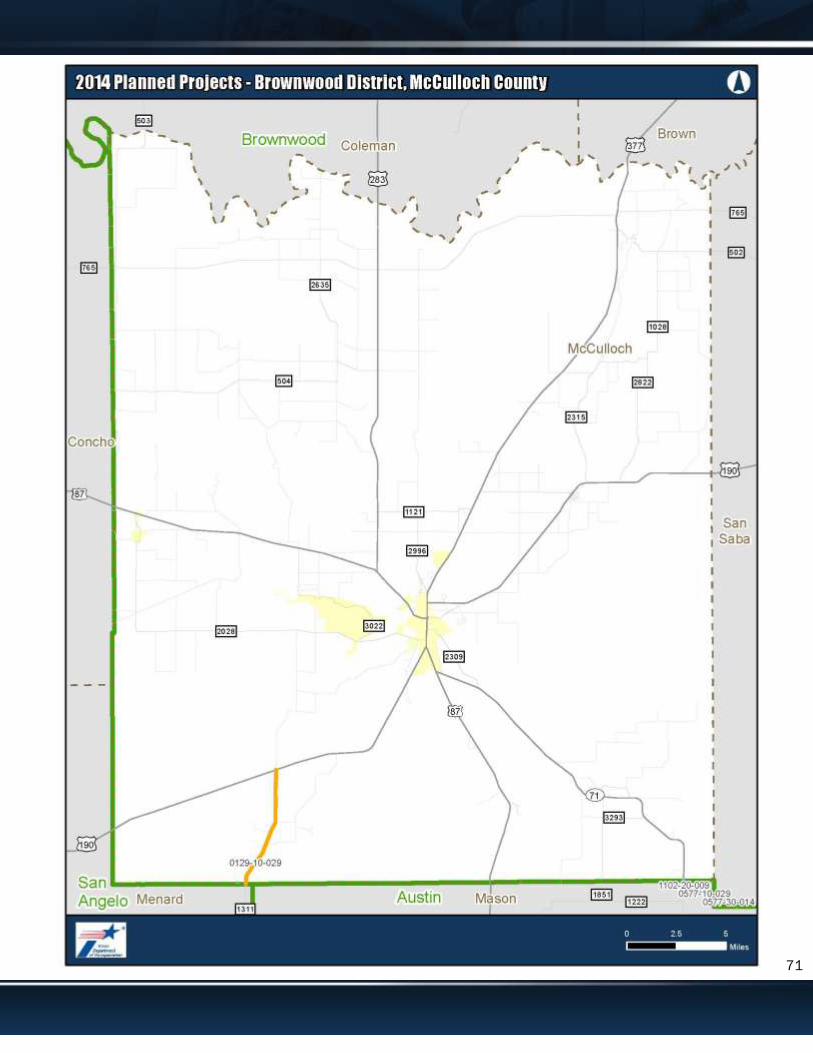
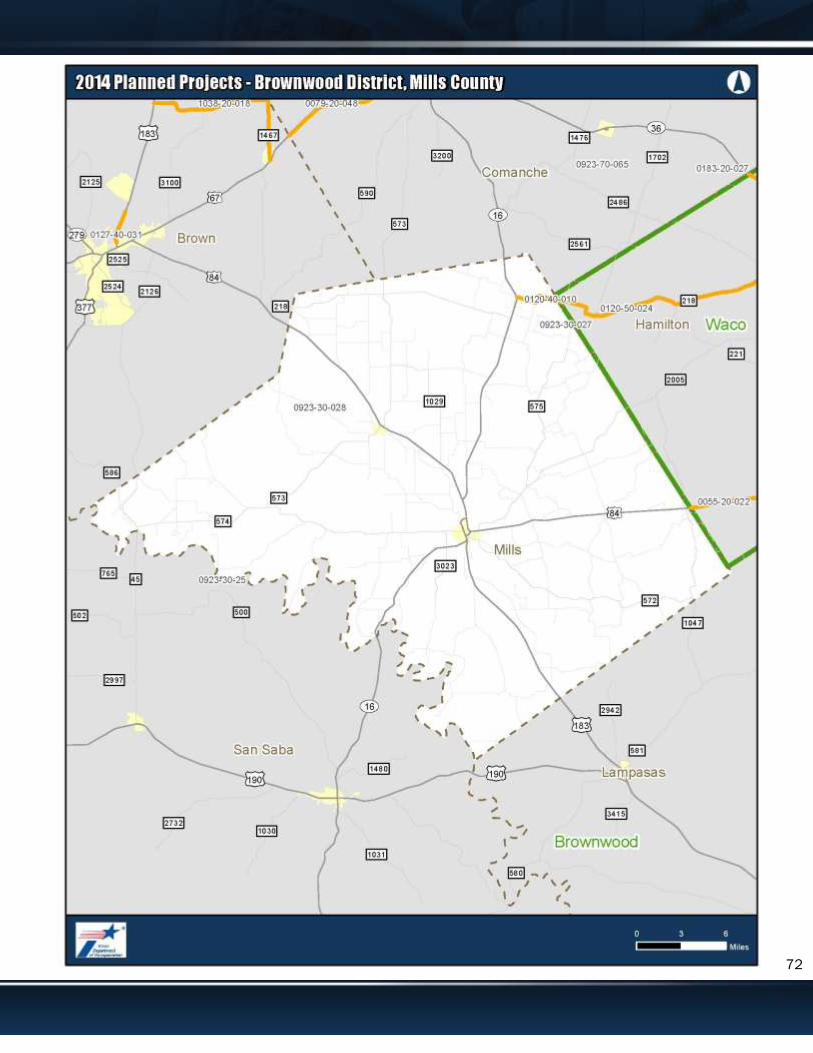
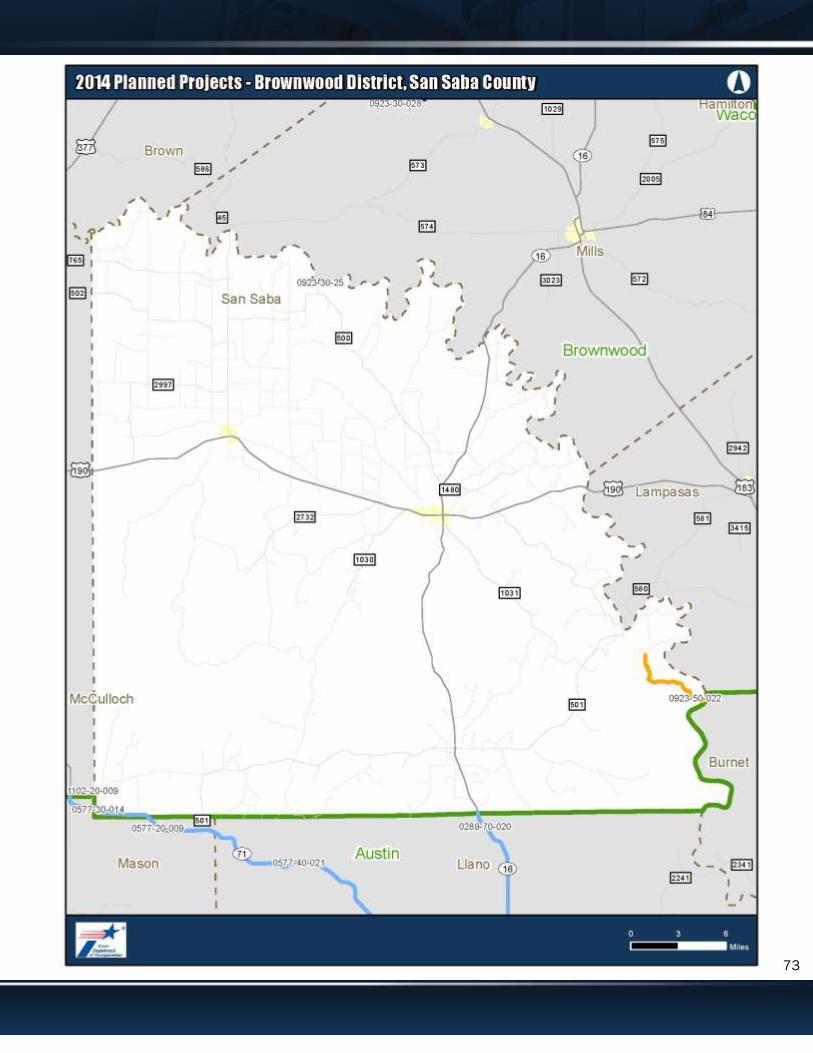
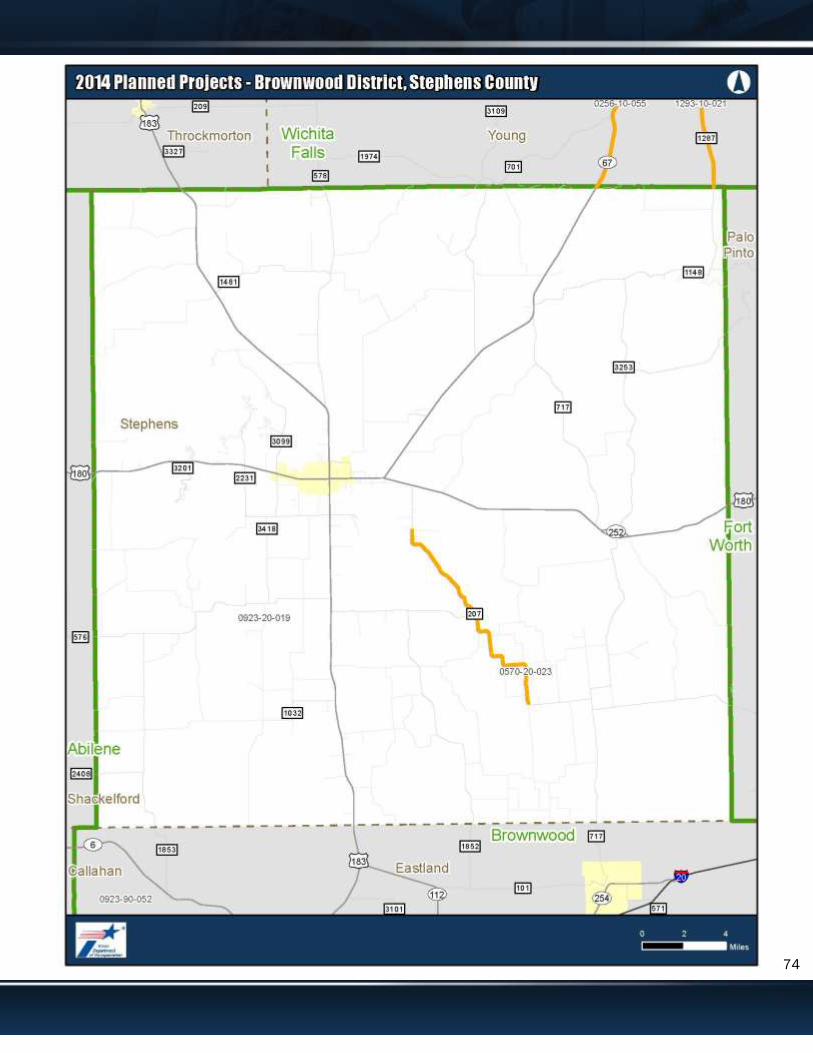
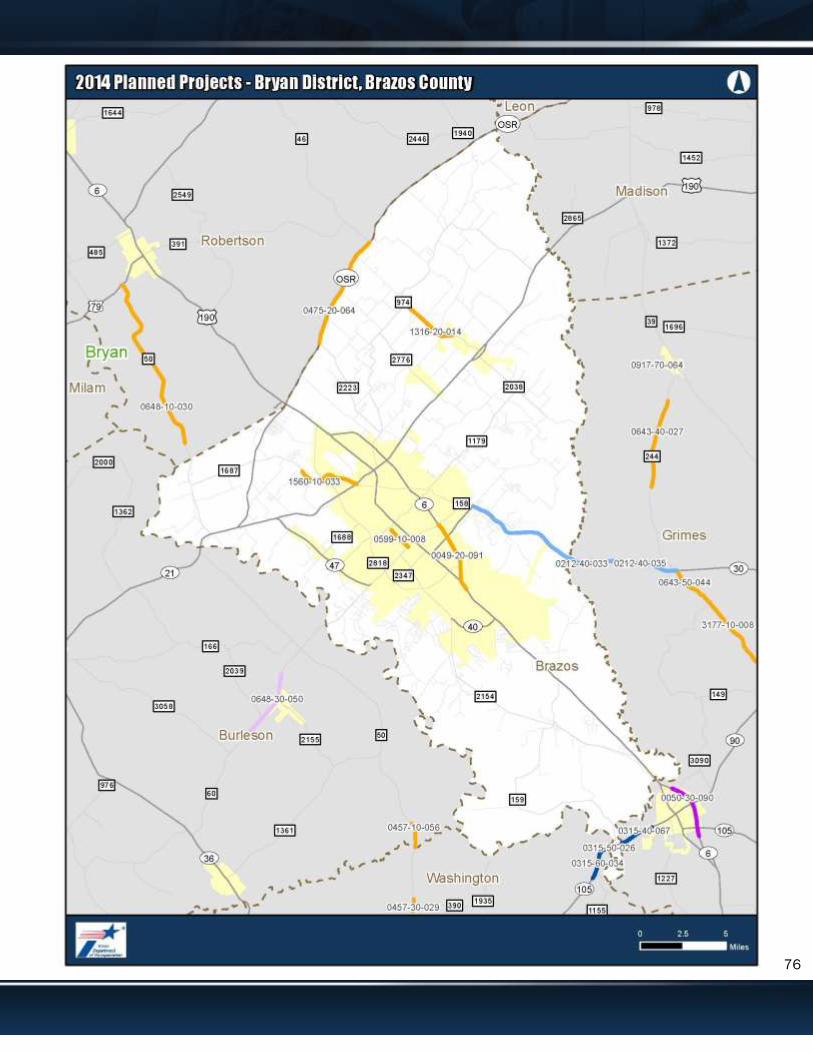
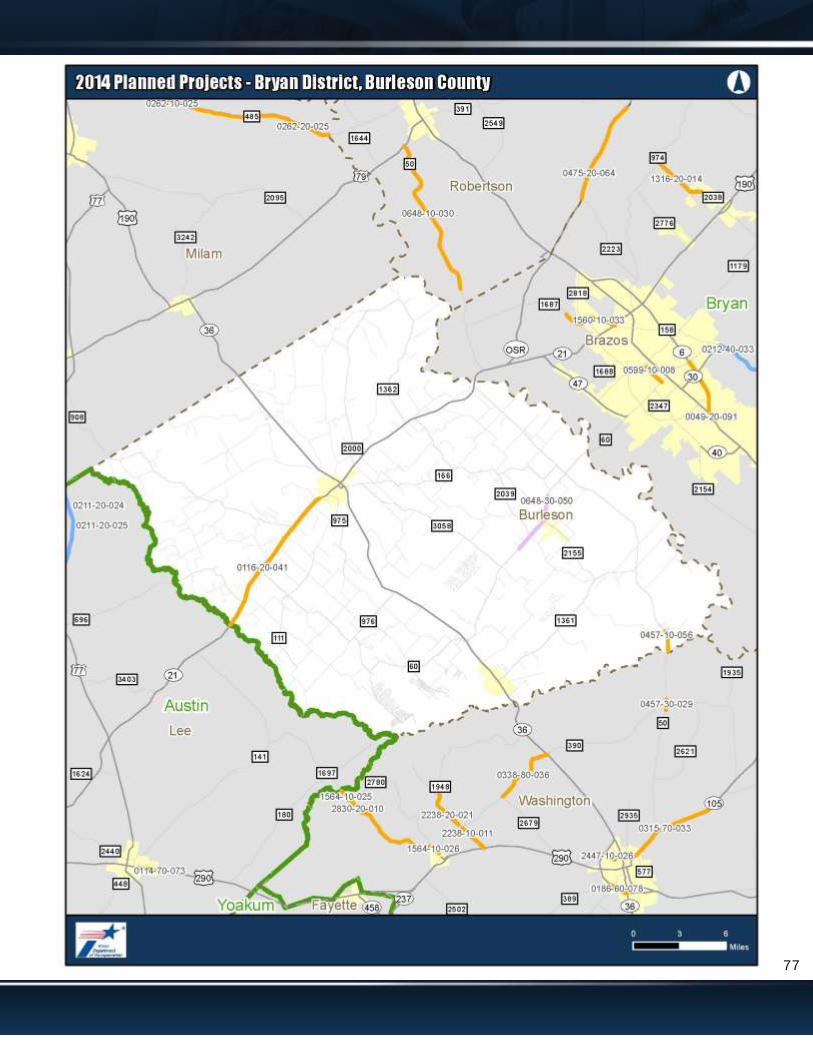
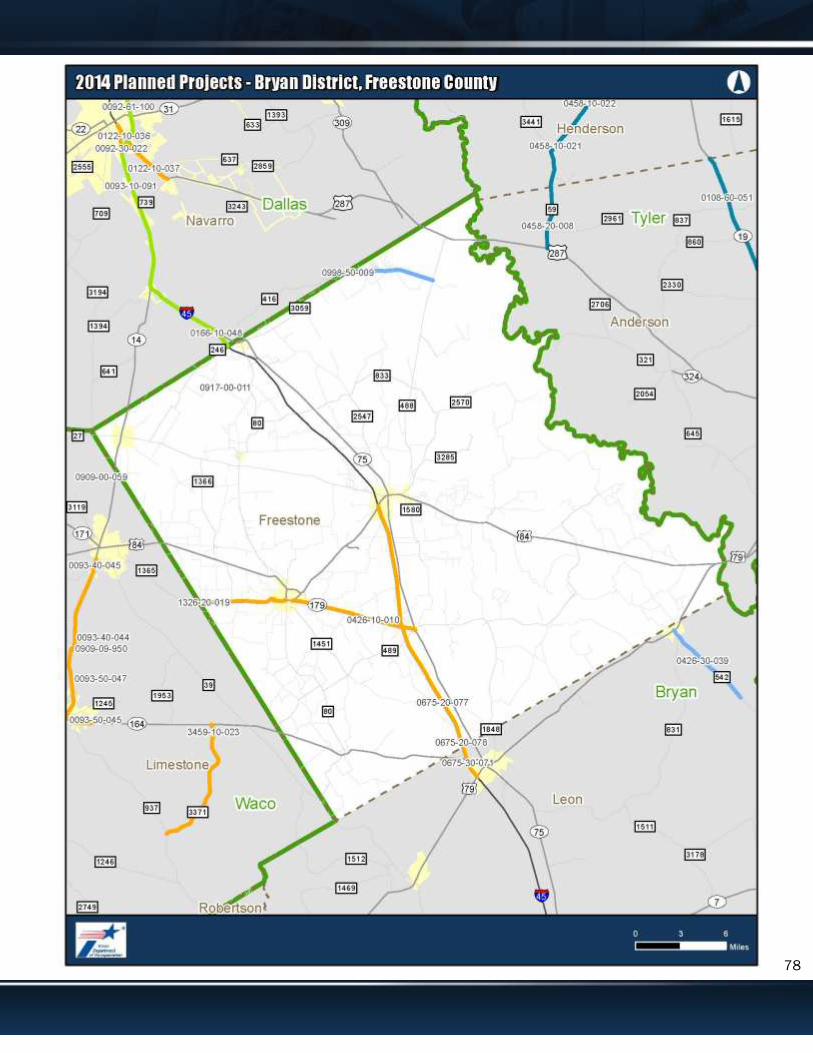
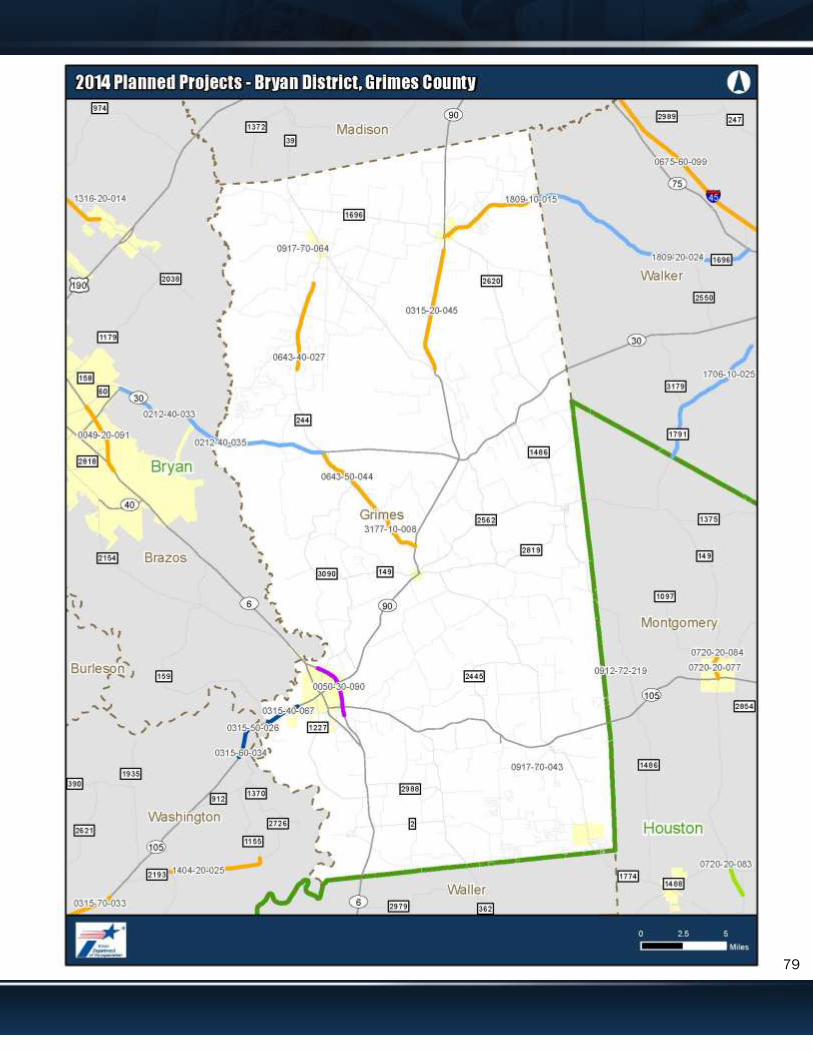
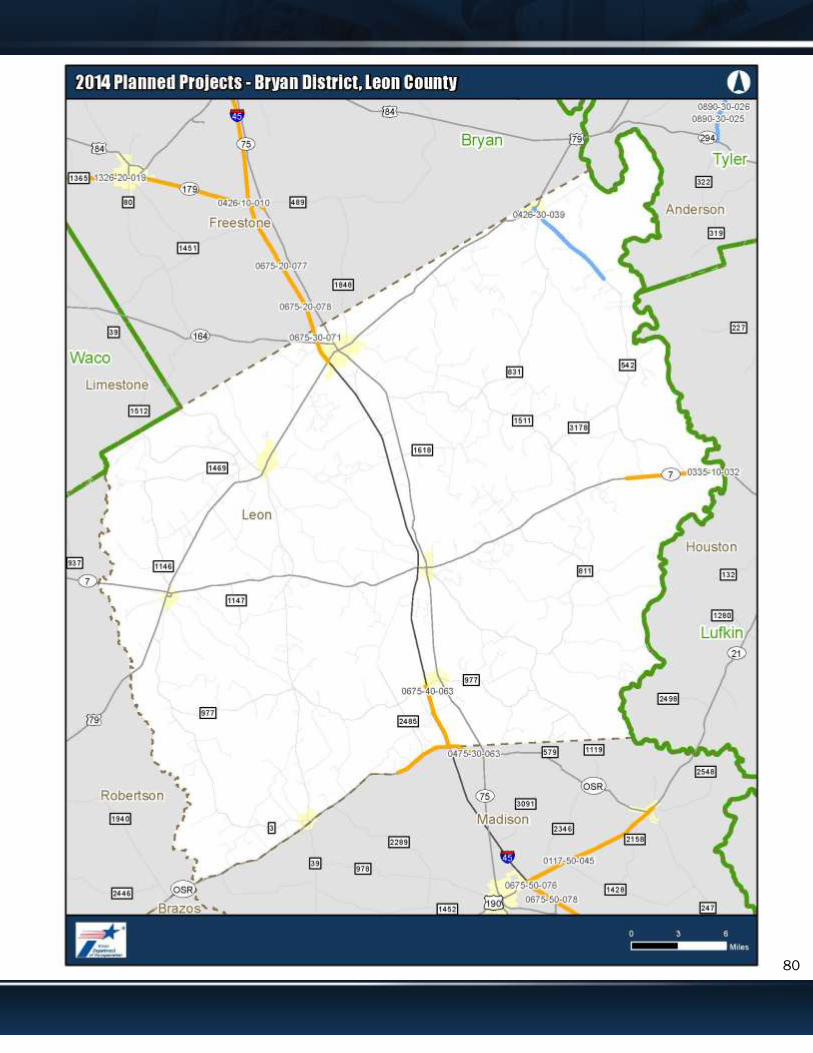
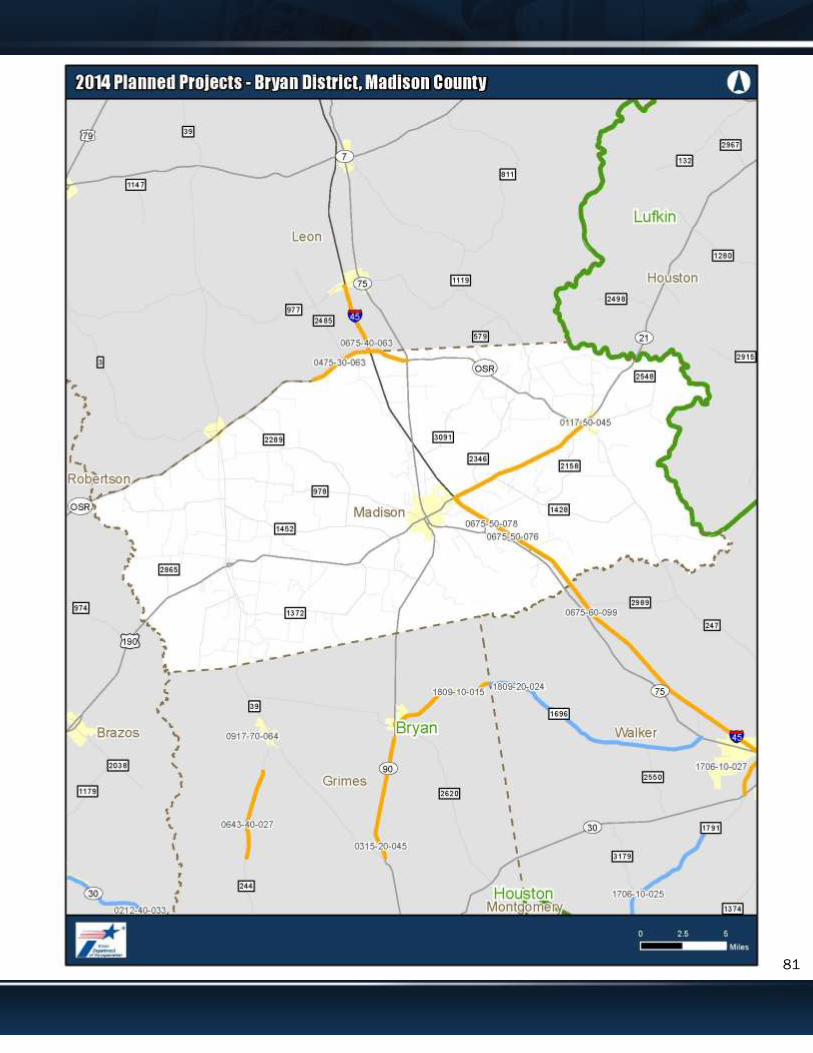
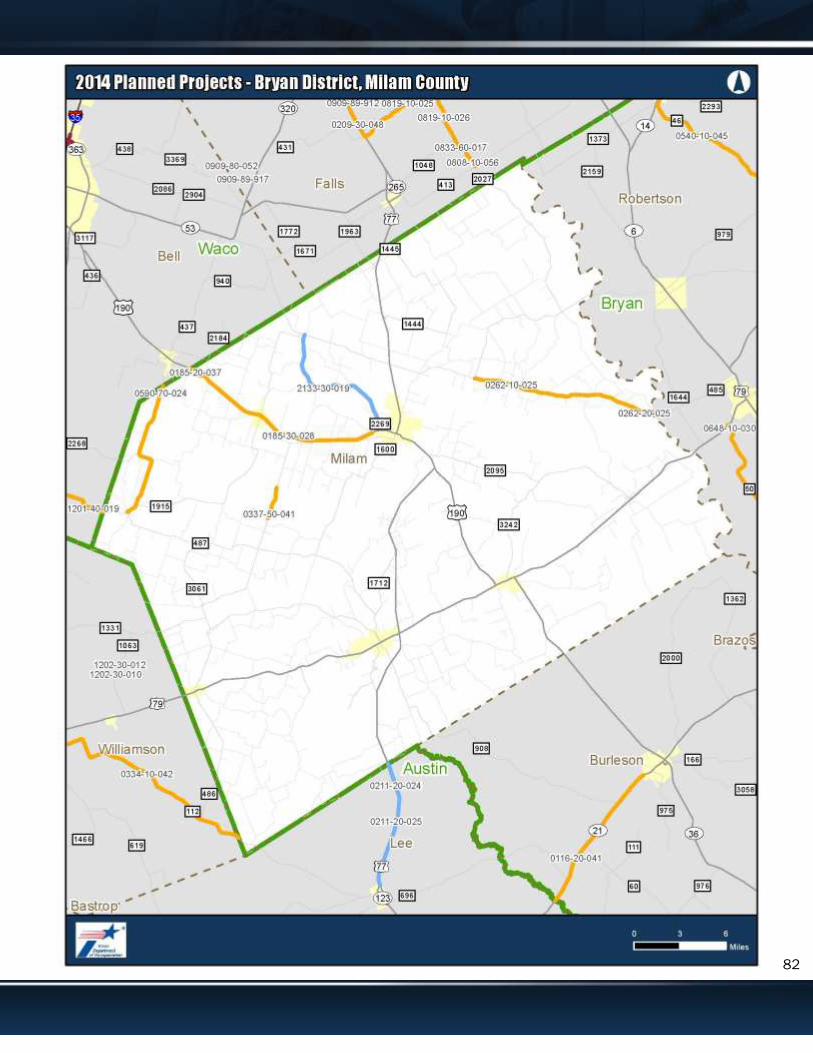
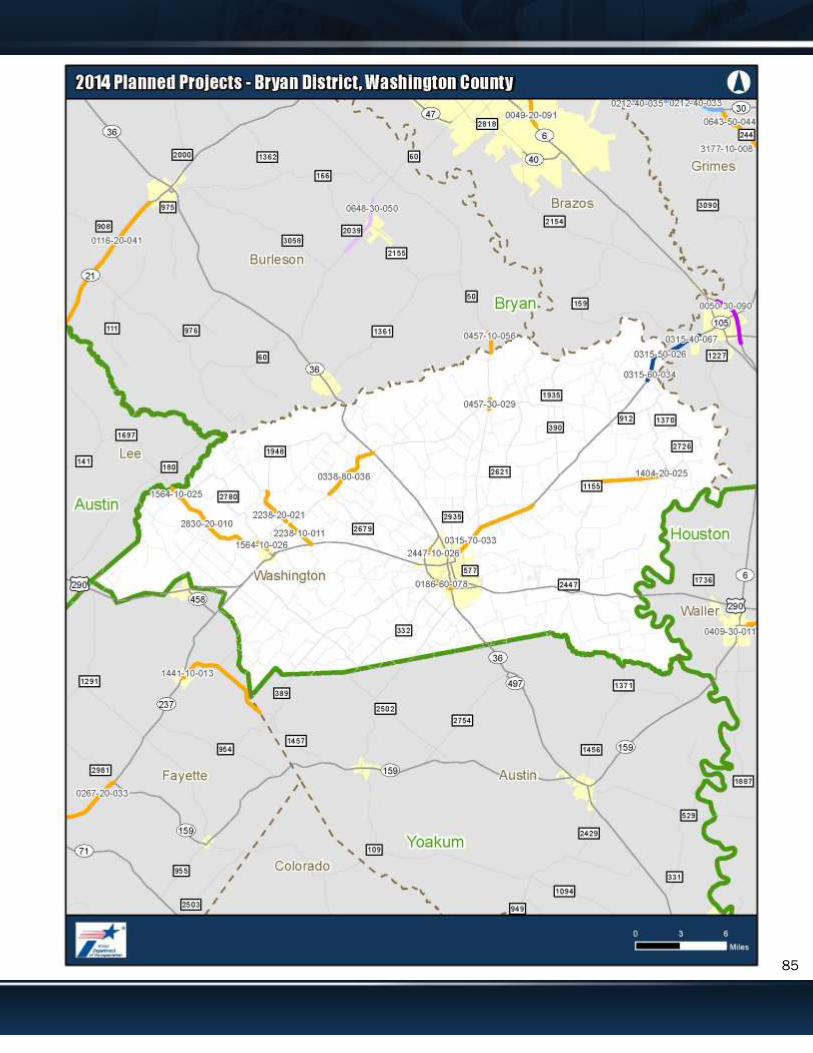
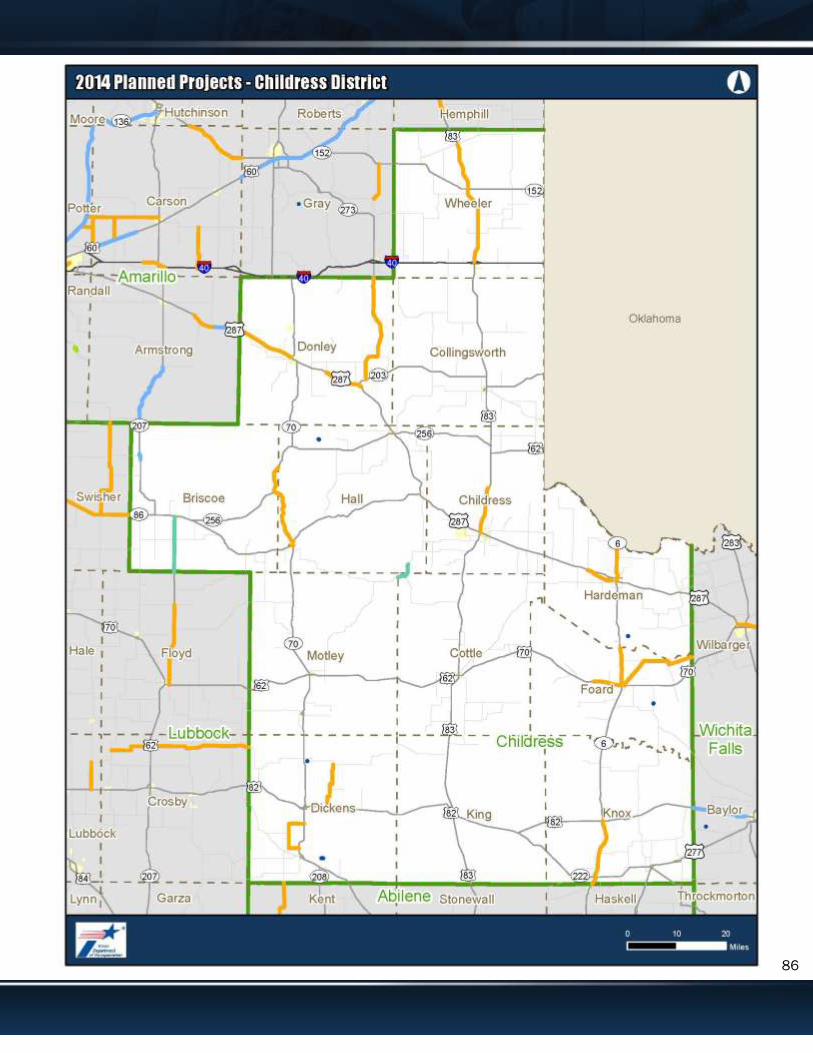
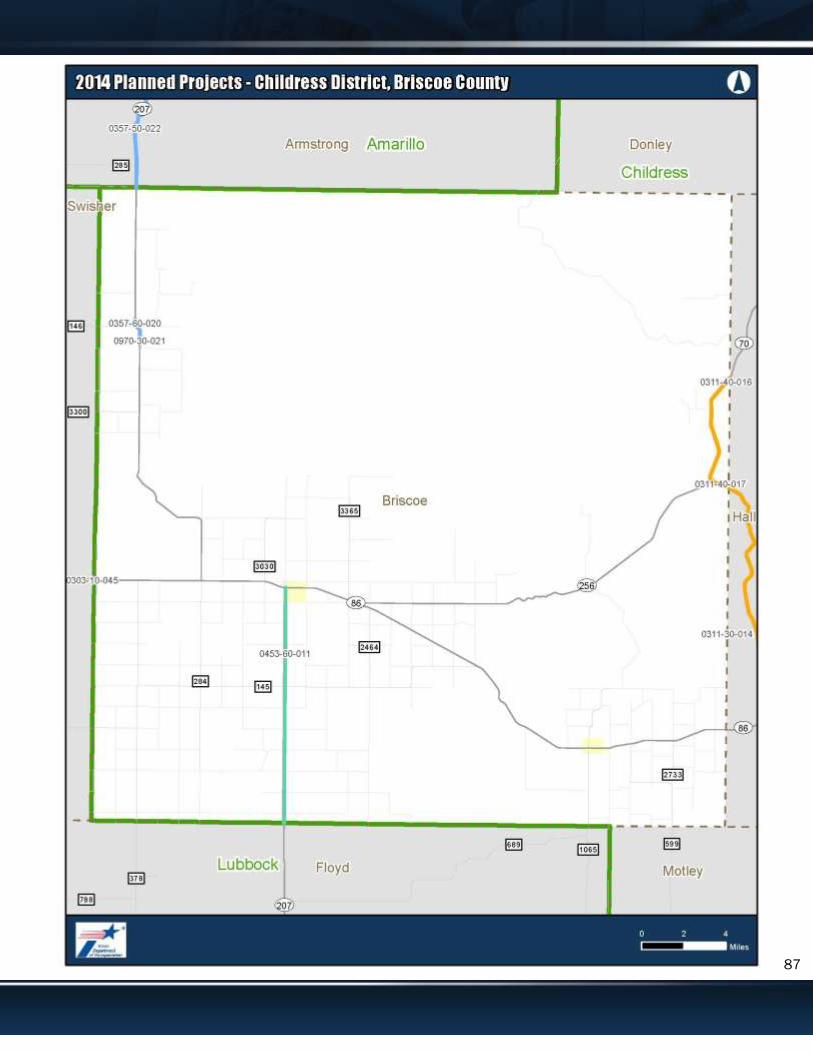
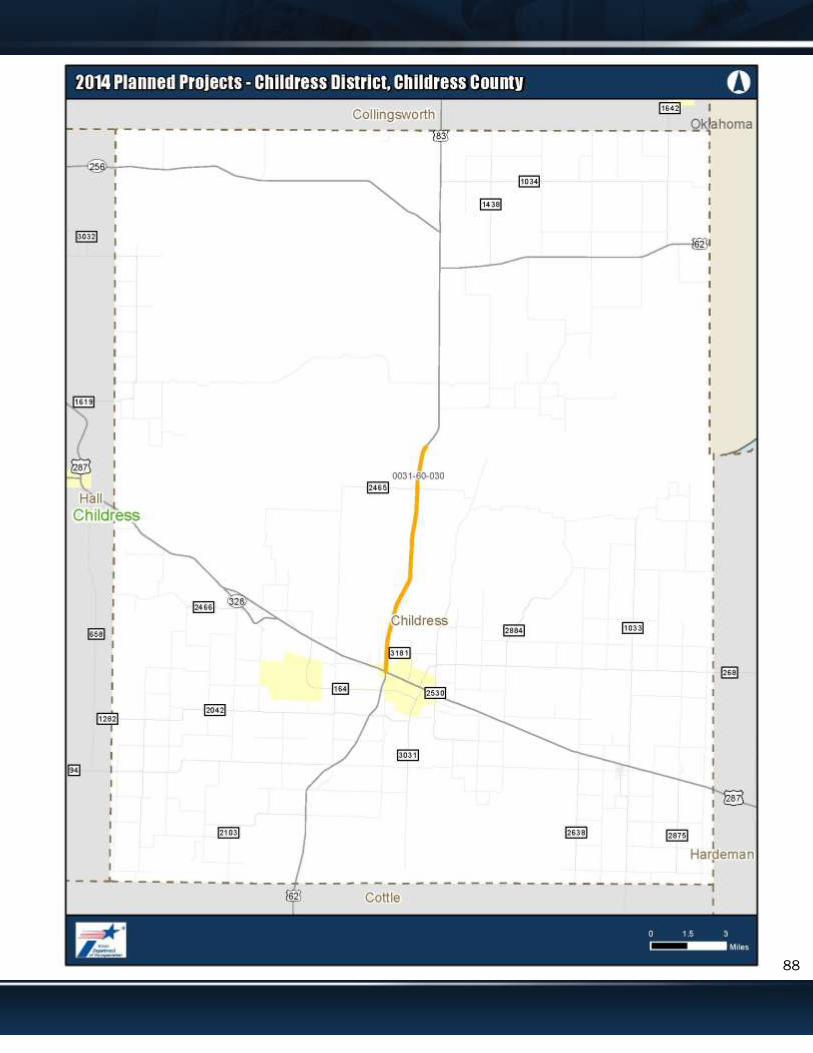
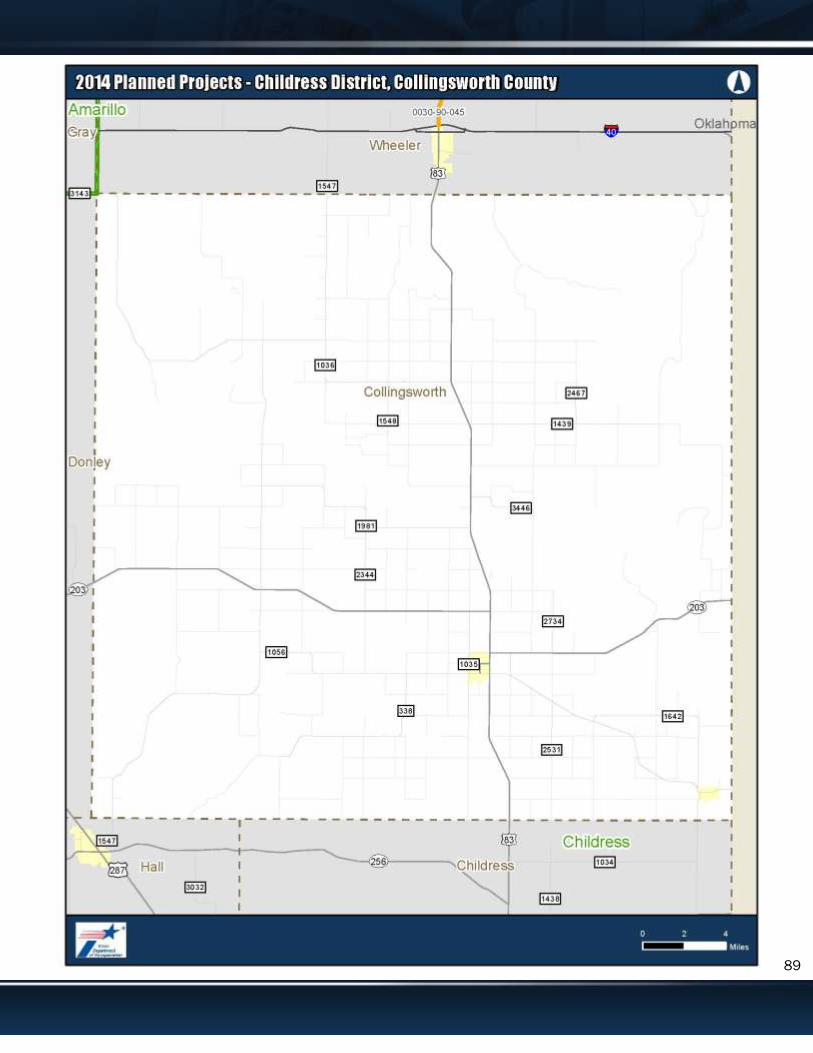
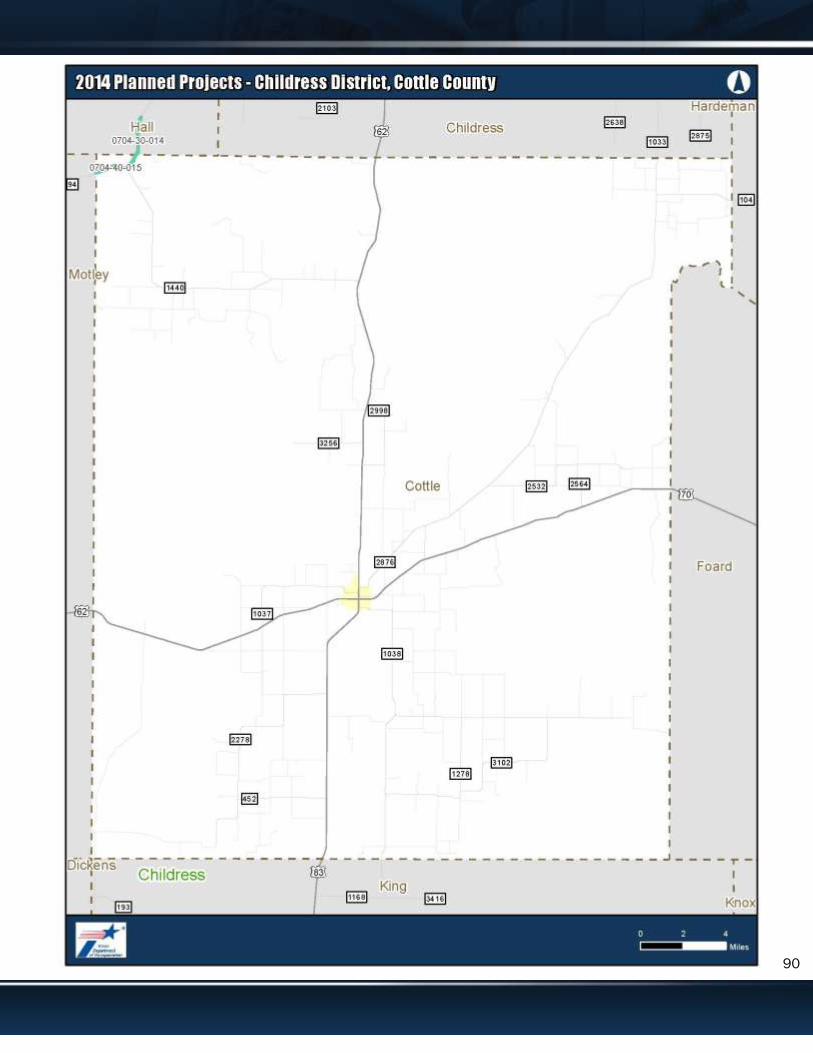
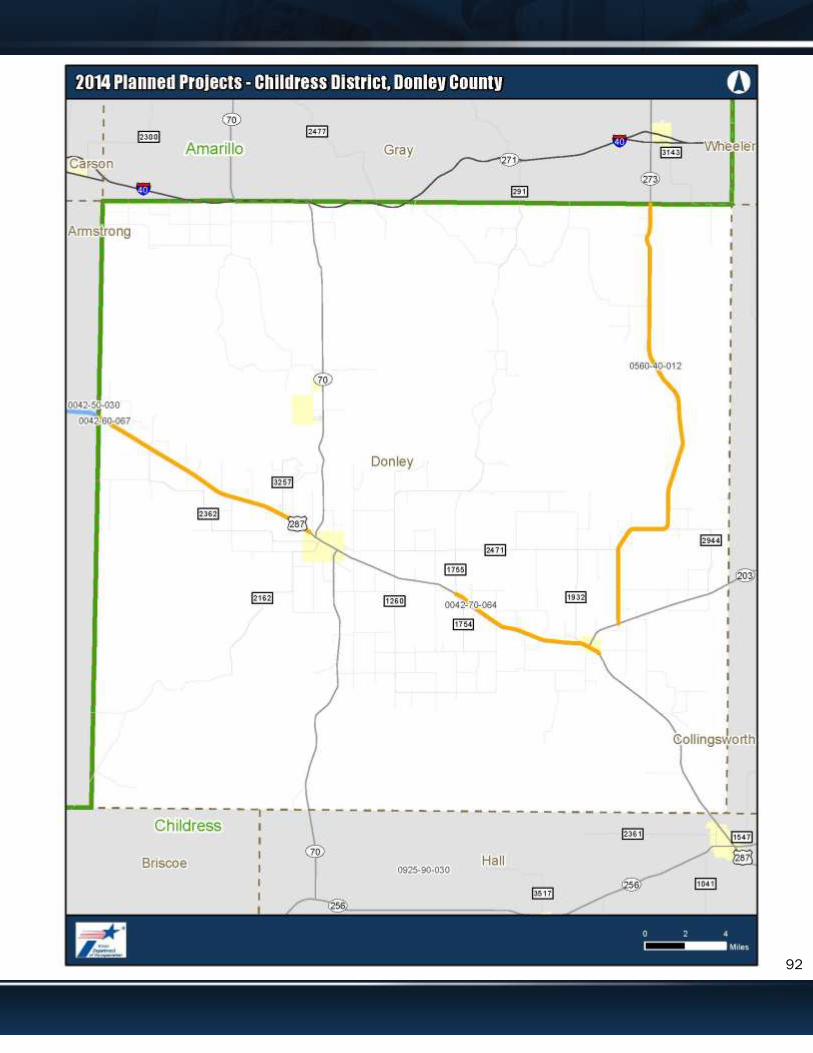
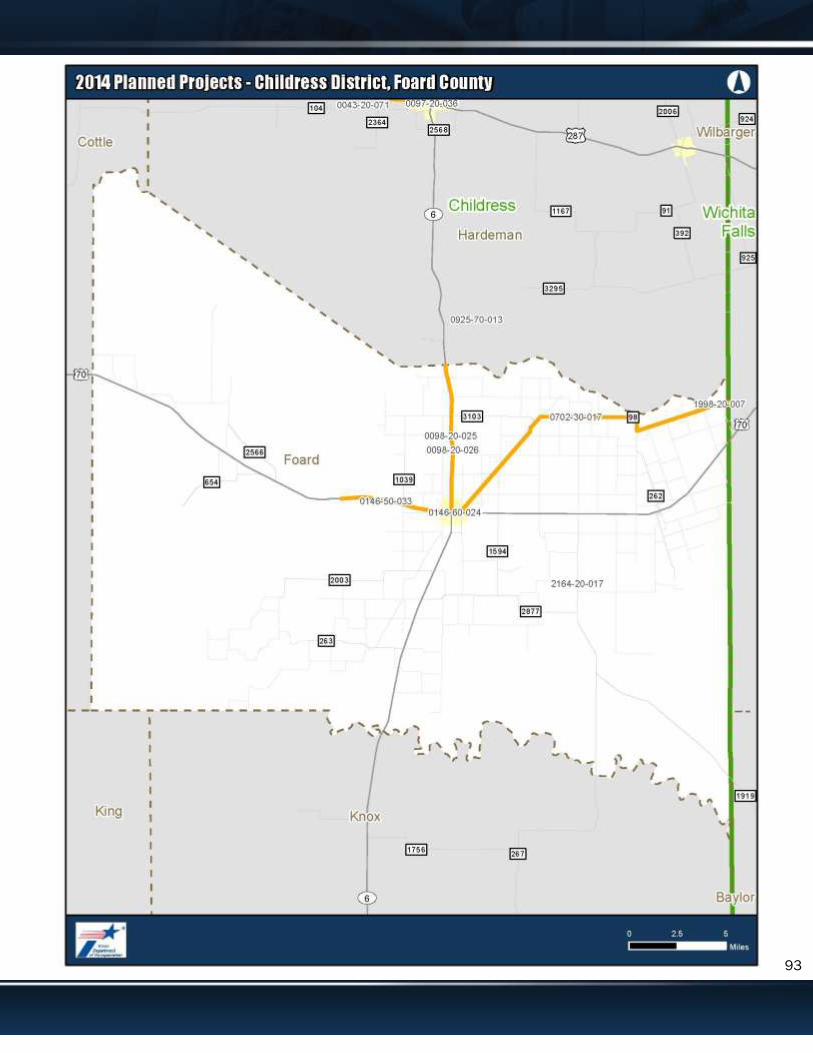
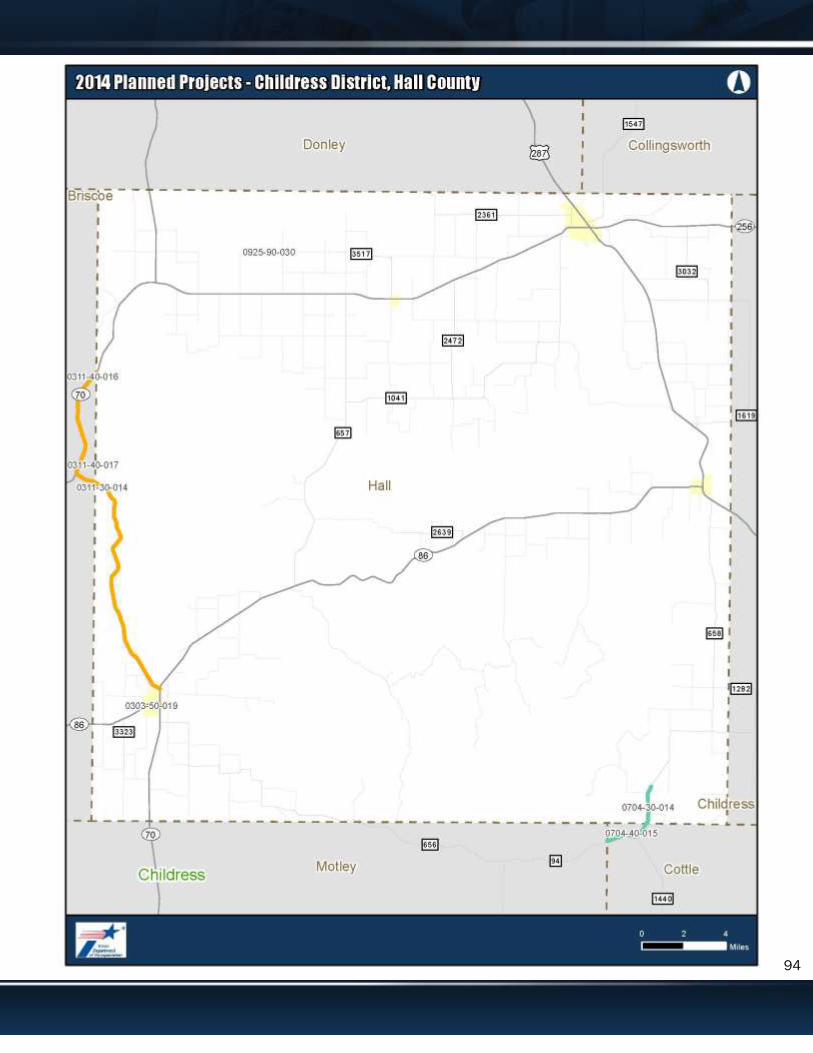
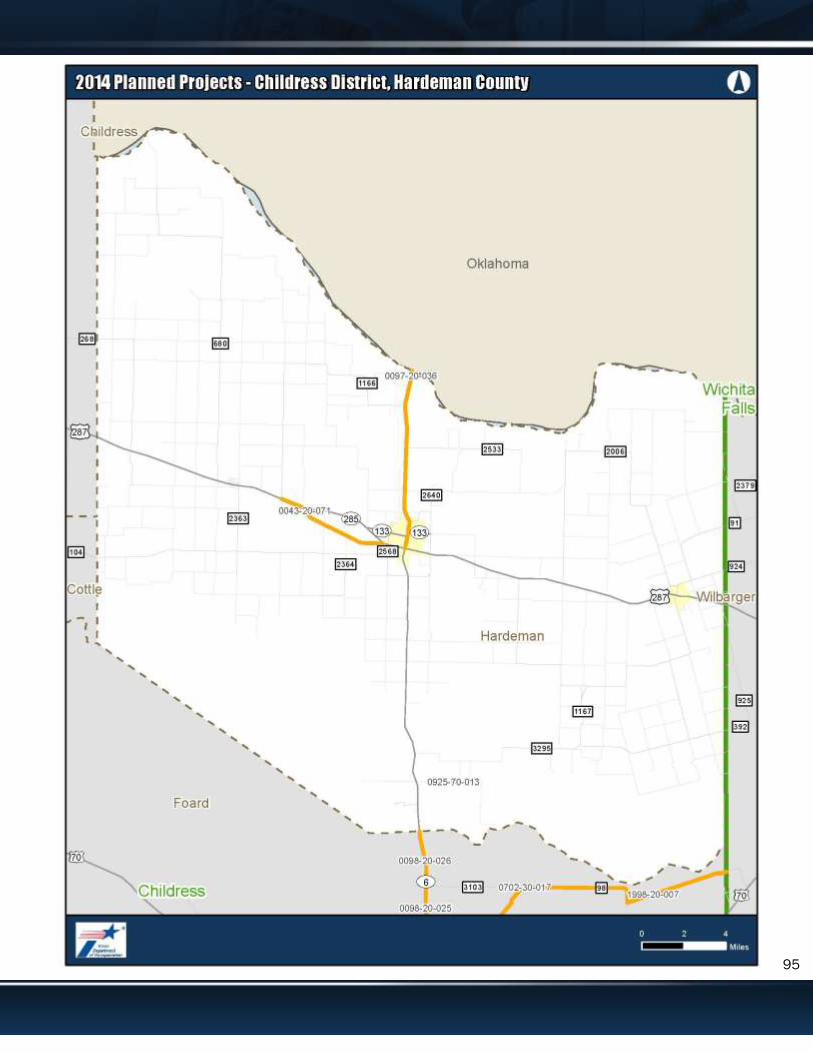
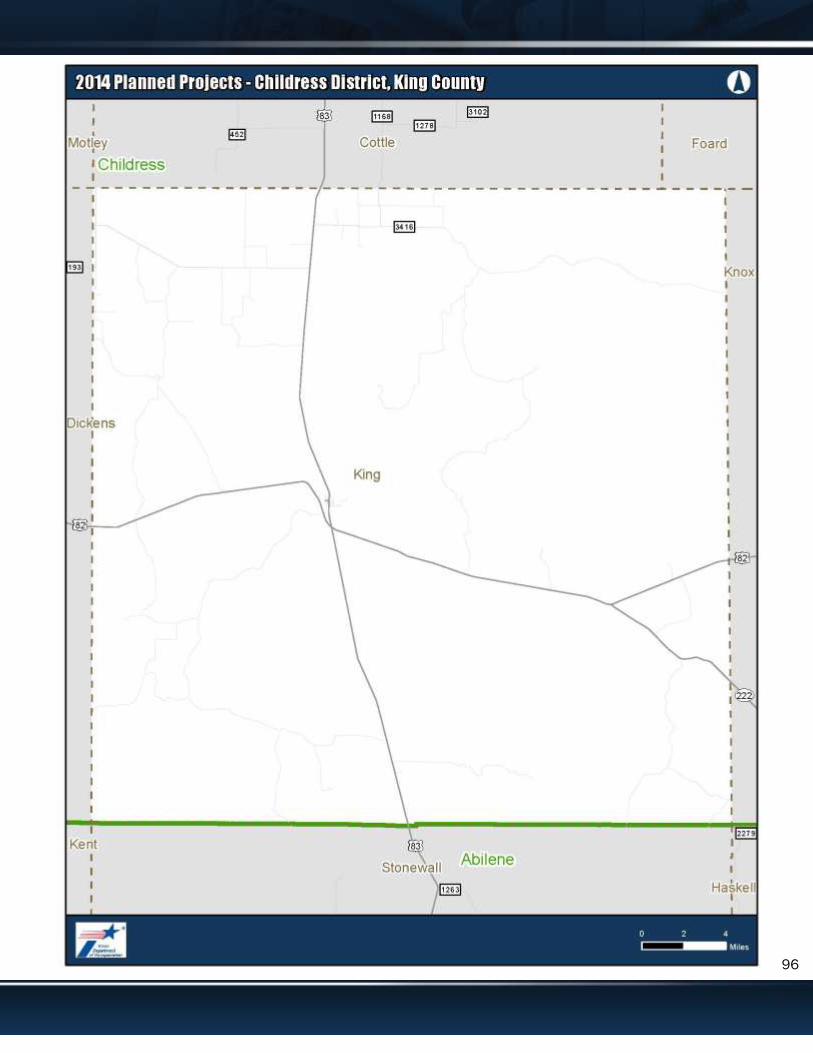
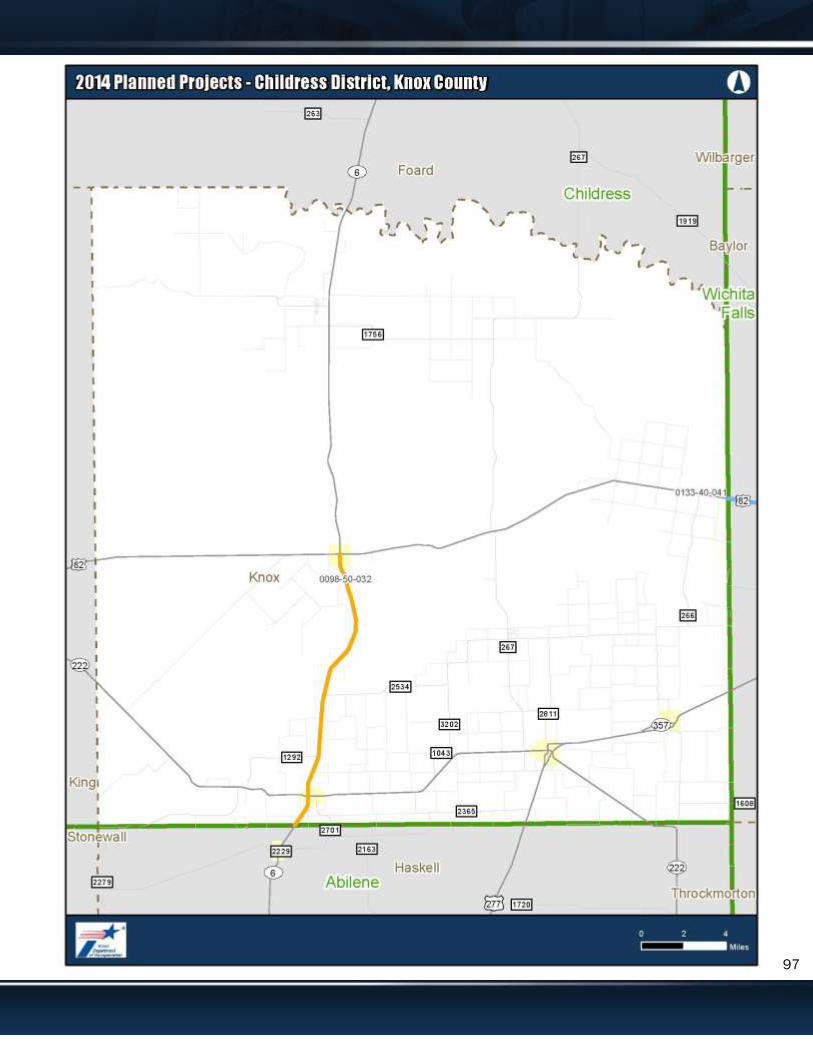
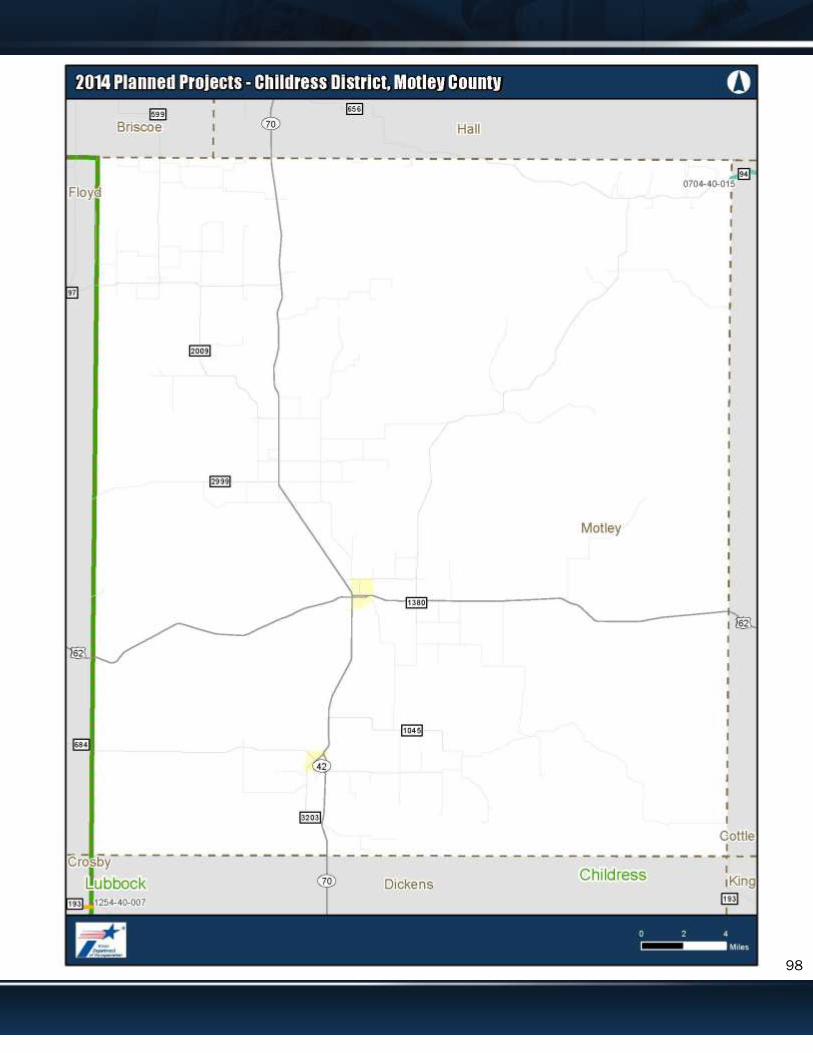
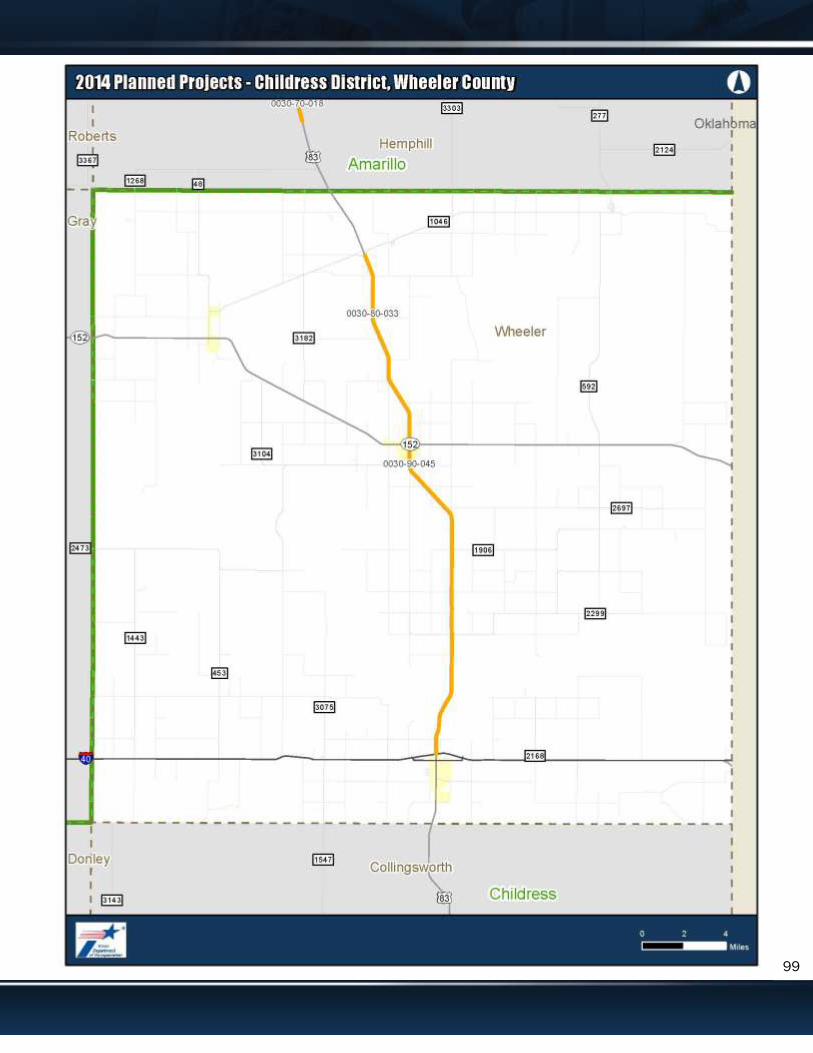
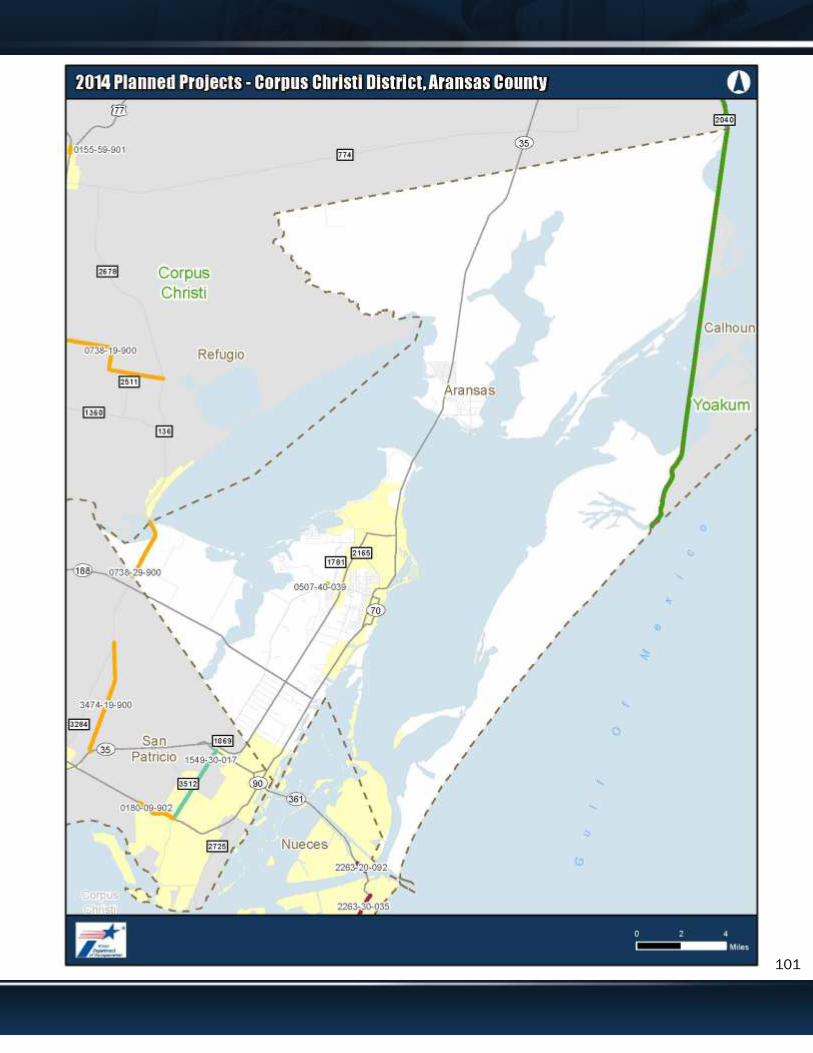
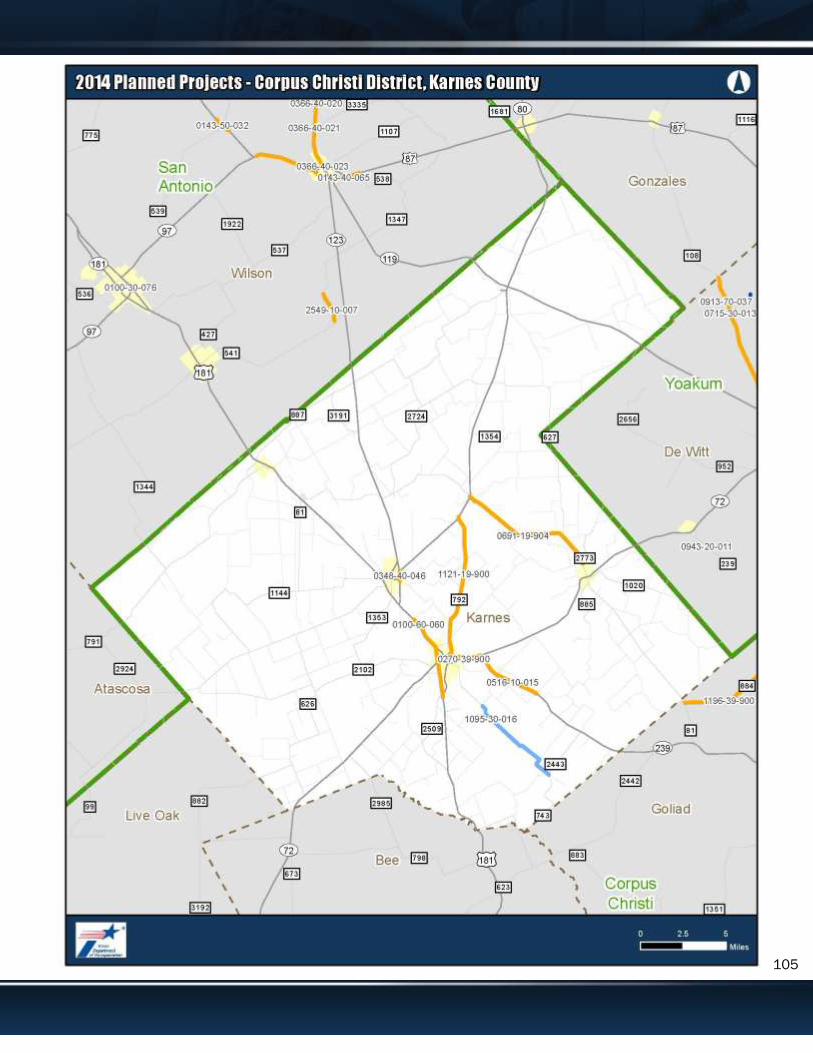
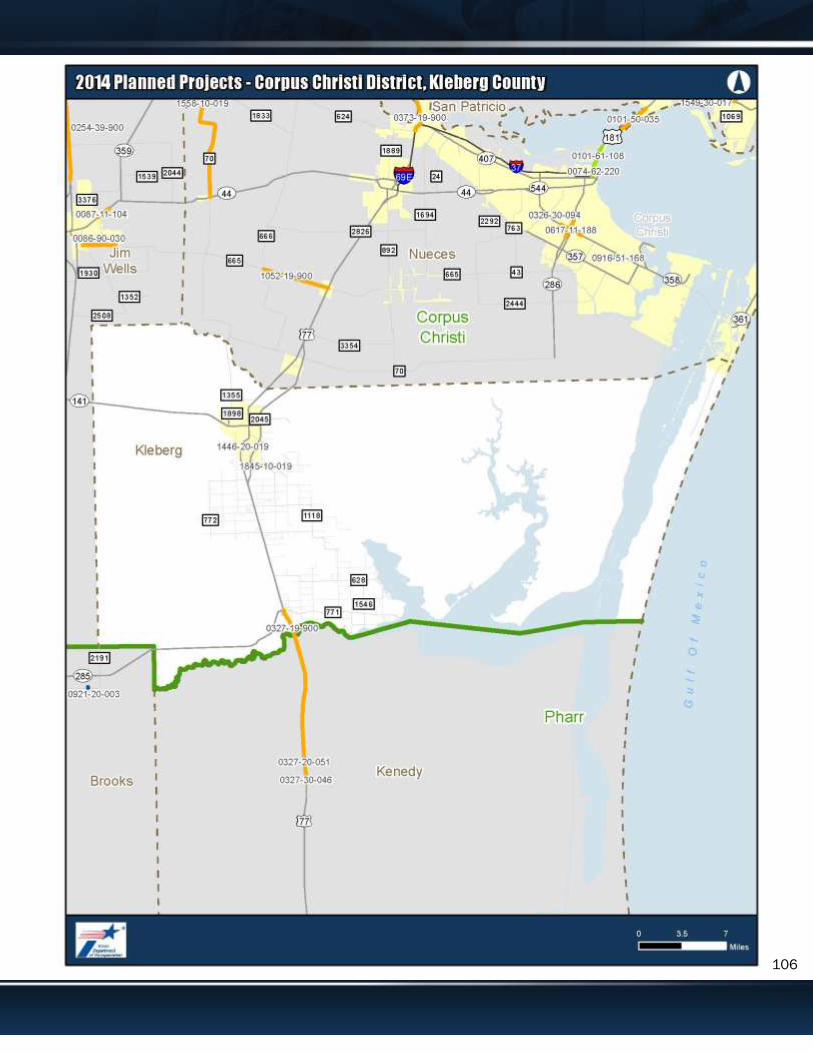
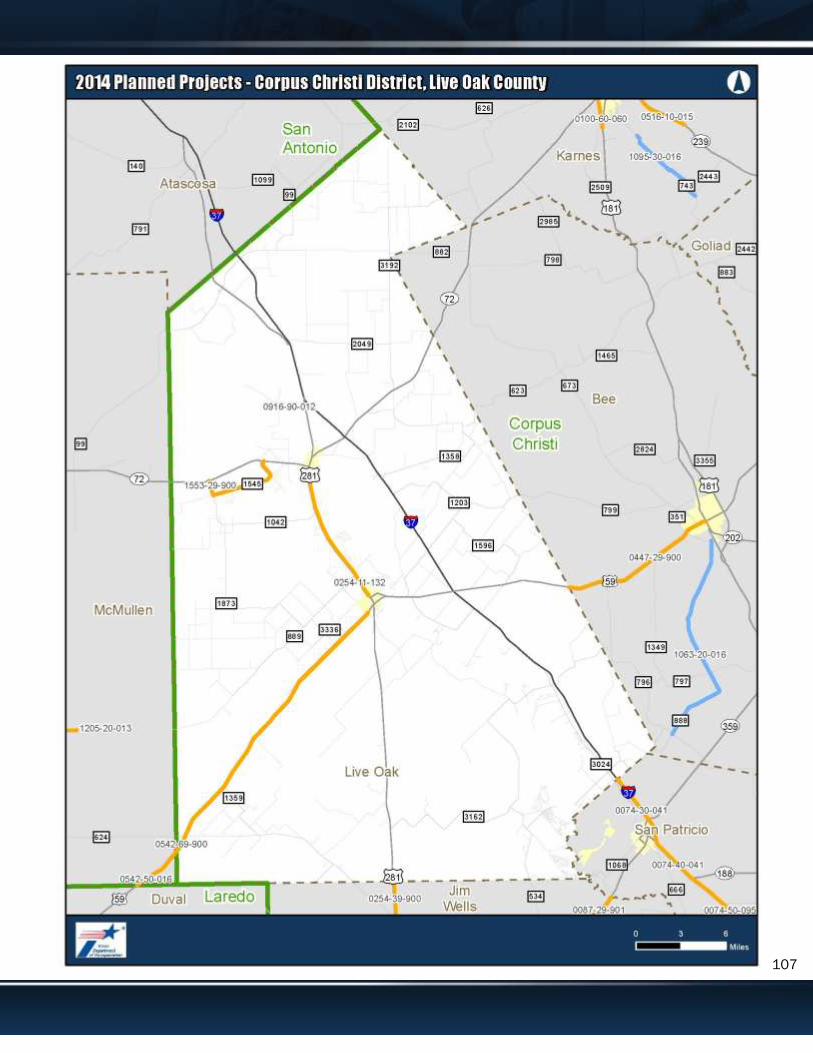
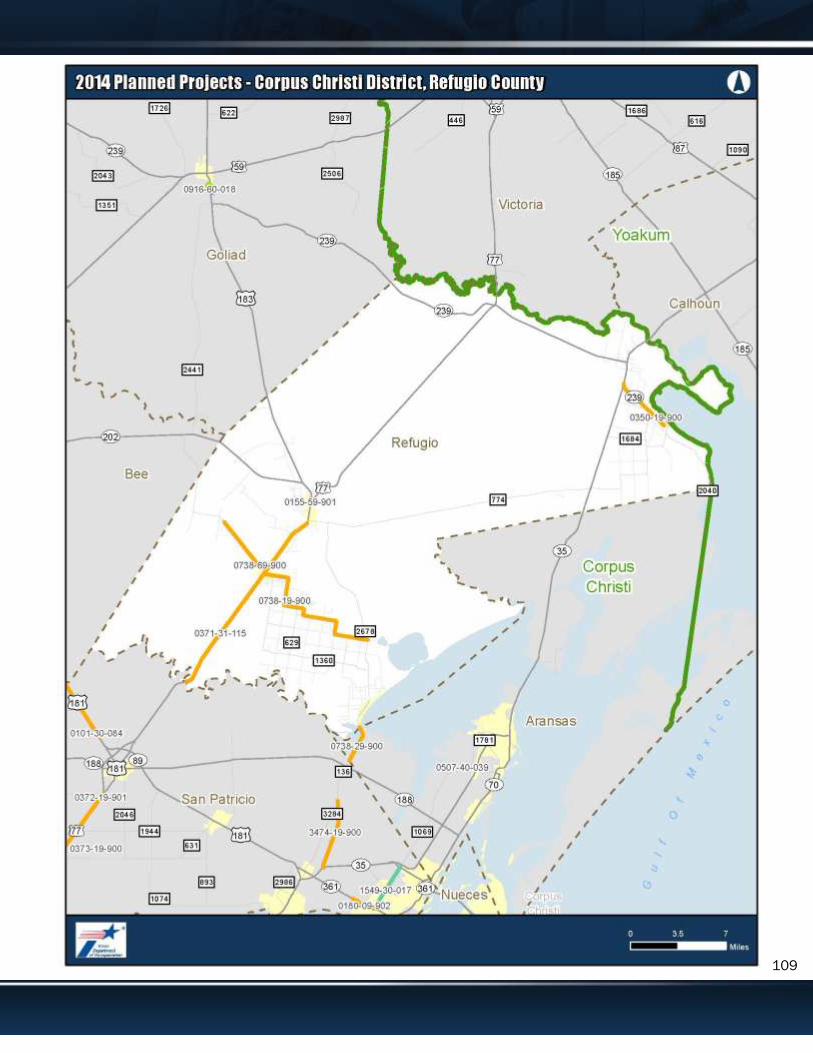
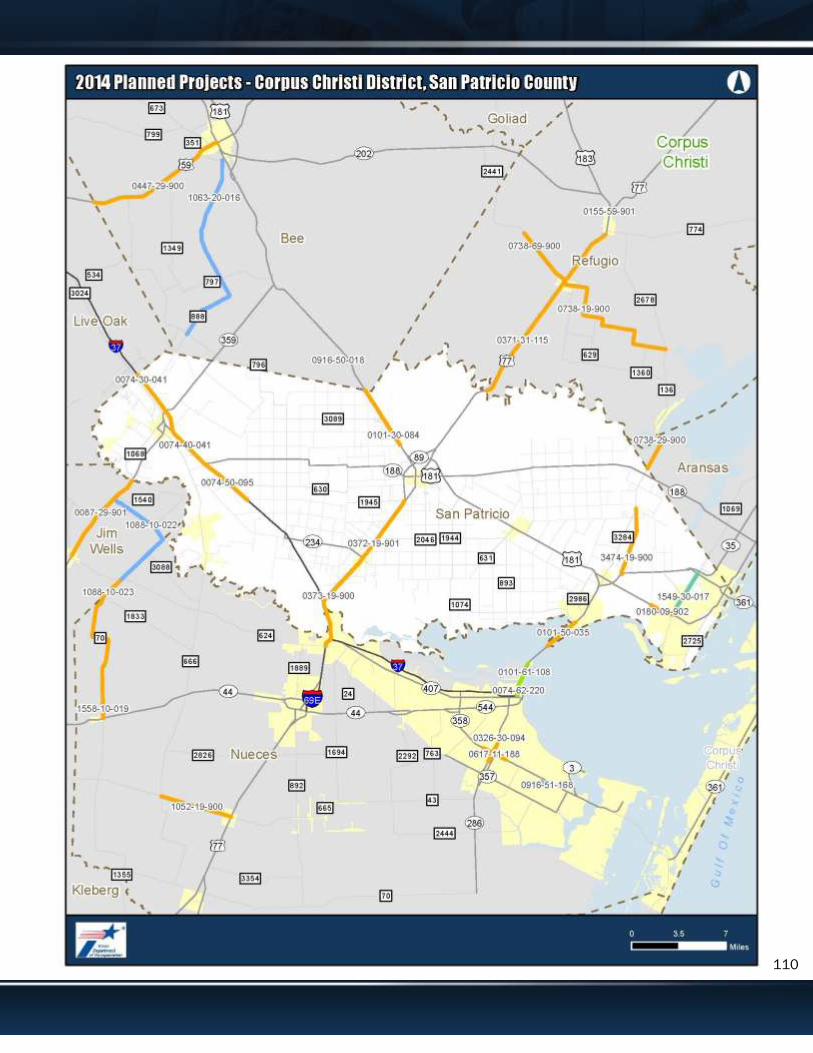
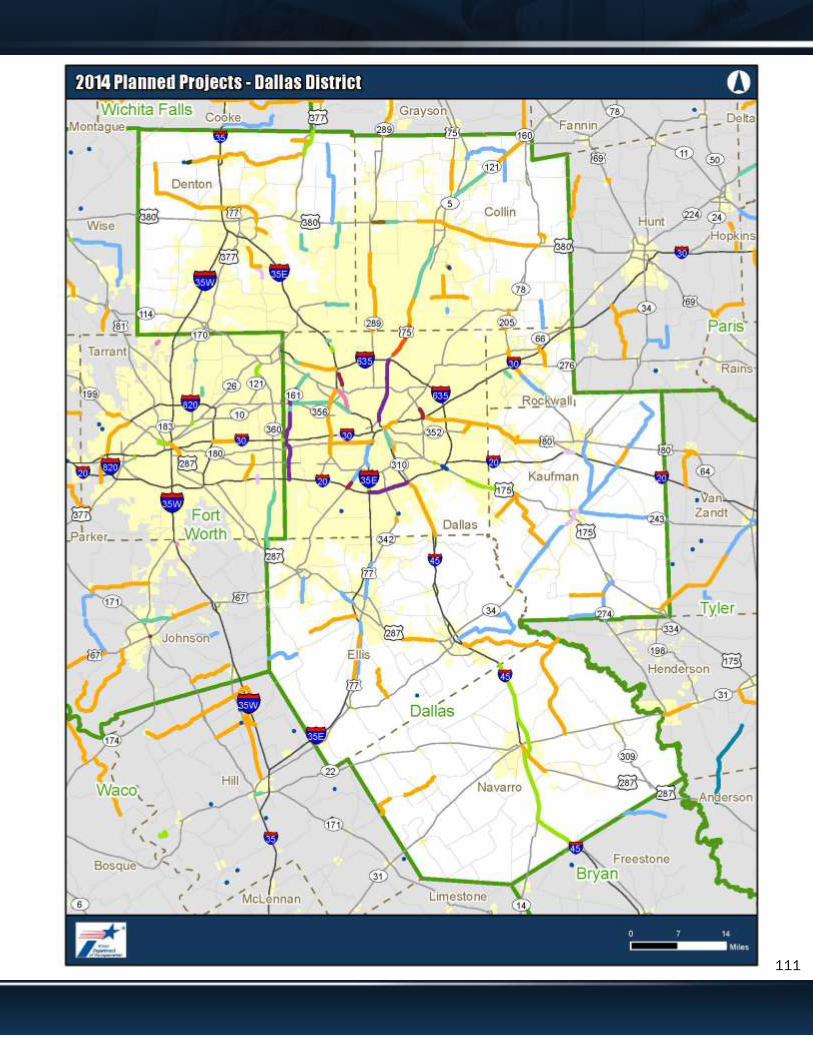
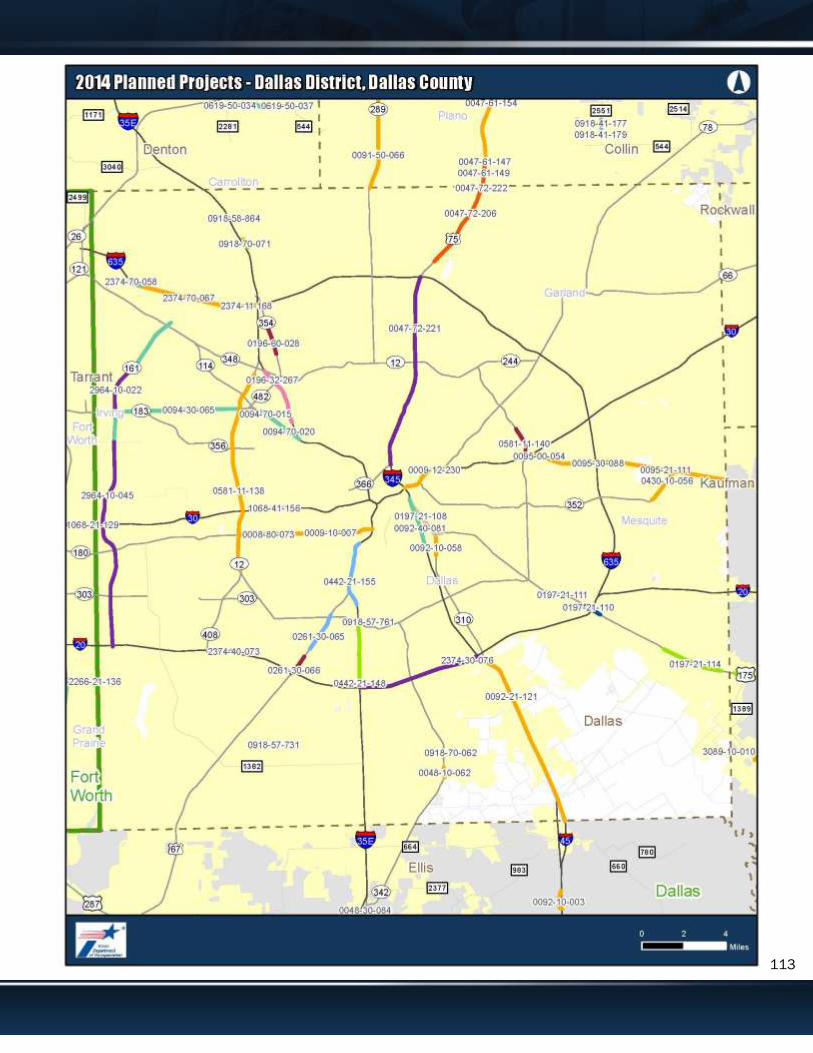
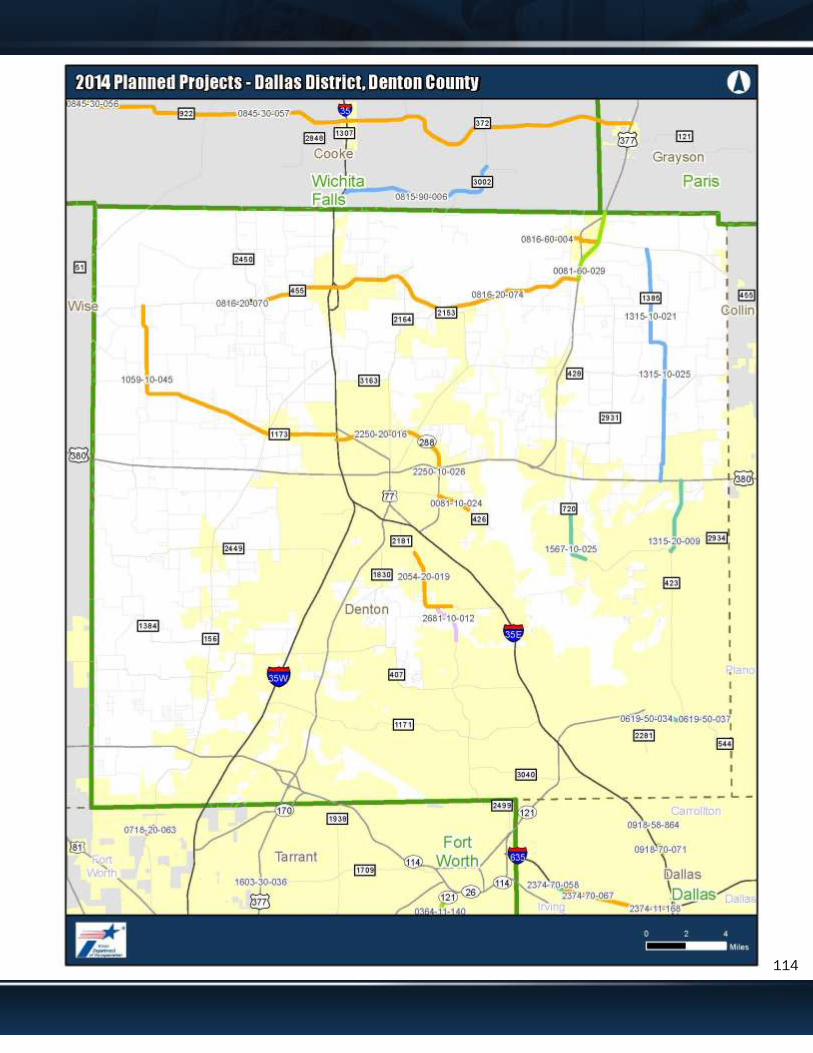
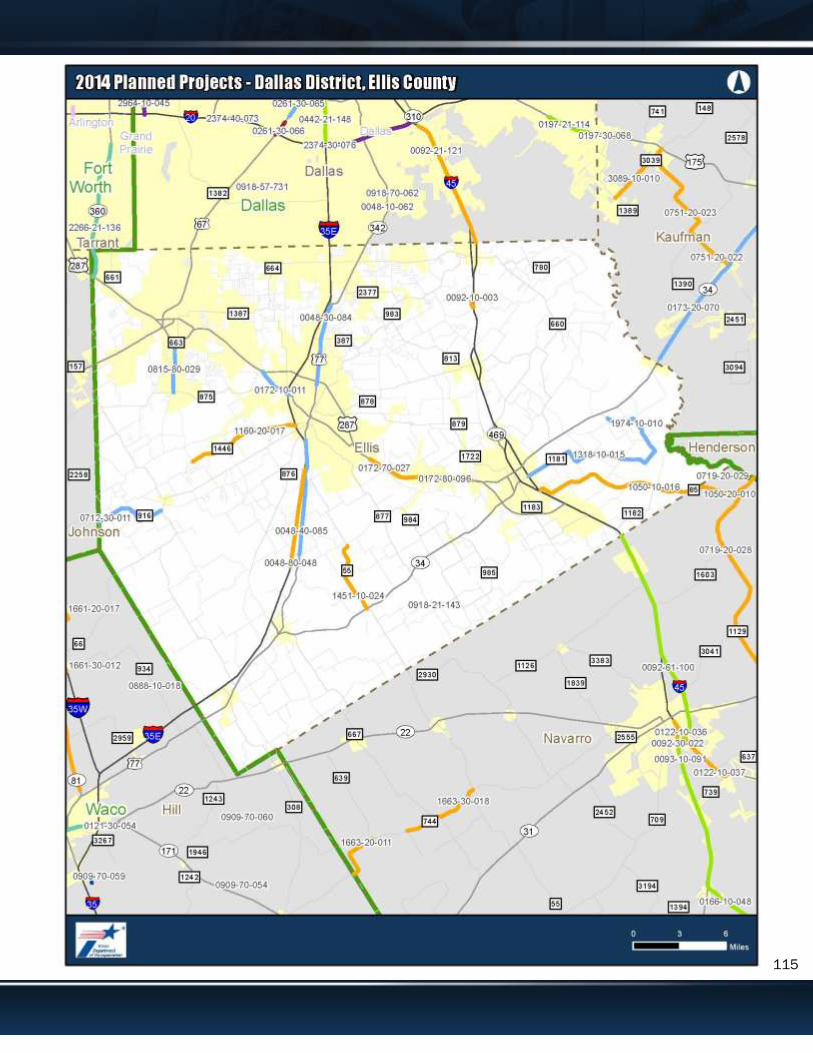
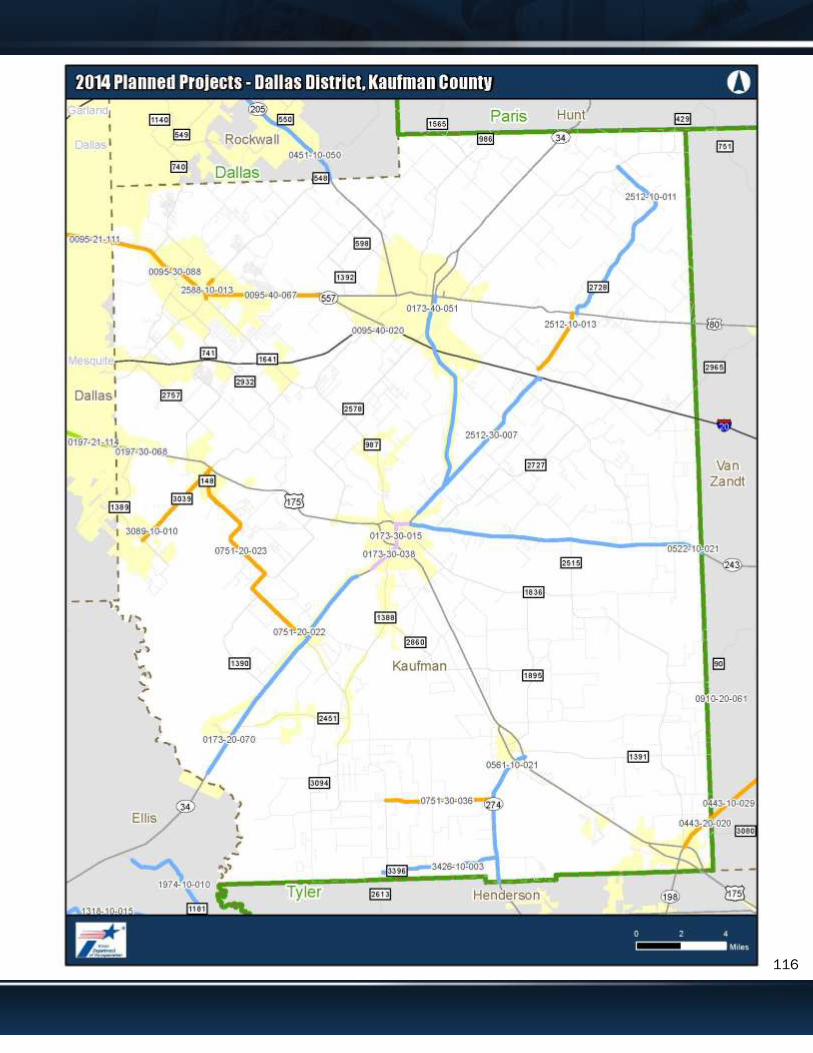
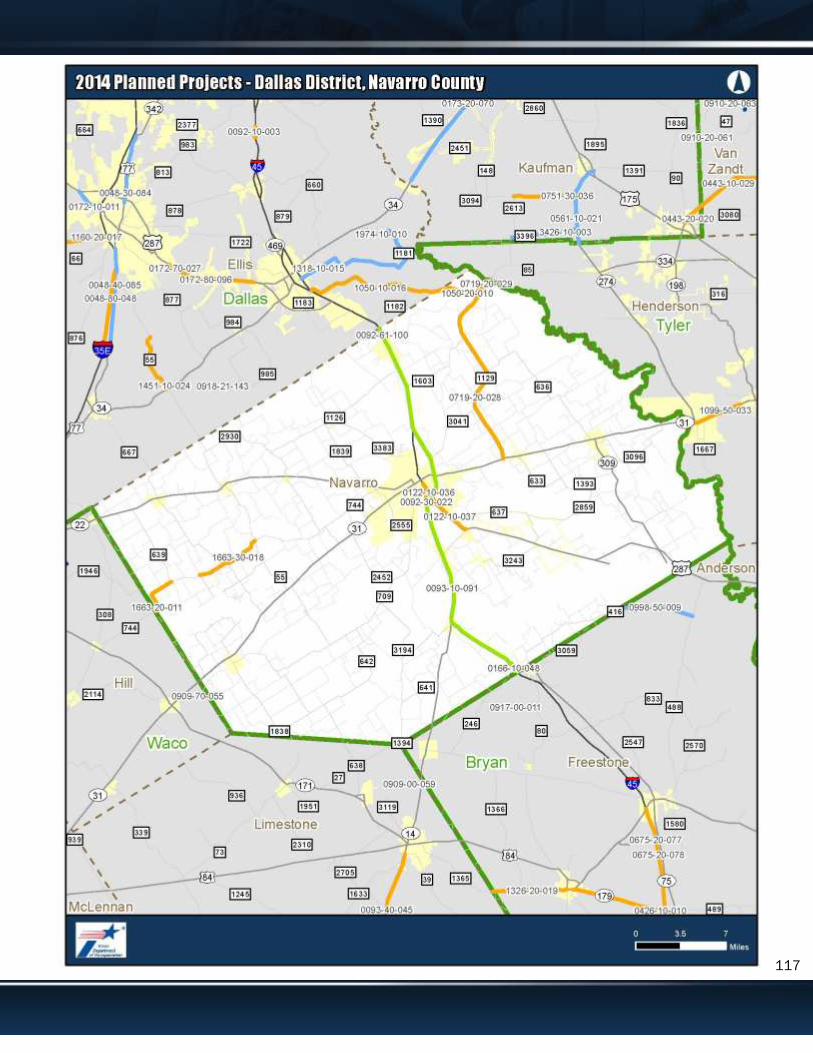
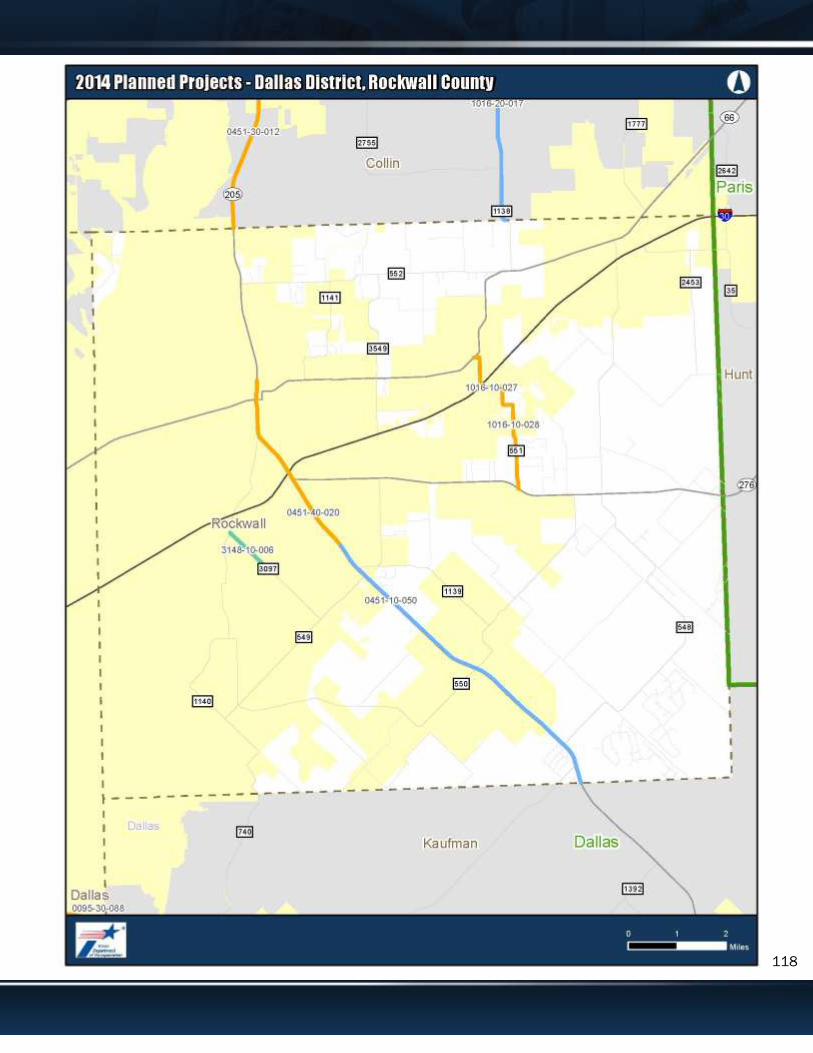
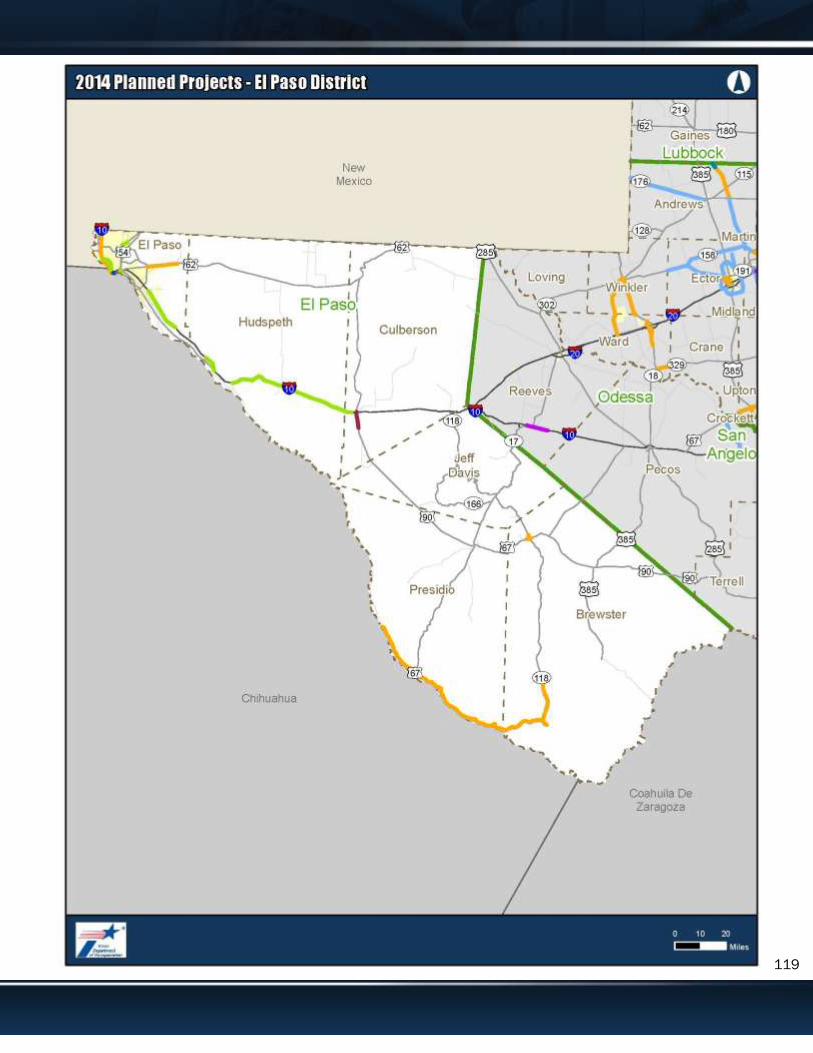
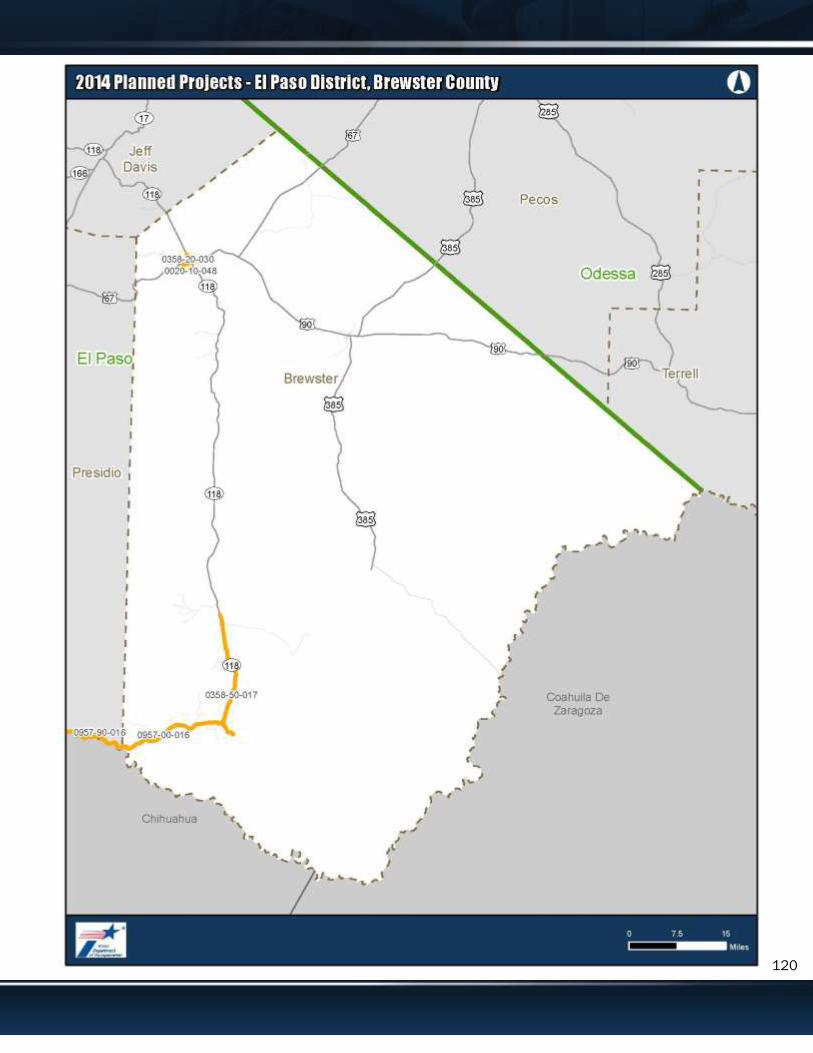
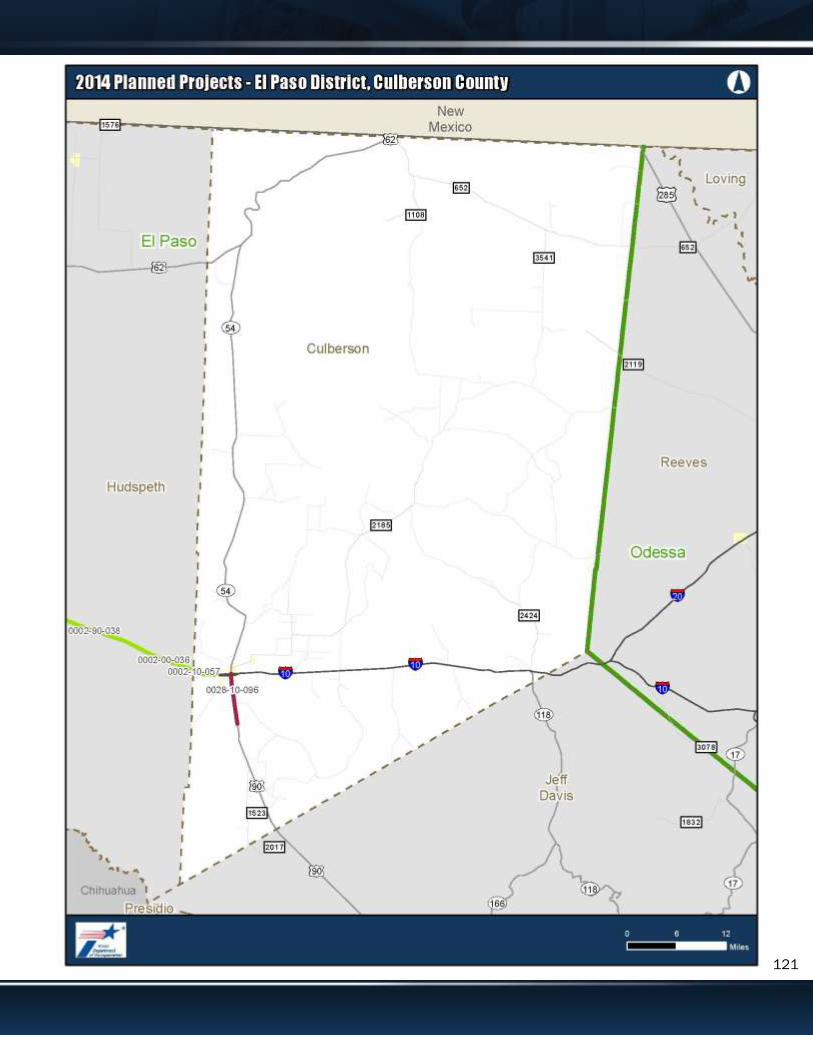
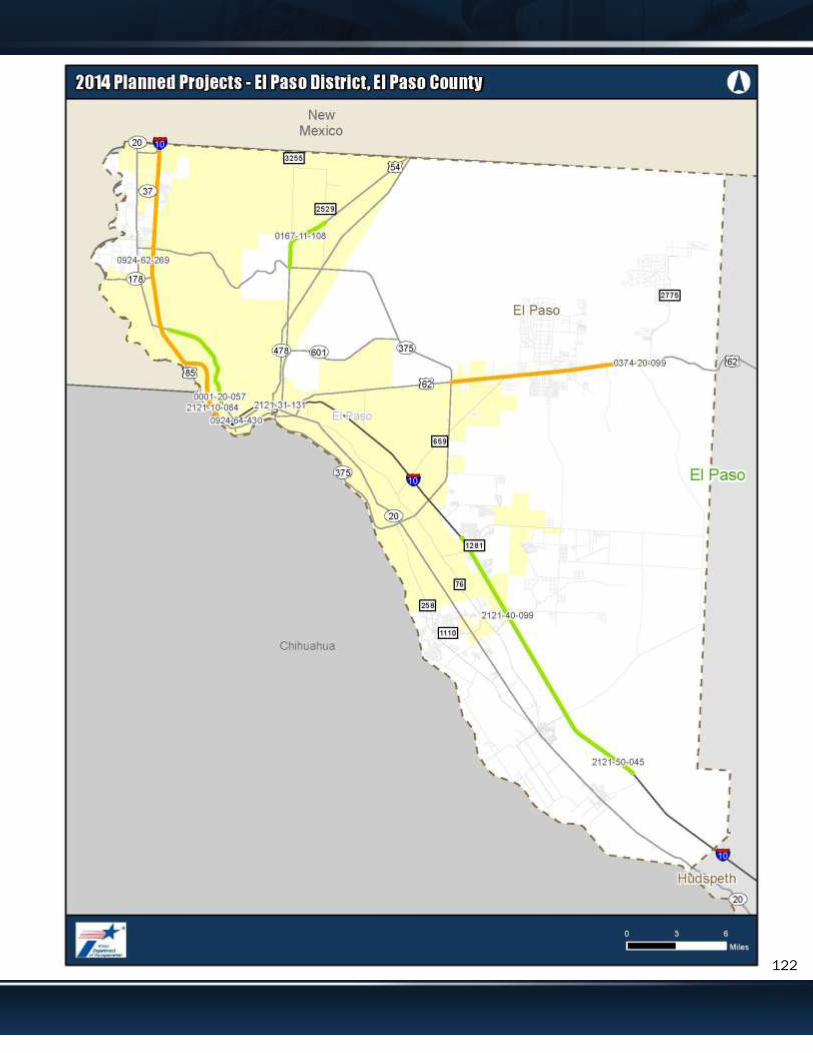
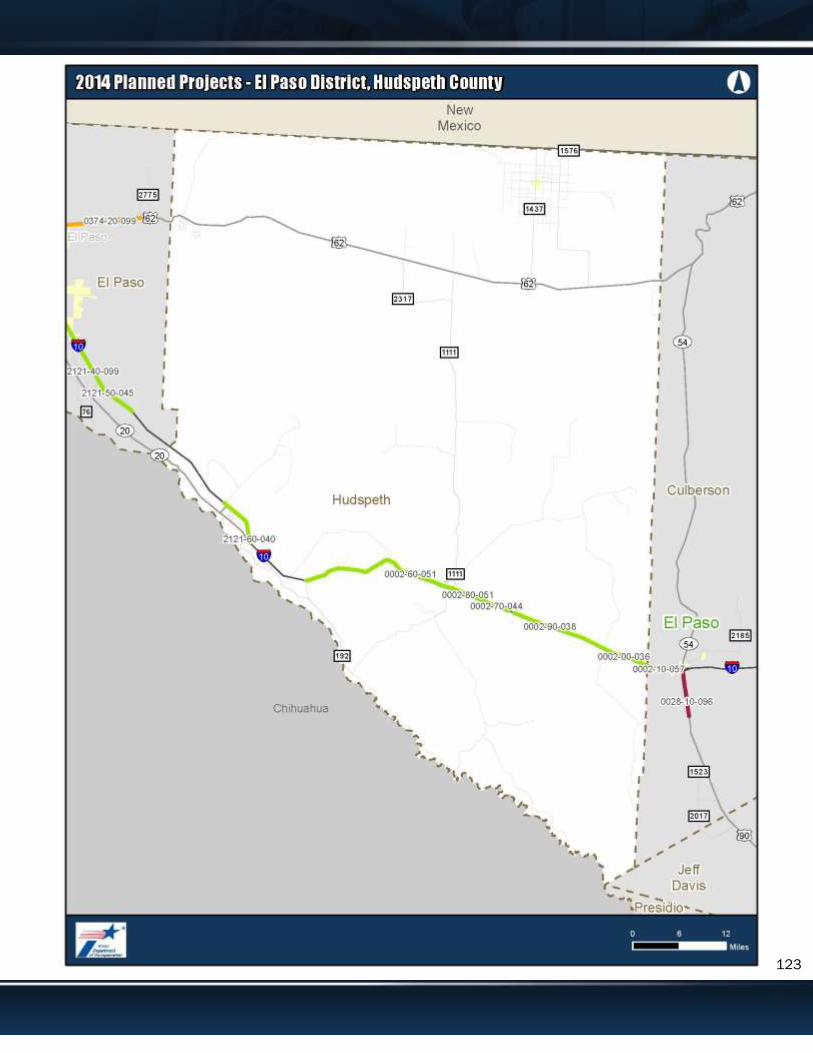
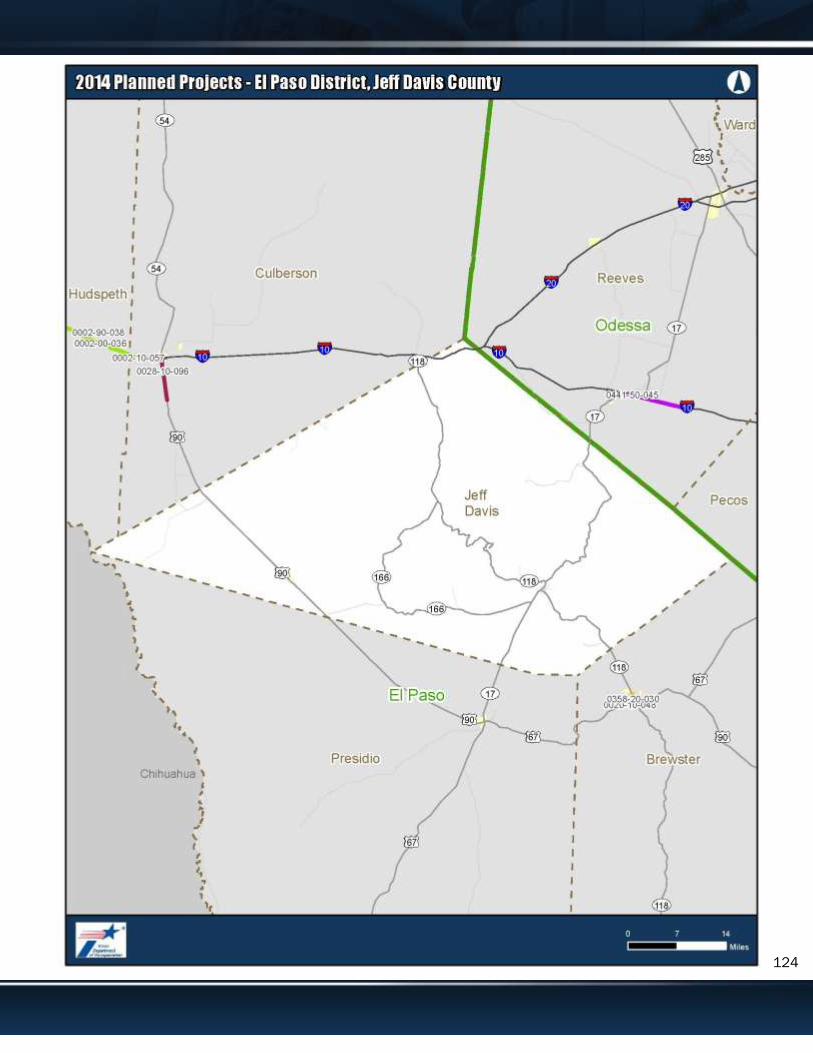
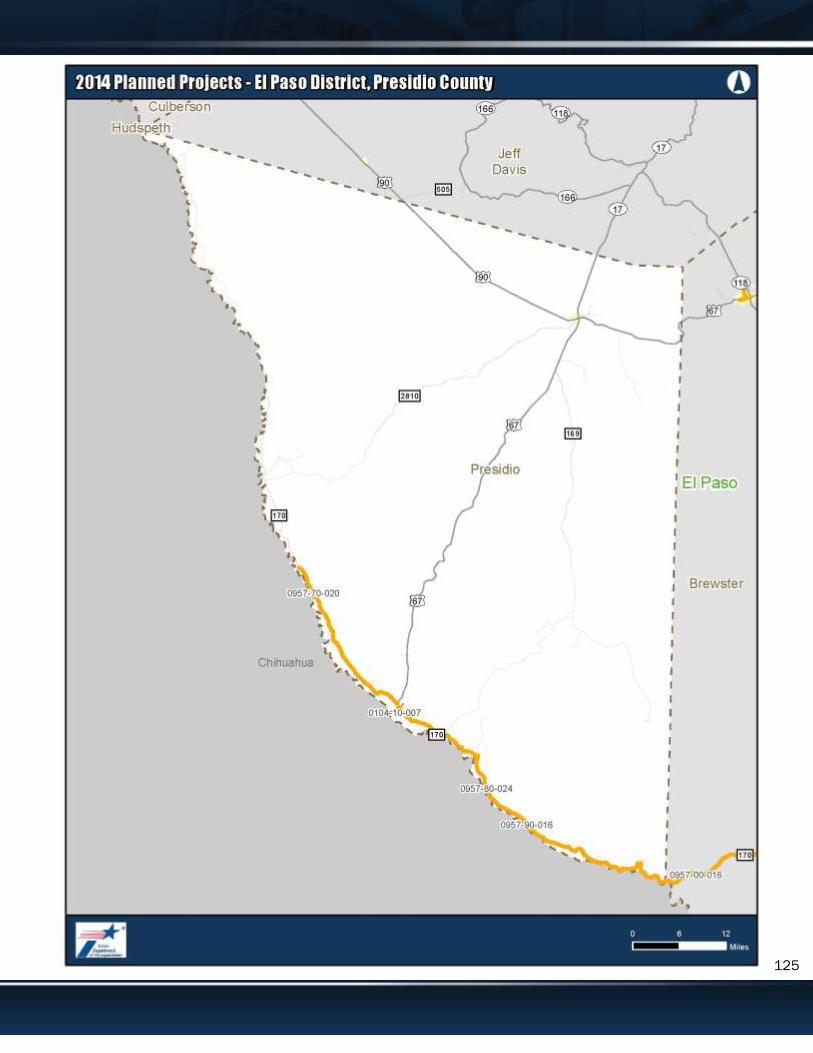
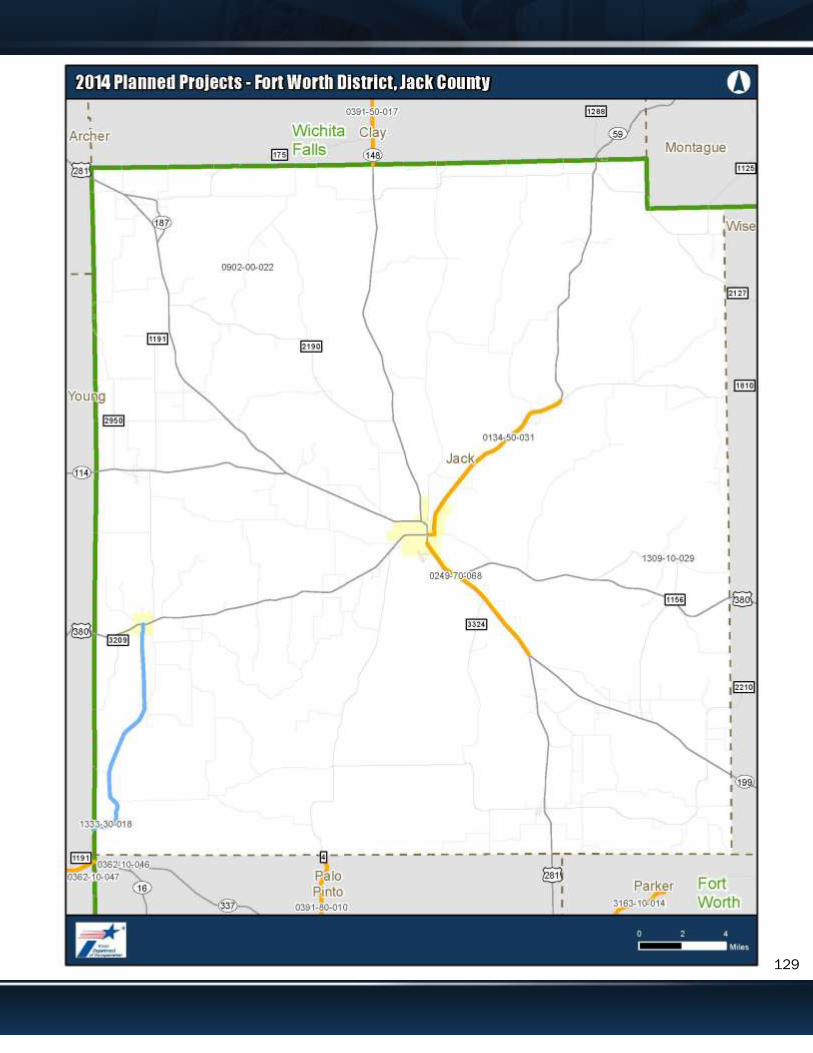
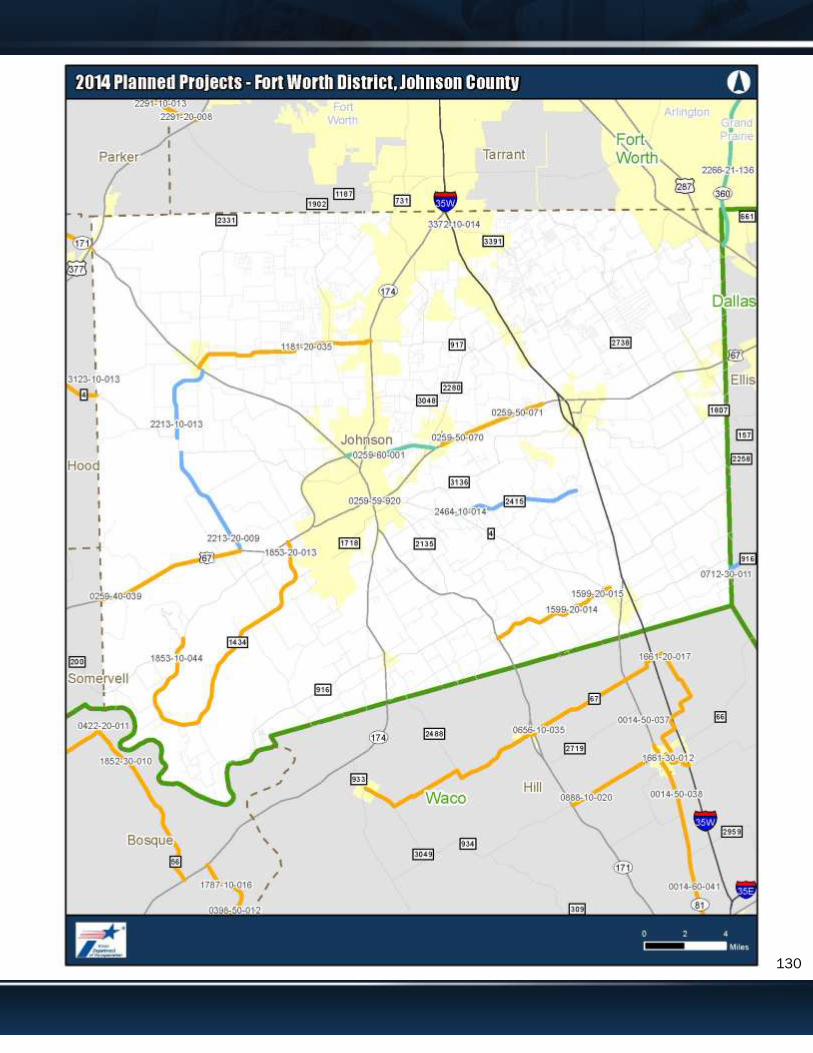
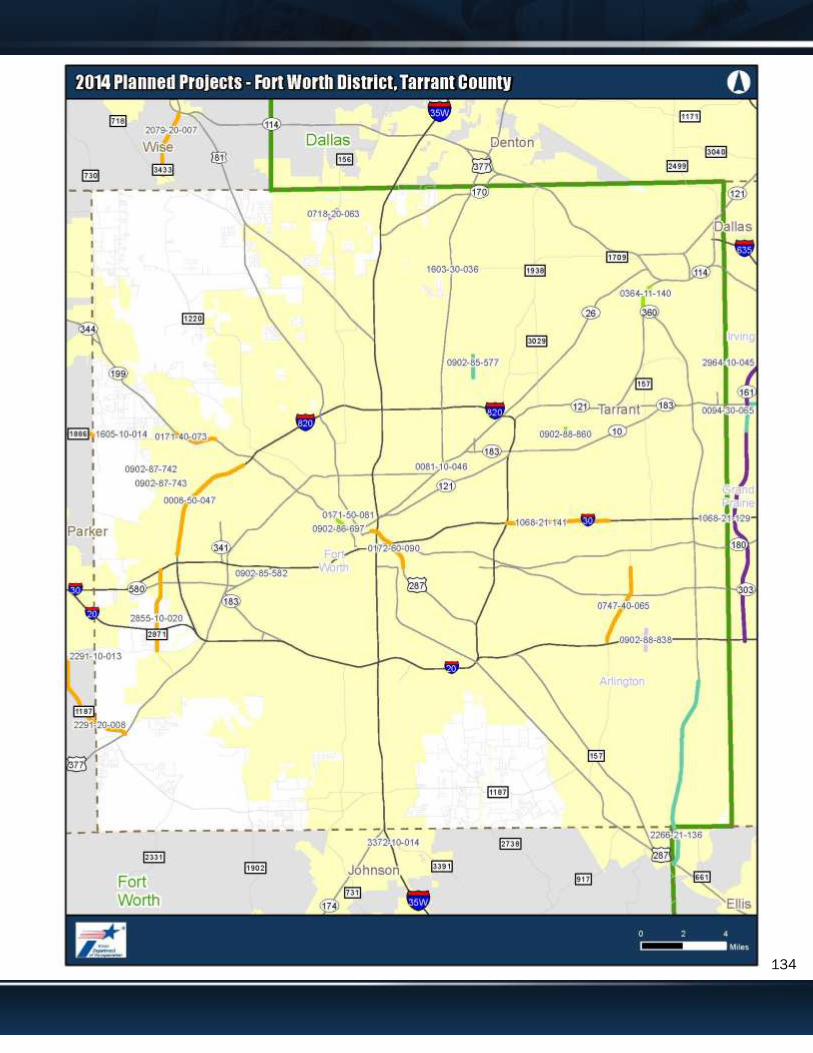
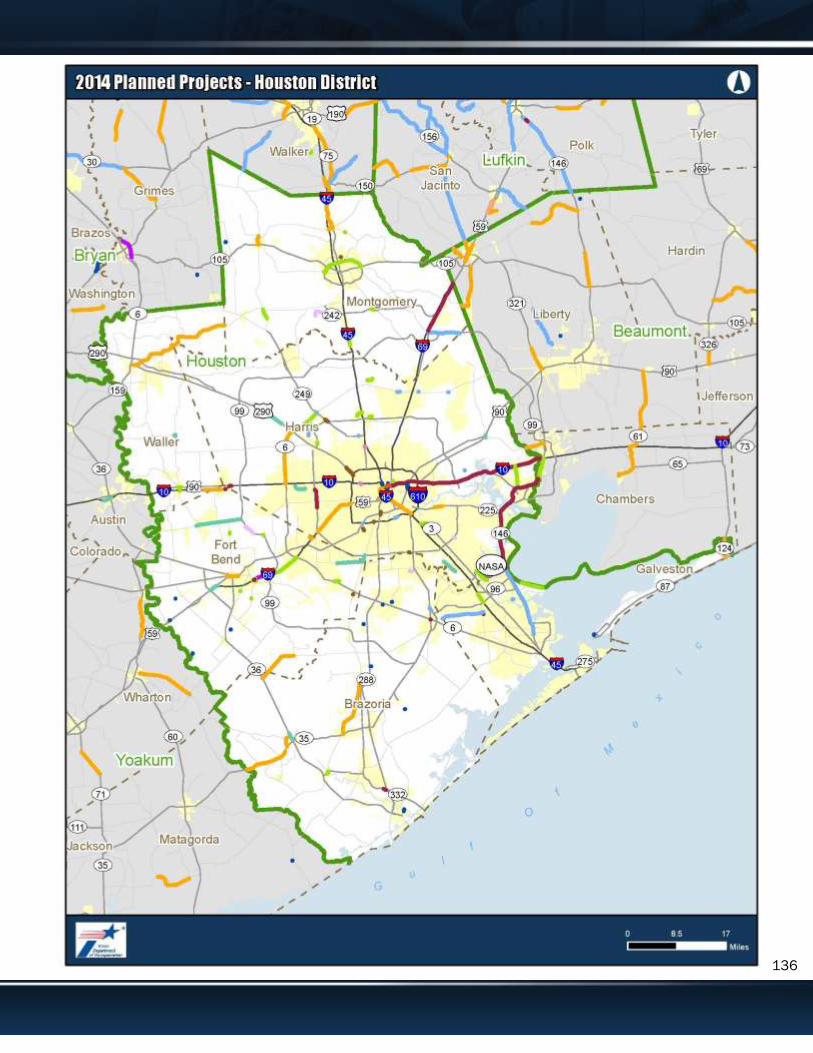
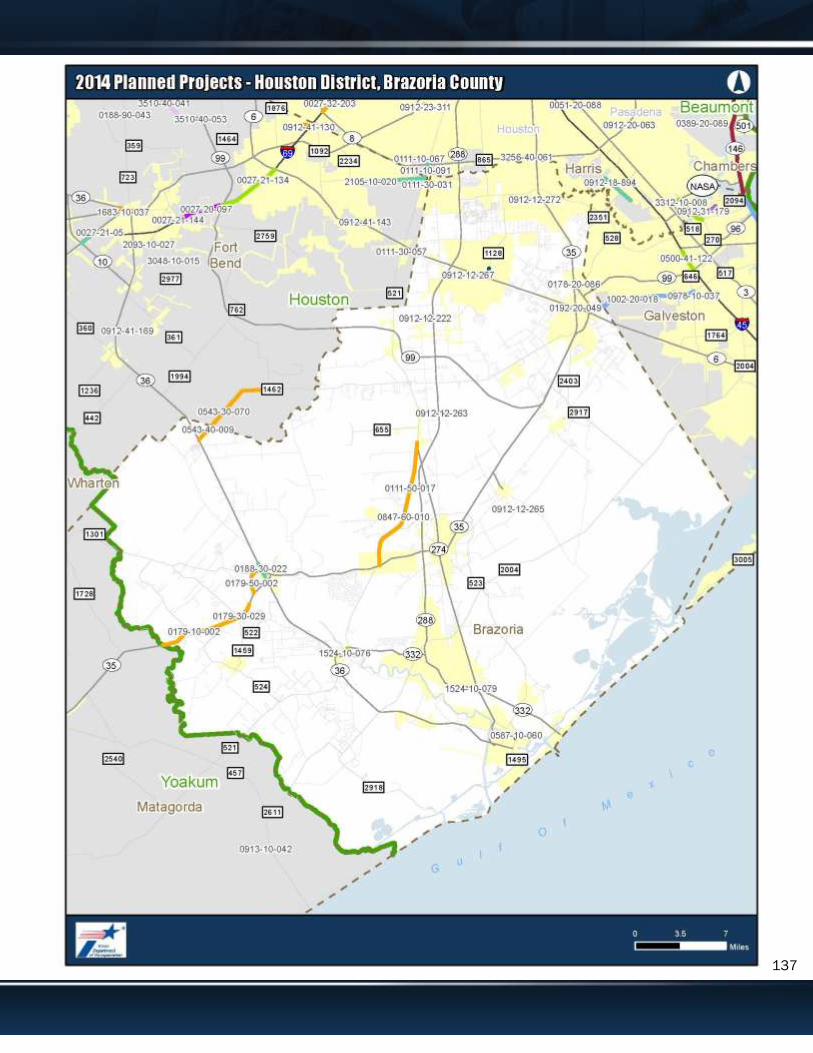
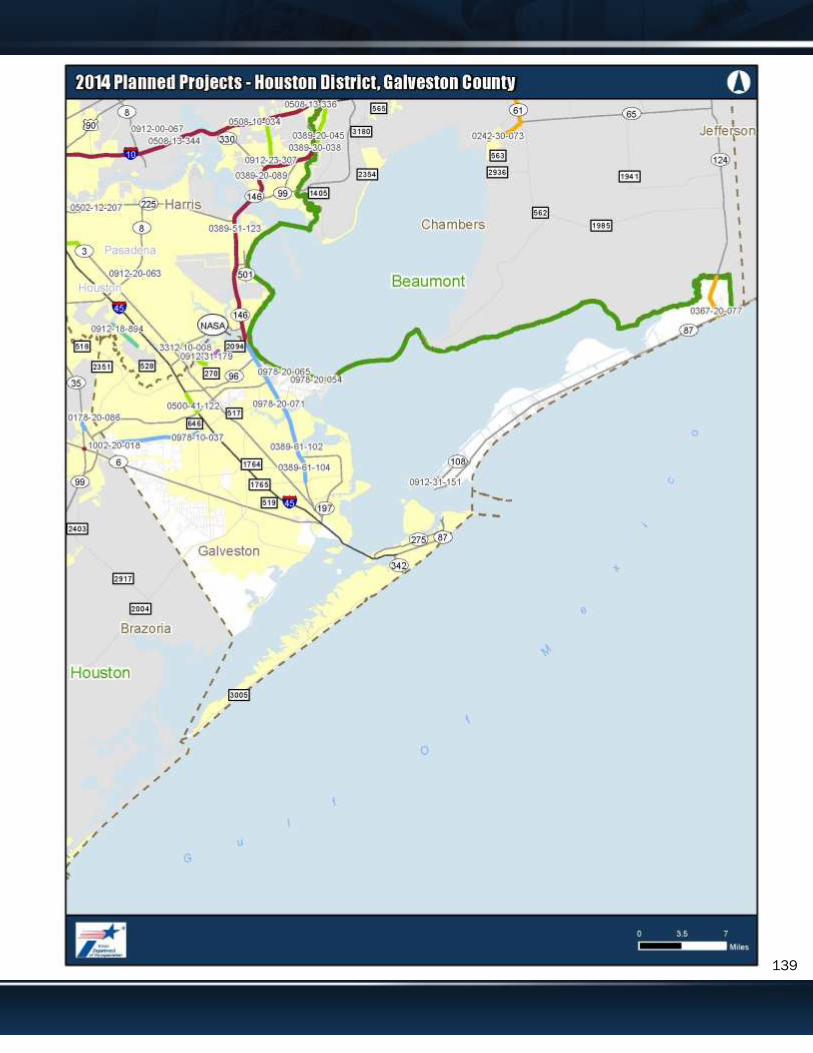
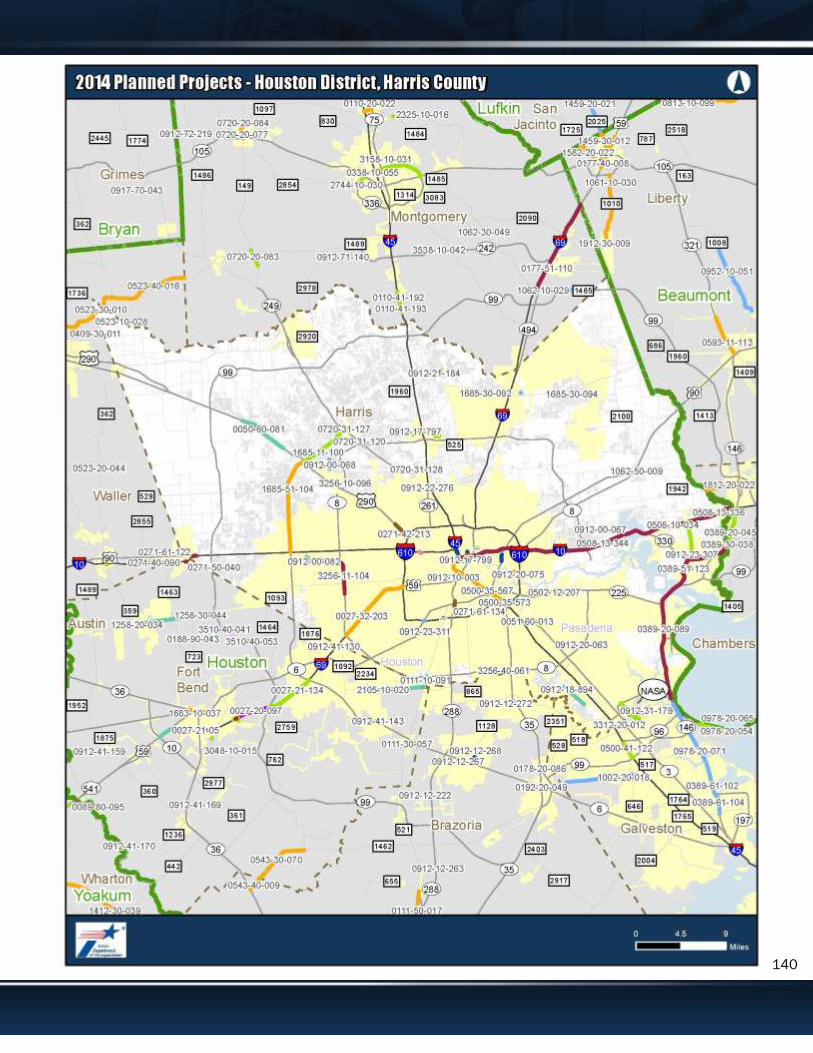
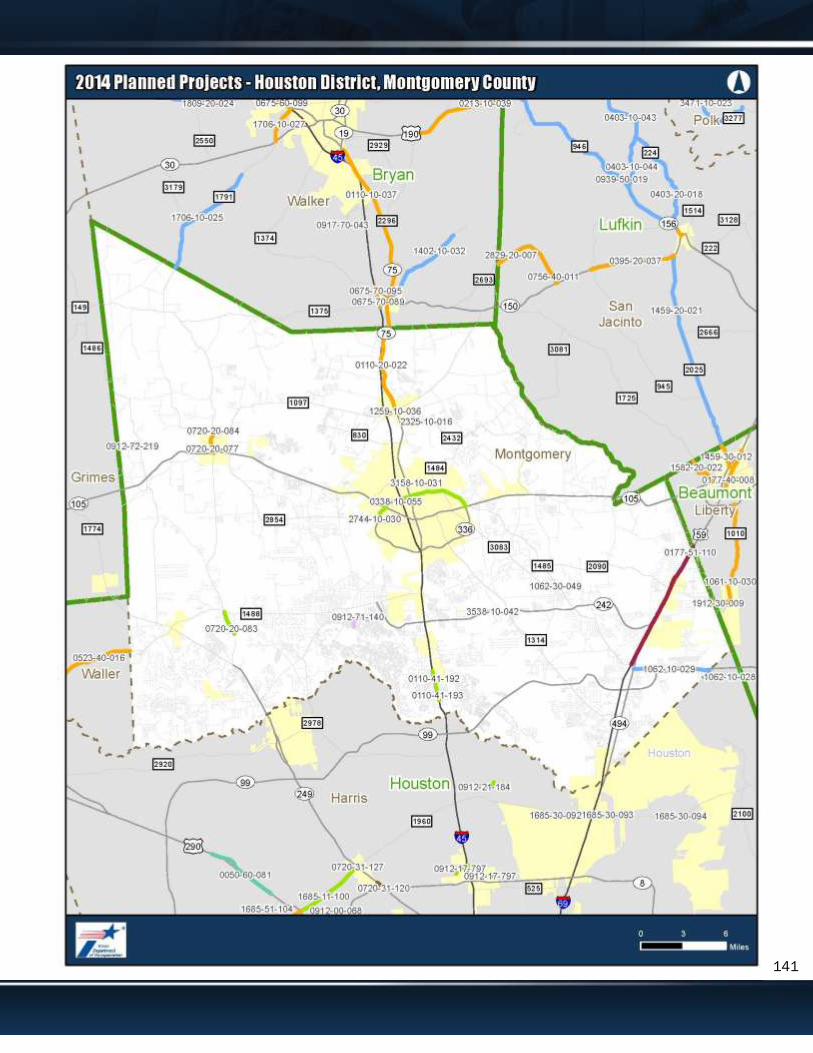
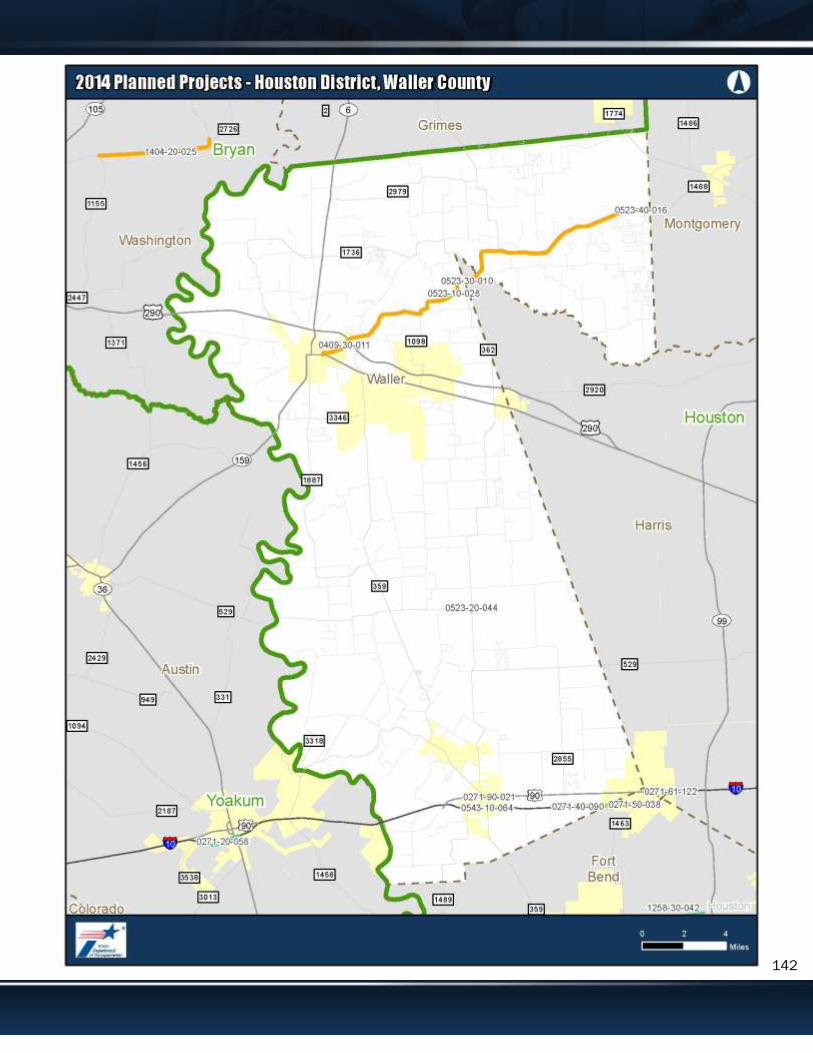
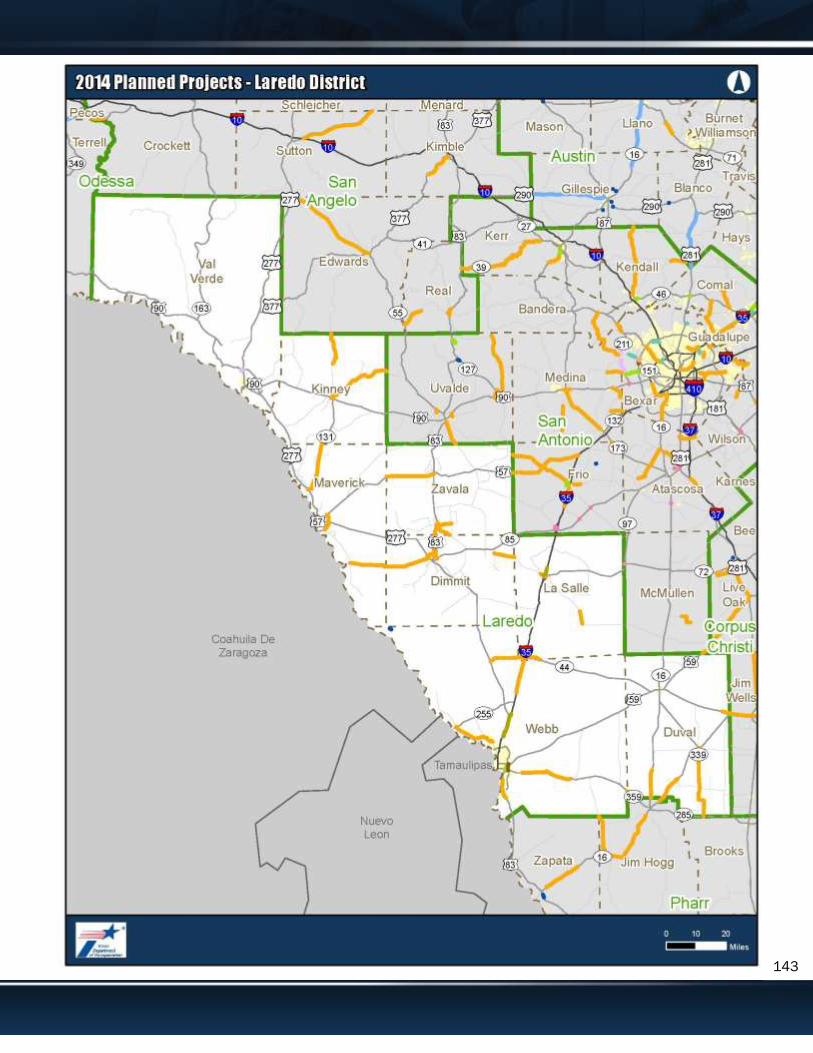
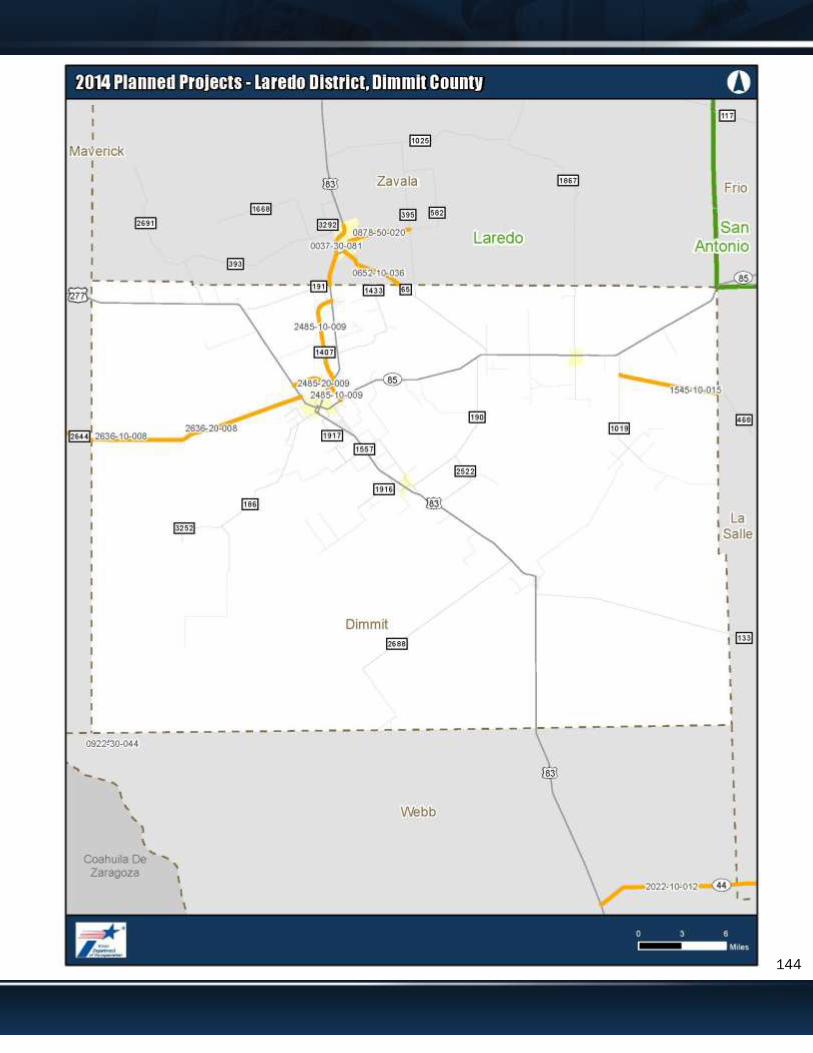
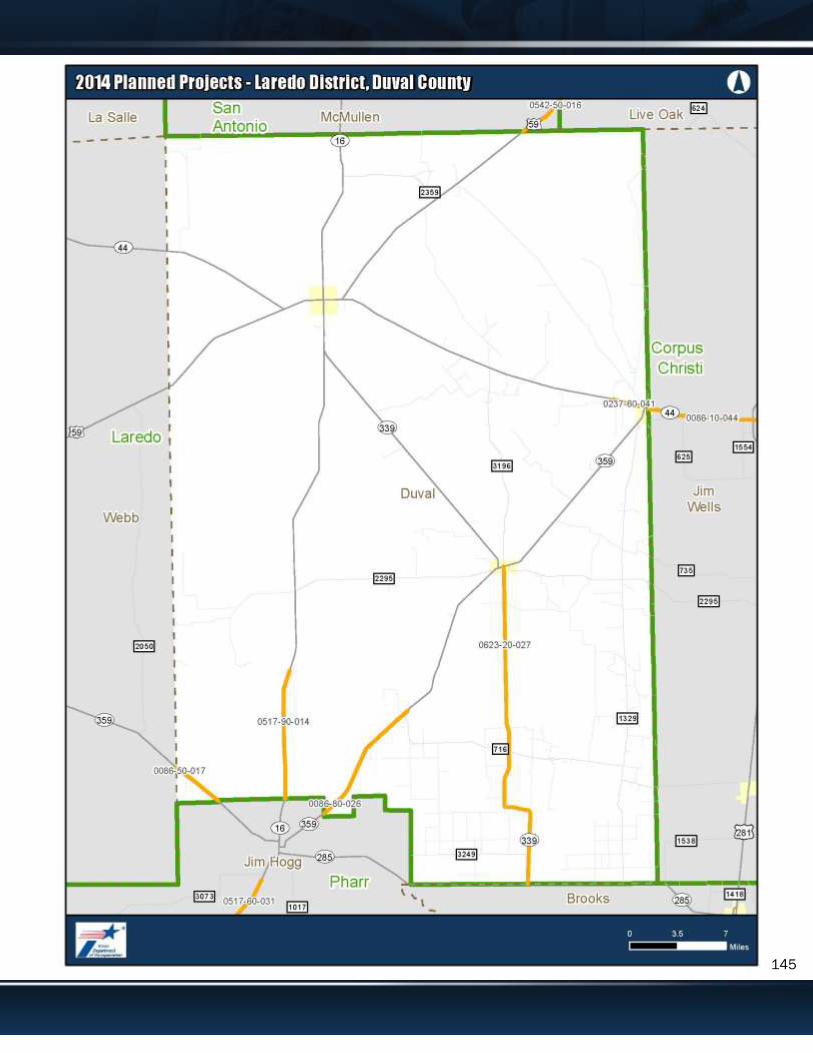
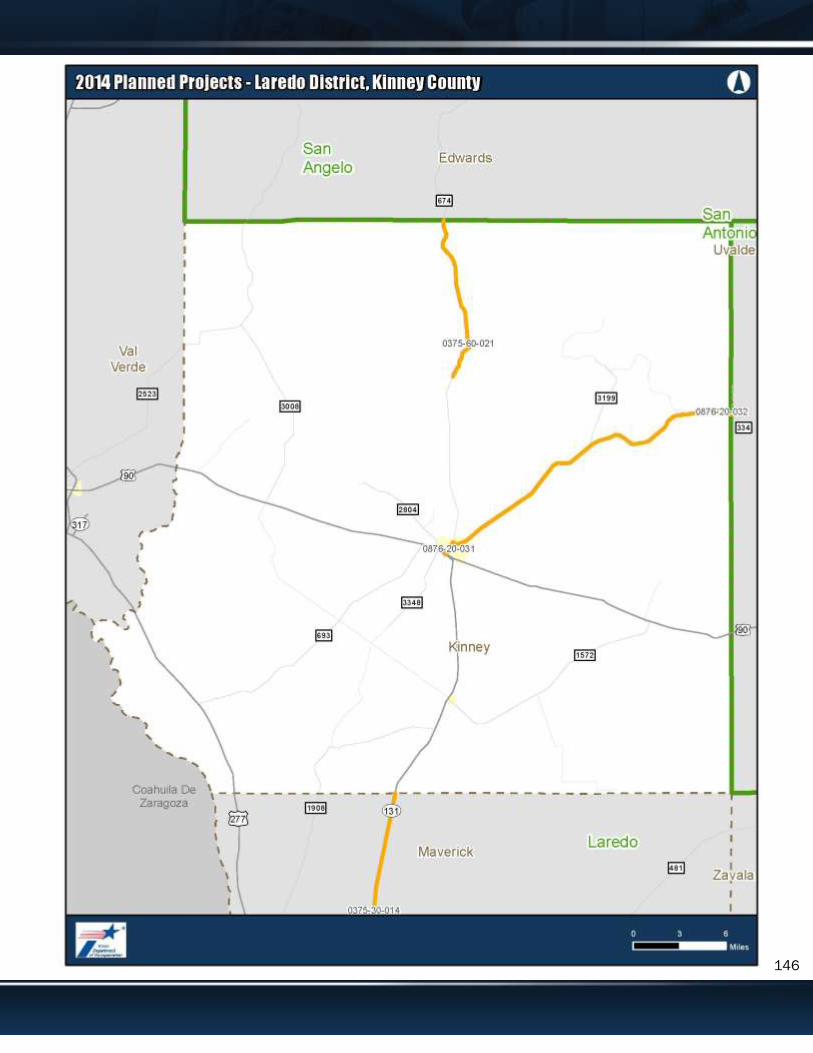
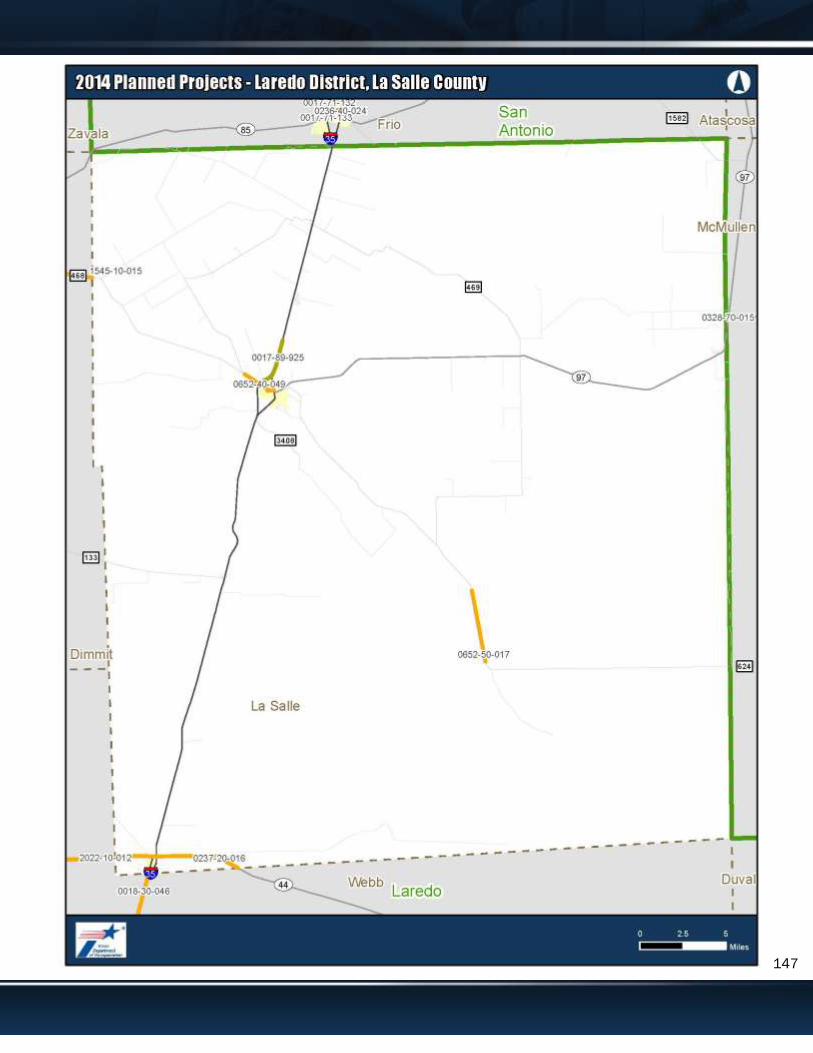
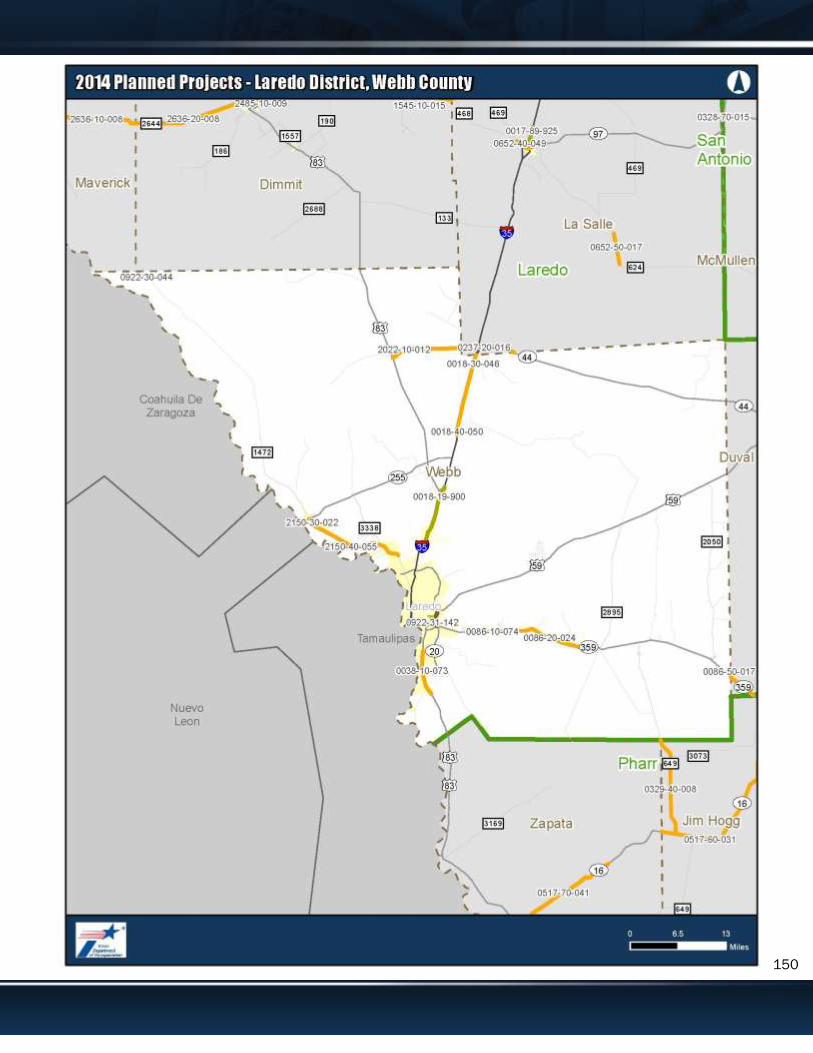
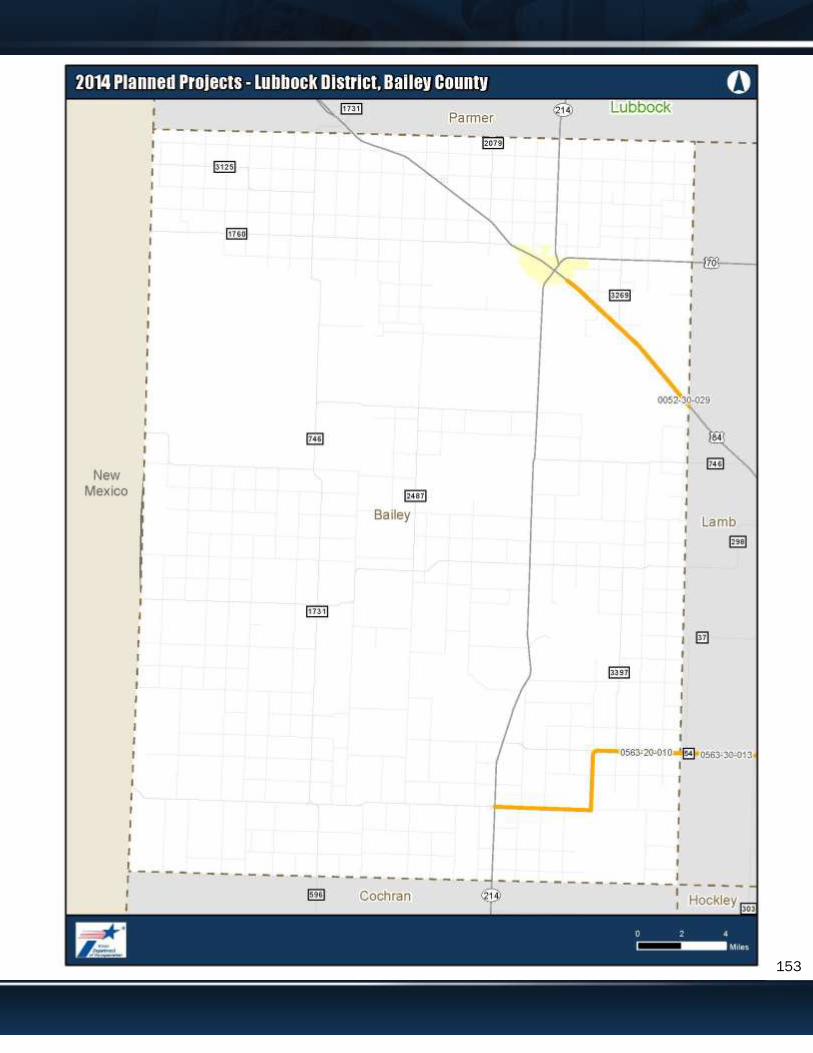
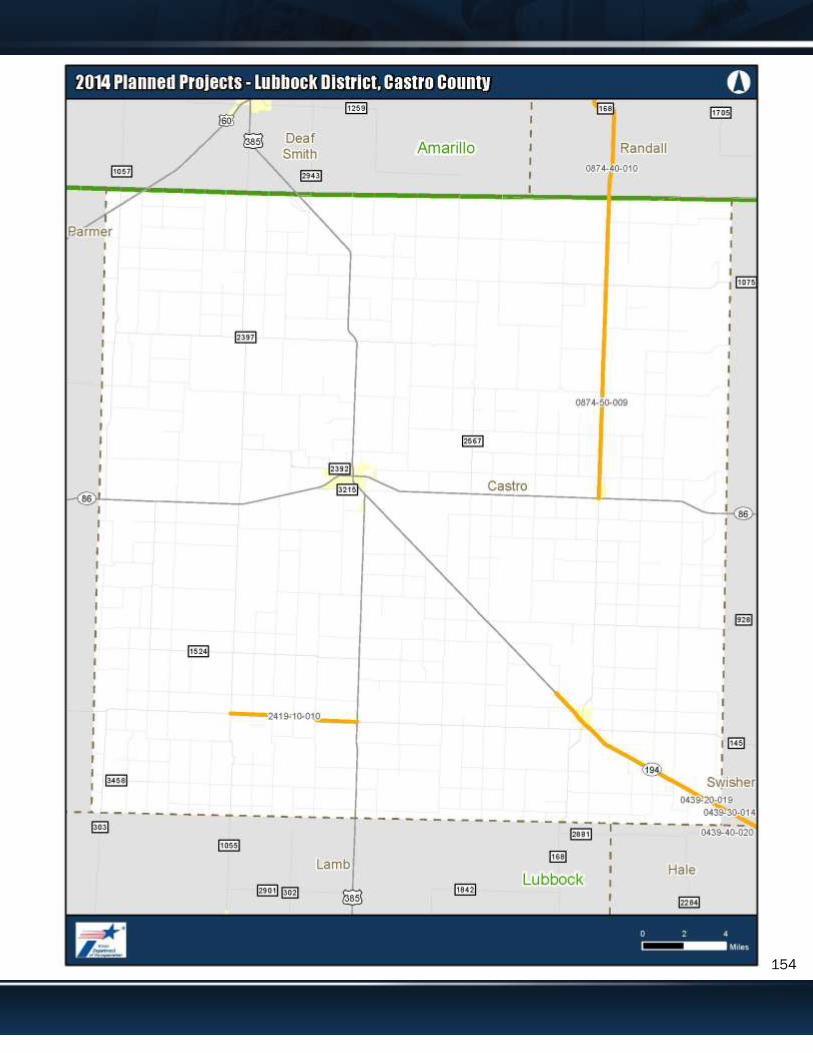
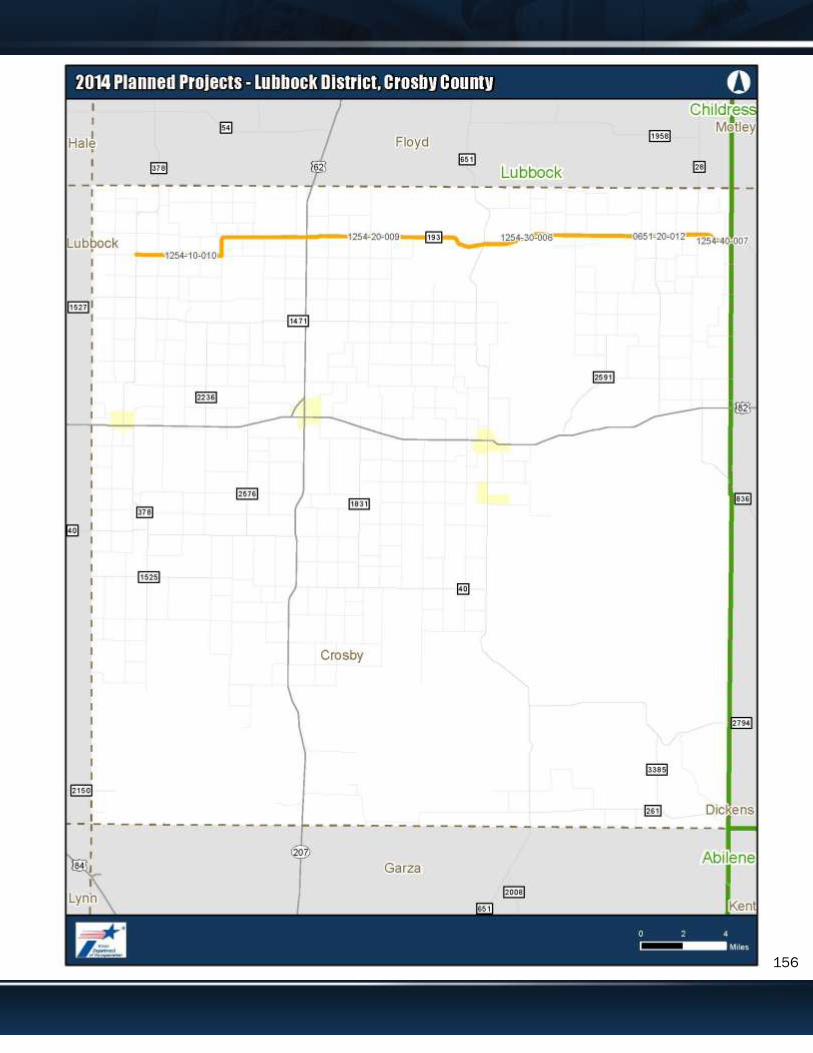
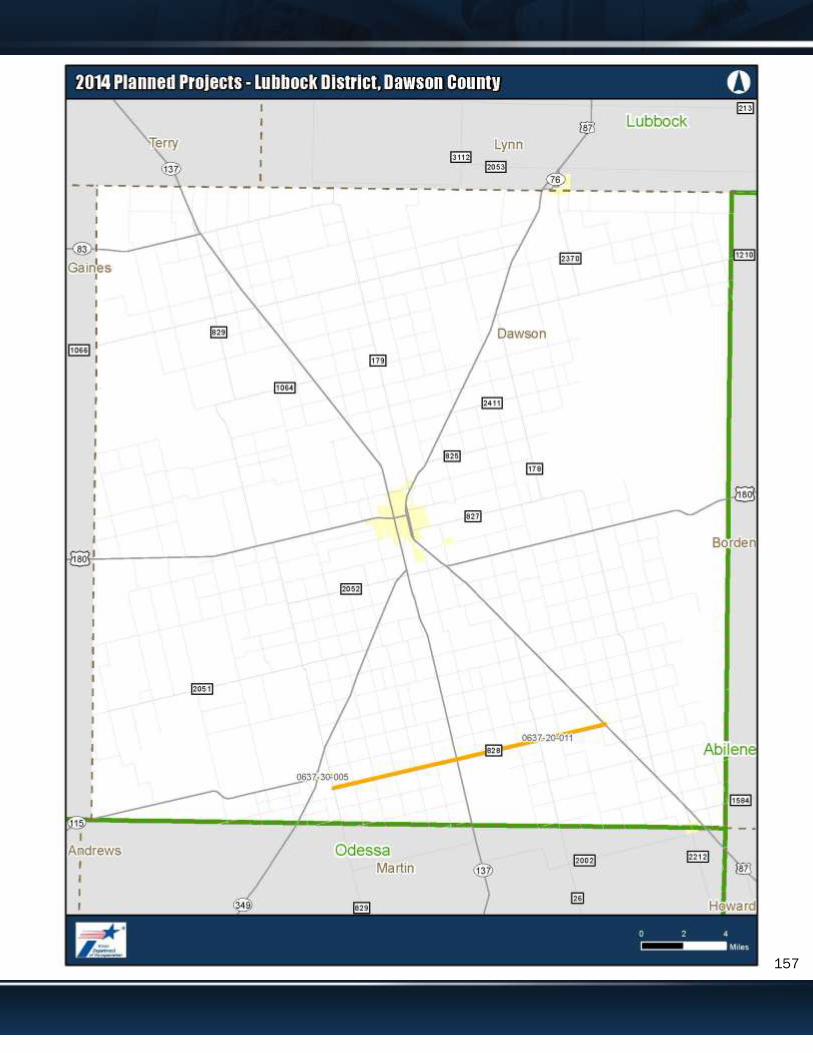
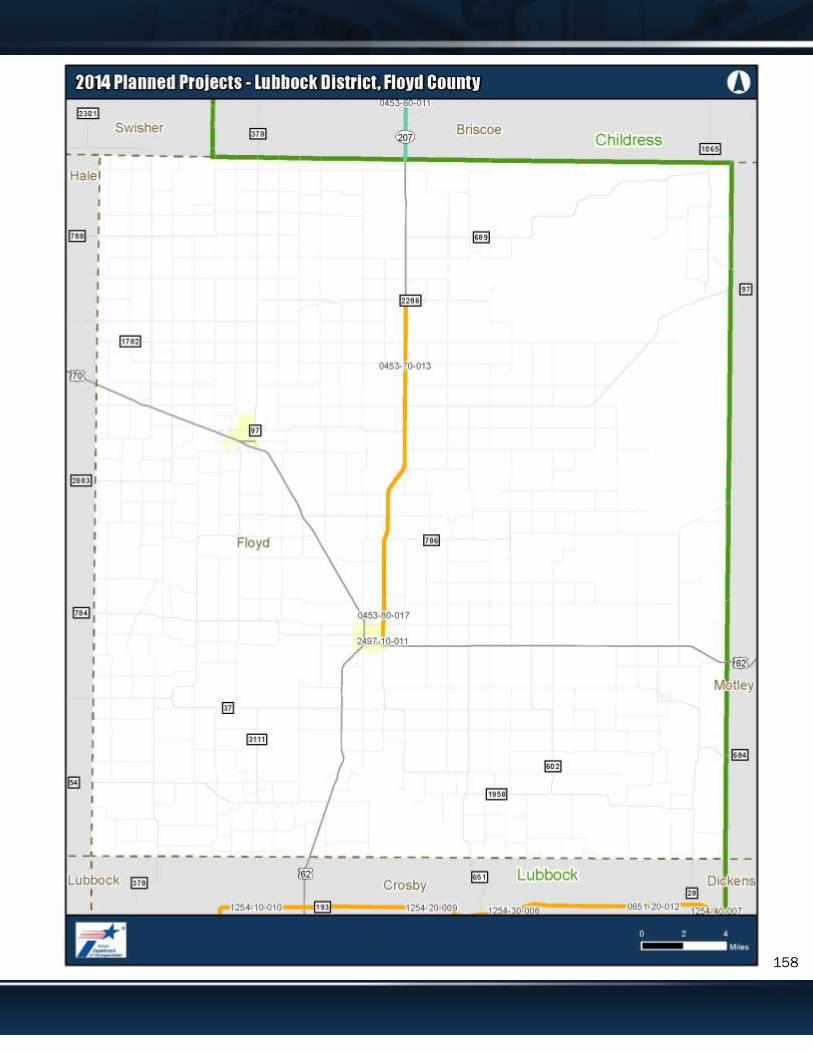
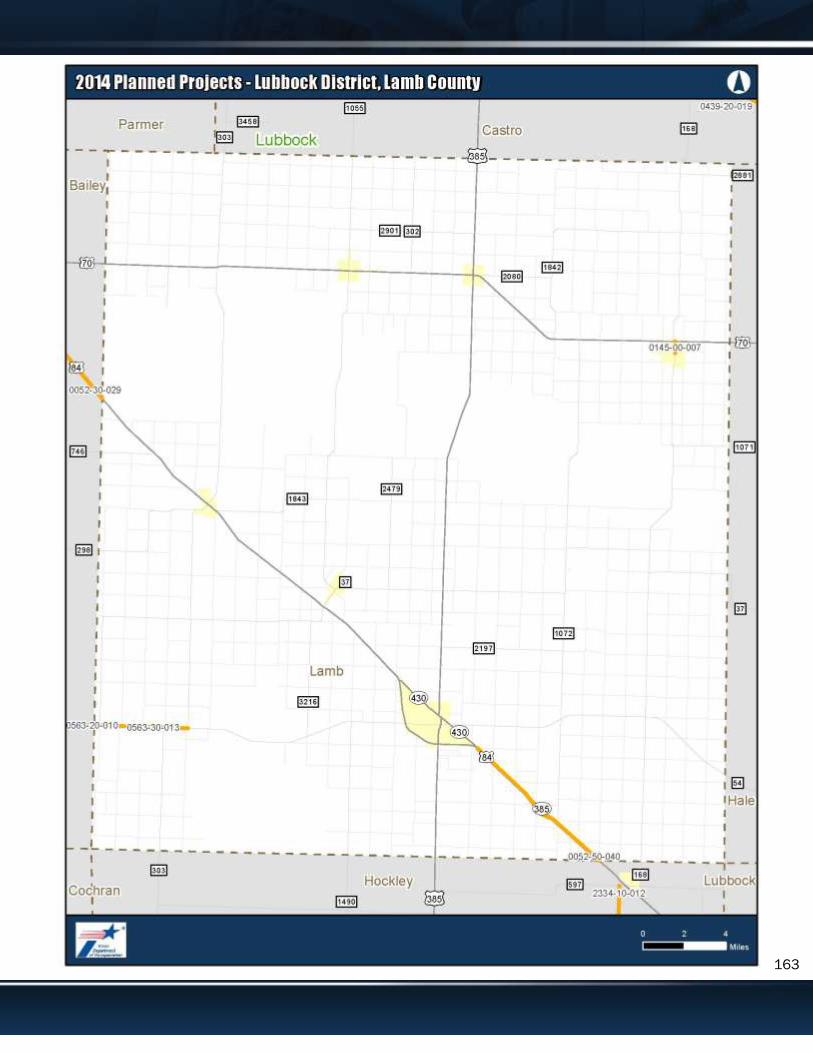
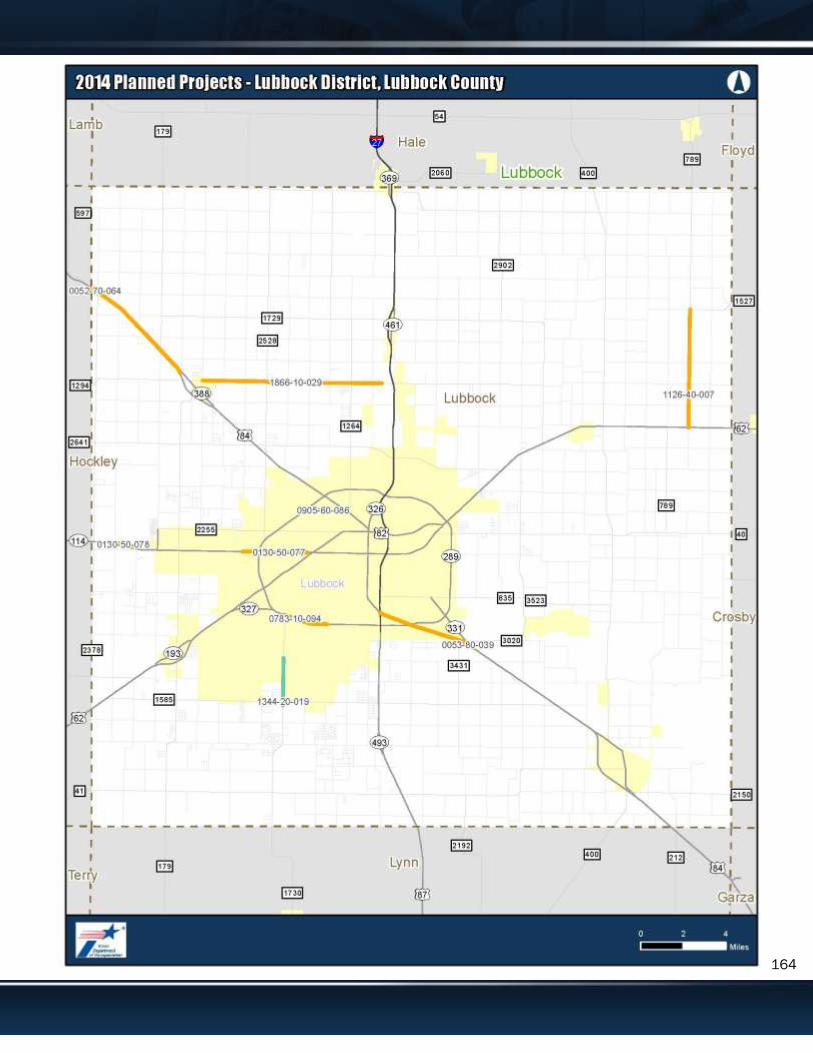
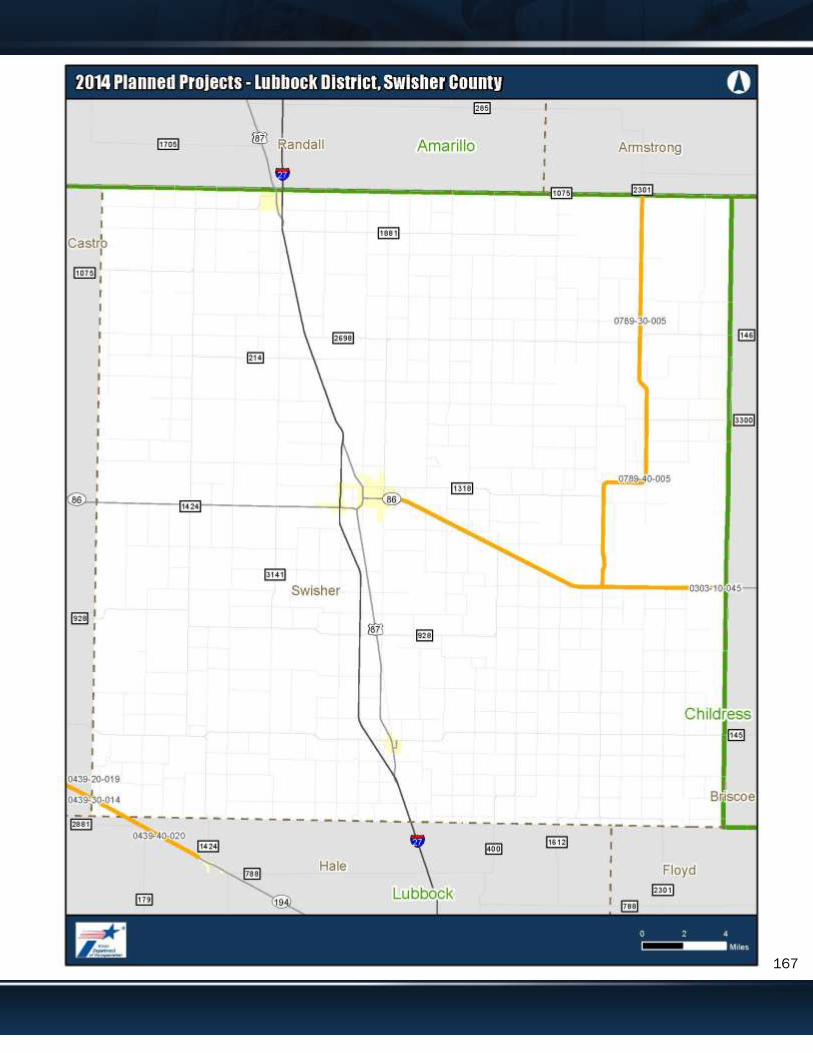
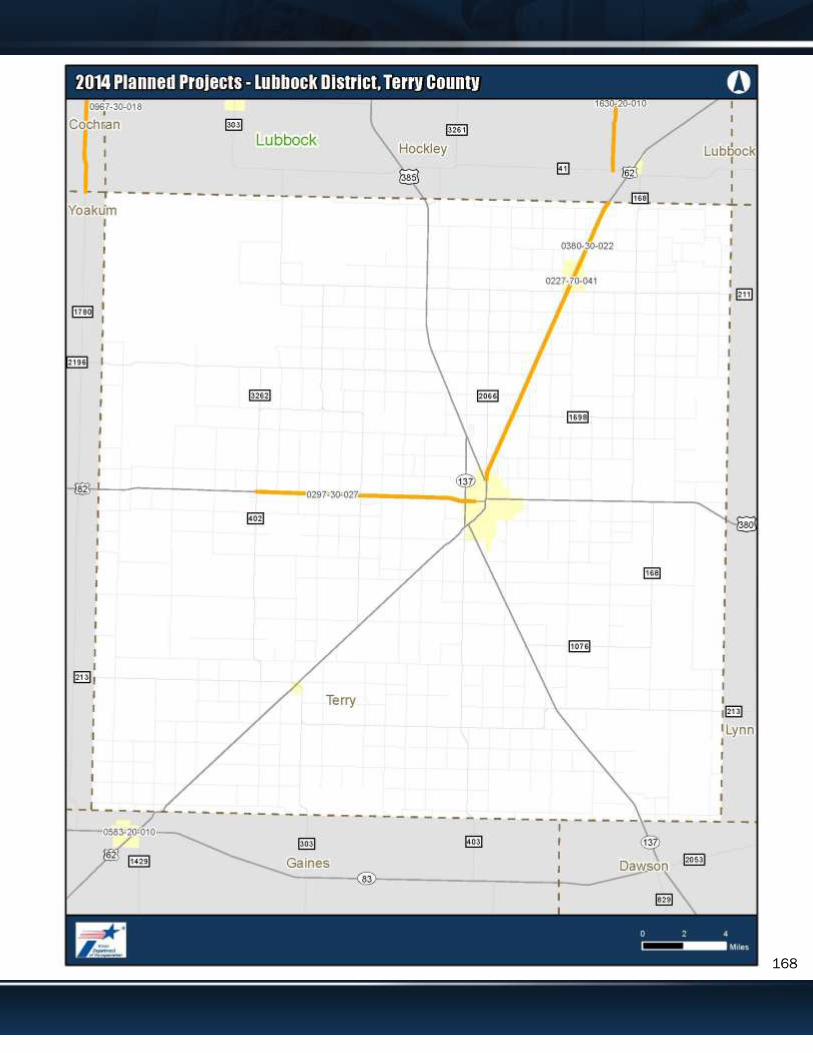
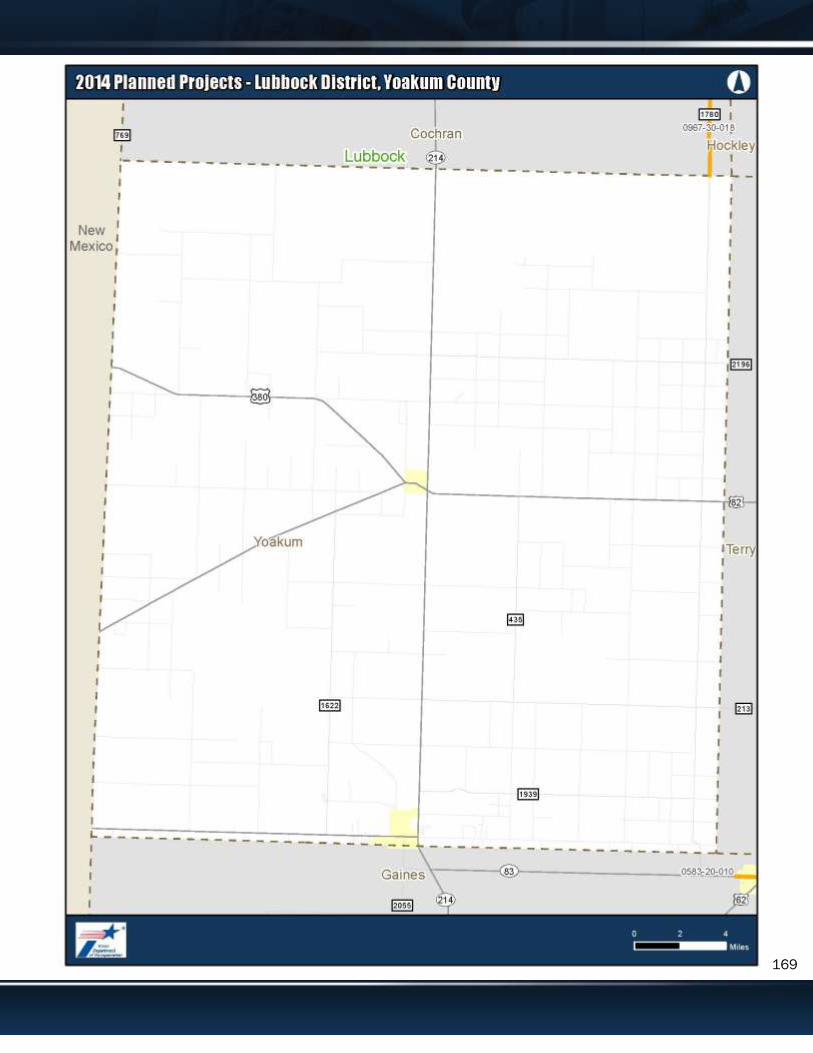
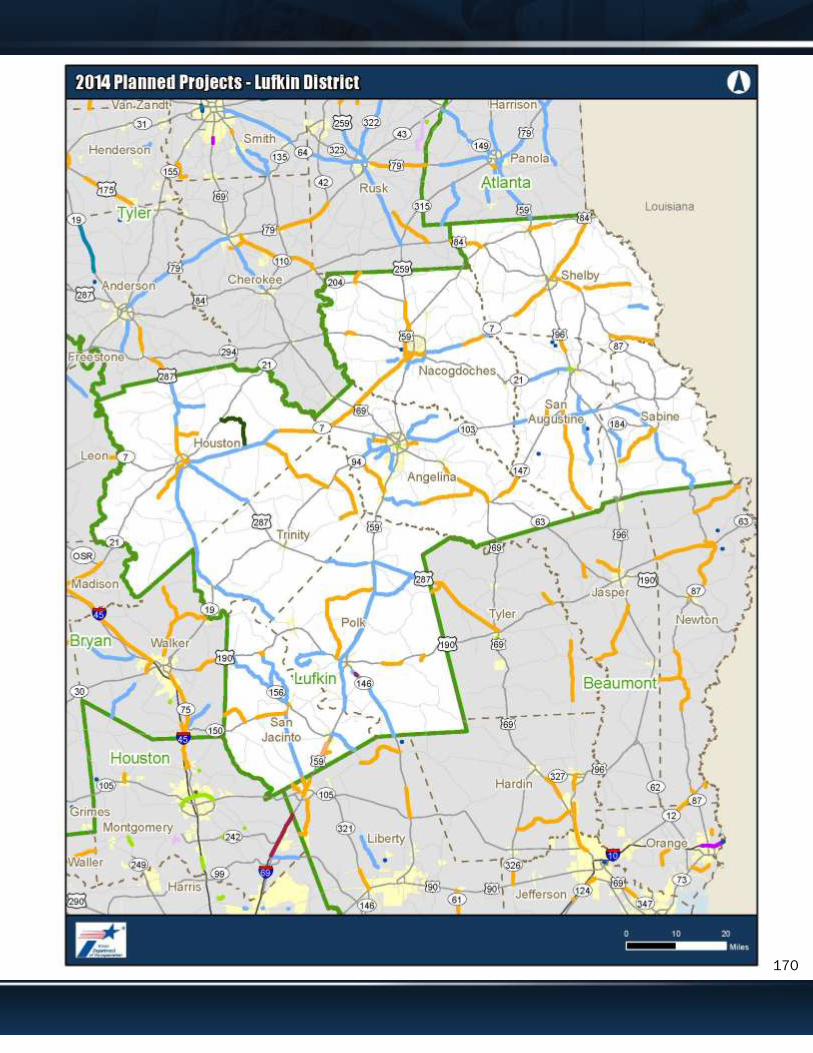
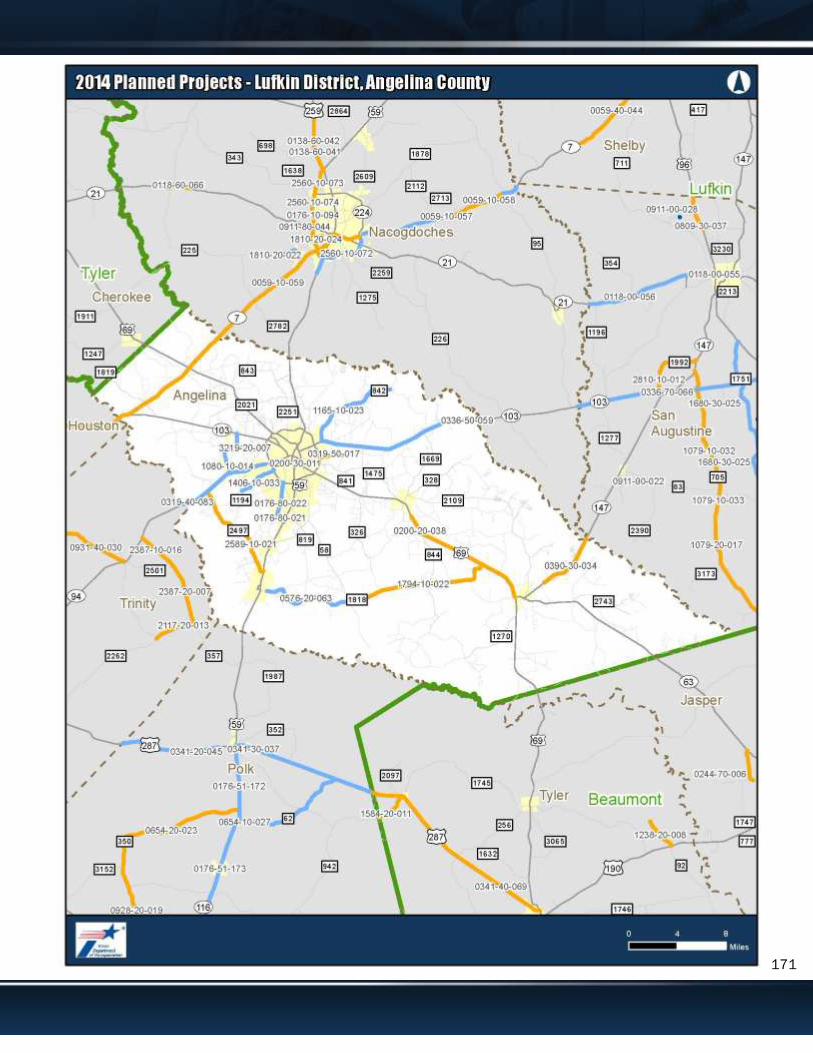
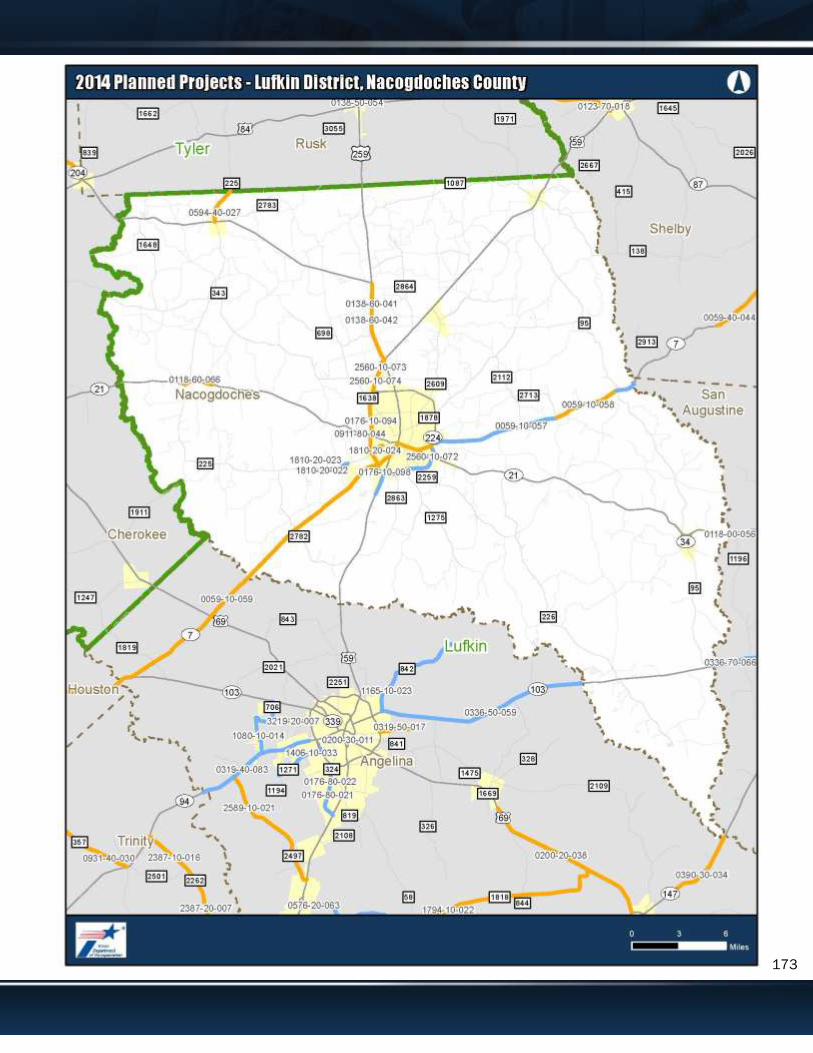
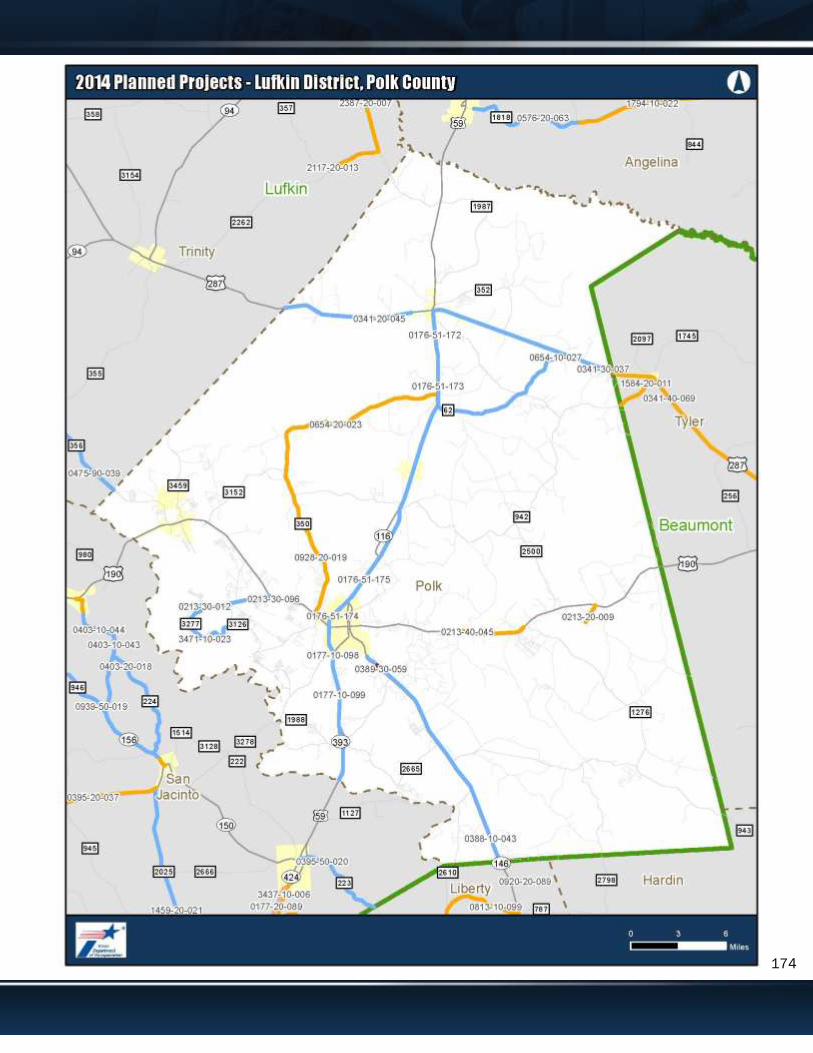
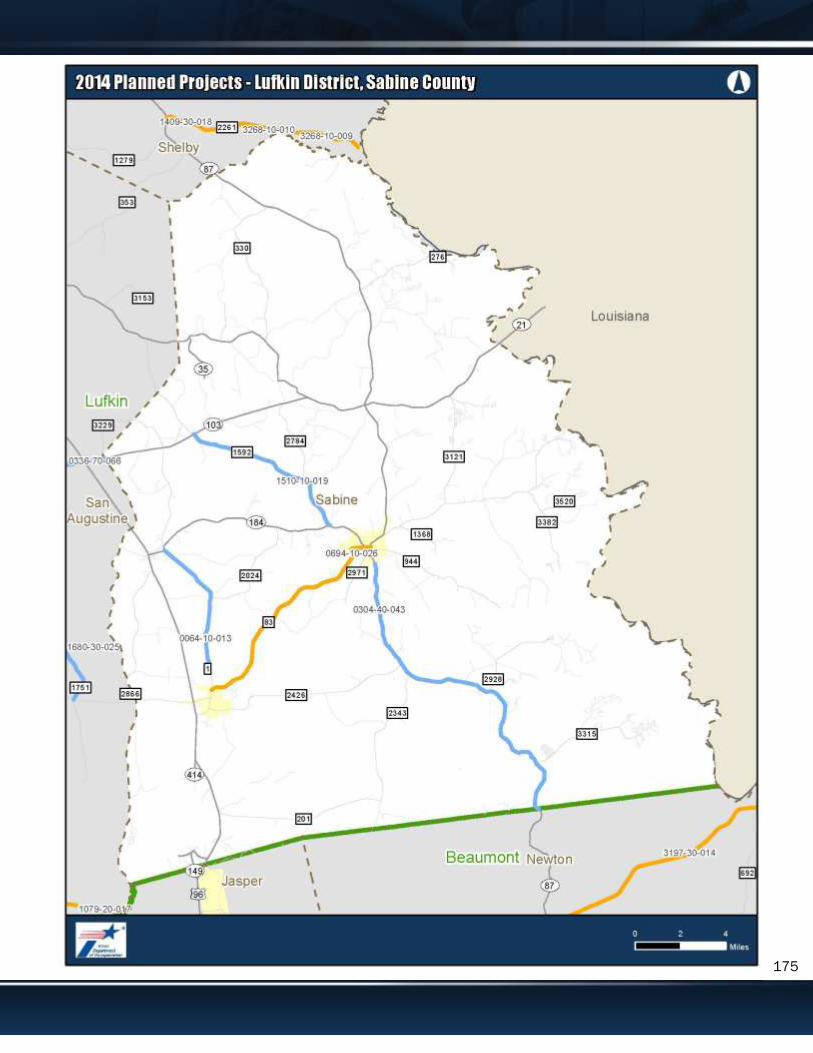
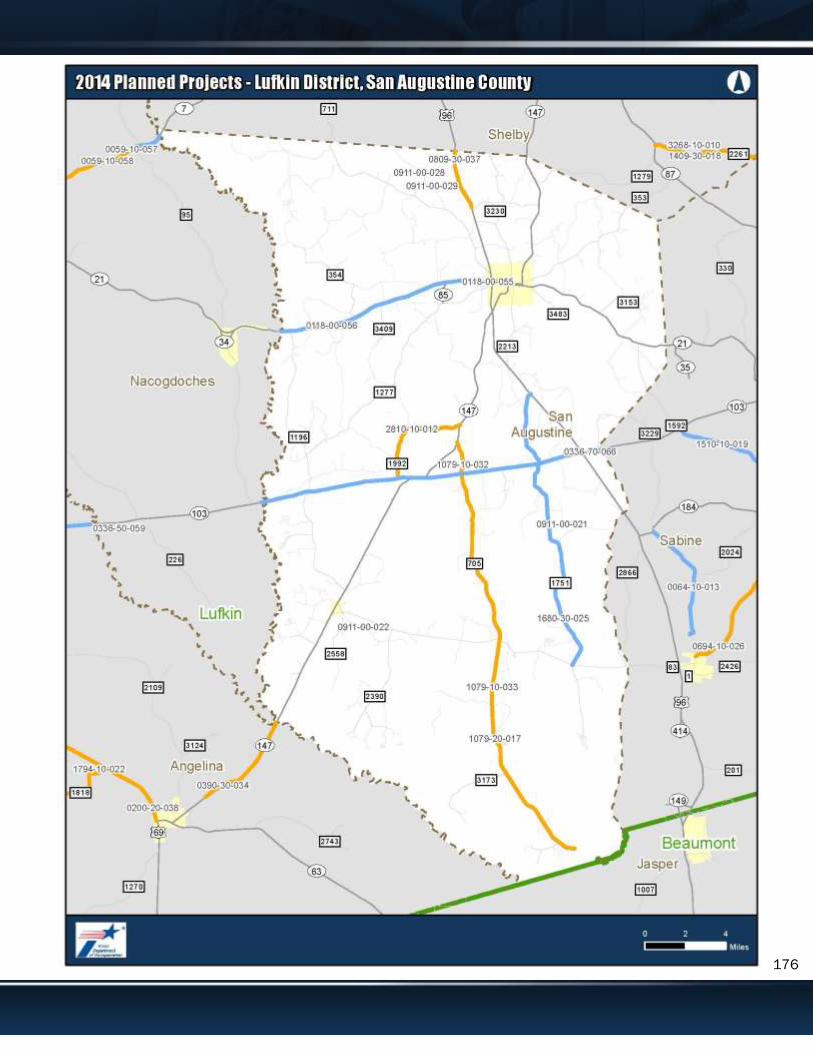
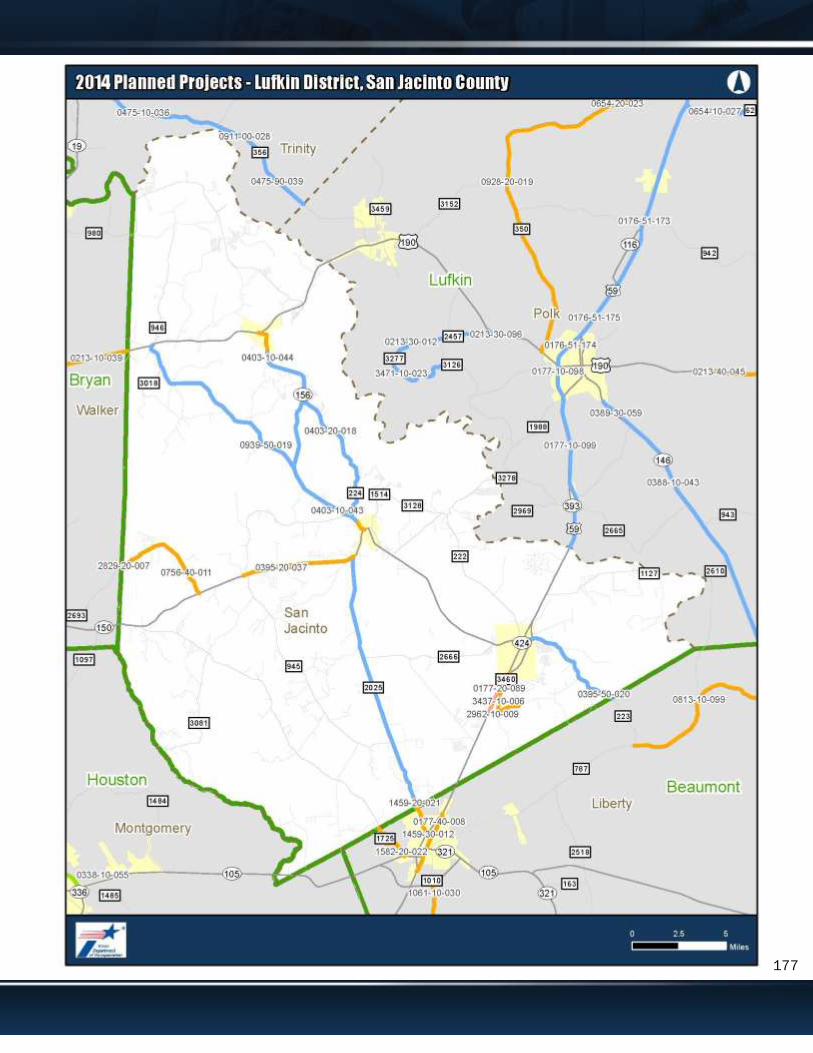
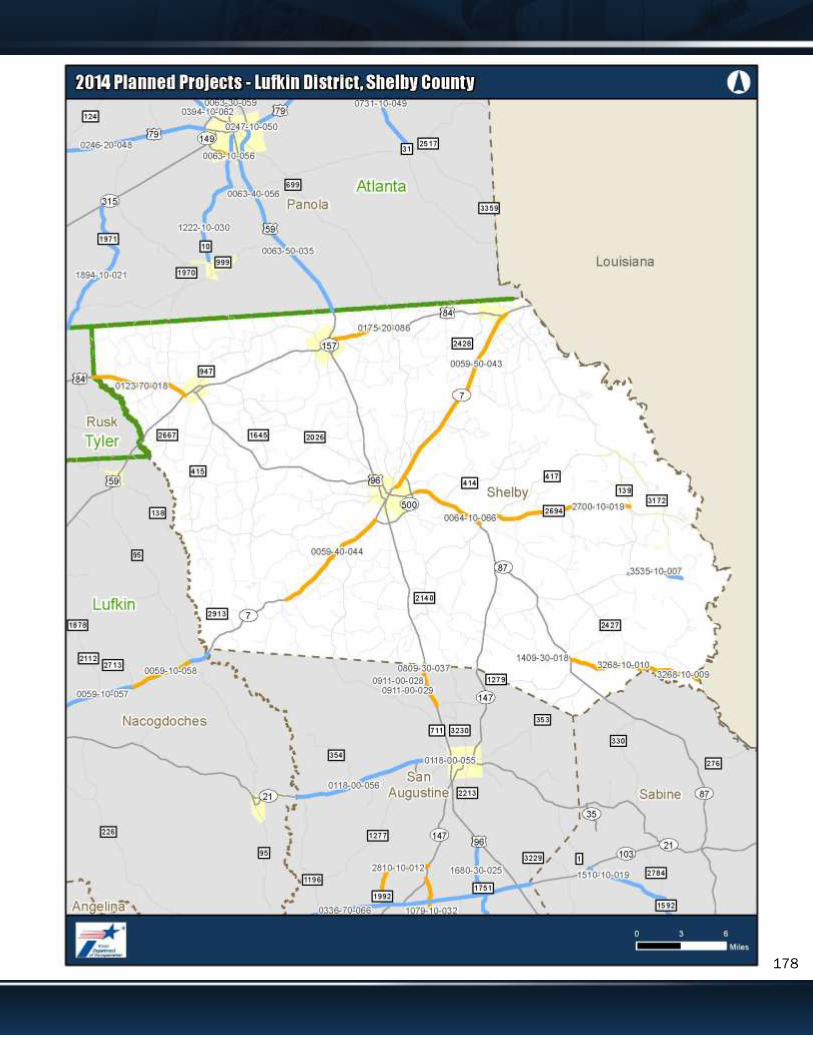
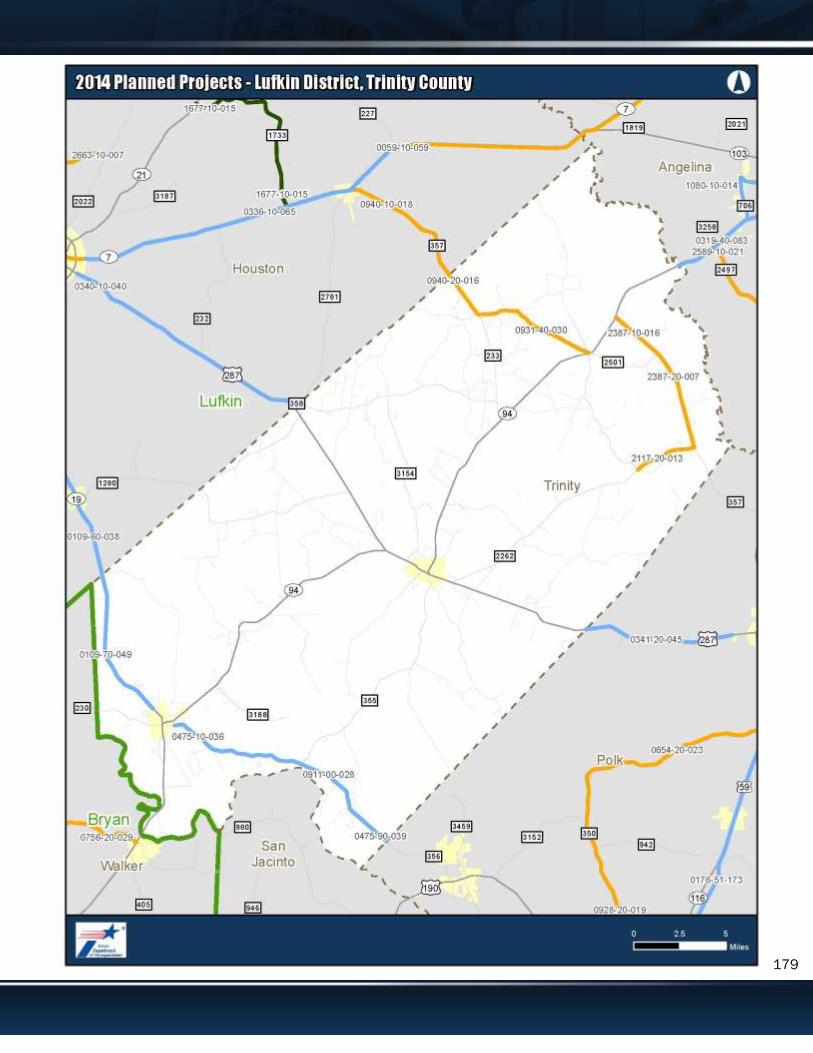
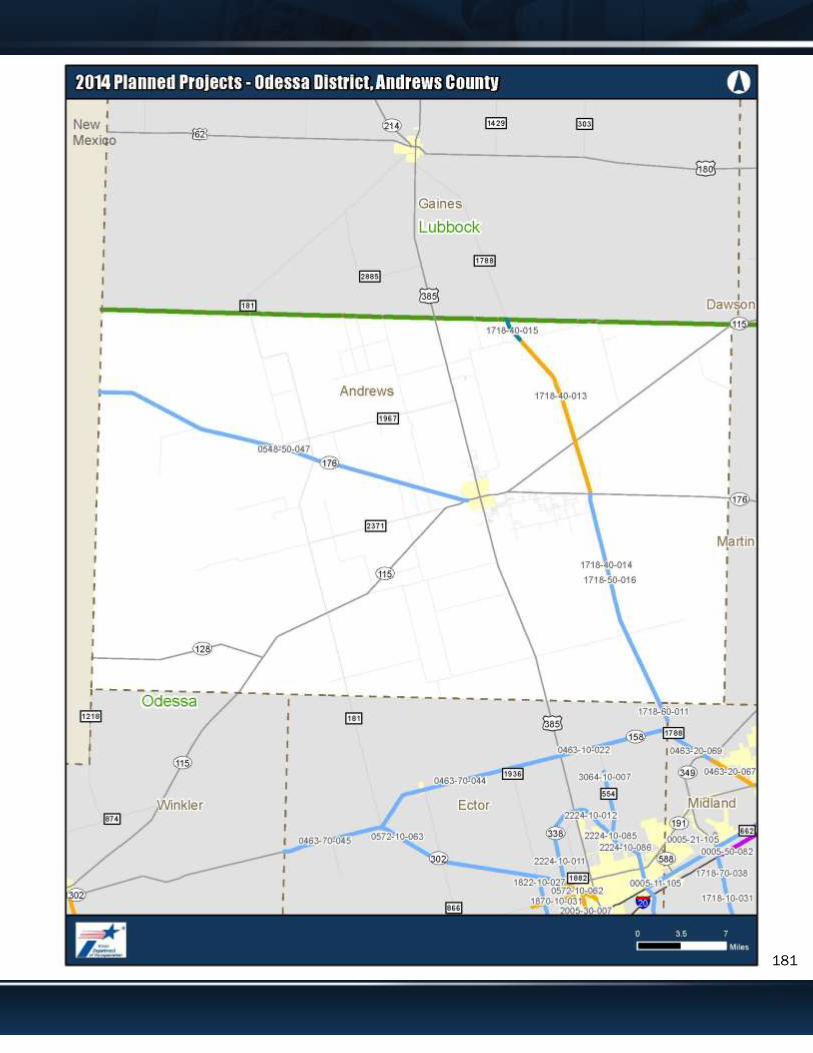
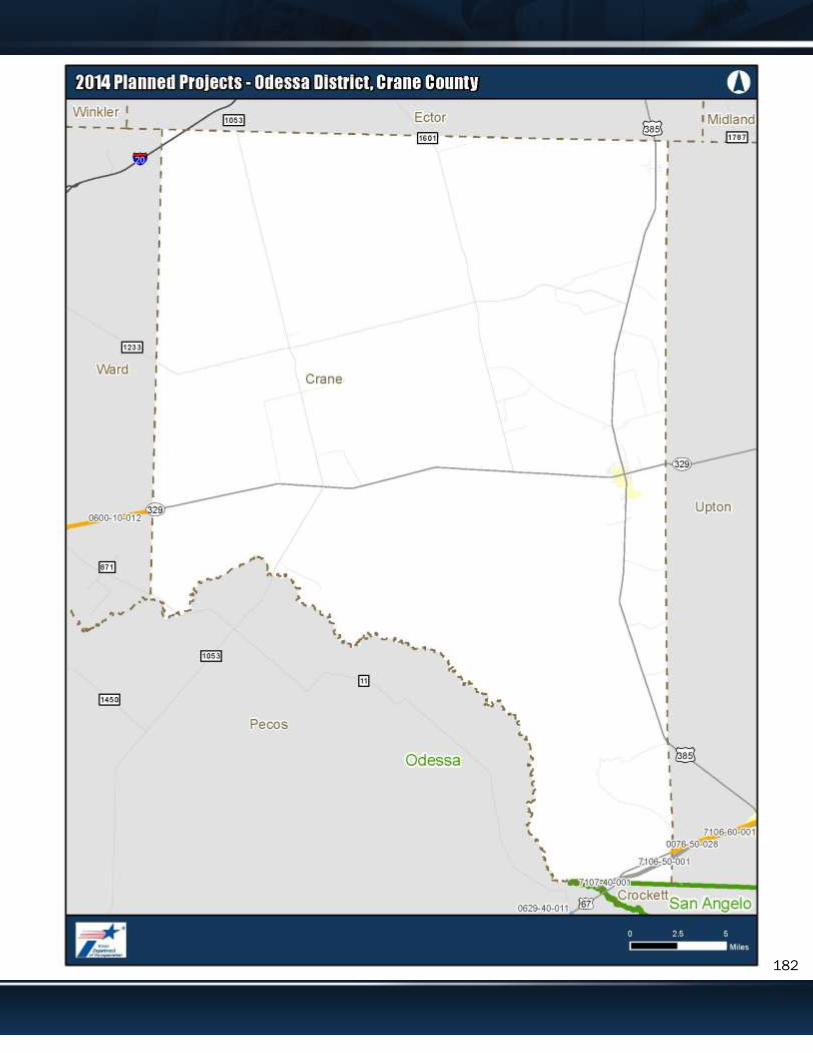
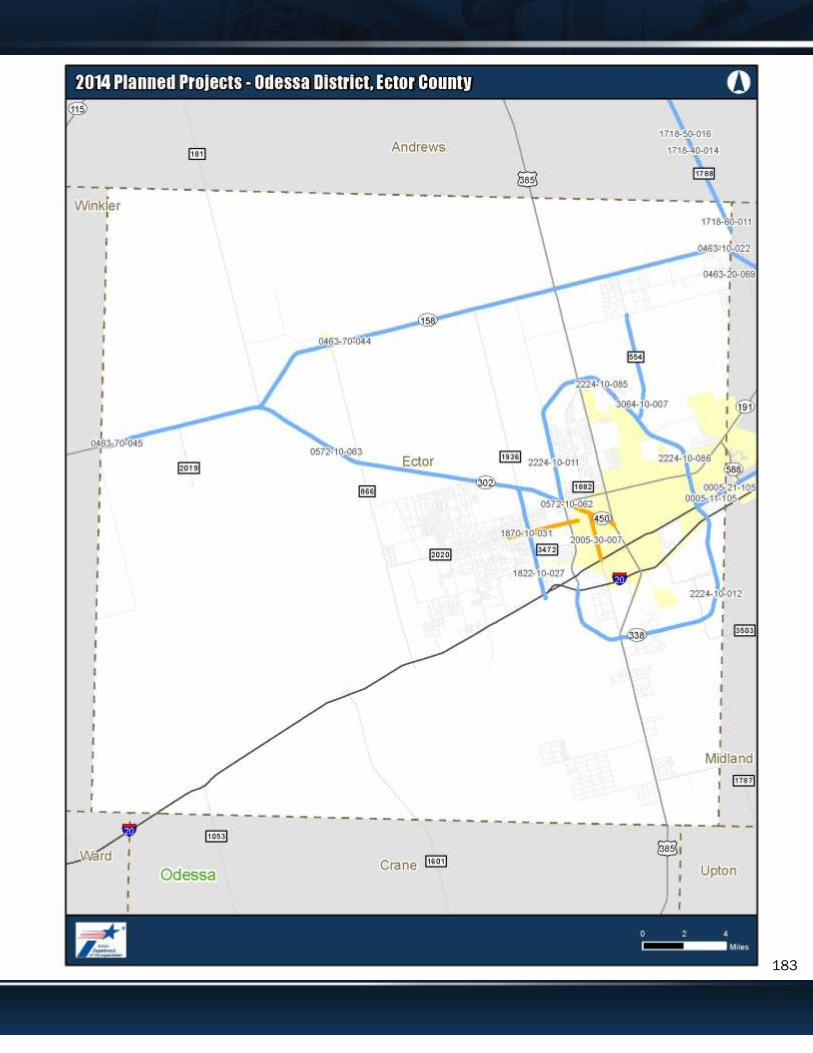
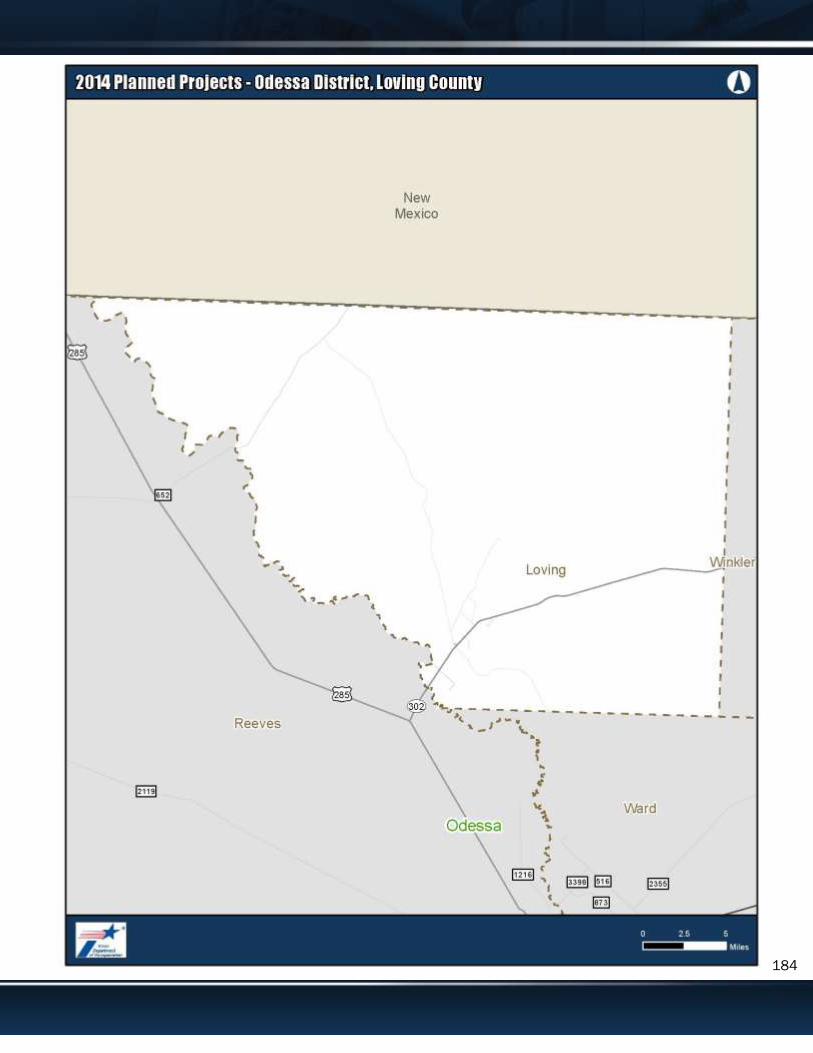
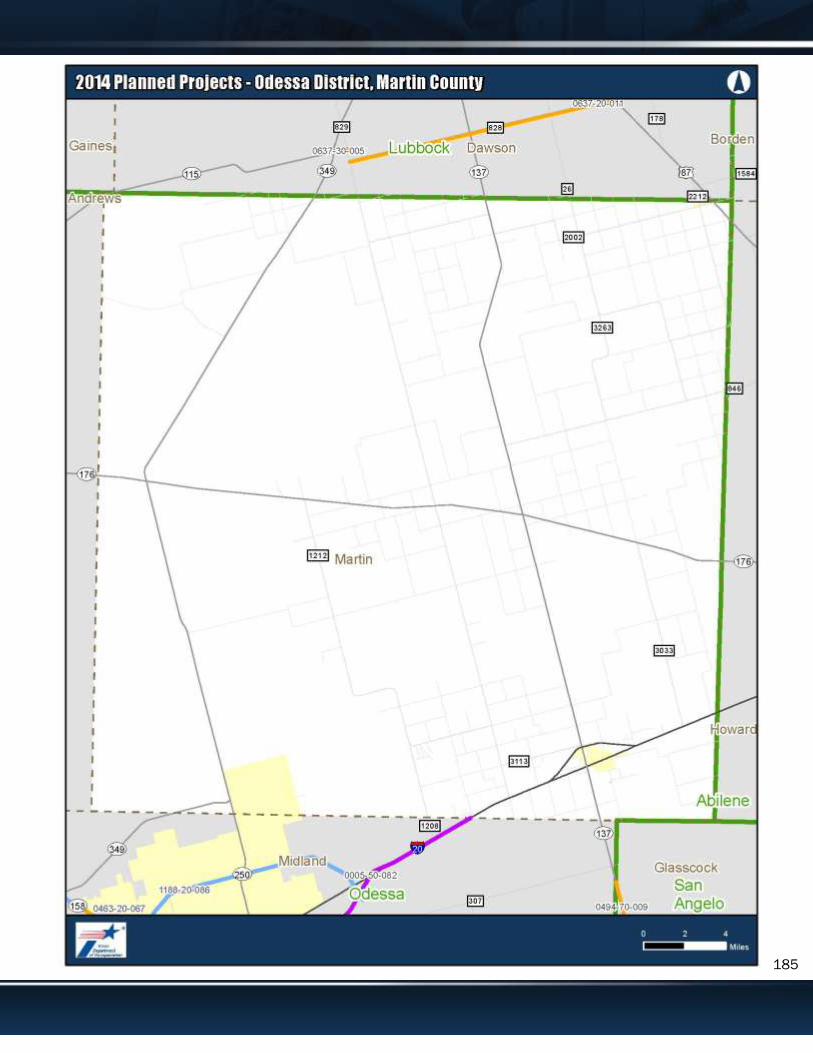
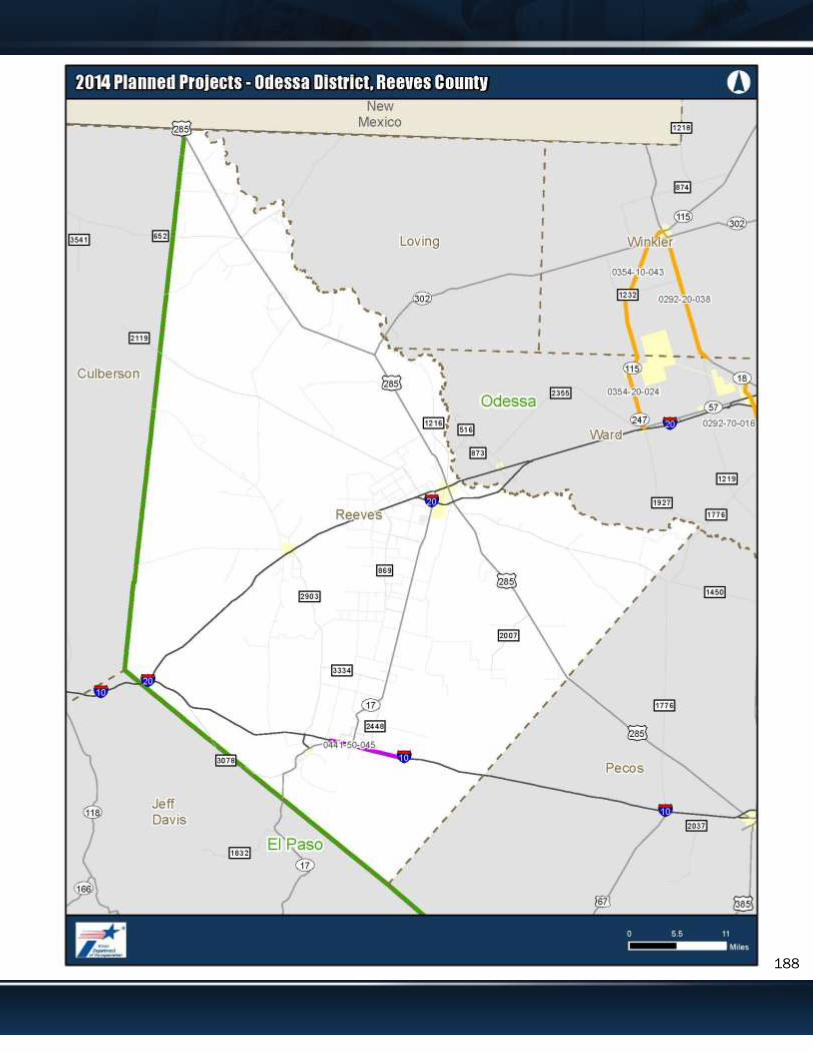
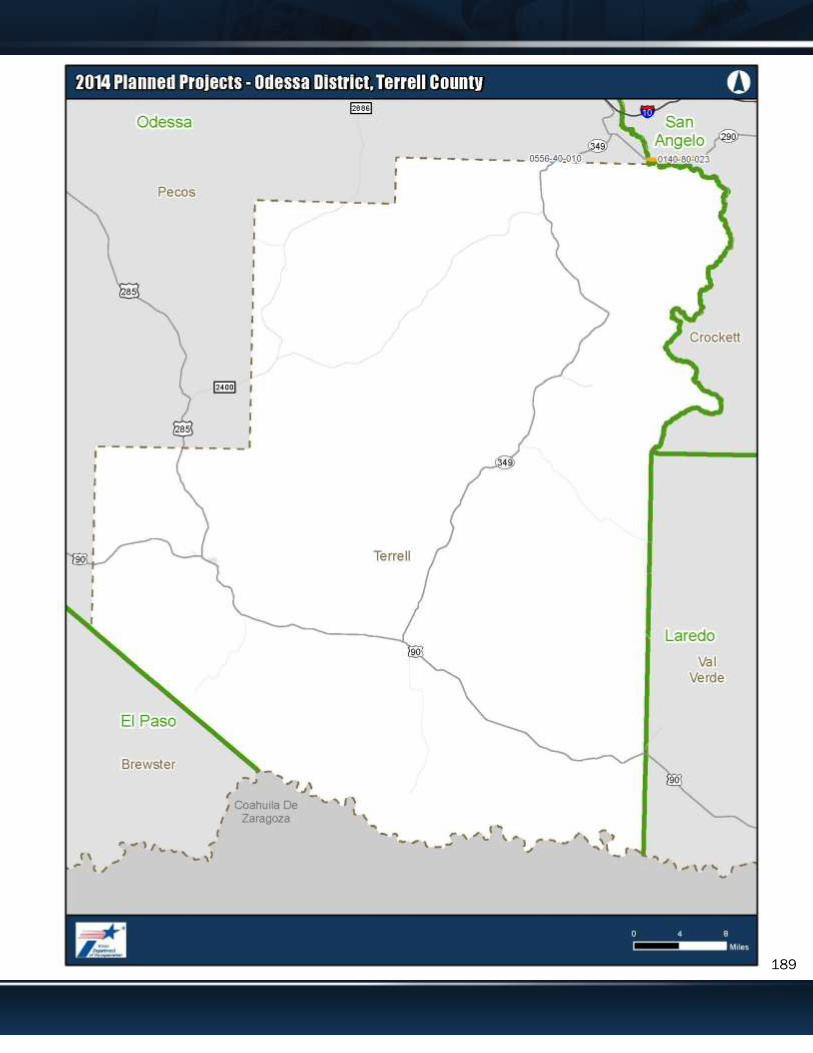
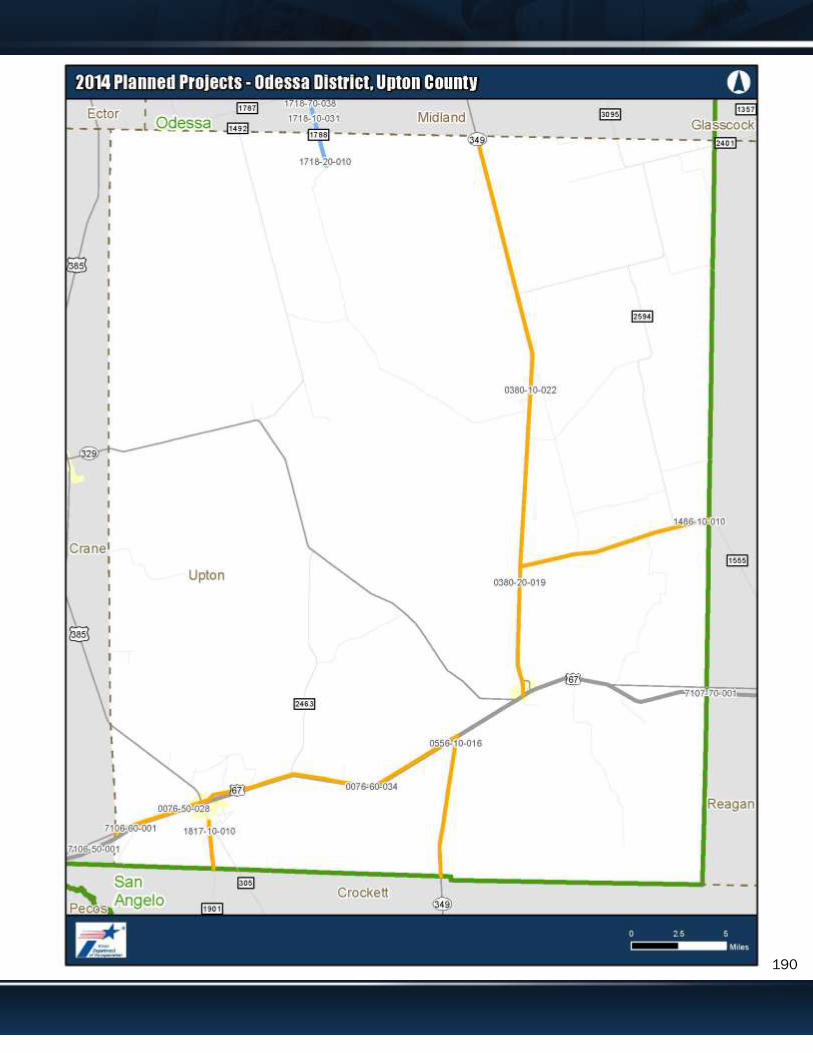
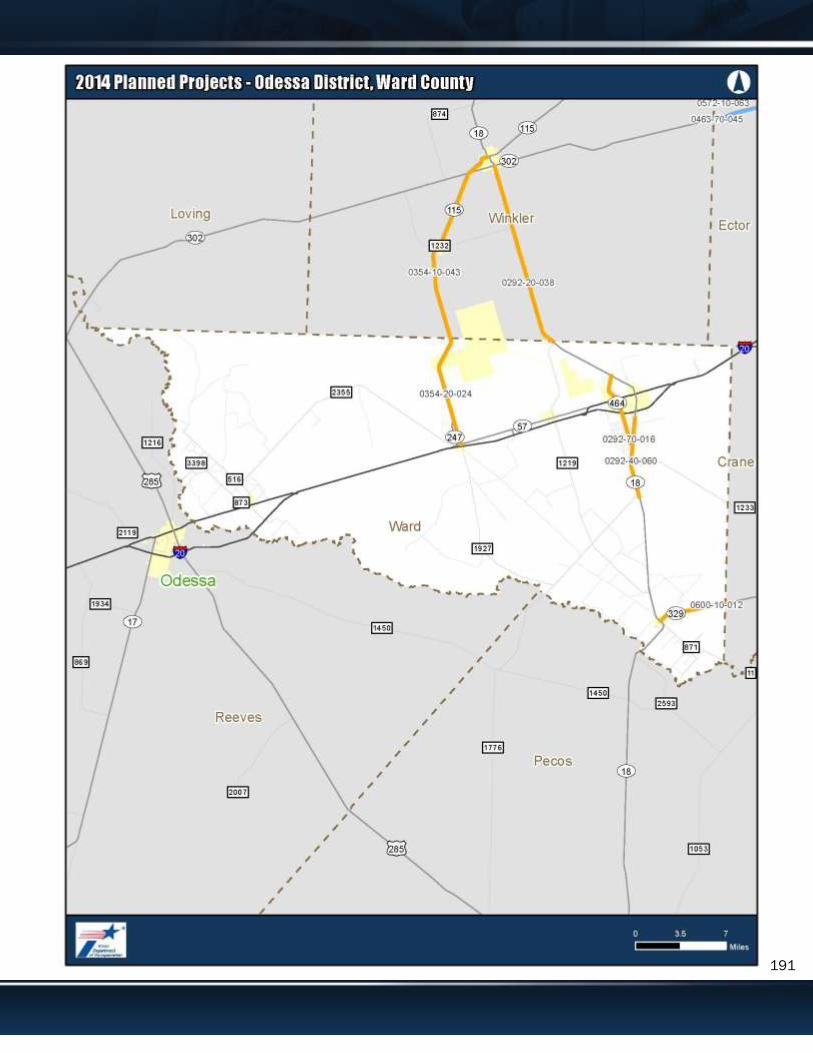
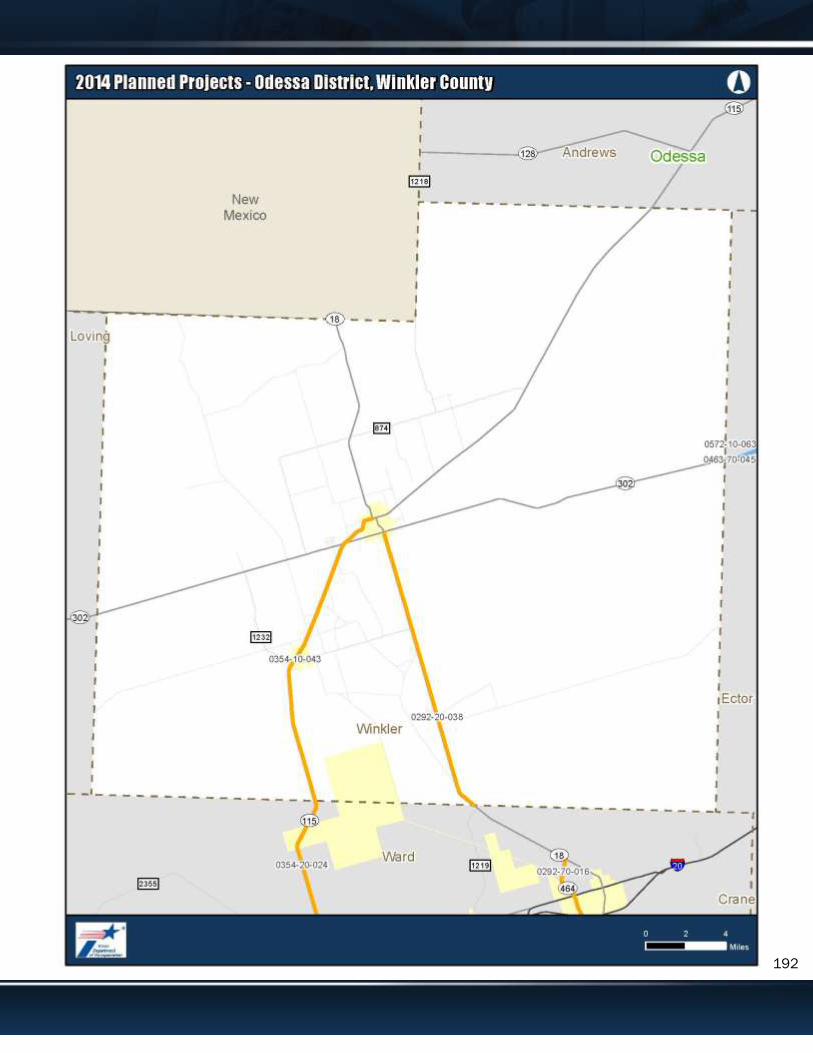
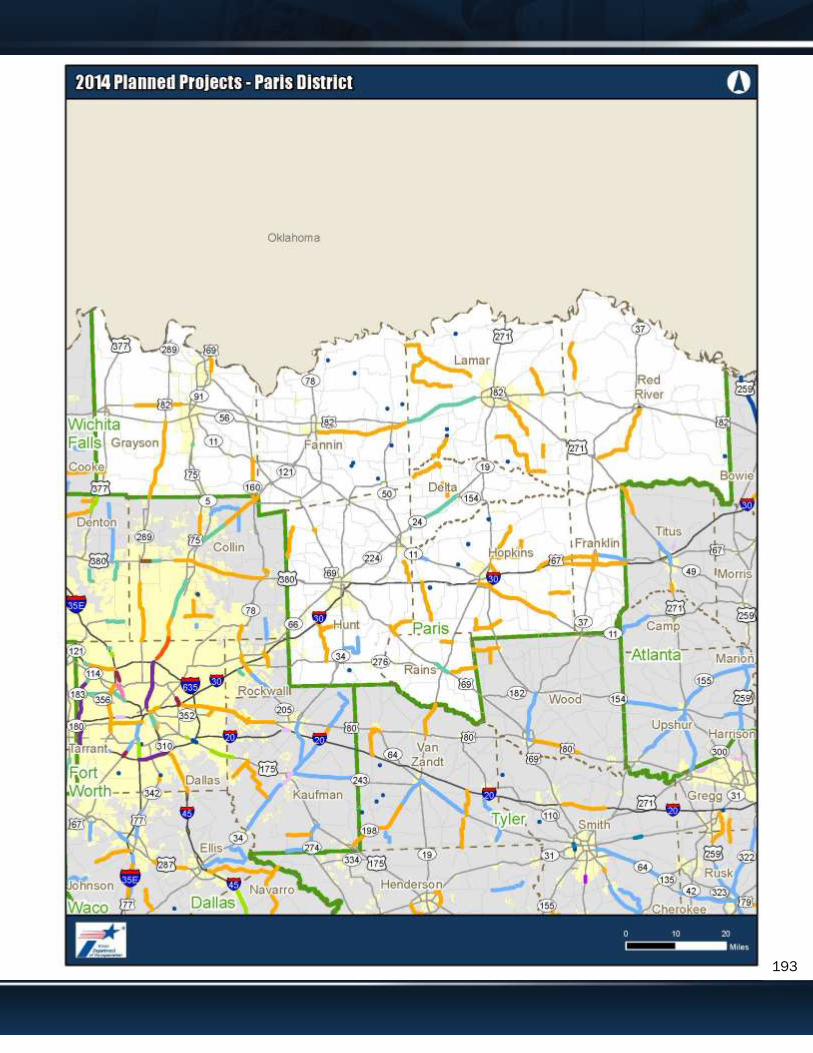
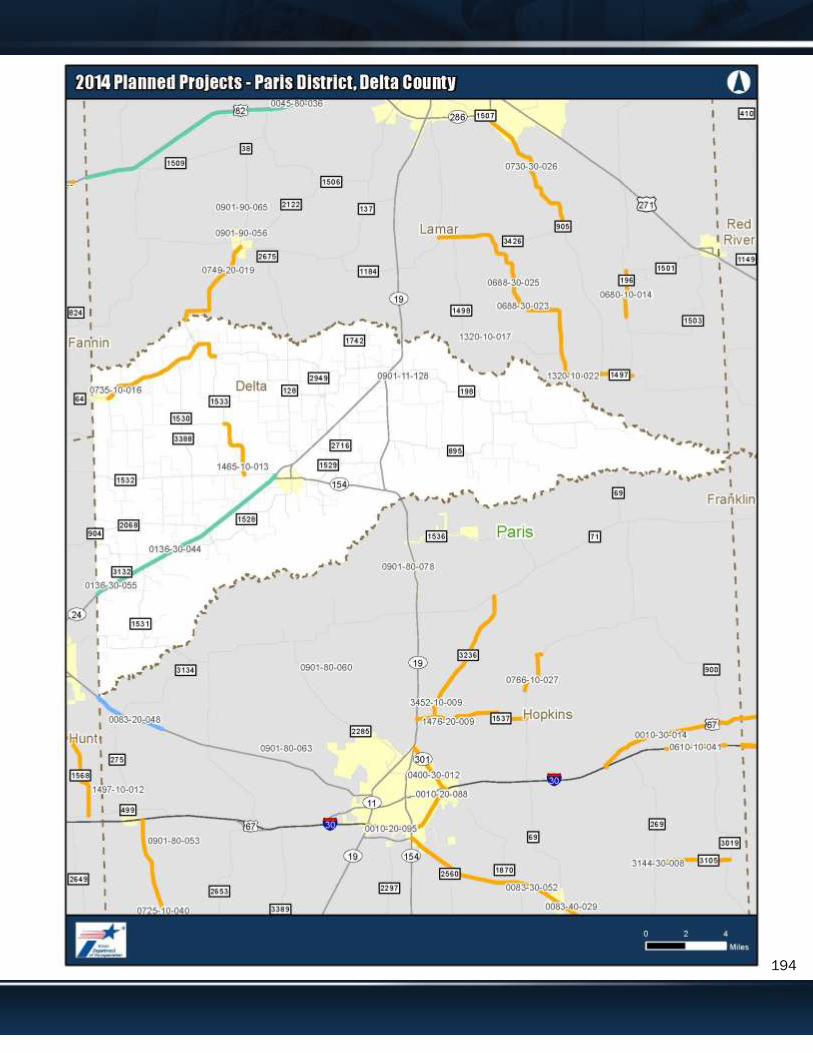
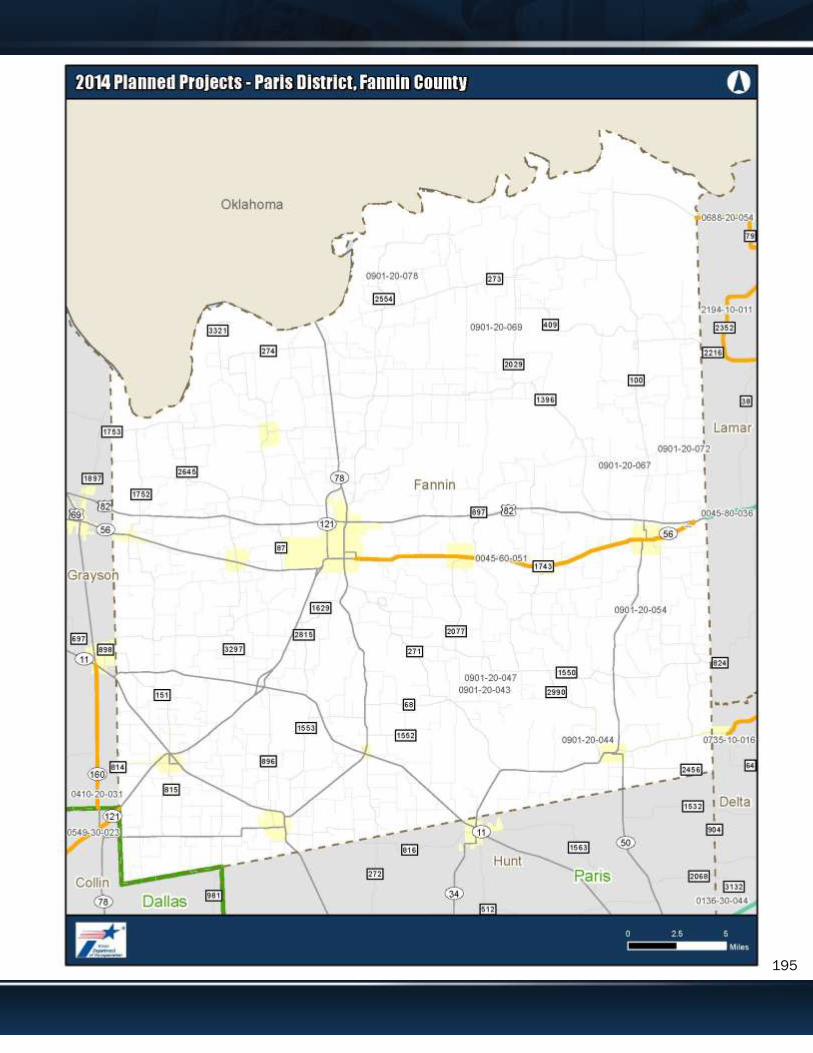
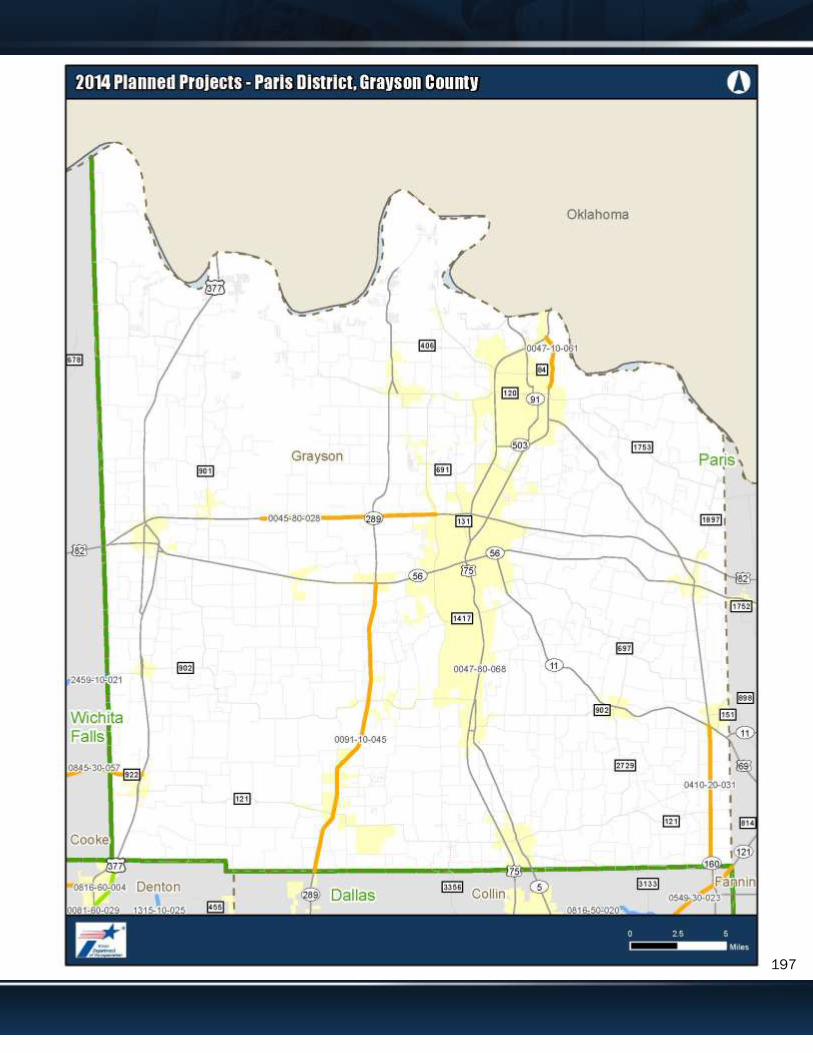
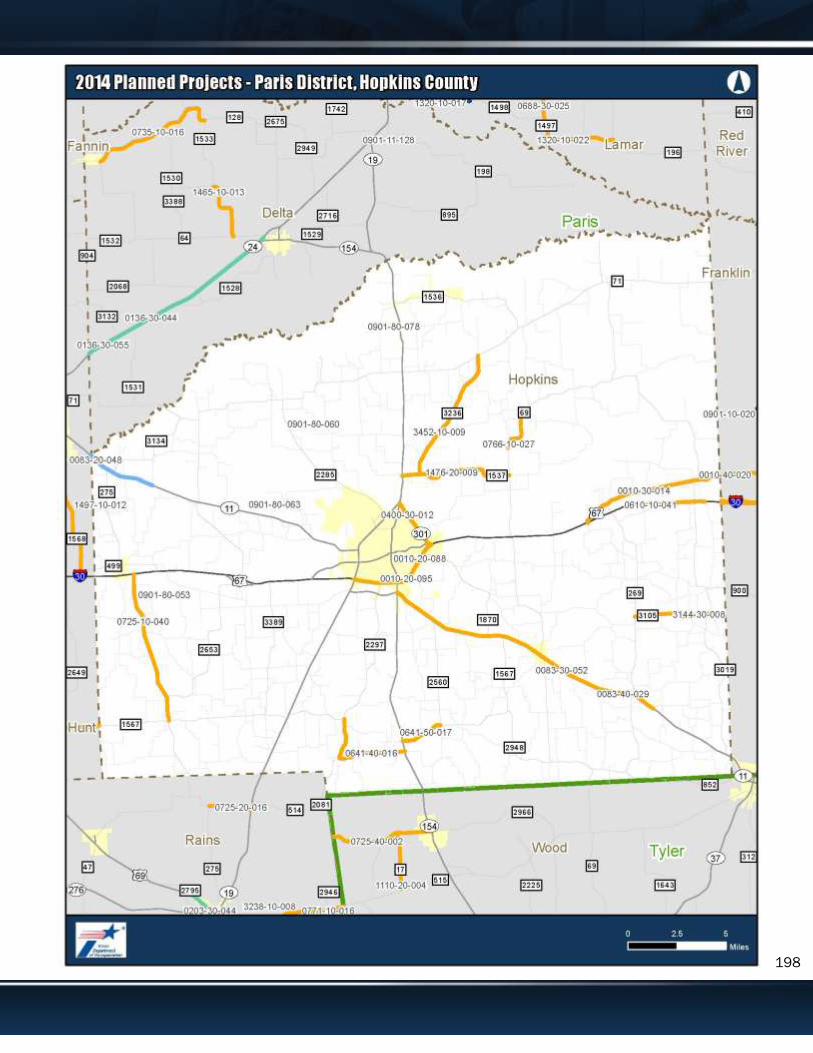
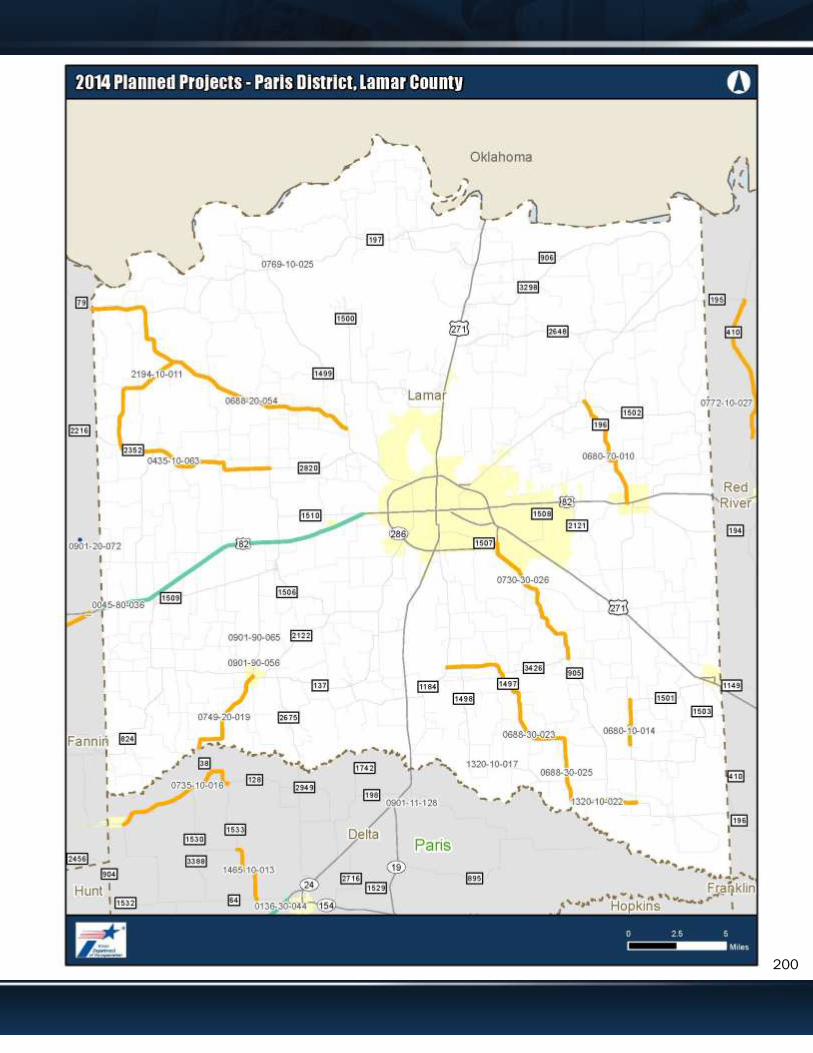
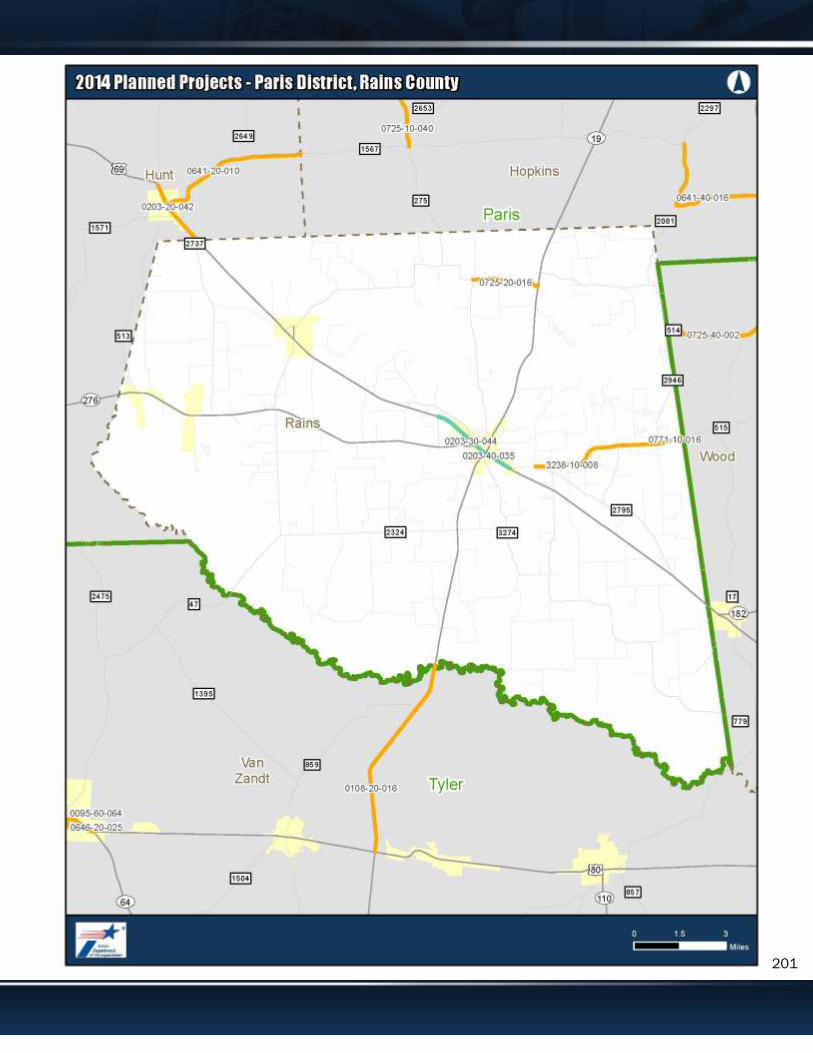
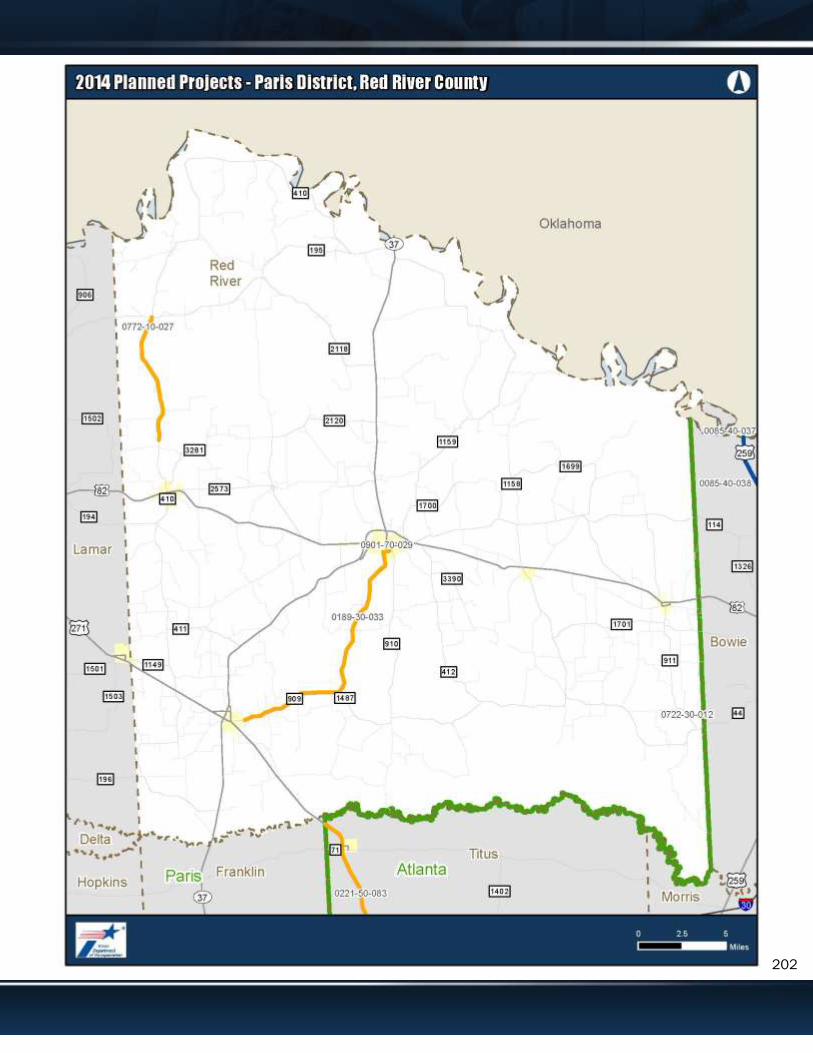
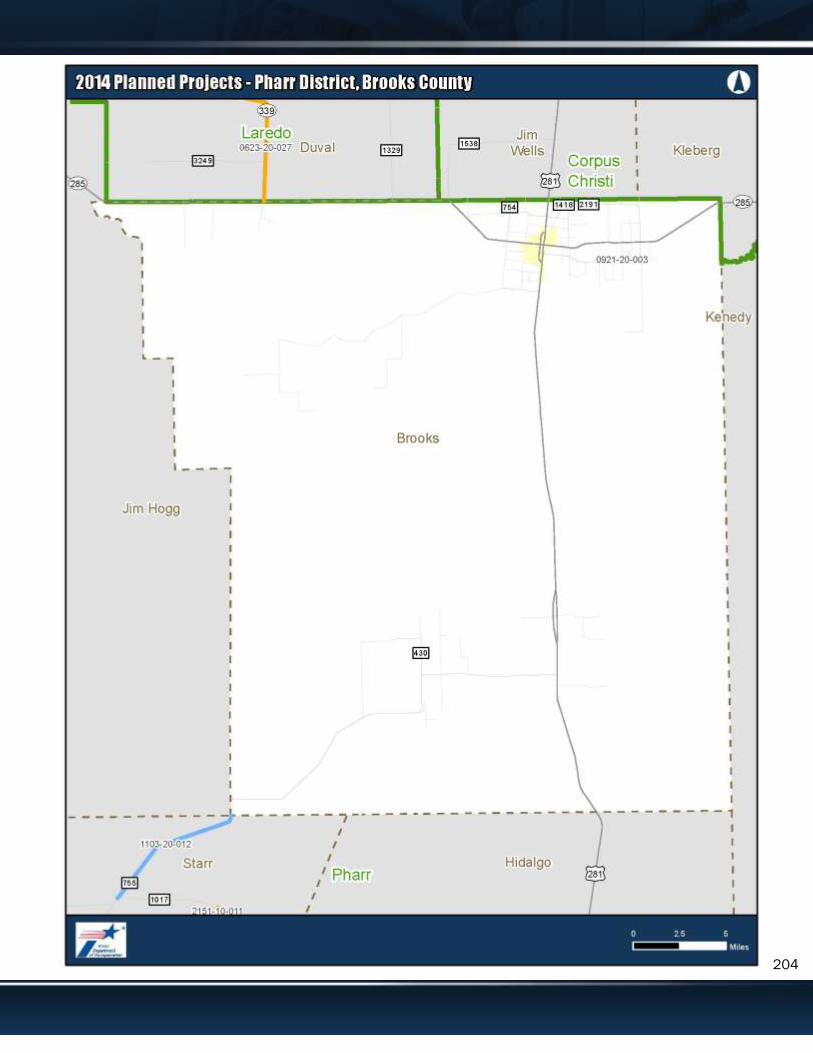
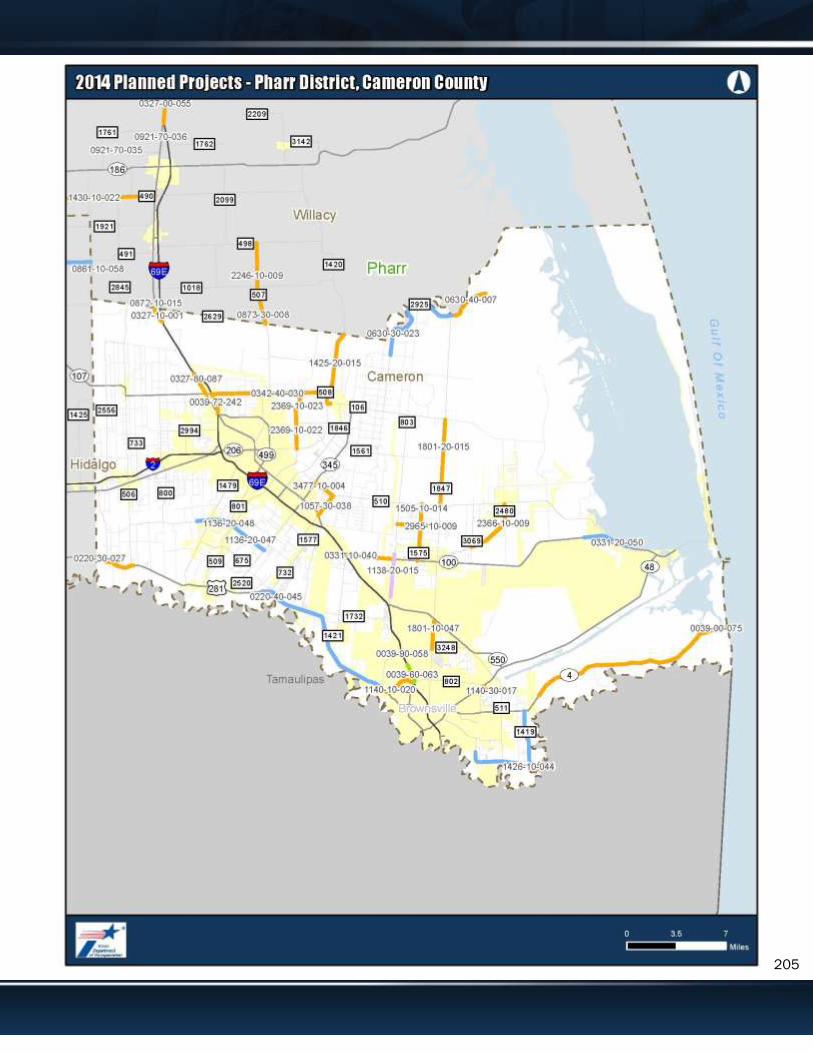
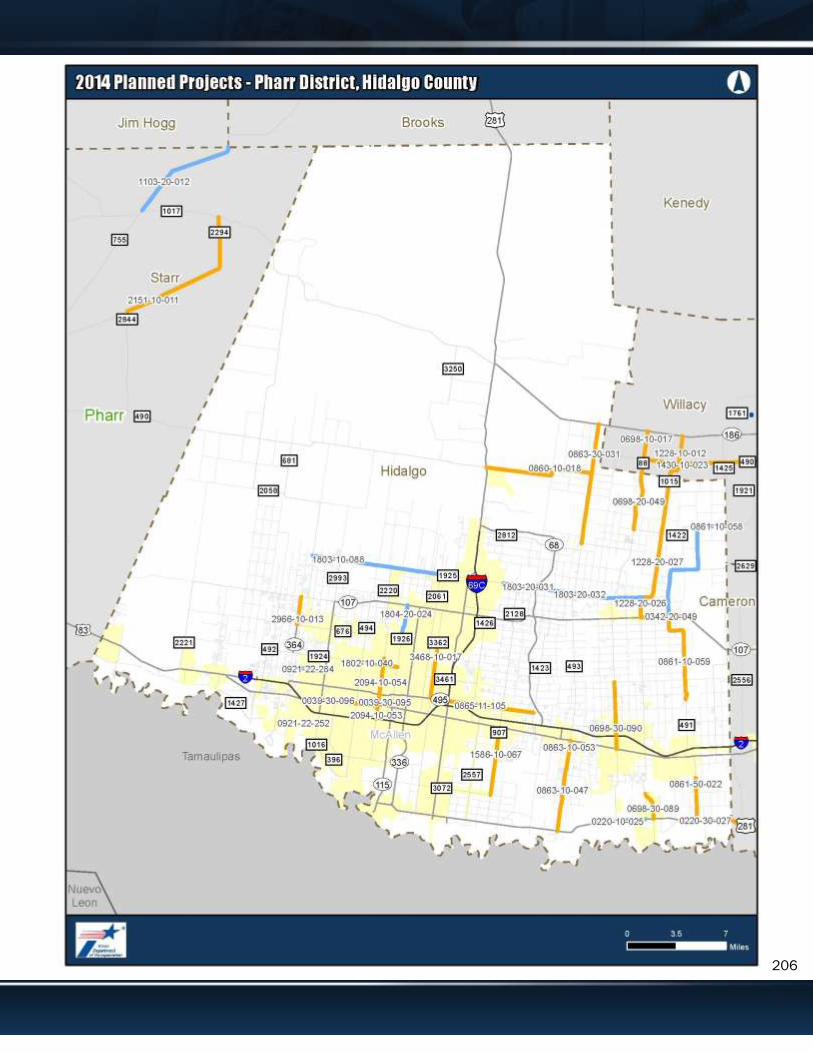
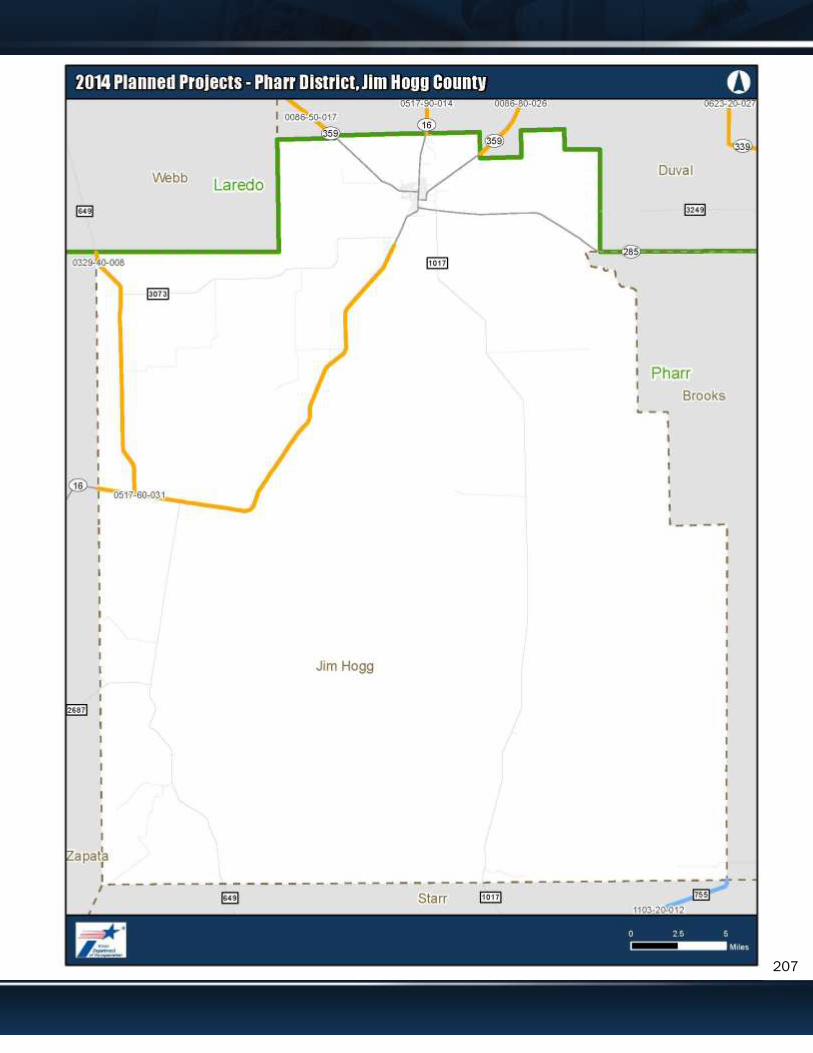
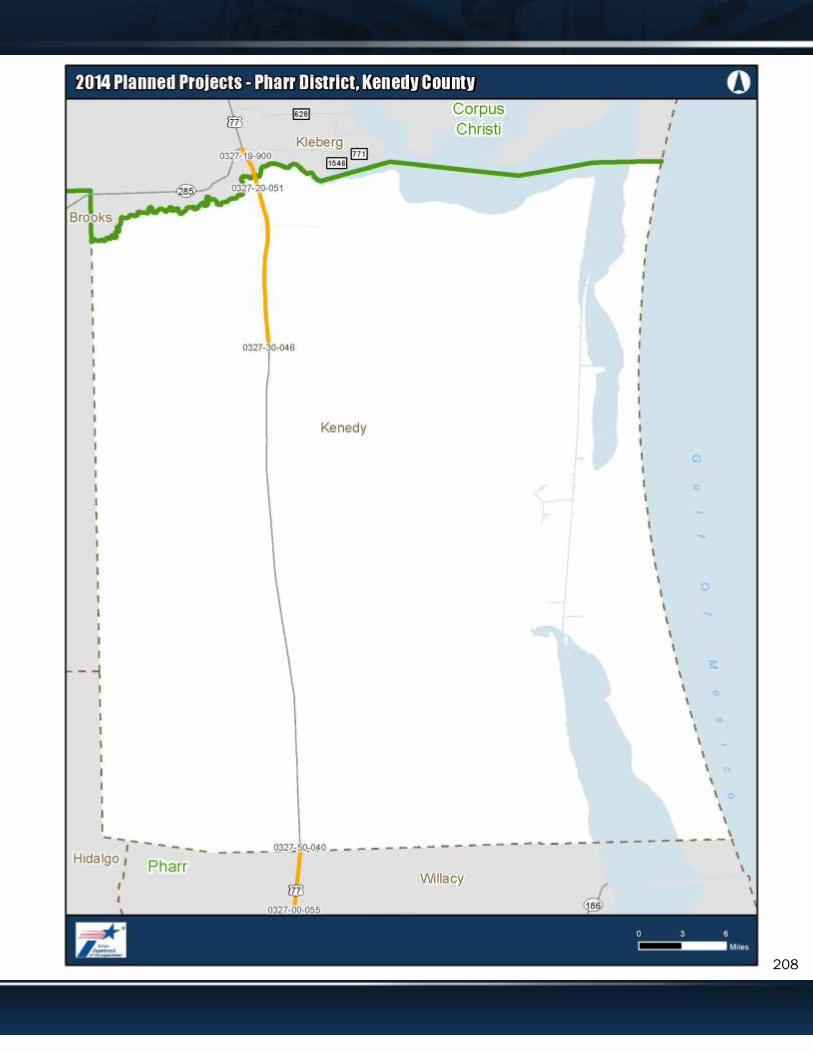
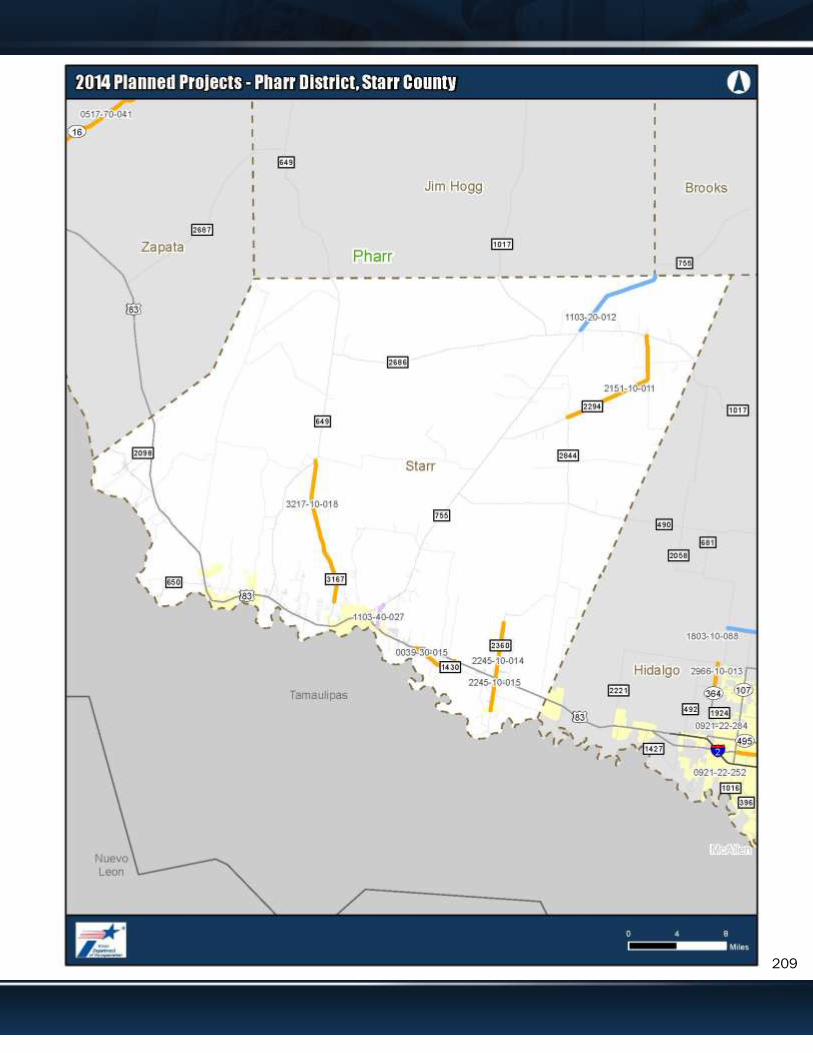
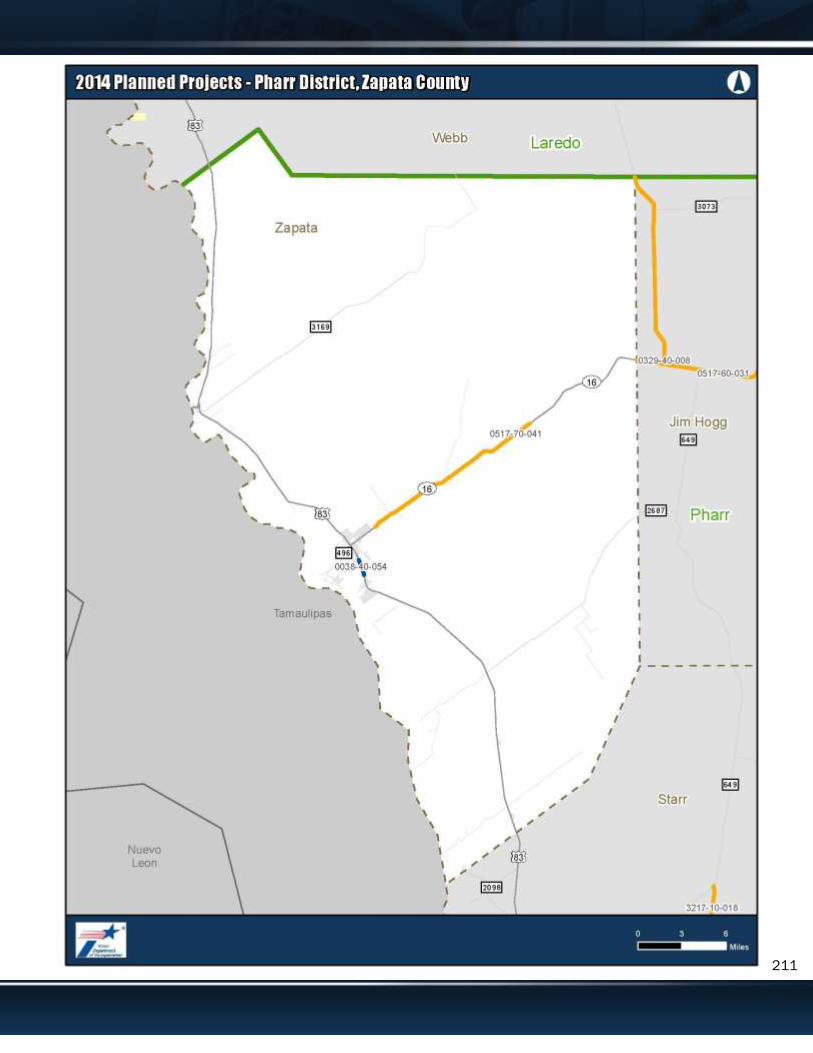
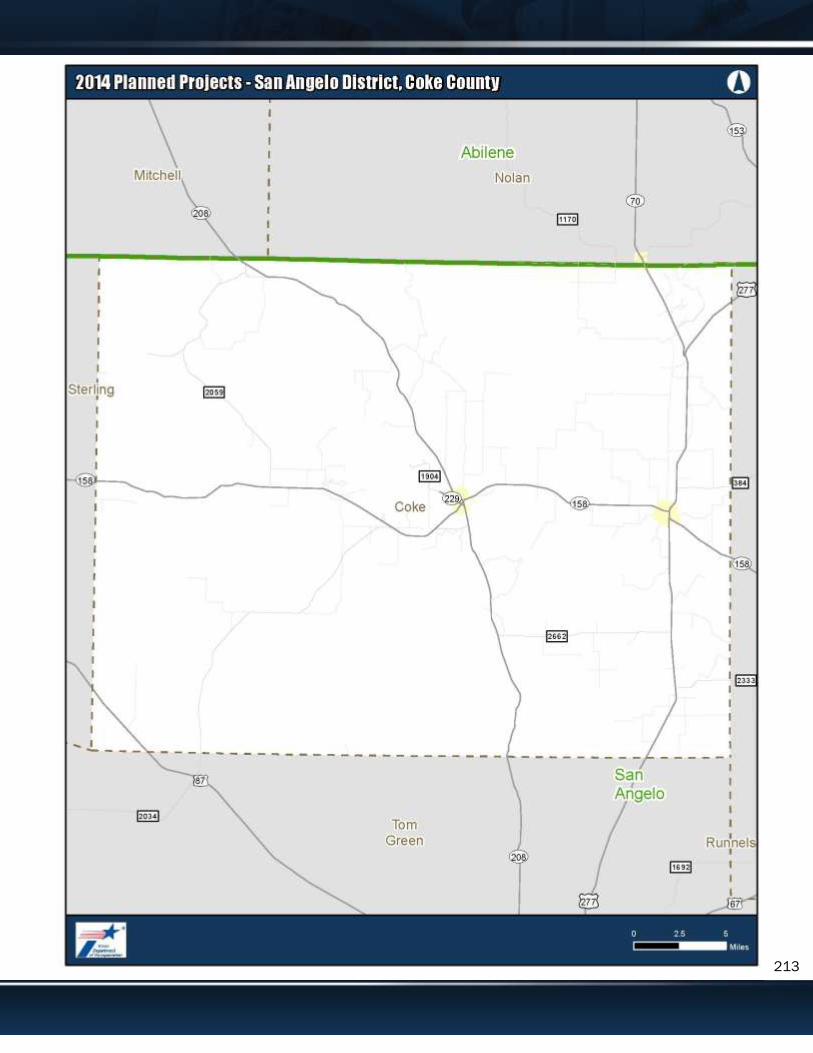
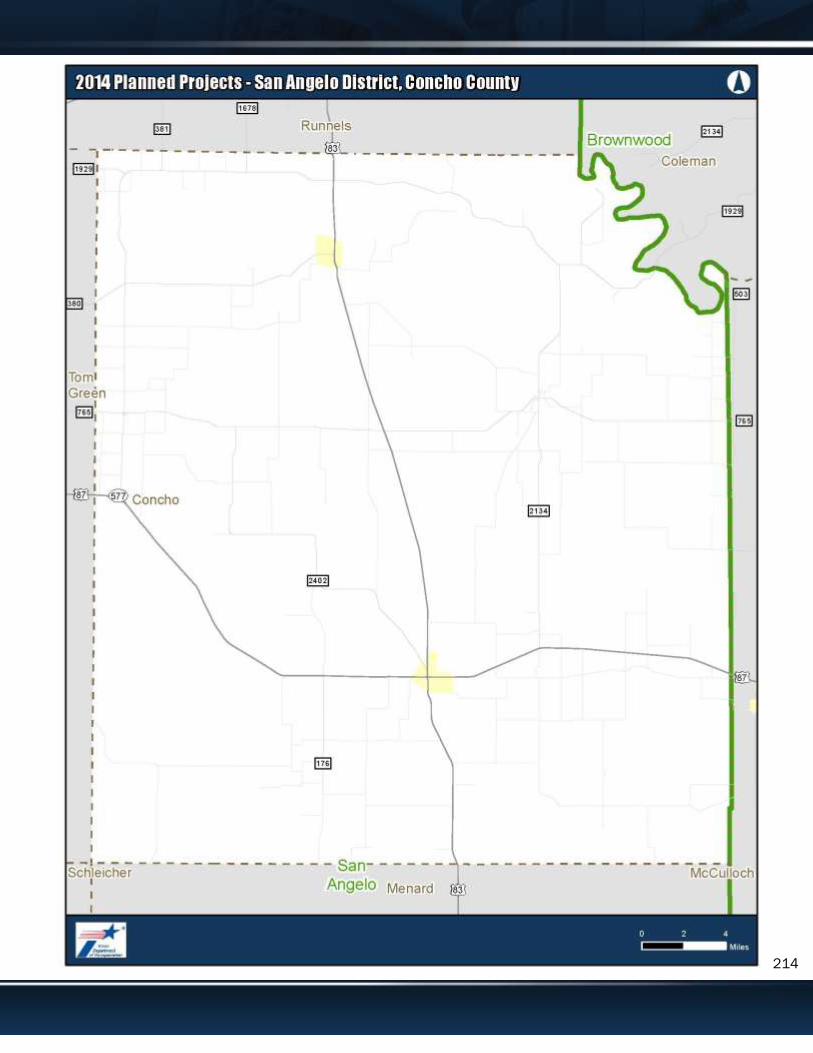
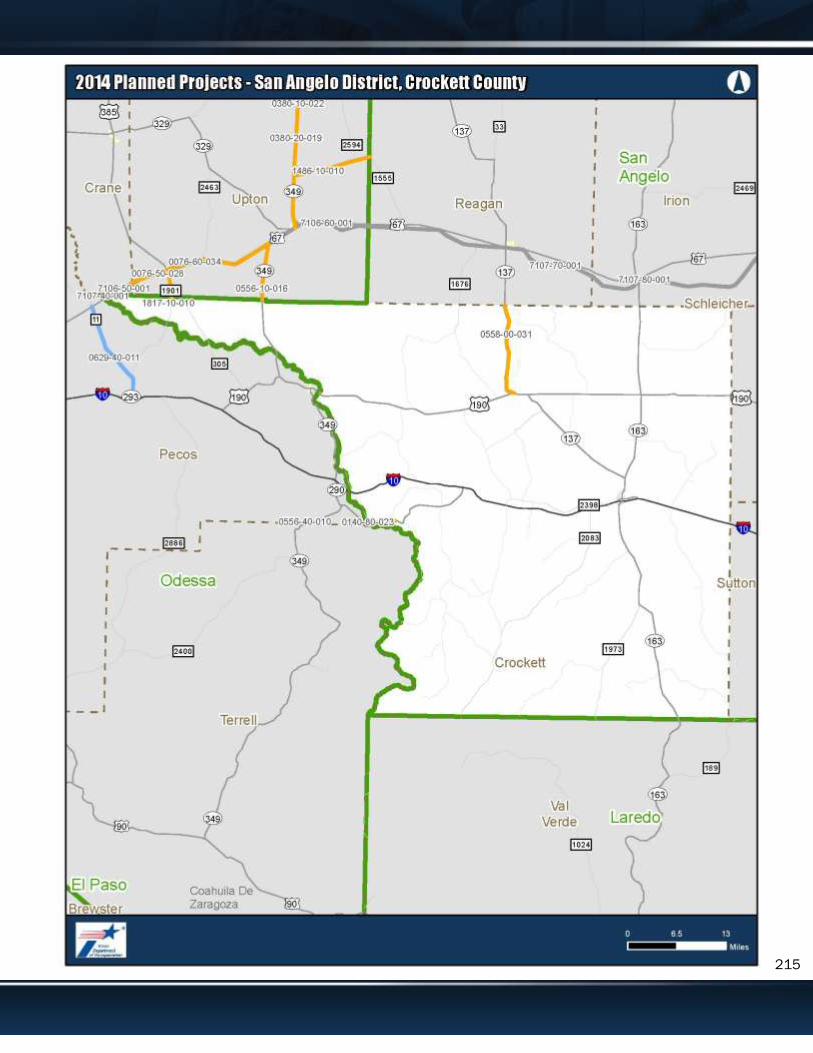
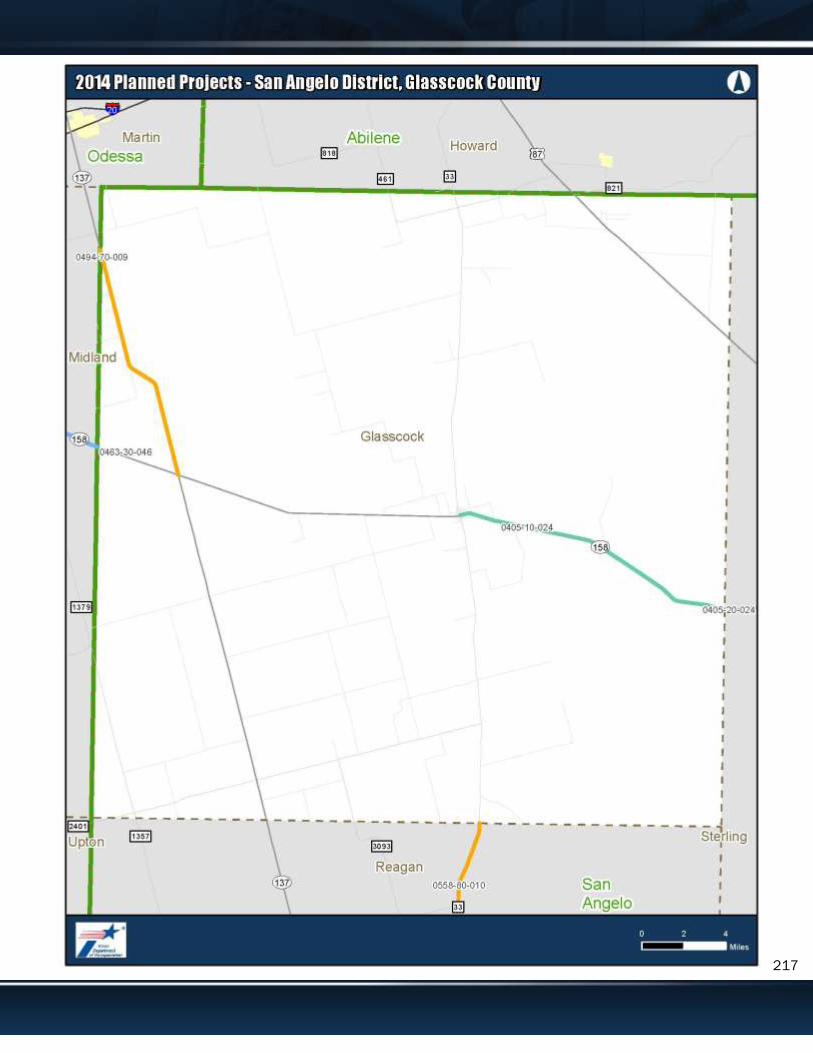
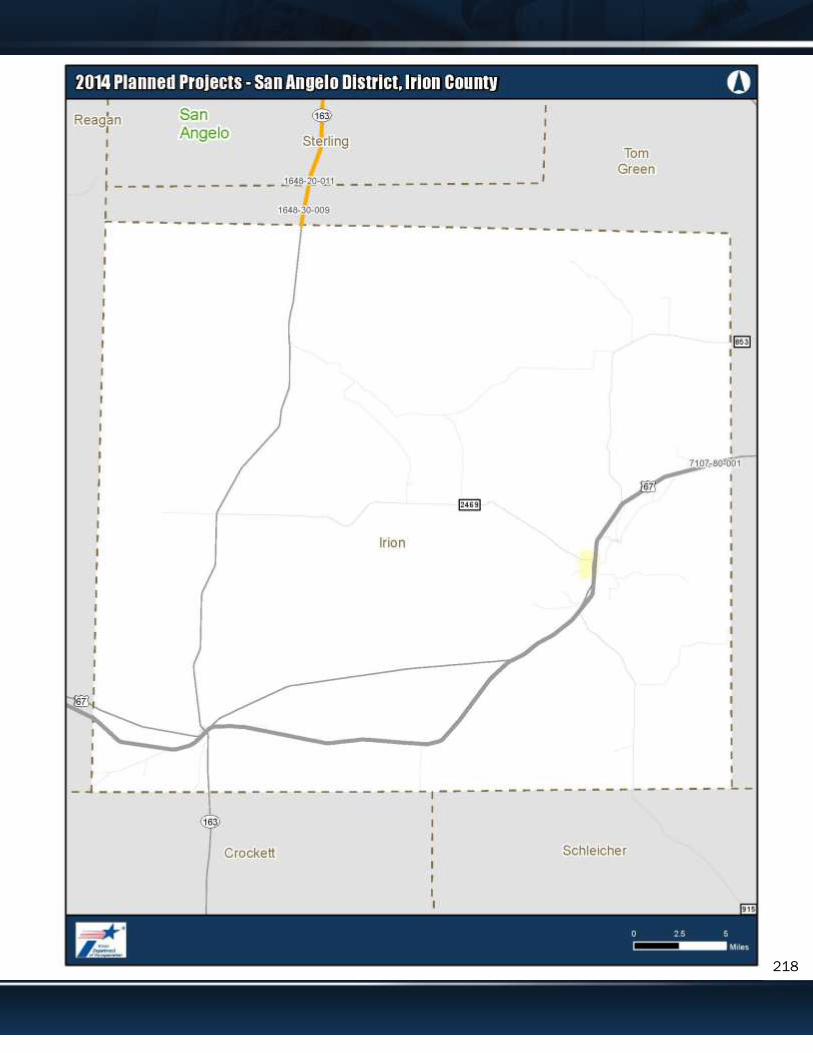
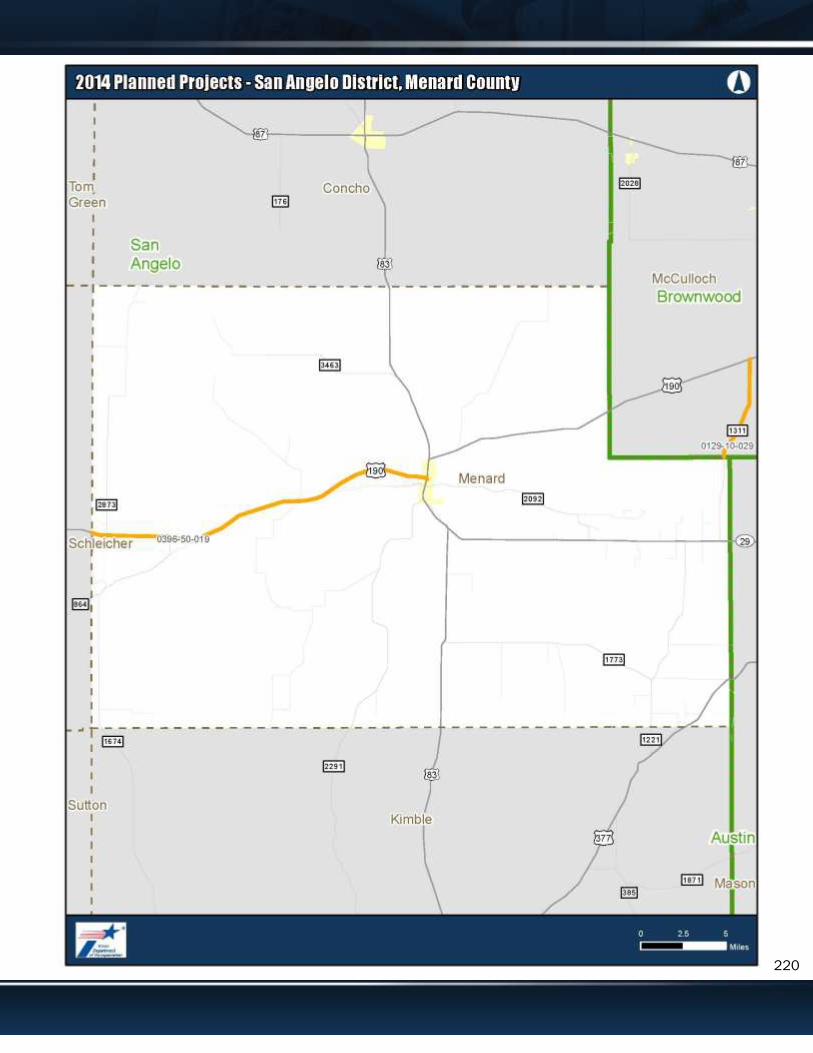
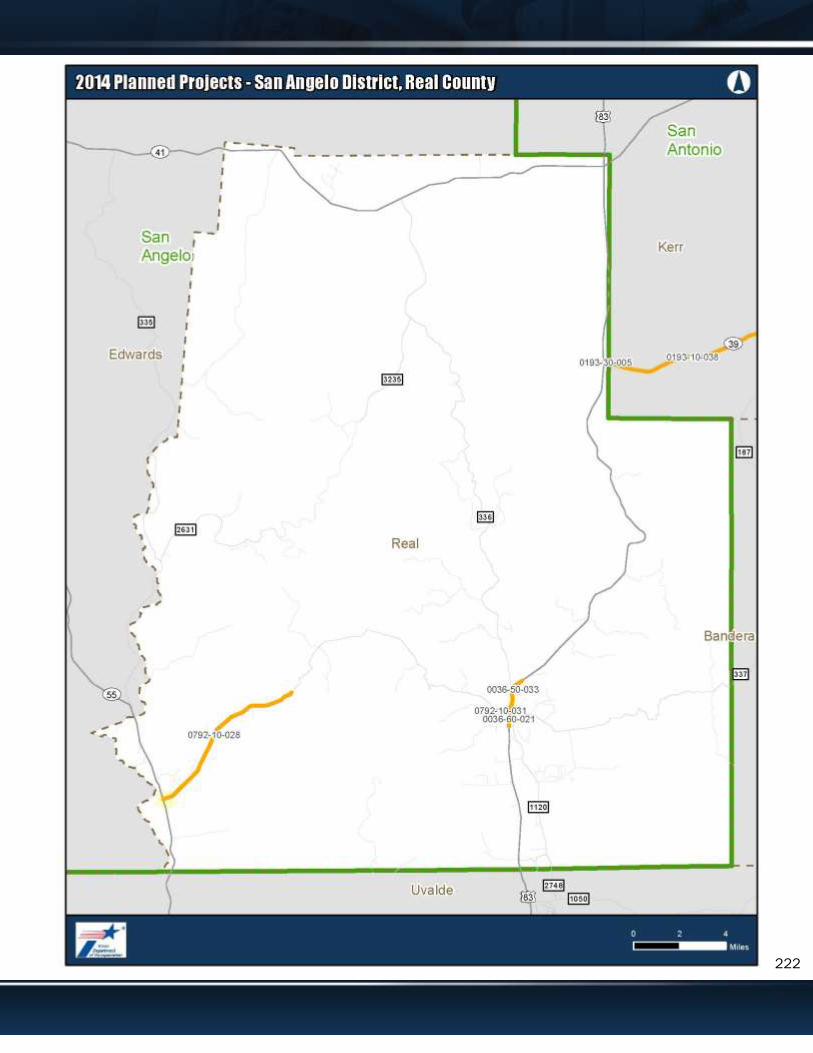
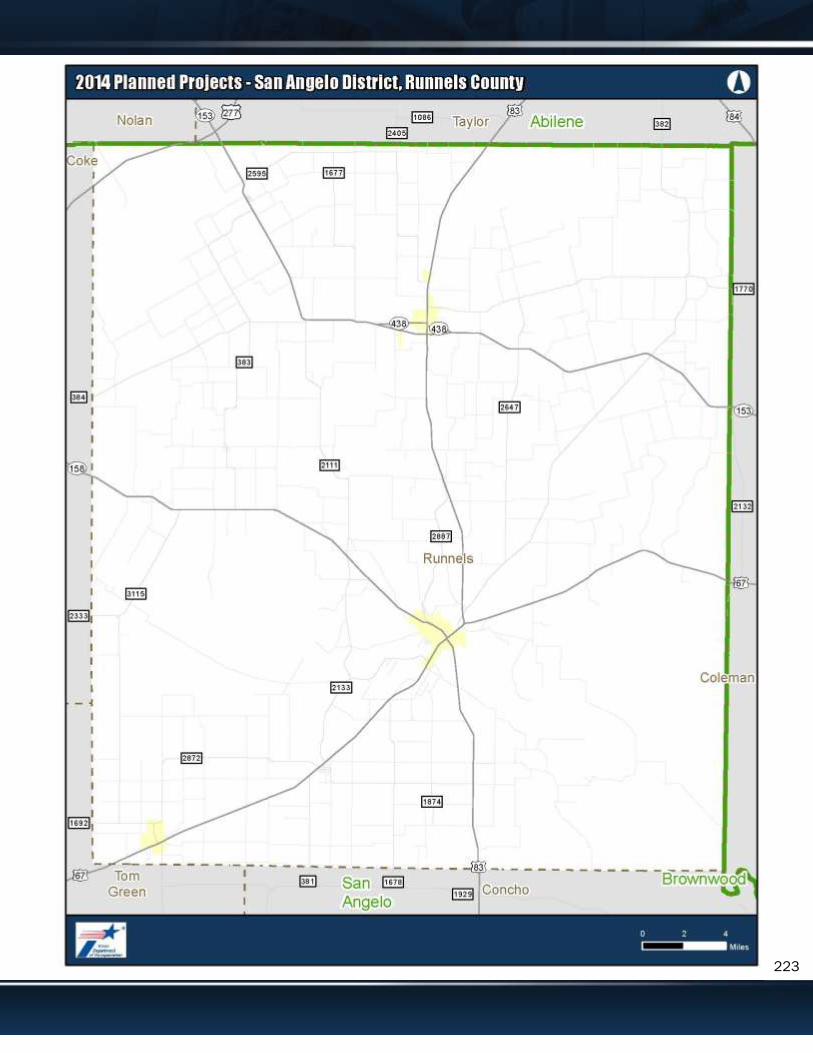
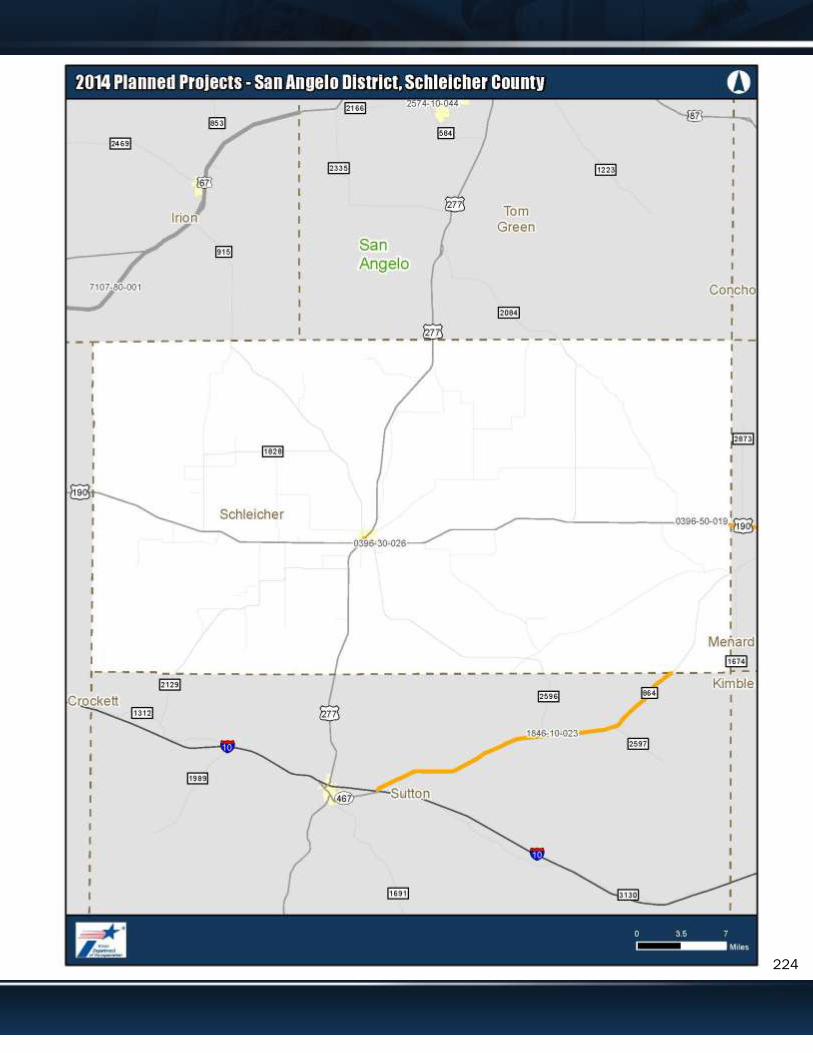
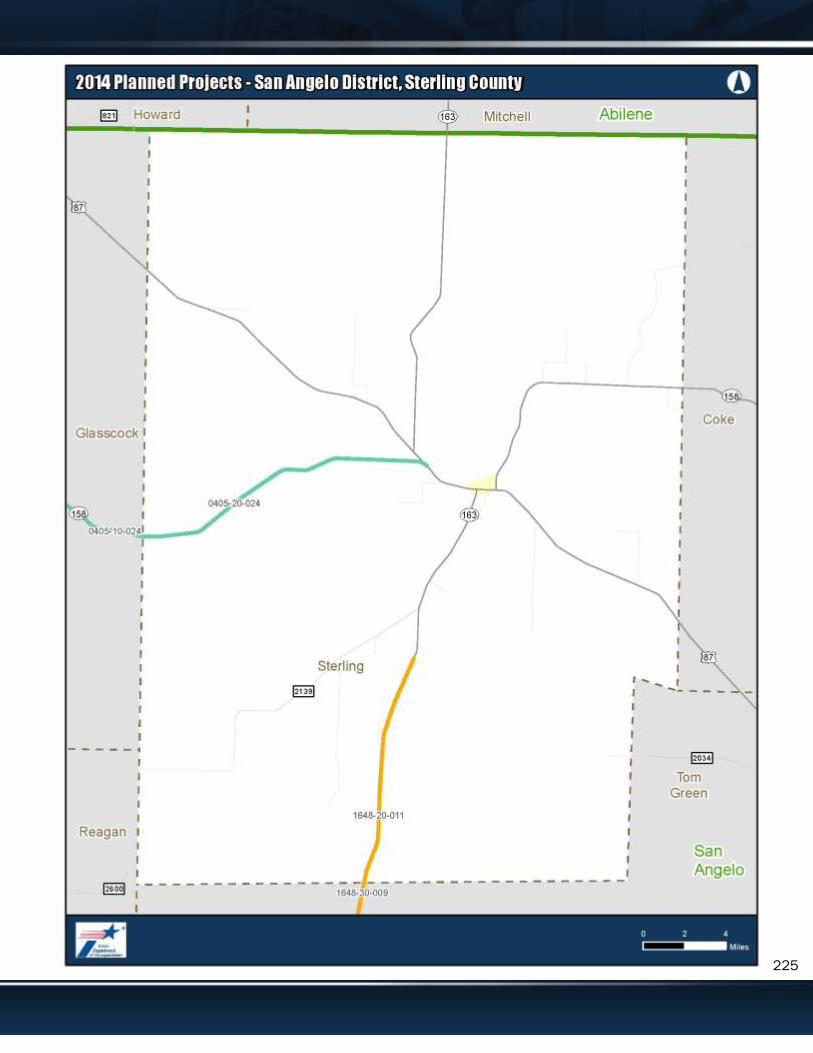
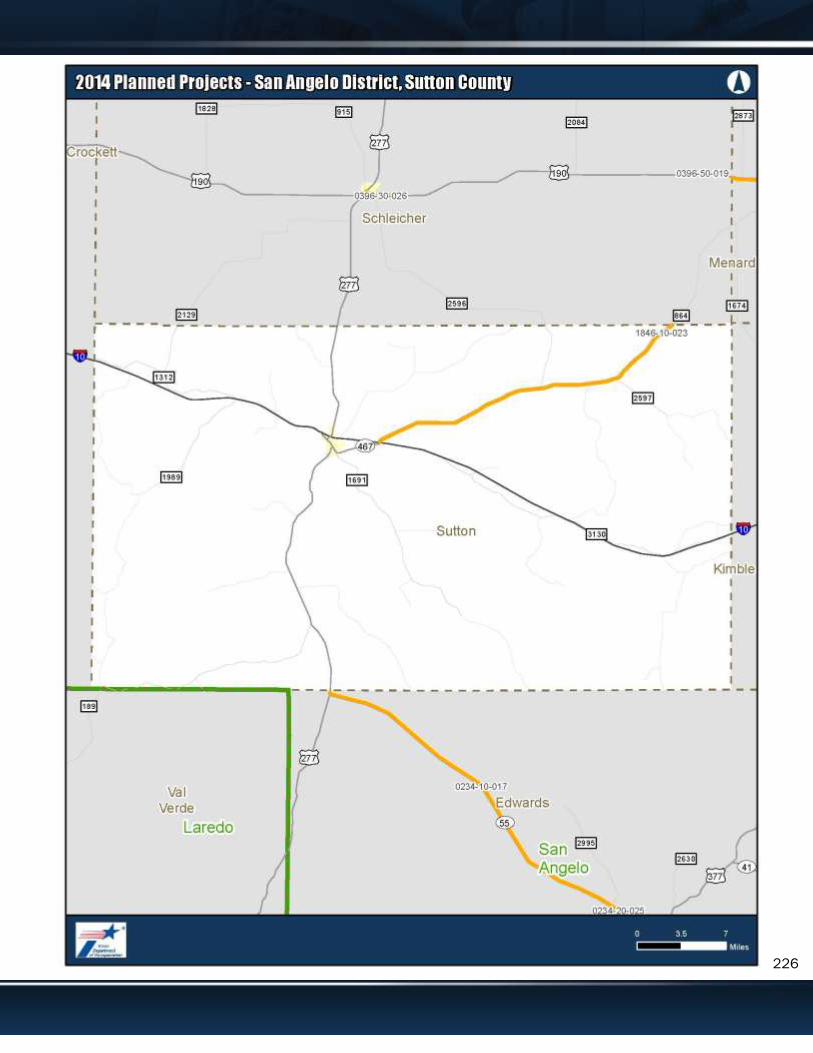
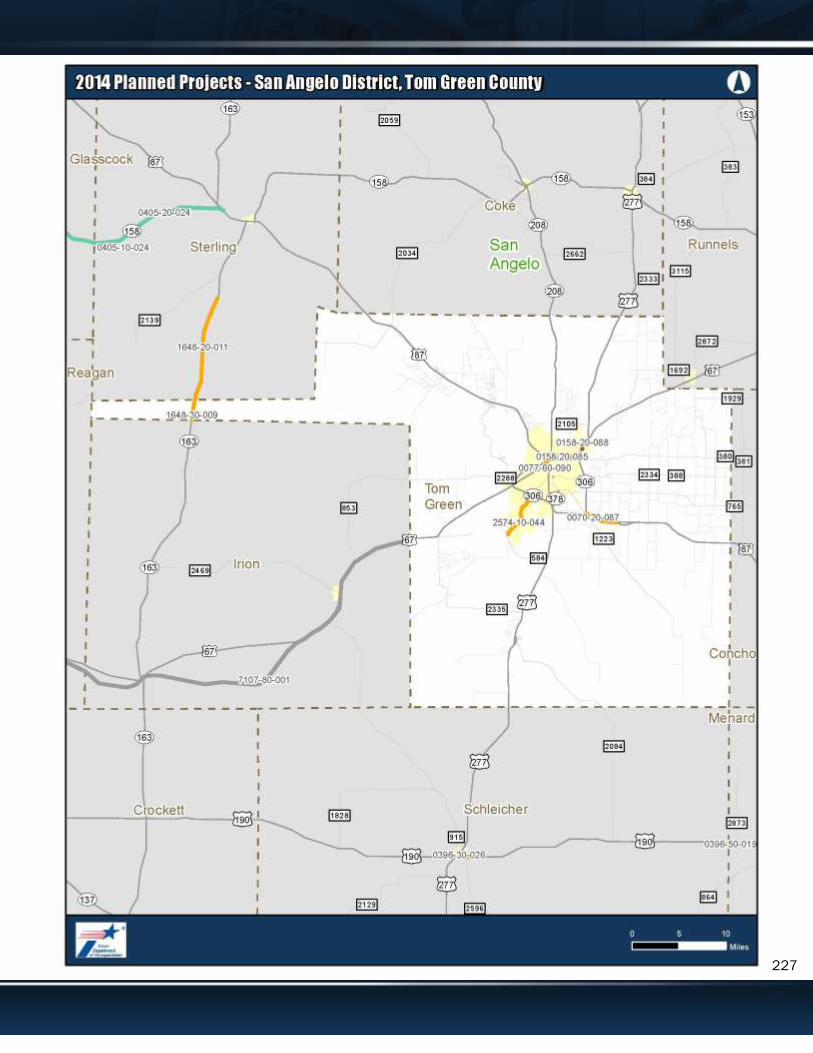
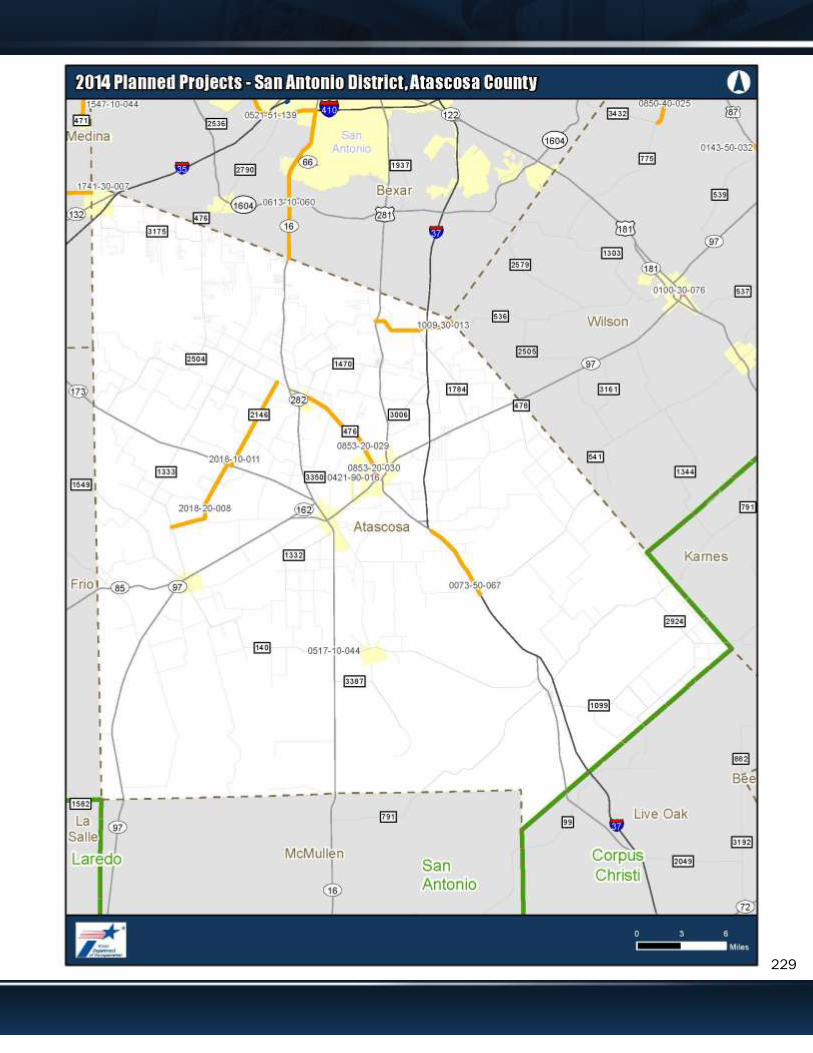
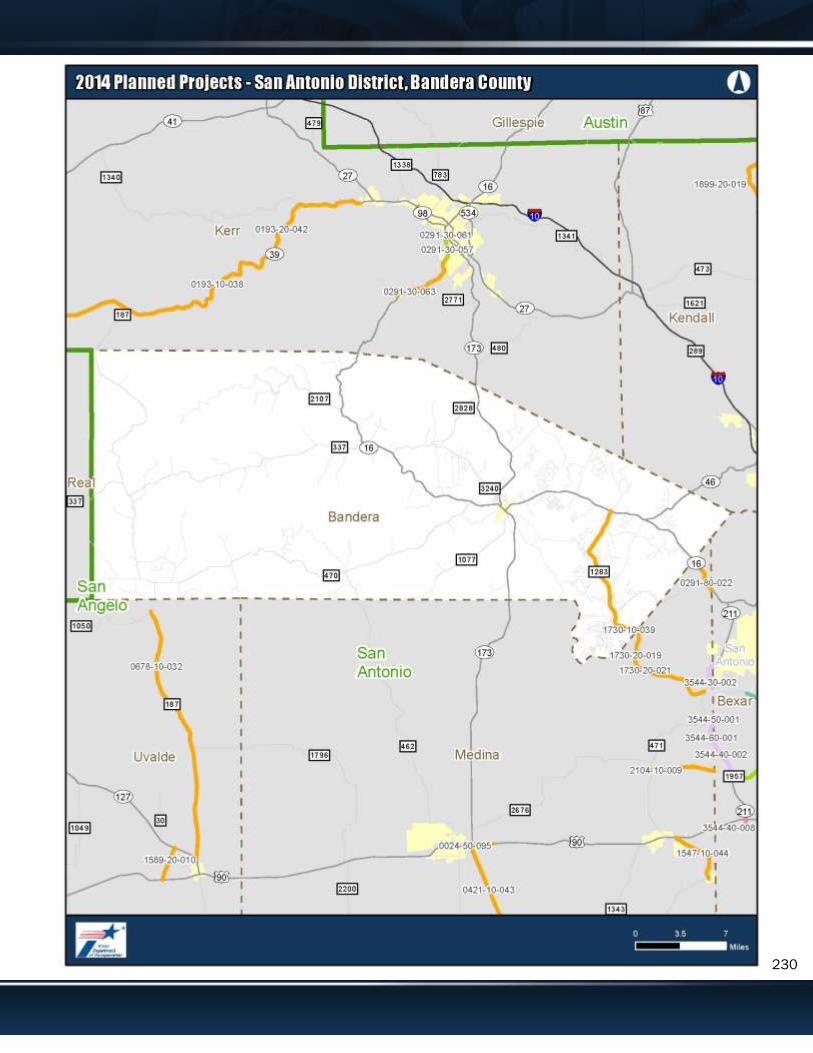
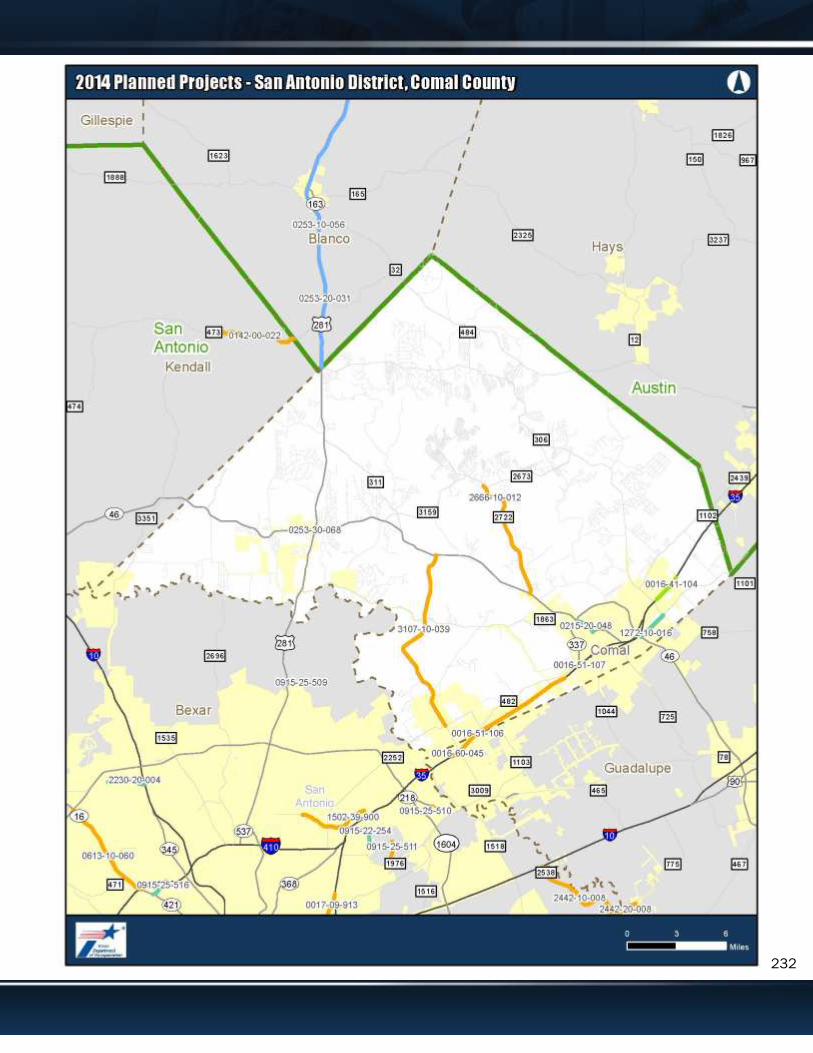
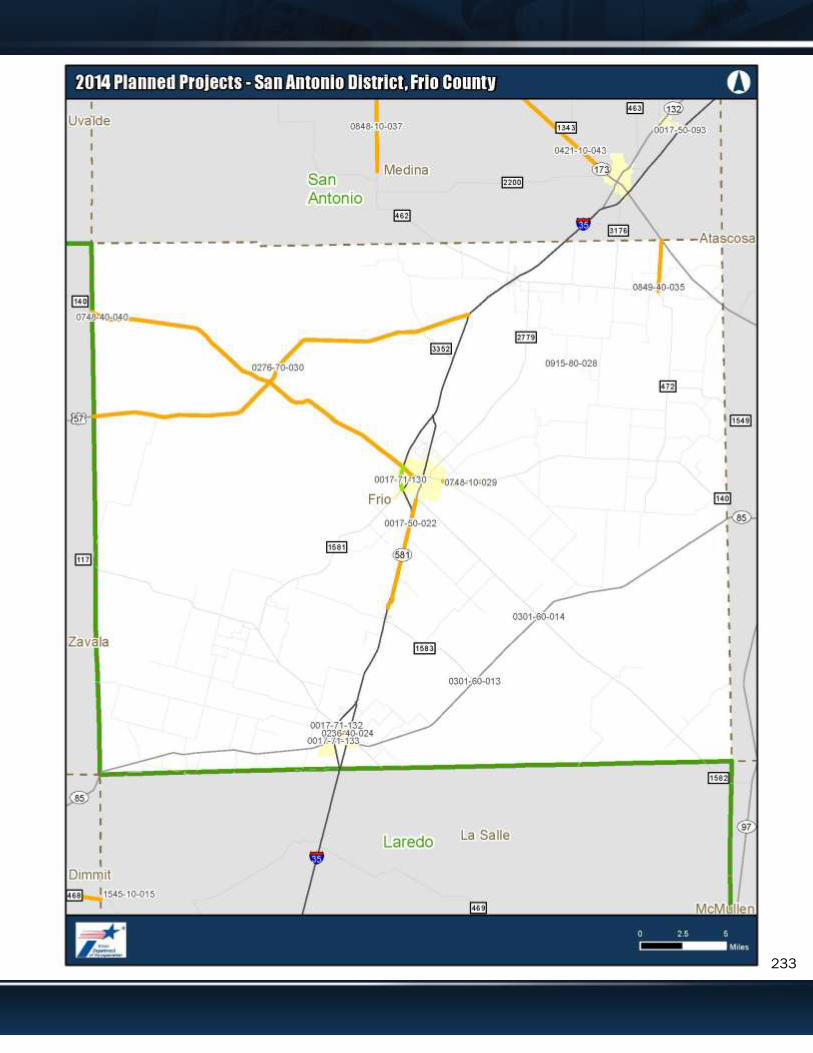
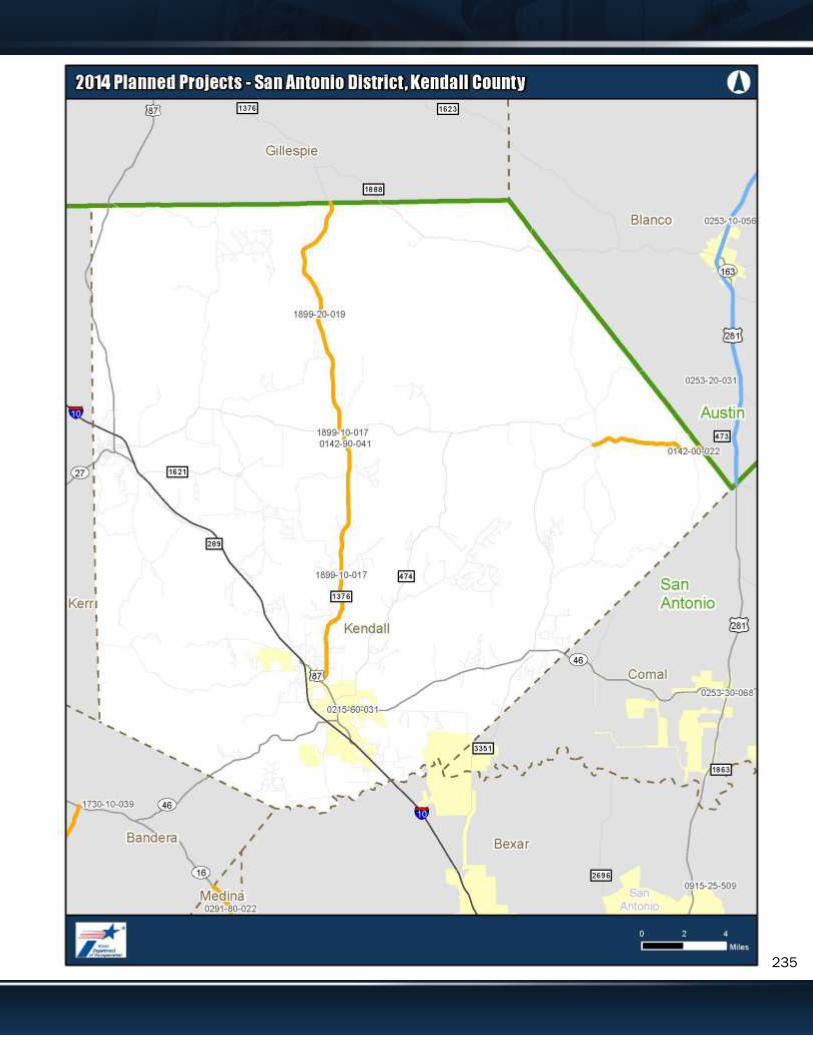
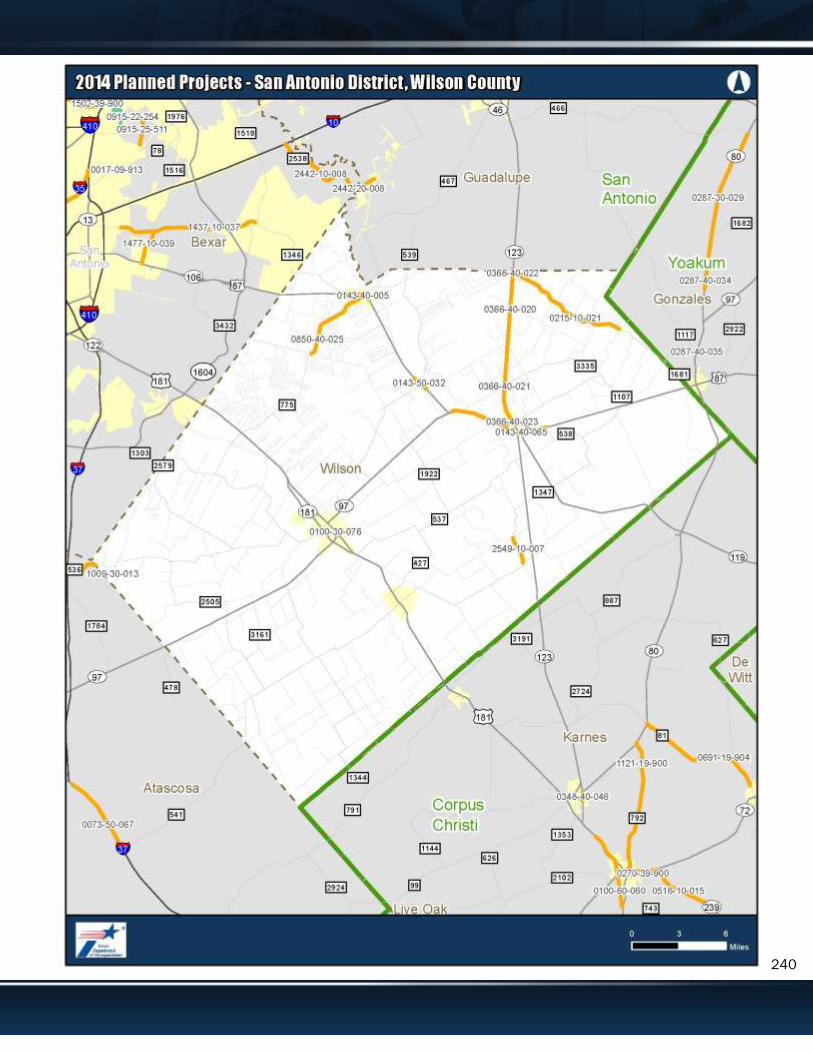
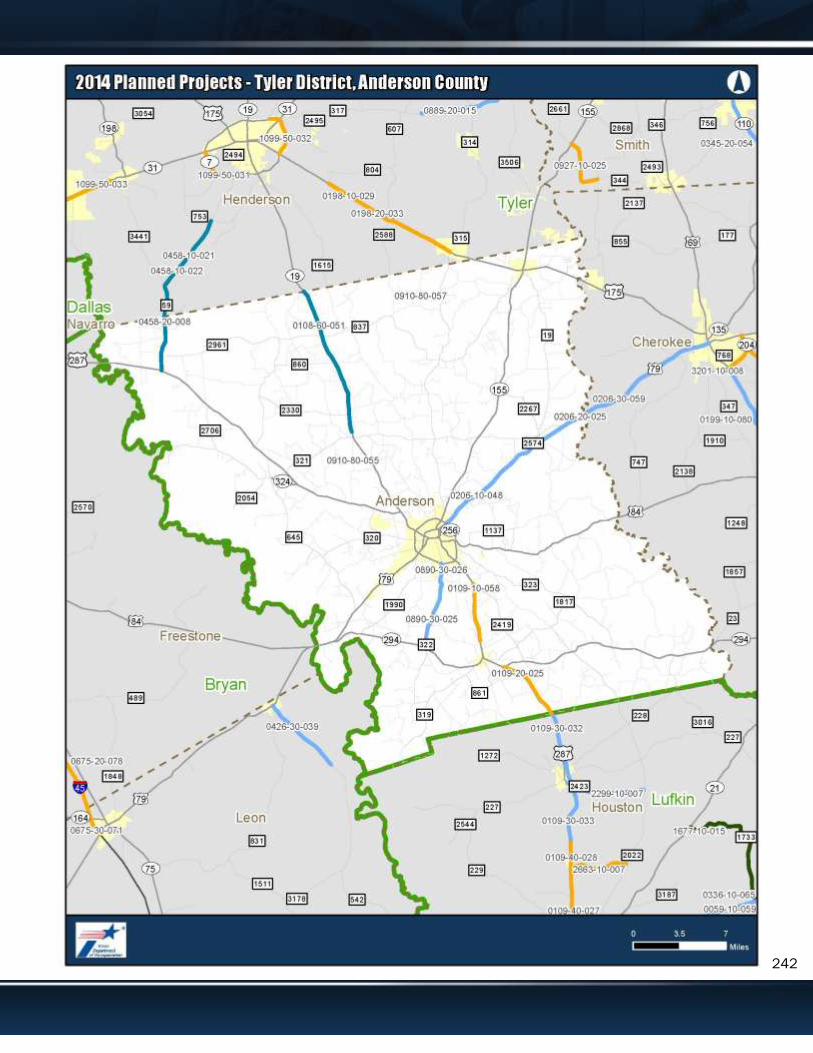
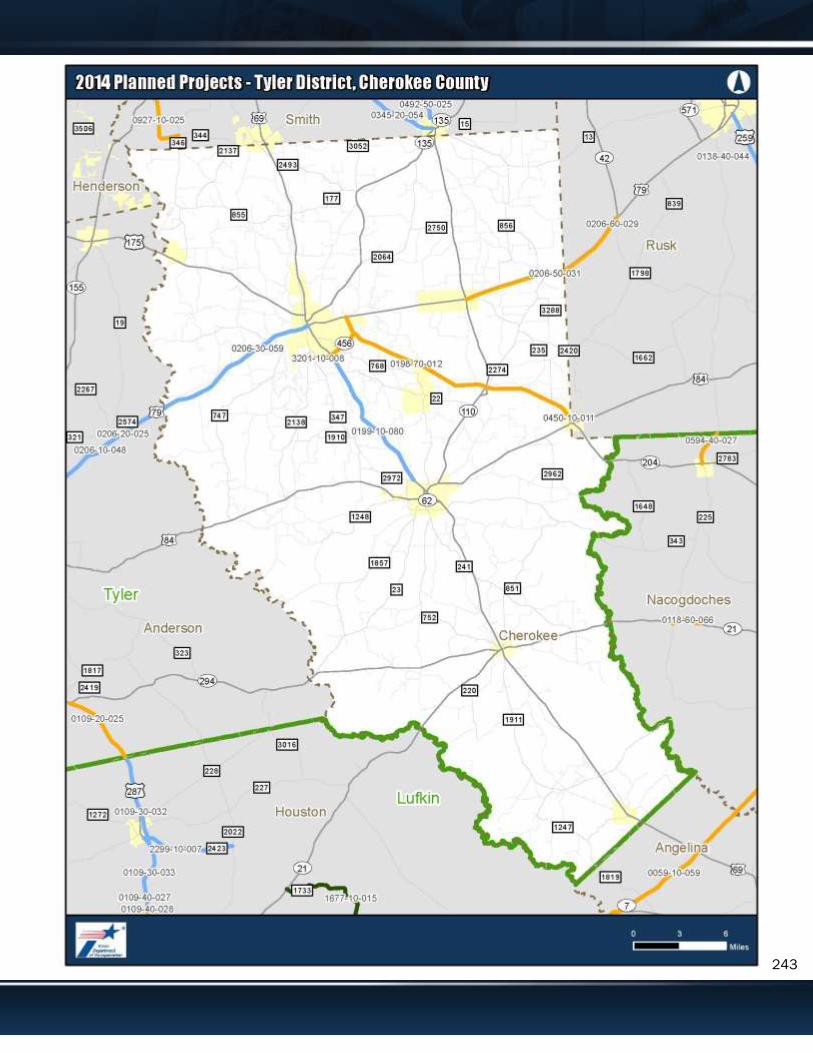
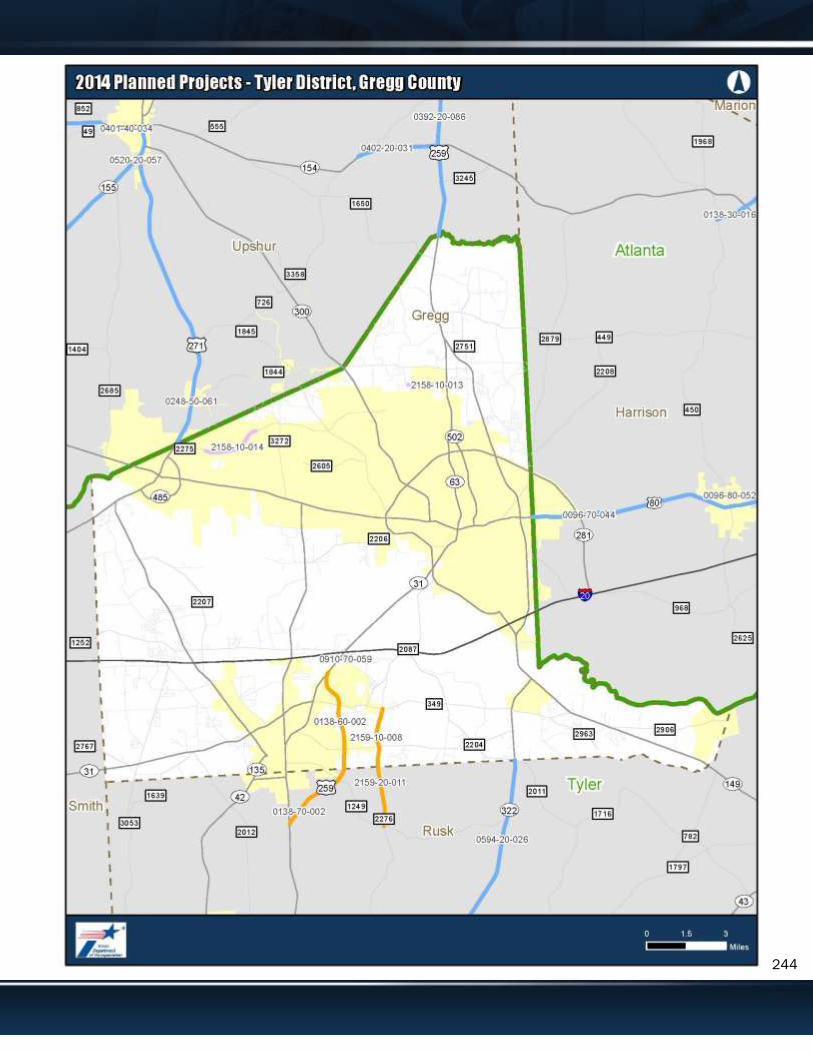
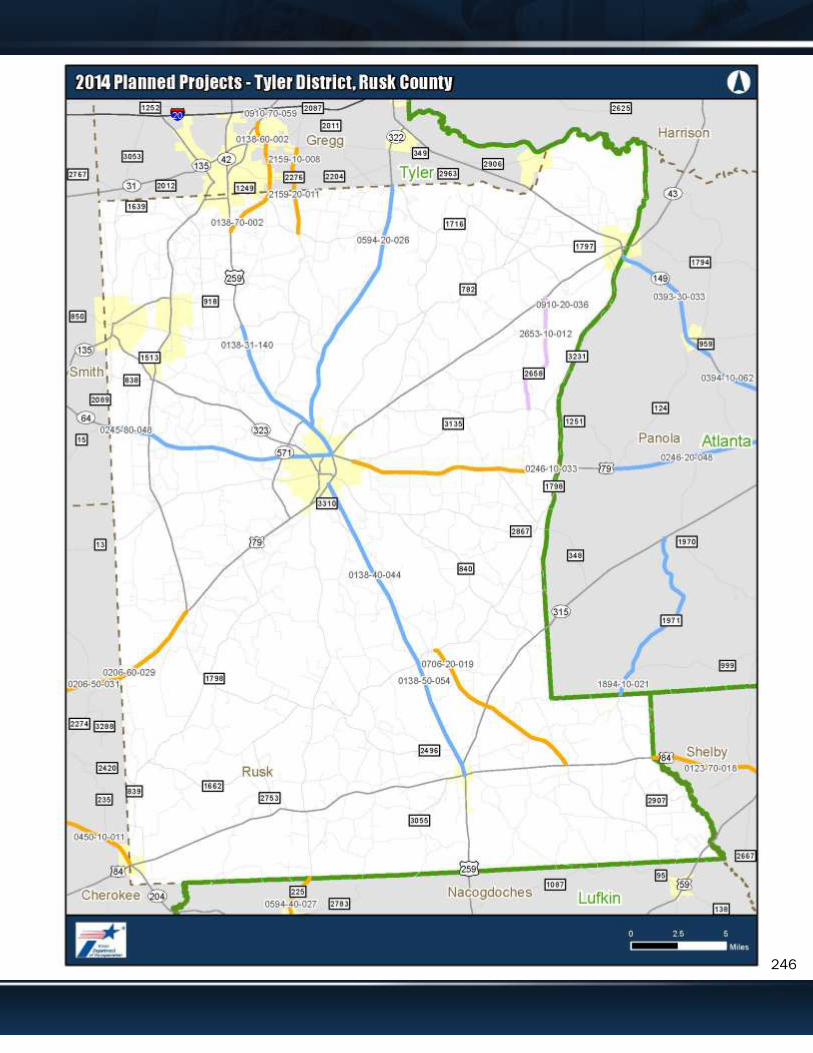
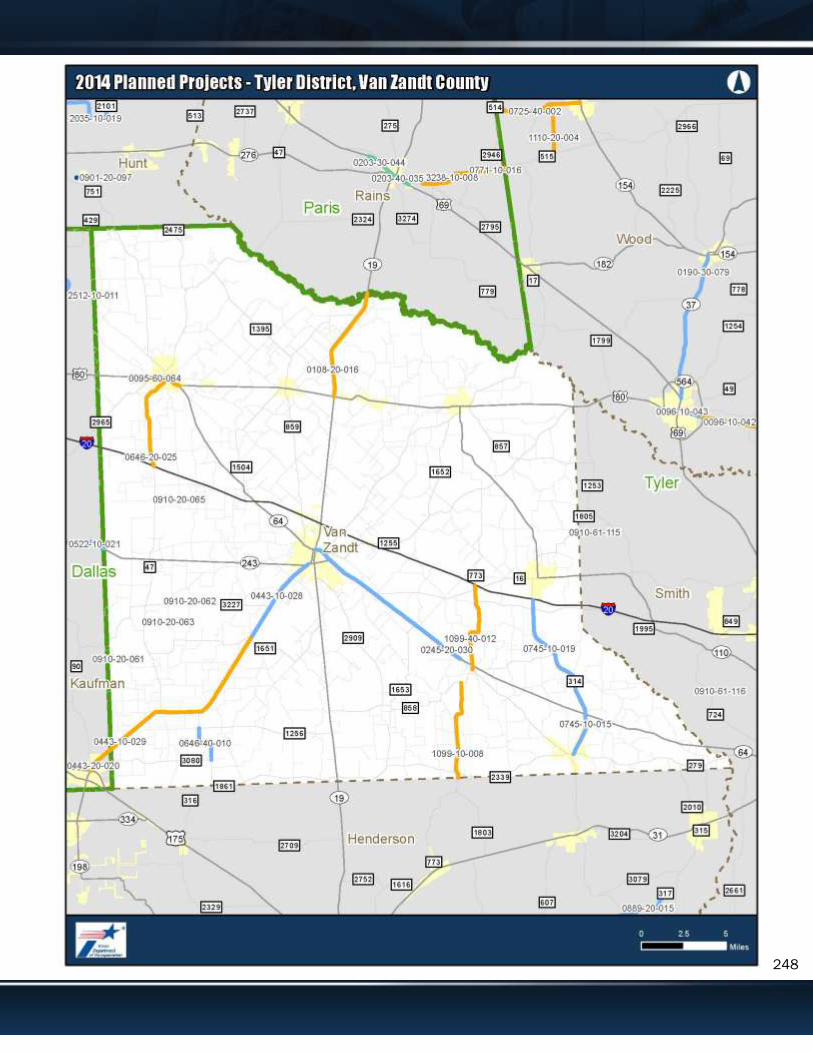
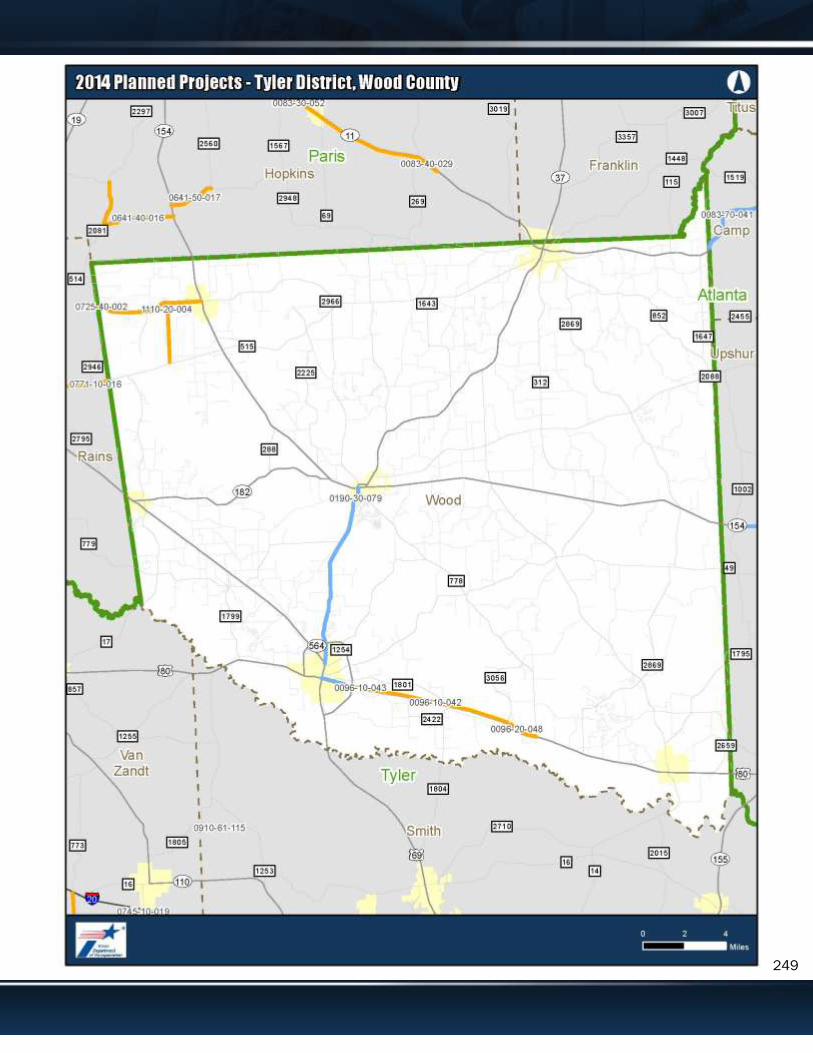
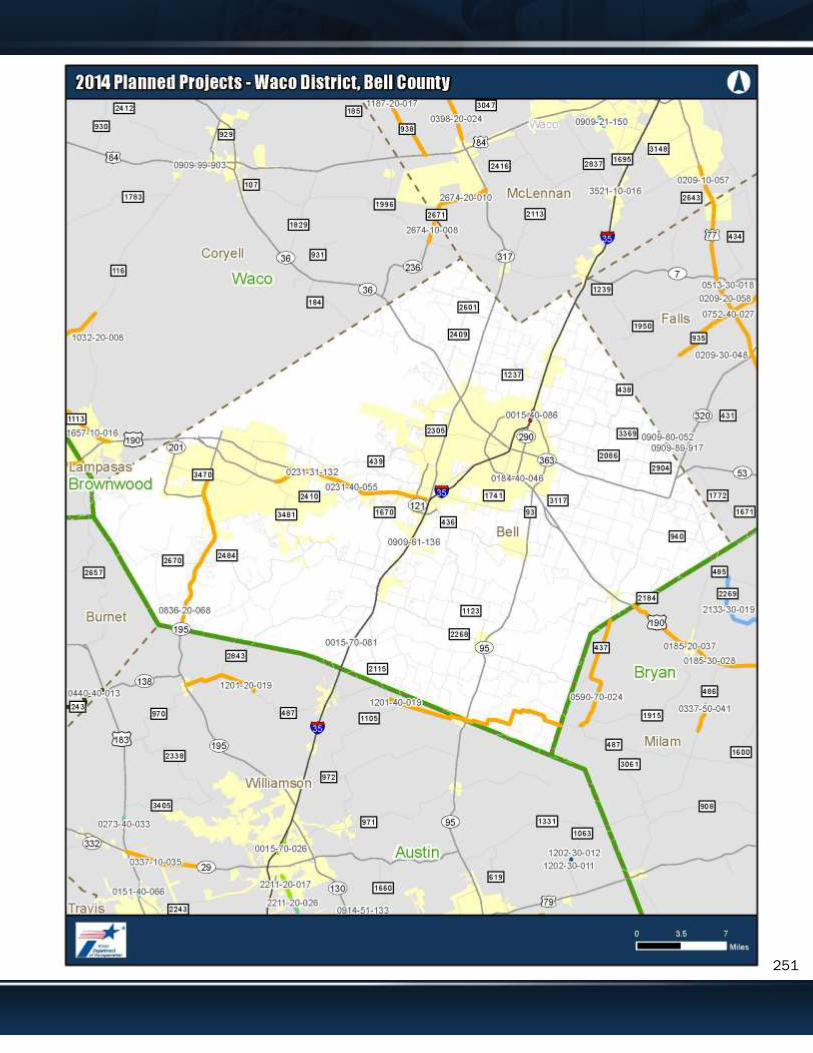
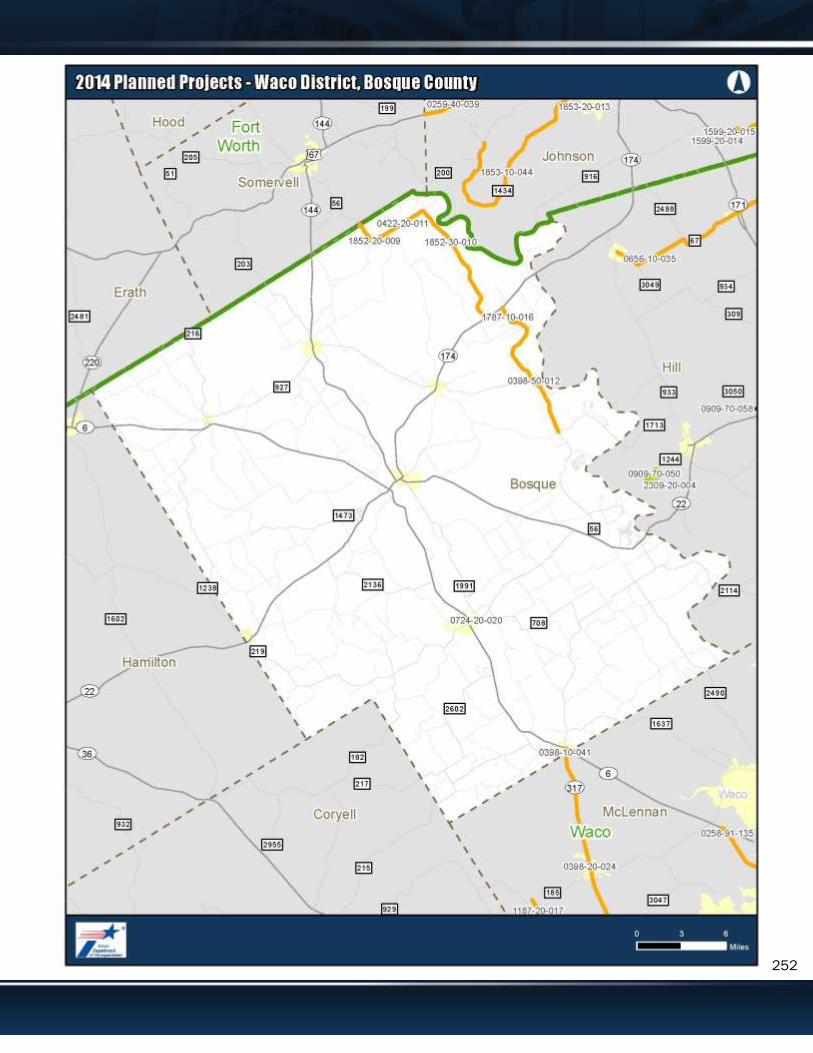
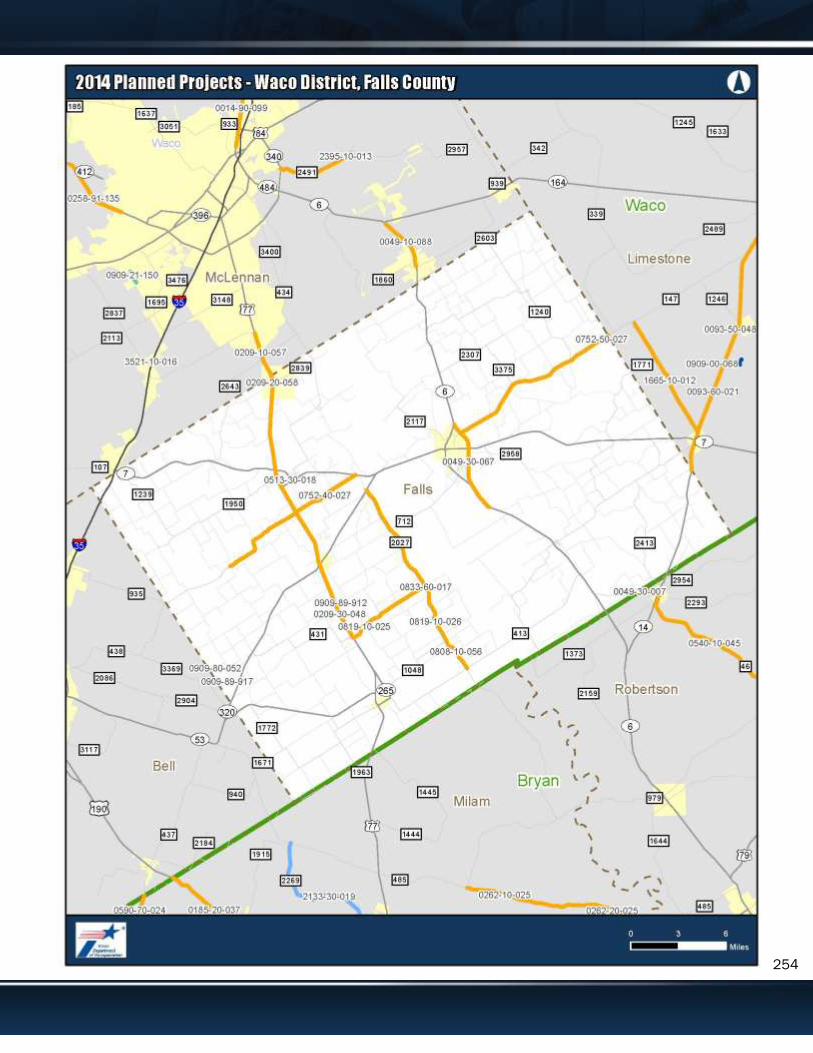
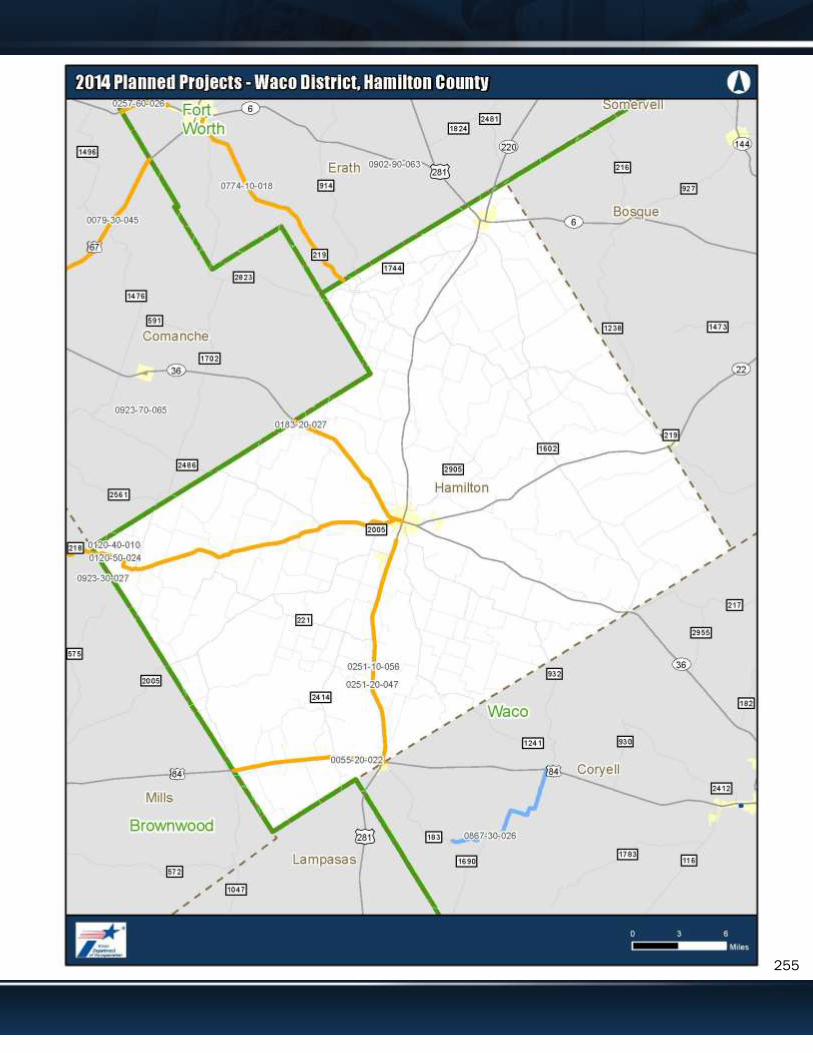
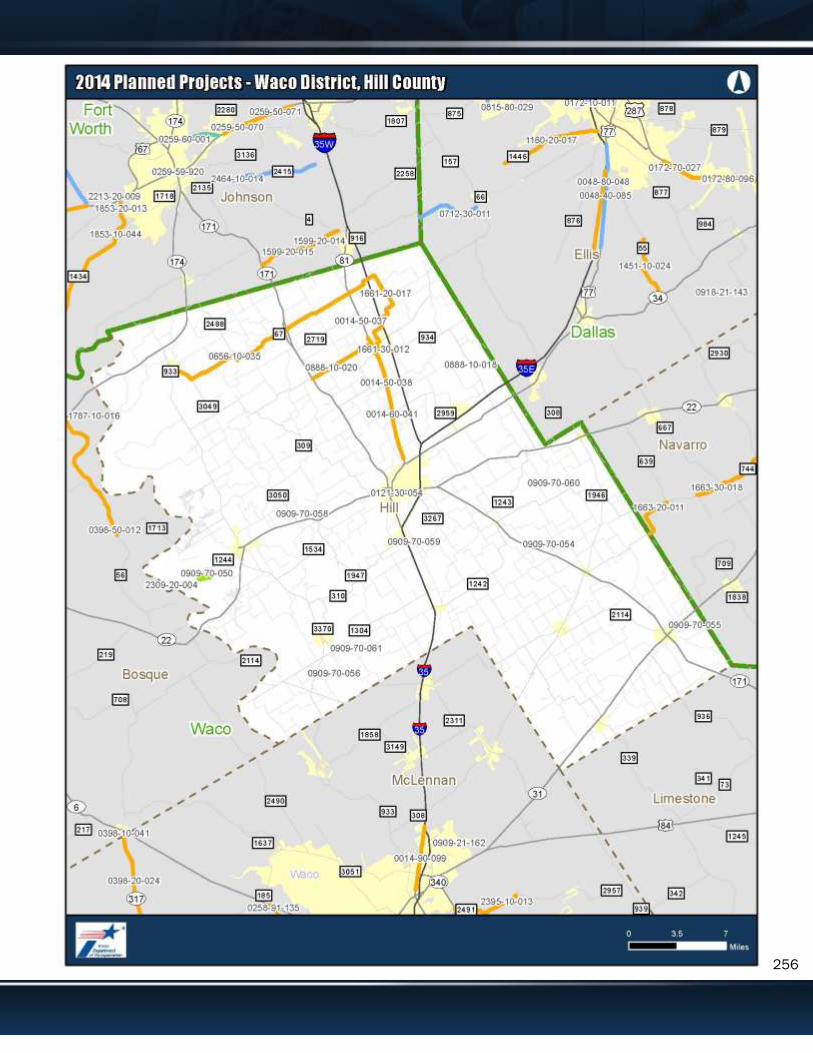
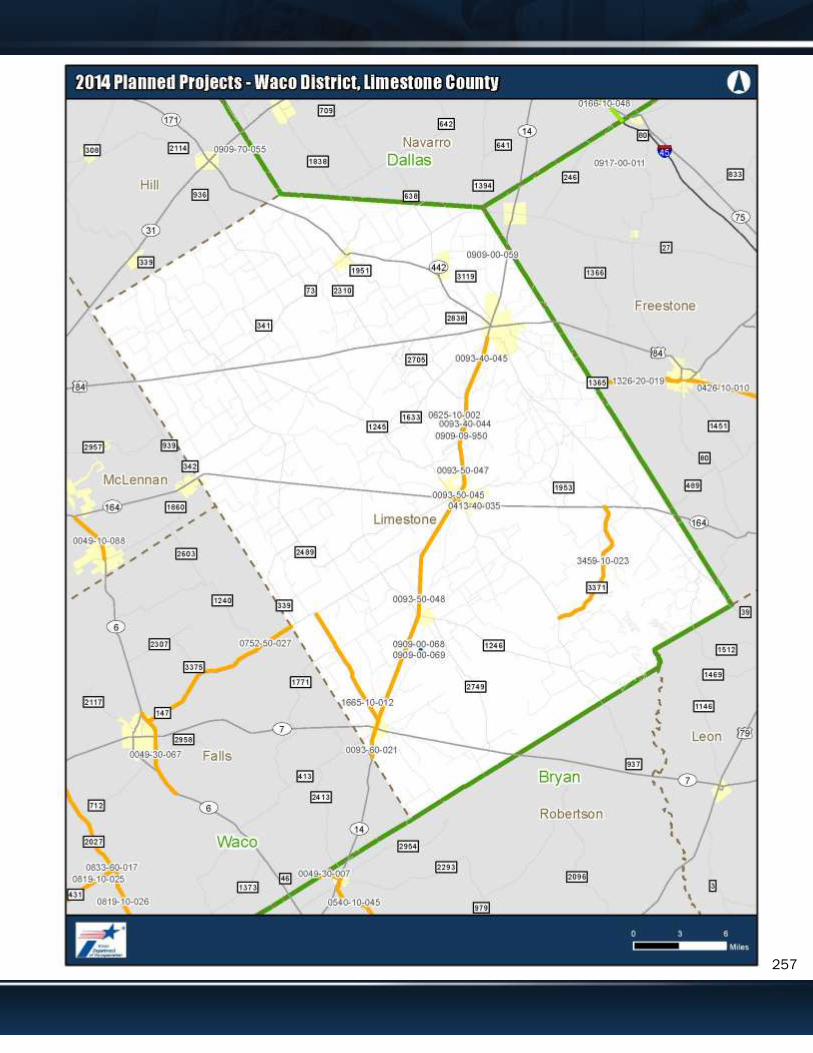
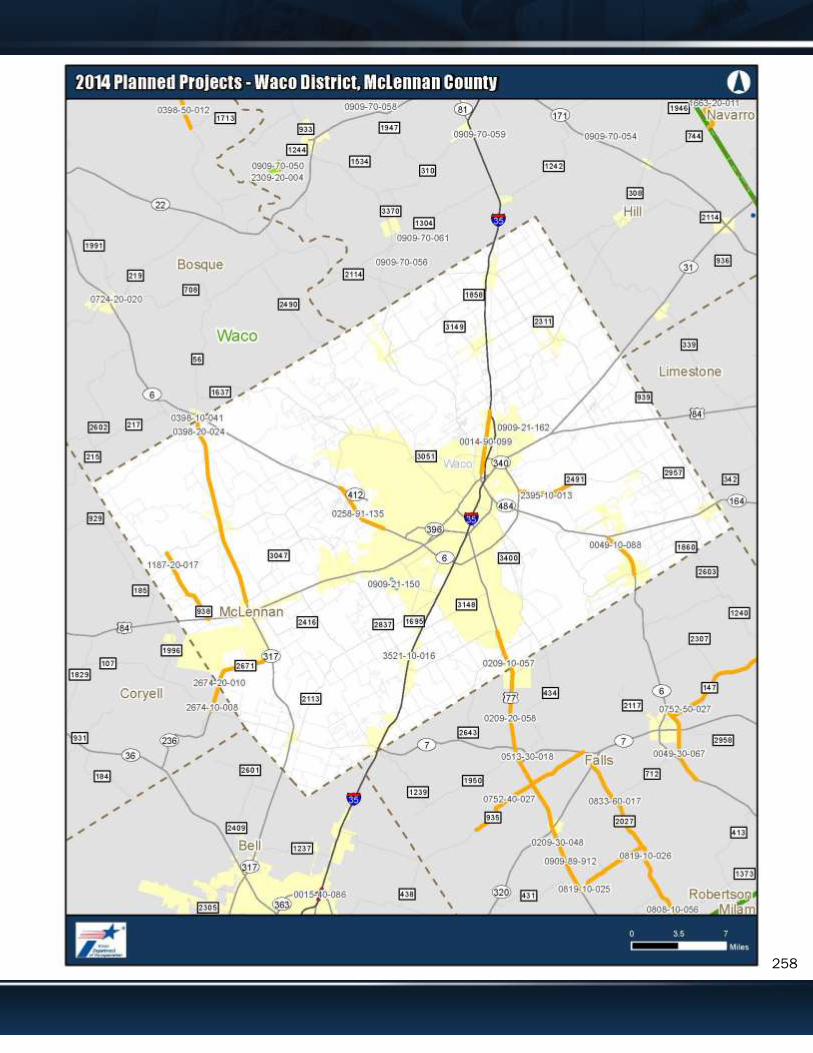
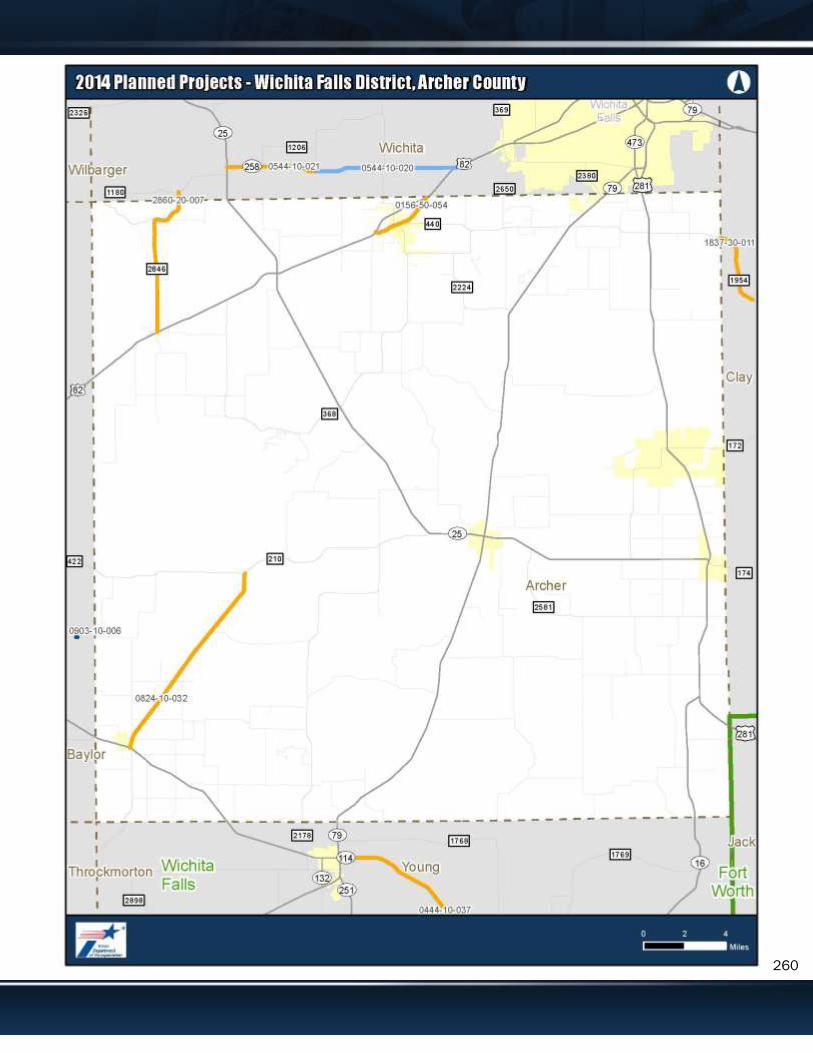
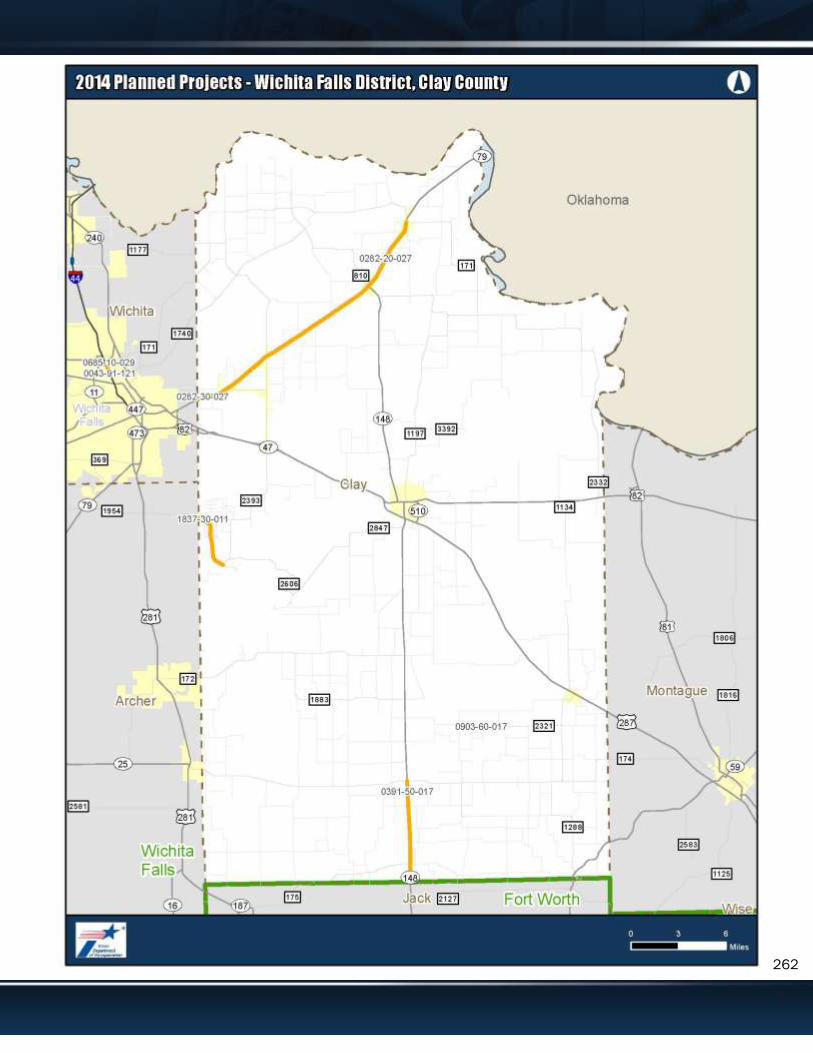
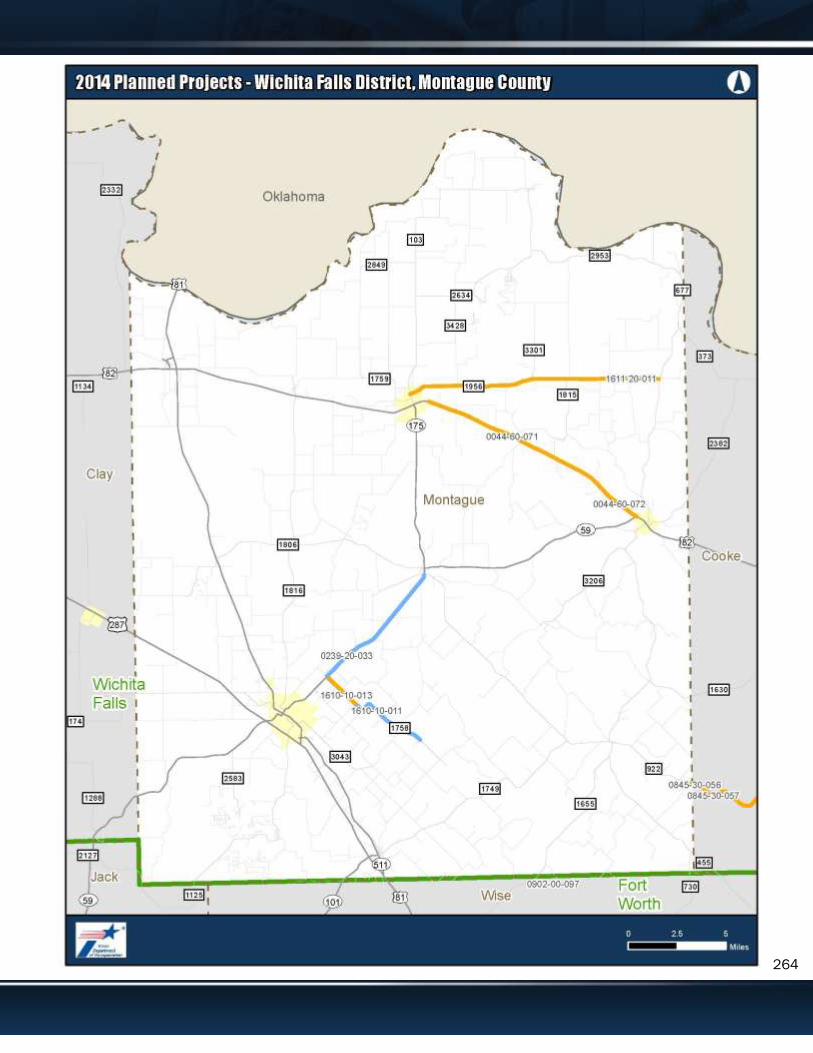
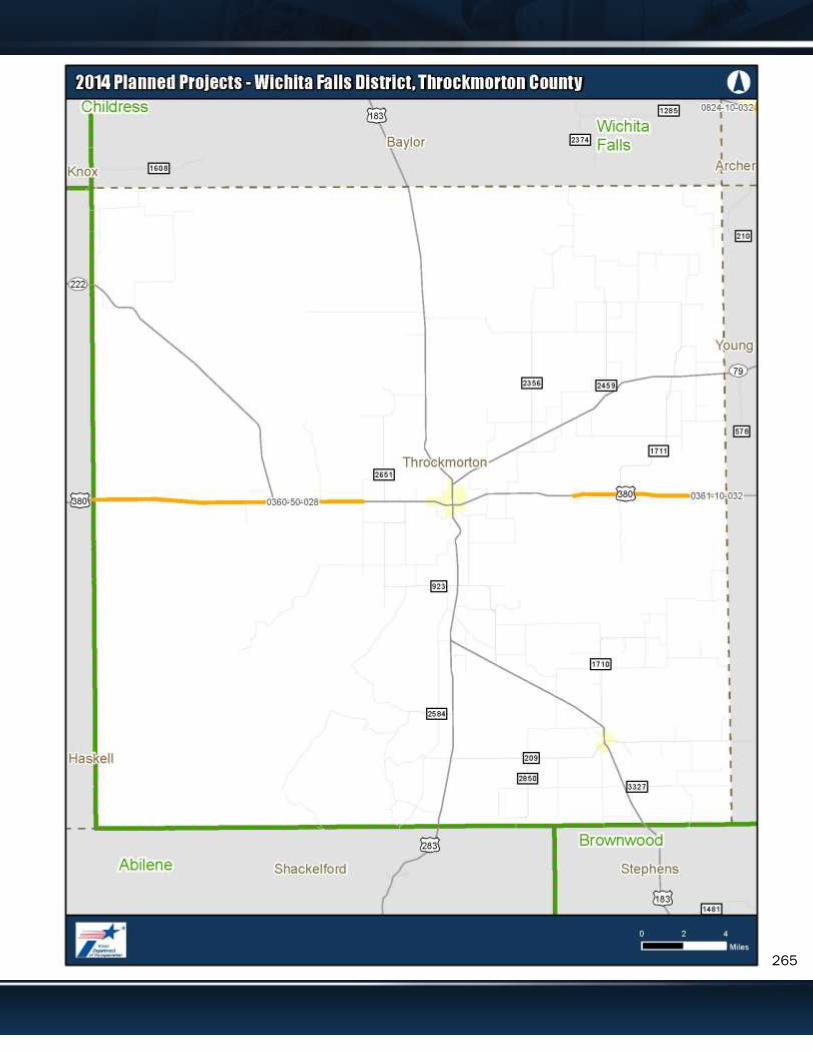
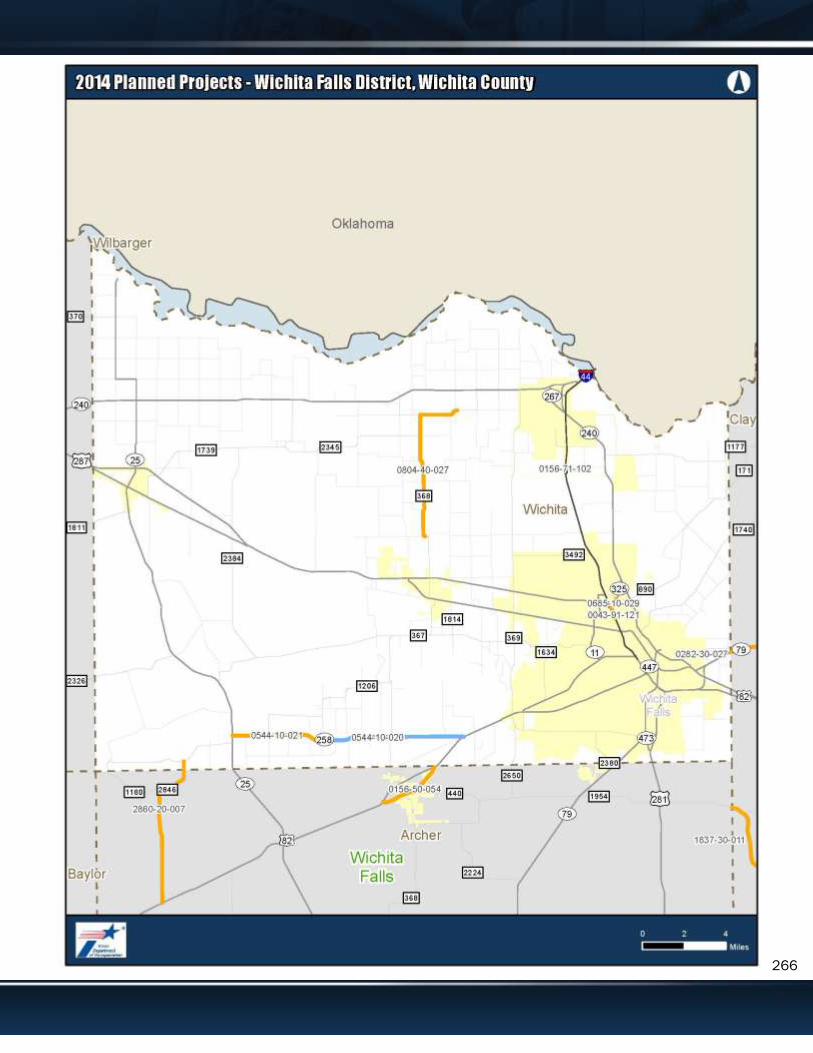
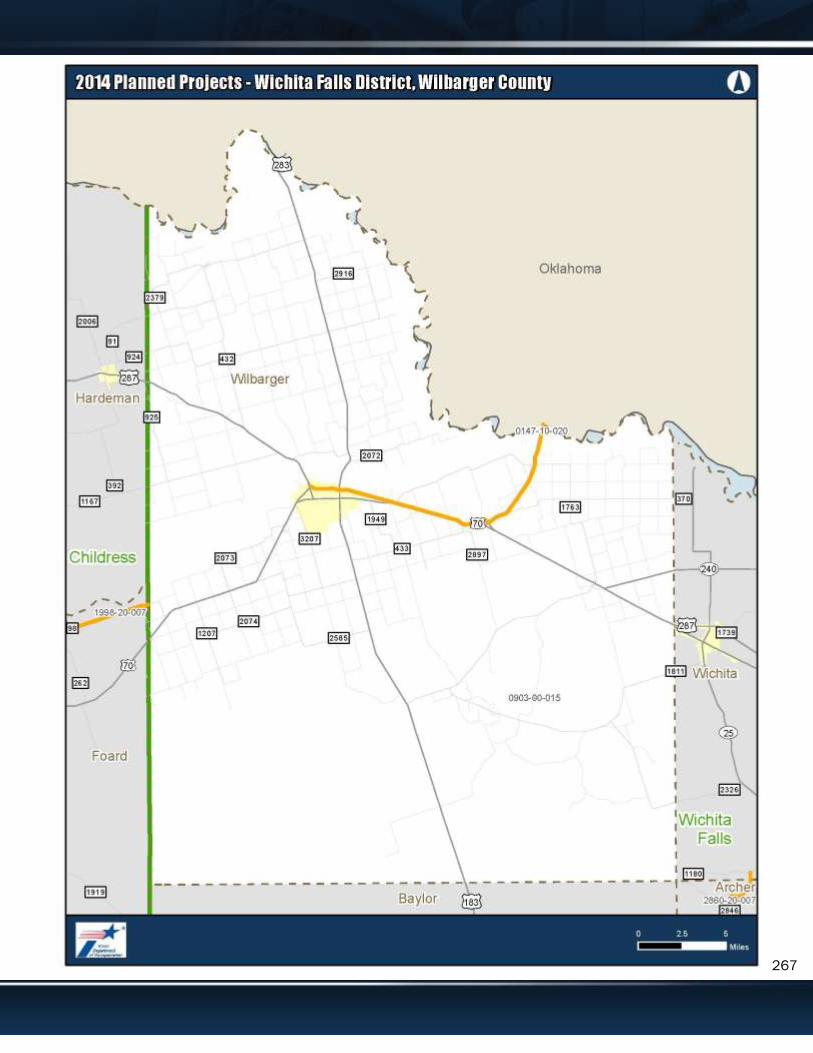
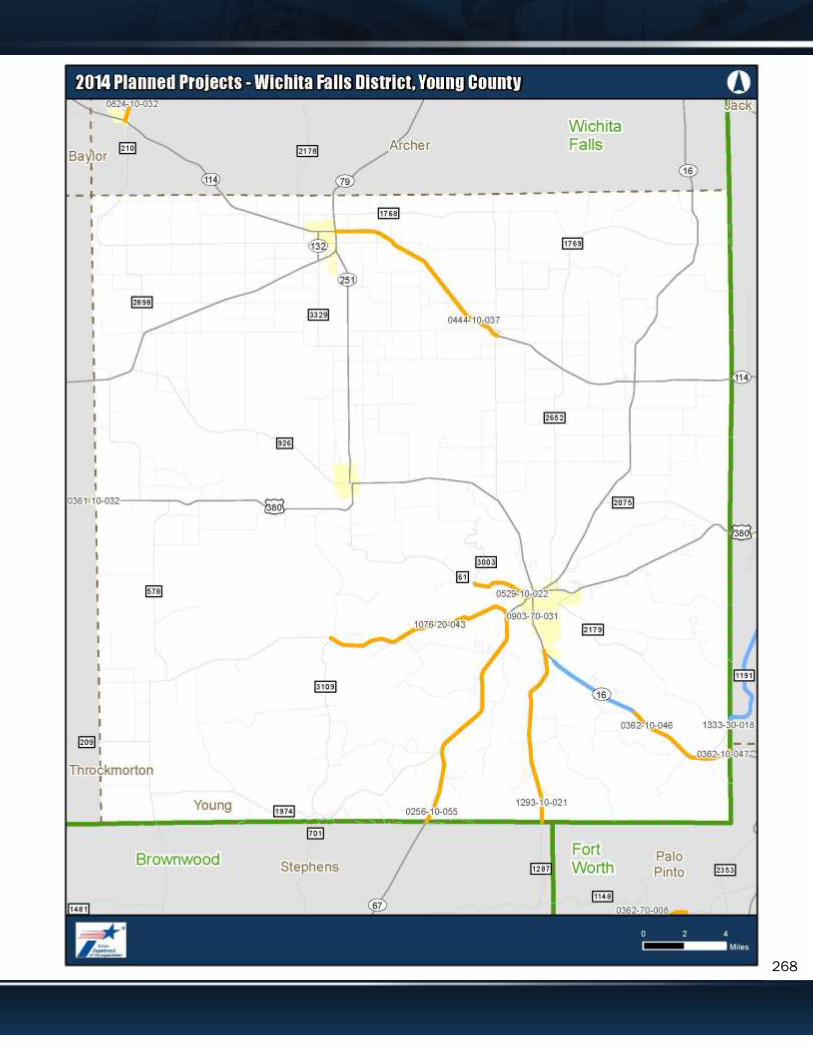
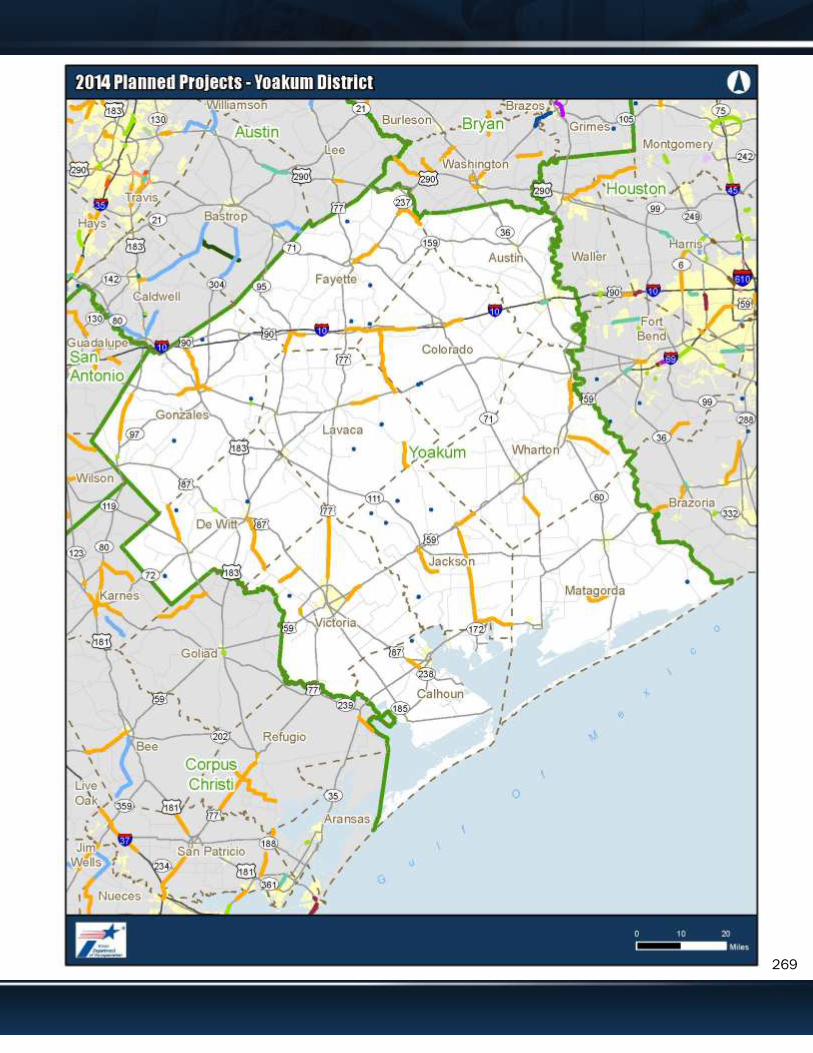
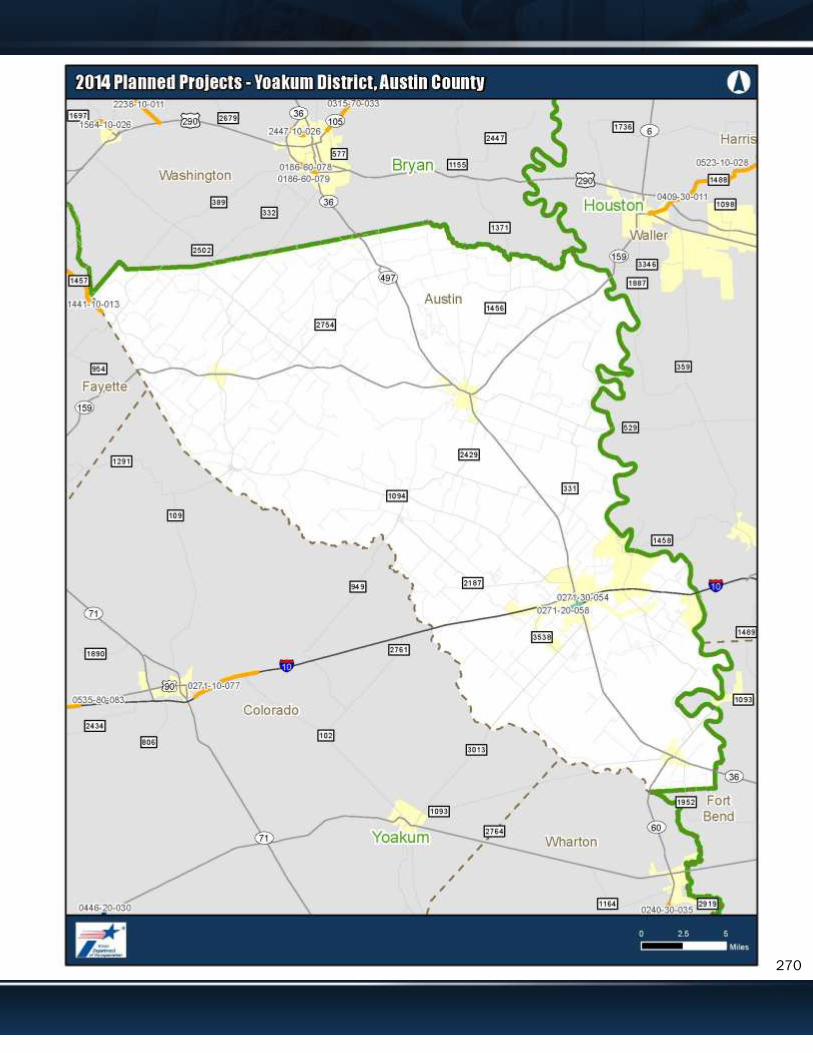
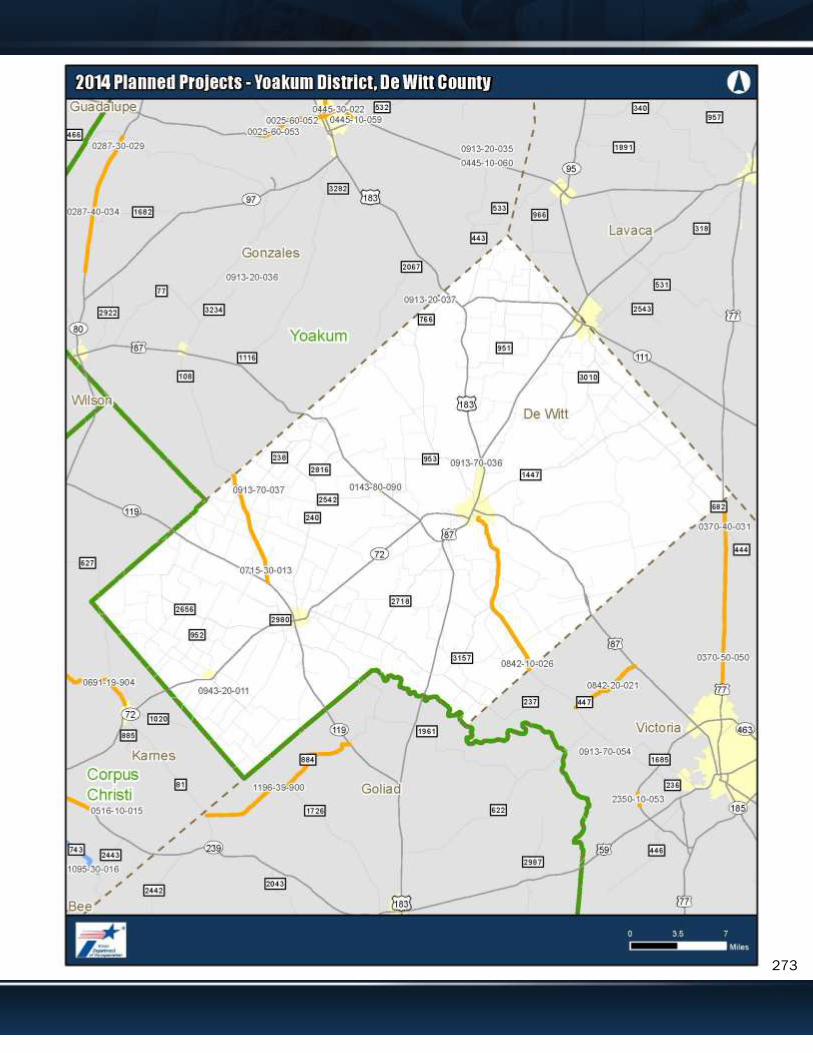
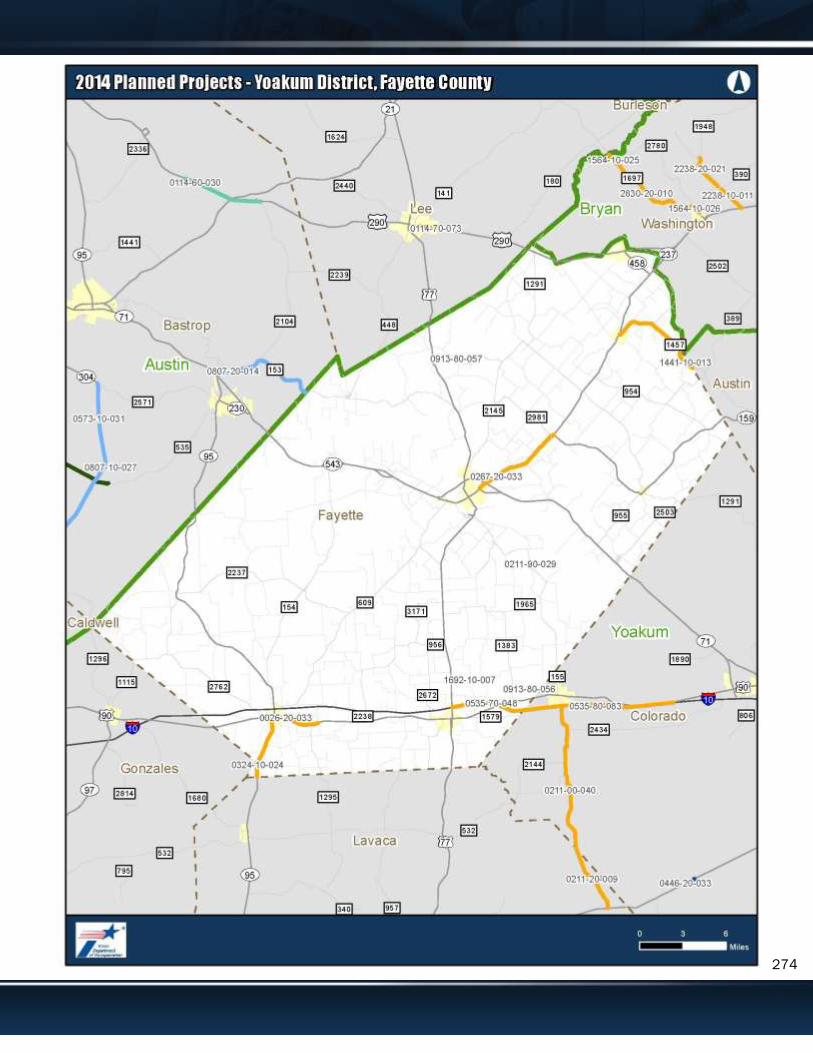
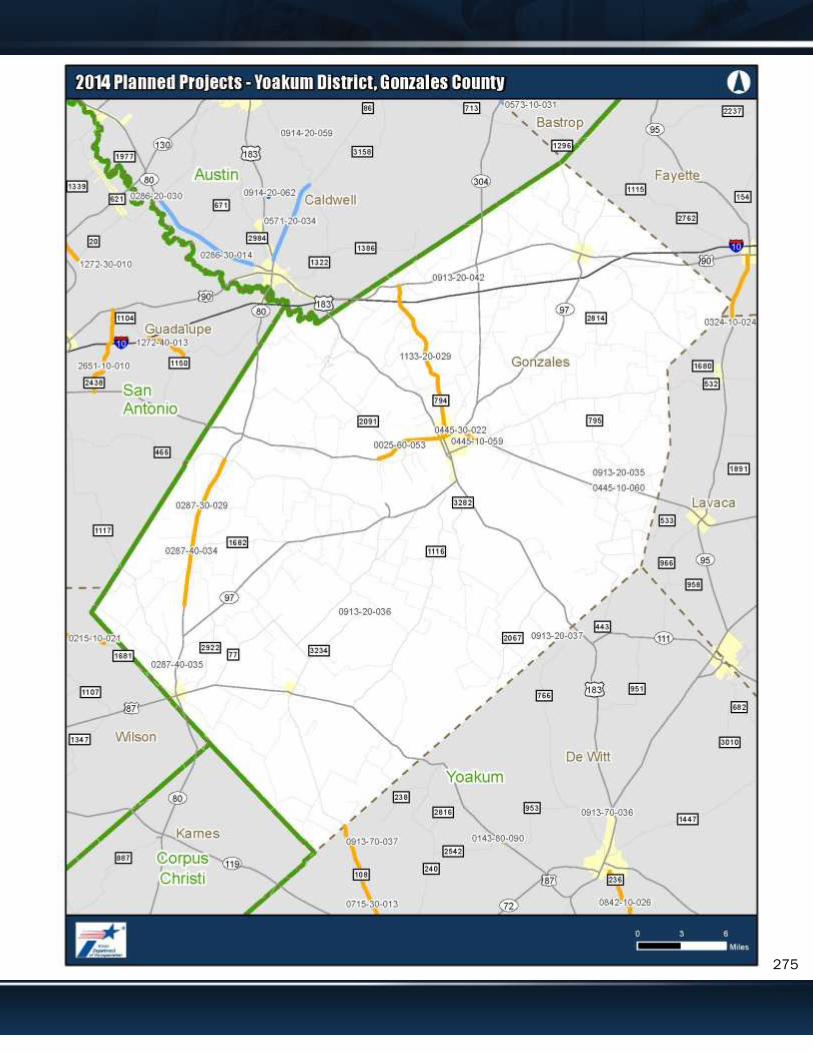
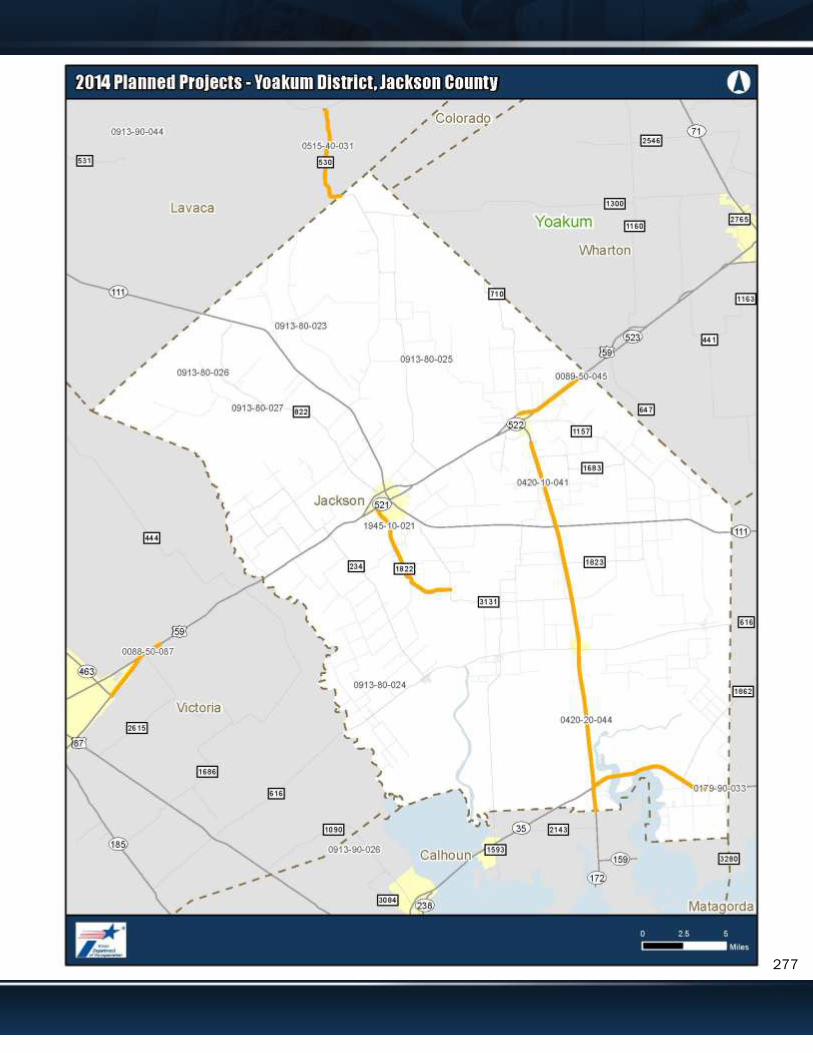
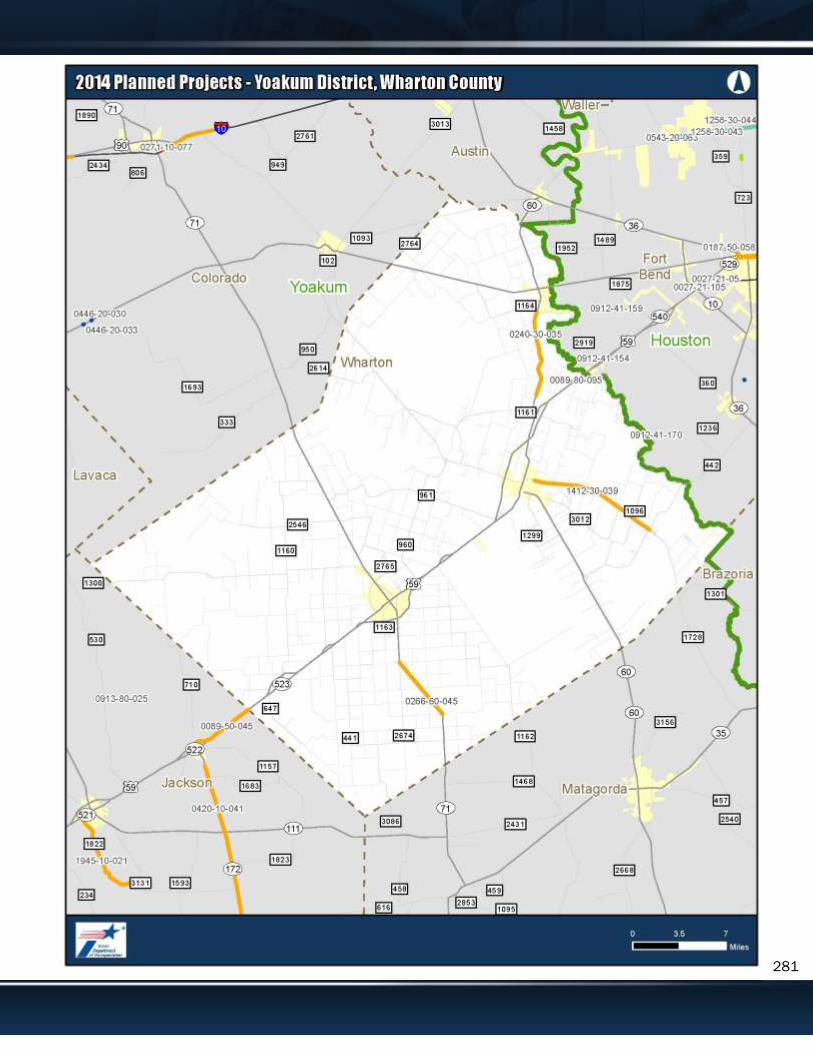
Following each disctrict’s list of projects is a overview map showing project locations. Detailed
maps, with project numbers, are in Appendix A to this report.
*All projects will have an economic impact in their local area through the jobs they produce. The
impacts identified in this report extend further than the project-based job creation.
20
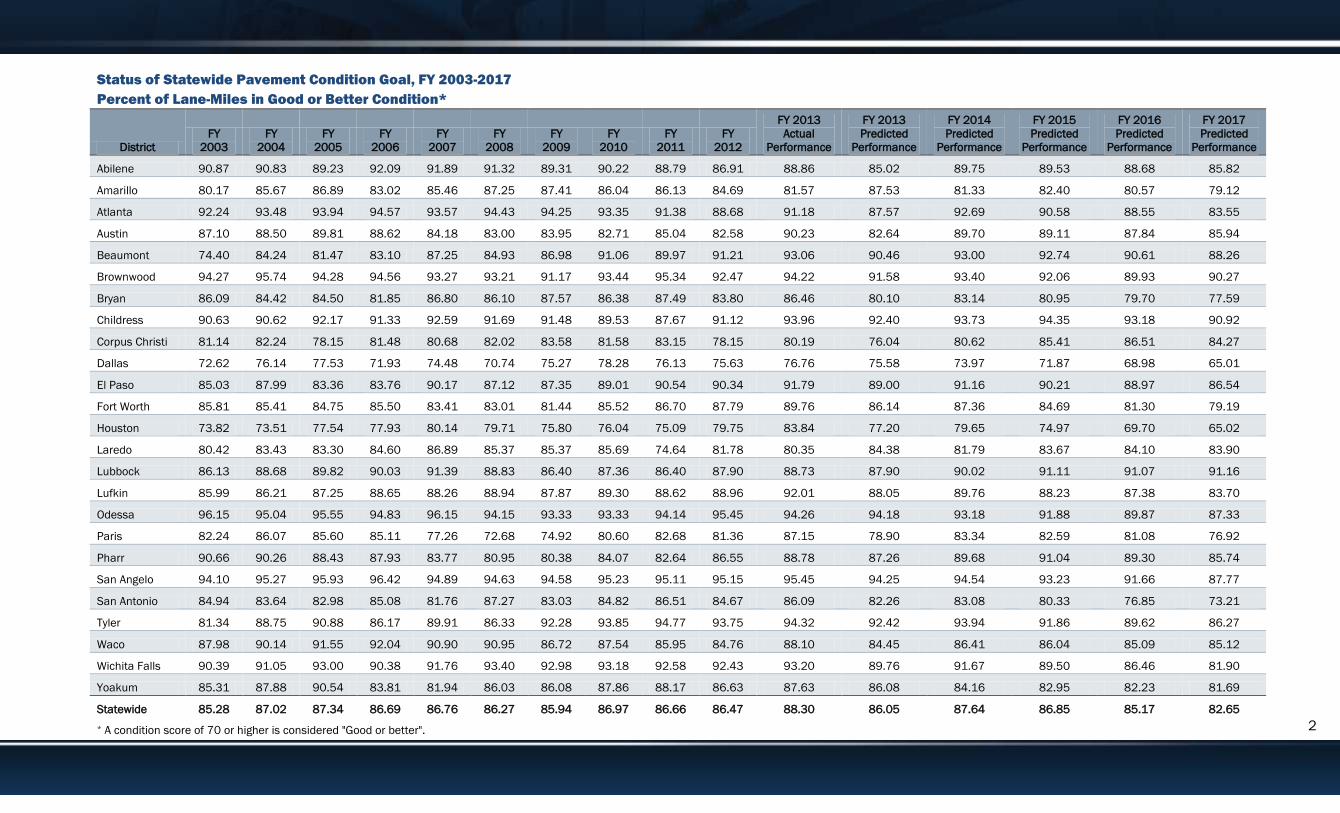
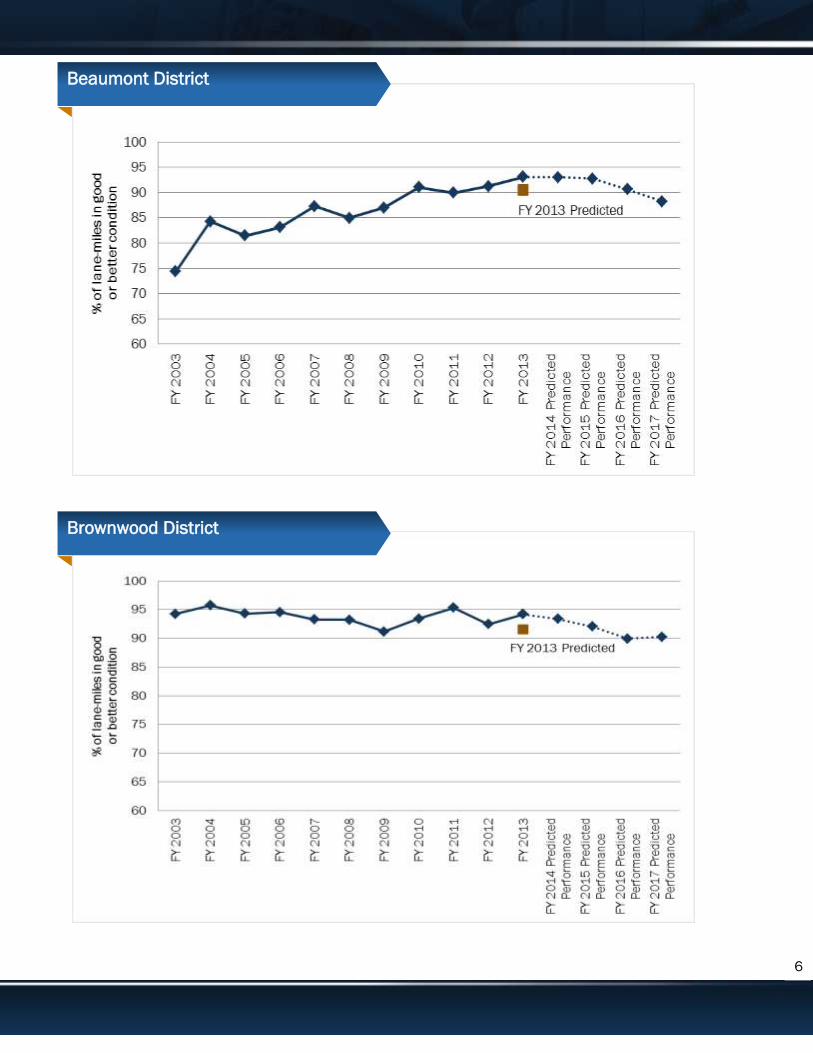
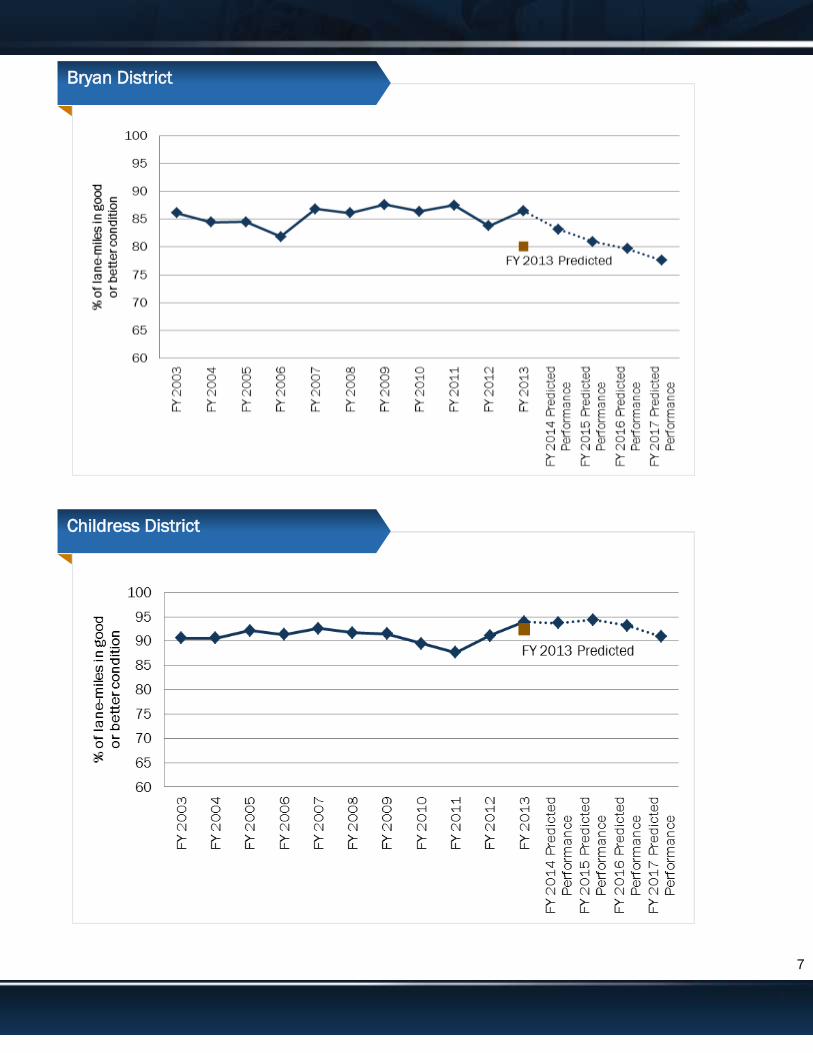
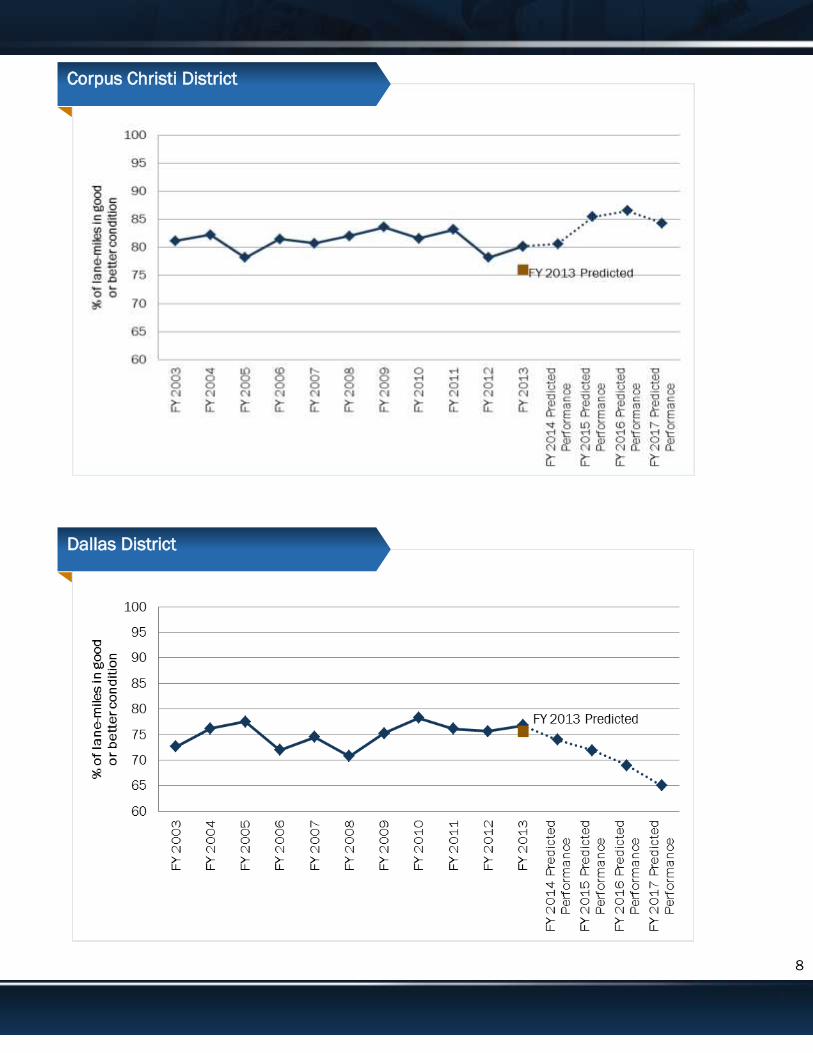
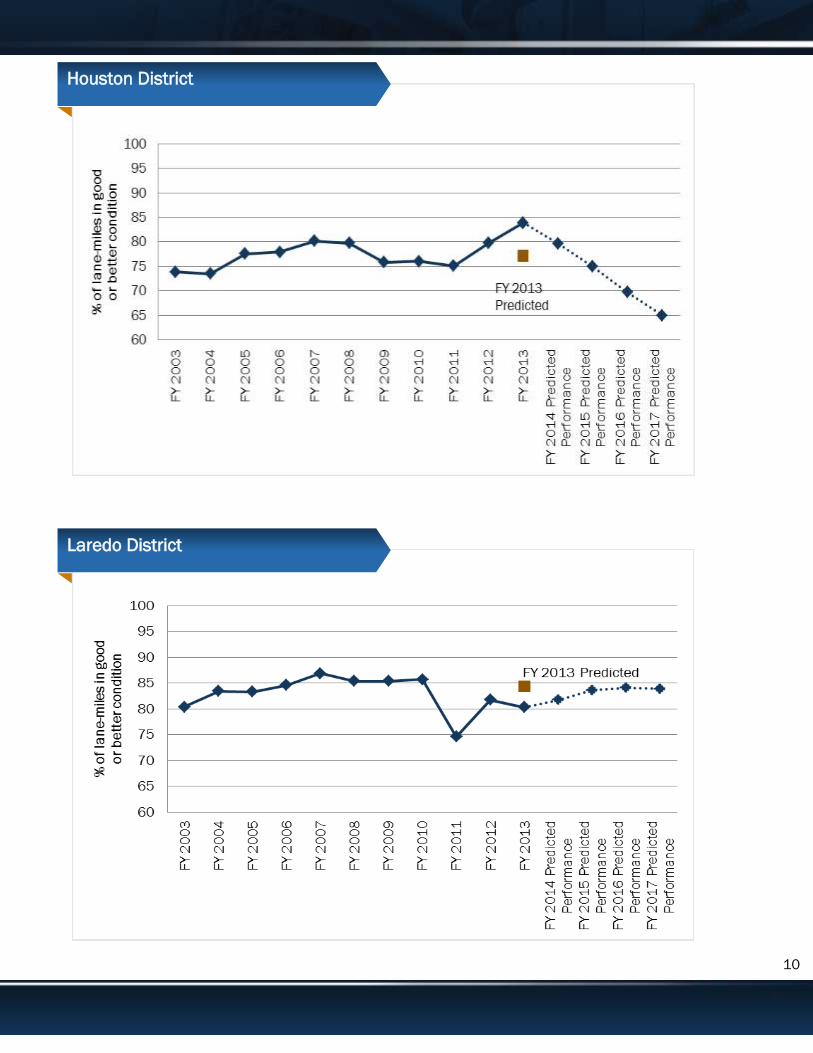
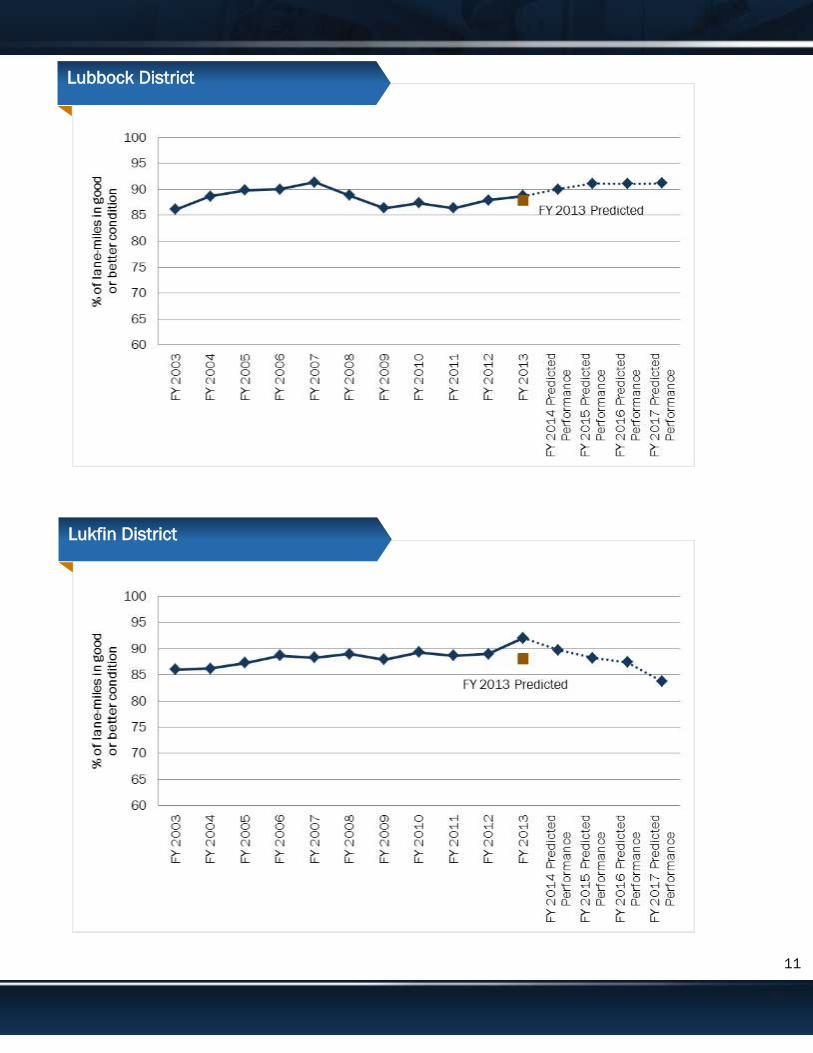
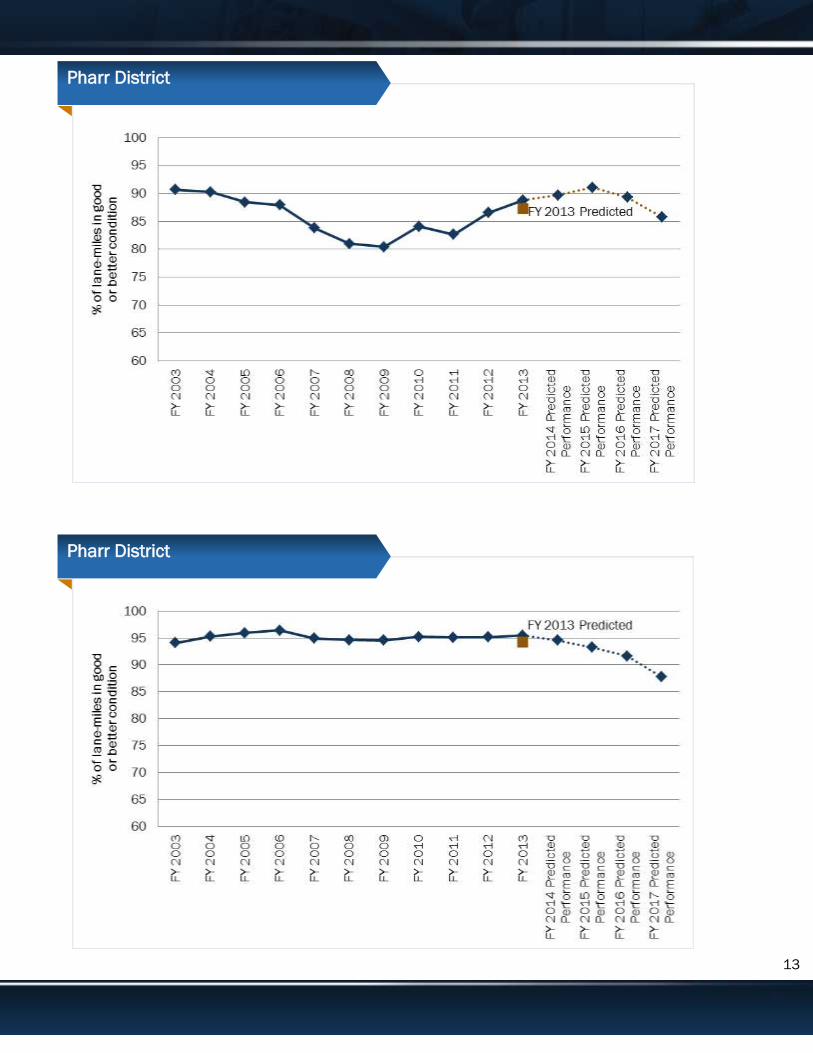
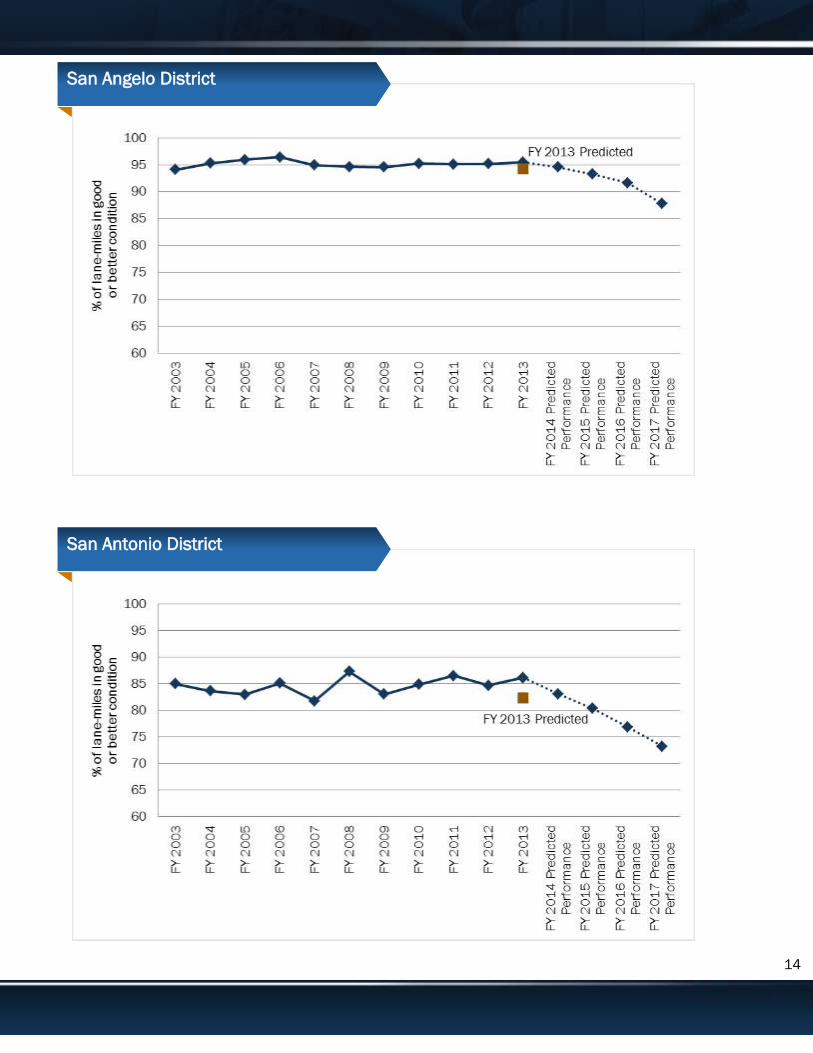
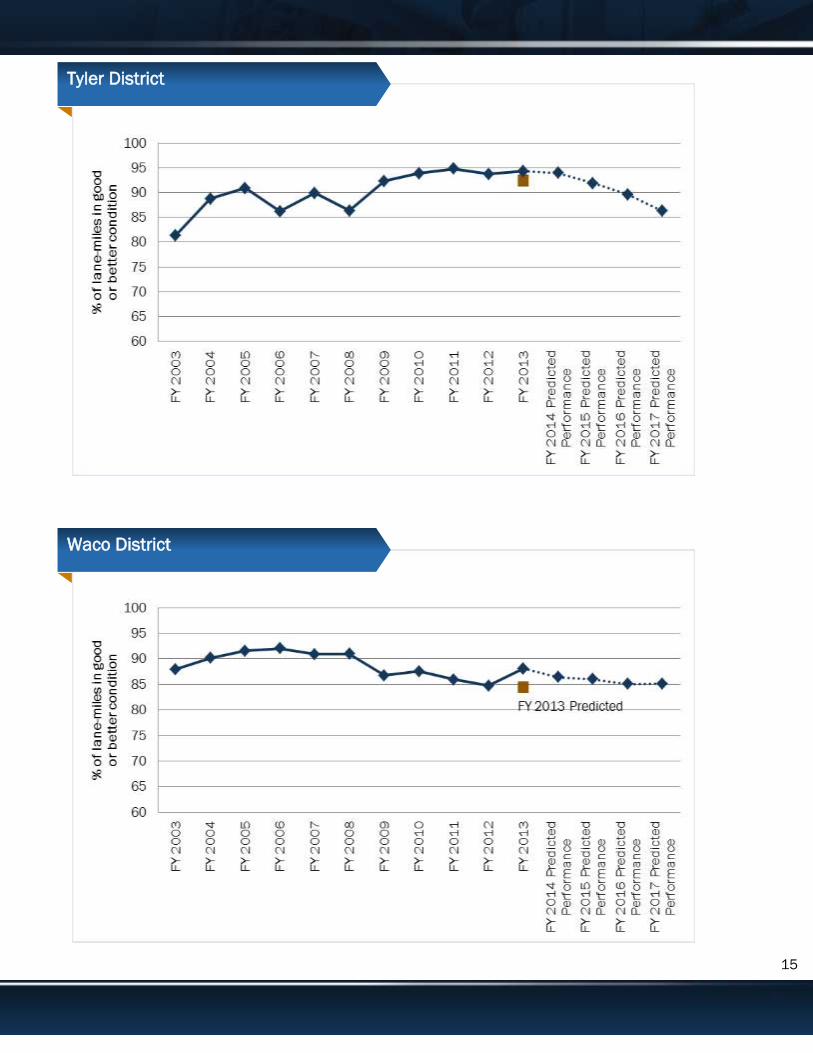
Status of Statewide Pavement Condition Goal, FY 2003-2017
Percent of Lane-Miles in Good or Better Condition*
District
FY
2003
FY
2004
FY
2005
FY
2006
FY
2007
FY
2008
FY
2009
FY
2010
FY
2011
FY
2012
FY 2013
Actual
Performance
FY 2013
Predicted
Performance
FY 2014
Predicted
Performance
FY 2015
Predicted
Performance
FY 2016
Predicted
Performance
FY 2017
Predicted
Performance
Abilene 90.87 90.83 89.23 92.09 91.89 91.32 89.31 90.22 88.79 86.91 88.86 85.02 89.75 89.53 88.68 85.82
Amarillo 80.17 85.67 86.89 83.02 85.46 87.25 87.41 86.04 86.13 84.69 81.57 87.53 81.33 82.40 80.57 79.12
Atlanta 92.24 93.48 93.94 94.57 93.57 94.43 94.25 93.35 91.38 88.68 91.18 87.57 92.69 90.58 88.55 83.55
Austin 87.10 88.50 89.81 88.62 84.18 83.00 83.95 82.71 85.04 82.58 90.23 82.64 89.70 89.11 87.84 85.94
Beaumont 74.40 84.24 81.47 83.10 87.25 84.93 86.98 91.06 89.97 91.21 93.06 90.46 93.00 92.74 90.61 88.26
Brownwood 94.27 95.74 94.28 94.56 93.27 93.21 91.17 93.44 95.34 92.47 94.22 91.58 93.40 92.06 89.93 90.27
Bryan 86.09 84.42 84.50 81.85 86.80 86.10 87.57 86.38 87.49 83.80 86.46 80.10 83.14 80.95 79.70 77.59
Childress 90.63 90.62 92.17 91.33 92.59 91.69 91.48 89.53 87.67 91.12 93.96 92.40 93.73 94.35 93.18 90.92
Corpus Christi 81.14 82.24 78.15 81.48 80.68 82.02 83.58 81.58 83.15 78.15 80.19 76.04 80.62 85.41 86.51 84.27
Dallas 72.62 76.14 77.53 71.93 74.48 70.74 75.27 78.28 76.13 75.63 76.76 75.58 73.97 71.87 68.98 65.01
El Paso 85.03 87.99 83.36 83.76 90.17 87.12 87.35 89.01 90.54 90.34 91.79 89.00 91.16 90.21 88.97 86.54
Fort Worth 85.81 85.41 84.75 85.50 83.41 83.01 81.44 85.52 86.70 87.79 89.76 86.14 87.36 84.69 81.30 79.19
Houston 73.82 73.51 77.54 77.93 80.14 79.71 75.80 76.04 75.09 79.75 83.84 77.20 79.65 74.97 69.70 65.02
Laredo 80.42 83.43 83.30 84.60 86.89 85.37 85.37 85.69 74.64 81.78 80.35 84.38 81.79 83.67 84.10 83.90
Lubbock 86.13 88.68 89.82 90.03 91.39 88.83 86.40 87.36 86.40 87.90 88.73 87.90 90.02 91.11 91.07 91.16
Lufkin 85.99 86.21 87.25 88.65 88.26 88.94 87.87 89.30 88.62 88.96 92.01 88.05 89.76 88.23 87.38 83.70
Odessa 96.15 95.04 95.55 94.83 96.15 94.15 93.33 93.33 94.14 95.45 94.26 94.18 93.18 91.88 89.87 87.33
Paris 82.24 86.07 85.60 85.11 77.26 72.68 74.92 80.60 82.68 81.36 87.15 78.90 83.34 82.59 81.08 76.92
Pharr 90.66 90.26 88.43 87.93 83.77 80.95 80.38 84.07 82.64 86.55 88.78 87.26 89.68 91.04 89.30 85.74
San Angelo 94.10 95.27 95.93 96.42 94.89 94.63 94.58 95.23 95.11 95.15 95.45 94.25 94.54 93.23 91.66 87.77
San Antonio 84.94 83.64 82.98 85.08 81.76 87.27 83.03 84.82 86.51 84.67 86.09 82.26 83.08 80.33 76.85 73.21
Tyler 81.34 88.75 90.88 86.17 89.91 86.33 92.28 93.85 94.77 93.75 94.32 92.42 93.94 91.86 89.62 86.27
Waco 87.98 90.14 91.55 92.04 90.90 90.95 86.72 87.54 85.95 84.76 88.10 84.45 86.41 86.04 85.09 85.12
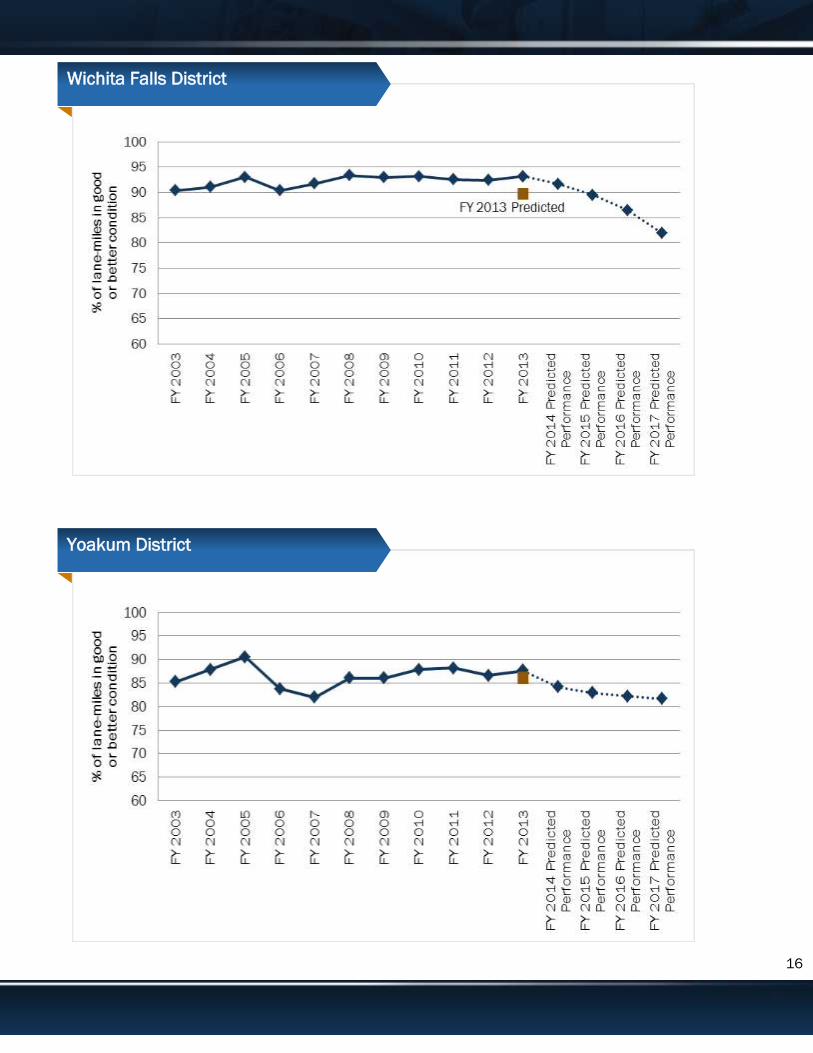
Wichita Falls 90.39 91.05 93.00 90.38 91.76 93.40 92.98 93.18 92.58 92.43 93.20 89.76 91.67 89.50 86.46 81.90
Yoakum 85.31 87.88 90.54 83.81 81.94 86.03 86.08 87.86 88.17 86.63 87.63 86.08 84.16 82.95 82.23 81.69
Statewide 85.28 87.02 87.34 86.69 86.76 86.27 85.94 86.97 86.66 86.47 88.30 86.05 87.64 86.85 85.17 82.65
* A condition score of 70 or higher is considered "Good or better".
2
20
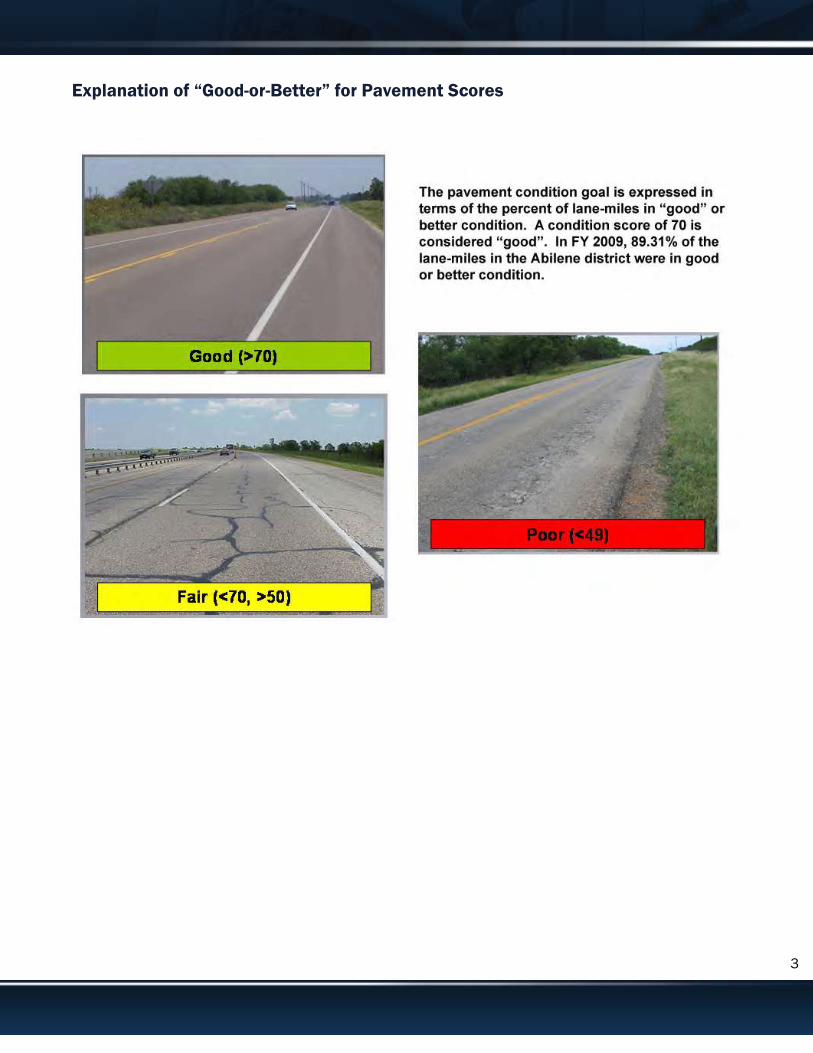
Explanation of “Good-or-Better” for Pavement Scores
3

20
5
Abilene District
Amarillo District
FY 2013 Predicted
FY 2013 Predicted
FY 2013 Predicted
4
20
6
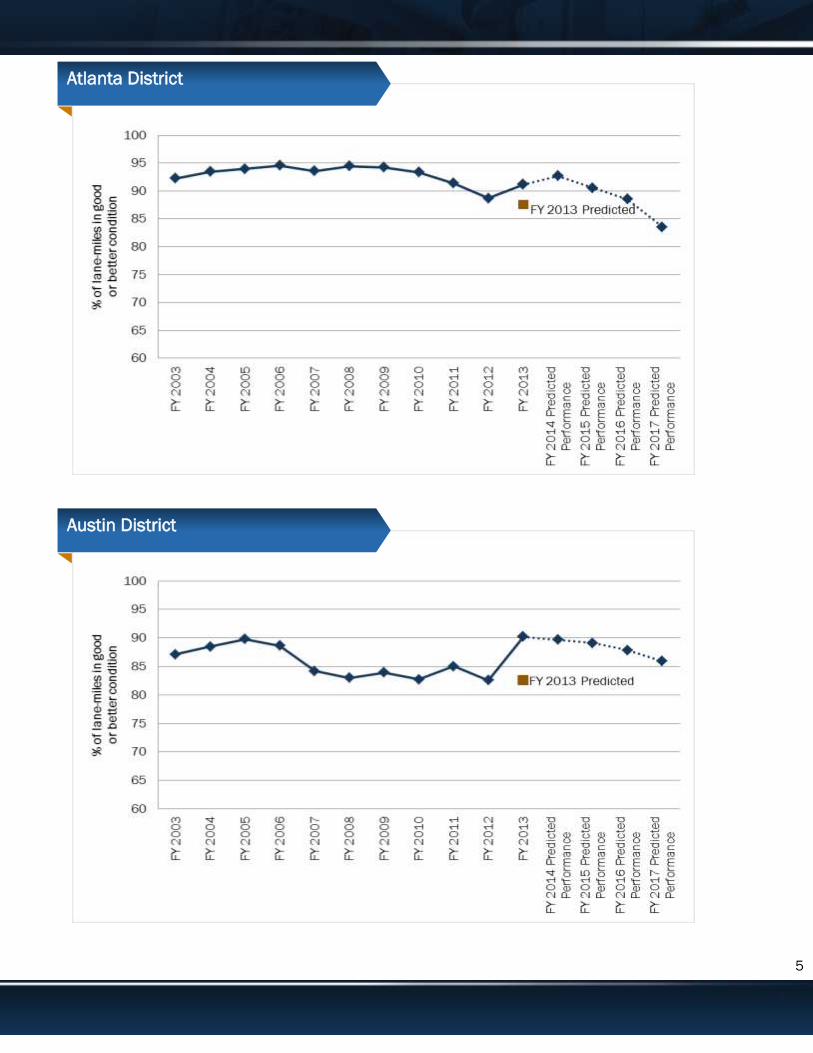
Atlanta District
Austin District
5
20
7
Beaumont District
Brownwood District
6
20
8
Bryan District
Childress District
7
20
9
Corpus Christi District
Dallas District
8

20
10
El Paso District
Fort Worth District
9
20
11
Houston District
Laredo District
10
20
12
Lubbock District
Lukfin District
11

20
13
Odessa District
Paris District
12
20
14
Pharr District
Pharr District
13
20
15
San Angelo District
San Antonio District
14
20
16
Tyler District
Waco District
15
20
17
Wichita Falls District
Yoakum District
16

Planned Projects FY 2014
Copyright 2013 Texas Department of Transportation
Water Body
CityTxDOT RoadwaysCountyDistrict
Base Map Layers
Project ClassificationsBridge Replacement; Bridge WideningConvert Non-Freeway to FreewayCorridor Traffic ManagementEnhancement projectFeasibility StudyHazard Elimination and SafetyInterchange (New or Reconst.)Landscape and Scenic EnhancementMiscellaneous Construction
Overlay; Rehab; Restoration; Seal CoatRailRight of Way AcquisitionSafetyTraffic Protection DevicesTraffic SignalUpgrade to Standards Non-FreewayUpgrade to Standards FreewayWiden Freeway; Widen Non-FreewayNew Location Freeway
New Location Non-Freeway
District MapsAbileneAmarillo
AtlantaAustinBeaumont
BrownwoodBryanChildress
Corpus Christi
18
222834
434852
5862
DallasEl PasoFort Worth
HoustonLaredoLubbock
LufkinOdessaParis
PharrSan Angelo
San AntonioTylerWaco
Whicita FallsYoakum
6779
8392
106
110114122
127
133140
143151157
164168
Transportation Planning and Programming DivisionStatewide Planning and Program Management SectionP.O. Box 149217 Phone: (512) 486-5038Austin, Texas 78714-9217 Fax: (512) 486-5040
This report was produced by the Texas Department of Transportation for use by and within the Texas Legislature. Accuracy is limited to the validity of available data as of December 31, 2012.No portion of this report may be reproduced or stored electronically withoutthe express written permission of the Texas Department of Transportation.Help keep Texas roadways safe and clean.Always buckle up and put litter in its place.
Contact Information

20
19
21

20
20
27

20
21
33

20
22
42
20
23
47
20
24
51

20
25
57

20
26
61
20
27
66

20
28
78

20
29
82
20
30
91

20
31
105

20
32
109
20
33
113

20
34
121
20
35
126

20
36
132
20
37
139
20
38
142
20
39
150
20
40
156
20
41
163
20
42
167

20
43
172
20
44
2
20
45
3
20
46
4
20
47
5
20
48
6
20
49
7
20
50
8
20
51
9
20
52
10

20
53
11
20
54
12
20
55
13
20
56
14
20
57
15
20
58
16
20
59
17
20
60
18

20
61
19
20
62
20
20
63
21

20
64
22
20
65
23
20
66
24
20
67
25
20
68
26
20
69
27

20
70
28
20
71
29

20
72
30

20
73
31
20
74
32
20
75
33
20
76
34
20
77
35

20
78
36
20
79
37
20
80
38
20
81
39
20
82
40

20
83
41
20
84
42
20
85
43
20
86
44
20
87
45
20
88
46
20
89
47
20
90
48

20
91
49

20
92
50
20
93
51
20
94
52

20
95
53
20
96
54
20
97
55
20
98
56
20
99
57
20
100
58
20
101
59

20
102
60

20
103
61
20
104
62
20
105
63

20
106
64
20
107
65
20
108
66
20
109
67

20
110
68
20
111
69

20
112
70
20
113
71
20
114
72
20
115
73
20
116
74

20
117
74
20
118
76
20
119
77
20
120
78
20
121
79
20
122
80
20
123
81
20
124
82

20
125
83

20
126
84
20
127
85
20
128
86
20
129
87
20
130
88
20
131
89
20
132
90

20
133
91
20
134
92
20
135
93
20
136
94
20
137
95
20
138
96
20
139
97
20
140
98
20
141
99

20
142
100
20
143
101

20
144
102

20
145
103

20
146
104
20
147
105
20
148
106
20
149
107

20
150
108
20
151
109
20
152
110
20
153
111

20
154
112
20
155
113
20
156
114
20
157
115
20
158
116
20
159
117
20
160
118
20
161
119
20
162
120
20
163
121
20
164
122
20
165
123
20
166
124
20
167
125

20
168
126

20
169
127

20
170
128
20
171
129
20
172
130

20
173
131

20
174
132

20
175
133
20
176
134

20
177
135
20
178
136
20
179
137

20
180
138
20
181
139
20
182
140
20
183
141
20
184
142
20
185
143
20
186
144
20
187
145
20
188
146
20
189
147

20
190
148

20
191
149
20
192
150

20
193
151

20
194
152
20
195
153
20
196
154

20
197
155
20
198
156
20
199
157
20
200
158

20
201
159

20
202
160

20
203
161

20
204
162
20
205
163
20
206
164

20
207
165

20
208
166
20
209
167
20
210
168
20
211
169
20
212
170
20
213
171

20
214
172
20
215
173
20
216
174
20
217
175
20
218
176
20
219
177
20
220
178
20
221
179

20
222
180
20
223
181
20
224
182
20
225
183
20
226
184
20
227
185

20
228
186

20
229
187
20
230
188
20
231
189
20
232
190
20
233
191
20
234
192
20
235
193
20
236
194
20
237
195

20
238
196
20
239
197
20
240
198

20
241
199
20
242
200
20
243
201
20
244
202

20
245
203
20
246
204
20
247
205
20
248
206
20
249
207
20
250
208
20
251
209

20
252
210
20
253
211

20
254
212
20
255
213
20
256
214
20
257
215

20
258
216
20
259
217
20
260
218

20
261
219
20
262
220

20
263
221
20
264
222
20
265
223
20
266
224
20
267
225
20
268
226
20
269
227

20
270
228
20
271
229
20
272
230

20
273
231
20
274
232
20
275
233

20
276
234
20
277
235

20
278
236

20
279
237

20
280
238

20
281
239
20
282
240

20
283
241
20
284
242
20
285
243
20
286
244

20
287
245
20
288
246

20
289
247
20
290
248
20
291
249

20
292
250
20
293
251
20
294
252

20
295
253
20
296
254
20
297
255
20
298
256
20
299
257
20
300
258

20
301
259
20
302
260

20
303
261
20
304
262

20
305
263
20
306
264
20
307
265
20
308
266
20
309
267
20
310
268
20
311
269
20
312
270

20
313
271

20
314
272
20
315
273
20
316
274
20
317
275

20
318
276
20
319
277

20
320
278

20
321
279

20
322
280
20
323
281