txdot project 0-5410 developing freight highway corridor performance measure strategies in texas
Post on 20-Dec-2015
220 views
TRANSCRIPT

TxDOT Project 0-5410
Developing Freight Highway Corridor Performance Measure
Strategies in Texas

Team: Center for Transportation Research
R. Harrison, L. Loftus-Otway, J. West, M. Schofield
Texas Transportation InstituteD. Middleton, D. Shrank, T. Lomas
TxDOTL. Gregorcyk (PC), G. Malatek (PD), D. Stewart (RTI)
FHWA and ATRI

Goals of Scoping Study
1. Review literature on urban and intercity corridors
2. Evaluate potential FPMs3. Examine ATRI data to evaluate
future freight data use4. Link Intercity and Urban
Corridors5. Identify TxDOT Needs

Top Issues in Motor Carrier Industry 14 MC experts surveyed Several issues could be directly
linked to vehicle location technology
82% of motor carriers believe congestion is a serious problem
(ICF, 2003)

Relating General PM Practices to Freight
Advantages1. Communicatio
n2. Accountability3. Operational
Improvements

Current FPM Practices (New Jersey)NJ FPMs fall into 5 categories: Average Travel Time Measures – Congestion delay Private Sector Cost Measures – Fuel Costs Per
Mile, Insurance Costs Public Impact Measures – Freight-related
Accident Rates, Emissions Economic Impact Measures – Value of
Transportation Goods, Impact of Investments on Regional Economy
Transportation Industry Productivity Measures – Vehicle Miles Traveled, System Performance (by survey), Average Haul Length
NJIT has made the most progress in displaying FPMs, but is still using models, not direct data collection

Focus on Bottlenecks and Impediments While MN/DOT has made an ambitious
push towards FPM use, little on intercity corridors
Current FPM Practices (MN/DOT)
“Developmental measures”
“Emerging measures”
“Mature measures”

Five Recommendations for FPM UseData must be capable of:
1. measurement 2. capturing deficiencies 3. collection over time 4. forecasted 5. being easily understood
Performance measurement has two sides:
Planning and Operational

Data TechnologiesReal time technologies for collecting FPM
data
GPS locators with more constant updates Cellular phones Toll tags RFID on vehicles registration tags
To take full advantage of the data’s potential, it needs to be collected and processed as close to real-time as possible

FHWA Sponsored FPM Worki. Proof of Conceptii. 5 Interstate Highwaysiii. (a) Sample 7 DOTs
(b) Monitor 35 Interstate Highways

ATRI Method
a. ATA sample, using vehicles with GPS on designated routes
b. Vendor provides aggregate data to ATRI
c. ATRI puts GPS data on GISd. Output – maps and reportse. Planning data

5 Initial Corridors

I-70 Denver

Hurricane Katrina 2005

Collaboration with ATRI
Truck volumes over a 24-hour period
Few areas (and no intercity corridors) use anything other than a percentage of passenger vehicle volume

Texas Data for 2005

Typical Auto PeaksTypical Auto PeaksCAMPO 24-Hour Internal Person Trips In Motion Plot
(Diurnal Distribution based upon 1997 expanded household Survey Data)
0.00%
0.50%
1.00%
1.50%
2.00%
2.50%
3.00%
3.50%
0.25
1.00
1.75
2.50
3.25
4.00
4.75
5.50
6.25
7.00
7.75
8.50
9.25
10.0
010
.7511
.5012
.2513
.0013
.7514
.5015
.2516
.0016
.7517
.5018
.2519
.0019
.7520
.5021
.2522
.0022
.7523
.50
Time
Per
cen
t O
f T
rip
s
AM Peak Hr: 7:15-8:15
PM Peak Hr:4:45-5:45
2 hr1.5 hr
3 hr
4:15-6:15
3:15-6:15
7:00-8:30
Peak 15 Min:7:30-7:45
Peak 15 Min:5:00-5:15

El Paso Truck TrafficPercentage of Truck Traffic in Each Hour of the Day
0.00%
1.00%
2.00%
3.00%
4.00%
5.00%
6.00%
7.00%
1 2 3 4 5 6 7 8 9 10 11 12 13 14 15 16 17 18 19 20 21 22 23 24
Time CST
Pe
rce
nt
To
tal
Tru
ck
Tra
ffic
El Paso
Yet real truck volumes show that trucks make different time choices than cars

Houston Truck TrafficPercentage of Truck Traffic in Each Hour of the Day
0.00%
1.00%
2.00%
3.00%
4.00%
5.00%
6.00%
7.00%
8.00%
1 2 3 4 5 6 7 8 9 10 11 12 13 14 15 16 17 18 19 20 21 22 23 24
Time CST
Pe
rce
nt
To
tal
Tru
ck
Tra
ffic
Houston
Shows truck travel demand in greater detail

Rural Truck Traffic
Percentage of Truck Traffic in Each Hour of the Day
0.00%
1.00%
2.00%
3.00%
4.00%
5.00%
6.00%
7.00%
1 2 3 4 5 6 7 8 9 10 11 12 13 14 15 16 17 18 19 20 21 22 23 24
Time CST
Pe
rce
nt
To
tal
Tru
ck
Tra
ffic
Rural

Overall Texas Truck TrafficPercentage of Truck Traffic in Each Hour of the Day
0.00%
1.00%
2.00%
3.00%
4.00%
5.00%
6.00%
7.00%
8.00%
1 2 3 4 5 6 7 8 9 10 11 12 13 14 15 16 17 18 19 20 21 22 23 24
Time CST
Pe
rce
nt
To
tal T
ruc
k T
raff
ic
Houston El Paso All Texas Rural
FPM with truck origin-destination data could result in the better models of truck movements

Linking Intercity and Urban Corridors
Urban Congestion Programs Mobility Monitoring Program
Began 2001 Uses archived detector data 30 urban areas
Urban Mobility Report Began 1982 Uses HPMS data 85 large urban areas
Urban Congestion Reporting Program Began 2002 10 urban areas

Mobility Monitoring Program Speed and count accuracy varies Lack of calibration and maintenance Use of spot speeds to estimate travel
time Lane-by-lane data combined into
“stations” Estimate link properties – “zone of
influence” Group freeway links with similar
adjacent links

traffic sensors collect data in each lane at 0.5-mile nominal spacing
summary statistics computed across all lanes in a given direction
link travel time &vehicle-miles of travel
link travel time &vehicle-miles of travel
point-based properties extrapolated to roadway links 0.5 to 3 miles in length
directional roadway sectiontravel time & vehicle-miles of travel
directional roadway section travel time & vehicle-miles of travel
link properties summed to analysis sections 5 to 10 miles in length
Lane-by-LaneLevel
SectionLevel
LinkLevel
StationLevel

Possible Linkages: ATRI & MMP
Different vehicles monitored
Sampling rates TTI and BI common Need verification

Pavement Management Uses

Future: Planning vs. Operational Improvements To date, nearly all FPM (even general
PM) use has focused on long-term planning
With more frequent, real-time data collection, trucks could become probe vehicles representing total traffic
Currently, urban traffic data provide information to metro users, Extended to intercity travelers, FPM will
provide trip estimates

Big-box and inland port locations may be driven by data on truck locations and volumes
Inland Port/Big Box Uses

Inland Port/Big Box Uses
As inland ports and big boxes locate along the TTC and other corridors, more precise truck travel patterns will prove invaluable in locating and managing distribution centers
Possible Inland Port Possible Inland Port Locations

Other Future Uses Reliability measures, either TTI’s Buffer Index
or a standard deviation, mapped on small highway segments over entire regions to pinpoint bottlenecks
1
)(1
2
N
AvgSpeedSpeedASR
N
ii
n
Real-time data processing allows (a) accidents to be accurately located when reported and (b) emergency routing
Border/port wait time management Other ITS uses such as real-time overhead
signing for traffic optimization.
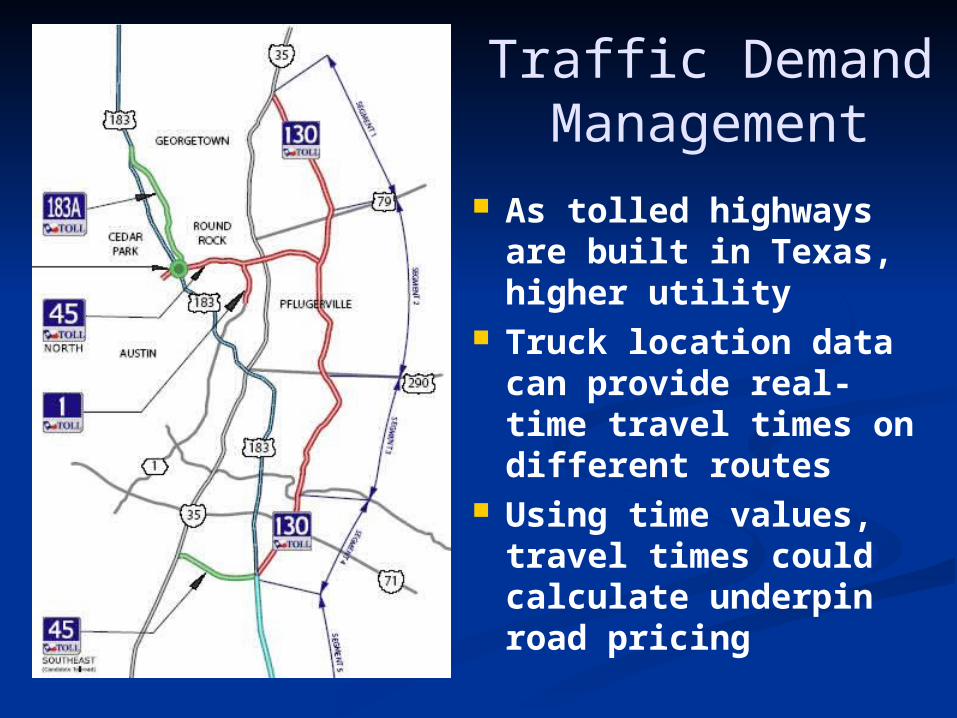
Traffic Demand Management
As tolled highways are built in Texas, higher utility
Truck location data can provide real-time travel times on different routes
Using time values, travel times could calculate underpin road pricing

Questions?