two way fixed effect of priority sector …wireilla.com/management/ijbbr/papers/5116ijbbr01.pdf ·...
TRANSCRIPT
International Journal of BRIC Business Research (IJBBR) Volume 5, Number 1, February 2016
DOI :10.14810/ijbbr.2016.5101 1
TWO WAY FIXED EFFECT OF PRIORITY SECTOR
LENDING (SECTOR WISE) ON NON PERFORMING
ASSETS OF INDIAN COMMERCIAL BANKS
Neha Goyal, Dr Rachna Agrawal and Dr.Renu Aggarwal
Asst, Professor YMCA UST Faridabad
Associate Professor YMCA UST Faridabad
YMCA UST Faridabad
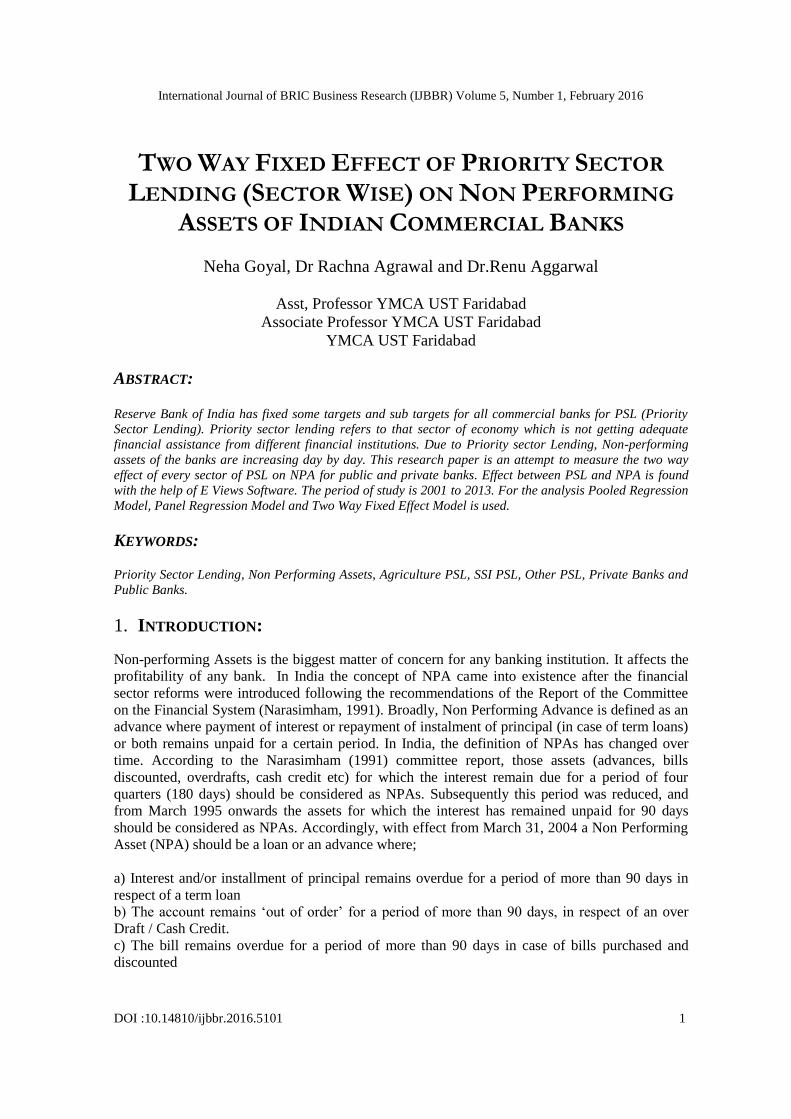
ABSTRACT: Reserve Bank of India has fixed some targets and sub targets for all commercial banks for PSL (Priority
Sector Lending). Priority sector lending refers to that sector of economy which is not getting adequate
financial assistance from different financial institutions. Due to Priority sector Lending, Non-performing
assets of the banks are increasing day by day. This research paper is an attempt to measure the two way
effect of every sector of PSL on NPA for public and private banks. Effect between PSL and NPA is found
with the help of E Views Software. The period of study is 2001 to 2013. For the analysis Pooled Regression
Model, Panel Regression Model and Two Way Fixed Effect Model is used.
KEYWORDS: Priority Sector Lending, Non Performing Assets, Agriculture PSL, SSI PSL, Other PSL, Private Banks and
Public Banks.
1. INTRODUCTION:
Non-performing Assets is the biggest matter of concern for any banking institution. It affects the
profitability of any bank. In India the concept of NPA came into existence after the financial
sector reforms were introduced following the recommendations of the Report of the Committee
on the Financial System (Narasimham, 1991). Broadly, Non Performing Advance is defined as an
advance where payment of interest or repayment of instalment of principal (in case of term loans)
or both remains unpaid for a certain period. In India, the definition of NPAs has changed over
time. According to the Narasimham (1991) committee report, those assets (advances, bills
discounted, overdrafts, cash credit etc) for which the interest remain due for a period of four
quarters (180 days) should be considered as NPAs. Subsequently this period was reduced, and
from March 1995 onwards the assets for which the interest has remained unpaid for 90 days
should be considered as NPAs. Accordingly, with effect from March 31, 2004 a Non Performing
Asset (NPA) should be a loan or an advance where;
a) Interest and/or installment of principal remains overdue for a period of more than 90 days in
respect of a term loan
b) The account remains ‘out of order’ for a period of more than 90 days, in respect of an over
Draft / Cash Credit.
c) The bill remains overdue for a period of more than 90 days in case of bills purchased and
discounted

International Journal of BRIC Business Research (IJBBR) Volume 5, Number 1, February 2016
2
d) Interest and/or installment of principal remains overdue for two harvest seasons but for a
period not exceeding two and a half years in the case of an advance granted for agricultural
purpose
e) Any amount to be received remains overdue for a period of more than 90 days in respect of
other accounts.
Priority sector lending refers to that sector of economy which is not getting adequate financial
assistance from different financial institutions. The main motive is to achieve socio economic
equality. Priority Sector Lending includes Agriculture, Small Scale Industries and Weaker
Sections etc. The targets under PSL have been fixed by RBI for different types of banks.
1.1 TARGETS
As per extant instructions, the targets and sub-targets set under priority sector lending for
domestic and foreign banks operating in India are given below:
Table 1: Targets for Domestic Commercial Banks
Till March 2015 March 2015
Total Priority
Sector
advances
40 per cent of Adjusted Net Bank
Credit (ANBC)
Same
Agriculture
Advances
18 per cent of ANBC out of which
13.5 to direct agriculture and 4.5 to
indirect agriculture.
18% of ANBC
(8%of ANBC is
fixed for small
and marginal
farmers)
No direct and
indirect
agriculture
Micro & Small
Enterprise
advances
(MSE)
No Target 7.5% of ANBC
is fixed for micro
enterprises
Export Credit No Target 12 per cent of
ANBC
Advances to
Weaker Section
10 per cent of ANBC Same
Source: Master Circular RBI/July/2012-13/108 and RBI/2014-15/573
FIDD.CO.Plan.BC.54/04.09.01/2014-15
It is clear from Table 1 that because of fixation of targets by RBI, commercial banks must lend to
Priority Sector. The present study is an attempt to find out the impact of PSL on NPA. The study
is classified in to 9 sections. Section 1 gives the brief introduction of PSL and NPA. Section 2
review the past studies related to NPA and PSL and find the research gap. Section 3 is about the
research methodology, which tells about the objectives of the study, data collection method and

International Journal of BRIC Business Research (IJBBR) Volume 5, Number 1, February 2016
3
steps followed to achieve the objectives. Section 4 is data analysis which comprise of 4 sub
sections. Section 4.1 shows the impact of PSL on NPA. Section 4.2 shows the impact of
Agriculture PSL on NPA. Section 4.3 shows the impact of SSI PSL on NPA. Section 4.4 shows
the impact of Other PSL on NPA. Section 5 is findings. Section 6 concludes the study. Section 7
is of abbreviation. Section 8 is of list of tables. Section 9 is references.
2. LITERATURE REVIEW:
The concept of Priority Sector Lending is formalized in 1972, in year 1979 all banks were
advised to give one third of their advances to priority sectors. In 1980 RBI working group under
Dr. K. S. Krishaswamy suggested to extend the PSL target from 33% to 40%. In 1991
Narshimam Committee suggested to phase out the concept of PSL as it is increasing the NPA
burden of banks. The recommendation of the committee was not accepted. In 1998 Narshimam
Committee again give the report and admitted that PSL is very necessary. In 1995 RIDF fund
had been established, and banks are directed to submit the gap amount of PSL target in RIDF.
Since then several changes had been made in PSL targets and sub targets and various studies has
been done.
Ghosh, 2011 in his study found that Priority sectors like agriculture, SSI and others are also a
reason of increasing NPA of Public and Private sector banks.
Reddy K Prashnath, 2002 in his study done the comparative analysis of Indian banks and -foreign
banks, Author found that main reason of NPA of Indian commercial banks is legal impositions,
like fixation of priority sector target.
Selvam N, 2013, done a study on customer perception regarding NPA of commercial banks,
author found that customer also feel that social and political pressure in form of PSL also play a
major role in increasing NPA.
Laveena, Malhotra Meenakshi, 2014 done a study on NPA and PSL. Researcher has analysed the
NPA and PSL from 2002 to 2014. He has analysed the data by various statistical tools like ration
correlation and regression. According to his study the coefficient of determination is 0.887;
therefore, about 88.7% of the variation in the gross NPA data is explained by priority sector
lending.
Patidar Suresh and Kataria Ashwini 2012 has conducted study to analyze priority sector lending
by selected public and private sector banks in India. Researchers assessed based on using
statistical tools like regression analysis, ratio analysis and t-test. The authors found the significant
impact of priority sector lending on total NPA of Public Sector banks, whereas in case of Private
Sector Banks, there was no significant impact of priority sector lending on total NPA of Banks.
Also the result showed the significant difference between NPA of SBI & Associates, Old Private
Banks and New Private Banks with the NPA of Nationalized Banks, the benchmark category.
Shabbir Najmi, Mujoo Rachna,2013 has conducted a study for the comparison of NPA between
private and public banks. Researchers found that NPA of public banks as compare to private
sector banks is high because PSL of public banks is high than private banks.
Dr. G Nagarajan., N. Sathyanarayana, Ali Asif, 2013 studied the relationship between
recovery and NPA. Researchers found that the main reason of NPA is writing off bad
loans and bad loans are more in case of PSL in comparison of non PSL.

International Journal of BRIC Business Research (IJBBR) Volume 5, Number 1, February 2016
4
The above studies find that there is relation between NPA and PSL. PSL is a leading factor of
NPA. PSL is divided into many sectors like Agriculture, SSI and others but according to the
above mentioned studies and to the best knowledge of researcher, this is still to be studied that
which sector of PSL is responsible for NPA and up to what extent. This study is an attempt to
find out that, among various sectors of PSL, what is the role of each sector to increase NPA.
3. RESEARCH DESIGN AND METHODOLOGY:
The data analyzed in the study is Panel data. Panel data is a data that involves measurements of
many individual units over a period of time. In the study the PSL impact of public banks and
private banks is studied over NPA for 13 years.
3.1. Sampling:
For the purpose of analyzing impact of PSL on NPA, the whole population of Public Sector and
Private Sector has been considered. PSL has been classified in 3 sectors.
1. Agriculture
2. SSI
3. Others
The data has been collected from the RBI website for the period of 13 years i.e. 2001 to 2013.
Secondary data has been used in this research.
3.2. Objectives:
The main objectives of the study are:
1. To find out two way fixed effect of Priority Sector Lending on Total NPA of public and
private banks
2. To find out two way fixed effect of Priority Sector Lending on Total NPA
2.1. To find out the two way fixed effect of Agriculture Priority Sector Lending on Total
NPA
2.2. To find out the two way fixed effect of SSI Priority Sector Lending on Total NPA
2.3. To find out the two way fixed effect of Other Priority Sector Lending on Total NPA
For every objective the following models have been used:
a. Pooled Regression Model: Firstly the relationship is found with the help of pooled
regression model. Pooled Regression Model tells the pooled effect of PSL on NPA of
both public and private sector banks.
b. Panel regression model: After applying the pooled regression model the panel regression
model is applied to know whether the fixed intercept of public and private banks is same
or not. For this, F test (Fixed effect) and Hausman test (Random effect) is applied.
c. Two way fixed effect model: Panel regression model has given different intercepts for
public banks and private banks. so after applying the panel regression model the two way
fixed effect model is applied to know whether the sensitivity coefficient (β) is also
different or not.

International Journal of BRIC Business Research (IJBBR) Volume 5, Number 1, February 2016
5
4. DATA ANALYSIS:
Table 2 present the NPA and PSL of public and private sector banks from 2000 to 2013. Colum 2
is total NPA of public sector bank from 2000 to 2013. Colum 6 is PSL of public sector banks.
Priority sector is further categorized in to three categories, Agriculture, SSI and others. Colum 3
is agriculture Priority Sector Lending of public sector banks. Colum 4 is SSI Priority Sector
Lending of public sector banks. Colum 5 is Other Priority Sector Lending of public sector banks.
Similarly Colum 7 is total NPA of private sector bank from 2000 to 2013. Colum 11 is PSL of
private sector banks. Colum 8 is agriculture Priority Sector Lending of private sector banks.
Colum 9 is SSI Priority Sector Lending of private sector banks. Colum 10 is Other Priority Sector
Lending of private sector banks.
.
*Source: Report of Trend and Progress of Banking in India, Reserve Bank of India (from 2000 to
2013)
4.1. Impact of PSL on NPA:
In the study the effort is done in order to analyse the impact of Priority Sector Lending of public
and private banks on their total net performance basis. The pooled regression model is applied
considering NPA as dependent variable and PSL as independent variable. The pooled regression
model can be mathematically expressed as:

International Journal of BRIC Business Research (IJBBR) Volume 5, Number 1, February 2016
6
The result of pooled regression model is shown below in table 3:
Table 3: Pooled Regression between Total NPA and PSL
Dependent
Variable
Independent
Variable
Regression
Coefficients
t-stat. (p-value) R2
F stat.
(p value)
Total NPA Intercept 7976.258 1.489
(.149)
71.96%
60.795 (.000)
PSL 0.082 7.797
(.000)
The result indicates the p value of t statistics (7.000) is found to be less than 5% level of
significance hence with 95% confidence level the null hypothesis of no significant impact of PSL
on NPA cannot be accepted. Thus it can be concluded that PSL of banks have significant impact
on the NPA of banks. The regression equation can be written as:
NPA=7976.258 +0.082PSL
The regression model indicates that slope coefficient of PSL is found to be 0.082 which is
positive and found significant. Hence it can be concluded that there exist significant positive
impact of PSL on NPA. The result of regression model indicates that if banks offer 1 rupee of
PSL there NPA increase by 8.2 paise. The F statistics of the regression model is found to be
60.79 with p value of (.000) which indicates that the pooled regression model is statistically fit.
The R2
is 71.96% which indicates that approximately 72% of variance in the behaviour of NPA
can be explained with the help of regression model.
4.1.1. Panel Regression Model of NPA and PSL:
After applying the pooled regression model the panel regression model is applied to decide fixed
effect versus random effect model. The F test as well as Hausman test is applied. The F test
indicates that whether fixed effect is significant or not. If p value of F Statistics is found to be less
than 5% level of significance it indicates that the presence of size effect of banks of banks in
analysing the impact of PSL on NPA. In other words fixed effect model is better than pooled
regression model, similarly Hausman test is used to test whether the effects are random or not.
Hausman statistics test the null hypothesis that the effects are random. If P value of Hausman test
is found to be more than 5% level of significance random effect model is applied.
The result of F test and Hausman test shown below:
Table 4: Panel Regression Model of Total NPA and PSL
F test Hausman test
F test (p value) Cross Section random (p value)
Cross Section Effect 7.020 (0.014) 7.020 (0.008)
Time effect 1.33 (.312) 5.03 (0.024)
The results as shown above in table 4 indicate that the P value of F statistics is significant (less
than 5 percent level of significance) hence fixed effect model is statistically better than Pooled
Regression model. The Hausman test indicates that the effects are not random since the P value of
Hausman test is found to be less than 5% level of significance. In other words it can be concluded
that the impact of PSL on NPA in case of public and private banks are different.

International Journal of BRIC Business Research (IJBBR) Volume 5, Number 1, February 2016
7
4.1.2. Two Way Fixed Effect Panel Regression of Total NPA and PSL:
In previous regression fixed effect model, it was assumed that intercept is different for public and
private banks in analyzing the impact of PSL on NPA. It may be possible not only intercept but
also sensitivity of NPA to PSL is also different for public and private banks. The following fixed
effect model where intercept as well as slope coefficient for both public and private banks may be
different is applied.
The results of fixed effect using equation are shown below in table 5:
Table 5: Two Way Fixed Effect Panel Regression Model of Total NPA and PSL
Dependent
Variable
Independent
Variable
Regression
Coefficients
t-stat. (p-value) R2
F stat.
(p value)
NPA Intercept 27710.06 2.89(0.008) 78.5
5
26.89 (.000)
Dummy Private -18152.12 -1.48 (0.152)
PSL 0.0636 4.987 (.000)
Dpr*PSL -0.025 -0.518 (.609)
The results indicate that α is found to be positive. In this regression model as public sector banks
are assumed to be reference hence the NPA in case of no PSL is positive. In addition to this the
slope coefficient of dummy private is found to be negative, which indicates low level of NPA in
case of private banks as compare to public banks. The slope coefficient is (0.0636) represents the
impact of PSL on NPA in case of public sector banks, which represents that increase in the PSL
of 100 Rs would lead to 6.36 Rs increase in NPA. However the slope coefficient of interaction
dummy (dummy of private* PSL) is found to be -0.025 which represents that in case of private
banks the net increase of NPA is Rs. 2.5 less than as result of 100 Rs. increase in PSL as
compare to public sector banks. In absolute terms in case of private banks as a result of 100 Rs.
increases in PSL the net increase in NPA is equal to (6.36-2.56) 3.8. Finally it can be concluded
that private sector banks are more efficient in managing NPA in relation with PSL.
4.2. Impact of Agriculture PSL Lending on NPA:
In the study the effort is done in order to analyse the impact of Agriculture Priority Sector
Lending of public and private banks on their total net performance basis. The pooled regression
model is applied considering NPA as dependent variable and Agriculture PSL as independent
variable. The pooled regression model can be mathematically expressed as:
The result of pooled regression model is shown below in table 6:
Table 6: Pooled Regression between Total NPA and Agriculture PSL
Dependent
Variable
Independent
Variable
Regression
Coefficients
t-stat. (p-
value)
R2
F stat.
(p value)
Total NPA Intercept 10038.69 1.920
(.066)
71.14% 59.179(.000)
Agri PSL 0.193 7.692
(.000)

International Journal of BRIC Business Research (IJBBR) Volume 5, Number 1, February 2016
8
The result indicates the p value of t statistics (7.000) is found to be less than 5% level of
significance hence with 95% confidence level the null hypothesis of no significant impact of
Agriculture PSL on NPA cannot be accepted. Thus it can be concluded that Agriculture PSL of
banks has significant impact on the NPA of banks. The regression equation can be written as:
NPA=10038.69 +0.193 Agri PSL
The regression model indicates that slope coefficient of Agriculture PSL is found to be 0.193
which is positive and found significant. Hence it can be concluded that there exist significant
positive impact of Agriculture PSL on NPA. The result of regression model indicates that if banks
offer 1 rupee of Agriculture PSL there NPA increase by 19.3 paise. The F statistics of the
regression model is found to be 59.179 with p value of (.000) which indicates that the pooled
regression model is statistically fit. The R2
is 71.14% which indicates that approximately 71% of
variance in the behaviour of NPA can be explained with the help of regression model.
4.2.1. Panel Regression Model of Total NPA and Agriculture PSL:
After applying the pooled regression model the panel regression model is applied to decide fixed
effect versus random effect model. The result of F test and Hausman test shown below:
Table 7: Panel Regression between Total NPA and Agriculture PSL
F test Hausman test
F test (p value) Cross Section random (p value)
Cross Section Effect 7.577 (0.011) 7.577 (0.005)
Time effect 1.323 (0.317) 4.679 (0.030)
The results as shown above in table indicate that the P value of F statistics is significant (less than
5 percent level of significance) hence fixed effect model is statistically better than Pooled
Regression model. The Hausman test indicates that the effects are not random since the P value of
Hausman test is found to be less than 5% level of significance. In other words it can be concluded
that the impact of Agriculture PSL on NPA in case of public and private banks are different.
4.2.2. Two Way Fixed Effect Panel Regression of Total NPA and Agriculture PSL:
In previous regression fixed effect model, it was assumed that intercept is different for public and
private banks in analyzing the impact of Agriculture PSL on NPA. It may be possible not only
intercept but also sensitivity of NPA to Agriculture PSL is also different for public and private
banks. The following fixed effect model where intercept as well as slope coefficient for both
public and private banks may be different is applied.

International Journal of BRIC Business Research (IJBBR) Volume 5, Number 1, February 2016
9
The results of fixed effect using equation are shown below in table 8:
Table 8: Two Way Fixed Effect Panel Regression between Total NPA and
Agriculture PSL
Dependent
Variable
Independent
Variable
Regression
Coefficients
t-stat. (p-value) R2
F stat.
(p value)
NPA Intercept 28177.46 3.30(0.003) 78.4 26.63 (.000)
Dummy Private -20314.47 -1.72(0.097)
Agri PSL 0.1471 4.948 (.000)
Dpr*Agri PSL -0.0447 -0.341(.735)
The results indicate that α is found to be positive. In this regression model as public sector banks
are assumed to be reference hence the NPA in case of no Agriculture PSL is positive. In addition
to this the slope coefficient of dummy private is found to be negative, which indicates low level
of NPA in case of private banks as compare to public banks. The slope coefficient is (0.1471)
represents the impact of Agriculture PSL on NPA in case of public sector banks, which represents
that increase in the Agriculture PSL of 100 Rs would lead to 14.71 Rs increase in NPA. However
the slope coefficient of interaction dummy (dummy of private* Agriculture PSL) is found to be -
0.0447 which represents that in case of private banks the net increase of NPA is Rs. 4.47 less than
as result of 100 Rs. increase in Agriculture PSL as compare to public sector banks. In absolute
terms in case of private banks as a result of 100 Rs. increases in Agriculture PSL the net increase
in NPA is equal to (14.71-4.47) 10.24 Finally it can be concluded that private sector banks are
more efficient in managing NPA in relation with Agriculture PSL.
4.3. Impact of SSI PSL Lending on NPA:
In the study the effort is done in order to analyse the impact of SSI Priority Sector Lending of
public and private banks on their total net performance basis. The pooled regression model is
applied considering NPA as dependent variable and SSI PSL as independent variable. The pooled
regression model can be mathematically expressed as:
The result of pooled regression model is shown below in table 9:
Table 9: Pooled Regression between Total NPA and SSI PSL
Dependent
Variable
Independent
Variable
Regression
Coefficients
t-stat. (p-
value)
R2
F stat.
(p value)
NPA Intercept 12551.92 2.636
(0.014)
73.52
%
66.638(.000)
SSI PSL 0.229 8.163 (.000)
The result indicates the p value of t statistics (7.000) is found to be less than 5% level of
significance hence with 95% confidence level the null hypothesis of no significant impact of SSI
PSL on NPA cannot be accepted. Thus it can be concluded that SSI PSL of banks has significant
impact on the NPA of banks. The regression equation can be written as:
NPA=12551.92 +0.229 SSI PSL

International Journal of BRIC Business Research (IJBBR) Volume 5, Number 1, February 2016
10
The regression model indicates that slope coefficient of SSI PSL is found to be 0.229 which is
positive and found significant. Hence it can be concluded that there exist significant positive
impact of SSI PSL on NPA. The result of regression model indicates that if banks offer 1 rupee of
SSI PSL there NPA increase by 22.9 paise. The F statistics of the regression model is found to be
66.638 with p value of (.000) which indicates that the pooled regression model is statistically fit.
The R2
is 73.52% which indicates that approximately 73% of variance in the behaviour of NPA
can be explained with the help of regression model.
4.3.1. Panel Regression Model of Total NPA and SSI PSL:
After applying the pooled regression model the panel regression model is applied to decide fixed
effect versus random effect model. The result of F test and Hausman test shown below in table
10:
Table 10: Panel Regression between Total NPA and SSI PSL
F test Hausman test
F test (p value) Cross Section random (p value)
Cross Section Effect 15.402 (0.000) 15.402 (0.000)
Time effect 1.171 (0.394) 7.446 (0.006)
The results as shown above in table indicate that the P value of F statistics is significant (less than
5 percent level of significance) hence fixed effect model is statistically better than Pooled
Regression model. The Hausman test indicates that the effects are not random since the P value of
Hausman test is found to be less than 5% level of significance. In other words it can be concluded
that the impact of SSI PSL on NPA in case of public and private banks are different.
4.3.2. Two Way Fixed Effect Panel Regression of Total NPA and SSI PSL:
In previous regression fixed effect model, it was assumed that intercept is different for public and
private banks in analyzing the impact of SSI PSL on NPA. It may be possible not only intercept
but also sensitivity of NPA to SSI PSL is also different for public and private banks. The
following fixed effect model where intercept as well as slope coefficient for both public and
private banks may be different is applied.
The results of fixed effect using equation are shown below in table 11:
Table 11: Two Way Fixed Effect Panel Regression between Total NPA and SSI PSL
Dependent
Variable
Independent
Variable
Regression
Coefficients
t-stat.
(p-value)
R2
F stat.
(p value)
NPA Intercept 30466.05 4.79(0.000) 84.7 40.893 (0.000)
Dummy Private -21259.86 -2.5(0.020)
SSI PSL 0.182 6.63 (.000)
Dpr*SSI PSL -0.0930 -0.97(.341)
The results indicate that α is found to be positive. In this regression model as public sector banks
are assumed to be reference hence the NPA in case of no SSI PSL is positive. In addition to this
the slope coefficient of dummy private is found to be negative, which indicates low level of NPA
in case of private banks as compare to public banks. The slope coefficient is (0.182) represents

International Journal of BRIC Business Research (IJBBR) Volume 5, Number 1, February 2016
11
the impact of SSI PSL on NPA in case of public sector banks, which represents that increase in
the SSI PSL of 100 Rs would lead to 18.2 Rs increase in NPA. However the slope coefficient of
interaction dummy (dummy of private* SSI PSL) is found to be -0.093 which represents that in
case of private banks the net increase of NPA is Rs. 9.3 less than as result of 100 Rs. increase in
SSI PSL as compare to public sector banks. In absolute terms in case of private banks as a result
of 100 Rs. increases in SSI PSL the net increase in NPA is equal to (18.2-9.3) 8.9 Finally it can
be concluded that private sector banks are more efficient in managing NPA in relation with SSI
PSL.
4.4. Impact of Other PSL Lending on NPA:
In the study the effort is done in order to analyse the impact of Other Priority Sector
Lending of public and private banks on their total net performance basis. The pooled
regression model is applied considering NPA as dependent variable and Other PSL as
independent variable. The pooled regression model can be mathematically expressed as:
The result of pooled regression model is shown below in table 12:
Table 12: Pooled Regression between Total NPA and Other PSL
Dependent
Variable
Independent
Variable
Regression
Coefficients
t-stat. (p-
value)
R2
F stat.
(p value)
NPA Intercept 3902.663 0.515 (.610) 57.19% 32.066 (.000)
Other PSL 0.310 5.662
(0.000)
The result indicates the p value of t statistics (7.000) is found to be less than 5% level of
significance hence with 95% confidence level the null hypothesis of no significant impact of
Other PSL on NPA cannot be accepted. Thus it can be concluded that Other PSL of banks has
significant impact on the NPA of banks. The regression equation can be written as:
NPA=3902.663 +0.310 Other PSL
The regression model indicates that slope coefficient of Other PSL is found to be 0.310 which is
positive and found significant. Hence it can be concluded that there exist significant positive
impact of Other PSL on NPA. The result of regression model indicates that if banks offer 1 rupee
of Other PSL there NPA increase by 31 paise. The F statistics of the regression model is found to
be 32.066 with p value of (.000) which indicates that the pooled regression model is statistically
fit. The R2
is 57.19% which indicates that approximately 57% of variance in the behaviour of
NPA can be explained with the help of regression model.
4.4.1. Panel Regression Model of Total NPA and Other PSL:
After applying the pooled regression model the panel regression model is applied to decide fixed
effect versus random effect model. The result of F test and Hausman test shown below in table
13:
Table 13: Panel Regression between Total NPA and Other PSL
F test Hausman test
F test (p value) Cross Section random (p value)
Cross Section Effect 4.381 (0.047) 4.381 (0.036)
Time effect 1.671 (0.192) 3.640 (0.056)
International Journal of BRIC Business Research (IJBBR) Volume 5, Number 1, February 2016
12
The results as shown above in table indicate that the P value of F statistics is significant (less than
5 percent level of significance) hence fixed effect model is statistically better than Pooled
Regression model. The Hausman test indicates that the effects are not random since the P value of
Hausman test is found to be less than 5% level of significance. In other words it can be concluded
that the impact of Other PSL on NPA in case of public and private banks are different.
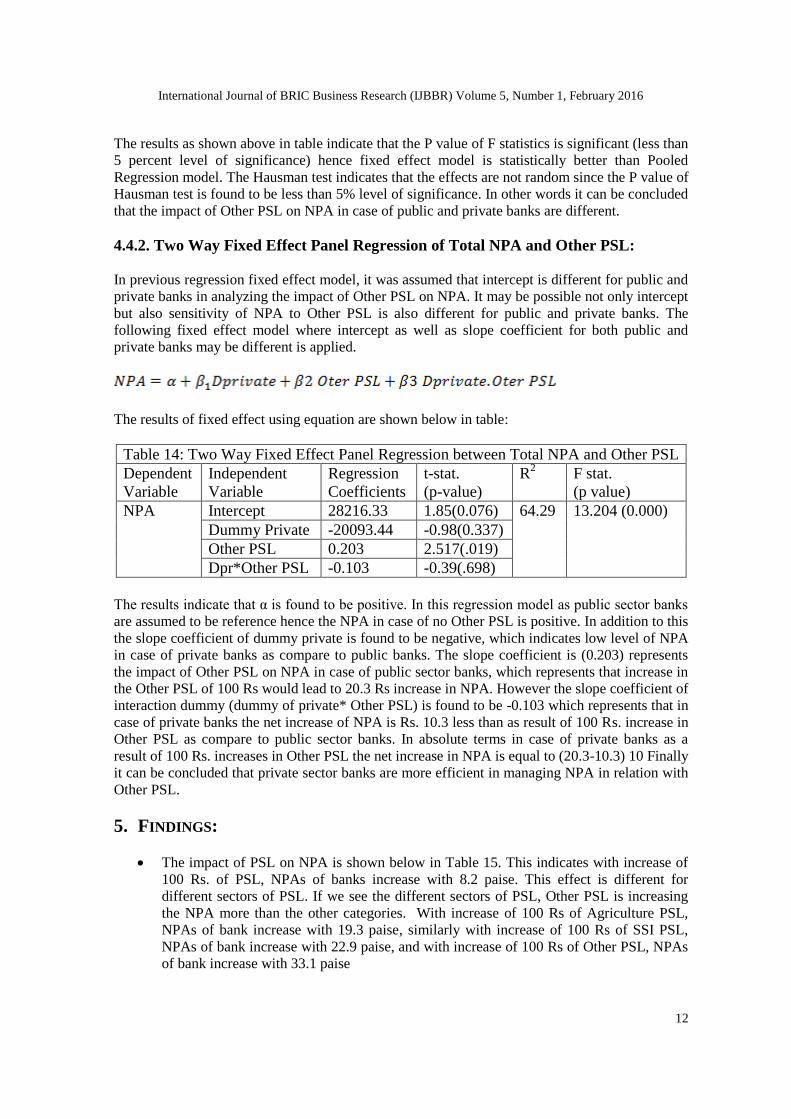
4.4.2. Two Way Fixed Effect Panel Regression of Total NPA and Other PSL:
In previous regression fixed effect model, it was assumed that intercept is different for public and
private banks in analyzing the impact of Other PSL on NPA. It may be possible not only intercept
but also sensitivity of NPA to Other PSL is also different for public and private banks. The
following fixed effect model where intercept as well as slope coefficient for both public and
private banks may be different is applied.
The results of fixed effect using equation are shown below in table:
Table 14: Two Way Fixed Effect Panel Regression between Total NPA and Other PSL
Dependent
Variable
Independent
Variable
Regression
Coefficients
t-stat.
(p-value)
R2
F stat.
(p value)
NPA Intercept 28216.33 1.85(0.076) 64.29 13.204 (0.000)
Dummy Private -20093.44 -0.98(0.337)
Other PSL 0.203 2.517(.019)
Dpr*Other PSL -0.103 -0.39(.698)
The results indicate that α is found to be positive. In this regression model as public sector banks
are assumed to be reference hence the NPA in case of no Other PSL is positive. In addition to this
the slope coefficient of dummy private is found to be negative, which indicates low level of NPA
in case of private banks as compare to public banks. The slope coefficient is (0.203) represents
the impact of Other PSL on NPA in case of public sector banks, which represents that increase in
the Other PSL of 100 Rs would lead to 20.3 Rs increase in NPA. However the slope coefficient of
interaction dummy (dummy of private* Other PSL) is found to be -0.103 which represents that in
case of private banks the net increase of NPA is Rs. 10.3 less than as result of 100 Rs. increase in
Other PSL as compare to public sector banks. In absolute terms in case of private banks as a
result of 100 Rs. increases in Other PSL the net increase in NPA is equal to (20.3-10.3) 10 Finally
it can be concluded that private sector banks are more efficient in managing NPA in relation with
Other PSL.
5. FINDINGS:
The impact of PSL on NPA is shown below in Table 15. This indicates with increase of
100 Rs. of PSL, NPAs of banks increase with 8.2 paise. This effect is different for
different sectors of PSL. If we see the different sectors of PSL, Other PSL is increasing
the NPA more than the other categories. With increase of 100 Rs of Agriculture PSL,
NPAs of bank increase with 19.3 paise, similarly with increase of 100 Rs of SSI PSL,
NPAs of bank increase with 22.9 paise, and with increase of 100 Rs of Other PSL, NPAs
of bank increase with 33.1 paise

International Journal of BRIC Business Research (IJBBR) Volume 5, Number 1, February 2016
13
Table 15: Impact of PSL on NPA sector wise
PSL and different Sector of PSL β coefficient with NPA
PSL 0.082
Agriculture PSL 0.193
SSI PSL 0.229
Other PSL 0.331
The impact of PSL and its different sectors on NPA is different for public and private
sector banks. The F test and Hausman test tell that intercept and β coefficient with NPA
of public and private banks is different. Means impact of PSL of pubic banks on NPA is
different from private banks.
Comparison of intercept and β coefficient of public banks and private banks is being done
in table 16. It is clear from table 16 that PSL intercept of public banks is 27710.06 and
private banks intercepts is 18152.12 less than public banks and β coefficient of public
banks of PSL is 0.0636 and private banks PSL β coefficient is .025 less than public
banks. It can be stated that if NPA of public banks increase with 6.36 paise with 100 Rs
increase of PSL than NPA of private banks increase with 3.86 paise(6.36-2.5).
Table 16: Comparison of Intercept and β Coefficient of Public Banks and Private
Banks
PSL and
different Sector
of PSL
Intercept
of public
banks
Intercept
of private
banks as
compare to
public
banks
β coefficient of
public banks
β coefficient of
private banks as
compare to
public banks
PSL 27710.06 -18152.12 0.0636 -0.025
Agriculture PSL 28177.46 -20314.47 0.1471 -0.0447
SSI PSL 30466.05 -21259.86 0.182 -0.0930
Other PSL 28216.33 -20093.44 0.203 -0.103
If we see the different sectors of PSL private banks NPAs are less affected because of PSL in
comparison of public banks. Due to 100 rupees increase of Agriculture PSL public banks NPAs
increase with 14.71 paise while private banks NPAs increase with 10.24 (14.71-4.47) paise. Due
to 100 rupees increase of SSI PSL public banks NPAs increase with 18.2 paise while private
banks NPAs increase with 8.9 (18.2-9.30) paise. Due to 100 rupees increase of Other PSL public
banks NPAs increase with 20.3 paise while private banks NPAs increase with 10 (20.3-10.3)
paise.
CONCLUSION:
Priority Sector Lending is having a significant impact on NPA in case of both public banks and
private banks, but public banks NPA is more affected by PSL as compare to private banks. In
case of public banks out of subsectors of PSL; SSI and Other PSLs is major contributor to NPA.
In case of private banks out of subsectors of PSL; Agriculture and Other PSL is equally
contributing to the NPA.
International Journal of BRIC Business Research (IJBBR) Volume 5, Number 1, February 2016
14
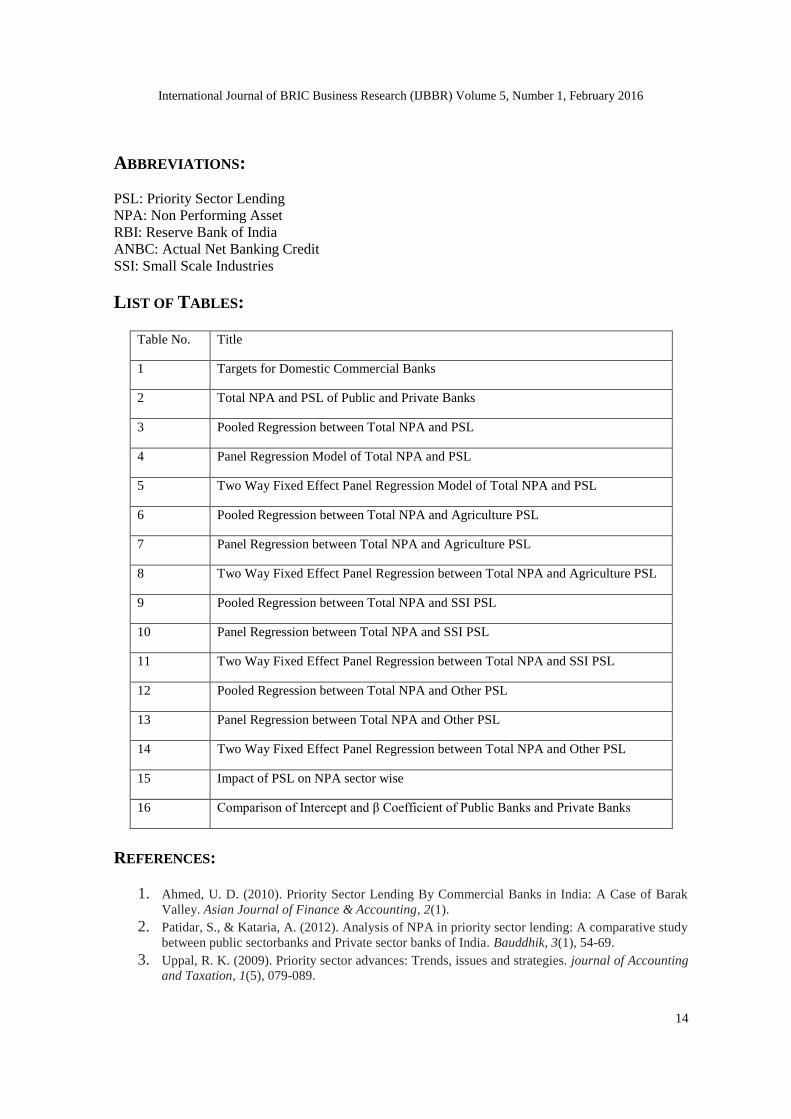
ABBREVIATIONS:
PSL: Priority Sector Lending
NPA: Non Performing Asset
RBI: Reserve Bank of India
ANBC: Actual Net Banking Credit
SSI: Small Scale Industries
LIST OF TABLES: Table No. Title
1 Targets for Domestic Commercial Banks
2 Total NPA and PSL of Public and Private Banks
3 Pooled Regression between Total NPA and PSL
4 Panel Regression Model of Total NPA and PSL
5 Two Way Fixed Effect Panel Regression Model of Total NPA and PSL
6 Pooled Regression between Total NPA and Agriculture PSL
7 Panel Regression between Total NPA and Agriculture PSL
8 Two Way Fixed Effect Panel Regression between Total NPA and Agriculture PSL
9 Pooled Regression between Total NPA and SSI PSL
10 Panel Regression between Total NPA and SSI PSL
11 Two Way Fixed Effect Panel Regression between Total NPA and SSI PSL
12 Pooled Regression between Total NPA and Other PSL
13 Panel Regression between Total NPA and Other PSL
14 Two Way Fixed Effect Panel Regression between Total NPA and Other PSL
15 Impact of PSL on NPA sector wise
16 Comparison of Intercept and β Coefficient of Public Banks and Private Banks
REFERENCES:
1. Ahmed, U. D. (2010). Priority Sector Lending By Commercial Banks in India: A Case of Barak
Valley. Asian Journal of Finance & Accounting, 2(1).
2. Patidar, S., & Kataria, A. (2012). Analysis of NPA in priority sector lending: A comparative study
between public sectorbanks and Private sector banks of India. Bauddhik, 3(1), 54-69.
3. Uppal, R. K. (2009). Priority sector advances: Trends, issues and strategies. journal of Accounting
and Taxation, 1(5), 079-089.
International Journal of BRIC Business Research (IJBBR) Volume 5, Number 1, February 2016
15
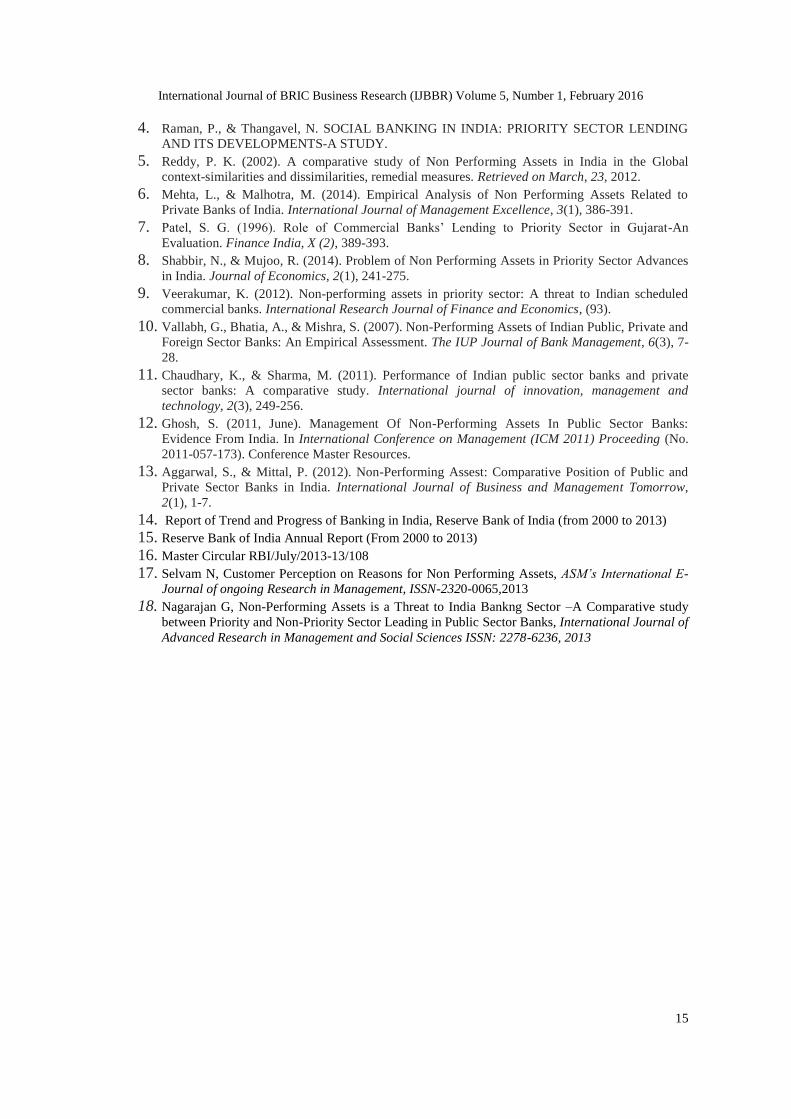
4. Raman, P., & Thangavel, N. SOCIAL BANKING IN INDIA: PRIORITY SECTOR LENDING
AND ITS DEVELOPMENTS-A STUDY.
5. Reddy, P. K. (2002). A comparative study of Non Performing Assets in India in the Global
context-similarities and dissimilarities, remedial measures. Retrieved on March, 23, 2012.
6. Mehta, L., & Malhotra, M. (2014). Empirical Analysis of Non Performing Assets Related to
Private Banks of India. International Journal of Management Excellence, 3(1), 386-391.
7. Patel, S. G. (1996). Role of Commercial Banks’ Lending to Priority Sector in Gujarat-An
Evaluation. Finance India, X (2), 389-393.
8. Shabbir, N., & Mujoo, R. (2014). Problem of Non Performing Assets in Priority Sector Advances
in India. Journal of Economics, 2(1), 241-275.
9. Veerakumar, K. (2012). Non-performing assets in priority sector: A threat to Indian scheduled
commercial banks. International Research Journal of Finance and Economics, (93).
10. Vallabh, G., Bhatia, A., & Mishra, S. (2007). Non-Performing Assets of Indian Public, Private and
Foreign Sector Banks: An Empirical Assessment. The IUP Journal of Bank Management, 6(3), 7-
28.
11. Chaudhary, K., & Sharma, M. (2011). Performance of Indian public sector banks and private
sector banks: A comparative study. International journal of innovation, management and
technology, 2(3), 249-256.
12. Ghosh, S. (2011, June). Management Of Non-Performing Assets In Public Sector Banks:
Evidence From India. In International Conference on Management (ICM 2011) Proceeding (No.
2011-057-173). Conference Master Resources.
13. Aggarwal, S., & Mittal, P. (2012). Non-Performing Assest: Comparative Position of Public and
Private Sector Banks in India. International Journal of Business and Management Tomorrow,
2(1), 1-7.
14. Report of Trend and Progress of Banking in India, Reserve Bank of India (from 2000 to 2013)
15. Reserve Bank of India Annual Report (From 2000 to 2013)
16. Master Circular RBI/July/2013-13/108
17. Selvam N, Customer Perception on Reasons for Non Performing Assets, ASM’s International E-
Journal of ongoing Research in Management, ISSN-2320-0065,2013
18. Nagarajan G, Non-Performing Assets is a Threat to India Bankng Sector –A Comparative study
between Priority and Non-Priority Sector Leading in Public Sector Banks, International Journal of
Advanced Research in Management and Social Sciences ISSN: 2278-6236, 2013