turfgrass trends - msu librariesarchive.lib.msu.edu/tic/tgtre/article/1998sep1a.pdf · turfgrass...
TRANSCRIPT

A P R A C T I C A L R E S E A R C H D I G E S T F O R T U R F M A N A G E R S
SEP I 4 1998
TURFGRASS TRENDS Volume 1, Issue 9 • September 1998
A G R O N O M I C S
Thatch control in bentgrass greens The influence of cultural & chemical controls on rootzone nutrients By Lloyd M. Callahan, University of Tennessee
Thatch accumulation naturally occurs at many managed turfgrass sites, however if it accumulates excessively it can seriously impede the health and long-term survival of densely grown turfgrasses such as on putting greens, so controlling thatch buildup is
important. Thatch is defined as a tightly intermingled layer of dead and living stems, leaves, and roots that accumulates between the green vegetation and the soil surface.
Accumulation of thatch is a direct result of intensive management which causes the rate of plant organic matter (OM) accumulation to exceed the natural degradation process. Thatch accumulation has been reported to be favored by acid soils except where calcium (Ca) was applied. Thatch accumulation rate was found to be approximately twice as great below pH 4.0 as above 5.0. The presence of Ca, applied as calcium hydroxide, and the suppressive effect it has been shown to have, suggests that Ca might be a major factor involved in thatch decomposition under acidic conditions.
There are considerable differences of opinion as to what cultural practices, chemical treatments, or treatment combinations are most effective in controlling thatch when high-ly maintained at sites like a golf course. These differences are broad-based and cover the spectrum of management strategies.
Some researchers have observed that mechanical practices like core aerification are effective in reducing thatch alone or in combination with either vertical mowing or lime-stone applications. Others have reported little or no benefit of coring on thatch levels. Ver-tical mowing has also been shown to effectively reduce thatch in some studies, but has been ineffective in others. Likewise, frequent topdressing with sand or a high sand content soil mixture reduced thatch when performed alone or in combination with coring and vertical mowing, while others have reported no effect of topdressing on thatch.
Limestone has been used in some studies to maintain a favorable thatch pH to enhance microbial activity to speed thatch decomposition, but in still other studies, limestone appli-cation had no effect on thatch. Even extra potassium (K) and wetting agent treatments have been tested, but were also reported to be ineffective in reducing thatch.
This variance in results was less surprising when you consider that all of these previous tests were conducted on a variety of grasses grown on soil rootzones under an assortment of management strategies - from six tests on bermudagrass greens and one lawn to three on bentgrass greens, one on a bentgrass fairway, and two on Kentucky bluegrass lawns.
To bring some semblance of order to this diversity of hosts, management practices, and
IN THIS ISSUE
Thatch in Bentgrass Greens: The Influence of Cultural & Chemical Controls on Rootzone Nutrients . . . . . . . . 1
Phosphorus
Hydrated Lime, Calcium, and pH
Wetting Agents
Nematodes as insect control allies. . . . .
Plant Parasites
Insect Parasites
Nematode Behavior
Field Applications
Nematode Suppliers
IO
unvw. landscapegroup. com

TURFGRASS TRENDS Editor Terry Mclver 440-891-2709; 440-891-2675 (fax) [email protected]
Production Manager Karen Lenzen 218-723-9129; 218-723-9576 (fax) klenzen@advanstar. com
Circulation Manager Frank Christopherson 218-723-9271
Layout & Production Bruce F. Shank, BioCOM 805-274-0321
Group Editor Vern Henry
Group Publisher John D. Payne 440-891-2786; 440-891-2675 (fax) jpayne@advanstar. com
Corporate Office 7500 Old Oak Blvd. Cleveland, OH 44130-3369
Editorial Office 7500 Old Oak Blvd. Cleveland, OH 44130
l\iew Subscriptions 1-888-527-7008
Abstracts: 800-466-8443 Reprint: 440-891-2744 Permission: 440-891-2742 Single copy or back issues: Subscription/Customer Service 218-723-9477; 218-723-9437 (fax) 888-527-7008 website: umw.landscapegroup.com
ÄDVANSTAR H O L D I N G S , I N C .
Chairman and Chief Executive Officer Robert L. Krakoff
Vice Chairman James M . Alic
Vice President, Business Development Skip Färber
W ADVANSTAR C O M M U N I C A T I O N S
Executive Vice Presidents William J. Cooke, Alexander S. DeBarr, Glenn A. Rogers
VP-Finance, CFO & Secretary David J. Montgomery
Treasurer and Controller Adele D. Hartwick
results we conducted a six-year study at the University of Tennessee. We compared the effectiveness of the most commonly used mechanical practices and certain chemi-cal/nutrient treatments in controlling thatch on a creeping bentgrass green con-structed to USGA specifications. Determi-nations were also included to assess the influence of these mechanical and chemi-cal/nutrient treatments on the content of selected nutrients and the pH level of the USGA green rootzone.
Treatments Used Cultural practices and chemical/nutrient
control treatments were conducted on a Penncross bentgrass research green con-structed at Knoxville, TN, expressly for the purpose of conducting these thatch control studies. The green was constructed to 1973 USGA specifications (9), except that the 1.5 inch thick intermediate coarse sand layer was omitted. An initial laboratory analyses of the 12-inch rootzone showed a composition of 95.3 percent sand (63 per-cent fractions between 0.25- and 0.5-mm diameters), 3 percent silt, 1 percent clay and 0.7 percent OM by weight. Analysis of the rootzone mixture also showed 36 percent capillary and 16 percent noncapillary pores, a bulk density of 1.41 g cm3; and infiltration and percolation rates of 9 inches per hour.
Dolomitic limestone and a 6-12-12 analysis fertilizer were thoroughly mixed into the rootzone giving an initial soil test of the top 6 inches of a pH 6.6, 60 lb/A phos-phorus (P), 190 lb/A K, and 3563 lb/A Ca. Nitrogen (N) was ammonium nitrate, P was superphosphate, and the K was muriate of potash. Limestone treatments were not made after the initial application.
The green was fumigated with methyl bromide to eradicate nematodes, fungi, insects and weed seed, and seeded with Koban treated Penncross bentgrass in Sep-tember. The first research treatments were made the following March.
Maintenance fertilization and height of mowing was uniform across the green. Nitrogen rates and mowing height were not
used as treatment variables. Bentgrass annu-al maintenance fertilization (excluding extra K that was used as one of the main experimental treatments) totaled 263 lb/A N, 38 lb/A P, and 146 lb/A K.
Nitrogen applications were divided equally among March, April, May, Septem-ber, October and November of each year. Annual phosphate and potash applications were divided equally among March, April, September, and October.
The green was mowed daily, Monday through Friday, with a greensmower at 6-mm-cutting height with clippings caught and removed. The green was irrigated with 1 -inch of water Monday, Wednesday, and Friday, unless it rained, between June and September.
Fungicides and insecticides were applied as needed to control diseases and insects. No additional chemical or mechanical thatch control maintenance treatments were applied to the green throughout the entire period of these investigations except those applied as treatments.
Annual repeat test treatments, and their respective abbreviations in brackets, were: (1) vertical mowing, 4 times (VM 4x) (2) vertical mowing, eight times (VM 8x) (3) core (or coring) aerification, four times (4) vertical mowing plus coring, both four times (VM + core) (5) a wetting agent, seven times (Wet Ag) (6) extra K, four times (K) (7) hydrated lime, four times (L) (8) K plus lime, both four times (K+L) (9) vertical mowing plus extra K, both four times (VM+K) (10) vertical mowing plus lime, both four times (VM+L) and (11) vertical mowing plus extra K and lime, all applied four times per year (VM+K+L).
Three sub-plots crossed the main treat-ments and consisted of sand topdressing three (Tpd 3x) and six (Tpd 6x) times per year, and a no topdressing strip. Thus, each replication comprised a total of 36 individ-ual plots.
Bentgrass stand density determinations were by monthly visual assessments in each sub-plot based on 0 to 100 percent. Main

plot treatments of vertical mowing were performed with solid blades spaced one inch apart, slicing just above the soil surface, and with the raised plant debris removed immediately with a power vacuum. VM treatments were done in March, May, Sep-tember, and October. Treatments applied eight times per year were done in March, April, May, June, August, September, Octo-ber, and November.
Coring was performed with a power core aerifier with 0.25 inch diameter tines, two inches apart, and cutting to a depth of approximately three inches. Cores were allowed to air-dry for several minutes and then removed with a power vacuum. Cor-ing treatments were applied in April, May, September, and October.
A non-ionic Wet Ag (Aqua-Gro) was applied annually in March, April, May, June, September, October, and November in a water dilution. Extra K, as muriate of potash, was applied at 36 lb/A in March, April, September, and October to provide 144 lb/A K annually.
Hydrated lime was applied in March, April, September and October at 218 lb/A in a water suspension.
A soil test was conducted at the end of the six-year test period at the 0 to 3-inch and 3- to 6-inch rootzone depths for deter-minations of Ca, K, P, and pH. Topdressing treatments applied three times per year were done in April, May, and September. Topdressing applied six times per year were done in April, May, June, August, Septem-ber, and October.
Thatch depth was measured with a thatchmeter in June, August, and Novem-ber for all six years of the study. The thatch-meter was selected over the ruler and total OM by loss-on-ignition methods because it proved to be the most sensitive, consistent, reliable, and fastest of the three methods investigated in a previous comparative study (4). The thatchmeter used was the "Thatchmeter II" developed by Volk.
Earthworm counts, pesticide treatments, other than maintenance treatments, and variable N rates were not used. Further-more, the potential for confounding influ-ences from surface and soil feeding insects was removed from these studies with the use of three different insecticides.
Thatch development at the test site - All 13 individual and combination treatments for thatch control began approximately seven months (in March) after construction was completed and the green was seeded to Penncross bentgrass (the previous Septem-ber). Depth of thatch was approximately 3.5 mm when treatments began.
Thatch accumulation was variable between replications as measured by both the ruler and thatchmeter during the first three years of the newly constructed green as thatch began its initial buildup. By year four, all ruler and thatchmeter readings appeared consistent among samples within plots and # -between replications. Thus, SlX-yCMV StUOy tO discussion of results will only cOYYlpClYC the be presented for the last three _ # „ years of the six-year study. ejjeCllVeneSS Oj Ruler measurements are only c o m m o n l y USed shown for consistency from ? 7
the start of the study. Thatch m e c k a n i c a l p r a c t i c e s depth by ruler measurements am£ selected chem-in non-treatment control 1
(check) plots in March was ical/nutrient treat-10.2, 12.7, and 14.8 mm for menfS {n controlling years 4, 5, and 6 respectively. 7 7
Thatch depth measure- thatch on a creeping ment values were consistently bentgrdSS green COn-higher in June for every main
The University of Tennessee conducted
plot treatment than corre-sponding values taken in November. Moisture content of grass leaves and the thatch was low in August and resulted in erratic results, probably due to higher tempera-tures and drier conditions, hence August was judged a poor time to make accurate measurements (seeTable 1).
Thatch Control The results listed in Table 1 of measure-
ments conducted in June show the most effective main treatment methods of reduc-ing thatch level (5.68-6.21 mm) were:
• VM alone at both 4 and 8x/yr • VM + core, both conducted 4x/yr. Thatch reduction increased as frequency
of Tpd increased, except under the three K treatments regimen (see Table 2). AT the higher amount of Tpd (6x), treatments
struct ed to USGA specifications.

receiving extra K (VM+ K + L, K + L, K) appeared by visual observations to result in an increase in size, and possibly numbers, of stolons which may have resulted in an increase in thatch depth readings.
Least squares analysis showed no differ-ence between VM 4x and 8x and VM + Core treatments under no Tpd. However, all main plot treatment effects exhibited lower values than untreated plots, except WetAg under 3x and 6x Tpd.
When lower amounts (3x) of Tpd was applied (April, May, and September) results were confounded and there were no differ-ences among most main plot treatments, except for the individual treatments of Core, L, and Wet Ag (Table 2). Again there was no difference between VM 4x and 8x and VM + Core, but the confounding effect of K was removed and the non-significant main plot treatments included VM + L, instead ofVM + K + L. Hydrated lime treatments did not influence thatch depth. The greatest decrease in thatch depth were observed on turf receiving large amounts of Tpd treat-ment (6x) plus VM (4x and 8x) and VM + Core (Table 2).
When comparing least squares analysis for Tpd frequency, both small (3x) and large (6x) amounts of Tpd significantly reduced thatch, as compared with no Tpd (Table 3). The largest amount of Tpd (6x) decreased thatch the most.
Lowest non-significant levels of thatch, or the highest level of thatch control, from cultural treatments resulted following VM 4x or 8x/yr and VM + coring. Tpd 3x or 6x/yr also effectively prevented thatch buildup.
Effects of Chemical/Nutritional Treat-ments on Thatch and rootzone nutrient lev-els The following discussions regarding lev-els of Ca, K, and P refer only to nutrient amounts in the rootzone reflected in the soil samples. No distinction is made as to what portion were removed by the plant nor what portion was lost through leaching. No leaf tissue analyses were conducted.
Potassium Effects Several researchers reported that K did
not influence thatch accumulation. Howev-er, they conducted their studies for only 1 year and indicated that K might affect thatch accumulation over a period of years. Extra K treatments were included in this study not only to determine if K contributes to either an increase or decrease in thatch buildup, but also to determine if K has any influence on bentgrass recovery following mechanical treatment thinning for thatch control.
The initial soil test K level was 190 lb/A, plus six years of annual maintenance fertil-izer providing 873 lb/A, combined with six years of extra K treatments totaling 857 lb/A, ending with a grand total of 1,920 lb/A in extra K treatment plots. The grand total of K applications in plots not receiving extra K was 1,063 lb/A.
A soil sampling at the end of the study from the 0 to 3-inch depth of the main treatment plots showed a K range of 133 to 83 lb/A for plots receiving extra K and a range for all other main treatment plots of 87 to 57 lb/A (see Table 4). On average K at the extra K plots after six years was 110 lb/A and showed a loss of 94 percent K from leaching and clipping removal in the 95.3 percent sand content USGA green. An average of all other main treatments not receiving extra K was 67 lb/A and also showed a 94 percent loss. Loss of K appeared to be proportionate to the amount present. A soil test of available K in the extra K plots would rank in the mid-medium range and available soil K in all of the other main treatment plots ranked in the upper low range.
Soil test from the 3 to 6-inch depth of the main treatment plots showed a K range of 83 to 50 lb/A for plots receiving extra K and a range of all other main treatment plots of 44 to 40 lb/A (Table 4). An aver-age of the extra K plots was 63 lb/A or a 97 percent loss and the average for all the other main treatments was 43 lb/A or a 96 per-cent loss. Again, K loss appeared to be pro-portionate to the amount present. Avail-able K in the extra K plots ranked in the upper low level soil test and for all the oth-

ers, in the mid-low soil test range. Previously it has been recommended that
K levels in USGA specification greens be increased during the establishment period, and for the first few growth years, do to the high loss rate under the very low cation exchange capacity (CEC) sand-based condi-tions. Although the K loss was extremely high in this study, the bentgrass showed no deficiency symptoms. Apparently the grass was still able to satisfy its needs for K from the much higher measured K concentrations in the 0 to 3-inch rootzone depth (Table 4), which also is the depth containing the high-est percentage of the grass's root system.
As mentioned under "Thatch Control", increasing Tpd (6x) generally resulted in decreased thatch, except with three of the four treatments involving extra K which exhibited increased thatch measurements (Table 2). Because of the longevity of this study, fungicides were used regularly throughout the six-year period to control all fungal activity to remove the confounding variability of disease incidence. Although K influence on disease resistance could not be determined, other physiological influences were observed. Bentgrass receiving extra K did not appear to maintain stand density, or influence rate of stand recovery following mechanical treatment thinning, any better than bentgrass mechanically thinned and not receiving extra K (Table 5). Thus, results of extra K treatments generally agreed with conclusions by other researchers.
Phosphorus Effects The beginning soil test level of P was 60
lb/A, that plus six years of annual mainte-nance fertilizations which added 225 lb/A yielded total applications of 285 lb/A. The soil test at the end of the 6 years showed a P range of 83 to 38 lb/A in the 0 to 3-inch depth, an average of 55 lb/A, and 36 to 22 lb/A in the 3 to 6-inch depth, and average of 30 lb/A, for the main treatment plots (Table 4). Loss of P in the 0 to 3-inch depth was 81 percent and 90 percent in the 3 to 6-inch depth. Levels of P were significantly higher in the 0 to 3-inch depth in five of the six plots
receiving extra K and L (K, K +L, K + L + VM, L, L + VM). Levels of P in the 3 to 6-inch depth was almost half that occurring in the 0 to 3-inch depth. Both soil test showed levels classified as high available P. Although the average P loss from the top 6 inches of this very high porosity green was 86 percent, the residual P level was still more than ade-
TABLE 1. THATCH MEASUREMENT WITH THE THATCHMETER
Thatch Measurement Means and Standard Errors for Main Thatch Control Treatments in June and November for thatch measurements with the thatchmeter for the last three years of a six-year study.
Thatch measurement means
Main Treatments June November
-mm-V + Core 5.68 5.04 VM 4x 6.20 5.07 VM 8x 6.21 4.99 VM + K 6.66 5.80 VM + K + L 6.75 5.23 K 6.80 5.72 V M - f L 6.80 5.30 K + L 6.95 6.07 Core 7.36 5.64 Check 7.73 6.40 L 7.96 5.60 Wet Ag 7.99 5.99
Standard errors for least square means, as determined by general linear mixed models analysis, for all means = 0.36.
quate for plant needs. As were recommen-dations for K, recommends for increasing P levels in USGA greens during establishment to assure sufficient levels for root develop-ment and off-set leaching losses and plant removal have been made. There were no indications that P level played a significant role in the increase or decrease of thatch. Although mechanical treatments of VM 4x and 8x, Core, and the chemical treatment of Wet Ag did reduce P levels significantly in the 0 to 3-inch depth (Table 4), there were no significant detrimental effects evident in bentgrass sod density (Table 5).
Hydrated Lime, Calcium, and pH Effects
Researchers have conducted several studies to evaluate agricultural limestone (CaC03) for thatch control. In two studies, it was suggested that limestone may be effective in reducing thatch, but in other studies, limestone treatments were not effective. However, it was reported that the presence of Ca as hydrated lime (Ca (OH)2) suggested that Ca may be a con-tributing factor in thatch decomposition.
In this study, dolomitic limestone (CaC0 3 Mg C 0 3 ) was incorporated into the rootzone just before bentgrass seeding. No limestone was used thereafter, only selective applications of hydrated lime were made four times per year for six years in four main treatment plots.
The initial level of Ca in the top six inch-es of the rootzone, following a dolomitic limestone incorporation, was 3563 lb/A. With the addition of Ca as hydrated lime four times per year for six years in four main treatment plots, total background plus
treatment Ca was 6,063 lb/A. The soil test at the end of six years showed an average level of Ca for main treatments in the 0 to 3-inch depth to be 2642 lb/A (Table 4), which was a 56 percent loss of Ca. Plots receiving L and extra K (L, K + L, L + VM, K + L + VM], with a pH 7.3, resulted in only a 53 percent Ca loss. The mean Ca level for main treatments in the 3 to 6-inch rootzone depth was 2980 lb/A, a 51 per-cent Ca loss.
However, plant needs for Ca is approxi-mately 500 lb/A (12), thus more than ade-quate levels of Ca were available in the rootzone.
The starting pH of the top 6 inches of the rootzone was 6.6. The ending soil test pH after six years in the 0 to 3-inch depth showed a significant increase to 7.3 for the four main treatments involving lime (L, K + L , L + V M , K + L + V M ) (Table 4). The pH for all other main treatments ranged from 6.8 to 6.4. Rootzone pH for all main treatments in the 3 to 6-inch depth ranged from 7.5 to 7.2, except for VM 4x which was significantly lower at 7.0 (Table 4).
TABLE 2. THATCH MEASUREMENT WITH THE THATCHMETER
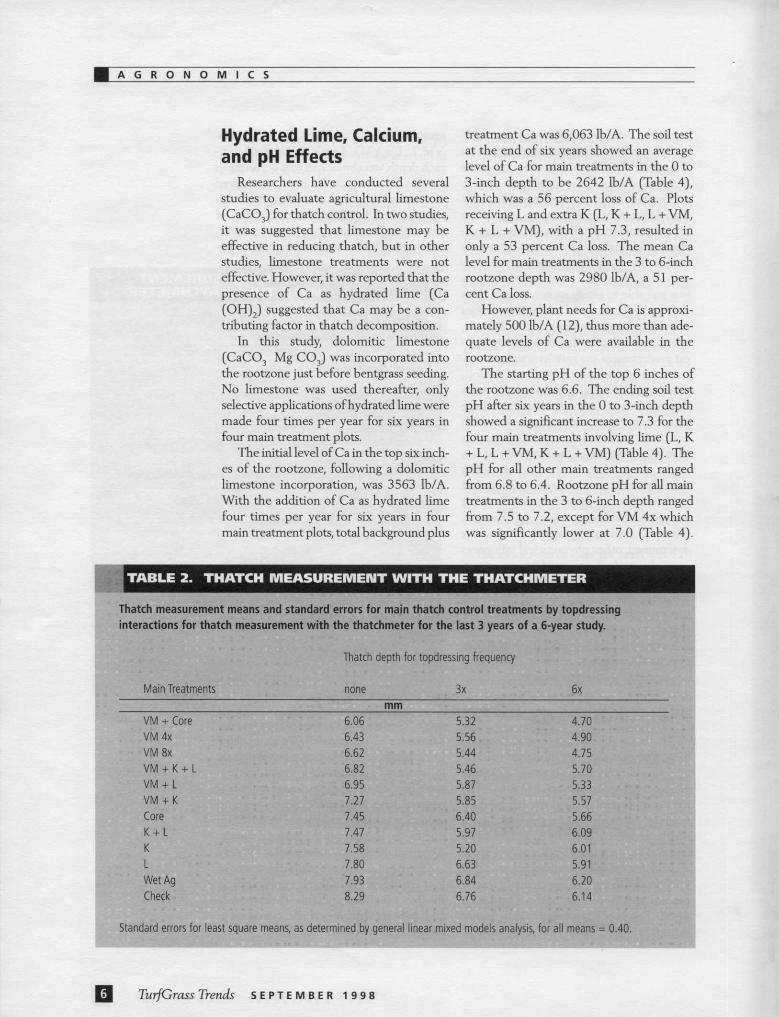
Thatch measurement means and standard errors for main thatch control treatments by topdressing interactions for thatch measurement with the thatchmeter for the last 3 years of a 6-year study.
Thatch depth for topdressing frequency
Main Treatments none 3x 6x mm
VM + Core 6.06 5.32 4.70 VM 4x 6.43 5.56 4.90 VM 8x 6.62 5.44 4.75 VM + K + L 6.82 5.46 5.70 VM + L 6.95 5.87 5.33 VM + K 7.27 5,85 5.57 Core 7.45 6.40 5.66 K + L 7.47 5.97 6.09 K 7.58 5.20 6.01 L 7.80 6.63 5.91 Wet Ag 7.93 6.84 6.20 Check 8.29 6.76 6.14
Standard errors for least square means, as determined by general linear mixed models analysis, for all means = 0.40.

However, means of bentgrass stand density exhibited no visible effects which could be attributed significantly to these pH levels (see Table 5).
Bentgrass receiving L and no Tpd showed no evidence of reduced stand den-sity that could be attributed to Ca defi-ciency after 5 and 6 years (Table 5) since Ca deficiency did not occur (Table 4). How-ever, under both Tpd frequencies (3x and 6x), by year five, the lowest creeping bent-grass stand densities were recorded in the L plots (91 and 92 percent density), although by year six stand densities within Tpd fre-quencies were 99 and 100 percent. Results of L treatments indicate that L, at the rates used, had no significant benefits in control-ling or reducing thatch, apparently because of the high soil pH levels which ranged from pH 6.4 to 7.3 in the 3 to 6-inch root-zone depth (Table 4).
Wetting Agent Effects Two previous researchers used a Wet Ag
and reported that it was ineffective in reducing thatch. The same non-ionic Wet Ag used in this study, but at a much higher rate than recommended by the manufac-turer. Results indicated that Wet Ag increased thatch accumulation, regardless of whether Tpd was applied or not (Tables 1 and 2). It was previously suggested that Wet Ag treatments tend to promote quick-er drying of the turf surface resulting in a interruption of the decay process thus enhancing thatch buildup. This may explain the deeper thatch layer observed
where Wet Ag was applied in our year five. What part, if any, the high porosity
green rootzone influenced Wet Ag effects could not be ascertained. However, bent-grass stand densities were 99 and 100 per-cent for year five and all were 100 percent for year six in untreated plots and in Tpd 3x and 6x plots (Table 5).
When combining mechanical and chemical methods with Tpd, lowest levels of thatch resulted following VM 4x or 8x/yr, VM + coring, and VM + L, all com-bined with Tpd 6x/yr. Extra K (VM + K + L, K + L, K) and Wet Ag actually resulted in increased thatch. Lime did not influ-ence thatch depth. Loss of rootzone K was 94 percent and increased with mechanical and chemical treatments. Loss of rootzone P was 86 percent but extra K and L treat-ments reduced P loss, especially under pH 7.3 following L treatments. Loss of root-zone Ca was 56 percent but L and extra K treatments under pH 7.3 reduced this loss.
If managers have adequate soil nutrient levels (as measured by a soil test) and they can be maintained through normal nutri-ent management practices, then the 4 and 8 times per year mechanical treatments combined with 3 to 6 topdressing applica-tions per year appear to offer the best change to significantly reduce accumulat-ed thatch on highly maintained bentgrass USGA putting greens.
If soil tests reveal consistently low soil K levels requiring supplemental applications or the use of high K fertility practices to reduce disease pressure are used, then
: TABLE 3. THATCH MEASUREMENT WITH THE THATCHMETER
Thatch measurement means and standard errors for topdressing frequency for thatch control measurements with the thatchmeter for the last 3 years of a 6-year study.
Thatch depth
Topdressing Treatment June November mm
None 7.99 6.45 3x/yr 6.59 5.29 6x/yr 6,18 4.97
Standard errors for least square means, as determined by general linear mixed models analysis, for all means = 0.32.

higher thatch depths may result especially when measured in the usually more favor-able fall months.
References
1. Beard, J.B. 1973. Turfgrass Science and Culture. Prentice-Hall, Inc., New York.
2. Beard, J.B. 1976. Thatch: Its causes and control, p. 68-74. In Proc. 17th Illinois Turf Conf. Univ. of III. Champaign, IL.
3. Blouin, D.C. and A.M. Saxton. 1990. General linear mixed models (GLMM) (version 1.0) user's manual. Louisiana Agric. Exp. Stn., Baton Rouge, LA.
4. Callahan, L.M., W.L. Sanders, J.M. Parham, C.A. Harper, L.D. Lester, and E.R. McDonald. 1997. Comparative methods of measuring thatch on a creeping bentgrass green. Crop Sci. 37:230-234.
5. Carrow, R.N. 1993. Establishing bentgrass on sand-based greens. Golf Course Mgt. 61(3): 90-93, 96-98.
6. Carrow, R.N., B.J. Johnson, and R.E. Burns. 1987. Thatch and quality of Tifway bermudagrass turf in relation to fertility and cultivation. Agron. J.
79: 524-530.
7. Eggens, J.L. 1980. Thatch control on creeping bentgrass turf. Can. J. Plant Sci. 60:1209-1213.
8. Engel, R.E., and R.B. Alderfer. 1967. The effect of cultivation, topdressing, lime, N, and wetting agent on thatch development on 1/4-inch bent-grass turf over a 10-year period. N.J. Agric. Exp. Stn. Bull. 818: 32-45.
9. Green Section Staff. 1973. Refining the green section specifications for putting green construc-tion. USGA Green Sec. Rec. 11:1-8.
10. Holt, E.C. 1969. Turfgrasses under warm, humid conditions, p. 513-528. InA.A. Hanson and F.V. Juska (ed.) Turfgrass Science. Agron. Monogr. 14. ASA, Madison Wl.
11. Hurto, K.A., A.J. Turgeon, and L.A. Spomer. 1980. Physical characteristics of thatch as a turf-grass growing medium. Agron. J. 72:165-167.
12. Jones, J.B., Jr., B. Wolf, and H.A.Mills. 1991. Plant analysis handbook. Micro-Macro. Publ., Inc., Athens, GA.
13. Ledeboer, F.B., and C.R. Skogley. 1967. Investigations into the nature of thatch and
TABLE 4. SOIL TEST LEVELS OF CALCIUM, PHOSPHORUS, POTASSIUM, PH
Means of main plot treatment soil test levels of calcium, phosphorus, potassium, and pH in the 0 to 3-inch and 3 to 6-inch rootzone depths after 6 years of thatch control treatments in a bentgrass green.
Nutrient means in two rootzone depths (in inches) K P Ca PH
Main treatments 0-3 3-6 0-3 3-6 Ih/A
0-3 3-6 0-3 3-6 IU/M
K 133 57 60 34 2672 2716 6.7 7.2 K + V M 130 83 38 28 2524 2530 6.6 7.2 K + L 94 60 83 29 2879 3850 7.3 7.5 Core 87 40 46 30 2445 2443 6.6 7.2 K + L + V M 83 50 73 36 2852 3827 7.3 7.5 Wet Ag 77 44 43 30 2645 2704 6.5 7.2 VM 4x 67 44 49 33 2484 2534 6.5 7.0 L 63 44 68 32 2838 3720 7.3 7.5 Core + VM 60 40 38 28 2435 2421 6.8 7.3 VM Bx 57 44 46 22 2471 2477 6.4 7.2 L + VM 57 44 54 25 2818 3555 13 7.5 Check 57 40 40 28 2550 2586 6.6 7.3 LSD (0.05) 52 12 23 12 208 300 0.41 0.33 Columns (down) are means of three replications, combining all Tpd treatments as one plot, and partitioned using LSD with alpha-risk set at 0.05.

method for its decompositions. Agron. J. 59.
14. McWhirter, E.L., and C.Y.Ward. 1976. Effect of vertical mowing and aerification on golf green quality. Miss. Agr. For. Exp. Stn. Res. Rpt. 2(12).
15. Meinhold, V.H., R.L. Duble, R.W. Weaver, and E.C.Holt. 1973. Thatch accumulation Bermudagrass turf in relation to management. Agron. J. 65: 833-835.
16. Murray, J.J., and F.V. Juska. 1977. Effects of management practices on thatch accumulation, turf quality, and leaf spot damage in common Kentucky bluegrass. Agron. 69: 365-369.
17. Potter, D.A., B.L. Bridges, and F.C. Gordon. 1985. Effect of N Fertilization on earthworm and microarthropod populations in Kentucky bluegrass turf. Agron. J. 77: 367-372.
18. Sanders, W.L. 1989. Choice of models of linear models and the mixed model rational for sta-tistical computations, p. 49-56. in Applications of mixed models in agriculture and related disciplines. So. Coop. Series Bull. No 343. Louisiana Agric. Exp. Stn.,Baton Rouge, LA.
19. Sartain, J.B. 1985. Effect of acidity and N source on the growth and thatch accumulation of Tifgreen bermudagrass on soil nutrient retention. Agron. J. 77: 33-36.
20. Smith, G.S. 1979. Nitrogen and aerification influence on putting green thatch and soil. Agron. J. 71:680-684.
21. Thompson,W.R., and C.Y.Ward. 1966. Prevent thatch accumulation on Tifgreen bermuda-grass greens. Golf Supt. 34: 20-38.
22. Volk,G.M. 1972. Compressibility of turf as a measure of grass growth and thatch development on bermudagrass greens. Agron. J. 64.
23. Waddington, D.V. 1992. Soils, soil mixtures, and soil amendments, p. 331-383. In D.V. Waddington et al. (ed.) Turfgrass. Argron. Monogr. 32. ASA, Madison, Wl.
24. White, R.H., and R. Dickens. 1984. Thatch accumulation in bentgrass as influenced by cultural practices. Agron. J. 76:19-22.
TABLE 5. PENNCROSS BENTGRASS STAND DENSITIES
Means of Penncross bentgrass stand densities in late June after 5 and 6 years of main plot treatments com-bined with sand topdressing treatments.
Topdressing (Tpd) frequencies
Year 5 Tpd Year 6 Tpd Main treatments None 3x 6x None 3x 6x
Core 100 100 / o
100 100 100 100 VM + Core 100 100 100 99 98 97 Wet Ag 100 100 99 100 100 100 VM + L 100 96 94 98 99 97 K + L 100 92 99 100 100 99 L 100 92 91 100 100 99 VM + K + L 99 97 97 98 100 98 K 98 92 100 100 100 100 VM 8x 98 96 93 100 100 100 VM 4x 98 91 97 100 100 100 VM + K 98 92 93 99 99 98 Check 90 91 93 97 99 100 LSD (0.05) 3.9 2.7 2.7 1.3 1.2 1.2 Columns (down) are means of three replications and were partitioned using LSD with alpha-risk
set at 0.05 for densities measured during the last 2 years of a 6-year study.