turbulent effect of sf6 thermal plasmas inside a puffer-assisted self-blast chamber
TRANSCRIPT
at SciVerse ScienceDirect
Vacuum 86 (2012) 1522e1527
Contents lists available
Vacuum
journal homepage: www.elsevier .com/locate/vacuum
Turbulent effect of SF6 thermal plasmas inside a puffer-assisted self-blast chamber
Jaeyoung Lee a, Jong-Chul Lee b,*
aGraduate School of Mechanical Engineering, Sungkyunkwan University, Suwon, 440746, Republic of Koreab School of Mechanical and Automotive Engineering, Gangneung-Wonju National University, Wonju, 220711, Republic of Korea
a r t i c l e i n f o
Article history:Received 30 September 2010Received in revised form26 December 2011Accepted 16 January 2012
Keywords:SF6 thermal plasmaPuffer-assisted self-blast chamberArc dischargeTurbulence modelComputational fluid dynamics
* Corresponding author. Tel.: þ82 33 760 8766; faxE-mail address: [email protected] (J.-C. Lee).
0042-207X/$ e see front matter � 2012 Elsevier Ltd.doi:10.1016/j.vacuum.2012.01.020
a b s t r a c t
In this study, we calculated the whole arcing history of SF6 thermal plasmas happened inside a puffer-assisted self-blast chamber during the alternative current interruption process with two different turbu-lencemodels. It is very difficult to correctly realize all phenomena happened inside the interrupter using thecomputational schemes; therefore, we have been trying to simplify the physics related in the problem.Because most flows encountered in the process are turbulent, the ability to predict turbulence for thisapplication is invaluable for the engineer to design the chamber reliably. The objective of this paper is tomodel turbulence by averaging the unsteadiness of the turbulence, which are called Reynolds averagedNaviereStokesmodels, and to compare the results with pressure and temperature field distributions duringthe whole arcing history. It was found that the two-equation turbulent model predicts bigger mixing ofmomentum, heat and species on the arc discharge of this interrupter than the zero-equation model does.
� 2012 Elsevier Ltd. All rights reserved.
1. Introduction
The physical understanding of SF6 thermal plasmas happenedinside a puffer-assisted self-blast (PASB) chamber, which is beingdeveloped as the next-generation switching mechanism, duringthe alternative current (AC) interruption process is invaluable forthe related engineer to research and develop the reliable products[1]. Although the experimental approach has been adopted well foranalyzing the complex interruption mechanism of electric arcs, itrequires mass infrastructure, safety and environment for large-capacity and high-voltage facilities. Therefore, the numericalapproach has been making progress with the computationalhardware and schemes as called numerical testing or digital testingfrom the end of the 1990’s [2]. Especially, the physical modelingusing the equations related with fluid flow and heat transfer andthe computational fluid dynamics (CFD) techniques is more suit-able for understanding mechanisms as well as for getting ideasduring the switching process [3] than the black-box modelingdealing with energy balance in terms of electrical view point [4].
Most flows encountered in this kind of arc discharges areturbulent, and therefore the modeling of turbulent arcs is requiredto investigate arc instability by taking into account the densityfluctuations in the region where the temperature gradient is verysteep [5]. Especially, the turbulent effect driven by SF6 thermalplasmas happened inside the PASB chamber is more significant
: þ82 33 760 8761.
All rights reserved.
than that of other breaking principles due to the use of PTFEablation for pressure-rise during the high-current phase andthermal decay during the current-zero phase [3,6].
In this paper, we calculate the whole arcing history of SF6thermal plasmas, which consists of thermal-flow characteristicsand electromagnetic behaviors, happened inside the PASB chamberduring the AC interruption process with a CFD technique and twodifferent turbulence models. The objective of this study is to modelturbulence by averaging the unsteadiness of turbulence, which arecalled Reynolds averaged NaviereStokes (RANS) models, and tocompare the results with pressure and temperature field distribu-tions during the interruption process. Because of the significantinfluence of the turbulence on the heat and mass transportphenomena in SF6 thermal plasmas, and the difficulty of obtainingdetailed turbulence measurements in the high temperature arcregion, emphasis is placed on the use of mathematical modeling asa means of studying the turbulence behavior in the chamber. Theplasma turbulent viscosity and the turbulent intensity with twodifferent turbulencemodels, the Prandtl’s mixing lengthmodel andthe standard ke 3model, are calculated. The results provide a valu-able insight of the turbulence phenomena in the chamber.
2. Numerical methods
2.1. The governing equations
SF6 thermal plasmas happened inside a PASB chamber can betreated as the local thermal equilibrium (LTE) plasmas because the
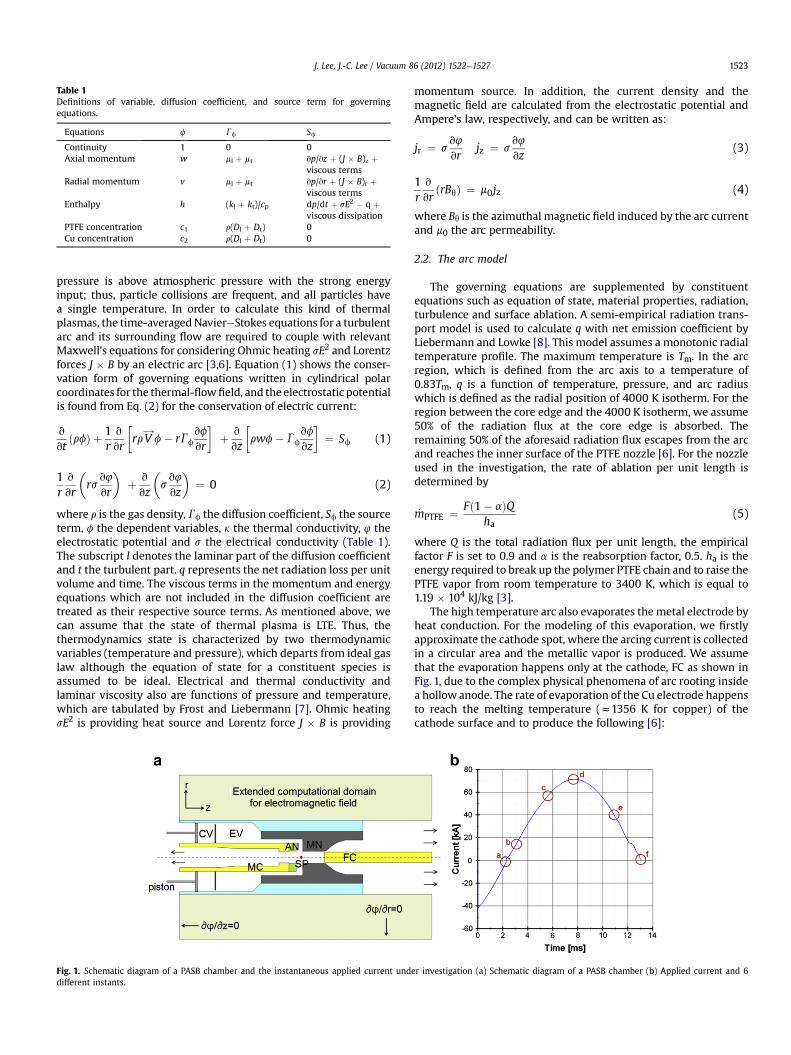
Table 1Definitions of variable, diffusion coefficient, and source term for governingequations.
Equations f Gf Sf
Continuity 1 0 0Axial momentum w ml þ mt vp/vz þ (J � B)z þ
viscous termsRadial momentum v ml þ mt vp/vr þ (J � B)r þ
viscous termsEnthalpy h (kl þ kt)/cp dp/dt þ sE2 � q þ
viscous dissipationPTFE concentration c1 r(Dl þ Dt) 0Cu concentration c2 r(Dl þ Dt) 0
J. Lee, J.-C. Lee / Vacuum 86 (2012) 1522e1527 1523
pressure is above atmospheric pressure with the strong energyinput; thus, particle collisions are frequent, and all particles havea single temperature. In order to calculate this kind of thermalplasmas, the time-averagedNaviereStokes equations for a turbulentarc and its surrounding flow are required to couple with relevantMaxwell’s equations for considering Ohmic heating sE2 and Lorentzforces J � B by an electric arc [3,6]. Equation (1) shows the conser-vation form of governing equations written in cylindrical polarcoordinates for the thermal-flowfield, and the electrostatic potentialis found from Eq. (2) for the conservation of electric current:
v
vtðrfÞ þ 1
rv
vr
�rrV!f� rGf
vf
vr
�þ v
vz
�rwf� Gf
vf
vz
�¼ Sf (1)
1rv
vr
�rs
v4
vr
�þ v
vz
�sv4
vz
�¼ 0 (2)
where r is the gas density, Gf the diffusion coefficient, Sf the sourceterm, f the dependent variables, k the thermal conductivity, 4 theelectrostatic potential and s the electrical conductivity (Table 1).The subscript l denotes the laminar part of the diffusion coefficientand t the turbulent part. q represents the net radiation loss per unitvolume and time. The viscous terms in the momentum and energyequations which are not included in the diffusion coefficient aretreated as their respective source terms. As mentioned above, wecan assume that the state of thermal plasma is LTE. Thus, thethermodynamics state is characterized by two thermodynamicvariables (temperature and pressure), which departs from ideal gaslaw although the equation of state for a constituent species isassumed to be ideal. Electrical and thermal conductivity andlaminar viscosity also are functions of pressure and temperature,which are tabulated by Frost and Liebermann [7]. Ohmic heatingsE2 is providing heat source and Lorentz force J � B is providing
Fig. 1. Schematic diagram of a PASB chamber and the instantaneous applied current unddifferent instants.
momentum source. In addition, the current density and themagnetic field are calculated from the electrostatic potential andAmpere’s law, respectively, and can be written as:
jr ¼ sv4
vrjz ¼ s
v4
vz(3)
1rv
vrðrBqÞ ¼ m0jz (4)
where Bq is the azimuthal magnetic field induced by the arc currentand m0 the arc permeability.
2.2. The arc model
The governing equations are supplemented by constituentequations such as equation of state, material properties, radiation,turbulence and surface ablation. A semi-empirical radiation trans-port model is used to calculate q with net emission coefficient byLiebermann and Lowke [8]. This model assumes a monotonic radialtemperature profile. The maximum temperature is Tm. In the arcregion, which is defined from the arc axis to a temperature of0.83Tm, q is a function of temperature, pressure, and arc radiuswhich is defined as the radial position of 4000 K isotherm. For theregion between the core edge and the 4000 K isotherm, we assume50% of the radiation flux at the core edge is absorbed. Theremaining 50% of the aforesaid radiation flux escapes from the arcand reaches the inner surface of the PTFE nozzle [6]. For the nozzleused in the investigation, the rate of ablation per unit length isdetermined by
_mPTFE ¼ Fð1� aÞQha
(5)
where Q is the total radiation flux per unit length, the empiricalfactor F is set to 0.9 and a is the reabsorption factor, 0.5. ha is theenergy required to break up the polymer PTFE chain and to raise thePTFE vapor from room temperature to 3400 K, which is equal to1.19 � 104 kJ/kg [3].
The high temperature arc also evaporates the metal electrode byheat conduction. For the modeling of this evaporation, we firstlyapproximate the cathode spot, where the arcing current is collectedin a circular area and the metallic vapor is produced. We assumethat the evaporation happens only at the cathode, FC as shown inFig. 1, due to the complex physical phenomena of arc rooting insidea hollow anode. The rate of evaporation of the Cu electrode happensto reach the melting temperature (z1356 K for copper) of thecathode surface and to produce the following [6]:
er investigation (a) Schematic diagram of a PASB chamber (b) Applied current and 6
J. Lee, J.-C. Lee / Vacuum 86 (2012) 1522e15271524
_mCu ¼ qv=hv (6)
where hv is the total energy required to heat up the electrodesurface to the melting temperature (¼135 kJ/kg) and to supply thelatent heat for phase change per a unit mass (¼5070 kJ/kg) of thecathode material. qv is the energy available for vaporization ofthe Cu electrode. We assume that the velocity at which the vapor isinjected depends on themass flow rate and the density and that thetemperature of the vapor is around 1356 K.
Besides the LTE assumption, local chemical equilibrium (LCE)can be used to simplify the calculation of the composition of themixture and the diffusion coefficients of the vapors. The composi-tion of the mixture is obtained by minimization of the Gibb’s freeenergy under the assumptions of LTE and LCE. The thermodynamicand transport properties are then calculated by using basic trans-port theory and are tabulated as functions of the temperature, thetotal pressure of the mixture, and the mass concentration of PTFEvapor [9]. The electrical conductivity of the mixture is used fromthe data of Chervy et al. [10] due to the much higher electricalconductivity of copper vapor.
2.3. The turbulence model
It is well known that most flows encountered in this kind of arcdischarges are turbulent. Especially, the turbulent effect driven bySF6 thermal plasmas happened inside the PASB chamber is moresignificant than that of other breaking principles due to the use ofPTFE ablation for pressure-rise during the high-current phase andthermal decay during the current-zero phase.
The Prandtl’s mixing lengthmodel (MLM) is also known as zero-equation model since the length and velocity scales are directlyrelated to the mean flow. For arcs burning in axisymmetric flowfields, the length scale is proportional to the local thermal radiuswhich characterizes the boundary of the high velocity core. Thevelocity scale is constructed from the local velocity gradient and thelength scale. The eddy viscosity can then be calculated by [3,6]
d ¼
ffiffiffiffiffiffiffiffiffiffiffiffiffiffiffiffiffiffiffiffiffiffiffiffiffiffiffiffiffiffiffiffiffiffiffiffiffiffiZR2k
0
�1� r
r2k
�2rdr
vuuut (7)
mt ¼ rðc1dÞ2����vwvr þ vv
vz
���� (8)
where c1 is a turbulent parameter whose value is set to 0.2 [11]. d isthe thermal radius of the arc defined in the radiation model above.
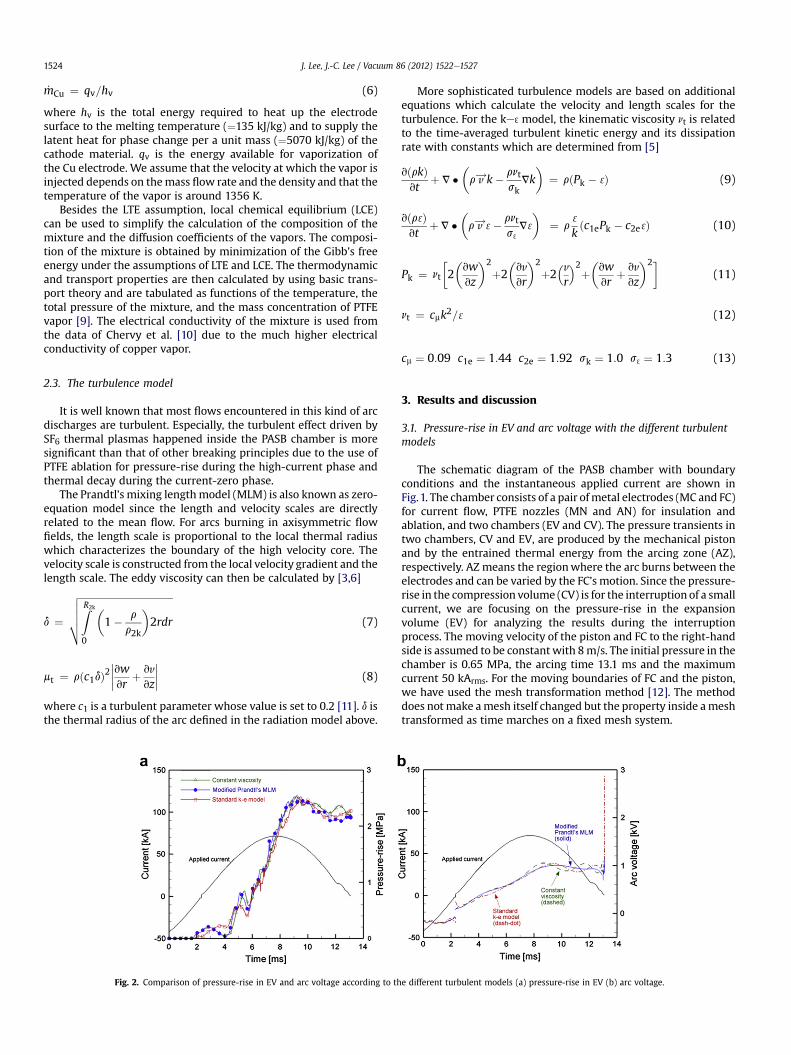
Fig. 2. Comparison of pressure-rise in EV and arc voltage according to th
More sophisticated turbulence models are based on additionalequations which calculate the velocity and length scales for theturbulence. For the ke 3model, the kinematic viscosity nt is relatedto the time-averaged turbulent kinetic energy and its dissipationrate with constants which are determined from [5]
vðrkÞvt
þ V ��r v!k� rnt
skVk
�¼ rðPk � 3Þ (9)
vðr 3Þvt
þ V ��r v! 3� rnt
s 3
V 3
�¼ r
3
kðc1ePk � c2e 3Þ (10)
Pk ¼ nt
�2�vwvz
�2
þ2�vv
vr
�2
þ2�vr
2þ�vwvr
þ vv
vz
�2�(11)
nt ¼ cmk2= 3 (12)
cm ¼ 0:09 c1e ¼ 1:44 c2e ¼ 1:92 sk ¼ 1:0 s 3¼ 1:3 (13)
3. Results and discussion
3.1. Pressure-rise in EV and arc voltage with the different turbulentmodels
The schematic diagram of the PASB chamber with boundaryconditions and the instantaneous applied current are shown inFig.1. The chamber consists of a pair ofmetal electrodes (MC and FC)for current flow, PTFE nozzles (MN and AN) for insulation andablation, and two chambers (EV and CV). The pressure transients intwo chambers, CV and EV, are produced by the mechanical pistonand by the entrained thermal energy from the arcing zone (AZ),respectively. AZ means the regionwhere the arc burns between theelectrodes and can be varied by the FC’s motion. Since the pressure-rise in the compression volume (CV) is for the interruption of a smallcurrent, we are focusing on the pressure-rise in the expansionvolume (EV) for analyzing the results during the interruptionprocess. The moving velocity of the piston and FC to the right-handside is assumed to be constant with 8m/s. The initial pressure in thechamber is 0.65 MPa, the arcing time 13.1 ms and the maximumcurrent 50 kArms. For the moving boundaries of FC and the piston,we have used the mesh transformation method [12]. The methoddoes notmake amesh itself changed but the property inside ameshtransformed as time marches on a fixed mesh system.
e different turbulent models (a) pressure-rise in EV (b) arc voltage.
J. Lee, J.-C. Lee / Vacuum 86 (2012) 1522e1527 1525
The pressure-rise in EV and the calculated arc voltage with thedifferent turbulentmodels are shown in Fig. 2. The characteristics ofpressure-rise in EV should play an important role in quenching thefault arcs of SF6 interrupters because the blowing-off force forcooling down the arcs can be generated by this pressure-rise.Moreover, since it is caused only by the PTFE ablation during thehigh-current phase for the PASB mechanism, the investigation ofthe pressure-rise in EV is critical for designing this kind of chambers.As shown in Fig. 2(a), the pressure-rise in EV is increased byheat andmass transfer of the ablated vapor from PTFE nozzles until the timeis around 9.5ms. As it will explain below, the pressure-release in EVhappenswhen the FC’s position clears theflat section ofMN, and thereverse flow from EV to AZ starts for cooling down the arcs betweenthe electrodes. For the different turbulent models, the pressure-risein EV is similar during the whole arcing history except near currentzero. The deviation between the different turbulent models isshown at two periods; one is when the current passes throughthe first current zero and the other starts over the maximum pointof the pressure-rise, which is when the time is about 10 ms. It isbecause the effect of turbulence causes the instabilities of arcsbetween the electrodes when the entrained flow heats up theresidual gas through EV and the reverse flow cools down theresidual arcs between the electrodes. As shown in Fig. 2(b), the arc
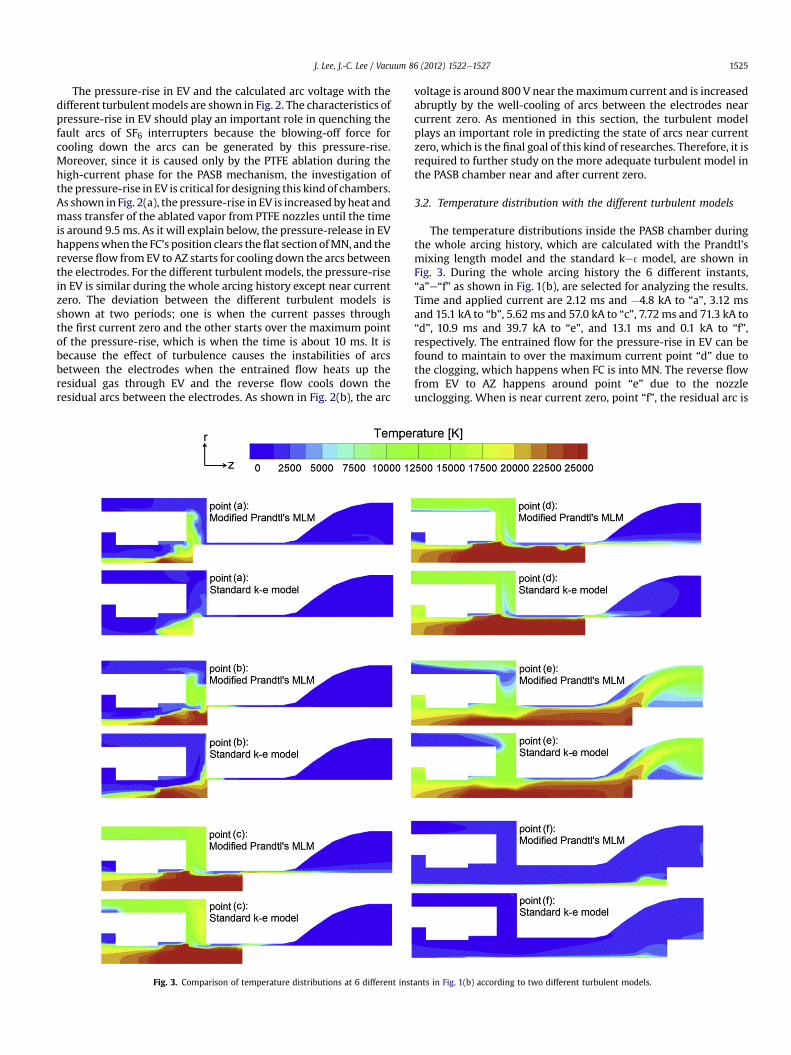
Fig. 3. Comparison of temperature distributions at 6 different inst
voltage is around 800 V near themaximum current and is increasedabruptly by the well-cooling of arcs between the electrodes nearcurrent zero. As mentioned in this section, the turbulent modelplays an important role in predicting the state of arcs near currentzero, which is the final goal of this kind of researches. Therefore, it isrequired to further study on the more adequate turbulent model inthe PASB chamber near and after current zero.
3.2. Temperature distribution with the different turbulent models
The temperature distributions inside the PASB chamber duringthe whole arcing history, which are calculated with the Prandtl’smixing length model and the standard ke 3model, are shown inFig. 3. During the whole arcing history the 6 different instants,“a”e“f” as shown in Fig. 1(b), are selected for analyzing the results.Time and applied current are 2.12 ms and �4.8 kA to “a”, 3.12 msand 15.1 kA to “b”, 5.62 ms and 57.0 kA to “c”, 7.72 ms and 71.3 kA to“d”, 10.9 ms and 39.7 kA to “e”, and 13.1 ms and 0.1 kA to “f”,respectively. The entrained flow for the pressure-rise in EV can befound to maintain to over the maximum current point “d” due tothe clogging, which happens when FC is into MN. The reverse flowfrom EV to AZ happens around point “e” due to the nozzleunclogging. When is near current zero, point “f”, the residual arc is
ants in Fig. 1(b) according to two different turbulent models.
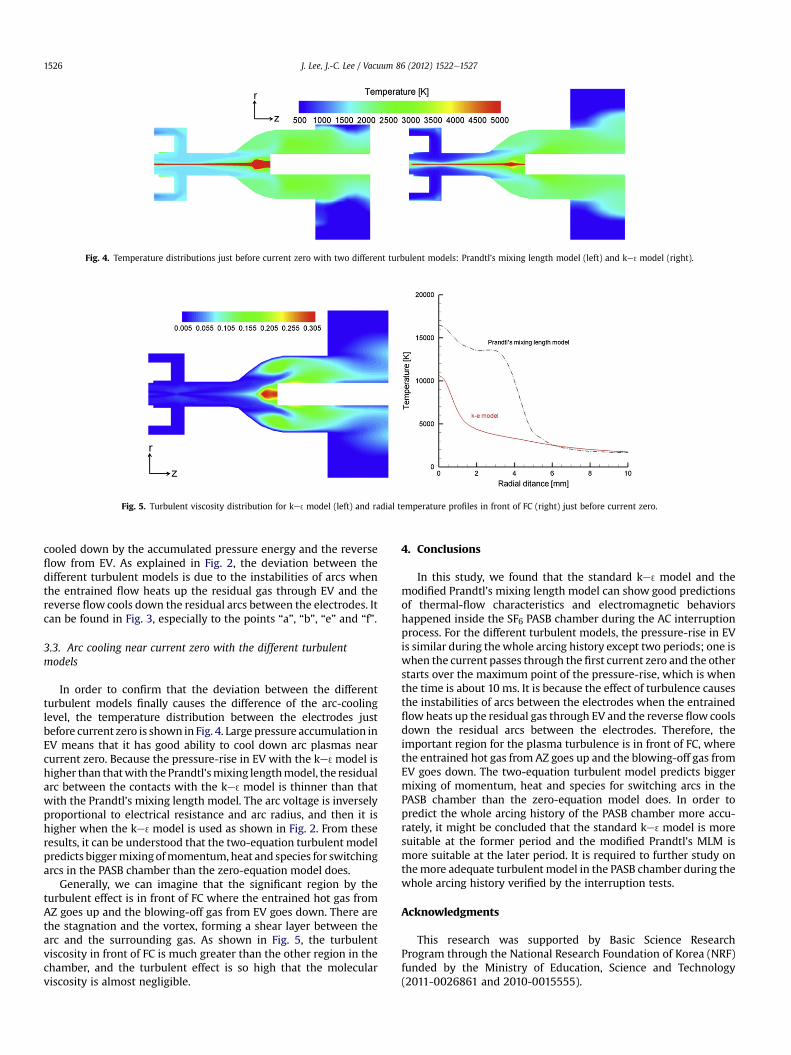
Fig. 4. Temperature distributions just before current zero with two different turbulent models: Prandtl’s mixing length model (left) and ke 3model (right).
Fig. 5. Turbulent viscosity distribution for ke 3model (left) and radial temperature profiles in front of FC (right) just before current zero.
J. Lee, J.-C. Lee / Vacuum 86 (2012) 1522e15271526
cooled down by the accumulated pressure energy and the reverseflow from EV. As explained in Fig. 2, the deviation between thedifferent turbulent models is due to the instabilities of arcs whenthe entrained flow heats up the residual gas through EV and thereverse flow cools down the residual arcs between the electrodes. Itcan be found in Fig. 3, especially to the points “a”, “b”, “e” and “f”.
3.3. Arc cooling near current zero with the different turbulentmodels
In order to confirm that the deviation between the differentturbulent models finally causes the difference of the arc-coolinglevel, the temperature distribution between the electrodes justbefore current zero is shown in Fig. 4. Large pressure accumulation inEV means that it has good ability to cool down arc plasmas nearcurrent zero. Because the pressure-rise in EV with the ke 3model ishigher than thatwith the Prandtl’smixing lengthmodel, the residualarc between the contacts with the ke 3model is thinner than thatwith the Prandtl’s mixing length model. The arc voltage is inverselyproportional to electrical resistance and arc radius, and then it ishigher when the ke 3model is used as shown in Fig. 2. From theseresults, it can be understood that the two-equation turbulent modelpredicts biggermixingofmomentum, heat and species for switchingarcs in the PASB chamber than the zero-equation model does.
Generally, we can imagine that the significant region by theturbulent effect is in front of FC where the entrained hot gas fromAZ goes up and the blowing-off gas from EV goes down. There arethe stagnation and the vortex, forming a shear layer between thearc and the surrounding gas. As shown in Fig. 5, the turbulentviscosity in front of FC is much greater than the other region in thechamber, and the turbulent effect is so high that the molecularviscosity is almost negligible.
4. Conclusions
In this study, we found that the standard ke 3model and themodified Prandtl’s mixing length model can show good predictionsof thermal-flow characteristics and electromagnetic behaviorshappened inside the SF6 PASB chamber during the AC interruptionprocess. For the different turbulent models, the pressure-rise in EVis similar during thewhole arcing history except two periods; one iswhen the current passes through the first current zero and the otherstarts over the maximum point of the pressure-rise, which is whenthe time is about 10 ms. It is because the effect of turbulence causesthe instabilities of arcs between the electrodes when the entrainedflow heats up the residual gas through EV and the reverse flow coolsdown the residual arcs between the electrodes. Therefore, theimportant region for the plasma turbulence is in front of FC, wherethe entrained hot gas from AZ goes up and the blowing-off gas fromEV goes down. The two-equation turbulent model predicts biggermixing of momentum, heat and species for switching arcs in thePASB chamber than the zero-equation model does. In order topredict the whole arcing history of the PASB chamber more accu-rately, it might be concluded that the standard ke 3model is moresuitable at the former period and the modified Prandtl’s MLM ismore suitable at the later period. It is required to further study onthemore adequate turbulent model in the PASB chamber during thewhole arcing history verified by the interruption tests.
Acknowledgments
This research was supported by Basic Science ResearchProgram through the National Research Foundation of Korea (NRF)funded by the Ministry of Education, Science and Technology(2011-0026861 and 2010-0015555).

J. Lee, J.-C. Lee / Vacuum 86 (2012) 1522e1527 1527
References
[1] Luders C, Suwanasri T, Dommerque R. Investigation of an SF6-selfblast circuitbreaker. J Phys D Appl Phys 2006;39:666e72.
[2] Schavemaker PH. Digital testing of high-voltage SF6 circuit breakers. Disser-tation Of TU Delft; 2002.
[3] Zhang JL, Yan JD, Murphy AB, Hall W, Fang MTC. Computational investigationof arc behavior in an auto-expansion circuit breaker contaminated by ablatednozzle vapor. IEEE Trans OnPlasma Sci 2002;30(No. 2):706e19.
[4] Urai H, Ooshita Y, Koizumi1 M, Yaginuma N, Tsukushi M and Smeets RPP.Estimation of 80 kA short-line fault interrupting capability in an SF6 gascircuit breaker based on arc model calculation. In: Proceedings of the 17thInternational Conference on Gas Discharges and Their Applications; 2008. pp.129e132.
[5] Yan JD, Nuttall KI, Fang MTC. A comparative study of turbulence models forSF6 arcs in a supersonic nozzle. J Phys D Appl Phys 1999;32:1401e6.
[6] Kim YJ, Lee JC. SF6 arc plasma simulation and breakdown performanceprediction using computational fluid dynamics and arc modeling. Thin SolidFilms, in press.
[7] Frost LS, Liebermann RW. Composition and transport properties of SF6 andtheir use in a simplified enthalpy flow arc model. Proc IEEE 1971;59:474e85.
[8] Liebermann RW, Lowke JJ. Radiation emission coefficients for Sulfur Hexa-fluoride arc plasmas. J Quant Spectrosc Radiat Transfer 1975;16:253e64.
[9] Murphy AB. A comparison of treatments of diffusion in thermal plasma. J PhysD Appl Phys 1996;29(No. 7):1922e32.
[10] Chervy B, Riad H, Gleizes A. Calculation of the interruption capability ofSF6eCF4 and SF6eC2F6 mixtures- part I: plasma properties. IEEE Trans PlasmaSci 1996;24:198e217.
[11] Zhang JL, Yan JD, Fang MTC. Investigation of the effects of pressure ratios onarc behavior in a supersonic nozzle. IEEE Trans Plasma Sci 2000;28:1725e34.
[12] Lee JC, Kim YJ. Numerical modeling of SF6 thermal plasma generated duringthe switching process. Thin Solid Films 2005;475:72e80.