tudy of advanced fuel ystem concepts for co mercial
TRANSCRIPT
NASA Contractor Report 174752
{_AbA-CS-17_752} -_i(313YO_ _£VA_C_D FU_L N85-19176SYSTEM COBCEPTS _C_ CCMM#BCII[ _I_C_AFT ANi3
B_GINaS _ir._l Pe[o_z (icckh£ed-Cali_o_nia
Co., _ur_ank.) 142 p _tC i67/_ .%91 CSCL 21b Ui,cla._G3/28 15_ %_.
_tudy of Advanced FuelSystem Concepts for CommercialAircraft and Engines
E. F. Versaw, G. D. Brewer,W. D. Byers, H. W. Fogg,D. E. Hanks, J. Chirivella "" '
Lockheed-California CompanyBurbank, California
i
NA_IIIli"/I ....Jmm'# 19eS
_, t_ 44136
, i#lil "li,_ _- .., -" I.
1985010866
NASA Contractor Report 17_.752
Study of Advanced Fuel._ System Concepts for Commercial. Aircraft and Engines
E. F. Versaw, G. D. Brewer,W. D. Byers, H. W. Fogg,D. E. Hanks, J. Chirivella
-°
Lockheed-California CompanyBurbank, California
Co,:tract NAS3-23271
• Jamuu'y 1983
N_,tJonaJ Aeronautics andSr',,_ce Administration
Lewir, Research CenterC:eveland, OH 44135
®I,
i
1985010866-002
FOREWORD
This is the final report of a study made under Contract NAS3-23271 for NASA-Lewis
Research Center, Cleveland, Ohio. Mr. Steve Cohen at Lewis Research Center was
Project Manager for the study. The report presents results of work performed during
the 13-month period, from December 1981 through December 1982.
The Lockheed-California Company was the prime contractor to NASA and the study
was managed by G. Daniel Brewer in the Commercial Advanced Design Division at
Burbank, California. A portion of t.,e work was subcontracted to Ergo-Tech, Inc.,
Dr, Jose Chirivella, President.
Lockheed wishes to acknowledge the technical advice of Exxon Research and
Engineering Company and Union O1i of California as well as contributions in the form
of illustrative material by Rolls-Royce, Limited_
The following individuals were principal contributors to tPis work:
Lockheed-Callfornia Comp@}lyMr. E. F. Versaw - Project Engineer
Mr. W. D. Byers - Fuel System Analysis
Mr. D. E. Hanks - Thermodynamics
Mr. H. W. Fogg - Airplane Performance Analysis
Ergo-Tech, Inc.
Dr. Jose Chirivella - Fuel property definition, analysis of systems J
to accommodate low thermal stab111ty fuels, and
general consulting.
{ . F.:,"_;'; ,,_A,NK N'OT FiEMFI)
F
] 9850 ] 0866-003

TABLE OF CONTENTS
Section
: FOREWORD ........................... iiiLIST OF FIGURES ......................... vii
LIST OF TABLES ......................... x
SUMMARY ............................. I
SYMBOLS AND ABBREVIATIONS .................... 3
i iNTRODUCTION .......................... 8
2 TECHNICAL APPROACH ....................... 9
2.1 Guidelines and Requirements .................
. 2.2 Overall Approach ....................... i0
3 BASELINE AIRCRAFT ........................ 13
3.1 Aircraft Description ..................... 13
3.1.1 Aircraft Fuel System ................... 13
3.1.2 Engine Fuel System .................... 18
3.2 Flight and Temperature Profile Descriptions ......... 21
3.2.1 Payloao/Range Requirements ................ 21
3.2.2 Flight Profile ...................... 22
3.2.3 Temperature - Altitude Profiles .............. 24
3.3 Baseline Aircraft Performance ................ 25
3.3.1 9260 km (5000 n.mi.) Mission ............... 26
3.3.2 3704 km (2000 n.mi.) Mission ............... 26
3.3.3 926 km (500 n.mi.) Mission ............... 28
4 FUEL PROPERTIES ......................... 32
4.1 ASTM Speclfications ..................... 32
4.2 Candidate Fuel Property Changes .............. 32
4.2.1 Freeze Point ....................... 35
4.2.2 Thermal Stability ..................... 35
4.2.3 Aromatics ......................... 39
4.2.4 Viscosity ......................... 39
4.2.5 Lubricity ......................... 40
4.2.6 Water Seperation ..................... 40
i 4.2.7 Electrical Conductivity .................. 41
4.2.8 Flash Point and Vapor Pressure .............. 41
4.3 Summary of Fuei Properties Selected for Fuel System
Analysis .......................... 42
5 ANALYSIS OF IMPACT OF PROPERTY CHANGES ON
BASELINE AIRCRAFT ....................... 43
5.1 Freeze Point ......................... 43
5.1.1 Fuel Tank Thermal Model .................. 43
5.1.2 Fuel Tank Predicted Temperatures ............. 53
5.1.3 Effects on Baseline Aircraft Performance ......... 57
5.2 Thermal Stability ...................... 61
5.2.1 Tank Outlet Fuel Temperature ............... 62
5.2.2 Engine Fuel Environment .................. 62
_r
1985010866-004

Section
5.2.3 Effect on Fuel System Components ............. 72
5.2.4 Effect on Baseline Aircraft Performance .......... 76
5.3 Aromatic Content ...................... 77
5.4 Viscosity .......................... 78
5.4.1 Effect on Fuel System Components ............. 805._.2 Effect on Baseline Aircraft Performance ......... 83
5.5 Lubrlcity ......................... 83
5.5.1 Effect on Fuel System Components ............. 845.5.2 Effect on Baseline Aircraft Performance .......... 84
5.o Other Fuel Properties ................... 85
5.6.1 Water Separation ..................... 85
5.6.2 Electrical Conductivity ................. 85
5.5.3 Flash Point and Vapor Pressure .............. 85
6 CONCEPTUAL DESIGNS ....................... 87
6.1 Freeze Point ......................... 87
6.1.1 Description of Candidate Systems ............ 87
6.1.2 Evaluation of High Freeze Point Concepts ......... 95
6.2 Thermal Stability ...................... I01
6.2.1 Descrlptlon of Candidate Systems ............. I01
6.2.2 Evaluation of Candidate Systems ............. 108
6.2.3 Recommended System for Low Thermal Stability ....... iii
6.3 Other Property Changes .................... 114
7 CANDIDATE ADVANCED FUEL SYSTEM CONCEPTS ............. 115
7.1 Candidate Descriptions .................... 1157.2 Performance Evaluation .................... 115
7.2.1 All Engines Operating ................... 115
7.2.2 Englne Out Operation ................... 117
7.2.3 Maximum Payload for 9260 km (5000 n.mi.) Range ...... 118
7.2.4 Comparison of Direct Operating Costs ........... 118
7,2.5 Support Systems, Maintenance, Safety ........... 121
7.3 Summary Comparison and Conclusions .............. 121
8 RECOMMENDATIONS ......................... 123
APPENDIX ............................ 124
REFERENCES ........................... 130
>
vi
1g85010866-005

LIST OF FIGURES
1 Aavanced Fuel System Concepts Technical Approach ......... ii
2 L-IOII-500 Baseline Alreraft General Arrangement ......... 14
3 Baseline Aircraft Fuel System .................. 16
4 Baseline Engine Fuel System Schematic .............. 18
5 Fuel Spray Connections and Manlfclding .............. 206 Burner and Fuel Distribution Valve Positions ........... 21
7 Baseliue Aircraft Payload/Range - Hot Day (ISA + 34°C) ..... 22
8 Altltude/Temperature Profiles ................. 24
9 Cold Day Flight Profile, 9260 km (5000 n.mi.) Mission ...... 26
iO Flight Profile=, 9260 km (5000 n.mi.) Mission ......... 27
ii Ambient Temperature Profile, 9260 km (5000 n.mi.) Mission .... 27
12 Cold Day Fuel Quantity, 9260 km (5000 n.ml.) Mission ...... 28
13 Flight Profiles, 3704 km (2000 n.mi.) Mission ......... 29
14 Ambient Temperature Profiles, 3704 km (2000 n.mi.) Mission .... 29
15 Cold Day Fuel Quantity, 3704 km (2000 n.ml.) Mission ..... 30
16 Flight Profiles, 926 km (500 n.mi.) Mission ........... 30
17 Ambient Temperature Profiles, 926 km (500 n.ml.) Mission ..... 31
I_ Cold Day Fuel Quantity, 926 km (500 n.ml.) Mission ........ 31
19 General Thermal Analyzer R-C Network for Fuel
Tank Louer Boundary .................... 45
2U Slmplifiod Schematic of Wing Fuel Tank LowerSurface Model ........................ 45
21 Simplified Schematic of Wing Fuel Tank Lower SurfaceWith Insulation ........................ 46
22 Bulk Fuel and Lower Surface Unadjusted TemperatureCorrelations - Full Tank ................... 49
23 Bulk Fuel and Lower Surface Unadjusted Temperature
Correlations - Emptying Tank .................. 49
24 Tank-i Bulk Fuel and Lower Surface Corrected Temperature
Correlations - Full Tank, Flight T-1686 ............ 51
25 Tank-i Bulk Fuel and Lower Surface Corrected Temperature
Correlations - Emptying Tank, Flight T-1640 .......... 51
26 Tank-i Bulk Fuel and Lower Surface Corrected Temperature
Correlations - Emptying Tank, Flight T-1676 .......... 52
27 Tank-2 Inboard Bulk Fuel and Tower Surface Corrected Temperature
Correlations - 90% Full, Flight T-1653 ............. 52
28 Tank-2 Inboard Bulk Fuel and Lower Surface Corrected Temp(.rature
Correlations - 90% full, Flight T-1676 ............. 53
29 Tank-i Bulk Fuel and Lower Surface Predicted Temperature -
9260 km (5000 n.ml.) Cold Day M_ssion ............. 54
30 Tank-2 Inboard Bulk Fuel and Lower Surface Predicted
Temperature - 9260 km (5000 n.mi.) Cold Day Mission ...... 5431 Tank-2 Outboard Bull Fuel and Lower Surface Predicted
Temperature - 9260 km (5000 n.mi.) Cold Day Mission ...... 55
32 Tank-2 Outboard Lower Surface Predicted Temperature -
926, 3704 and 9260 km (500, 2000, and 5000 n.ml.)
Cold Day Missions 56eeelmeleewJaeooe,amaloo
3_ Tank-2 Outboard Lower Surface Predicted Temperature -
+ 15.6 and - 17.0°C initial Fuel Temperature .......... 56
vii
1985010866-006

34 -20°C Adiabatic Wall Temperature Profiles ............ 59
35 Coklng Rateq Vs. W_II Temperature for Jet A and
Home Heating Fuels ....................... 62
36 Total Heat Input to Engine Oil as a Function of
HP Rotor Speed ........................ 66
37 Fuel Cooled Oil Cooling System Schematic Diagram
and Operation ......................... 67
38 Location of Engine Side Fuel System Components .......... 69
39 Simplex Burner System Bellmouth Burner Feed Arm
With Multlpoint Fuel Injection ................. 70
40 Combustion Chamber Head and Simplex Burner System ........ 71
41 Fuel System Temperature Profiles in Key Sections of
Fan Case Fuel System Components for the Hot Day (Ambient
Temper_ture=54°C) Limiting Flight ............... 73
42 Measured Core Temperature Distribution for Heat
Rejection Rates from an Installed Engine for an
ISA + 39°C Hot Day at a Mach No. of 0.3,Sea Level and Maximum RPM ................... 75
43 Commercial Aviation Jet Fuel Viscosity .............. 81
44 Effect of Viscosity on Component Performance ........... 82
45 Fuel lank Electric Foll Heaters W/O Insulation
(For All Tanks) ........................ 89
46 Predicted Fuel Tank Electrical Heating Power Requirements -
9260 km (5000 n,ml.) Cold Day Mission ............. 90
47 Predicted Fuel Tank Electric Heating Requirements for VariousFreeze Point Fuels 90 ',e,,,o,oo,eooe_eeJeeo,e
48 Fuel Tank Electric Foll Heaters With Insulation _(For All Tanks) ....................... 92
49 Fuel Tank Electric Foll Heaters With In_ulatlon
(For Tank 2-Outboard) ..................... 93
50 APU Fuel System Heating ................... 94
51 Engine Fuel System Heating ................... 95
52 9260 km (5000 n.mi.) Mission Profile With
Loss of Engine in Mid-Cruise - Cold Day ............ 98
53 Rejection of Oil Heat to Fuel Tank ................ 103
54 Rejection of Excess Oil Heat to the Atmosphere .......... 103
55 Reduction of Fuel Heating Using Pump Speed Control ........ 105
56 Reduction of Fuel Heating Using Variable
Displacement LP/HP Pumps ................... 106
57 Heat Shield for Lines and Components Located in Hot Section
Region ............................. 108
58 Improved Heat Shield Thermal Design for Injectors ........ 109 _
59 Evaluation of Candidate Systems ................. ii0
60 Recommended System for Low Thermal Stability Fuel ........ 112
61 Impact of Fuel Cost on DOC .................... 120
62 Effect of nEW on Block Fuel and TOGW - Cold Day ......... 125
63 Effect of OEW on Block Fuel and TOGW - Standard Day ....... 126
64 Effect of OEW on Block Fuel and TOGW - Hot Day .......... 127
65 Effect of Percent Change in SFC on Block Fuel TOGW -
Cold Day 128eoeQoeoomvololeeeo_loeeoeoee
viii
®
1985010866-007

L
\
66 Effect of Percent Change in SFC on Block Fuel TOGW -
Standard Day .......................... 128
67 Effect of Percent Change in SFC on Block Fuel TOGW -
Hot Day ........................... 129
J
L
'a'
J
I
ix
1985010866-008

LIST OF TABLES
Tabl____e Pa_
i Baseline Aircraft Design Summary ................ 15
2 Detailed Requirements of Aviation Turbine Fuels
D 1655-81 Specifications ................... 33
3 Proposed Specifications for Experimental Referee Broad-Specification (ERBS) Aviation Turbine FuEl .......... 36
4 Fuel Properties Selected for Fuel Systems Amalysis ....... 42
5 Impact of High Freeze Point Fuel on Performance ofBaseline Aircraft ....................... 60
6 Aircraft and Engine Parameters Profiles for the Short
Range 926 km (500 n.mi.) Flight, Hot Day(54°C Ground Temperature) 63,,moooeoo,eloalei*
7 Fuel Tank Outlet Temperature Histories ............. 648 Engine Compressor Discharge Temperature and Fuel Flow Rates . ° . 76
9 Solubility Parameters of Typical Hydrocarbons from Fuel ..... 78i0 Swelling of Natural Rubber in Various Solvents ......... 79II Aft Engine Fuel Inlet Pres_dre ................. B4
12 Weights and Electrical Power Requirements for
Engine Fuel System Heating .................. 96
13 Impact of Fuel System Heating on _ircraft Performance,All Engine Operating - Cold Day - 9260 km ........... 97
14 Increase Fuel Consumption Due to Power Extraction
with Engine Out ........................ 9915 Cost Premise ......................... i00
16 Effect on DOC of Fuel Heating Systems .............. i0117 Fuel Bypass System Weight _enalty ................ 102
18 Air/Oil - Fuel/Air Heat Exchanger System Weight Penalty ..... 104
19 Aircraft Weight Penalty for a Variable Speed Fuel PumpSystem ............................ 105
20 Aircraft Weight Penalty for a Variable Displacement FuelPump System .......................... 107
21 Fuel System Heat Protection Weight Penalty .......... 108
22 Weight Evaluation of Recommended System for Fuel Cooling .... 112
23 Weight Penalties Due to Recommended System for
Fuel Cooling ......................... 11324 DOC Increase Due to Recommended System for Low
Thermal Stability Fuel .................... Ii_
25 Candidate Fuel Systems Concept Descriptions ........... 116
26 Comparison of Candidates to Baseline Airplane, All EnginesOperating - Cold Day - 9260 Kilometers ........... 117
27 Increase in Fuel Consumption for One EngineOut Operation ......................... 118
28 Comparison of Candidate Systems at Maximum Payload -Hot Day - 9260 Kilometers .............. 118
29 Increa,einDi e=tOperatlngCost(T o ,anAo;1982 Dollars) ......................... 119
1985010866-009
STUDY OF ADVANCED FUEL SYSTEM CONCEPTS FOR
COMMERCIAL AIRCRAFT AND ENGINES
E. F. Versaw, G. D. Brewer, W. D. Byers,
H. W. Fogg, D. E. Hanks, J. Chirivella
Lockheed-Ca]ifornla Company
Burbank, California 91520
SUMMARY
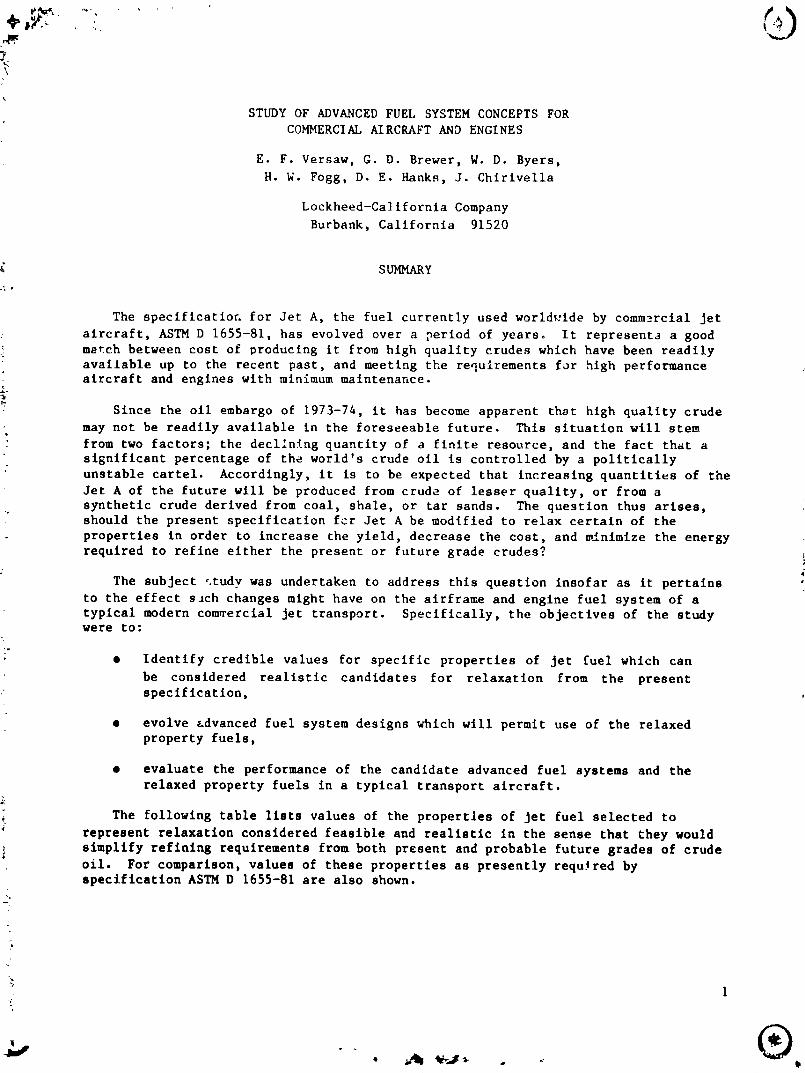
The specificatio_ for Jet A, the fuel currently used world,wide by commercial Jet
aircraft, ASTM D 1655-81, has evolved over a period of years. It represents a good
mstch between cost of producing it from high quality crudes which have been readilyavailable up to the recent past, and meeting the requirements for high performanceaircraft and engines with minimum maintenance.
20
Since the oll embargo of 1973-74, it has become apparent that high quality crude
may not be readily available in the foreseeable future. This situation will stem
from two factors; the decllning quantity of a finite resource, and the fact that asignificant percentage of the world's crude oll is controlled by a politically
unstable cartel. Accordingly, it is to be expected that increasing quantities of the
Jet A of the future will be produced from crude of lesser quality, or from asynthetic crude derived from coal, shale, or tar sands. The question thus arises,should the present specification for Jet A be modified to relax certain of the
properties in order to increase the yield, decrease the cost, and _knlmlze the energyrequired to refine either the present or future grade crudes? i
The subject .,tudywas undertaken to address this question insofar as it pertains
to the effect s_ch changes might have on the airframe and engine fuel system of a
typical modern commercial Jet transport. Specifically, the objectives of the studywere to:
i"
• Identify credible values for specific properties of Jet fuel which can
be considered realistic candidates for relaxation from the presentspecification,
$ evolve advanced fuel system designs which will permit use of the relaxedproperty fuels,
• evaluate the performance of the candidate advanced fuel systems and therelaxed property fuels in a typical transport aircraft.
The following table lists values of the propertles of Jet fuel selected to
represent relaxation considered feasible and realistic in the sense that they would
i simplify refining requirements from both present and probable future grades of crudeo£I. For comparison, values of these properties as presently required byspecification ASTM D 1655-81 are also shown.
>
1
1985010866-010
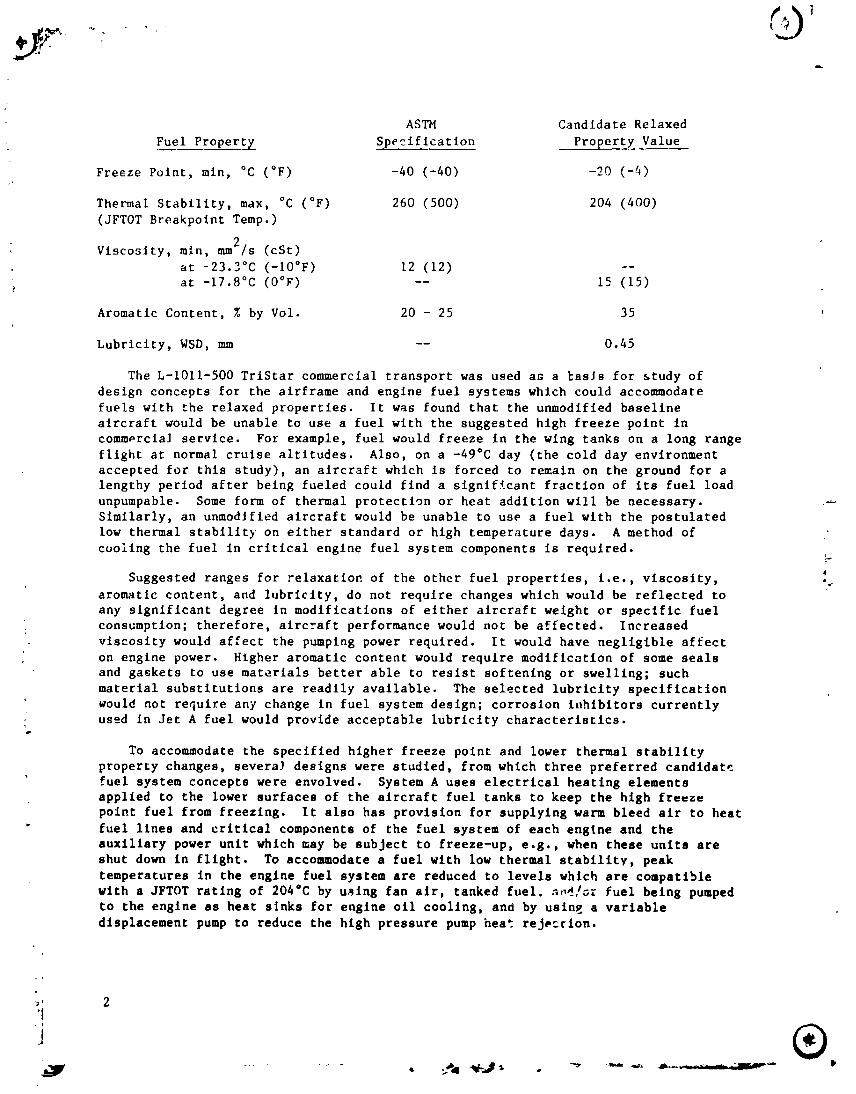
ASTM Candidate Relaxed
Fu_el Property Specification Property Value
Freeze Point, min, °C (°F) -40 (-40) -20 (-4)
Thermal Stability, max, °C (°F) 260 (500) 204 (400)
(JFTOT Breakpoint Temp.)
Viscosity, min, mm2/s (cSt)
at -23.3°C (-lO°F) 12 (12) --
at -17.8°C (O°F) -- 15 (15)
Aromatic Content, % by Vol. 20 - 25 35 ,
Lubricity, WSD, mm -- 0.45
The L-1011-500 TriStar commercial transport was used as a basis for study of
design concepts for the airframe and engine fuel systems which could accommodate
fuels with the relaxed properties. It was found that the unmodified baseline
aircraft would be unable to use a fuel with the suggested high freeze point in
commprcla] service. For example, fuel would freeze in the wing tanks on a long range
flight at normal cruise altitudes. Also, on a -49°C day (the cold day environment
accepted for this study), an aircraft which is forced to remain on the ground for a
lengthy period after being fueled could find a significant fraction of its fuel load
unpumpable. Some form of thermal protection or heat addition will be necessary. ._
Similarly, an unmodified aircraft would be unable to use a fuel with the postulated
low thermal stability on either standard or high temperature days. A method of
cooling the fuel in critical engine fuel system components is required.r
Suggested ranges for relaxation of the other fuel properties, i.e , viscosity,
aromatic content, and lubricity, do not require changes which would be reflected to
any significant degree in modifications of either aircraft weight or specific fuel
: consumption; therefore, aircraft performance would not be affected• Increased
viscosity would affect the pumping power required. It would have negligible affect
on engine power. Higher aromatic content would require modification of some seals
and gaskets to use materials better able to resist softening or swelling; such
material substitutions are readily available. The selected lubricity specification
' _ould not require any change in fuel system design; corrosion inhlbitors currently
used In Jet A fuel would provide acceptable lubriclty characteristics.
To accommodate the specified higher freeze point and lower thermal stability
property changes, severa_ designs were studied, from which three preferred candidate
fuel system concepts were envolved. System A uses electrical heating elements
applied to the lower surfaces of the aircraft fuel tanks to keep the high freeze
point fuel from freezing. It also has provision for supplying warm bleed air to heat
" fuel lines and critical components of the fuel system of each engine and the
auxiliary power unit which may be subject to freeze-up, e.g., when these units are
shut down in flight. To accommodate a fuel with low thermal stability, peak
temperatures in the engine fuel system are reduced to levels which are compatible
with a JFTOT rating of 204°C by u_Ing fan air, tanked fuel. a,,d,lor fuel being pumped
to the engine as heat sinks for engine oil cooling, and by usin_ a variable
displacement pump to reduce the high pressure pump heat reJ_=rlon.
7, 2
"I
q9850 q08GG-Oqq
4 Candidate Systems B and C incorporate all of these features from System A and, in
addition, make use of insulation in various areas of the fuel tanks to decrease heat
loss and minimize the requirement for adding heat to prevent fuel freeze-up. System
B has 3.175 mm (0.125 in) thick insulation on the lower surfaces, including
stringers, in all wing tanks. System C has the same type Ins_latlon on the uppersurfaces of the outboard tanks, in addition to the lower surfaces of all tanks. In
both systems, 'he he_ting elements are applied on the fuel side of the insulation
layer on the bottom of the tanks. No heating elements are used over the insulationon the upper outboard tank surfaces in System C. The insulation suggested is
polysulflde filled to 50 percent by volume with hollow borosillcate glass spheres
which average approximately 80 microns diameter.
For fuel costs near present values, i.e., approximately $1.O0/gal., System A was
found to provide the lowest direct operating cost. However, with o_ly a 27 percent
increase In fuel cost, System B achieves parity in DOC and thereafter, as fuel costscontinue to increase, System B would show increasing cost advantage. System B is
therefore recommended as the most attractive fuel system candidate for the long term
if changes such as those herein postulated are made to the Jet fuel Jpeclflcatlon.
It is emphasized that there are no current plans in the industry to implement
_- changes in _he fuel specification, This preliminary study was conducted to explore
potential technology requirements and performance trade-offs in the _vent futureconsiderations indicate such relaxation is necessary. Much more work is needed, both
experimental and analytical, before firm conclusions can be reached and finalrcco-__endations made.
SYMBOLS AND ABBREVIATIONS
4
A ampere
. a, abs absolute
A/C, Ac aircraft
acc accelerate
ADV advancedI
' API American Petroleum Institute
APU auxiliary power unit
ASTM American Society for Testing and Materials
BOOM Ball-On-Cylinder Machine
Btu British thermal unitp
C cenLi
C specific heat
"C Celsius
CAL caloriep _
,_ C_C Coordinating Research Councll
ca, caT, cSt centlstokesn
3
-!
1985010866-012
SYMBOLS AND ABBREVIATIONS
D diameter
dc direct current
decc decelerate
deg degree
DOC direct operating cost
E actlvatlon energy
e.g. for example
eng. engine
ERBS Experimental Referee Broad-Speclflcatlon
°F Fahcenheit
FAA Federal Aviation Administration
FCOC fuel-cooled oil cooler
fpm feet per minute
FSED full scale engineering development
ft feet
g gram or gauge
gat gallon (U.S.)
GCIdS gas chromatography - mass spectrometry
, gen. generator
h hour or film heat transfer coefficient
HE high energy
Hg mercury
HP high pressure or horsepowerP
hr hour
i.e. that is
in. inch
IP intermediate pressure
ISA international standazd atmosphere
J Joule
Jet A, A-l, B Designation for Commercial Aviation Jet Fuel_
JFTOT Jet Fuel Thermal Oxidation Tes.er
JF-4 Designation for a Military Aviation Jet Fuel
4,o
1985010866-013
SYMBOLS AND ABBREVIATIONS
K kelvin
k kilo or thermal conductivity
KCAS knots calibrated airspeed
kt knot
kVA kilo volt-amperes
L, ] liter, length
Ib pound
ibm pound m_ss
LP low pressurel
M Mach number or mega
m meter or milli
max maximum
mln minute or minimum
mol mole
N Newton
NASA National Aeronautics and Space Administration
n.ml. nautical mlle
NMR nuclear magnetic r,_onance
No. number
Nu Nu&selt number
OEW operating empty weight
P pressure
p plco
Pa pascal
Pr Prandtl number
psi pounds per square inch
Qobs percent swell of a polymeric elastomer in a solvent
R-C reslstor-capacitor
Ref. reference
RFP Request for Proposal
Rn Reynolds number
rpm revolutions per minute
5
g -
1985010866-014

SYMBOLS AND ABBREVIATIONS
S Sieman
s second
sec second
k SFC specific fuel consumption
SL, S.L. sea level
SmCo Samarium CcbaJt
SMD Sauter mean diameter
sp gr specific gravity
Std standard
sys, syst system
SW switch
T temperature
TDR tube deposit rating
temp temperature
TOGW takeoff gross weight
U.S. United States
V velocity or volt i
visc viscosity
Vol, vol volume
vs. versusI"
W weight, weight flow rate or watt
W/O without
WSD Wear Scar Diameter
" wt weight
_r year
6
1985010866-015

SYMBOLS AND ABBREVIATIONS
SUBSCRIPTS
Related To Fluid Flow
aw adiabatic wall
f fuel
H hydraulic
o stagnation
p pressure
Related to Solubillt 7
o solvent
p polymer
GREEK SYMBOLS i
A difference (used as a prefix)
6 ratio of static pressure to sea level _tatlc pressure
or solubility parameter
micro or absolute viscosity
v kinematic viscosity
_, P density
o surface tension
ohm
9.......................
1985010866-016

I. INTRODUCTION
This is the fln=] report describing a study conducted by the Lockheed-California
Company for the NASA-Lewis Research Center to assess the impact on a commercial Jet
transport aircraft of using fuels which have relaxed property limits, relative to the
current commercial jet fuel. This study is part of an overall program being conduc-
ted by NASA to provide the technological date base needed in the event it becomes
necessary to make changes in aviation fuel properties.
The fuel currently used by the commercial aviation industry is derived from high
quality crude oil. It meets _ specification developed Jointly by the engine manu-
; faccrers and the fuel producers following many years of laboratory research and
operational experience. The resulting fuel has contributed importantly to the
outstanding record of performance amd operational characteristics of commercial
transport aircraft. Until the oil embargo of 1973-74 the crude oils from which these
_uels were refined were readily available throughout the world, at reasonable cost.
This is no longer true, however, inasmuch as costs have increased tremendously and
there is a declining quantity of high quality crude available on the market. The
producers of Jet fuels will increasingly be forced to consider the use of lower
quality crudes as well as synthetic crudes obtained from coal, shale, and tar sands.
The _roblem in doing this is that it requires costly changes to be made in the
refining process in order to produce a Jet fuel which meets the current specifica-
tion. One means of minimizing this increased cost is to relax certain of the
required fuel properties. If this can be accomplished it can also increase the yield
of jet fuel obtainable from the existing high quality crudes. The question is, which
fuel properties can be relaxed without compromising the performance and operational
characteristics of the engine, or the safety of the aircraft, recognizing that the
recent decline in availability of high quality crudes has already resulted in a
reduction of the margins which had previously existed between delivered and
specification fuel properties.
The objectives of the study were: to identify credible values for specific
properties of Jet fuel which could be considered realistic candidates for relaxation,
to evolve advanced fuel system designs for commercial aircraft and ergines which
would permit use of the relaxed property fuels, and to compare the performance of a
¢ modern commercial transport aircraft using these advanced fuel systems and the
_ relaxed fuel property limits with that of the baseline aircraft using current speci-fication fuel. The study was limited to any system, subsystem, or component that is
involved in the containment, delivery, or control of the fuel to the engine comb-
ustor. It thus was limited to delivery through the combustor fuel injection nozzles
and did not include the combustion process itself.
The methodology of the study is outlined in Section 2, Technical Approach. Data
used as input are identified in Section 3. Fuel properties are discussed in Section
4, which includes a listing of the property limits selected for relaxation. Section
5 presents an analysis of the effect the specified relaxation of fuel properties
would have on the baseline aircraft, and Section 6 describes advanced fuel system
component designs which will permit the satisfactory use of fuel with the candidate
* relaxed properties in the subject aircraft. Section 7 then provides a description
_ and the results of an evaluation of candidate fuel system concepts which were evolved• _ to accommodate a hypothetical fuel combining the relaxed properties in the reference
aircraft. Based on results of this analysis, recommendations are presented inSection 8.
-_" _ .... -.................... _ . j_,_ll-.-11_av--_ _ _ ,,___
1985010866-017

2. TECHNICAL APPROACH
The technical approach followed in this analytical study was predicated upon
satisfying a set of guidelines and requirements established early in the program.
These guidelines and requirements, together with the overall approach used in
performing the analysis, are outlined in the following paragraphs.
2.1 Guidelines and Requirements
Reference Aircraft - The L-1011-500 commercial transport aircraft was selected to
serve as the baseline vehicle for evaluating candidate advanced fuel system concepts
in connection with the use of potential relaxed property fuels.
Flight Requirements - Evaluate aircraft performance in each of the followingflight durations:
• Short range, duration ! 2 hours.
Use 926 km (500 n.mi.) range.
• Medium range, duration between 2 and 6 hours.
Use 3704 km (2000 n.mi.) range.
• Long range, duration _ 6 hours.
Use 9260 km (5000 n.ml.) range.
Temperature Conditions - Evaluate aircraft performance for each of the followingtemperature conditions: !
4
• Standard day normal atmosphere
• A standard high temperature atmosphere.
• A special low temperature atmosphere selected to represent a one day peryear worst case condition.
Candidate Fuels - Fuels to be considered in the study were limited to
hydrocarbons which would result from relaxation of property limits currentlyspecified in ASTM D 1655-BI. Other types of fuels such as hydrogen, methane,alcohols, and metal or carbon slurries were not included.
Fuel System Limits - The study was limited to consideration of any system,
subsysL :m, or component that is involved in the containment, delivery, or control ofthe _Jel to the engine combustor. It was thus limited to delivery of the fuel
, tlrough the combustor fuel injection nozzles and did not include the combustion9rocess itself.
Evaluation Requirements - Compare the flight performance of the reference
aircraft using ASI_M D 1655-81 Jet A kerosene as a baseline with four versions of its
fuel system using postulated relaxed f,el properties. The four versions include the
unmodified reference aircraft fuel system and three candidate advanced fuel system
concepts designed to permit use of the relaxed fuel properties.
"_ 9
1985010866-018
Evaluation Criteria - Evaluate the performance of the reference aircraft using
the following criteria:
• Aircraft weight variation for constant range missions (see Flight
Requirements)
Gross Takeoff Weight
Operating Empty WeightBlock Fuel Weight
Payload Weight
• Cost (manufacturing, maintenance, operations) as functions of fuel cost
• Safety
• Support requirements
• Complexity
2.2 Overall Approach
The study was conducted using analytical methods which have largely beensubstantiated by, or correlated with. experimental data; however, in some cases new
methods had to be developed for which no experimental results exist.
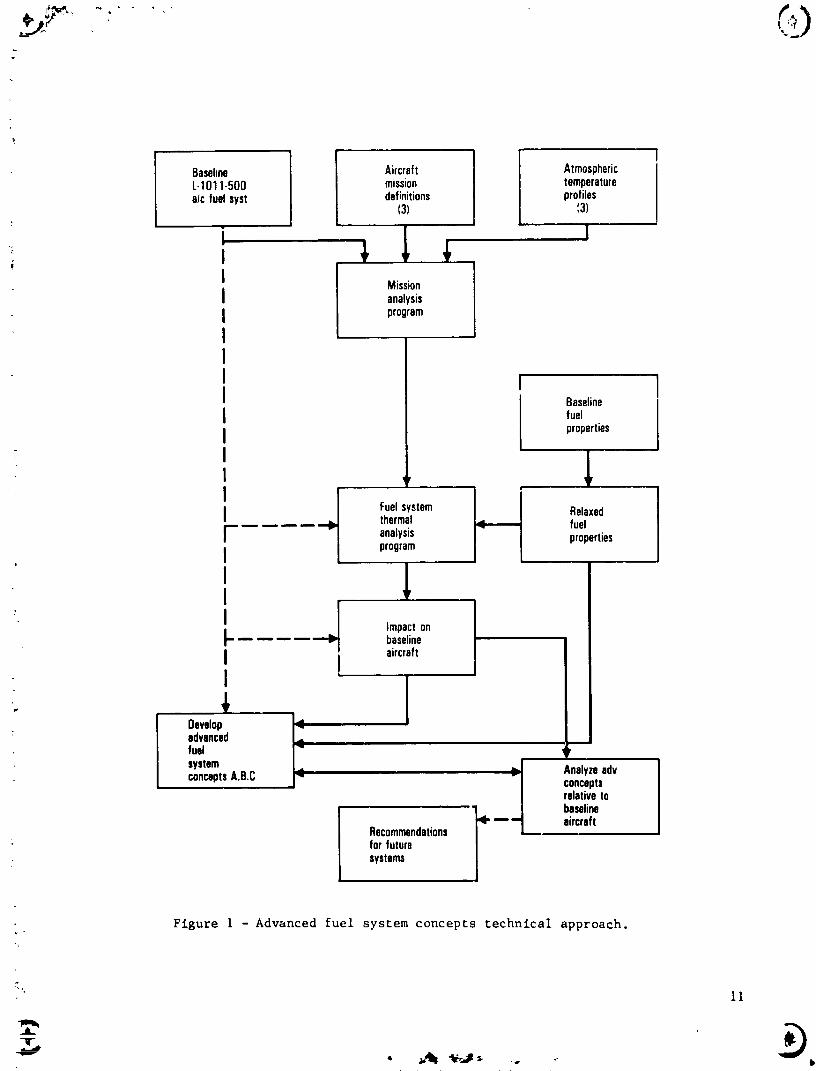
The study effort was divided into three sepa1_to tasks. A block diagram showing
the task breakdown and the interrelationships between them is provided in figure i.
A more detailed listing of the task breakdown is as follows:
Task I Baseline Aircraft Design and Input Data
• Compile pertinent data on the L-IOII-500 long-range commercial transport!
aircraft.
• Identify flight parameters and fuel flow conditions for the L-IOII-500
aircraft for short, medium, and long-range flights, and for hot, cold,
and standard atmospheric conditions.
• Identify candidate values for fuel properties which are relaxed from
those of the current specification.
: • Evaluate performa;,ce of the baseline aircraft using the selected fuelproperties.
• Task II Conceptual Fuel System Designs
• Deve)op design concepts of advaDced fuel system components and
subsystems.
• Establish designs of three candidate fuel systems for the basellve
"_ aircraft which are capable of using hypothetical fuels with the relaxed
properties.
i0
®
1985010866-019
r
Baseline Aircraft AtmosphericL.1011-500 mission temperaturea/cfuelsyst definitions profiles
(3) ',3)
i t, _ 1,
Mission
analysisprogram
Baselinefuelproperties
thermal fuelanalysis propertiesprogram
P
1!
/ Impacton
"1 baselineaircraft
I
Develo I..,advanced I:
fuel I_ i ,,
systemconceptsA.B.C > Analyzeadvconcepts
relativeto
baseline
aircraft• Recommendations
forfuturesystems
Figure 1 - Advanced fuel system concepts technical approach.
ll
1985010866-020
Task III Performance Evaluation of Candidate Fuel Systems
• Determine performance of each candidate fuel system in the modified
baseline aircraft using the relaxed property fuels. Evaluate for short,
medium, and long ran&e flights, and _or nominal and extreme temperatureconditions. Select the preferred system.
• Provide recommendations.
12
1985010866-021

3_ ' .,_ .. I,
3. BASELINE AIRCRAFT
3.1 Aircraft Description
The baseline aircraft selected for evaluating the candidate fuel systems is the
Lockheed L-1011-500 shown in figure 2. A summary of its design characteristics is
showr in table I. The L-1011 is typical of current wide-body aircraft used in both
i domestic and international air routes. Versions of the L-1011 are used in short and
medlum-range applications as well as long-range applications which require added fuelin center section tanks.
The major impact of fuel property changes will be on the aircraft and engine fuel
systems including fuel tanks, fuel supply systems, fuel metering systems, and the
associated materials which are in contact with the fuel. Consequently, the following
sections will describe only those systems which are directly affected by the fuel
property changes.
3.1.1 Aircraft fuel system.
3.1.1.1 Aircraft fuel tank arrangement: The aircraft fuel tank arrangement,
shown schematically in figure 3, includes four engine fuel feed tanks, all located in
the wing, which function as a three-tank system. Tanks are numbered from left to
right, 2L, I, 3 and 2R. The 2L and 2R ranks have an inboard and outboard compart-
ment. Al_hough any tank can supply fuel to any engine, the No. 1 Tank normally
supplies fuel to the No. 1 engine, the 2L and 2R Tanks to No. 2 engine, and the No. 3
Tank the No. 3 engine. In addition, two auxiliary fuel tanks, designated IA and 3A
located in the aft three bays of the wing center section box beam, replenish fuel
depleted from Tanks 1 and 3 as required.
The 2L and 2R Tanks each have an inboard and outboard compartment separated by a
solid bulkhead. For structural reasons during flight, approximately 3856 kg (8500
ib) of fuel are retained in each outboard compartment as long as possible. A
transfer llne connects the outboard compartment to the inboard compartment surge box.
When fuel in the surge box drops below approximately 454 kg (I000 ib), a float level
control valve opens and fuel transfers by gravity to the surge box rendering the
outboard compartment fuel available for usage.
Fuel transfer from the auxiliary Tanks (IA and 3A) is accomplished by means of
ejector pumps. Motive flow for the ejector pumps is taken from the main discharge of
the booster pump in Tanks I or 3.
i 3.1.1.2 Fuel management: The aircraft fuel storage tanks were initially sized
to provide each engine with essentially the same available fuel quantity for
operation on a normal tank to engine feed system selection. However, with the
addition of fuel stcced In the center section bays for long range flights, fuel
management is utilized to sustain the basic tank to engine feed system principle and
to allow the wing bending moments to remain within their design criteria. This is
accomplished as follows:
Taxi, takeoff and initial climb mission segments are performed with tank to
engine fuel feed. When the total fuel depletion approaches 6350 kg (14,000 ib), the
.:. 13
1985010866-022

1985010866-023

TABLE 1 - BASELINE AIRCRAFT DESIGN SUM_IRY
Wing S.I.Units U.S. Umts
• Area 329.0m2 (3,541 ft2_Ref. Area 321.1m? (3,456 ft 2)
1/4 ChordSweep 350
AspectRatio 7.62
HorizontalTail
Area 119.1m2 (1,282 ft 2)
Sweep 350
VerticalTail
Area 51.1 m2 (550ft2)
PessenoerCap_city 242
DesignWeights
MAX Takeoff 231 293 kg (510,000Ib)MAX Lending 16_ 322 kg (368,000Ib)
MAX ZeroFuel ,43 314 Lt] (338,0001b)
OperatingEmpty 1 ', J07 kg (245,3f'0 Ib)FuelCapacity 96 900 kg (213,640Ib)
Engine
SL StaticThrust 222 410 N (50,000Ib)
': TakeoffFlat Rating 29°C (84OF)
AirplanePerformance
TakeoffF;eldLengthat SL 29°C (84°F) 2760 m (9,060 ft)
LandingField Length 2070 ,'n (6,790 ft)
1
I
i4
I
tI
15
®I
1985010866-024


crew initiates crossfeedlng to all three engines from Tanks 1 and 3 only. Cross-
feeding is continued u_til fuel Is depleted in Tanks IA and 3A, and fuel quantities
in Tank I, and rank 3 and the sum of the fuel remaining in Tanks 2R and 2L are equal.
3.1.1.3 Engine feed system: The No. I and No. 3 Tanks each contain two
idpnttcal ac motor-driven boost pumps and check valves, adc motor-actuated tank
qhutofl valve located within the engine pylon upstream of the ftrewall, and the
interconnecting plumbing to the interface with the engine.
The feed system for the No. 2 (aft fuselage) enbine consists of; a) two pumps
identical to those in the No. 1 and No. 3 Tanks in each of the two outboard Tanks (2L
an. 2R, b) a manually operated shutoff valve for each llne where the lines exit from
each tank at the wlug root, c) a flow equalizer which equalizes the two tributary
flows, d) a dc motor-actuated isolation valve located at the aft wall of the center
section, e) two dc motor-actuated emergency (firewal!) shutoff valves located
upstream of the firewall, and f) the interconnecting plumbing to the engine luter-
face. All fuel lines in the wing are contained inside the tanks. The No. 2 engine
feed line is enclosed in a shrouded tube under the cabin floor within the pressurized
compartment.
A cross-feed system connects to the normal uank-to-engine feed ilnes througl,
appropriate dc motor-actuated chutoff valves and lines so that fuel can be supplied
from any of the three tank systems to any engine.
To assure fuel availability to the tank boost pumps during various airplane
attitudes and reduced fuel tank capacities, each tank contains a 454 kg (!000 Ib)
surge box reservoir, maintained full by scavenge eJcctor pumps.1
3.1.1.4 Auxiliary power unit (APU) feed system: Fuel for the APU is supplied
from Tanks 2L/2R by means of a common feed line with the No. 2 engine. A branch from
the common llne feeds directly to the _PU interface through two emergency (flrewall)
motor-actuated shutoff valves.
3.1.1.5 Refueling system: A pressure fueling system with two fueling stations
(outboard of each wing engine nacelle) is used to fuel the airplane. Each station
has two 2-1/2 inch diameter standard type D-I adapters suitable for accepting hoses
from ground support refueling equipment. The right slde station contains all of the
gages and switches necessary to control and monitor the complete fueling operation.All tanks can be fueled from one station or the other, or from both stations
s'multaneously. Adc motor-actuated shutoff valve is located in the cross shlp
fueling manifold so that the left and right sides of the system are isolated from
each other during normal fueling from both stations simultaneously. Dual type
electrically-operated shutoff valves are used to each tank. Fuel level, dual float
control pilot valves located at the full tank quantity level automatically operatethe shutoff valves to prevent overfilling the fuel tanks.
3.1.1.6 Jettison system: Fuel jettison in flight is accomplished by means of
the fuel tank boost pumps. During Jettison, the boost pumps also feed the e_glnes at
the necessary fuel flow rate demanded for flight operational conditions. Fuel exlt_
overboard through a dump mast whlch is located well outboard tn the wing trailing
J edge. To prevent Jettisoning fuel below I0 886 kg (24,000 ib) of airplane fuel, low
level thermistors are installed in the tanks to shut off the Jettison flow.
:.. 17
9 ®
1985010866-026

3.1.1.7 Vent systems: An open vent system is provided for all fuel tanks. Two
vent outlets in each tank are required to insure communication to the ullage space
for various aircraft attitudes. The aft vent outlet fnccrporates a float-operated
ve,. valve which closes to avoid z_pillage out the vents during climb and opens durlngd _ccnt to allow venting at attitudes in which fuel covers the open forward outlet•
3.1.1.8 Scavenge _ystem: The scavenge system consists of a series of Jet pumps
using motive fuel flow under pressure from the fuel tank boost pumps tc induce a
secondary flow from low points in the fuel tanks. The intent is to zemove fuel and
free water by scavenging through the secondary lines and delivering it to the surgeboxes vhere it is pumped to the enginas and consumed• The system works in parallel
with the surge box wall-mounted flapper check valves for supplying fuel to the boostpumps.
3.1.2 Engine fuel system. - The engine fuel system is shown schematically in
figure 4. It consists of a low pressure fuel pump which receives fuel from theaircraft fuel tank boost pumps and delivers fuel through a low pressure fuel filter
to the low pressure side of a fuel-cooled oil cooler. The fuel then paste8 through a
high pressure fuel pump and iJ delivered through the high pr-_sure side of the fuel-cooled oil cooler and rue] regulators to the fuel injectors in the engine combustors.
A brief description of the major components of the system follows.
3.1.2.1 Fuel pumps and spill valve: The LP pump is a centrifugal design and has
been sized to provide the best matching between RPM a,o fuel flow rate during takeoffand climb.
_I4_ IIN_ _LJ|k
¢ ,
' Figure 4 - Baseline engine fuel system schematic.
I
t_,t [8.!
- ®|
1985010866-027
The HP pump is of the gear type with the plate ends being lubricated by the fuel.
; Its operating point has been selected to provide an optimum match between speed and
uol_metric flow rate at takeoff and climb conditions. At low power levels, the
delivered fuel flow rate is much in excess of what is required by the engine fuel
metering system, and a HP bypass conduit _ provided to spill the excess fuel. The
_mount of bypass fuel is controllea by the spill valve sssembly under the control of
the fuel metering swstem. Th_ spill valve assembly is integrated with the combined
pump unit.
3.1.2.2 LP fuel filter: Thls u_i_ has the primary function to filter the debris
washed down from the wing tank and prevent it _rom invading the fuel meteriz;g system
and other small passages. In those cases in whlch severe pressure drops may exceed
the operatlonal limits of the fuel _ystem, a bypass mechanism overrides the fuelfilter.
3.1.2.3 Fuel cooled oll cooler: The fuel-cooled oil cool_r exchanges heat
between the fuel anu the engine _cavenge o[i. It serves two rurposes: to heat thefuel at cold fuel conditions and to cool :he oil at hot oil conditions.
3.1.2.4 Fuel flow regulators: The Main Fuel Flow Regulator controls the fuel
pressure supplied to the f_ei injectors directly and through the Starting Fuel
Regulator and Cold Day Enr{chment Valve it supplies added fuel during normal and cold
day engine starts respectively.
3.1.2.5 High pressure shutoff valve: This valve has a dual function: a) ittinterrupts completely the fuel supply to the burner system when the engine is shut
down; b) after shutoff, it allows the fuel located in the hot region system compo-
nents (manifold, distribution valves, and injectors) to be drained by means of a
separate line to the cool fan case region, and delivered to a small tank.
4
3.1.2.6 Fuel manifold distribution valves and spray nozzles: The fuel manifold
d!stributlon valves and pigtail conduitE to the {nJectors are shown in figure 5. The
distribution valves are passive and control the fuel fraction through them by means
"" ,_ a biased sprlng-loaded poppet. There are six distribution valves with each valve
di_trlbuting the fuel to three Injectors. The location of the spray nozzles and
distribution valves can be seen in figure 6. Spray nozzles Ncs. 8 and 12 are
provided with ignitor plugs for engine start.
19
1985010866-028

'_.. 20
1g85010866-02g

18 ! I Distributionvalves(typ)
17 \ / 2, \
3
i //// ",6\ ",'\\ X ./15_ _ / 4
View lookingforward ---
-- 14 ............. 5
13 / ,_ 6
/ /, \,,"
12 /; ' \ 7,gnite,and. _ / \ ,,startingfuel burner
11 , \ 8,_,Igniterand
10 9 startingfuel burner
Figure 6 - Burner and fuel distribution valve positions
4
Figure provided through the courtesy of
Rolls-Royce, Limited.
3.2 Flight and Temperature Profile Descriptions
3.2.1 Payload/range requirements. - A payload range curve for the L-IOII-500 is
presented in figure 7. This type of presentation shows the limiting values for an
aircraft in a particular configuration flying under a particular set of conditions.
The figure shows, for example, that maximum payload is limited to 42 000 kg and thatmaximum range at that payload is obtained when the airplane takes off at the maximum
allowable takeoff gross weight. Payload is traded for fuel as the operating point
moves down the maximum takeoff gross weight line until the maximum fuel capacity is
reached. From this point down to zero payload, the fuel capacity is the limiting
factor and the range increases as the takeoff and thus the mission weight is reduced.
With selection of the L-1011-500 as the baseline aircraft, typical missions that
; fit the study requirements for flight duration were defined as follows:
a) short range, (less than 2 hours) = 926 km (500 n.mi.)
b) medium range, (2 - 6 hours) = 3704 km (2000 n.ml.)
c) long range, (greater than 6 hours) - 9260 km (5000 n.mi.)
These ranges are consistent with operational missions that an airline might
schedule for the L-IOII-500. In service an airplane is not scheduled at its design
range and payload for each of its flights but will typically fly at shorter ranges
21
4
1985010866-030

50000
Maximump_yload
take-offgrossweight40000
_ 30000
l Maximumpaylo=:lat9260 km_25402 kg
g_
20000 Typicalp."ylnad_18144 ,Maxfmumfuelcapacityi
10000
o 14000 5000 6000 7000 8000 9000 10000 11000 12000
Ranoe_km
Figure 7 - Baseline aircraft payload/range - hot day (ISA + 34°C)
and reduced capacity, as for example the shaded area of figure 7. During 198], two
operators of the L-1011-500, reported average ranges of 6612 km (3570 n.mi.) and 7084
km (3825 n.ml.) resDectlvely.
A payload of 18 144 kg (40,000 Ib) was selected as the typical operational
payload for this study. This represents passenger load factors in the range from 60
; to 70 percent and cargo loads between 4536 and 2268 kg (_0,000 and 5000 ib). The
airlines mentioned above had load factors of 63 percent and 74 percent for the
L-IOII-500 for the reporting period. The total industry average load factors for the
same period of 1981 and the available reporting quarters of 1982, averaged slightly
lower (Ref. I). The selected payload of 18 144 kg (40,000 ib) therefore encompassesthe payloads being realized.
To allow for the full capacity case, calculations were also made with I00 percent
passenger load factor and 2268 kg (5000 ib) of cargo. This was accomplished on the
extreme hot day and used to determine the operational capability of the airplane withthe fuel system changes.
3.2.2 Flight profile. - Flight profiles were selected to simulate properlyairline operation. Thus, Federal Aviation Agency rules were considered as well as
practical operational limitations. A consistent set of ground rules were used for
i each of the temperature environments, differences occurring only when dictated by
_ engine limztatlons. The flight profiles selected consist of four major segments:takeoff, climb to altitude, step cruise and descent, qn the standard and extreme
cold days they are identical insofar as altitudes and speeds are concerned but on the
extreme hot day the altitudes vary due to thrust limitations on the engines.
if 22
1985010866-031

On the e_treme cold a,_ standard d ys climb is made with Normal Climb (Maximum
Cruise) power at a calibrate_ airspeed of 165 m/sac (320 kt)/Mach 0.8_ to the nearest
od_ pressure altitude below thqt for a W/ of approximately 0.86 x I0v kg (1.9 xI0 Ib), with a maximum pressure altitude of ii 887 m (39,000 ft). This value of
weight over ambient prcssure r_zio has been determlned from previous Fli_ht
Management System studies to represent the best altitude at which to init._te elsise
from an optimum cruise standpoint. On the extreme hot day, climb is made with
Maximum Climb power at a calibcated airspeed of 165 m/sec (320 kt)/Mach 0.82 to the
highest pressure altitude at which the aircraft can still fly with Maximum Cruise
_ Power, again with a maximum pressure altitude of II 887 m (39,000 ft). A minim_,m c f
: 91.4 m/min (300 fpm) rate of climb capabil_ty is maintained throughout the climb
segments.
A Mach 0.82 cruise, at partial oower, is then initiated at the end ,f the climb
segment a.d continues until the specific air range (F_/kg fueT) is gLeater at an
altitude 1219 m (4000 ft) higher. This procedure is coetinued to ac.__ve the desired
m_ssion range. This step crulse operation is used to approximate cruise at optimum
_pecific air range and is consistent with airline operation when Air Traffic Control
designates the available altitudes.
The descents from altitude for the mission profiles are done at cabin pressure
limited rates of descent. A cabin limited rate of descent is defined as the rate at
which the total time to descend is equivalent to the time required to pump the
pressure in the cabin up to the ambient pressure at the end of descent. Upper
portions of the descent are often limited by the maximum cabin pressure differential.
In these cases an idle power setting would bring the aircraft down faster than the
: limiting pump rate could bring the pressure up _n the cabin and the cabin pressure
differential would exceed its limit. For this reason, the first segment of some of
the high altitude descents require partial power.
Reserve fuels were calculated and are included in the missions. Domestic rules
were used for the 926 and 3704 km (500 and 2000 n.mi.) missions and International
rules for the 9260 km (5000 n.mi.) mission. All of the reserves were calculated for
a 370 km (200 n.mi.) alternate range. The cruise portion of the flight to an
alternate airport for extreme cold and standard atmospheres was flown at 9144 m
(30,000 ft); however, on the extreme hot day mission a 6096 m (20,000 ft) cruise
altitude was used due to thrust limitations.
. Domestic Reserves are calculated using the following flight profile segments:
i) Missed approach, climb to 457 m (1500 ft)
2) Climb to 3048 m (i0,000 ft) at a calibrated airspeed of 129 m/s (250 kt)
3) Accelerate to a calibrated airspeed of 154 m/s (300 kt)
4) Climb to cruise altitude at _ calibrated airspeed of 154 m/s (300 kt)
5) Cruise at optimum Mach6) Descend to 3048 m (i0,000 ft) at a calibrated airspeed of 154 m/s (300 kt)
7) Decelerate to a calibrated airspeed of 129 m/s (250 kt)
8) Descend to Sea Level
9) Include a 45 minute hold maintaining the fuel flow at the end of cruise
International Reserve calculations are broken down into two parts: Part I is the
contingency fuel _hich is I0 percent of the total flight time at the fuel flow at the
ii 23
®
19850 10866-032
end of the labE cruise segment, and Part II which is a flight profile broken down
into the following segments:
I) Missed approach, climb to 457 m (1500 ft)
2) Climb to 3048 m (I0,000 ft) at a calibrated airspeed of 129 m/s (250 kt)3) Accelerate to a calibrated airspeed of 154 m/s (300 kt)
4) Climb to cruise altitude at a calibrated airspeed of 154 m/s (300 kt)
5) Cruise at optimum Mach
6) Descend to 3048 m (i0,000 ft) at a calibrated airspeed of 154 m/s (300 kt)
7) Decelerate to a calibrated airspeed of 129 m/s (250 kt)
8) Descend to Sea Level
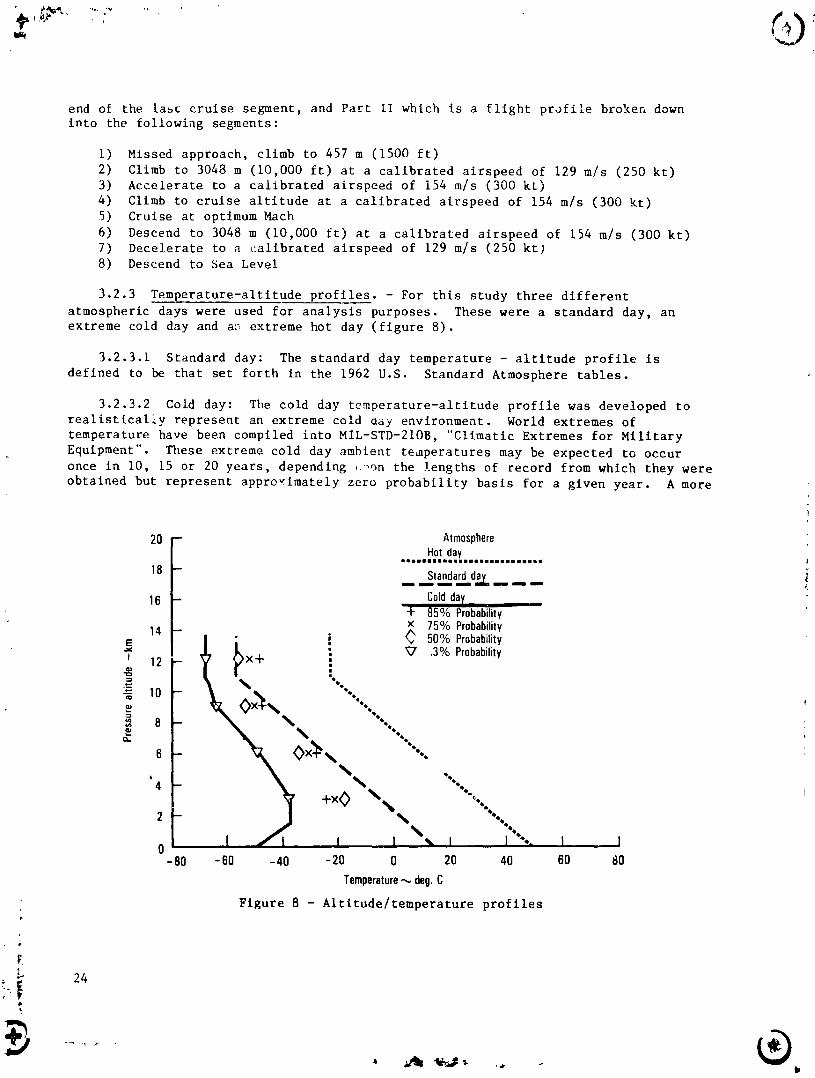
3.2.3 Temperature-altltude profiles. - For this study three different
atmospheric days were used for analysis purposes. These were a standard day, an
extreme cold day and a_ extreme hot day (figure 8).
3.2.3.1 Standard day: The standard day temperature - altitude profile is
defined to be that set forth in the 1962 U.S. Standard Atmosphere tables.
3.2.3.2 Cold day: The cold day temperature-altitude profile was developed torealistically represent an extreme cold aay environment. World extremes of
temperature have been compiled into MIL-STD-21OB, "Climatic Extremes for Military
Equipment". _lese extreme cold day ambient temperatures may be expected to occur
once in I0, 15 or 20 years, depending ,._on the lengths of record from which they were
obtained but represent approximately zero probability basis for a given year. A more
20 -- Atmosphere 'Hotday
eeilllamlliiliiilwaiiamli el mlO
18 -- Standardday
16 - Coldday,--I- 85% Probabilityx 75% Probability
E 14 -- + _> i _ 50% Pr°bability12 x+ _ .3% Probability
_ _ "...--:- ,o -- ,. ..ro _X_ e'D
_ 8 - N N ...¢,1
x ...
0 _-80 -60 -40 -20 0 20 40 60 80
Temperature_, deg.C
Figure 8 - Altitude/temperature profiles
#
24
t
.......... ®
1985010866-033

realistic method relating extreme cold ambient temperatures at altitude to globallocation was formulated in a recent NASA study (ref. 2). This £tudy showed the
extreme cold temperatures that might be encountered by aircraft during a flight with
an annu..l 0.3 percent probability of occurrence (one day a year).
The one day a year percent probability of occurrence, translates Into an extreme
cold temperature exposure tlme of 1.8 minutes for the 9260 km (5000 n. mi.) cold daymission. The time duration at the minimum ambient temperature is very short relative
to the total tlme of the flight and thus has little effect on the the fuel
temperature. An aircraft flying the route for a month would have the equivalent of
30, 1.8 minute extreme cold temperature exposures, or one 54 minute period per month.
A time period of one hour was assumed in this study which allows a reasonable amount
of fuel tank exposure time to the extreme cold temperature.
The minimum fuel temperature is calculated by determining the heat transfer to
the air adjacent to the wing skin and the time of exposure. The temperature of this
air is a function of st_tlc air temperature, aircraft speed, and the percent of
stagnation temperature rise recovered in the boundary layer air. The static orambient temperatures for the cold day temperature-altltude profile were developed
from statistical temperatu:e information derivcd from actual worldwide temperaturerecordings to 16 154 m (53,000 it) (ref. 3). Temperature data were compiled and
computed to report a mean route temperature with 50, 75, and 85 percent probabilityof eccurrence; i.e., temperatures which are not expected to be exceeded 50, 75, and
85 percent of the time.
To determine tre probability of temperatures which are not expected to be
exceeded, an inverse normal integral function (Gaussian distribution) was utilized.The one day a year, 0.3 percent probability, was input to this distribution to
determine the standard normal variable. The standard normal variable for 0.3 percent
and the temperature and standard normal variables associated with 50, 75, and 85
percent probabilities are plotted to extrapolate a temperature for the one day ayear, 0.3 percent probability.
The cold day temperature-altltude profile is shown in figure 8. These altitudes,
temperatures, and probabilities were utilized in the cruise portion of the flight todefine the ambient temperature through which the aircraft flies. This ambJent
temperature profile for the 9260 km (5000 n.mi.) cold day mission (figure 9)
represents the worst case extreme cold day temperature environment used to predict
the fuel tank temperatures in this study, b
3.2.3.3 Hot day: The hot day temperature - altitude profile follows the hot day
environmental operating envelope of the L-1011-500. This is the maximum temperatureday for which the environmental control system of the L-1011-500 remains within its
operating design limits.
3.3 Baseline Aircraft Performance
Performance of the reference aircraft was determined on the selected _lightprofiles for each of the mission ranges and for the three temperature profiles; thiswas accomplished using the Lockheed Aircraft Mission Analysis Program. The resultshave been summarized as time histories of altitude, Mach number, ambient temperatureand fuel quantity in each of the tanks while flying at a constant airspeed of Mach0.82. Each of these variables were calculated for all nine mission range-atmospherecombinations for use in determining fuel tank temperatures. Hcwever, only selectedvalues are shown for each of the combinations.
25
1985010866-034

20
18 I 85% of cruisetime •
75% of cruisetime • Pressurealtitude
16 50% of cruisetime • ....... Ambienttemperature = -20
E 14 onehour • -
12 - 40 q.)
lO ,...4-. __ . -
6 - E
4 - -80
2 -
0 kt -- -1000 1 2 3 4 5 6 7 8 9 10 tl 12
Flightt_me_,hours
Figure 9 Cold day flight profile, 9260 km (500 n.ml.) mission
3.3.1 9260 km (5000 n.ml.) mission. - The entire set of data for the critical
mission, 9260 km (5000 n.mi., on the cold day, are presented for illustration in
figures i0 through 12. Figure i0 shows that for optimum specific range the airplanecruises at altitudes of 9449, i0 668, and II 887 m (31,000, 35,000, and 39,000 ft).
The ambient temperature that the aircraft operates In _uring the flight is presented
in figure I_. During the majority of the cruise the amolent temperature is in therange from -73 to -51°C. Fuel quantities in each of the four tanks are shown in
figure 12. From this figure it can be seen that all of the fuel in Tank IA Is usedbefore burning any significant amount of fuel from any of the other three tanks.
When Tank IA is depleted, fuel is used from Tank I and shortly afterward from Tank 2Inner. When Tank 2 Inner reaches the 454 kg (I000 ib) level, thls level is
maintained by transfer from Tank 2 Outer. Tanks 1 and 2 Outer are then used untilthe end of the flight.
For the remaining mission range-atmosphere combinations, only the altitude and
ambient temperature time histories are presented. The flight profile on the standardday uses the same cruise altitudes as the extreme cold day and the altitude time
history Is therefore similar, as shown In figure I0. The corresponding ambienttemperature time history for standard day is presented in figure II. On the extreme
hot day, however, figure IO ohows that the cruise altitudes vary, due to thrust
limitations, and the flight profile is at lower altitudes. The cruise al_tudes for
the extreme hot day are 8839, 10 058, and 11 278 m (29,000, 33,000, and 37,000 ft).The ambient temperature time history for this flight profile and atmosphere is also
shown in figure ii.
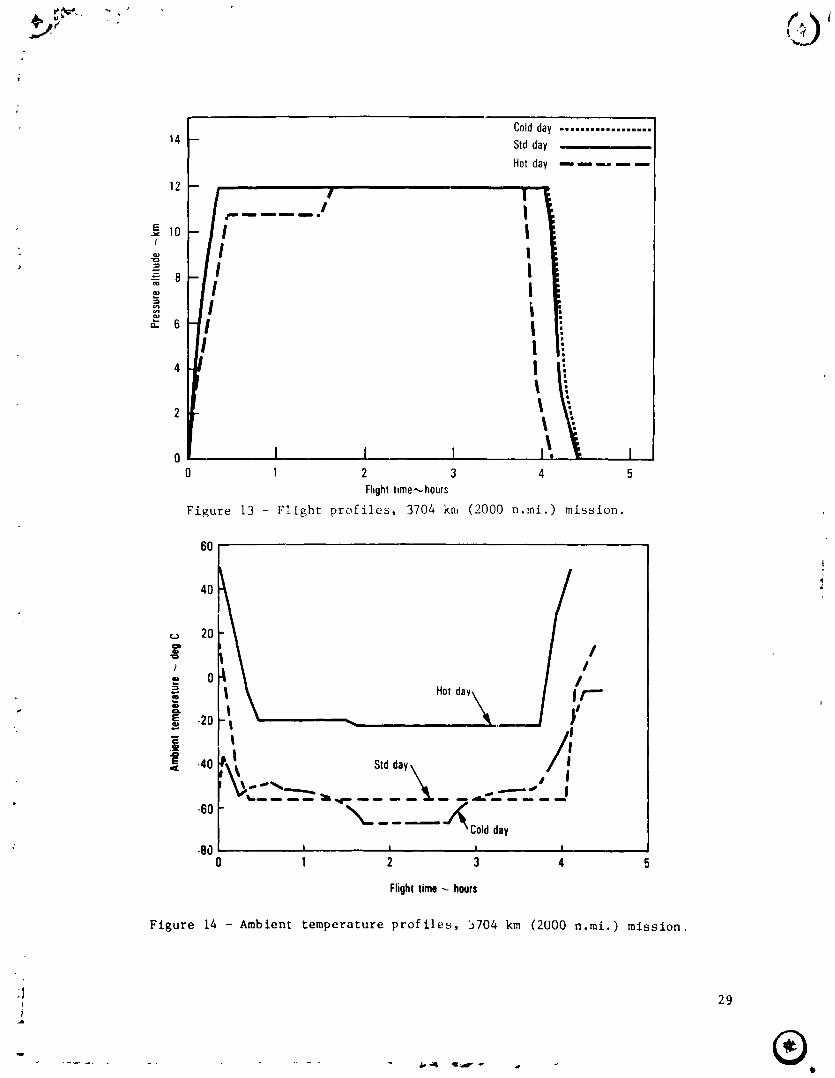
' 3.3.2 3704 km (2000 n.mt.) mission. - The flight profiles for the medium range! mission are similar for the standard and extreme cold days and different for the
extreme hot day. On the standard and extreme cold days the aircraft climbs to acruise altitude of ii 887 m (39,000 ft) and remains there until the descent to the
1985010866-035

f Coldday..................
14 Stdday •
Hotday .....12
_iln Ii,_ Ins= Illm II_ 1
10 .....
Iii_ i lil Ilil I
E ! I.to
, 8 I II I._._
4 II
0 1 2 3 4 5 6 7 8 9 10 11
Flightt=me_-.hours
Figure i0 - Flight profiles, 9260 km (5000 n.ml) mission.
6O
*_ 40 /
i2° I
i0 Hotday\ I
i _ \20 -
.4o|
IS_,_, Stdday,_ y-601 I ='_--/-I -- -- :---"--"='"="= "-- -- --_"-- -- -- _- -- "/JI , Cl°lddat'_ "' ""_" - -# t.80 i t i t0 1 2 3 4 5 6 7 8 9 10 11
Flighttime,,,- hours
Figure II - Ambient temperature profile, 9260 km (500 n.ml.) mission.
_.i 27Z..
- ®
] 9850 ] 0866-036

26.0
. 24.0 Tank1/3Ta,.k1A/3A22.0 Tank2 R/Li,ner
Tank2 R/Louter20.0
18.0
16.0
-_ ,= O!7 14. &
120
== 10.08.0 %
%
6.0 k4.0
2.O _
0 0 2.0 4.0 6.0 8.0
Fhghtt=me---,m=nutesx 10.2
Figure 12 - Cold day fuel quantity, 9260 k= (5000 n.mt.) mission.
destination. However, on the extreme hot day the aircraft climbs to an initial
cruise altitude of I0 668 m (35,000 ft) where it remains for a period of time and Jthen to a final cruise altitude of ii 887 m (39,000 ft) where i_ remains until
descending to the destination. 4
In figure 13 the flight profiles are shown as plots of pressure altitude vs
flight time for the extreme cold, standard and hot days. The ambient temperatures
associated with these altitude-time profiles are presented in figure 14. The mission
fuel tank quantities are shown in figure 15 for the cold day only since the standardand hot day fuel tank quantities are not critical in this study.
r I
3.3.3 926 km (500 n.mi.) mission. - In the short range mission, less than two
hours, a flight profile containing only one cruise segment is used. The aircraft
climbs to the cruise altitude, cruises, and descends to the destination. The same
cruise altitude of Ii 887 m (39,000 ft) was used for all three temperature profiles.In figure 16 the flight profiles are shown as plots of pressure altitude vs flight
time for the extreme cold, standard and hot days. The ambient temperaturesassociated with these altitude-time profiles are presented in figure 17 and the coldday mission fuei tank quantities in figure 18.
i 28
1985010866-037
Coldday ..................14 Stdday
Hotday =,==....
12
E 10t
-_ 8
_ 6
I
I
o I I I I. I0 1 2 3 4 5
Fhghtt_me_,-,hours
Figure 13 - Flight profiles, 3704 knl (2000 n.mi.) mission.
6O{
4
40
o 20"
/
= _ Hotday
_ .20 .
-80 i i i i i0 1 2 3 4 5
Flighttime_ hours
Figure 14 - Ambient temperature profiles, b704 km (2000 n.mi.) mission.
;i 29
- ®
1985010866-038

12
I0_ .TankI
i
c_
/ 6- '"
:L_ e_
m ._OUt
0 I I J 10 1 2 3 4 5
Flighttime_ hours
Figure 15 - Cold day fuel quantity, 3704 km (2000 n.mi.) mission.
14Coldday ............. _.Stdday ,,
12 _"-- _ _ Hotday
/," ....
4
o_0 .2 .4 .6 .8 1.0 1.2 1.4
Flighttime_,,h0urs
Figure ]6 - Flight profiles, q26 km (500 n.mi.) mission.
'_. 3o
............ • ,i,'il "ti...'li I. ,. It
1985010866-039

6O
40-
r,,.,1
=, 20.= _ i II
-== 0 Hotda, //
i ,/,_ -20 _I
- /
.4°/,,:,_.,. _e
-60 _ Loldday--_
-80 ,,_ i l I I0 0.2 0.4 0.6 0 3 1.0 1.2 1.4
Flightteme_ hours
Figure 17 - Ambient temperature profiles, 926 km (500 n.mL.) mission.
5
4 % /Tank ]
"--Z..3--
1
• _- /Tank 2 outer
Tank2 ,nner
o I L i I 1 I0 0.2 0.4 0.6 0.8 1.0 1.2 ! .4
Fhghttime- hours
Figure 18 - Cold day fuel quantity, 926 km (500 n,mi.) mission.
• 31
1985010866-040

4. FUEL PROPERTIES
4.1 ASTH Specificatio,'
Current commercial aircraft use jet fuels whose properties are wtthtn a_ envelopeof limiting value_. These limits, currently establisheq by ASTM specification D
1655-8]_ for Jet A, .Jet A-l, and Jet B, are shown in table 2.
, The airframe and engine manufacturers have also established materials selection
and component design criteria, which assure a highly reliable aircraft able to
operate within reasor_able economic margins, as long as the jet fuel properties are
kept _ithin specifications. When significant problems arise in fuel supply or
utilization, the related specification limits are carefully examined in order to
decide whether they should be relaxed (supply problem) 3r tightened (utilization
problem) for coping with temporary or permanent situations. For example, in the past
years there has been a trend to increase the aromatics content beyond the normallyallowed maximum limit of 20 percent in volume. As can be seen In table 2, aromatics
content [s presently permitt_d uo to 25 percent, provided the supp!_er notifies the
T_urcbnser within 90 days, or if other reporting conditions mutually aF_eeable to both
oartles are made. The allowance was only temporary and was subject to further
approwl by 1982. If the experience accumulated during the property relaxation
period demonstrates that it is safe and reasonable to operate under such conditions,
this rel_xation can become permanent.
In tbe last ten yt,_rs, however, thero h_ve been clear signals that during periods
of fuel shortage, the availabilf y of jet fuel may be jeopardized because of competi-tion from oth,:r important sectors of the fuel market, s,_ch as diesel f,,els and
heating oils. Studlm_ hav_ been conducted wbich show that in the future, jet fuels
will most prcbably have to be produced from heavier petroleum fro tions withincreasing participation of shale oil and coal syucrude blends. The back end of
thes,, dls:illates would necessitate additlo-_l processing in the refinery in order to
meet present specifications. This would undoubtedly translate into higher fuel
costs, with the corresponding impact on direct operating costs.
_ al,ernate approach under study by NASA and DoD agencies proposes a
re--examination of the present speclfications iI_ view of the advancements which have
beec introduced in the last 30 years in airframe and engine technology, coupled with
" a deeper understandtn_ of the behavior of fuels in fuel systems and engines. An
assessment on how far the specification limits cou!d be relaxed, wh'[e still opera-
tiLlg the alrcraft within safe and economic limits, could result in a greater
availability and significant energy and cost savings.
4.2 C_ndidate Fuel Property Changes
Since the Arab oil embargo the cost of jet fuels has almost quadrupled and under
special circumstances, such as severe winter weather, fuel procurement actions have
been hampered. These developments have motivated the oil industry to turn their
interest to non-petroleum resources for the production of fu, ls for jet aircraft and
other uses. In the military, these concern_ were rai_ed early in the middle 1970's
when a series of feas[billty studies were conducted to asse_s the potential contri-
bution of oll shale, _'oal, and tar sands as raw m,.terials for augmenting the supplies
-_- _ 32
1985010866-041

TABLE 2 - DETAILED REQUIREMENTS O1' AVLArlON TURbiNE FUELSD 1655-81 SPECIFICATIONS
T-L P.e,¢=_.... J_tA rlr p_A I JP'B ASTM TestMethodB
J -4
Ar,_,;y,t.tal.la_mg KOh g 0 1 [3914or03242
Aromahrs _o,,rna_% /_C 20C DI319
Sultu, mercaptan,[} wt max '% 0 003 8 003 0322;
"- Sulfur total wt max ',, _ 3 0 3 D1266 ur 01552 or 0262?01$f_fletlontemoeraturg °C 'UF_
x _0%recoveredmax leap 7F}44 t4OUI [38620q_recovered ma_ tem_, 143 3 (29"J_90% ._.:o,ered max te,'_p ,epo,t 282 8 _3701
9P_=reck1,_.rgdmax temp leport 243 3 _470_
k,naLbolhng ,.oat rr,ax ut I('l -, d0O_572)DJstdlat_onresidue me. "_ 1 5 1 5OlstJlatlOh_OSSnlax_ I 5 1 5
F ashpo.lt mlr, UCtUFI ,q7 81 ,00 056 o, D3243L
Gray,ivmax oAPIhl.n sp_,)alI%b'_I 51 107753, 57 _O7501_ D1299
Grav,r_ n,ln oAPI ,max sp.rl _t 15[oC J7 (r) 8398} "5 _(_8517_ D1298
I 36 13% I D323Vapor_resslJren_ax kg _'hl
Freezl._ po_qT,max nc 40 JetA E 50_ D2386VESCOS_t¢I20UC) 4°_max rSt 947JetAIEF 0445
Nefheatofcomb_t_ohr],n,kJkg_[_t_'Ib, 42795(1940[IH_ 42795_Id:00H} 014050_02382CombustJn -toperI es nne_ttn_ tn lot4,, g_e
pul.ementlshailbemet
,t) Lumlnomet{'numbermlno' 45 45 D1740
(2) _moke poet _Nh Or 25 25 DI,]22
43) Smoke pint m_n and 20G 200 B1322
Naphthalene_vO:ma_ _ 3 3 01840
Cnlrnsloncopperstrlp2hatl00UC12_2OrlTnax No 1 NO f O1`]0ma_
Thermal |IabN,_ one _f the fOIIow'T,_re_ ,rement_shellbe meT
(I1 Fillerpleuuredrop ,'_a_',,r,Hq 76 2 162 D16G0i
Preheaterdeposit less•nan Cnde3 [ r,de3
_2} F,Iter pre_u,e drop max mmHg 25 25 O3241J
Tubedeposit!e.,s_'la,l Code3 Cod_ 3
E_l_ent gum, max mg T0Drnl 1 I 0381Waterreaction
Separat,nn_at,,,gmax I2_ _2l 01094
InTerfacerat,ng ma_ ,h _b 01094Add,t,vm See4 2
Electricalconductivity pS'm K K 02624 or O]114
AThe requirementshereine_eabsoluteanoarmnot sublect to correctionto_ toJeranceof ttie testmethods _I mult_plg
determlnanonsare made lyeegoresuV shei be usedBThe test ra_thodsind,cetedin th_stable are referredt_ _nSection9 . _
CFuelswith In atom&tic,conten_over20 vol¢_me%but nDtexceed_n§25 vo_un.e%}re permittedprovided the supplier (seherlnotifies the purchaserof the volume d_stibution andaromaticcontent w_th,q90 daysof dateot shipment unle_ other
teportin_ conditionsareagreedto by bnth p_rtle$ Th_sfootnote _|subjectto ,&approval,n 1982
DThamerclptln tuHur direr _mahon maybe wa_ve(,_f the f,at__sconsidered_weetby Ihe doctor 'askdescribedm 4 2 ofSpeclf,clt_on0484 for Hydrocarbon0 VOeenlngSolven's`] #
: EotheffrNzlng peatsmay be agreeduponbelweensupphefand purchaser
, FThe _7_C mix,mum freez,ngpo,nt tract for Jet A I _ss,,blect to reapproval,,_1983 If not reapproved,the va;ue wdl revert to
-50oc mix=mum
GFuellhavre@m smokepoint1111than20 butnotlessthan%8end e mexlmum of3 volume% ofnaphthalene$arepermmed
provldadthesupplier(loller)nofiflesthepurchet_rofthevolume,diltrlbuf_onand smokepoint}ndnaphfhelenescontenl
w_thin90 daysof date ofshipmentunllsl olhel reporting condlt_onsire agreedTobv both petites This footnote iSsob_act
_= tOroepprovat,n 1982HI_se for JetsA endA lthe vl_ue calculatedfrom Table3 or Eqs5 end9 inMethod D1405 Usefor Jet 8 Thevaluecelculetod
from Table6 or Eqs$ and7 in Method01408 Method 02382 maybl usld i| &nllllrnltlVl In cell of disputeMethod02382
mustbeu:ad
• IThermal|t_b,t_ty testshsllb_ ,.onductedfor 5 h at 1488°C 1300oF) pc&heatertemper&tore204 4°C ',4OO°F)hirer temperlturs,endIt aflow TOteOf2 7 k_h (6 Ib/h)
JThe_molstibdiw tail IJf'" OT) shill be conductedfor 2 5 h it • control temperatureol 260oc but .f Ihe requlremo.tsof
Table Iere n(,trest. fh,. '_'.t rosyhe ct_)nductsdfor 2 5 h at _¢ontIoI temperatureof 245oc Resultsatboth test t|mparatures
" shallberlportedln fhlsCes• Tubedepus_tssh&llelwaysbsreportsdbvthlVisualMlthGd,lratlngbytheTubeOeposltRetmg(TDR) opt_roldensitymelhnd _sd.. ,eb_ebut not mandatory
KA limit of 50 to450 conductivityunlt_i(p_., ,,p,leSonlywhenIn Ilestr¢CllconducfiVltyadditive _l usedInd underthe
conditionIt point of use1 pS/m = I x 10 12¢.Ilm '
Ll'_esulttobtainedby Method03243 may be up to1 /°C (3OF) belowthoseoblaine"1by Method D56which ISthe prlferred
• method IncaseO#dlsputl.Mllhod 050 will iOply
¢2N
] 985010866-042

of aviation turbine fuels (see references 4, 5, and 6). It soon became evident from
those early studies that:
i. It was possible, in principle, to manufacture jet fuels from
syncrude which can meet current specifications.
2. The additional refinery pro_essing that was required to bring
the synthetic fuels within the specifications would undoubtedly
result in higher costs to the consumer and higher process energy
consumption at the refinery.
3. Jet fuels from shale oil would be similar to petroleum derived
jet fuels, while jet fuels from coal syncrude would be either heavy
in aromatics or, after hydroprocessing, highly dominated by
napthenic based components.
4. Considerations related to capital investment, risk minimization
and other competing sectors from industry indicate that, in the
short term, jet fuels will still be produced from petroleum sources,
although with increasing participation of the heavier distillatefractions.
5. Before the year 2000, some jet fuels will probably be partially
manufactured from shale oil, although the percentage penetration in
the jet fuel market is uncertain and will undoubtedly be dependent
on the energy supply/demand scenarios that result from growth or
no-growth economic trends.
6. Before the turn of the century, it is expected that some fuels
will be derived from coal. It is believed that given the higher
tolerance to napthenic based fuels by the gasoline, diesel, and
heating oil consumers, the contribution of coal will be more
noticeable in those sectors, leaving the petroleum based crudes
freed for the manufacture of aviation turbine fuels (see
reference 7).
In summary, in the short term, current trends indicate that future jet fuels will
be manufactured with medium distillates obtained from heavier petroleum fractions by
means of cracking and hydroprocessing. In the intermediate future, before the turn
of the century, shale oll derived jet fuels could become an important fraction of the
total aviation turbine consumption; and in the long term (50 years from now), if jet
aircraft are still powered with hydrocarbon fuels (there are strong indications that
liquid hydrogen and liquid methane could become major fuels for large aircraft after
the turn of the century), most of them will be derived from coal and consequently
will be of a napthenlc and aromatic base.
The J tional Aeronautics and Space Administration, and the Department of Defense,
have active programs in jet aircraft hydrocarbon fuel technology aimed at
investigating the required technological developments which may be necessary in the
future (references 7 and 8). These programs comprise studies and experimental
testing. In order to provide a common reference base for the program activities, an
I Experimental L_e_eree Broad-Specification (ERBS) fuel was recommended (see
reference 9). Quoting from this document, the ERBS fuel was suggested to be used as
a base case fuel in the programs aimed at developing new engines and fuel systems.
34
®
1985010866-043

++IP++ +
The proposed specifications are given in table 3. In this study, the ERBS fuel was
intentionally selected to provide a fre_back and ascertain as to whether the
tentative limits originally recommen _ for the ERBS were or were not adequately
established (at that time, very few r, _Its were available from the airframe industry
to provide a sufficiently sound basis on which to recommend the working ERBS limits).
4.2.1 Freeze point. - The _reeze point is presently specified in ASTM D 1655-81
at -40°C (-40°F) for Jet A fuel, and is defined as the temperature at which suspended
waxes in the fuel disappear while on a warm-up cycle after a previous chilling cycle.
Visual detection of these waxes is subjective and the reproducibility has been
established to be within 2.6°C (4.7°F) (see reference i0). It is important to notice
: that the vclume percentage of these waxes could be extremely small. The materials
present in the precipitate belong usually to the highest boiling point paraffinic
chains that make their way into the fuel during the distillation or blending process.
It should be expected that under equal circumstances a Jet fuel with a napthenic base
will have a freezing point somewhat lower than one with a paraffinic base. Coal
derived fuels still have a substantial portion of heavy paraffins and the dependence
of the freezing point on the end boiling point and the crude base may be even weaker
than the dependence on the nature of the refinery process employed to manufa,_ture thefuel.
Reference !i reports on the examination of the d_stribution of published inspec-
tion data of Jet A fuel in an eleven year period, from 1969 to 1979. It was found
that a distribution of freezing points in the 676 samples presented a component
centered very near the present specification at -40°C (-40OF). In fact, it was found
that the freezing point was one of the controlling near-specification properties. A
relaxation to a higher limiting value would obviously have a positive effect on the
availability of Jet A fuel. Furthermore, laboratory low temperature experiments con-
ducted by Lockheed for NASA (reference 12) in an L-1011 simulated tank have shown
that there is a one percent probability that present aircraft may encounter extreme
temperature conditions whlch could result in a freeze-out of 1.2 percent of unusable 4fuel. Although this quantity is lower than the reserve fuel and would melt duringdescent, it is evident that the freezing point specification imposes a constraint on
the fuel system. The freezing point is then an important property to be considered
when designing advanced fuel systems for broadened property fuels. A limiting value
of -200C (-4°F) was selected for this s_udy, which is 3.3°C (6°F) higher than the
ERBS recommended limit to reflect the type of freezing point that a diesel fuel could
exhibit if manufactured from a blend of napthenic and paraffinic crudes.
4.2.2 Thermal stability. - In the most general sense, fuel stability refers to
the ability of a fuel to resist chemical changes due to a shift in environmental
variables (temperature or pressure), exposure to foreign matter (materials compati-
bility), or long term effects (storage stability). Thermal instability makes itspresence noticed by the appearance of carbonaceous deposits, film lacquers and
varnishes on those components of the fuel system whose surfaces have come in contact
with the fuel while being exposed to high temperatures. Storage instability is
' normally associated with the fuel aging processes and manifests itself by the
formation of sediment gums in the fuel tanks. In subsonic flight the components of
the fuel system which are vulnerable to thermal instabilities are those where the
fuel is subjected to moderately high temperatures for long periods of time, or has
come in contact with hot spots for short dwelling times. However, the chemical
mechanisms responsible for thermal and storage instabilities are not too different,
i.e., they may be different manifestations of the same phenomena at different
: temperatures and residence times.
; 35+
- "O
1985010866-044

TABLE 3 - PROPOSED SPECIFICATIONS FOR EXPERIMENTAL REFEREE
BROAD-SPECIfICATION (ERBS) AVIATION TbnRBINE FUEL
ERBS ProposedSpeclf,cat_ans Jet Fuel Value TestMethod
Composition.
Hydrogen,wt % 12.8+0 2 NMRAromattcs,vol % Report ASTM 01319
Sulfur, mercaptan,wt % 0.003, max. ASTM 01219
Suifur, tot31,wt % 0.3, max. ASTM 01266
Nitrogen,total, wt % Report KjeldahlNaphthalenes,vol % Report ASTM 01840Hydrocarboncompositionalanalysis Report GCMS
Volatihty:Distillation temperature,°C (OF) ASTM 02892
Imtial boihngpoint Report ASTM 02892
10 Percent 204.4 (400), max. ASTM 0289250 Percent Report ASTM 02892
90 Percent 260 (500), ram. ASTM 02892
Final bodingpoint Report ASTM 02892Residue,percent Report ASTM 02892
Loss,percent Report ASTM 02892
Flashpoint,°C (OF) 37.8 (100), rain. ASTM 056
Grav,ty,API (15 6°C) Report ASTM 0287Gravity, specific(15.6/15.6°C) Report ASTM 01298
Fluidity:
Freezingpoint,°C (°FI -23,3 (-10), max. ASTM 02386Viscosity,at-23.3°C (-10°F), cS 12,max. ASTM 0445
Combustmn:
Netheatof combustton,kJ/kg (Btu/Ib) Report ASTM 02382
Thermalstabihty:
JFTOT, breakpointtemperature,°C (OF) 237.8 (460) rain. ASTM 03241(TDR, 13;and AP, 25mm)
[
' 36
1985010866-045

The ASTM D 1655-81 specification for thermal stability offers two alternatives tocomply with the requirements: a) the AS_4 CRC Fuel Coker described in the
spenificatlon D 1660, or b) the Jet Fuel Thermal Oxidation Tester (JFTOT) described
in specification D 3241. The JFTOT test consists of pumping the fuel sample through
a polished aluminum heater tube, and then through a 17 _m (17-micron) filter for 2.5
hours. The temperature at which the filter plugs (a pressure drop of 3.3 kPa (25 mm
Hg)), or at which the deposits on the heater tube become darker than a light tan, is
known as the breakpoint temperature. The present specifications require a minimum
temperature of 260°C (500°F) when operating at 3.45 MPa gauge (500 psig).
The CRC Coker and JFTOT test times are of the order of hours, at temperatures
well above those to which a fuel system component is normally exposed, except for
perhaps the injection nozzles themselves. _ese temperature and time ranges have
been selected for practical reasons, since otherwise the sample of fuel under test
would be too large should the test proceed for periods of several days. The testtemperatures are then selected sufficiently high to obtain detectable results.
The formation of deposits, varnishes and lacquers at ambient or intermediate
temperatures are perhaps better represented by the _pecification for allowable gums,which ASTM D 1655-81 sets at a maximum of 0.07 kg/m (7 mg/100 mL), described in
specification D 381. This specification was developed to characterize storage
stability of a fuel, rather than the thermal stability. Present refinery practices
must comply with other Jet A fuel specifications, such as odor improvement, sulfur
reduction, organic acidity, color, gums and aromatics. On achieving these goals,
experience has shown (see ref. 13) that the fuel stability specifications are
automatically satisfied; and if for some reason an unusual jet fuel happens to be
beyond the thermal stability limit, it is sold instead as heating fuel. Thus, in
spite of the importance that thermal stability has to aircraft engine and fuel system
designers, refineries presently have to worry little, if at all, about meeting thespecification.
44
From the extensive effort conducted during the past twenty years in investigating
the cause and nature of thermal and storage instability, it is realized that the
phenomena, although very complex, are all related to fuel auto-oxidation (ref. 14).
The oxygen is present in the fuel in two forms: a) chemically bound oxygen, and b)
dissolved oxygen. The chemically bound oxygen occurs usually in the form of
hydroperoxides. These compounds are unstable, but at ambient termDeratures they may
remain in the fuel for long periods of time unless they are exposed to light and/or
to traces of some metals (copper or vanadium have been shown to accelerate
auto-oxidatlon). At the higher temperatures encountered in aircraft fuel/oil heat
exchangers, fuel control components, manifolds and injection nozzles, auto-oxidation
can proceed at a much faster pace. Whether one is concerned with storage stabilityor thermal stability, the formation of deposits has always been correlated with the
onset of fuel auto-oxidation. These deposits do not necessarily result from the
products of auto-oxldation themselves, but rather it is believed that the presence ofthe free radicals triggered by auto-oxidation are directly responsible for the chain
of reactions leading to the formation of sediments and deposits. An examination of
these deposits has shown that their hydrogen/carbon ratio is lower than that of the
fuel, and that the content of heteroatom compounds, i.e., oxygen, nitrogen, and
sulphur, is much higher than the average fuel content of those elements. This
suggests that the resonance stabilized free radicals derived from auto-o×idation are
more reactive with heteroatom compounds and unsaturated hydrocarbons. Quantitative
analyses have also shown that the dissolved oxygen participates very heavily in the
_ 37
1985010866-046

advanced stages of the oxidation process (see ref. 15). In brief, the formation of
sediments and deposits may proceed along the following li_Les. After an induction
period (nucleation) auto-oxldation commences on a series of active centers
: distributed on the fuel system surface, as well as in the bulk of the fuel. In the
case of thermal instability, and taki,g into account that most of the heat transfer
into the fluid occurs by heat conduction through the surfaces, it is improbable that
the active centers in the bulk of the fuel will significantly contribute to the
deposits; the phenomenon is clearly of a boundary layer type. The traces produced by
this first stage of auto-oxidation are still soluble in th_ fuel, and may d_ffuse
i throughout if the residence time is sufficiently long; they may remain in a thin
diffusion boundary layer near the wall if the flow velocity is sufficiently high.
Further oxidation, in which even the dissolved oxygen may participate, results in
products which are no longer soluble and appear in a solid phase as a sediment.
Current engine trends show that in the future, higher efficiency, higher power
density and lower emission requirements are going to come in conflict with fuel
thermal stability, even if present fuel specifications are not relaxed. This is
primarily due to three factors: a) the trend towards higher engine pressure ratios
and consequently higher air temperatures flowing through or about the injection
nozzles; b) tighter tolerances in the spray pattern which make t_.e nozzles more
vulnerable to incipient fouling; and c) the engine manufacturer's desire to take
advantage of the fuel flow to cool the engine oil, and thus redirect the oil heat
back into the engine in an attempt to improve the specific fuel consumption. This
latter approach results in fuel temperatures, at the high pressure shutoff valve,
manifold, and distribution valves, which are sufficiently high to experience (after
continuous operation in tropical climates) unusually high varnish and lacquer
formation rates on those component surfaces. If in addition to engine design trends,
the jet fuel specifications are broadened, it is certain that the thermal stability
could become a most limiting property.
One of the major drawbacks of the CRC Coker and JFTOT is that the behavior of
these Jet fuels in the fuel system and engine is not represented by laboratory tests.
There is underway a considerable amount of work in this area, supported by NASA, the
Air Force and the Navy, with the general objective of closing the gap between the
laboratory results and the fuel system design criteria. These efforts (ref. 16)
consist of modified laboratory tests under boundary conditions which approximate
those used in the fuel system. Other efforts (ref. 17) include fuel systems
; simulators provided with sophisticated instrumentation rigs able to capture depositsfor further laboratory analysis.
: For the purposes of this study, the fuel stability will be represented by the
JFTOT. A review of the literature, as well as some of the correlations attempted for
a variety of petroleum, shale oil and coal-derived fuels, has not shown a definite
range where the JFTOT breakpoint temperature would fall. This is mostly due to the
lack of current experience in present fuels. Assuming that future Jet fuel will have
a strong naphthenic base (such as the Alaskan North Slope crude), and that an extreme
situation could be incurred in which a diesel type fuel could be considered for
utilization as a Jet fuel, a JFTOT breakpoint of 204°C (400°F) was Jointly agreedf
upon by NASA and Lockheed for consideration in this study. It is understood,
however, that this is a severe relaxation from the present 260°C (500°F)JFTOTspecification and it is much below the 237°C (458.6°F) recommended for the ERBS
specification.
38
- ®1
1985010866-047

4.2.3 Aromatics. - ASTM D 1655-81 sets a maximum limit of 20 percent by volume
for aromatics. Up to 25 percent is permitted, provided that the supplier notifies
the purchaser of the volume, distribution and aromatic content within 90 days of
shipment• An increase in aromatics in a fuel increases the radiant heat transfer
from the flames in the combustor to the liner and reduces combustor llfe. A study of
the impact on the combustor when relaxinE the specification limits is beyond the
scope of this effort, and the primary interest here in connection with aromatics is
their deleterious effect on certain elastomers and other nonmetallic materials which
are used icL seals, membranes and filters throughout the fuel system.
It was found in ref. ii that the aromatics content is a dominant controlling
property, and its relaxation is expected to affect refinery output. The ERBS does
not recommend any specific value of aromatics but requires that it be determined by
test and reported by the refinery. There are reasons to believe that in the near
future, and more so towards the turn of the century, the aromatics content in fuels
will increase considerably. This projection is based on the fact that the present
trend in refineries towards the processing of heavier distillate fractions makes use
of catalytic, thermal, and hydrocracking, and results in the formation of a high
content of aromatics, which are then brought down to specification limits by hydro-
processing• This is the reason why some refineries are already ha_ing difficulty in
supplying jet fuels with aromatics content below 20 percent. In the future, however,
if shale oil and coal become important sources for jet fuels, hydrocracking will be
practiced in a much larger scale, resulting in substantially higher aromaticscontents. It is obvious therefore, that a modification in aircraft fuel systems,
allowing for the utilization of high aromatic fuels, will have a most significant
impact on fuel cost, energy savings and fuel availability. For this study a 35
percent maximum content in aromatics was selected for the purpose of studying the
fuel system materials compatibility• This figure appears to be represe" _ative of
refinery outputs that may be experienced before the turn of the century.
• 44.2 4 Viscosity. - Kinematic viscosity is related to the ability of the fuel _
system to pump the fuel and deliver it to the engine. The kinematic viscos½ty forJet A fuels is defined by the D 1655 specification to be not moregthan 8 mm /s (8cSt) at -20°C (-4°F). The ERBS recommends its new limit at 12 mm_/s (12 cSt) at
-23.3°C (-IO°F). The present specification freezing point of -40°C (-40°F),
translates into a 20°C (36°F) margin above the freeze point for measuring the
viscosity. In the ERBS the viscosity measurement temperature equals the freezing
point. Fuels may still be chilled below the freezing point before their flowability
Is severely impeded (pour point). The difference between the freezing point and pour
point varies from less than I°C (I.8°F) up to IO°C (18°F) depending on the type of
fuel. It is felt here that better reproduclbility in measuring the viscosity can be
accomplished if the freezing point is well below the measurement _emperature forviscosity. For example, the viscosity could be specified as 9 mm /s (9 cSt) at -8°C
(17.60F).
For the present study, however, it was proposed that the viscosity be relaxed
even further in order to explore the ability of the fuel system to pump fuels that
are heavy in aromatics and napthenics _ith distillation fractions as heavy as dieselfuel No. 2. A limiting value of 15 mm /s (15 cSt) at -17.8°C (O°F) was therefore
selected, which ensures that the fuel is in a liquid state when its viscosity ismeasured.
39
1985010866-048

4.2.5 Lubriclty. - This property is the ability of a fuel to minimize friction
and wear between moving adjacent surfaces in fuel system components. When two solid
surfaces slide over one another, the friction coeff, cient between them can be
dimJnished by the introduction of a liquid film. As the two surfaces are brought
closer by applying a normal load, the liquid film is squeezed out at a rate which Js
a functlon of its viscosity and surface tension. As long as the thickness of this
film layer _s above 0.5 or 0.6 pm, the sarfaces are said to be hydrodynamicallylubricated and the friction coefficient is independent of the film lubricity. When
: the film becomes thin to the point that it reaches less than 0.I _m (I000 angstroms),
the molecular structure of the film (as well as the solid surface texture and atomic
structure) become most d_mlnant in determining the friction coefficient. Tn the
extreme event that both surfaces become locally in contact, they heat locally and
melt, resulting in progressive wear. This regime is known as solid friction or
partial fluid friction. The thickness of the film layer depends on the normal load,
the relative speed between the surfaces, the degree of surface finishing, and the
concentration of polar molecules in the liquid.
Lubrlcity as a jet fuel property is not covered by present specifications, but in
those cases where the jet fuels are produced by intense hydrotreating, or whose
contaminants have been separated using clay filters, the lubrlclty has deteriorated
to the point of causing isolated but important cases of accelerated wear in the fuel
pumps, particularly those using sliding piston-cylinders. Hydrotreatlng appears to
reduce the number of functional groups in the polar molecules or their length, thus
reducing the lubricity of the fuel.
In those cases where poor fuel pump lubrlcity has been detected, it was found
that a corrosion inhibitor additive would resolve the situation. The problem would
also disappear when the steel cylinder sleeve was replaced by a highly carbon-treated
steel. Since unusual amounts of corrosion inhlbitors are incompatible with free
water removal methods, it is more desirable to cha_Ige the materials of the fuel pump
than to employ additives.
It is suggested in ref. 18 to utilize the Wear Scar Diameter (WSD) as obtained in
the Ball-On-Cyllnder Machine (BOCM) as a method and specification for ranking Jet
fuels according to their lubricity. The ability of this method to correlate fuel
lubriclty with fuel pump llfe will have to be determined by testing, but the method
seems to be able to distinguish between fuels provided with different lubrlcltyadditives.
Y It is consistent to assume that jet fuels with a higher end boiling point, from a
broad spectrum of crudes, will have a tendency to exhibit better lubricity. It is
also conceivable, however, that those occurrences encountered in Europe, where
lubrlcity w_. affected adversely because of intense hydrotreating (see ref. 19),could become a trend in the near future, in which case a lubrlclty standard may be
necessary. As suggested in ref. 18, a WSD of 0.45 mm could be representative of amarginal fuel lubrlcity, requiring special component design considerations.
4.2.6 Water separation. - Before a fuel Is delivered by the supplier, the
water is separated from the fuel by decantation and solvent extraction. In theory,
water is not soluble in hydrocarbons, but the presence of the functional groups and
peroxides retain water molecules dissolved in the fuel. The higher the molecular
weight of the fuel, as well as the higher the number of branches and naphthenic and
aromatic compounds, the larger will be the traces of polar molecules in the fuel, and
|
•_ 40
®t
1985010866-049

consequently, the higher water solubility. The capacity of a jet fuel to dissolve
water by means of such surfactants is detrimental to the fuel system, as an increase
in the number of ice particles is expected in the fuel at low temperatures, which
could in this manner affect filter matrices and produce wear in the pumps. The
requirements on the concentration of surfactants for water separation and lubricityare in conflict and need to be compromised.
4.2.7 Electrical conductivity. - From the point of view of aircraft safety, a
fuel with adequate electrical conductivity will prevent electrostatic discharges in
the fuel tank (localized sparking). The triboelectrlc charge separation, occurring
at the interface of a fuel and a solid surface, becomes evident when the fuel is in
relative movement with respect to the dielectric solid surface. Electrostatic
discharges in the fuel can cause a fire hazard. Aircraft Jet fuels sometimes use
antistatic additives to improve the fuel conductivity and eliminate the fire hazard.
A limit of 50-450 picosiemans per meter (pS/m) applies when an electrical conduc-
tivity additive is uged. Relaxing the end boiling point of a Jet fuel will result in
higher water solubility and therefore in a higher initial electic conductivity.
Relaxing the front end of the distillation curve has, however, the opposite effect.
The amount nf additive required in different cases Ks variable and impacts the costof fuel del_vered to the aircraft.
4.2.8 Flash point and vapor pressure. - The flash point is the temperature at
which a fuel exposed to air will form an ignitable mixture. This temperature does
not guarantee sustained combustion of the fuel, but only an initial flash after
ignition. This property is important because it is related to aircraft safety and
to engine re-light at altitude. Because of it_ relation to the volatile fraction of
the fuel (initial boiling point), it is anticipated that the flash point will be no
lower than the present D 1655 specification limiting value of 37.8°C (100°F). The
flash point is determined primarily by the front end of the distillation curve. This
fraction is presently at a premium in the fuel market for the manufacture of
gasoline. According to the refinery industry in the future there will be a decrease
in gasoline demand, and this could release large amounts of the volatile fractions.
As to whether 3uch an assumption is reasonable or not the concern is reflected in
the present study by extending the range of availability of Jet fuel on both ends of
the distillation curve. To this end a flashpolnt of 27°C (80.6°F), which is well
above the flash point of Jet B fuel, was agreed upon with NASA for this study.
The vapor pressure is closely related to the flash point in the sense that at a
given temperature the partial pressure of vapor fuel, in coexistence with the liquid
phase, is determined by the distillation curve (primarily by the front end). In Jet
fuels this property is given in terms of the Reid vapor pressure as measured by
specification D 323. The present specification for Jet A fuel has substituted the
flash point for the Reid va_or pressure limit. Jet B and JP-4 fuels use instead the
vapor pressure to specify the volatiles. This property is related to the tendency of
the fuel to form combustible vapors and lose volatiles through fuel air vents at high
altitude. ASTM D 1655 specifies a limit of 13.8 to 20.7 kPa absolute (2 to 3 psia)
for Jet B. In accordance with the flash point value of 27°C (80.6°F) selected above,the vapor pressure considered in this study will be assumed to be less than 13.8 kPa
absolute (2 psia).
; 41
1985010866-050
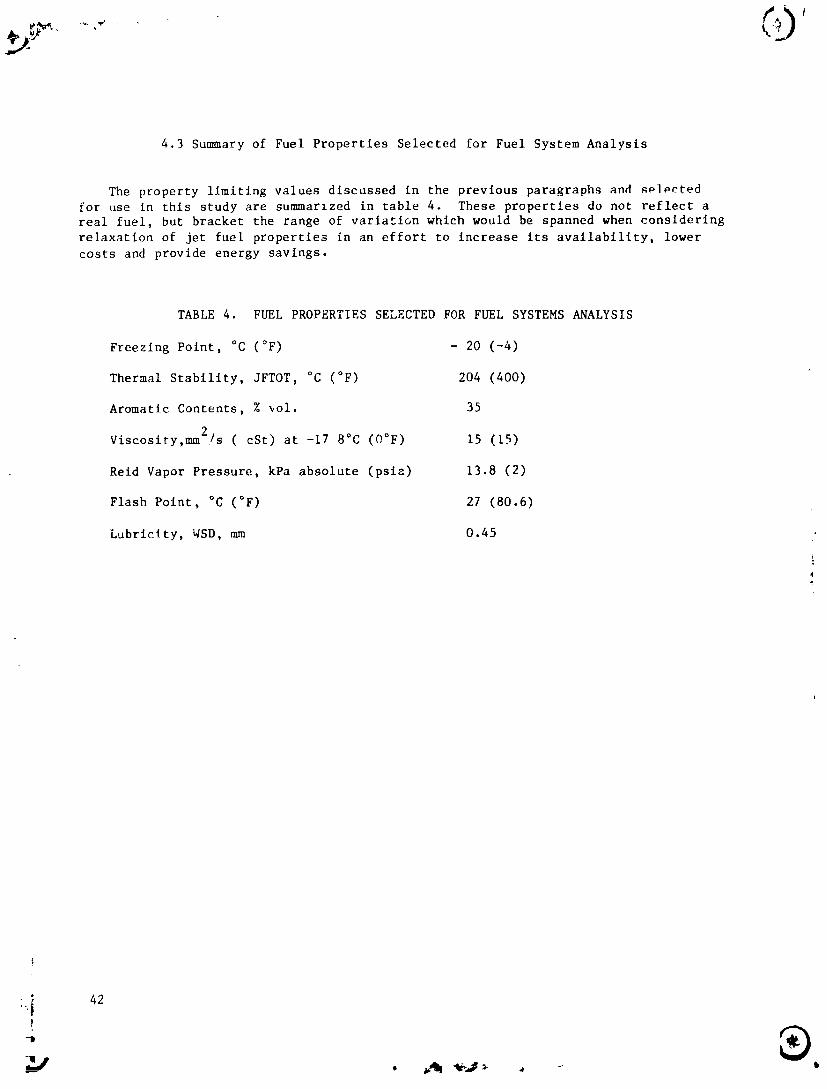
4.3 Summary of Fuel Propertles Selected for Fuel System Analysis
The property limiting values discussed in the previous paragraphs and _plp_ted
for use in this study are summarlzed in table 4. These properties do not reflect a
real fuel, but bracket the range of variation whlch would be spanned when considering
relaxation of jet fuel properties in an effort to increase its availability, lower
costs and provide energy savlngs.
TABLE 4. FUEL PROPERTIES SELECTED FOR FUEL SYSTEMS ANALYSIS
Freezing Point, °C (°F) - 20 (-4)
Thermal Stability, JFTOT, °C (°F) 204 (400)
Aromatic Contents, % _oi. 35
Viscosity,mm2/s (cSt) at -17 8°C (O°F) 15 (15)
Reid Vapor Pressure, kPa absolute (psia) 13.8 (2)
Flash Point, °C (°F) 27 (80.6)
Lubriclty, WSD, mm 0.45
_'i 42
1985010866-051
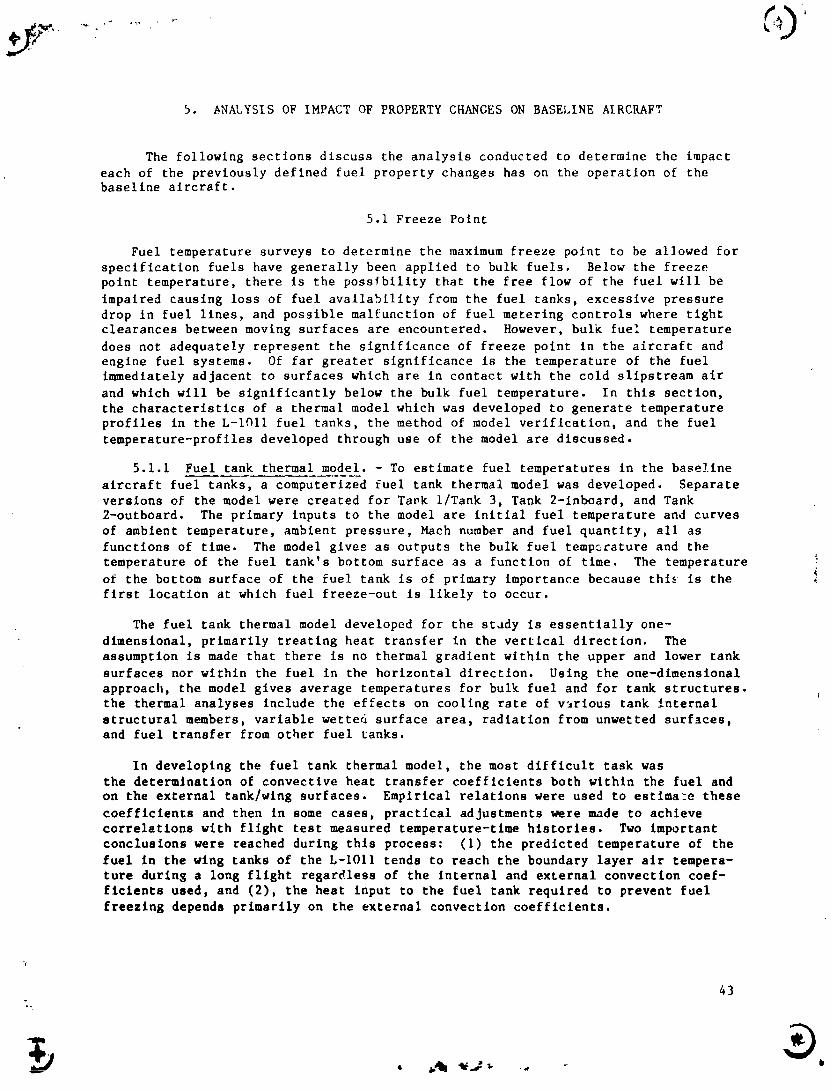
5. _N_.YSIS OF IMPACT OF PROPERTY CHANGES ON BASELINE AIRCRAFT
The following sections discuss the analysis conducted to determine the impact
each of the previously defined fuel property changes has on the operation of thebaseline aircraft.
5.1 Freeze Point
Fuel temperature surveys to determine the maximum freeze point to be allowed for
specification fuels have generally been applied to bulk fuels. Below the freeze
point temperature, there is the possibility that the free flow of the fuel will be
impaired causing loss of fuel availability from the fuel tanks, excessive pressure
drop in fuel lines, and possible malfunction of fuel metering controls where tight
clearances between moving surfaces are encountered. However, bulk fuel temperature
does not adequately represent the significance of freeze point in the aircraft and
engine fuel systems. Of far greater significance is the temperature of the fuel
immediately adjacent to surfaces which are in contact with the cold slipstream air
and which will be significantly below the bulk fuel temperature. In this section,
the characteristics of a thermal model which was developed to generate temperature
profiles in the L-lOll fuel tanks, the method of model verification, and the fuel
temperature-profiles developed through use of the model are discussed.
5.1.1 Fuel tank thermal model. - To estimate fuel temperatures in the baseline
aircraft fuel tanks, a computerized fuel tank thermal model was developed. Separate
versions of the model were created for Tark 1/Tank 3, Tank 2-inboard, and Tank
2-outboard. The primary inputs to the model are initial fuel temperature and curves
of ambient temperature, ambient pressure, Mach number and fuel quantity, all as
functions of time. The model gives as outputs the bulk fuel tempccature and the
temperature of the fuel tank's bottom surface as a function of time. The temperature
of the bottom surface of the fuel tank is of primary importance because thi_ is the 4
first location at which fuel freeze-out is likely to occur.
The fuel tank thermal model developed for the stJdy is essentially one-
dimensional, primarily treating heat transfer in the vertical direction. The
assumption is made that there is no thermal gradient within the upper and lower tank
surfaces nor within the fuel in the horizontal direction. Using the one-dimenslonal
approach, the model gives average temperatures for bulk fuel and for tank structures.
the thermal analyses include the effects on cooling rate of v_rlous tank internal
structural members, variable wetted surface area, radiation from unwetted surfmces,and fuel transfer from other fuel tanks.
In developing the fuel tank thermal model, the most difficult task wasthe determination of convective heat transfer coefficients both within the fuel and
on the external tank/wing surfaces. Empirical relations were used to estimale these
coefficients and then in some cases, practical adjustments were made to achieve
correlations with flight test measured temperature-time histories. Two important
conclusions were reached during this process: (I) the predicted temperature of the
fuel in the wing tanks of the L-IOll tends to reach the boundary layer air tempera-
ture durin$ a long flight regardless of the internal and external convection coef-
flcients used, and (2), the heat input to the fuel tank required to prevent fuel
freezing depends primarily on the external convection coefficients.
43
1985010866-052

The fuel tank thermal model was developed using the Lockheed thermal analyzer
program as the basic tool. Using this program, the solution to transient heat
transfer problems is effected by converting the three dimensional physical system
into an analogous electrical network of lumped thermal capacities (small volumes with
essentially uniform temperature) connected by thermal resistors. The resistors may
represent heat transfer by convection, radiation or conduction. Transient
temperature histories are computed u_ia_ the lumped-parameter, or finite-difference
approach by applying Kirchhoff's law at each lumo _node) of the R-C
(reslstor-capacltor) ele_trlcal analog network. By specifying any quantity as a
function of any other, it is possible to include the effect of various nonlinear
parameters, e.g., variable thermal properties and arbitrary boundary conditions as a
function of time and/or temperature.
The development of the fuel tank thermal model can be divided ir_to three parts,
modeling of tank structures modeling of external heat transfer, and modeling ofinternal heat transfer.
5.1.1.1 Modeling of tank structures: In the integral wing tanks of the L-lOll,
th= structural components which contribute most signlfica_tly to heat transfer are
the upper and lower wing surfaces, the stringers, the ribs, and the =pars. Of these,
the most dominant heat transfer contribution is made by the upper and lower wing
surfaces. These surfaces have the largest convection areas, the shortest conduction
lengths, and provide the most direct heat transfer paths from the fuel to the
freestream air. High convection rates exist in the vicinity of these surfaces both
on the fuel side and on the freestream air side. The stringers and ribs have a
significant effect on heat transfer because they act as fins adding convective areato the wing surfaces inside the tank. For example, in one location of the L-1011
fuel tanks, the stringers have the effect of adding 41 percent to the surface area.
The wing spars which form the fore and aft boundaries of the fuel tanks have a less
pronounced effect on heat transfer than the structural elements previously discussed.
This is due to the low air velocities in the wing cavities adjacent to the sparsforward and aft of the tank boundaries, and to the spar's relatively small convective
areas. The heat transfer through the spars which does occur is primarily the result
of convection from the fuel at the vertical spar surfaces and conduction through thespar structure to the upper and lower wing surfaces.
Figure 19 shows a general thermal analyzer R-C network representing a
section of the lower boundary of the fuel tank. In the model, this network is
simplified to the equivalent network shown in figure 20. The heat paths through the
various structures are computed using average values for the structural dimensions so
that this network represents a typical section of the lower boundary rather than a
specific location. An identically structured network is used to represent the upper
tank boundary wlch conduction resistors computed using the appropriate average
structural dimensions. These boundary networks allow the separate determination of
average temperatures in the surface, the stringers, and the ribs. The effect of heat
transfer through the spars is not treated directly but is included with that
through the upper and lower tank boundaries.
For use in a later section of this report, figure 21 shows the R-C network for
the lower boundary, modified to account for the presenc_ of insulation. The R-Cnetworks shown in both figure 20 and 21 can be used to model the addition of electric
loll heating. This is accomplished by adding a heat input into the heat balancecalculations performed at nodes a, b, and c.
44
1985010866-053

J/
i I i_ I
Figure 19 - General thermal analyzer R-C networkfor fuel tank lower boundary.
VV_
IFigure 20 - Simpllfled scheaatlc of wing fuel tank lower surface model.
45
Q i.'lil "li,.,ltl• . _ •
1985010866-054

Figure 21 - Simplified schematic of wing fuel tanklower surface with insulation.
5.1.I.2 Modeling of exte,qal heat transfer: For the integral wing tanks of thebaseline aircraft, the upper and lower surfaces of the wing form the respectiveboundaries of the fuel tanks. The external heat transfer from the fuel tank_
therefore consists of convection from the wing surfaces to the boundary layer air
stream and radiation from these surfaces to the surrounding environment.
The convective heat transfer falls into the well documented regime of forced
convection. In the modcl, average convectlon coefficients were compute( separatelyfor the upper and lower surfaces of the wings. These coefficients were computed
continuously throughout a simulated flight using flat plate relationships. Because
the leading edges of the fuel tanks lie beyond the point of tranststlon to turbulentflow, turbulent flow relationships were used. Average values of pressure coef-
ficients were estimated for the upper and lower wing surfaces near the center of each
fuel tank using flight test data measured under cruise condlctor_. These pressure
coefficients were u_ed in the model with free stream pressure and velocity to computeaverage values of local pressure and velocity. The local pressure and velocity were
used with the air film temperatuce and the tank's position in the wings to computethe average convection coefficients.
R_diation heat transfer between the wing surfaces and the sky and ground areaccounted for in the model as is solar radiation to the upper surface. Compared to
the convective heat transfer, the contribution o_ radiation is relatively minor. The
variables affecting radiation are the emissivity and absorptivity of the surface, theground and sky temperatures, and the upper and lower surface te=peratu_es. Anemissivity of 0.18 was used in the model for the wing surfaces. This value corres-ponds to unpolished and unpainted aluminum. A corresponding absorptivity of 0.50 was
;_ 46
i "O
1985010866-055

used for the upper wing surface in computations of solar heating. A ground
temperature of IO°C was used for the validation flight cases in which the actual
ground temperature was not recomded. For the contract missions, the ground tem-
perature used is that given by the appropriate mission temperature profile shown in
Section 3.2. The sky heat sink temperature is assumed to be -273°C for all cases.
Solar heating of the upper wing surface was considered in the valldat_on cases. For
the contract missions, however, solar heating is not considered so as to produce the
lowest fuel temperatures which would occur at night.
The upper and lower surface temperatures were computed by the model using heat
balance calculations which include the previously discussed modes of heat transfer
pl_s heat transfer within the tank.
5.1.1.3 Modeling of internal heat transfer: The model of the interior of the
fuel tank considers the variable heat capacity of the fuel and heat transfer from the
fuel to the inner tank structure by convection and radiation. In addition, the model
considers the effects on fuel temperature of fuel transfer from other fuel tanks.
The entire heat capacity of the fuel is treated as a single thermal unit. This
method of analysis requires the assumption that all of the fuel in the tank exists at
a single 'bulk fuel temperature" at any given point in time. This assumption is
supported by the limited data obtained in L-1011 flight tests (reference 20). The
fuel temperature profiles in a vertical section were recorded as functions of time.
The results show that the temperature of most cf the fuel within the vertical section
does fall within a narrow range, although the percentage of the total fuel within
that range varies with cooling rate and fuel height. Layers of cooler fuel at the
top and bottom of the fuel remain relatively thin most of the time.
An important consideration in predicting the rate of heat transfer to the fuel isthe area of the tank surfaces in direct contact with the fuel. Since this wetted ;-
surface area varies with thc quantity of fuel in the tank, it will decrease as fuel _4
is consumed by the engines during the flight as will the quantity of bulk fuel.
Heat transfer from the fuel to the colder tank structure consists of convection
_ within the fuel and radiation and convection across the ullage space above the fuel.
While the model consider3 all three modes of heat transfer, convection within the
fuel Is by far the most dominant mode.
The analysis of convection within the fuel is broken down into separat
computations for each ol the main structural components, the upper and lower surface,
the stringers, and the ribs. Only the portions of each of these structures that are
_ actually in contact with fuel at a given time are considered in the computations.
Separate convection coefficients are computed for the upper ard lower tank
structures. The available relatioas for horizontal flat plates were used to estimate
these coefficients. Empirlcal adjustments obtained in correlations of temperature
predictions with flight test data were then made to the estimated coefficients.
Further discussion of these convection coefficients is given in the followingsection.
5.1.1.4 Correlation of model _emperat',-e predictions with flight test data: The
validity of the fuel tank thermal model waJ verified tsing flight test data obtained
unde_ NASA contract (reference 20). Flight tes*s were conducted in which time
dependent vertical temperature profiles were obtained for two L-lOll fuel tanks,
47
1985010866-056

Tank 1 and Tank 2R-inboard. For Tank i, temperature profile data were obtained in
cases where fuel was withdrawn from the tank during the flight and in cases where the
tank remained full of fuel. For Tank 2R-inboard, applicable data were obtained only
for cases in which the task was maiatained approximately 90 percent full of fuel.
The first step in the valldatioa of the fuel tank model was to verify that the
temperature predictions showed the proper trcnds and roughly the proper temperatures.
Figures 22 and 23 show that the proper trends were given by the model in correlations
? of predicted temperature with flight test temperature-time histories. In the
figures, the predicted and actual bulk fuel and lower surface temperatures in Tank I
are shown. Figure 22 gives the results for a flight in which Tank 1 remained full of
fuel, figure 23 for a flight in which the tank was emptied.
The second step in the validation of the model was to make adjustments to the
estimated convection internal and external coefficients to improve the correlations.
The required adjustments were different for Tank 1 and Tank 2R-inboard. Most of the
\ required adjustments were not more than 25 percent of the original values given by
the empirical relations, which is generally within the accuracy of these relations.
However, two cases emerged in which significant changes were required.
The first case in which a significant modification to the convective heat
transfer computation method was required occurred inside Tank i. While satisfactory
correlations of bulk fuel and lower surface temperatures were given by the model for
cases in which the tank remained full of fuel, in all cases in which the tank was
emptied, the recorded temperature of the lu _r surface was found to be higher than
that predicted by the model. Since the thermocouple rake in Tank 1 was in the
vicinity of the fuel pumps, it is hypothesized that warmer fuel from the bulk was
mixed with that near the surface resulting in higher recorded surface temperatures in
this area. Further investigation showed that a good correlation for lower surface
temperature was obtained, for cases in which fuel was withdrawn, by the addition of a 4
local i,ternal convection coefficient used only in the computation of the lower _.
surface temperature. This local internal convection coefficient is higher than the
overall internal cenvection coefficient in order to account for the high degree of
. motion in the fuel in the vicinity of the fuel pumps. Because the higher surface
temperature recorded in the vicinity of the fuel pumps is believed to be a localized
effect, the lower surface temperature _ edictions for the study missions, which are
to be representative of the entire low r surface of the tank, were computed without
the higher local convection coefficiert.
" The second case where a significant modification to the convective heat transfer
computation was required occurred inside Tank 2R-inboard. It was found that a
convection coefficient significantly higher than that given by the empirical
relations was required to obtain a good correlation of both lower surface and bulk
: fuel temperatures with flight test recorded temperatures. This was true for all of
the test flights that were analyzed. The higher than estimated convective heat
transfer to this surface is incurred because fuel sloshing within the tank is more
prevalent in Tank 2-inboard due to its shape and the continual flexing it experiences
because of its position further from the aircraft's center of gravity. Sloshing
within the tank would tend to increase the rate of heat transfer from the fuel to the
: lower svrface by mixing warmer bulk fuel with the colder layer of fuel near the lower
surface. Further investigation showed that a constant value of internal convection
coefficient applied to the lower tank surface of Tank 2-inboard consistently gave
) satisfactory tlme-temperature correlations for all flight tests. For the studymissions, it was premised that the same value of convection coefficient was
applicable.
: 48
1985010866-057
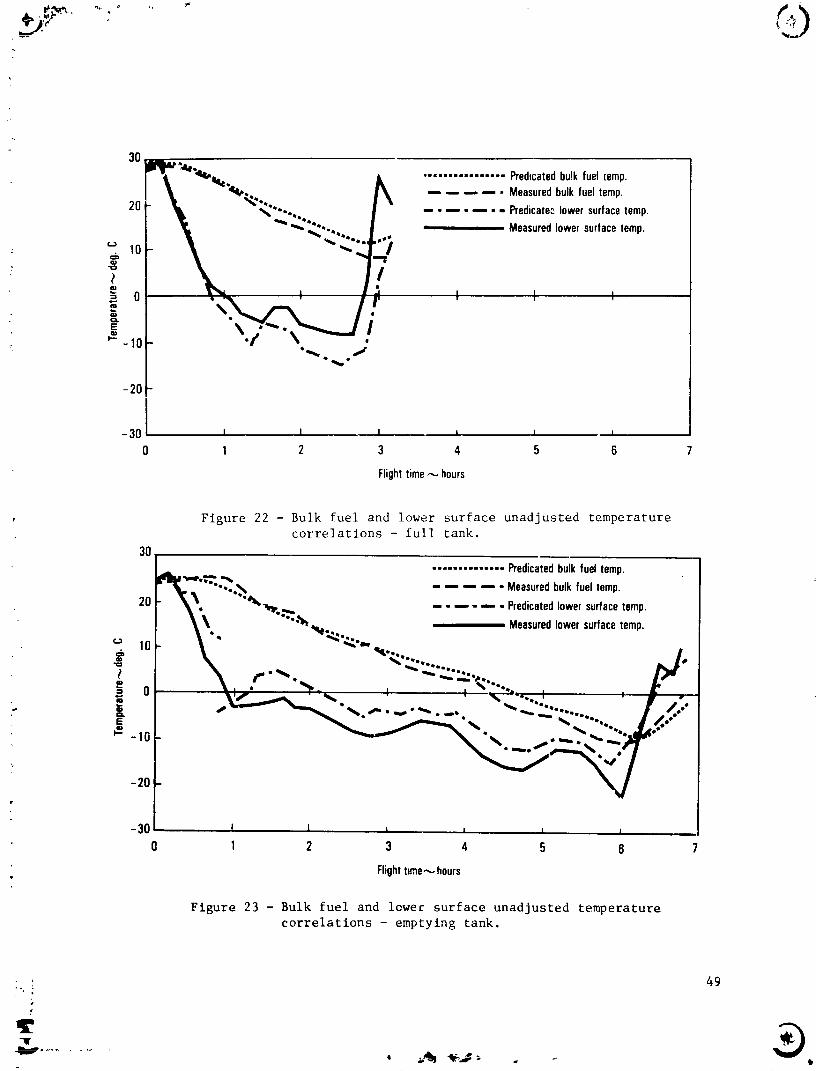
_ 30
",le,._ ................ Predicatedbulkfuel[emp...... Measuredbulkfueltemp.
20 "o... ....... Predicateslowersurfacetemp., Measuredlowersurfacetemp.
o,o\. .._
°tl ' ' '_- -10
-2Ol-
-30 I l z = J J0 1 2 3 4 5 6 7
Flighttime---.hours
, Figure 22 - Bulk fuel and lower surface unadjusted temperaturecorrelations - full tank.
3O
'_J_'_'_"-.="_ i" ............ Predicatedbulkfueltemp._iC,_ °°°%_, .... Measuredbulkfueltemp.
20 _ • '_b.,,,_,°,%_,, ...... Predicatedlowersurfacetemp.
_. ""_'_e-. Measuredlowersurfacetemp.
i 10 __ '_'44.'I-_1 '.......
o _.,_" _._ , ,"_'--_. , , • .." ""-'-- _ "__-'.-,"-.-, _-._."....... I_G-"
_" ___',, ,,_'...... j,._."
-20
-30 I 1 , _ , j
0 1 2 3 4 5 6 7
Flightteme_-,hours
Figure 23 - Bulk fuel and lowec surface unadjusted temperaturecorrelations - emptying tank.
_ 49
#
_="............ -O
1985010866-058

Since flight test data are not available for the determination of internal and
external convection coefficients for Tank 2-outboard, it must be assumed that those
determined for Tank 2-inboard are also applicable to Tank 2-outboard. This premise
is justified because Tanks 2-inboard and 2-outboard have similar geometries and
because both are located in the outboard portion of the wings.
Figurp_ 24 through 28 show corrected correlations of predicted bulk fuel and
lower tank skin temperature-time histories with flight test measured results. Figure
24 shows the correlation obtained for Tank i in a flight in which the tank remained
full of fuel. The prediction of the lower skin temperature tended to lead the
recorded temperature during the initial climb and final descent phases of the flight.
This effect is a result of the modeling technique in which all of the thermal mass of
the fuel is treated as a single concentrated homogenous unit. During these periods
of rapid temperature change, a thickening of the temperature stratification layer is
observed in the measured vertical temperature profile accounting for some deviation
: from predicted results obtained by the bulk fuel concept used in the model. A
greater thermal lag actually exists in the vicinity of the lower skin than is
considered by the model. However, during the cruise portions of the flights, a more
pervasive bulk fuel temperature is established in the fuel tank increasing the
accuracy of the bulk fuel concept. The temperature transient observed in the lower
skin temperature between the second and third hours of the flight were caused by a
0.16 drop in Mach number.
Figures 25 and 26 show the correlations obtained in Tank I for two flights inwhich fuel was withdrawn from the tank. Again, the tendency of the predicted lower
skin temperature to lead the actual temperature can be observed. The good
correlations achieved in these two cases demGnstrate the validity of the model's
treatment of the changing wetted _urface areas inside the tank as fuel is withdrawn.
The correlation shown in figure 24 for a case in which the tank remained full of
fuel supports the validity of the overall heat transfer analysis but does not
indicate whether the separate heat transfer rates computed for che upper and lower
tank surfaces are properly proportioned. Since the lower surface is the only
significant heat path when the tank is partially filled, the later portions of the
correlations shown in figures 25 and 26 for cases in which fuel was withdrawn sb
the validity of the lower surface heat transfer analysis.
The periodic temperature transients observed in figure 25 were caused by the
aircraft's repeated traversing through a weather front. It is not known what caused
the temperature transients observed in figure 26. It appears, however, that the
recorded temperature profiles tend to approach the predicted profiles toward the end
of the flight where the transients were not present.
Figures 27 and 28 show corrected correlations obtained for Tank 2-1nboard. In
both cases, the tank was maintained approximately 90 percent full of fuel throughoutthe cruise portion of the flight. The temperature transients observed in the
recorded lower surface temperature during the first two hours of the flights were
apparently caused by aircraft maneuvers which resulted in mixing of the warm bulk
fuel with the colder fuel layer near the lower surface. In figure 27, the
temperature transient observed in the predicted lower surface temperature at
approximately 4.5 hours into the flight was caused by a change in altitude. As
before, the predicted lower surface temperature tended to lead the measured lower
surface temperature during the rapid change in ambient temperature.
5O
_'_
D
1985010866-059

I
4T
30r.._i= _,. _.._ _iL ............... Predicatedbulkfueltemp.
Lk:"- I' .......20 , Predicatedlowersurfacetemp.
° _). "--44.- ...... ,.=,.o,ow._,,,,..,..
. I;:i_ 0 " ,.m,= I ' I I I
-20 I-30 I I i t _ I0 1 2 3 4 5 6 7
Flighttime_,_hours
Figure 24 -- Tank-i bulk fuel and lower surface corrected temperaturecorrelations - full tank, flight T-1686.
30
................. Predicatedhulkfueltemp•
\ - -.- - Measuredbulkfueltemp.2O
li_i_)l_ i I • Predicatedlowersurfacetemp..'_._% ..... Measuredlowersurfacetemp.r_3
_o ' ' '. .'"' ' . '1,?1
-30 i i i i _ i _ I0 1 2 3 4 5 6 7
Flighttime---hours
Figure 25 - Tank-I bulk fuel and lower surface corrected temperature
correlations - emptying tank, flight T-1640.]
51
®
1985010866-060

3O/
;' [_Lr:V'"_"o_ ................ Predmatedbulkfueltemp.1 ""-.':x20 J'- _'t "t=_..o"*. _ -.,. n -- Measuredbulkfueltemp.
= L_" °°°'_" i ,,, Predicatedlowersurfacet_.mp.
• _ I_"_® 100 _,b__/o 8'"t_" --i" ......t MeasuredlowersurfacetemP.i I=E'- -10 -
-20 -
-30. i i l i A I0 I 2 3 4 5 6
Flightt,me_h0urs
Figure 26 - Tank--1 bulk fuel and lower surface corrected temperaturecorrelations - emptying tank, flight T-1676.
30
I_'-o.... - ........ temp. 4Predicatedbulkfuel
_ _ "°.. -- .-,-- Measuredbulkfueltemp.
20 - X °'%t .--.----- Predicatedlowersurfacetemp."_'_. _ -,-, - ,,,-,. Measuredlowersurfacetemp.
_, 10- . ,p_,._
_ -19
-20 -
I I L I I I-30 0 1 2 3 4 5 6
Flighttime-,hours
Figure 27 - Tank-2 inboard bulk fuel and lower surface corrected
temperature correlations - 90% full, flight T-1653.
?
._ 52
1985010866-061

30 . -- -- Predictedbulkfueltemp.
o,_'_'_. ....... Measuredbulkfueltemp
201 _i___'.o>_...._..,o,,._.._ / --Predicted lowersurfacetemp.
-- - -- Measuredlowersurfacetemp.
10
, , ,
E-_o -
-20 -
-3O I 1 1 1 I 10 1 2 3 4 5 6
Fhghttime_hours
Figure 28 - Tank-2 inboard bulk fuel and lower surface corrected
temperature correlations - 90% full, flight T-1676.
5.1.2 Fuel tank predicted temperatures. - To determine the impact of the use of
the high freeze point fuel on the operation of the baseline aircraft, predictions offuel temperature-time histories were required for each of the three cold daymissions. The fuel tank thermal model discussed in the preceding section was used to
generate these temperature-tlme histories. Using the mission profile data presentedin Section 3.2, including altitude, Mach number, ambient temperature, and fuel
quantity as functions of time, the model gave predicted bulk fuel and tank lower skin
temperature for each of the fuel tanks.
Since it is within the cold fuel layer on the lower tank wall that the first
accumulation of fuel freeze-out occurs, emphasis is placed on the predicted
temperatures of this layer of fuel. Although the fuel tank thermal model actuallygives the temperature of the aluminum structure of the lower tank boundary, this is
very nearly equal to the temperature of the adjacent fuel. In the discussions that
follow, the lower surface temperature given by the model is used to express thecoldest and most critical fuel temperature.
The predicted bulk fuel and lower surface temperatures for the 9260 km (5000
n.mi.) mission are shown for Tank i, Tank 2-inboard, and Tank 2-outboard in
figures 29, 30, and 31, repectively. An initial fuel temperature of -17°C (I.4°F)which is 3°C above the freezing point of the fuel, was selected for the cases shown
in the figures. The selection of this initial temperature and its effect on the
overall fuel temperature profile is discussed later in this section. The figures
show that the bottom surface temperature is lower than the bulk fuel temperaturethroughout most of the flight. The exceptions are i), between the first and second
hour of the mission, a period during which the aircraft climbs through a thermai
53
!
1985010866-062
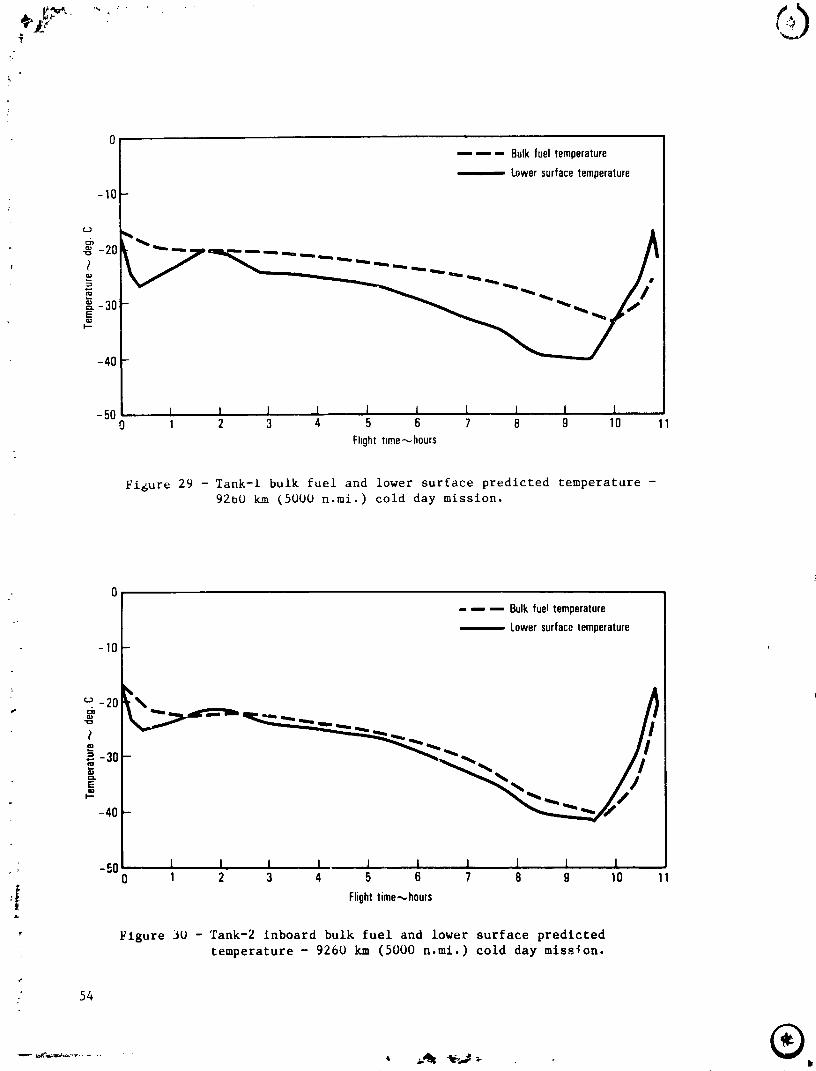
O|f ---- BulkfueltemperatureLowersurfacetemperature
-10
-20
m
-30+
-40
-50 I I I 1 1 1 I 1 1 1 [ I0 1 2 3 4 5 6 7 8 9 10 11
Flighttlme_,-hours
Figure 29 - Tank-I bulk fuel and lower surface predicted temperature -9260 km (5OOO n.mi.) cold day mission.
0
- _ -- Bulkfueltemperature
-- Lowersurfacetemperature
-10
• ; -50 I I_ l I I I J ] I I0 1 2 3 4 5 6 7 8 9 10 11
: L Flighttime-_hours-I
r Figure 3U - Tank-2 inboard bulk fuel and lower surface predicted
+ temperature- 9260 km (5000 n.ml.) cold day mlss+on.
+ 54
A
1985010866-063

-- ---- Sulkfuel temperature-10
-- Lowersurfacetemperature
-20
7
_-3o- _ ,_ I 1- //'-40 - _ , /
-50 I I I I 1 I I I 1 ]0 1 2 3 4 5 6 7 8 9 10 1
Flighttime.-,,.hours
Figure 31 -Tank-Z outboard bulk fuel and lower surface predicted
temperature - 92b0 km (5UO0 n.ml.) cold day mission.
inversion layer built into the ambient temperature profile, and 2), during the
descent at the end ot the mission. In all tanks, the lower surface temperature tends
to approach the recovery temperature.
.- The figures show that the spread between the bulk fuel temperature and the lower
surface temperature is quite different in the different fuel tanks. In Tank 1 which
has a relatively low surface to volume ratio, the temperature spread is relatively
large. In Tanks Z-inboard and Z-outboard both of which have much higher surface to
volume ratios, the temperature spread is much less. For all missions, the bulk fuel
and lower surface temperatures in Tank Z-outboard are consistently lower than the
correspondin_ temperatures in the other two tanks. Therefore, Tanks 2-outboard,left
and right are considered to be the most critical fuel tank in regard to fuel
freezing.
The lower surface temperature-tlme histories in Tank 2-outboard for the 926,
37U_, and 9ZbU km (SUO, 2000, and 5000 n.mi.) cold-day missions are shown in figure
JZ. as expected, progressively lower minimum fuel temperatures are attained as the
mission length is increased. However, the difference between the minimum temperatures
attained in the various missions is not as large as may have been anticipated. Thisis due to the lower fuel quantities carried on board for the shorter missions. The
reduced fuel quantity provides less thermal mass in the fuel tank and results in an
increased rate of change in temperature.
The effects of initial fuel temperature on the lower surface temperature-time
histories in Tank 2-outboard are shown in figure 33. For each of the three cold-day
missions, temperature profiles are shown for initial fuel temperatures of -17°C and
55
2J
1985010866-064

. ,%)7
0
/ ,JfbO _m ,%{H][J_lmk,g_,t' ',,, ,,,,_,on
2 I0 / II ............ q2,_km _qO[7f,m,, gulddaym,ss,onI
,°
: I
40
1 2 3 4 5 6 7 8 g 10 1"
FILqhllime_hour',
Figure 32 - Tank-2 outboard lower surface predicted temperature -926, 370/+, and 9260 km (500, 2000, and 5000 n.mi.)
cold day missions.
1g b
oL-'l ...... 9260 km, TimI - ]50' C
-10i L -- 9260 km, T,mI --1}0 C
1
I0 , I :4
_ 0 + +-- -I - - 3204km T_mt " 150 C I"*
'= -10 _-.. --- 3204kmt,,,, - 170 ¢5
-20
'-" -30 "" _
]_ -40: ....... -" _ "-" - ..........
p.
10
0. ---- 926km lmH - 150 C
-10 _ I" 925km l,mt - _70 C
- 20 _ ,','•, • • Ij
- 30 " ",4:
0 I 2 3 4 5
Fhgh!lbme hours
, Figure 33 - Tank-2 outboard lower surface predicted temperature -
_ +15.0 and -17.0°C initial fuel temperature.
.lk
&.j .........
1985010866-065

+ 15°C. The impact of the initial fuel temperature on the minimum lower surface
temperature varies with mission length from a 6.7°C temperature difference in the
926 km (500 n.mi.) mission to an insignificant temperature difference after thefourth hour in the 9260 km (5000 n.mi.) mission. The results of this study show that
with a 15°C initial fuel temperature, a fuel with a freeze point of approximately
-29°C would be required for the 926 km (500 n.m[.) mission and a _reeze point of
approximately -37=C would be satisfactory _or the 3704 km (2000 n.mi.)mission.
However, the study results suggest that for the 9260 km (5000 n.mi.) mission, no
freeze point advantage could be obtained by maintaining any reasonable initial fuel
temperature.
5.1.3 Effects on baseline aircraft performance. - The low fuel temperature of
-41°C predicted in the previous section for an extreme cold day (figure 32) is
representative of the minimum temperatures expected with a probability of occurring
one day per vear based upon statistical summaries of data recorded by IATA member
airlines (reference 21). The airlines have experienced little difficulty with these
temperatures while using ASTM D 1655 specification fuels. In considering an increase
in fuel freeze point to -2o°C= it i_ recognized that fuel freeze-out will occur.
Consequently, the changes in the physical properties of the fuel must be thoroughlyunderstood in order to evaluate the impact of these changes on the baseline airplane
performance.
Although the initial freeze--out occurs at the bottom of the tanks coating the
skin with a thin layer of wax, most of the minute wax particles which constitute
freeze-out remain dispersed In the liquid fuel and rarely affect the aircraft
performance. However, as the freezing process continues, fuel in the form of wax
particles agglomerate and fall to the bottom of the tar_k forming a matrix which traps
additional liquid fuel. The total mass of the wax and trapped liquid fuel can be
many times that of the wax alone. This combination of wax and trapped fuel, referred
to as hold-up, remains unavailable to the engines. In extreme cases, the wax couldblock the fuel tank exits rendering large quantities of fuel unavailable to the
engines.
Agglomerated wax particles in the fuel stream can create blockage in scavenge
ejector motive flow filter screens and can slow down the response rate of close
tolerance valves. For components which are normally shut down in flight, the problem
is more acute. For example: in normal operation of the aircraft, the APU is shut
down shortly before takeoff. The APU remains shut down throughout the flJght unless
it is required as an emergency power source. Since the APU compartment and the fuel
lines from the wing fuel tanks are not heated, the possibility of these components
becoming blocked by frozen fuel exists. This occurrence would cause the APU to be
inoperable at the end of the flight and unreliable as an emergency power source inflight.
On rare occasions, situations arise when it may be desirable to shut down an
engine while in flight but retain the option to restart the engine prior to landing.
An example of such a situation would be the occurrence of a warning indication on an
engine monitoring instrument. In this case, it is likely that the shut down engine
would be restarted prior to landing and held in reserve in case the landing had to be
aborted. If an engine were shut down in flight, the temperature of the fuel in some
of the engine fuel system components would drop very quickly. Thus, the possibility
exists that frozen fuel could block the engine fuel system and prevent the engine
from being restarted.
1985010866-066

In the fuel tanks, small amounts of fuel hold-up could be tolerated as part of
normal operating procedures. This would be true if extra fuel were carried on board
to maintain the required quantity of usable fuel. However, a practical procedure for
predicting hold-up or for measuring hold-up in flight must be developed for this
practice to be feasible. For the present, changes in the normal operating procedures
of the baseline aircraft will be considered to eliminate the possibility of hold-up
in the fuel tanks. For safety reasons, frozen fuel must no_ affect the operatiou of
the other vital fuel system components.
The options available consist primarily of placing restrictions on the minimum
initial fuel temperature and adiabatic wall temperature established by Mach number
and ambient air temperature. Figure 33 indicates tha _ _:_initial fuel temperature of
15°C is not sufficiently high to prevent freezing of the -20°C freeze point fuel even
=or the short range mission, lnitial fuel temperatures higher than 15°C are not
considered practical as a standard requirement for winter operatiop. It is apparent
that for the ambient temperatures considered in this study, a restriction on the
minimum initial fuel temperature would delay but not prevent fuel freeze-out in the
fuel tanks. Of course, restrictions on initial fuel temperature weuld do nothing to
prevent fuel freezing in inoperative engine and APU fuel systems.
The restrictions on the allowable combinations of Mach number and ambient
temperature to pre_ nt fuel freezing are dependent upon the a.:mospheric conditions
encountered in flight. These restrictions can be evaluated in terms of the adiabatic
wall temperature. The adiabatic wall temperature is the temperatare of the boundary
layer air stream adjacent to external surfaces of the aircraft. Since the boundary
layer is the primary heat sink to which aircraft heat is rejected, the adiabatic wall
temperature is very nearly the lowest possible temperature obtainable by any aircraft
component. Radiation to the environment, the other normally considered mode of heat
rejection is nearly inslgnificant under the conditions of subsonic commercial
aircraft flight. Therefore, if the aircraft is operated under flight conditions such
that the adiabatic wall temperature exceeds the freeze point of the fuel, then the
possibility of fuel freezing is eliminated.
For any given ambient temperature/altitude profile, there is a locus of altitude,
Mach number combinations which give an adiabatic wall temperature equal to the freeze
point of _ specified fuel. In figure 34, li. es of constant adiabatic wall tempera-
ture equal to the -20°C freeze point for che study fuel are shown for three ambient
temperature profiles, ISA Day, and the 50 percent and 0.3 percent probability days
discussed in Section 3. Aircraft operation at altitude/Mach combinations on or to
the right of these lines would prevent fuel freezing during flight in the respectiveenvironments.
However, the maximum Mach number allowable at various altitudes is restricted by
both legal and aircraft operating limitations. The maximum Mach number as a function
of altitude for the baseline aircraft is indicated in figure 34 by the dotted llne.
Below 3048 m (lO,O00 ft), the llne indicates the maximum legal calibrated airspeed of
129 m/s (250 kt). Above 3048 m (I0,000 ft), the line indicates the structural
limitations of the aircraft. This Mach limit is valid for all three ambient
temperature profiles since the legal and structural limitations are independent of
atmospheric conditions.
58.!!
__. ®
1985010866-067
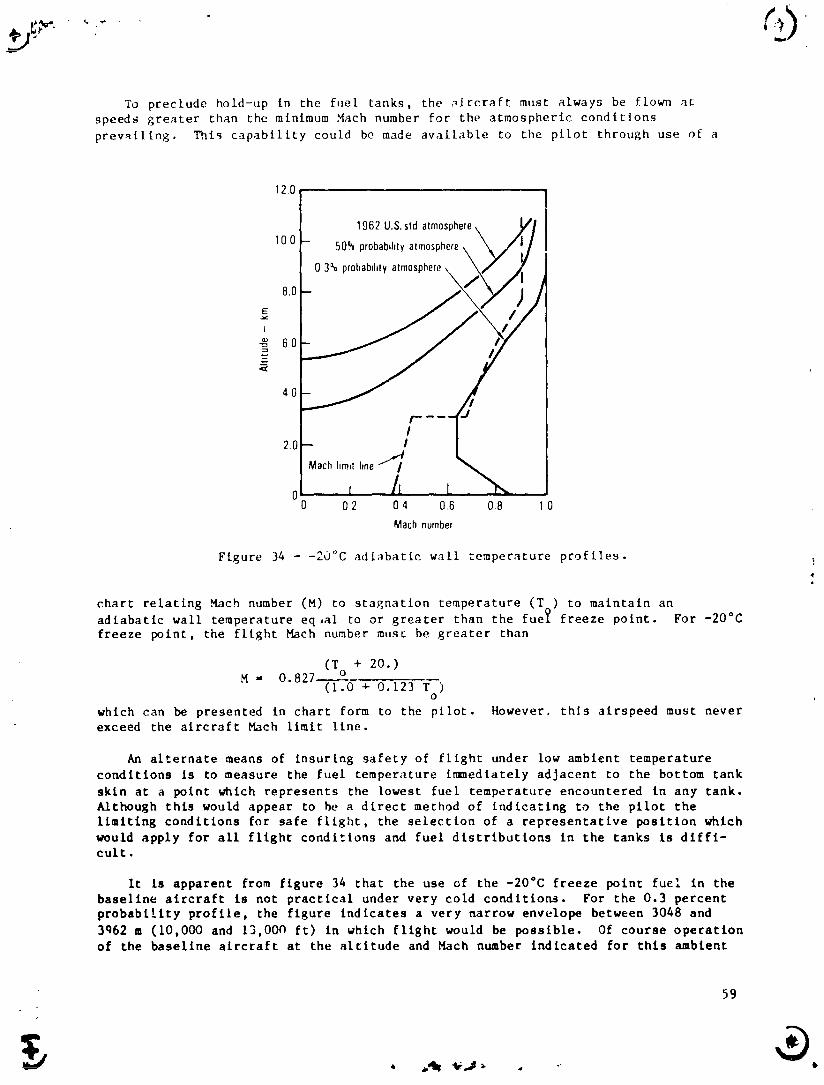
To preclude hold-up in the fuel tanks, the _ircraft must always be flown at
speeds greater than the minimum Mach number for the atmospheric conditions
prevailing. This capability could be made avaliable to the pilot through use of a
12.0
1962 U.S.std atmosphere_ Z/
100 - 50% probab,htyatmosphere_ V'_
8.0 _03, probab,htyatmosphere.. /_
I
-_ 60
40
20
Math hmJtline 1t7
o x 11 L0 2 0 4 0.6 0.8 0
Macb number
Figure 34 - -20°C adiabatic wall temperature profiles.
chart relating Mach number (M) to stagnation temperature (T) to maintain an
adiabatic wall temperature eq,al to or greater than the fue_ freeze point. For -20°C
freeze point, the flight Mach number must be greater than
(T + 20. )M - 0.827- o
(I.0 + 0.123 T )O
which can be presented in chart form to the pilot. However. this airspeed must neverexceed the aircraft Mach limit llne.
An alternate means of insuring safety of flight under low ambient temperature
conditions is to measure the fuel temperature immediately adjacent to the bottom tank
skin at a point which represents the lowest fuel temperature encountered in any tank.
Although this would appear to be a direct method of indicating to the pilot the
limiting conditions for safe flight, the selection of a representative position which
would apply for all flight conditions and fuel distributions in the tanks is diffi-cult •
It is apparent from figure 34 that the use of the -200C freeze point fuel in the
baseline aircraft is not practical under very cold condition_. For the 0.3 percent
probability profile, the figure indicates a very narrow envelope between 3048 and
3q62 m (I0,000 and 13,000 ft) in which flight would be possible. Of course operation
of the baseline aircraft at the altitude and Mach number indicated for this ambient
: 59
1985010866-068
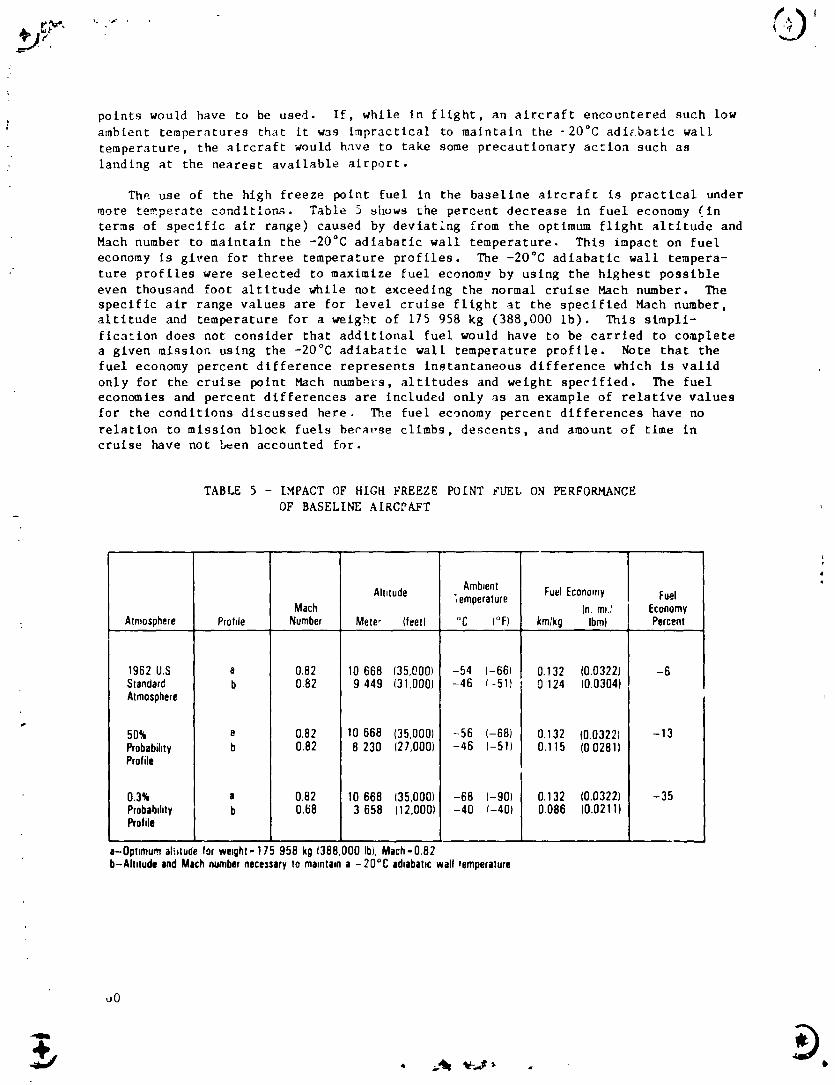
points would have to be used. If, while in flight, an aircraft encountered such lowambient temperatures that it was impractical to maintain the -20°C adl_batlc wall
temperature, the aircraft would have to take some precautionary action such as
landing at the nearest available airport.
The use of the high freeze _int fuel in the baseline aircraft is practical under
more temperate conditlo_. Table 5 _hows the percent decrease in fuel economy (in
terms of specific air range) caused by deviating from the optimum flight altitude and
Mach number to maintain the -20°C adiabatic wall temperature. This impact on fuel
economy is given for three temperature profiles. The -20°C adiabatic wall tempera-
ture profiles were selected to maximize fuel economy by using the highest possible
even thousand foot _titude while not exceeding the normal cruise Mach number. The
specific air range values are for level cruise flight at the specified Mach number,
altitude and temperature for a weight of 175 958 kg (388,000 [b). This simpli-
fication does not consider that additional fuel would have to be carried to complete
a given mission using the -20°C adiahatlc wall temperature profile. Note that the
fuel economy percent difference represents instantaneous difference which is valid
only for the cruise _int Mach numbers, altitudes and weight specifled. The fuel
economies a_ percent differences are included only as an example of relative values
for the conditions discussed here, The fuel economy percent differences have no
relation to mission bl_k fuels bera_,se climbs, descents, and amount of time incruise _ve not _en accounted for.
TABLE 5 - IMPACT OF HIGH FREEZE POINT FUEL ON PERFORMANCE
OF BASELINE AIRCPAFT
Amb=ent *Altitude 3emperature FuelEconomy Fuel
Mach (n. mr./ Economy: Atmosphere Prohle Number Mete, (feel) °C (°F) km/kg Ibm) Percent
1962 U.S a 0,82 10 668 (35,000) -54 (-66) 0.132 (0.0322) -6Standard b 0.82 9 449 (31,000) -46 (-51t 0 124 (0.0304)Atmosphere
.o
50% a 0.82 10 668 (35,000) -56 (-68) 0.132 (0.0322) -13Probabihty b 0.82 8 230 (27,000) -46 (-51) 0.115 (0 0281)Profile
0.3% a 0.82 10 668 (35,000) -68 (-90) 0.132 (0.0322) -35Probal),hty b 0.68 3 658 (12,000) -40 (-40) 0.086 (0.0211)Profile
a-Optimumalt=zud,for weight-175 958 k9 (388.000 Ib),Mach-O.82b-AIt=tudeandMachnumbernecessaryto maintaina -20°C ad,abatlcwall temperature
oO
1985010866-069
5.2 Thermal Stability
Present jet f,,ets vhich comply with ASTM specifications for thermal stability,
produce ceking ratPs in current fuel systems that are acceptable from the aircraft
opekator's point ot view. The fuel system can be cleaned, if necessary, by flushingit with approved detergents during the scheduled maintenance program. The criterion
for designing a fuel system aulc tc handle lower thcrmal stability fuels is based ontie fundamental assumption that these presently tolerable deposition rates are not to
be increased when relaying the JFTOT rating to 204°C.
The coking rates in a fuel system componrnt depend primarily on the fu_l
temperature, wall temperature, fuel flow rates, aud pressure, as well as othervariables unrelated to the fuel system such as fuel composition, contaminants,
exposure to air, etc. Unfortunately. there does not exist as yet a dynamic model for
thermal stability which can accounL for the effects of the environmental parameters
mentioned above. Recent efforts by Vranos and Marteney (ref. 22) under the
sponsorhlp of NASA have resulted in the collection of film deposition rates for a
: variety of fuels, under geometric conditions approaching a fuel system situation.fhese data were correlaLcd by those authors using Arrhenius plots of deposition-rates
vs. wall-temperatures as shown in figure 35. When operating with Jet A fuel, _be
wall temperatures may on a hot day reach values as high as 135_C (275°F). F om the
figure, the coking rates at this temperature appeaT to be of the order of
I ug/(cm 2 h). For a home heating fuel, suc1_ as the one selected in the figure to
represent a reduced thermal stability jet fue], extrapolation ot the experimental
data to temperatures as low as 840C, would indicate coking rates as high as
i0 _g/(cm 2 h). This temperature is commonly reached in present diesel engine fuel
systems, but there have not been any indications of such a fast deposit build-up. It
appears then that extrapolation of the high temperature measurements of ref. 22 to
lower temperatures should be exercised with great caution. For the purpose of this
study, a reducLion temperature interval will be selected based on the decrease in
JFTOT rather than on the coking rates criterion described above. This interval will
be taken as the differen,'e between the Je_ A JFTOT (260°C) and the low thermal _
\ stability fuel (204_C), that is, _T = 56°C. It is recognized that this interval
could be somewhat higher if properly estimated from coking rate considerations.
In order to assess the impact of utilizing the low thermal stability fuel,
the following method will be applied here:
a) Establish a tolerable maximum fuel bulk temperature in the fuel system when
operating with Jet A. This temperature limit is determined from experience.
• b) Decrease this present limit by an amount equal to the temperature interval
separating the tolerable coking rates of i ug/(cm 2 h).
c) Obtain fuel system component temperature profiles for the thermal stability
limiting flight (hot day, short flight).
d) Compare the profiles obtained in (c) with the new fuel temperature limit
selected in (b). Assess the impact on fuel systems and aircraft operations if the
temperature profiles of (c) are reduced to remain below the new fuel temperaturelimit,
In the following, the tank outlet fuel temperature will be presented for the
limiting short flight on a hot day. The fuel system components affected by low
thermal stability will be described, and the temperature distribution throughout the
system estimated. The impact of the low thermal stability fuel on components as well
as aircraft operations is discussed at the end of this section.
61
.... ",m,,mmmwJmlw ...............
1985010866-070

- 1000
Z G 2.14 x 10.3 kg/s(2.5 gal/hr).. 100 -- ' " 6.85 x t0 .3 kg/s(8gal/hr)
E= 38 kJ/mol • 6.85 x 10.3 kg/s(8gal/hr) ho.atedfuel
E = At,rattan energy
::L No, 2 homeheatingoil
: i0 Jet A fuelca
/(_ /"_7, \ E = 42 kJ/tool/
/ / (10 kcal/mol)
t.0 _ ,/
_ Tolerablecokmgrates
0.1 I , 1 i I ,I ,I100 200 300 400 500
84 150 250
Wall temperature,°C
Figure 35 - Coking rates vs. wall temperatures for Jet A and
home heating fuels.
5.2.1 Tank outlet fuel temperature. - A short flight of 926 km (500 n.mi.) on
the hot day profile established for this study, 54°C (!30°F) sea level temperature,
_s the limiting flight profile for low thermal stability fuel. The tank outlet
temperature hlstor> was estimated utilizing the wing tank thermal model described in
5.1.1. The flight parameters were described in 3.2.1 and additional informatlcn _.
relevant to the present analysis was obtained from table 6. The fuel tank bulk
"_ temperatures after refueling were assumed to be 38°C (lO0°F) which is the reported
maximum fuel temperature delivered to aircraft in hot climate airports (ref. 23). In
estimating the tank outlet temperature at takeoff, it was assumed that the aircraft
cleared the ramp two hours after being fueled. Table 7 shows the estimated fuel tank
_" outlet temperature histories throughout the flight. In Tanks i and 3, which supply
Engines i and 3, the fuel cools at a slower rate than the fuel in Tank 2 outboard
which has a higher surface-to-volume ratio. (Fuel from Tank 2 outboard is
transferred to the inboard compartment, and from there to Engine 2, the tail section
: engine). Although the difference between the tank outlet fuel temperature histories
is minimal, the Tank i outlet temperature was selected for the purpose of this
analysis as providing the most limiting condition.
5.2.2 Engine fuel environment. - Thermal stressing of the f,el is most severe on
the engine side of the baseline aircraft fuel system. The engine fuel system wasdescribed in Section 3.1.2 and illustrated schematically in figure 4. In order to
r
62
1985010866-071

TABLE 6 - AIRCRAFT AND ENGINE PARAMETERS PROFILES FOR THE SHORT RANGE 926 km
(500 n.mi.) FLIGHT, HOT DAY (54°C GROUND TEMPERATURE)
Time From
Segment Mode Take-Off Altitude Macf,No.min m (ft)
1 acc 0 0 0
2 chmb 0.45 0 0.226
3 acc 0.98 457 (1,50(J) 0.232
4 climb 1.47 457 (1,500) 0.388
5 acc 4.13 3,048 (10,000) 0.420
6 climb 4.84 3,048 (10.000) 0.476
7 chmb 15.87 8,808 (28899) 0.820
8 cruise 24.35 11,887 (39000) 0.820
9 descent 45 10 11,887 (39 000) 0.820
10 descent 57.46 3,048 (10 000) 0.576
11 decel 58.1 3,048 (10000) 0.452
ThrustPer Fuel Flow Per HPRotor Turb,neGas
Segment Engl,Te Engme Speed Ternperature
kN (klb) kg/h (Ib/hr) (rpm) °C (K)
1 164.6 (37.0 7,521 (16,580) 10,050 1818 (1544)
2 146.8 (33.0 7,466 (16,460) 10,050 1818 (1544)
3 133.4 (30.0 7,366 (16,240) 10,050 1818 (1544)
4 89.0 (20.0 4,_08 (10,820) 9,500 1629 (1355)
5 75.6 (17.0 4,518 (9,960) 9,690 1712 (1438)
6 57.8 (13.0 3,946 (8,700) 9,460 1623 (1350)
7 40.0 (9.0) 2,867 (6,320) 9,490 1673 (1400)
8 27.1 (6.1) 2,005 (4,420) 9,440 1690 (1417)
9 26.7 (6.0) 680 (1,500) 8,130 1306 (1033)
10 2.2 (0.5) 871 (1,920) 7,580 1223 (950)
11 2.2 (0.5) 980 (2,180) 7,800 1229 (955)
63
1985010866-072
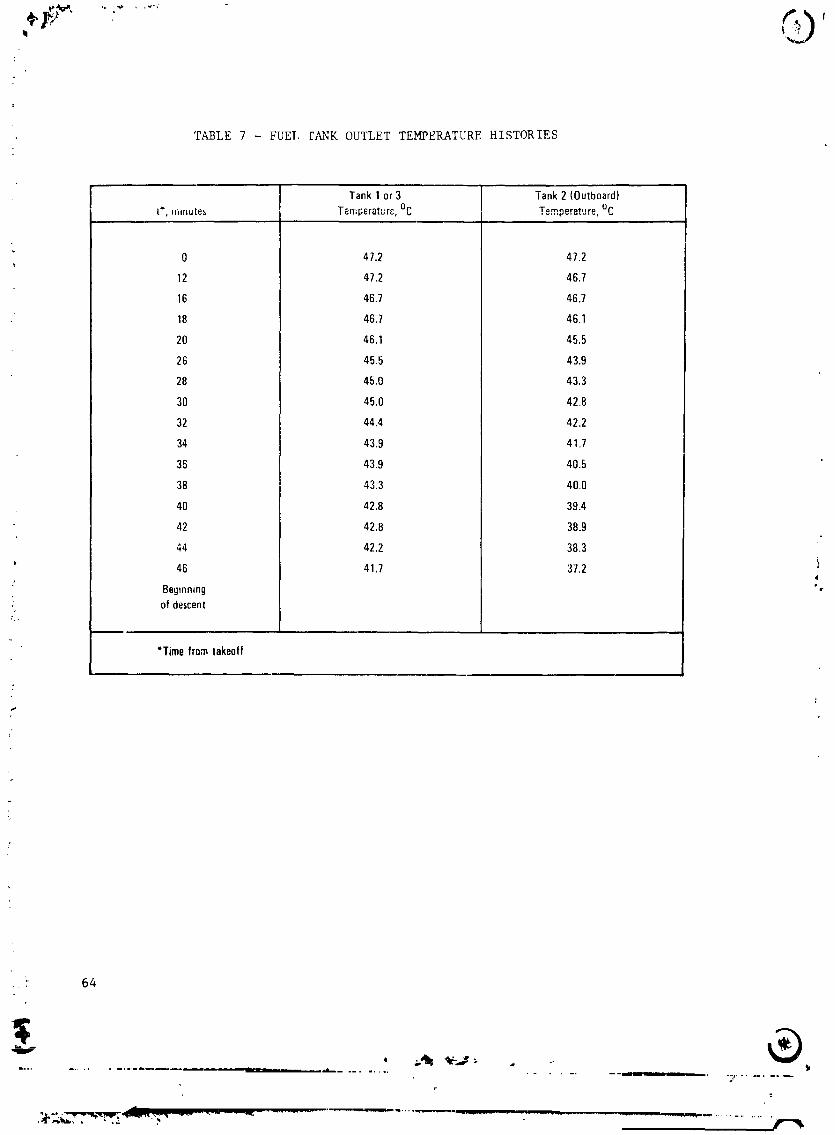
TABLE 7 - FUEl, rANK OUTLET TEMPERATURE HISTORIES
Tank I or 3 Tank 2 (Outboard)
t+, .,,ute_ Temperaturc,°C Temperature,°C
0 47.2 41.2
12 47.2 46.7
16 46.7 46.7
18 46.7 46.1
20 46.1 45.5
26 45.5 43.9
28 45.0 43.3
30 45.0 42.8
32 44.4 42.2
34 43.9 41.7
36 43.9 40.5
38 43.3 40.0
40 42.8 39.4
42 42.8 38.9
44 42.2 38.3
46 41.7 37.2
Begmmng "-of descent
*Time from takeoff
64
®r
1985010866-073

have a better understanding of the effects of low thermal stability fuels on the
engine performance, the functional relationships and thermal environment of the
various engine components are discussed in this section. Although the engine fuelfeed lines from Tanks I and 3 are significantly different from the Tank 2 feed line
supplying the aft fuselage engine, all of the engines have identical fuel systems
downstream of the png_n_ interface.
In this analysis engine fuel system accessories located in the fan case are
discussed separately from those in the engine core area because of the differing
thermal environments. Installation of the accessories on the fan case is desirable,
since this region is the coolest and can be accessed while the engine is operating.
The fuel system components installed in this region include the LP fuel filter, the
dual LP/HP pump, the two fuel-cooled oil coolers, the fuel flow regulators (including
the feel enrichment solenoid and the starting fuel flow regulator) and the HP shutoff
valve. The core section operates at higher temperatures since it is exposed to the
heat rejected from the HP compressor air and the combustors. The fuel system
components installed in this region include the HP filter, manifold, distribution
valves, and injectors. Ventilation of this region is provided by air bled from thefan duct.
Once the fuel enters the engine side of the fuel system, its temperature
increases progressively as the fuel flows downstream through different components and
line segments. The bulk fuel temperature in those components located on the fan case
are s]ightly lower than the surface temperature. In the core region the soak-back
heat from the hot section of the engine becomes more intense, while simultaneously
the fuel velocity increases, cadsing a larger difference between the bulk and surface
temperatures. In the following, those components of the fuel system, which introduce
important thermal loads into the fuel system, are reviewed in greater detail.
5.2.2.1 Fuel-cooled oil cooling system (FCOC): The baseline fuel system is "-
designed to improve the engine specific fuel consumption by preheating the fuel while
assuring at the same time that under extreme conditions, the fuel is not overheated
to form varnishes and carbon deposits. To this end, the fuel is utilized to cool the
engine oil, and this results indirectly in a secondary SFC improvement, since it
eliminates the need for an air-cooled oil cooling system, which does have an impact
on installed performance.
• The total heat to the engine oil is approximately a function of the engine speed.
" The baseline engine has three independent concentric rotors for the LP (fan), IP, and
HP compressors. The speeds of the three rotors are coupled aerodynamically within
narrow limits permitting the total heat to the oil to be expressed as a function of
the HP rotor speed only (figure 36).
A schematic diagram of the FCOC can be seen in figure 37. A pressure pumpL
supplies oil from the oil tank, through a high pressure filter and two oil coolers,
and then to the inlet of a second p_essure pump which delivers the oil to the gears
and beariDgs. The oil cooling system is _omprised of the control valves, the low
pressure fuel-cooled oil cooler (LPFCOC), and the high pressure fuel-cooled oil
cooler (HPFCOC). The oil flow path through the coolers is established by the
temperature of the LPFCOC outlet, which determines the position of the control valves
by means of retracting thermal elements. The cold valve element operates between I_
and 25°C, and the hot valve element in the range from 85 to 95°C. If the LP
temperature is below 12°C, all the oil flow is directed through the LPFCOC ¢:._y,
resulting in maximum fuel heating. Between 12 and 23°C, a small fraction of the oil
1985010866-074

2OO
180 --
160
140
i 120
100
80
60
'° @20
0 L '7000 8000 9000 10,000
HPspeed(rpm)
Figure 36 - Total heat input to engine oil as a function ofHP rotor speed.
_ 66
-- - m ........ ._ ..... ., o,
t
1985010866-075

LPfuelout
.'_ E,gineoilcoolingsystemcontrolvalves
rI Modulating Modulating I
• I cold valve hot valve j12°C to 25°C 85% to 95°C
' Oilin _ I Oi;outh_
" V r
I I: I I
I II.- ....... _J
LP fuel ou1 r
HP FCOC LF FCOC .
! out
_, I.p fuel in
4
._, FuelTempat LPFCOCExit 0il Flaw Through Acti_
; Below+ 12 degC LPFCOCand/orbypass Oil pressureopensLP FCOC reliefoilpressabove35 psi dependingon mlpressure valveandalsohot valveto ensure
adequateoil flowto secondaryoilpump
Below+ 12 deo C LP FCOC Max LP fuel heatingw
+ 12 to +25 degC LPFCOCand ColdvalveactionprogressivewithHPFCOC temperature.Increasingoil cooling
+26 to +84 degC LPandHP FCOC Max oil cooling
_._ +85 to +95 degC LPand HPFCOC ReducedLP fuelheating
- Above+95 degC HPFCOC MinimumLP fuel heating
Figure 37 - Fuel cooled oii cooling system schematic diagram
and operation.
67
' _,.....,,.,.................................._,,--.-._............:............... ,................_ ,,, "r-,_,_'_'_"'_'_'_"_'_'_" ' '" _:%', _ -- . . .........
1985010866-076

flow has an open path through the HPFCOC for increased oil cooling. From 25 to 85°C,
both valves are fully opened and maximum oil cooling is obtained for this temperature
range. When the LP fuel temperature is above 85°C the hot valve begins to close in
order to reduce the LP fuel heating, and above 95°C it is totally closed and the
HPFCOC is the only active cooler. With this control system, the total heat from the
oil is directed to the engine. Notice, however, that an extreme condition is
possible, although rare, where the LP fuel _emperature may be above 95°C, but the HP
fuel still receives the heat input from the oil. The HP fuel temperature could then
approach (130°C) with an attendant increase in oil temperature.
5.2.2.2 Combined low pressure/h_gh pressure fuel pumping system: The fuel is
delivered to the engine nacelle by the wing tank booster pumps. In order to achieve
the full flow rates and delivery pressures which are required for engine operation,
the baseline fuel system is provided with a compact combined HP/LP pum_ system. Both
pumps are mechanically coupled to the HP rotor through the accessories gear box. For
an installation of the unit, see figure 38.
The compactness and structural integration of both pumps result in some thermal
"cross-talk" between the HP and LP pumps. For this reason, the increase in tempera-
ture of the fuel across each pump may be slightly different for steady state and
transient operation. The characteristic temperature increase of the fuel at low
power levels is of the order of 5=C for one pass which, depending on the number of
passes (_s high as 7), could amount to as much as 350C.
5.2.2.3 Main fuel flow regulator: The main fuel flow regulator has delicate
metering air and fuel orifices to accurately schedule the fuel flow rate for every
flight condition. The power dissipation in the unit is negligible and requires
special considerations when the fuel temperature becomes too high.
5.2.2.4 High pressure shut-off valve: The HP shut-off valve is especially 4sensitive to materials incompatibility and carbonaceous fuel deposits. The valve
functions as a plunger sliding in a cyl_der, and sliding surfaces are highly
susceptible to becomlng sticky when varnishes or lacquers are formed _n their
surfaces.
5.2.2.5 High pressure filter: A single high pressure filter assures that the
small particulates which arc suspended in the fuel will not clog the delicate
passages of the distribution valves and injection nozzles thus guaranteeing an even
delivery of fuel to all of the injectors.
5.2.2.6 Burner system: The baseline engine is provided with a simplex burner
system with a bell-mouth feed arm design (figure 39). The main fuel flow from the
distribution valve is delivered to the spray nozzle, and goes through a restrictor
plug which meters the correct fuel flow for the delivery pressure. The feed arm is
directed radially inwards, and ends in the bell-mouth composed of a swirl chamber
enclosed by a deflector cone and a shroud. Six tangential drillings form a
multipoint injector and produce a spray with an atomization enhancing swirl. The LIP
compressor discharge air has a dual path through the deflector cone support plates
and the radial air feed slots. FigL_re 40 shows the simplex burner system integrated
with the structure of the combustor head, as well as further details on the main fuel
manifold, distribution valve, structural supports, and thermal stand-off distances.
The feed arm is enclosed in a cast steel body, the conductance of which is the only
resistance to heat transfer from the _ air to the fuel flowing within the feed arm.
In those cases where a low fuel flow rate is combined with a high HP discharge
". : 68
............ II .... il , Be - ----: i , . il_ ...... ii., i ............... I --
1985010866-077

69
{ ..9....... --m--. --- ii
"-_,_':,'..-'--_"_-T _ ......"'" _ .............................. _[......................................_"......................: _7
1985010866-078

7O
" '.................... ° _,_11_.'_,__ I_
-.. .., ._,__. ?.,;-

~
_ 71
!
_j,_]¢_,.,-:-:::._,---,..--................ .._.....................
I
1985010866-080

temperature, the soakback heat to the fuel in the nozzle could create severe
carbonaceous deposits on the tangential drillings. The soakback heat from thecombustor head to the nozzle is less severe because of the protective shields
installed. The injector restricting plug, as well as the distribution valves, are
less sensitive to the soak-back heat becau _'_ of the much cooler temperatures
experienced on the upper plate of the spray nozzles (figure 40).
5.2.2.7 Fuel drain tanks: When the HP shutoff valve is closed, the fuel in the
manifold, distribution valves and pigtail conduits is drained down to the level of
the lowest position injectors, Nos. 9 and I0. With this procedure, the exposure of
fuel for long periods of time to the severe soak-back heat from the core after engine
shut-down, is avoided. The fuel is returned by gravity to the fuel drain tank, which
is a small spherical container located in the fan case region. The tank is provided
with an ejector and a float valve mechanism which rediTects the drained fuel back to
the low pressure pump when the engine is started agein. The float valve blocks any
air in the drain tank from entering the fuel _ystem.
5.2.3 Effect on fuel system components. - When a section of the fuel system is
experiencing a fuel thermal stability problem, the fuel bulk temperature contro!_ the
nucleating rate o_ chemical reactions responsible for the fuel breakdown, while the
component surface temperatures and the fuel velocity control the coking and deposi-
tion rates on the component surface. The increase in bulk temperature is caused
primarily by the thermal loads in the fan case region, wL ie the highest surface
temperatures are experienced in those componento which receive the soak-back heat
from the HP compressor discharge. The fuel flow in the fan case region is charac-
terized by a low velocity, and moderate surface and bulk temperatures. These
conditions are seldom conducive to carbon deposits but may, after many hours of
operation, lead to the formation of films on those surfaces which are desig-ed to
slide or rest in contact with other surfaces. Since the bulk fuel temperature keeps
increasing as it flows through the engine fuel system, the component most likely to
suffer from such effects is the HP shutoff valve. Figure 41 shows the temperature
profiles at the key sections of the fuel system for the short range, hot day limiting
flight. These temperature profiles bare been obtained by extrapolating system
temperatures, measured during the aircraft certification to the hot day profile of
54°C (130"F) sea level temperature specified for this study. The extrapolation
formulae consist of emplricai tquations de_eloped from previous experience. These
temperatures were used to calculate the thermal loads across the componeats for eachengine regime. The temperature increases _ere then added as appropriate to the fuel
tank outlet temperatures reported in 5.2.1. The ground operations from engine start
to takeoff were directly adopted from the extrapolated certification measurements and
attached to the flight profile to complete the aircraft mission.
An inspection of the figure shows clearly that the HPFCOC outlet fuel temperature
(which is nearly the same as the HP shutoff valve inlet fuel temperature) is highest
during taxiing and at the beginning of t descent. The other temperatures in the
fuel system follow the same trend. This result was unexpected, since it had been
reported in previous work (ref. 24) that the beginning of descent was the most
limiting condition. The current data show that groun# operations are more
restrictive (HPFCOC outlet temperature reached between 125 and 128'C during taxiing
and ground Idle).
Experience has shown that valves using sliding surfaceo, such as the liP shutoff
valve and the distribution valves, will be free from film deposits, as long as the
bulk fuel temperature is kept below 135°C (ref. 25). If the manifold inlet fuel
72
. .y, ''-' ,r".... "---'""-'--- ..... "--- .............................. ' ..........e.
1985010866-081
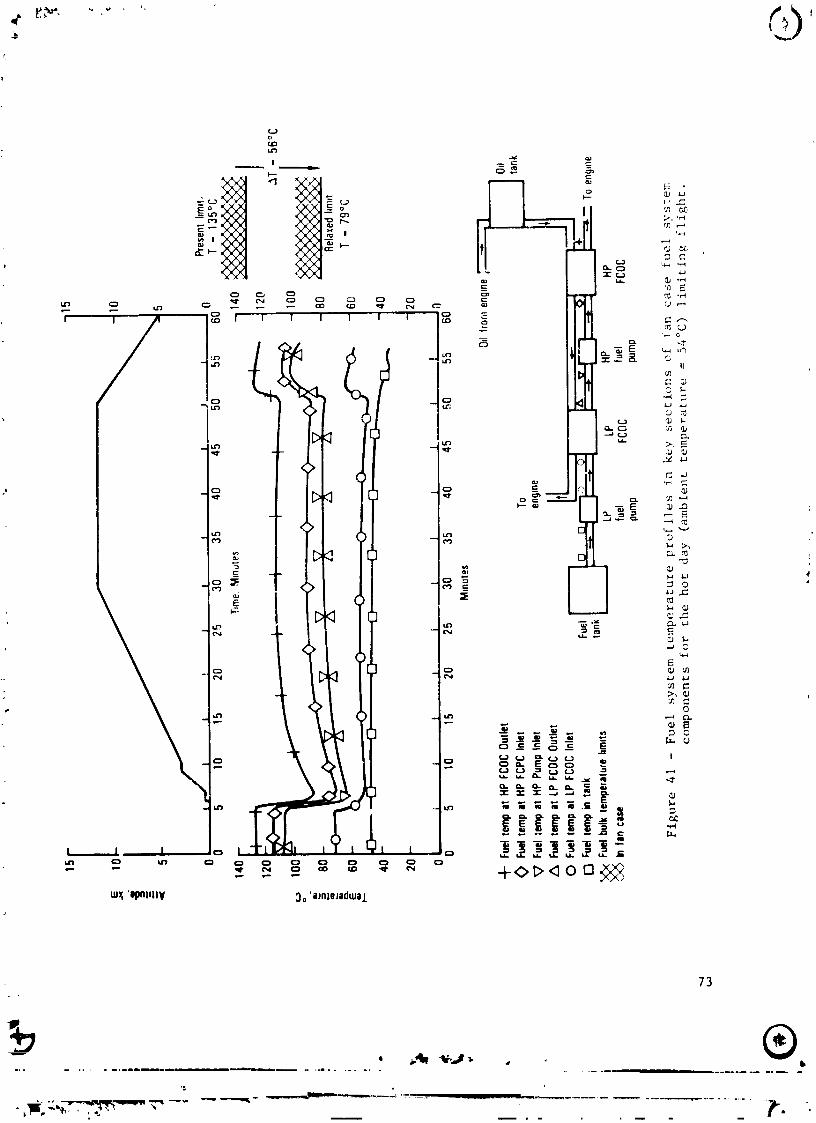
73
®,. z
__ -"-==-==......... r-__ ....... __.__... ....... . .....
1985010866-082

temperature is allowed to increase up to 150°C, seizure of the fuel metering valves
could occur within 200 hours of engine operation. [f one selects 135°C as the upper
llm[t, (tolerable in present Jet A fuels) _ relaxation of 56°C In this limiting tem-
perature as derl,red in Sectlo,_ 5.2 would result in an upper limit of 79°C. On
insrecting figure 61 it is seen that this new limit would be surpassed by thp NPFCOC
out_et temperature for the whole duration of the flight. The HP fuel pump outlet
temperature would also exceed this limit for the whole flight .zxcept for takeoff and
, climb up to 3048 m (i0,000 ft). The LPFCOC outlet temperature would also be over the
limit during ground and descent, and just below the limit during cruise. The LP fuel
pump inlet and outlet temperatures would be below the limit for the whole fl_ght.
Further examination of the temperature profiles show that the thermal loads from
the oli heat and pumping system a.e indeed the culprits for the increase in bulk fuel
temperature. Notice that the thermal loads are very _Im_lar for ground operationsand flight Idle, and occur d,_rlng those segments of the aircraft mission when the
engine SFC is the hlRhest sad the fuel flow rates are the lowest. At cruise, the
thermal loads from the o11 heat are dominant. At low power level_, the LP fuel pump
contributes 30 percent to the total thermal load. The HP pump load remains nearly
constant during the _oI_ mission and is the lowest (14 percent) of the totql thermal
load.
The heat transferred from the oil to the fuel through both heat exchangers has
been calct,lated _rom figure 41 for the beginning of cruise flight. With the engine
fuel consumption of 2005 kg/s and assuming a fuel specific heat of 2.27 kJ/kgK at the
fuel temperatures indicated In figure 41, the heat absorbed by the fuel is
approximately 58 kJ/s. This represents only 53 percent of the total heat input to
the ell at the cruise HP rotor speed of 9440 rpm as indicated by figure 36. At
takeoff and climb, the ell heat fraction dissipated by the fuel coolers is evensmaller.
The hi_ _ _g rates on thJ surfaces are expected to occur tn those compo-
nents whic_ _, ..aviag the highest surface _emperatures, are exposed to the fuel
with the highest )ulk temperatures. These components are installed in the hot
environment of the core region. The temperature dlstriDutlon along the core for a
hot day is given in figure 42. it is measured at the core surface and [s not
representative cf the HP filter, fuel manifold, or distribution valve surfaces, which
are mounted on the core surface by means of stand-o_f supporting brackets. This
temperature is repres,_n_qtive, however, of the cover plate of the spray fan, as well
as of the temperatures In the neighborhood of _he metering pl of the spray nozzles.
For the purpose of this study, a temperature of 300_C has been selected as being
representatlve of the core reglon.
The burner feed arm is in contact with the EP compressor discharge hot air, and
in steady state engine operation, it can be assumed that much of its structure is at
the compressor discharge alr temperature. This air temperature increases with power
levels and flow rates as shown in table 8. At high power, the fuel wetted surface of
the feed arm is conside ably cooler than the air and is very near th_ bulk fuel
temperature in the distrlbutioI_ valves. If power i_ reduced suddenly (aborted
takeoff), the fuel flow drops drasticall> from 7510 down to 680 kg/h. Since at
takeoff, most of the external feed arm structure is near 600°C, a severe soakbac>
heat could cause the wetted surface temperaturo to be excessive. This high
temperature situation, however, is expected to last o,ly a short time inasmuch as the
feed arm structure is als_ cooled by the low power HP air.
74
1985010866-083

" 700 - "7
600 -
500 - 450 °C -o_ ,.--.,
_oo-
300°C= 300 - /'
/r__
: 200 -120°C
,.J
._ 100-
/ Fnginecoresurface/
dk ,4
. II
II r
Fuelmamfoldplane -, ,,_
_igu_e 42 - Measured core temperature distribution for heat rejection rates
: _rom an installed engine for an ISA + 39°C hot day at a M_ch no.
of 0.3, sea level and maximum rpm_
_ Figure provided through the courtesy of
: Roils-Royce, Limited.75
z
1985010866-084
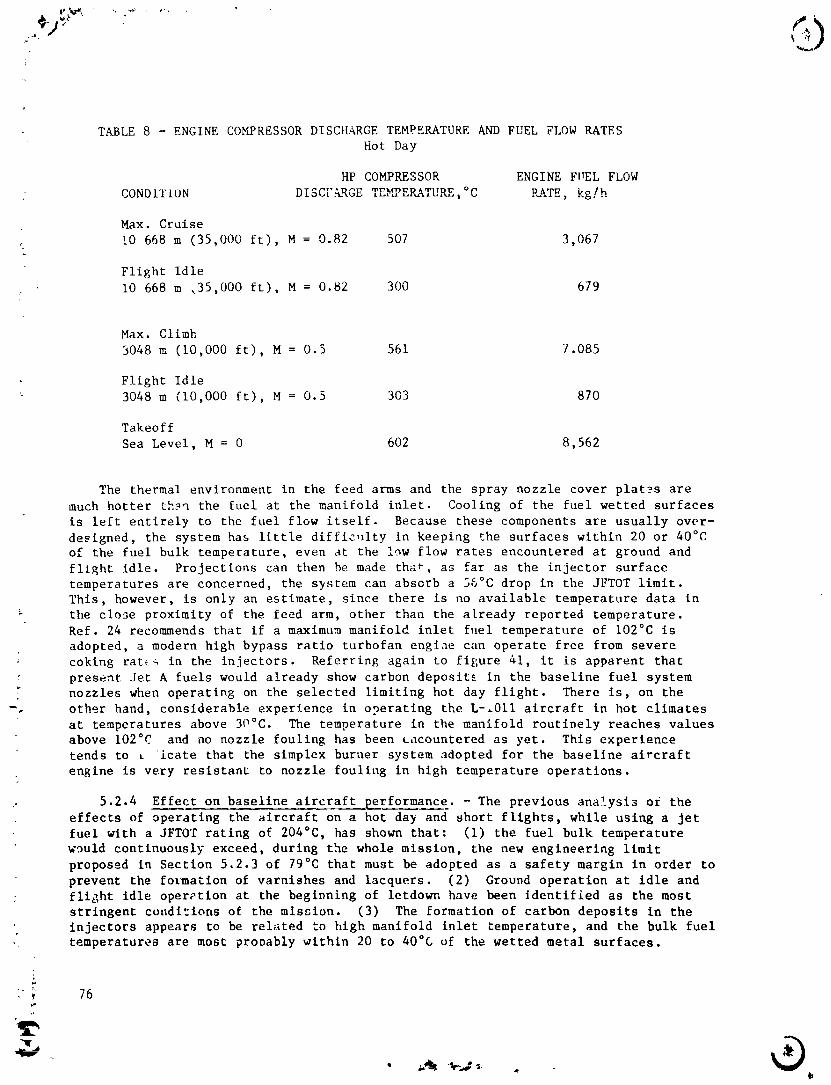
J
TABLE 8 - ENGINE COMPRESSOR DISCHARGE TEMPERATURE AND FUEL FLOW RATES
Hot Day
HP COMPRESSOR ENGINE FIrEL FLOW
CONDITLON DISCF_RGE TEMPERATURE, °C _TE, kg/h
Max. Cruise
I0 668 m (35,000 ft), M = 0.82 507 3,067
Flight Idle
i0 668 m ,35,000 ft), M = 0.82 300 679
Max. Climb
3048 m (I0,000 ft), M = 0.5 561 7.085
Flight Idle
'- 3048 m (I0,000 ft), M = 0.5 303 870
Takeoff
Sea Level, M = 0 602 8,562
The thermal environment in the feed arms and the spray nozzle cover plates are
much hotter than the fuel at the manifold inlet. Cooling of the fuel wetted surfaces
is left entirely to the fuel flow itself. Because these components are usually over-
designed, the system has little difficulty in keeping the surfaces within 20 or 40ocof the fuel bulk temperature, even at the low flow rates encountered at ground and
flight idle. Projections can then be made tha_, as far as the injector surface
temperatures are concerned, the system can absorb a 36°C drop in the JFTOT limit.
This, however, is only an estimate, since there is no available temperature data in
the close proximity of the feed arm, other than the already reported temperature.
Ref. 24 recommends that if a maximum manifold inlet fuel temperature of I02°C is
adopted, a modern high bypass ratio turbofan engiae can operate free from severe
: coking rat_ in the injectors. Referring again to figure 41, it is apparent that
present Jet A fuels would already show carbon deposit_ in the baseline fuel system
nozzles when operating on the selected limiting hot day flight. There is, on the
-. other hand, considerable experience in operating the L-_OII aircraft in hot climates
at temperatures above 30°C. The temperature in the manifold routinely reaches values
above I020C and no nozzle fouling has been Lacountered as yet. This experience
tends to L icate that the simplex burner system adopted for the baseline aircraft
engine is very resistant to nozzle fouling in high temperature operations.
,o 5.2.4 Effect on baseline aircraft performance. - The previous analysis o_ the
effects of operating the aircraft on a hot day and short flights, while using a jet
fuel with a JFTOT rating of 2040C, has shown that: (i) the fuel bulk temperature
would continuously exceed, during the whole mission, the new engineering limit
proposed in Section 5.2.3 of 79°C that must be adopted as a safety margin in order to
prevent the formation of varnishes and lacquers. (2) Ground operation at idle and
; flight idle operetion at the beginning of letdown have been identified as the most
stringent conditions of the mission. (3) The formation of carbon deposits in the
injectors appears to be related to high manifold inlet temperature, and the bulk fuel
temperatures are most prooably within 20 to 40°L of the wetted metal surfaces.
76
1985010866-085

The results are conclusive. A relaxation of the JFTOT eating down to 204°C would
halt operations of the aircraft, not only in hot weather, but even at ground level
temperatures as low as 20°C because the distri_ ion valves, HP shutoff valve, and
fuel metering devices would almost certainly experience seizure due to the formation
of varnishes and lacquers.
A corollary question is - how much could the present JFTOT rating of 260°C be
relaxed before operating the aircraft in hot weather and short flights become a
problem? The fuel system for the baseline aircraft was designed to take full
advantage of any opportunity for improving the SFC. For this particular design the
fuel bulk temperature at _he manifold inlet is as high as possible without pushing
the practical thermal _.reakdown limit. The formation of varnishes and lacquer3 on
the component surfac located in the fan case, as well as on the distribution
! valves, Is a cumulative process, and its presence is felt after many hours of
operation. How long i takes to detect them depends on no_ often the aircraft
operates in hot climates, as well as the time that the aircraft spends in ground
operations and descent. From this point of view, a statistical approach appears more
reasonable for the analysis, rather than the single most-limiting flight approach- considered above.
Assume that the aircraft operates 500 hours, servicing routes in a hot climate
(for instance, the Southeast United States summer). It is probable that during this
period the aircraft could be operating at ground temperatures above 32°C (90°F).
Taking 32°C as the ground temperature, down from 54°C used for figure 41, a maximum
value of I07°C is projected at the outlet of the HPFCOC. This is also approximately
the temperature that the fuel shutoff valves and the distribution valves will be
experiencing. If this value is taken as the new practical limit, it translates intoa relaxation of the JFTOT down to 232°C.
The estimated lowest JFTOT breakpoint temperature of 232_C at which the aircraft
could operate for a seqaence of hot days at ground temperatures not gre_ter than •
32°C, must be taken with great caution. Much more work is necessary to pinpoln_ _he
_ coking rates at low temperatures which happen to be the prime culprits of the limits
imposed to the aircraft.
The limits described above refer to slow, long term deposits on the fuel compo--
nents. There are situations where the operation of the aircraft (even for short
periods of time) in very hot climates could induce injector nozzle fouling in a
matter of minutes. For examp]e, after an aborted takeoff, the bulk fuel temperatures
are very high and simultanously the structural member of the feed arm is very hot.
This could result in carbonaceous deposits on the feed arm at a very high rate if the
aircraft is left to idle on the runway shortly aftec the aborted takeoff.
5.3 Aromatic Content
A significant impact of utilizing fuels with altered chemical composition f_om
conventional petrole_,m fuels is the effect on the solvent properties of the fuel.
Since these fuels must come in contact with certain _onmetallic aircraft componentssuch as seals, hoses, etc, the effect of altered aromatic content of shale and coal
derlved refined fuels must be addressed. The fuel mixture, treated as an orga'Lic
solvent, causes .,.welling of polymers, including plastics and rubber material. Thus, L-a correlation of fuel solvent action with various polymers provides a useful
_rediction of Jetrimental effects o_ fuel on plastics, elastomers, and other
i polymeric materials.
1985010866-086
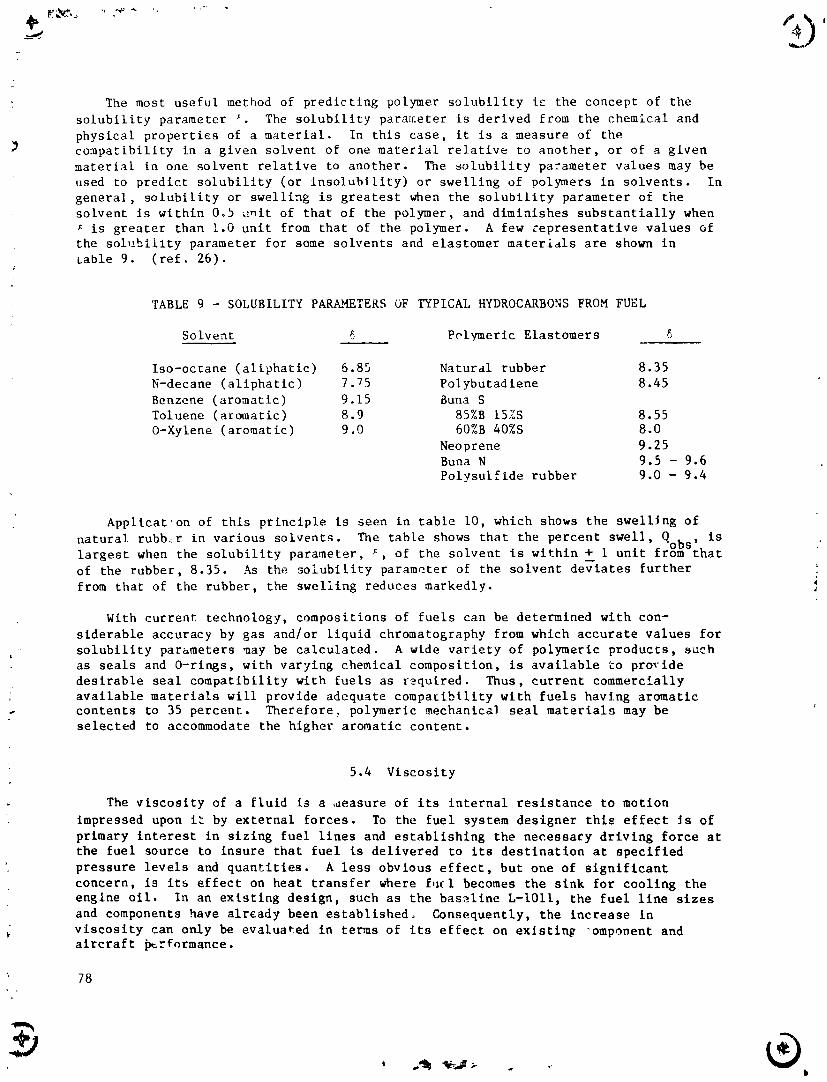
The most useful method of predicting _olymer solubility i_ the concept of the
solubility parameter _ The solubility parai_eter is derived from the chemical and
physical properties of a material. In this case, it is a measure of thecompatibility in a given solvent of one material relative to another, or of a given
material in one solvent relative to another. _ne solubility parameter values may be
used to predict solubility (or insolubility) or swelling of polymers in solvents. In
general, solubility or swelling is greatest when the solubility parameter of the
solvent is within 0.5 unit of that of the polymer, and diminishes substantially when
is greater than 1.0 unit from that of the polymer. A few ;epresentative values of
the soluhiilty parameter for some solvents and elastomer materials are shown in
Lable 9. (ref. 26).
TABLE 9 - SOLUBILITY PARAMETERS OF TYPICAL HYDROCARBONS FROM FUEL
Solvent _ Polymeric Elastomers
Iso-octane (aliphatic) 6.85 Natural rubber 8.35
N-decane (aliphatic) 7.75 Polybutadiene 8.45
Benzene (aromatic) 9.15 6una S
Toluene (aromatic) 8.9 85%B 15%S 8.55
O-Xylene (aromatic) 9.0 60%B 40%S 8.0
Neoprene 9.25Buna N 9.5 - 9.6
Polysulflde rubber 9.0 - 9.4
Applicat on of this principle is seen in table i0, which shows the swell_ng of
natural rubb<r in various solvents. The table shows that the percent swell, Qobs," islargest when the solubility parameter, _, of the solvent is within + i unit _rom that
of the rubber, 8.35. As the solubility parameter of the solvent deviates further
from that of the rubber, the swelling reduces markedly. 4
With current technology, compositions of fuels can be determined with con-
siderable accuracy by gas and/or liquid chromatography from which accurate values for
solubility parameters may be calculated. A wide variety of polymeric products, such
as seals and O-rings, with varying chemical composition, is available to pro_'ide
desirable seal compatibility with fuels as required. Thus, current commercially
available materials will provide adequate compatibility with fuels having aromatic
f contents to 35 percent. Therefore, polymeric mechanical seal materials may beselected to accommodate the higher aromatic content.
: 5.4 Viscosity
The viscosity of a fluid is a ,deasure of its internal resistance to motion
impressed upon it by external forces. To the fuel system designer this effect Is of
primary interest in sizing fuel lines and establishing the necessary driving force at
the fuel source to insure that fuel is delivered to its destination at specified
pressure levels and quantities. A less obvious effect, but one of significant
concern, is its effect on heat transfer where fuel becomes the sink for cooling the
englne oil. In an existing design, such as the baseline L-IOll, the fuel line sizes
and components have already been establlshed_ Consequently, the increase in
viscosity can only be evaluated in terms of its effect on existin_ _omponent andaircraft _rformance.
78
1985010866-087

+JY
TABLE I0 - SWELLING OF NATURe, RUBBER IN VARIOUS SOLVENTS (ref. 26)
(6= 8.35)Hydrocarbons
% Swell
6 Qobs
n-Pentane 7.05 1.12
n-Hexane 7.3 1.18
n-Octane 7.55 2.34
Benzene 9.15 3.95
Toluene 8.9 4.10
' m-Xylene 8.8 4.15
Mesitylene 8.8 3.25Limonene 8.5 4.00
Ketones
Acetone 9.9 0.03
Methyl ethyl ketone 9.3 0.71
Diethyl ketone 8.8 1.6
Diisopropyl ketone 7.6 1.9
Alcohols!
n-Propyl alcohol 11.9 0.02
tert-Butyl alcohol 10.6 0.13
Amyl alcohol 10.9 0.07
n-Hexyl alcohol 10.7 0.15
n-Heptyl alcohol 10.6 0.55 ,
n-Octyl alcohol 10.2 0.85
Nitriles
Acetonitrile 11.9 0.04 "_
Proplonitrlle I0.6 0.06
Capronitrile 9.4 0.70
Benzonitrile 8.35 2.0
Nitro CompoundsNitromethane 12.7 0.03
Nltrotenzene 9.95 1.15
' 79
1985010866-088

5.4.1 Effect on fuel system components. - The fuel system components affected by
increased viscosity include: fuel lines, fuel pumps, heat exchangers in which fuel is
one of the heat transfer fluids, and fuel nozzles. The relaxed fuel viscosity is
compared to ASTM D 1655 JET A commercial kerosene as a function of temperature in
figure 43. The effect of fuel viscosity on component performance is greatest at low
fuel temperatures and is almost negligible at high fuel temperatures.
5.4.1.1 Fuel lines: The effect of fuel viscosity on fuel line losses as
affected by fuel temperatures is illustrated in figure 44 which compares the pressure
drop per meter (AP/L) in two sizes of engine feed lines used in the L-lOll-500
airplane. During cruise, with a fuel temperature of -40°C, the higher viscosity fuel
causes a 250 percent increase Jn pressure drop in the 3.81 cm (1.5 in.) line
supplying fuel to the wing engines and a 350 percent increase in the 5.08 cm (2 in)
line supplying the No. 2 engine. However, at temperatures above i5.0°C (60°F), these
line loss ratios are reduced to less than Ii percent and 14 percent respectively.
5o4.1.2 Fue] pumps: The primary effect of fuel viscosity on pump performance is
a result of the increased discharge pressure required to overcome the increased
plumbing line losses. The centrifugal pumps used as boost pumps in the L-lOll fuel
tanks and at the engine inlet, will experience some reduction in discharge pressure,
fuel flow rate and pump efficiency if a higher viscosity fuel is used. Aircraft pump
manufacturers assume these losses to be negligible. However, a method of correcting
centrifugal pump performance for viscosity has been developed by the Hydraulic
Institute (reference 27). Assuming this method of correction can be applied directly
to the L-1011 fuel pumps, pump performance may be degraded by as much aq 1.5 percent
in output pressure, 4 percent in fuel flow rate, and 17.7 percent in pump efficiency
if tbe higher viscosity fuel Is used in cruise in lieu of Jet A kerosene at -40°C.
5.4.1.3 Heat exchangers: Assuming fully developed channel flow in the fuel side
of the L-lOll engine oil cooler, the film transfer coefficient (h) may be determined
from the following relationship:
0.8 1/3Nu = 0.0225 (Rn) (Pr)
where: h DH
u k
V DHR = --n
PVCr k
_t
£
' _: 80
1985010866-089

=h
1
100 -
5O
30 - Max.consadered=nstudy
20 -\
15 - \\\ ASTMD1655jetA,A-1max.10 -
8.0 -
\6.0 - \
\5.0 - \
\4.0- \
\\
3.0 - \\
5 2.0
1.75 \\\
,,, 1.50 \. E \E
•"= \" 1.25-_ \'-' \113
=- \_' 1.00 I I I I I I
-60 -40 -20 0 20 40 60 80 100 120 140
l'emperature,°C
Figure 43 - Commercial aviation jet fuel viscosity.
0
-" (DJ
1985010866-090

1 2 -- Fuel nozzledropletsize(Sautermeandiameter)
, N 11 -
1.[1-
1.0 - Oulto fuelheat exchanger
< 0,9-
0.7
0.6-
06-Frmtmnalline losses
Viscosity
20 mm2/[email protected]°C (highvis)
0.4 _,8
_'_ mm2/s @" -20°C (ASTM),, /
¢"L"1
0.2 " "" -" -" '__ 39.1 mmline
..... 50.8 mm line
0 1 I 1 I 1 1 •-40 - 20 0 20 40 60 80 100
Fueltemperature----°C
Figure 44 - Effect of viscosity on component performance.
"" 82
1985010866-091

Assuming the flow rate (V), hydraulic diameter (DH) , thermal conductivity (k),density (_), and specific heat (Cp) are the same for the Jet A kerosene and the
higher viscosity fuel, the effect of viscosity (J) on film transfer on the fuel side' will be:
7/15h (high vJs.)/h (Jet A) = [ _J(Jet A)/_ (high vis.)J
This relationshlp is shown on figure 44 as a function of ambient temperature. In
the range of critical fuel temperatures above 93.3°C (200°F), the fuel side heat
" transfer coefficient using the higher viscosity fuel will be down a_proxlmately 12
percent relative to Jet A fuel.
5.4.1.4 Fuel nozzles: The impact of viscosity on the Simplex Pressure Swirl
Atomizer nozzle used in the L-1011 engines is also shown in figure 44. The
comparison is based upon an empirically determined equation for Sauter Mean Diameter
(SMD) of fuel droplets repotted in reference 28:
0.16 0.6 0.22 -0.43
SMD = 4.4_ Wf APf
Assuming the fuel total pressure drop across the 1ozzle does not change and using
compatible values for surface tension (I) and fuel flow rate (Wf) the droplet sizefor the high viscosity fuel at combustor inlet fuel temperatures will be
approximately 5 percent larger than those using Jet A fuel.
5.4.2 Effect on baseline aircraf____t_,_formance. - The impact of higher viscosityfuel in the baseline aircraft performance will be most significant at low fuel
temperatures. As long as the tank-mounted boost pumps are operating, however, the
higher viscosity will not effect engine performance. At sea level takeoff, on a
, -40°C day, the engine fuel flow is 7597.8 kg/h (16,750 ib/h). As_umlng a -40°C fuel,
the pressure at the most critical engine, which is mounted in the aft fuselage, may
be determined from the following equations:
Peng. in = Ppump out - APfuel llne
The aft engine inlet pressures will vary with fuel viscosity and number of
tank-mounted boost pumps in operation as shown in table II.
From the above, it is apparent that the aft engine can operate at takeoff power
with either hlgh vlscosity ot Jet A fuel as long as the tank boost pumps are
operating. With boost pumps inoperative however, the analysis indicates that the aft
fuselage engine could not achieve takeoff power with the high viscosity fuel. A
similar analysis with boost pumps off for the wing engines shows a fuel inlet
o pressure of 83.4 kPa absolute (12.1 psla) at the engine inlet indicating no
compromise in englne thrust using high viscosity fuel. The higher engine inlet
pressure zesults from the short supply lines and pos_tlve fuel head because the
: engines are mounted below the wing tanks.
5.5 Lubricity
Fuel lubriclty has not been a serious problem in the past. However, the trend to
moderate an_ severe hydroprocessing of syncrudes in the future can result in reduced
lubrlcity for aviation Jet fuels. The effects on the baseline aircraft ccmponents
and aircraft performance are discussed in the following paragraphs.
, 83
1985010866-092

i
TABLF ii - AFT ENGINE FUEL INLET PRESSURE
Two Pumps OnePump No Pumps
Fuel Ppump,gauge Peng,abs Ppump,.qaugu Peng,abs Pta,k, gauge Peng,abs
kPa kPa kPa kPa kPa kPa
(pslg) (psia) (pslg) (pma) (pslg) (psla)
Jet A 251 7 2689 225.5 242.7 0 17.2~
(36.5) (39.0) (32.7) (35.2) (0) (2 5)
HtghV,s 248.2 237 9 222 1 2;1 7 0 -10.3(36 0) (34.5) (32.2) (30.7) (0) (-1.5)
5.5.1 Effect on fuel systems components. - Since most fuel system components
rely on the lubricating qualities of fuel to minimize friction between movingsurfaces in contact witb each other, it is to be expected that reduced lubricity will
result in increased wear with the attendant reduction in component life. In the
baseline aircraft such components include the engine high and low pr_ssure pumps, 4
fuel flow regulator, high pressure fuel shutoff valve, starting fuel regulator, the
airframe tank-mounted boost pumps, Tanks 2L/2R flow proportioaer, and system shutoff
valves. In addition to reduced life for all such components, controls which modulate
the fuel flow in the engine may experience sticking or sluggish operation. This
latter effect has been observed on a J-79 engine installed in an F-I04 airplane which
had been refueled by fuel which had its lubricity reduced by passing through clay
filters. However, the problem disappeared when the same aircraft was supplied fuel
which had bypassed the clay filters. Evidence that the llfe of some of the baseline
y L-lOll fuel system components will be reduced by operation with low lubricity fuel
has been demonstrated by excessive gear tooth and bearing block erosion in the engine
fuel system high pressure pump. Further investigation revealed that the fuel used in
these aircraft had been subjected to severe hydroprocessing. Subsequent design
modifications to the pump increased its life to an acceptable level while operating
with ghe equivalent low lubrlcity fuel.
5.5.2 Effect on baseline aircraft per[ormance. - The lung term effects of low
lubricity fuel on the baseline aircraft is to increase the frequency of component and
system maintenance activities with the attendant cost impact. Of more immediate
concern, however, is the potential results of sluggish or sticking fuel controls.
This could cause safety hazards primarily in takeoff, landing and ground maneuvering
) where quick response to control movements are sometimes required to avoid accidents.
1985010866-093

5.6 Other Fuel Propertie_
5.6.1 Water separation. - Water in the fuel can become a problem if it exceeds
the quantity which will remain In solution. Since its solubility increases with fuel
' temperature, water saturated fuel tdkeu dbo_rd In a hot humid climate can release
significant quantities of free water as the fuel is cooled in flight. As the fueltemperature drops below the freezing point of the free water, small crystals of ice
are formed which can remain suspended in the fuel for long periods of time. As they
are drawn into the engine fuel system, these fi- ice crystals can block fuel filters
and cause some system malfunctions. However, a I commercial jet transports must be
capable of sustained operation under the most critical conditions for water freeze-
out in the fuel. In most cases, this condition is met by using the engine oil heat
rejection to ensure that the fuel is well above the freezing point of water before
: the fuel reaches filters where ice crystals could block the filter.
A more hazardous condition can be encountered if free water is supplied to the
aircraft through malfunctioning ground equipment. If the water quantities are large
and improperly trained _rews neglect to sump the aircraft tanks prior to takeoff,
large slugs of wa_er can cause loss of engine thrust. A contributing factor to thls
condition can be the use of lubricity additives in fuels when severe hydroprozessing
has removed much of the lubricating quali_es of the fuel. Such additlve_ frequently
act as surfactants which reduce the water removing capability of the ground fuel
supplier's filter/separator equipment.
5.6.2 Electrical conductivity. - the electrical conductivity of the fuel is an
important consideration when evaluating the potential of fuel tank fires while
refueling the airplane. As the fuel is transferred f_om the ground equipment to the
aircraft, an electrostatic charge is picked up by the fuel as it passes through the
, refueling system, especially the ground filter/water separation equipment. Thls :
charge is carried to the aircraft fuel tanks where it is gradually dissipated byconduction through the fuel to the oppositely charged airframe. Since charges which
are driven to the fuel surface are no + neutralized by airframe charges, a surface
" voltage difference between the fuel surface and upper wing skin develops. If this
surface voltage exceeds the breakdown _oltage in the ullage space, a spark discharge
occurs which can ignite combustible fuel vapors causing an explosive reaction.
If the fuel conductivity is high enough to cause a rapid charge relaxation, the
fuel surface charge does not become a potential ignition source. Consequently, a
considerable effort is expended by the fuel handler and aircraft operator to insure
that the fuel conductivity is at a safe level.
Fuels produced from shale and syncrudes will oe s_bjected to severe processing in
the refining operations to remove molecular nitrogen and excessive sulfur. If them
processing removes most of the polar compounds, it could reduce the electrical
conductivity level to a point where static discharge could become a serious hazard.
From a safety point of view, this condition would not be tolerated. Consequently,
anti-static additives, which a_e readily available, would become mandatory.
5.6.3 Flash point and vapor pressure. - Relaxation of the flash point and
increasing the vapor pressure of commercial Jet fuels can provide a significantincrease in Jet fuel availibillty. Because sucL changes can increase the possibility
of fire, the industry has evidenced a great reluctance .o relax these p, erttes.Increasing the vapor pressure can also result in fuel boil-oft losses Lt is
probable that contemplated cha_iges in these properties would be t;ell within the
85
AK
1985010866-094
present limits of ASTM O 1655 Jet B fuel. Since ,host commercial jet fueled aircraft,
includ_;_g the L-IOII, have been certified to operate with Jet B fu, I, none of the
fucl system components would be affected by the chatlge.
Jet B fuel vaporizes more readily than Jet A and forms a combustible mixture from
approximately ll°C down to -28°C at sea level under stable conditions. However,
under dynamic conditions, the lower flammability limit can extend to -65°C. Jet A
fuel, which is less volatile than Jet B fuel has a combugtible range from 84°C down
to 41°C under stable conditions and down to 50C under dynamic conditions. It is
apparent that the present combustible range of Jet A fuels under stabl[zed coditions
has a minimal overlap with normal operating tenperatures. Increasing the vapor
pressure would increase this overlap with the attendant increase in fire hazard.
86
1985010866-095

6. CONCEPTUAL DES Iv_IS
This section provides a discussion of the modifications at could be made to tho
baseline aircraft's fuel 3ystem to pcrmi_ the airc aft to operate with relaxed fuel
properties at the critical environmental condition. Of the eight fuel property
changes dJscussed in the preceding section, only two require that major modi[icetlons
be made to the baseline aircraft design to avoid operational limitations in the
extreme environments. These are; i) the increase i_ freeze point to -20°C for
operation in a cold environment and 2) the decrease in thermal stability for
operation on a hot day. Minor modifications may be required to accept fuels wit_ the
proposed changes in aromatics, viscosity, lubricity and water separation. Electrical
conductivity, flash _oint and vapor pressure changes are not expected to require any
changes to the baseli_,e aircraft design. Accordingly, the major emphasis in this
section will be conceptual design modifications which can accommodate the higher fuel
freeze point and the lower fuel breakpoint temperature. Several alternative
approaches are discussed. The more promising of these are evaluated in terms of
their impact on aircraft performance. Each concept was evaluated on the basis of its
effect on block fuel weight, increase in t_.keoff gross weight (TOGW), and percent
increase in specific fuel consumption (EFC). Finally, several reco_endatioas are
offered.
6.1 Freeze Point
6.1.1 Description of candidate systems. - The use of the proposed -20°C freeze
point fu_! requires modifications to the baseline aircraft to prevent fuel freezing
in the fuel tanks _nd to control fuel freezing in the fuel distribution system.
Systems for the prevention of freeze-out by heat addition in the fuel tanks and
distribution system with and without insulation are discussed in the following !sections.
6.1.1.1 Fuel tank heating without insulation: One means of preventing fuel
freeze-out is to heat the fuel by an amount sufficient to compensate for the aero-
dynamic cooling. There are several possible sources of heat for the fuel tanks.
These include; engine exhaust heat, e'gine bleed air, engine oil, and electric
power. The advantages and disadvantages of most of these heat sources have been
considered in previous studies (ref. 29) and therefore will not be discussed in
detail in this report. The use of engine exhaust heat has the least impact on the
" engine specific fuel consumption. Its disadvantages a_e the large weight penalty
associated with having a tailpipe heat e_changer and the necessity of a secot,dary
hea= transport fluid to meet safety requirements. Bleed _Jr as a source of heat has
the highest impact on fuel consumption. It has the additional disadvantage of
requi_it_ a bulky alr-to-fuel heat exchanger. Enginu oil would be the simplest and
most natural seleccion as a source of heat. qn=ortunately, _bls heat source does not
have sufficient capacity to prevent fuel freeze-out. The ase of electrical power has
the advantages of haling: i) a lower impact on fuel consumption than t_e use of bleed
air and; 2) a lower Installatlov weight and less complexity than the _se of exhaust
heat. In its present configur_'ion, the electrical system of the L-1011 does not
have sufficient generator capacity ro provide enough heat to prevent fuel freeze-oat
in the aircraft's non-lnsulated fuel tanks, dowever, the electrical system can bemodified to increase its capacity.
Heat can be input into the fuel by either of two _ethods, I) by a b llk fuel
"_ heater located near the center of th_ tan_ dnd _ by heating system which applies
• j
, ®1
1985010866-096

Peat directly to the Lottom of the tark. The f_r_ t 0_ethod has the ,_dvantage of
stmpllclty. A single, centrally located, heater c-an uqe electric pe.w_-. compressor
bleed air, or e,lgine exhaust energy to heat the {uel. The fuel circula _ on caused by
the existing boost pump scavenger system would tend to maintain a rou L _, u_liform
temperature within the bulk of the fu_l. However, f_lel te_perature prottI_q obtained
in flight tests shew that the fuel near the tank's lower surfaces Is generally much
colder than the bulk fuel. It is In this cold layer of fuel that fuel freeze-out
would first occur.
To prevent freeze-out in the fuel adjacent to the tank lower surface with the
first method, it would be necess_. I_o maintain the bulk fuel at a temperature tha_
" Is considerably above the fuel freeze point. The elevated bulk fuel temperaturp
would result in a higher rate of heat loss from the fuel and correspondingly higher
demand for heat from the fuel heating system.
The second method by which heat can be input into the fuel is to use a heating
system that covers the bot_ ._ of the fuel tanks. The advantage of this method is
_hat it concentrates _he heat in the coldest layer of fuel and results im a more
uniform temperature t_Gughout _he fuel. Natural convecLion produces sufficient
mixing even when the boost pump scavenger system is not c__ratlng. The _osc
important advantage of t_is method, is that it r_quires m'Jch less heat to prevent
fue] freeze-out than the first method. If the tanks: bottom surfaces are ma _tained
at a temperature equal to or sllghtly higher tban the fuel fre.,ze point Ibis is
sufficient to prevent freeze-out In the fu_l tanks. Although the bulk fuel
temperature may drop somewhat below the freeze point during long .'ange flights
because of heat loss th. ough Lhe upper skin, any freeze-out that occurs in the bulk
will eventually drop to the bottom and be melt_:d. Because the bulk fuel temperature
is lower wlth the secono method than with the first, the overall heat loss from tl,e
fuel tank is much lower and the heat input required from the [':el heating system is
considerably less. The large difference in heat requirement between the two l,ethods
favors the bottom surface heatlnN method.
The selection of the tank bottom surface heating method leads directly to the
choice of electric power as the source of heat. The other .ources of heat are
Incompatible with the bottom surface heating method since the27 wo_14 _equtre a large
number of small, Independently controlled heaters. Two tyres of electric heaterswere considere ; linear element heaters and foil heaters. Linear element heaters
have the advar_age of being relatively easy to Install. However, because cold spots
• would occur between the heater _.lements, they would have to be placed rather close
together and would have to be matntatneu at _ higher temperature than foil heaterswhich provide the most even heat, are lighter In weight, and can be fit into the
Irregular shapes betwee_ the rfbm and stringers attached to _he tanks, bottom
surface_. Fo_l heaters were selected for use in the recommended system.
The eleccrlc foil heaters incorporating fuel resistant Kapton insulation would be
applied directly to the bottom surfaces of the tanks in the areas between the rlbs
and stringers, Figure 45 shows a typical heater installation. T_e heater sys=e_ for
each tank Is made ,_p of an array of separately controlled panels that cover the
bottom of the tank. Each panel consists of a series of heating elements typically
made up of the area bo_,nded by a pair of ribs in the spanwise direction and as _ny
as five stringers in the chordwlse direction. These heating elements are
" interconnected electrically and controlled as a unit by means of a centrally J,)cated
temperature sensimg device and a fuel sensing device. The temperature of each pan_l
is independently maintained a_ a preset temperature. For thls _tudy, a temperature
" of +_'C _bove the fuel freeze ooint was selected In order to provide a ms-gin for
88
1985010866-097

7R=bstdlenerJ
%1i* R,b web _T1,'/ i tl , Heaterand tber-, rata wmnn /..... ° ' [i /"_ , t l / , Rib cap k
II _-----_--_a " " _ .AJ"I;I%"_'\\ 4 . . ._\N_LI.-- '-- "q r=_ _
/ /, -..., ....Stringer Clampring -Accessdoor Skin
Figure 45 - Fuel tank electric foil heaters wlo insulation (for all tanks).
tolerances in the temperature control system. When, as a result of fuel usage,
panels become uncovered by the receding fuel, the uncovered panels are automattcally
cut out of the system to minimize the heat loss and preclude excessive surfacetemperatures in the heating panels.
The present electrical system in the baseline aircraft has approximately 101.5
kVA excess capacity to _upply the fuel tank heating system in addition to the normal
aircraft electrical loads under the conditions of the cold day missions. Electrical
: heating power requirements predicted by the fuel tank thermal model indicate a peak
power requirement for the heating system of 270 kVA (figure 46) for the 9260 km (5000
n.ml.) cold day mission. This excessive power requirement is a valid reason for
questioning the selection of a -20°C freeze point. However, the peak power
requirement after 8.5 hours exceeds the available excess capacity for a freeze point
of -30°C (figure 47) and appears to be marginal if extrapolated to -35°C. Therefore,
the -20°C freeze point is retained in this study since the weight and cost systemsare essentially identical for any of these freeze point levels.
Three alternative modltlcations to the electrical system were considered. The
first modification involves replacing the three present 75/90 kVA engine driven
generators with three 175/220 kVA generators. This constitutes a major change in the
L-lOll's primary electrical system and, as such, produces several significant
problems. First, the entire electrical system would have to be extensively
redesigned. Second, the aircraft's new primary electrical system would have to be
requallfled by the FAA, a process which is costly and time consuming. Finally,limitations on the torque capacity of the engine's generator drive system, tke
structural load capacity of the generator mounting pads, and the available space
inside the engine nacelle may make thls modification practically impossible toimplement.
* 89
t*
•
1985010866-098
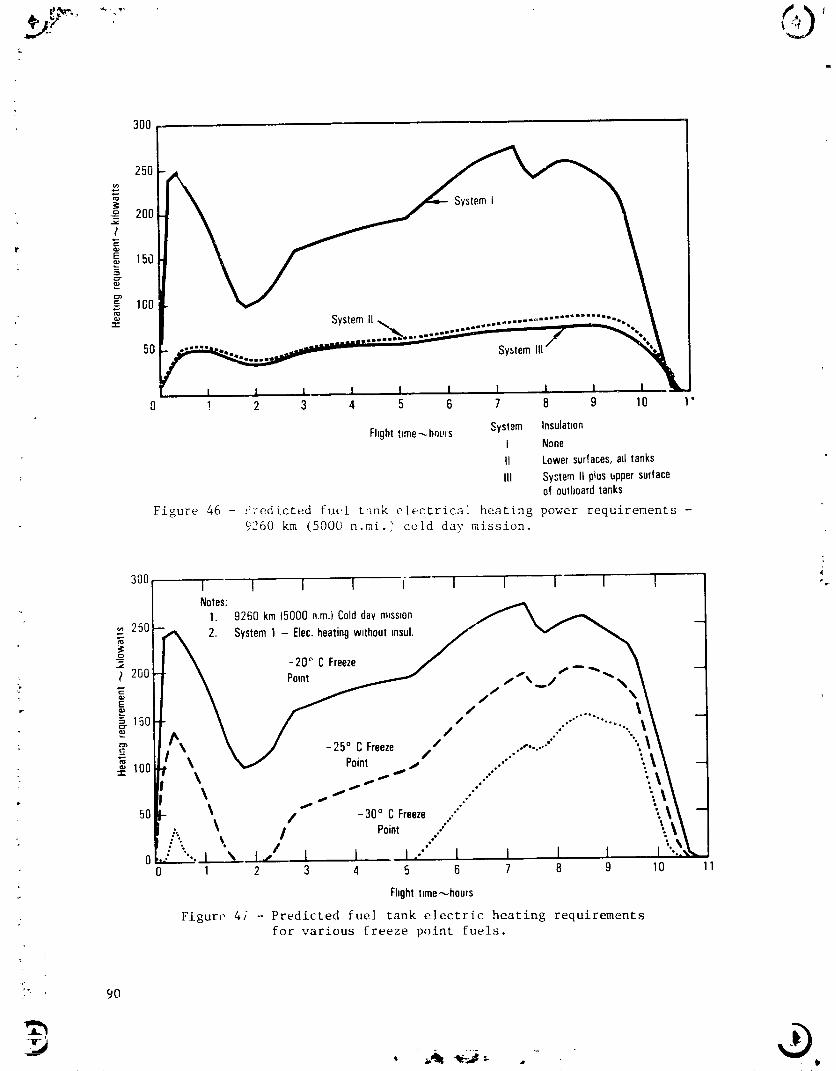
7
3OO
25O
200
_ 150
100
5O
0 ! 2 3 4 5 6 7 8 9 10 1'
Fhghttime-..,boors System InsulatmnI NoneII Lowersurfaces,all tanksIII SystemII plus_,ppersurface
of ouflmardtanks
Figure 46 - i'i-edictedfu_J _ank electrica] heating power requirements -9260 km (5000 n,mi.) cold day mission.
3001 I I 1 I I 1 1 1 I Ii II
I Notes:/
_ 2501 _. 2' Systeml-Elec'heatingw'th°utmsul'Jo _ _V__ --"
, _ 2ooU \ -2oocFree,e / _---- _ _'-" _ ,
_. 150
. _ loo
5o
o0 1 2 3 4 5 6 7 8 9 10 1
Flightt=me--,hours
• Figuro 47 - Predicted fuel tank electric heating requirementsfor various freeze point fuels.
9O
1985010866-099
The second alternative involves adding an additional generator to each engine.
The three new generators would be dedicated solely to supplying the electrical
requirements uf the fuel tank heating system. This less extensive modification
requires a lea_ complex FAA requaliflcatlon but generally involves the same design
_ difflcult_es previously discussed. In particular, a new generator mounting pad and
either a tandem or remote generator drive system pad must be added to the engine.
The third alternative involves a major change in the engine starting system. The
present pneumatic starting system would have _ be replaced with an electric
starter-generator system with the generator portlo_ of the system dedicated to
supplying the electrical requirements of the fuel tank beating system. A 150/200 kVA
rated SmCo starter-generator, required for eL_g_ne starting, could be mounted on the
existing starter-pad of each engine. In add. ice =- _ouivale_t generator unit would
have to be added to the APU to supply electric power for engine starting. Other
minor modifications include adding two electrical Inve_._rs and the additional wiringand contactors required by the starting system.
_he use of starter-generators as the electric power source fer the fuel tank
heating system has two major advantages. First, the c'i_ting =tar,=r pad and drive
system are able to provide the required torq_,_ _=paclty a_,_ accept the physical
dimensions of the starter-generator uni_. This greatly simp_fles the implementation
of this modification. Second, becaus_ vhe primary electrical zy-_em ts _.c_ altered
by this modification, FAA requaliflcati_, =_u_J 5= relatively easy. _e only major
disadvantage of this modification is that i_ r=cuires a uha-ge from pneumatic to
electric starting procedures, a requirement that, aL _he present time, would meet
considerable resistance in the airline industry. However, _t is anticipated =hat
"all electric aircraft" technologies will gain greater acceptance by _h= 1990 tlro
period considered in this study. Therefore, of the three sources of electrical
energy considered,the electric starter-generator modification was selected to supply
the electrical requirements for the unlnsulated fuel tank heating system.
6.1.1.2 Fuel tanP heating with insulation: The major disadvantage of the above
system is that it requires such a large quantity of e]ectrlc power that a major
expansion of the aircraft's generating capacity is necessary. Adding thermal
insulation to the fuel tanks significantly reduces the electric power required to
prevent freeze-out. The results of analyses conducted using the fuel tank thermal
model indicate that properly configured fuel tank insulation can reduce the electric
heating loads to a level that is below the excess capacity of the existing ge_eratlng
system. Thus with insulation, the penalties associated with expanding the generating
capacity can be avoided. Insulation is only considered in conjunction with fuel tank
heating because insulation without heating is insufficient to prevent fuel freeze-outduring the cold-day missions.
The results of the thermal analysis led to the definition of two alternative
configurations which employ insulation. In the first configuration, figure 48, alayer of insulation is applied to the bottom surfaces of all three fuel tanks between
the aluminum lower skin and the electric foil heaters. Other than being applied on
top of the insulation, the foil heaters are installed in the same manner as described
in the preceding section for the heating system without insulation.
The minimum insulation thickness required on the bottom surface depends upon
_ : whether or not the insulation covers the stringers. The thickness required for an
arrangement in which the stringers are not covered is approximately twice that
required for an arrangement in which the stringers are covered. Because covering the!
]9850]0866-]00

. Ribstiffener
i _ Ribweb /insolation
i i /
I, _ ./ / Foilheater _ Rib cap L,_
J
Stringer/ Clampring Accessdoor/ Skin'
Figure 48 - Fuel tank electric foil heaters with insulation
(for all tanks.)
stringers nearly doubles the area of coverage, the volume and weight of insulation
required to sufficiently reduce the electric heating requirement is roughly equal for i,
both arrangements. However, the arrangement in which the stringers are covered
results in a warmer bulk fuel temperature for the same heat input. The disadvantage
of this arrangement is that it is somewhat more difficult to install. _-
Based upon the thermal ana]ysls, an insulation thickness of 3.175 =m (1/8 in) was
selected for the study. This thickness met the objective of maintaining the total
aircraft wing heating load within the maximum of 101.5 kW excess capacity of the
existing L-1011 generators (figure 46). A further increase in the insulation
thickness did not signlficantly reduce the electrical power requirements.
The second configuration defined is identical to the first configuration in
regard to the bottom surfaces of the three fuel tanks. However, in the second
configuration, figure 49, a layer of insulation is added to the upper surface of Tank
2-outboard. The installation of insulation on the upper surface of Tank 2-outboard
is effective because normal fuel management procedures result in this tank remaining
full of fuel for long periods of time. When the tank is full, fuel is in contact
with the upper tank surface and a high rate of heat loss occurs. Fuel management
procedures are different for the inboard fuel tanks, Tanks I, 3, and 2-1nboard.
These _rocedures result in the fuel in the inboard tanks being consumed first. The
inboard tanks are full only for relatively sho_t periods of time and only for longrange flights. The air space (ullage space) that forms between the fuel and the
;, upper surface when the tanks are less than full provides sufficient insulation for_ the upper surfaces of these tanks. Therefore, the installation of the upper surface
i insulation in the inboard tanks is not advantageous.
_..
>
_ 92
1985010866-101

qibweb Ribstifle=
J II Heaterandthermostatwiring I[ Fo,Iheater B=bcap I,
/ /Smnger Accessdoor Skin
Figure 49 -Fuel tank electric foil heaters with insulation
(for tank 2-outboard.)
6.1.1.3 Engine fuel system heating: In addition to the fuel tanks , the engine
and APU fuel systems must be protected against fuel freeze-out. Since the enginesand the APU produce enough heat locally to prevent freeze-out when operating, thepotential for freeze-out exists only when one or more of these units is shut down. J
In the APU, freeze-out could be a common occurrence because the unit is normally shutdown in flight. Because the APU is used in flight as an emergency power source, its
fuel system must be made operable quickly. Freeze-out may also occur on theoccasions in which an engine is temporarily shut down in flight. Therefore, fuel
system heating is provided to insure that freeze-out will not prevent starting a shut
down engine or an APU when it is needed.
Two sources of heat were investigated: bleed air from an operating engine and
. electrical power. Of these, bleed air heating is the recommended method because itis possible to concentrate a large quantity of heat on several adjacent fuel system
components by simply directing the air through a discharge manifold onto the
components. To achieve the same effectiveness using electrical heating would requirethat specifically designed heating Jackets be fitted around each fuel system
component. Maintenance of the fuel system would be made more difficult by thepresence of these jackets. Because the heating system would be operated only forshort periods of time, the impact of using bleed air heating on the aircraft'soverall fuel economy is negligible.
Bleed air is available in the APU compartment and in the engine nacelles throughthe existing pneumatic system ducting. This system interconnects the three engines
and the APU so that bleed can be directed to inactive engines or to the APU from
active engines or from the APU when it is operating.
_"' g3
Vb
]9850]0866-]02

For the APU, air from the pneumatic system is ducted through shrouds which
surround the fuel llne_ within the APU compartment. This air is discharged from the
shrouds through manifolds that direct the air onto the fuel pump, oil-to-fuel heater,
fuel filter, and fuel control unit. A small portion of the air is used to heat the
segment of fuel llne that runs from the aft bulkhead to the APU. The entire APU fuel
system heater is controlled by a single valve located at the junction between the
heating syst and the bleed air interconnect llne. The installation of the control
valve, fuel line shrouds, and discharge manifolds for the APU is shown in figure 50.
For the engines, bleed air from the pneumatic system passes through shrouds
surrounding the network of fuel lines within the nacelle. This ai£ is discharged
from the shrouds through manifolds that direct the air onto the oil cooler(s), the
low pressure filter, and the low pressure pump. A small portion of the air is used
to heat the segment of fuel llne which, for the wing engines, runs from the wing tank
through the pylon to the engine nacelle and, for the center engine, runs from the aft
bulkhead to the r;acelle. As with the APU fuel system heater, the engine fuel system
heaters are controlled by a single valve for each engine. The installation of the
control valve, fuel line shrouds, and discharge manifolds for the engines is shown in
figure 51.
In addition to the fuel system components previously discussed, the segment of
fuel line that runs through the fuselage from the wing tanks to the aft bulkhead must
be protected against freeze-out. Without protection, this fuel llne would be subject
to the slow accumulation of freeze-out in flight. This is due to the constant flow
of vent air through the vapor/spillage shroud which surrounds this llne. The
recommended method for protecting this line is to mix a small quantity of bleed air i
with the vent air to maintain an air temperature above -17°C.i.
I
Fuelline sh,oudandmanifold %
Oil-to.fuel Fuelline Bleedairheater interconnect
line 'Fuelpump,
I
t
tNewvalve
Fuelfilter
/ i
Fuelcontrolunit
Figure 50 - APU fuel system heating.
_ 94
1985010866-103
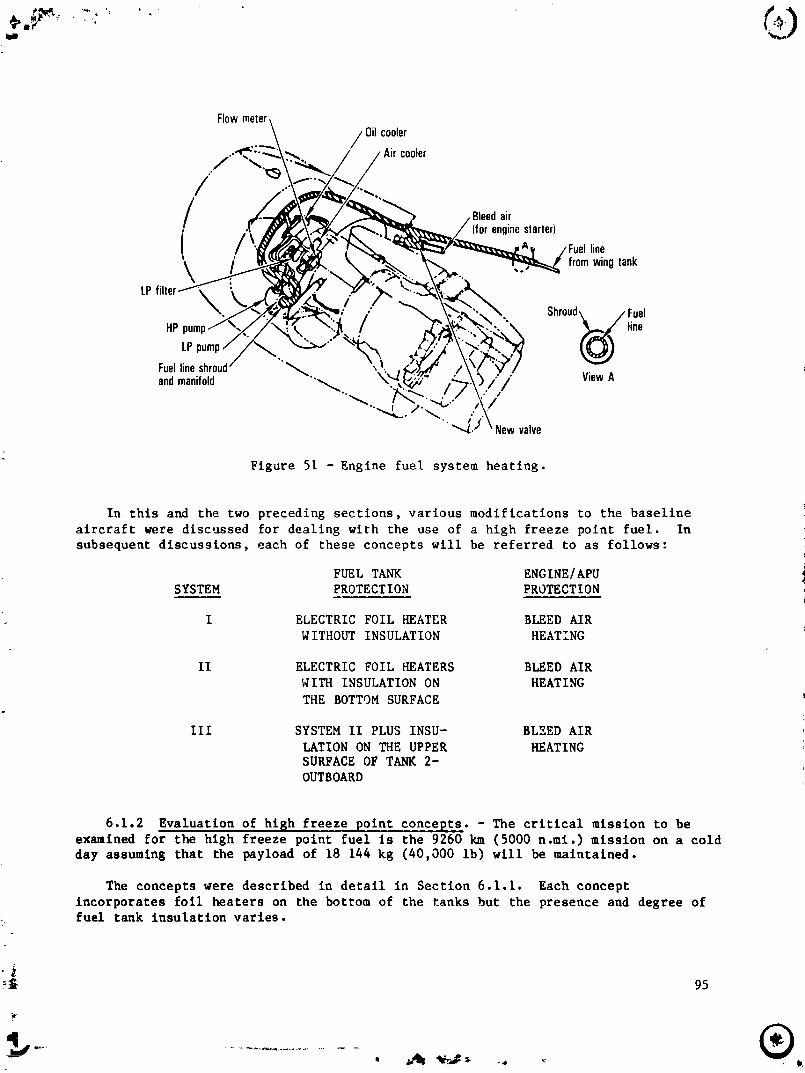
Flow
/ Oilcoolercooler
/"
air. (forenginestarter)
{ / line
fromwingtank
LP • Shroud\ / FuelHP / _=j(" line
LPpump . (0)V
Fuellineshrou ..,_.andmanifold "_ /'i' ViewA
")/'"4, Newvalve
Figure 51 - Engine fuel system heating.
In this and the two preceding sections, various modifications to the baseline
aircraft were discussed for dealing with the use of a high freeze point fuel. In
subsequent discussions, each of these concepts will be referred to as follows:!
FUEL TANK ENGINE/APUSYSTEM PROTECTION PROTECTION
I ELECTRIC FOIL HEATER BLEED AIRWITHOUT INSULATION HEATING
II ELECTRIC FOIL HEATERS BLEED AIR
WITH INSULATION ON HEATING
THE BOTTOM SURFACE i
I11 SYSTEM II PLUS INSU- BLEED AIR
LATION ON THE UPPER HEATINGSURFACE OF TANK 2-
OUTBOARD
6.1.2 Evaluation of high freeze point concepts. - The critical mission to beexamined for the high freeze point fuel Is the 9260 kin (5000 n.mi.) mission on a cold
day assuming that the payload of 18 144 kg (40,000 ib) will be maintained.
The concepts were described in detail in Section 6.1.1. Each concept
incorporates foil heaters on the bottom of the tanks but the presence and degree offuel tank insulation varies.
"_i 95
1985010866-104

6.1.2.1 Weight and electrical power assessment: Insulation weights for this
assessment are based upon a 50/50 mixture by volume of polysulflde and hollow glass
mlcrospheres. This insulation has a weight density of 16.45 kilograms per square
meter per _entlmeter (8.56 pounds per square foot per inch) of insulation thickness.
The roll heaters incorporate a fuel resistant Kapton insulatlon and have a weight of
0.4589 kilograms per square meter (0.094 pounds per square foot).
Electrical power for heating the fuel is supplied by the existing aircraft
electrical system modified to produce additional power, if required. The existing
L-1011-500 airplane generator capacity is capab]e of supplying 101.5 kW in excess of
; ship's requirements when all three engine generators are operating.
The loss of one of these generators can be replaced by _atuatlng the APU
generator. However, the probability of this failure o _urrlng is remote and was not
considered in this analysis. Its impact on the aircraft performance In the course of
a year's operation would not he significant.
The weights and electrical power requirements for each system are summarized in _,
table 12. An inspection of the table shows that System I with no fuel tank
insulation has a sizable weight advantage over the other systems considered.
However, its power requirement of 270 kW to heat the fuel is 168.5 kW more than is
available from the existing electrical system. To meet this requirement, the
existing pneumatic starting system would be replaced by a 150 kVA starter/generator
mounted on each engine starter pad and an equivalent generator on the APU for
self-contalned starting of the engines. These starter/generator systems are within
the state-of-the-art and would not entail any major development effort i(reference 30). I
TABLE 12 - WEIGHTS AND ELECTRICAL POWER REQUIREMENTS FOR iENGINE FUEL SYSTEM HEATING
J
-F }
Fuel Tank k Engine Starter/Sen Electrical Power Added ;Insulahon Heater Fuel System Net We,ght Required By Generator Capac=ty
Weight Wezght _ Heatmq Added Total Heaters KdowattsSystem kg Oh) kq (Ib) kq (Ib) kg (tb) k9 (Tb) K=lowatts
I
'_ I Heaters Only IF )Bottom Surfaces 0 0 59 1129) 46 (102) 61 (134) 470 (1030) ! 635 (1401) 270 270
II2 System 1 Plus
3 175 mm {1/8 m)
Insulahon Bottom 646 (1425) 59 (129) 46 (102) 51 (134) 0 (0) 812 (1790) 87 3 OSurfaces and F
Strmqers
3. System 2. Ptus
3 175 mm (1/8 m)
Insulahon on Top 779 {1717) 59 (129} 46 (102) 61 (134) 0 (0) 944 (2082) 74 8 0Surfa.:es and
Strmgers Tank 2
i Outboard
I , r
[
1985010866-105

J
From considerations of weight and electrical power requirements, System I,
because of its lighter weight, appears to be the most desirable. However, the addedcomplications of the starter/generator system may be a deterrent to its selection.
In that case, Systems II and III, which can operate within the existing aircraftelectrical power limitation, are more desirable.
6.1.2.2 Impact on aircraft performance: The parameters that best describe the
impact of these systems on aircraft performance are the increase in takeoff gross
weight and block fuel weight (reference Appendix). In table 13 the total effect on
gross weight and block fuel is divided into two parts. The first part is the effect
of the increase in the aircraft operating empty weight that is caused by the fuel
heating system. The second part is the effect of the increase in the engine specificfuel consumption which is caused by additional power extraction to provide for theincreased electrical requirements for the heaters. The total effects show that
System I has the least impact on the aircraft takeoff gross weight but requires morefuel to complete the 9260 km (5000 n.mi.) mile range than either of the systems usingfuel tank insulation. The increase in TOGW is a built-ln penalty which must be
evaluated during hot day operation. An inspection cf the payload/range curvediscussed eerlier, figure 7, shuws that none of the proposed systems affect eitherthe payload or the range of the aircraft adversely with the study payload of
18 144 kg (40,000 pounds). The primary concern of the operator is that this addedfuel consumption increases his operating costs.
TABLE 13 - IMPACT OF FUEL SYSTEM HEATING ON AIRCRAFT PERFORMANCE
All Engines Operating - Cold Day - 9260 kilometers (5000 n.ml.)
Effectof 0EWChange
Increase _ Block ABlockInEmptyWeight ATOGW Fuel ATOGW Fuel
System kg (Ib) kg fib) kg (Ib) _0EW AOEW
I 635 (1400) 1009 (2225) 317 (700) 1.589 0.499II 812 (1790) 1288 (2840) 408 (900) 1.586 0.r.,02
III 943 (2080) 1497 (3300) 476 (1050) 1.587 0.505
Effectof SFCChange
_%SFCDuetoAdditionalFuel _ Block A BlockConsumption ATOGW Fuel ATOGW Fuel
System % kg (Ib) kg (Ib) L__SFC A%SFC
I 0.554 494 (1089) 480 (1060) 892 (1966) 868 (1913)
II 0.196 175 (386) 155 (342) 893 (1969) 791 (1745)
III 0.171 152 (335) 132 (292) 889 (1959) 772 (1708)
+!
++I
+_ 97
]9850]0866-]06

' The table also includes sensitivity coefficients based upon the change in
operating empty weight and percent change in SFC incurred by each of the systems [or
evaluating the impact on payload/range of small changes in payload_
The possibility of modifying the flight profile by increasing flight speed and
decreasing altitude to raise the adiabatic wall temperature, which acts as a heat
sink for the fuel, was discussed and rejected in Section 5 because of the limited
cruise altitudes, 3048 to 3862 m (i0,000 to 13,000 it). Hence, this possibility wasnot considered in this assessment.
Failure of an engine during takeoff or during cruise must not prevent the
aircraft from completing its mission safely. Since the failure of an englue during
takeoff is one of the requisites for aircraft certification, the ability of theaircraft to maintain safe flight under such circumstances had to be assessed for each
of the systems. Because the aircraft could meet this condition with the maximum
increase in TOGW of 1496.9 kg (3300 ib), all of the systems were Judged satisfactoryfor takeoff.
The effects of an engine failure in cruise were also analyzed for each of the
systems on the cold day assuming the failure occurred at the midpoint of the 9260 km
(5000 n.ml.) flight and the aircraft continued to its destination. Figure 52 shows
the adjustment in cruise altitude from I0 688 m (35,000 it) at Mach 0.82 for three
engine operation to 8839 m (29,000 it) at Mach 0.71 for two engine operation in order
to maintain optimum km/kg (nautical mlles per pound) of fuel. This flight profiledeviation results in an additional block fuel usage of 5142 kg (11,338 ib).
143 engineprofileroach0.82
12 Enginefailureoccurs,_
!
lO I
'= 2 engineprofileroach0.71
• ." 8 I! I '.m,', | ;
4 II
2 III
0 I I, i i i [_ '0 1 2 3 4 5 6 7 8 9 10 11 12
t Flighttime _ hours
Figure 52 - 9260 km (5000 n.mi.) mission profile with loss of engine
f in mldcrulse cold day.
98
h
1985010866-107
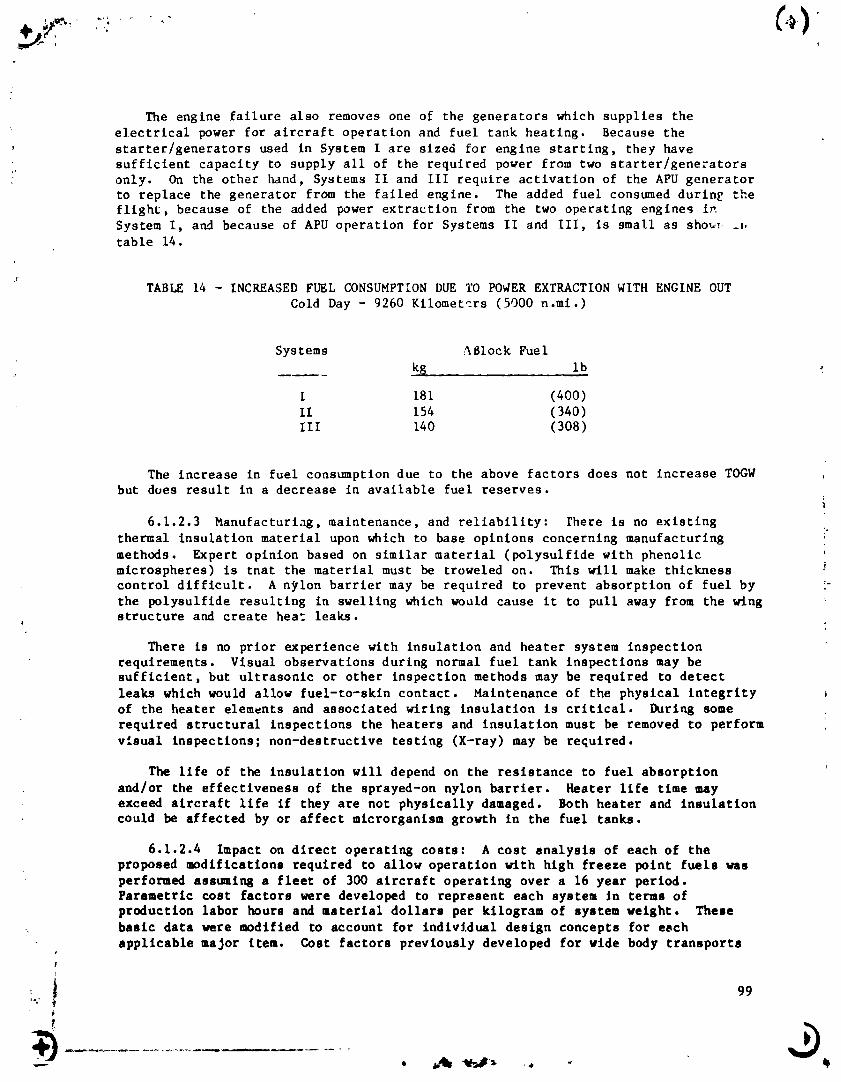
The engine failure also removes one of the generators which supplies the
electrical power for aircraft operation and fuel tank heating. Because the
starter/generators used in System I are sized for engine starting, they havesufficient capacity to supply all of the required power from two starter/generators
:" only. On the other hand, Systems 11 and 111 require activation of the APU generator
to replace the generator from the failed engine. The added fuel consumed durin_ theflight, because of the added power extraction from the two operating engines i_
System I, and because of APU operation for Systems II and III, is small as showy _i,table 14.
r
TABLE 14 - INCREASED FUEL CONSUMPTION DUE TO POWER EXTRACTION WITH ENGINE OUT
Cold Day - 9260 Kilometers (5000 n.mi.)
Systems ABlock Fuel
kg Ib
I 181 (400)
II 154 (340)III 140 (308)
The Increase in fuel consumption due to the above factors does not increase TOGWbut does result in a decrease In available fuel reserves.
l
6.1.2.3 Manufacturi._g, maintenance, and reliability: there is no existing
thermal Insulation material upon which to base opinions concerning manufacturing
methods. Expert opinion based on similar material (polysulfide with phenolicmtcrospheres) is that the material must be troweled on. This will make thickness
control difficult. A n_lon barrier may be required to prevent absorption of fuel by '-
the polysulfide resulting in swelling which would cause it to pull away from the wingstructure and create heat leaks.
There is no prior experience with Insulation and heater system inspection
requirements. Visual observations during normal fuel tank inspections may besufficient, but ultrasonic or other inspection methods may be required to detect
leaks which would allow fuel-to-skin contact. Maintenance of the physical integrityof the heater elements and associated wiring insulation is critical. During some
required structural Inspections the heaters and Insulation must be removed to perform
visual inspections; non-destructive testing (X-ray) may be required.
The life of the insulation will depend on the resistance to fuel absorption
and/or the effectiveness of the sprayed-on nylon barrier. Heater life time may= exceed aircraft llfe if they are not physically damaged. Both heater and Insulation
could be affected by or affect microrganism growth in the fuel tanks.
6.1.2.4 Impact on direct operating costs: A cost analysls of each of theproposed modifications required to allow operation with high freeze point fuels wasperformed assuming a fleet of 300 aircraft operating over a 16 year period.Parametric cost factors were developed to represent each system In terms ofproduction labor hours and material dollars per kilogram of system weight. These
:, basic data were modified to account for individual design concepts for eachapplicable major item. Cost factors previously developed for vide body transports
f
.... 3
1985010866-108

for fabrication, assembly, installation, and modification of valves, pumps, and other
components of the fuel system were used. The cost of insulation and heaterprocurement and installation was obtained informally from suppliers.
The premises and assumptions upon which this and subscquent cost analyses wpre
made are shown in table 15. The results of the cost analysis are sho_ in table 16.
Total acquisition costs re reflected largely in depreciation allowances in the DOC
computation and to a lesser _tent in insurance allowances.
The cost breakdown indicates that System I has the lowest maintenance costs
becaase it requires no insulation in the fuel tanks. To inspect the structural
elements of the aircraft, stripping and replacement of the heaters and insulation is
required in 8 percent of the fleet. The remainder of the fleet is required to strip
and replace the heaters and insulation at one half the aircraft life. These costs
more than offset the extra fuel required to operate the SmCo generators to f rnlsh
the 270 kVA needed by the heaters.
System II has the lowest fuel costs but has high maintenance costs because of the
insulation, consequently, the DOC of this system at thr fuel cost o_ $1.GO/gal is
greater than that for System I even though some parameters such a: increase in empty
weight and block fuel favors selection of System II. As the price of fuel increases,
this conclusion will eventually be reversed as discussed in Section 7.2.4.
TABLE 15 - COST PREMISE
Configuration L-IOII-500 Based on New Program Production Quantity 300
Operation
4IntertLational
Stage Length 9200 km (5000 n.mi.)
Utilization 4718 Block Hours/Year
Block Time 11.2 Block Hours/Trip
Trips per Year 421
Operational Life 16 years
Cost of Fuel $1.O0/Gallon (International U.S. Trunk - May 1982)
, Non Revenue Flying 1.23 percent
Acquisition Costs Included in Depreclatlon
Economics
Year t982
Labor Rates Lockheed (1982 Direct, Overhead, G&A, Other), Profit I0 percent
Maintenance
- Structural Inspection requires stripping and replacln 8 insulation and
heaters at 20,000 hours (4 times during llfe) on 8 percent of the
flaet plus l0 percent for miscellaneous checks.
- Life o_ insulation and heaters is assumed to be one half the aircraft
llfe requlrlng one strtpplng and replacement for the remainder of theaircraft.
- Labor Rate $13.93/hour- Burden Factor 3.13 (International)
_- I00
• _ _ • . .b
1985010866-I09

TABLE 16 - EFFECT ON DOC OF FUEL IIEATING SYSTEMS
(Thousands of 1982 Dollars)
I II TII
Ac_isitlon
Full Scale Engineering
Development (FSED) 7350 7350 7350
Procurement 99574 145203 t48523
Total Acquisition 106924 152553 155873
Direc______tOperatlngCostsFuel 537686 379435 407236
Insurance 4753 6776 6923 ,
Depreciation 96232 127298 140286Maintenance i003_i 260251 270173Total for Fleet 739032 773760 842618
Cost - $/(Ac Yr) 154 161 172
The added insulation weight in System III increases the cost of fuel, resultingin the highest DOC of the three systems. This also contributes to higher maintenanceand depreciation costs, causing System III to be the costliest of all of the systems.
6.1.2.5 Recommended system for high freeze point fuel: At present fuel prices_
System I is recommended for use with high freeze Folnt fuels because It has the ilowest acquisition and direct operating costs. Although it has the highest fuelconsumption due to its high electrical power requirements, this cost is more than
offset by its low maintenance costs. System I requires the development of a bonding
agent, which must be impervious to hydrocarbon fuel in order to ensure a dependable
intimate contact of the fuel heaters with the tank surfaces. In addition to havingthis requirement, Systems II and III require the development of the 50 percent
polysulflde and hollow glass mlcrosphere mixture insulation. A further advantage ofSystem I is that the starter/generator electrical power source is independent of the
existing aircraft electrical system which will not have to be recertified, whereas
the added power extraction requirements for Systems II and III will require
recertlftcatlon. As fuel prices increase in the future, System ii will becume thepreferred system because of lower fuel usage,
6.2 Thermal Stability
The proposed relaxation of fuel thermal stability from a JFTOT rating of 260"C to204"C has been shown, in Section 5.2, to require a reduction in peak fuel temperatureat the RPFCOC discharge from 135"C to 79"C. In the following paragraphs, alternateengine fuel system design modifications are proposed end ew!uated for effectivenessin accomplishing this reduction in bulk fuel temperat.re.
6.2.1 Descrlyclon of alternate systems. - The followi_g candidate systems willbe divided into two groups: those which decrease the bulk fu_l temperature and
'"i I01!
1985010866-110

i others which assure low fuel-wet surface temperatures in components located in the
hot region of the engine core. In the first group, when considering that the two [.
most important thermal loads in the fuel system _:iginate in the oil heat input and
the operation of the fuel pumps, three approaches were investigated: a) rejection of
engine oil heat to the atmosphere; b) rejection of engine oll heat to the fuel in the
wing tank; and c) reduction of fuel pump heat input. In the second group, the fuel
lines and fuel components exposed by their location to the highest fuel bulk heat
temperature are proposed to be cooled by air jackets and the feed arm structure by
the introduction of heat shields and air jackets. Introduction of advanced ceramic
materials with high resistance to structural loads and fatigue at high temperature
can be utilized, and thus reduce the thermal conductivit_
6.2.1.1 Rejection of oil heat to fuel tank: This modification permits making
full use of the cor'pactness of a single fuel/oll heat exchanger in each engine, while
providing an active control of the fuel temperature which is being aelivered to the
injectors. A schematic diagram of the modification is shown in figure 53. Fuel from
the tank passes through the LP fuel pump and FCOC after which a portion of the fuel
may be directed back to the fuel tank to maintain a maximum heat sink for oil cooling
wheu the engine fuel consumption is low. The fuel flow rate through the modulating
valve is controlled so as to limit the peak fuel temperature at the fuel _emperature
sensor to 79°C.
This system requires LP fuel and HP fael pumps of different capacities. The HP
fuel pump rating is determined by the engine fuel flow rate requirements at takeoff.
The LP fuel pump maximum capacity must accommodate the fuel flow rate at takeoff, in
aadition to the fuel flow rate which is required to provide adequate oil cooling
during the limiting flight, it is estimated that the volumetric capacity of the L=
fuel pump is about twice as high as the HP pump. The additional weight Laquirements
for this system are given in table 17.
TABLE 17 - FUEL BYPASS SYSTEM WEIGHT PENALTY _-
COMPONENT WEIGHT
(Per Engine) (Per Aircraft)
Increase in LP Pump Weight - kg (Ib) + 9.1 (29) + 27.2 (60)
Fuel Thermal Control - kg (ib) + 0.7 (1.5) + 2.0 (4.5)
Fuel Return Line - kg (Ib) + 30.4 (67) + 30.4 (67)_Engine 2)
Fuel Return Line
(Engines I and 3) - kg (ib) + 3.2 (7) + 6.4 (14)
Total for Aircraft - kg (ib) + 66.0 (145.5)
6.2.1.2 Rejection of excess oil heat to atmo_pheric air: This modification
achieves similar results to tlle scheme described in 6.2.1.1, but avoids the instal-
: latlon of fuel return lines. It requires, however, the addition of an alr/oll heat
exchanger. A schematic diagram of this modification is shown in figure 54. The
102
b
1985010866-111

I ] It.PFue,i,_. FuelTank _ Pump
In FCOC Out
ModulatingFuelValve
, I II PumpI, +
t I i I-atureSensor Regulator
ToEng;ne" Combustor
Figure 53 - Rejection of oil heat to fuel tank.
Fueltank L I--'--"-] Fuelline Jl--.------ Oilline I
LPfuelpump
Fuo,,o,,] IA'"°"I,.,exchanger exchanger
I" __L --'1 Fuel
'. thermal
,_ _r -'_ 3-wayL Jco,trol
I valve
HPpump
I I _ E,,gine
r Figure 54 - Rejection of excess oil heat to the atmosphere.
103
1985010866-112

delivered fuel temperature is indirectly controlled by splitti_,g the streams of oil
between the alr/oil heat excPanger and the fuel/oll heat exchanger by means of one
single proportional three-way valve. When the delivered fuel temperature approaches
prohibited limits, tLe three-way valve directs all the oll stream throuBh the alr/oll
heat exchang?r. In intermediate situations, the oll stream is split to achieve a
safe fuel temperature and still take advantage of the oll heat to improve the engine
SFC. In this scheme, the besellne system suffers a minimal impact. Table 18 shows
the weight penalty introduced by this modification.
TABLE 18 - AIR/OIL - FUEL/AIR HEAT EXCHANGER SYSTEM WEIGHT PENALTYv
COMPONENT WEIGHT
(P_r Engine) (Per Aircraft)
Air/oil Heat Exchanger - kg (Ib) + 6.8 (15) + 20.4 (45)
Three-way Valve and
Controllers - kg (ib) + 0.9 (2) + 2.7 (6)
Total fvr Aircraft - kg (ib) + 23.1 (51)
' Earlier versions of the L-lOll utilized a similar combination of alr/cooled oil
- coolers and fuel/cooled oil coolers. The difference with the present scheme
is that, in those earlier versions, the alr/cooled oil cooler w_s the primary heat
exchanger and the fuel cooled oil cooler was receiving only the excess oil heat. In
th - present modification, the choice of which heat exchanger is the primary cooler
does ,.ot arise since they are both used in parallel as far as the oil stream isconcernec.
When _,sing an 9ir heat ex¢"anger, a decision must be made on whether to use ram
air or fan ai£ for th_ heat exchanger. Since the controlling parameter is the
delivered fuel temperature, the worse conditions within a limiting 'ight have been
identified as being those at grout.d operations and descent. During ,round Idle and
taxiing, ram air is non-exlstent. Fan all 4q then the only source of cooling _ir for
the heat -xchanger.
6.2.1.3 Reduction of fuel pump heat input into the fuel: During ground
operations and descent this thermal load is a major contributor to the heat input
into the _uel. The baseline fuel system uses fixed displacement pumps whose speed is
mechanically coupled to the engine. The corresponding speed at which the fuel
pumping system is drive_ does not necessarily match, for a given delivery pressure,
the volumetric flow rate required by the engine. Accordingly, a bypass circuit is
provided for each pump to spill the excess fuel. As a result of this fuel flow
-: aaJustment, a significant thermal load is input into the fuel. A flow match to the
required fuel delivery pressure would result in a significant reduction in the
thermal load. Experience shows that with this approach, the temrerature increase due
to the pumping system could be reduced from approximately 32°C to 6 or 7°C.
Matching the r_qulred fuel flow rates and delivery pressures can be accomplished
by either using a variable displacement pumping system or using a variable speed
coupler between the pumping system and the engine. Figure 55 shows a schematic
/ diagram of the reduction of fuel pump heat input, using pump speed control. The pump
104
.-%t:
1985010866-113
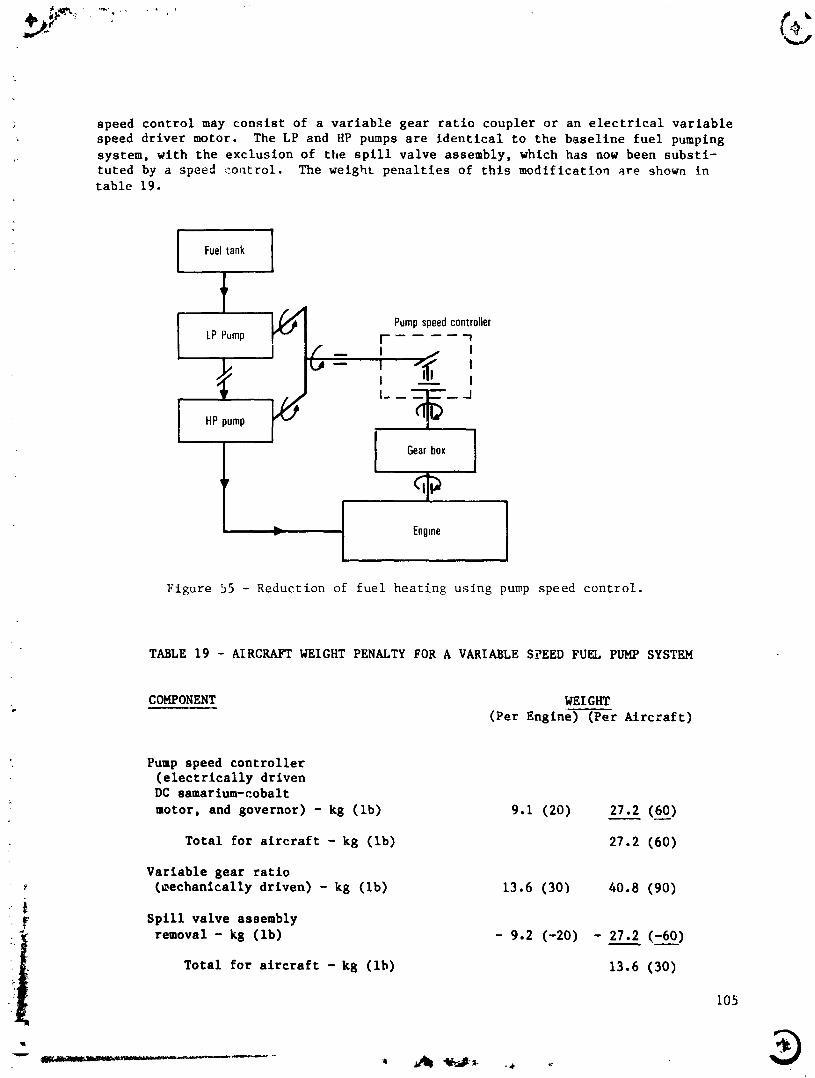
; speed control may consist of a variable gear ratio coupler or an electrical variable
speed driver motor. The LP and HP pumps are identical to the baseline fuel pumping
system, with the exclusion of the spill valve assembly, which has now been substi-tuted by a speed control. The weight penalties of this modification are shown intable 19.
Fueltank ]
. fI Pumpspeedcontroller
LPPump r- -_
ji -- I II -- I
I HPpump I- -- "_-- .,J
Engine
Figure 55 - Reduction of fuel heating using pump speed control.
TABLE 19 - AIRCRAFT WEIGHT PENALTY FOR A VARIABLE SPEED FUEL PUMP SYSTEM
COMPONENT WEIGHT
(Per Engine) (Per Aircraft)
Pump speed controller; (electrically driven
DC samarlum-cobalt
motor, and governor) - kg (lb) 9.1 (20) 27.2 (60)
Total for aircraft - kg (lb) 27.2 (60)
Variable gear ratio(_echanlcally driven) - kg (lb) 13.6 (30) 40.8 (90)
" _ Spill valve assembly
i!t removal - kg (lb) - 9.2 (-20) - 27.___2(-60)
Total for aircraft - kg (Ib) 13.6 (30)
• 105
...... _ ...... _ _1 "eft1l_ ._
1985010866-114

In this case the electrically driven pump has not been deducted from the total
weight since it has been adopted as backup to the pumping system in case of failure
of the mechanically driven system.
Figure 56 illustrates how to reduce the fuel pump heat Inp_,t when using a
variable displacement pump. The pump speed coupling to the engine speed is still
fixed, but the fuel flow rate and delivery pressures are matched by varying the pump
displacement. Flight qualified variable displacement pumps, which are presently
available, are mostly of the piston cylinder type and use sliding surfaces. The=_
pumps are more complex than the centrifugal and gear pumps, and have higher lubricityrequirements. For the baseline fuel system the maximum volumetric fuel flow rate can
be met by a variableodisplacement pump rated at 55 gal/min and with a maximum dis-
placement of 32.8 cm J (2 in.3). A typical weight for one of these pumps is 9.07 kg
(20 ib). A dual variable displacement pump of this rating, incorporating an LP/HP
capability, could be designed to weigh under 13.6 kg (30 ib). Table 20 gives theweight penalty.
Fueltank
Fuelre9ulator _ "] _'_J
rate control _ ,
, _ Engine
Figure 56 - Reduction of fuel heating using variable
displacement LP/HP pumps.
¢
] 9850 ] 0866-] ]5

TABLE 20 AIRCRAFT WEIGHT PENALTY FOR A VARIABLE DISPLACEMENT FUEL PUMP SYSTEM
COMPONENT WEIGHT
(Per Engine) (Per Aircraft)
Removal of baseline
LP/HP pumping system - kg (ib) - 36.3 (-80) - 108.9 (-240)
Installation of a dual
variable displacement
pumping system - kg (ib) + 13.6 (30) + 40.8 (90)
Total for aircraft - kg (ib) - 68.0 (-150)
Substitution of the baseline pumping system by a variable displacement pumping
system results not only in lower thermal loads, but also in a decrease in weight. Asdiscussed later, these advantages have to be weighed against higher complexity, lowerreliability and highor maintenance costs, relative to the previously discussed
system.
6.2.1.4 Reduction of fuel-wet surface temperatures in the core region: The fuel
feed and drain lines, manifold and distribution valves, and injector feed arms aresubjected to the hot environment of the core. The injector feed arms are exposed tothe most severe temperatures from heat conveyed by the compressor air. The fuel
lines, manifold and distribution valves are not so exposed to soak back heat because
of the stand-off mounting brackets supporting them to the core surfaces. Themodification suggested introduces coaxial stainless steel tubes of about 7.62 cm
(3 in.) in outside diameter, which are utilized in place of the existing 3.81 cm
(1.5 in.) fuel lines. The outer tube plays the role of a heat shield, and the air
gap in between serves as an impedance path to heat conductance. The outer tube can
be welded to shrouds which surround the distribution valves, extending in this manner
the heat shield throughout all the fuel-wet surfaces located on the core, except inthe injectors. During normal engine operation, the cavity between the heat shield
and fuel lines and components contains still air, and the fuel flow is sufficient to
keep the wet surfaces from reaching prohibitive temperatures. During engineshutdown, air could be blown, at different points, into this gap to reduce the enginesoakback heat. Figure 57 illustrates the concept in a section of the coaxial tube.
Two approaches can be adopted to reduce the wet surface temperatures in the feed
arms. The first approach, figure 58, uses a heat shield, directly in contact with
the compressor air, and protects the feed arm. The feed arm has been reduced to a
sing)e tube supported on the l_eat shield by structural cross members. At the end of
the feed arm, the bell-mouth burner penetrates the last sealed structural member.
With this disposition, the feed arm itself is kept at low temperatures while only the
bell-mouth is exposed to the compressor air temperature. The second approach does
not alter the original geometry of the baseline injectors, but it utilizes hightemperature ceramic materials instead of cast steel for the structure of theinjector. If necessary, the feed arm conduit itself can be lined with stainless
steel or other fuel compatible material. In this manner, the high rigidity of the
! original design is maintained while a high resistance path is presented to heatconduction from the compressor. Table 21 gives the weight penalties for this system.
i
.-,-: 107
1985010866-116
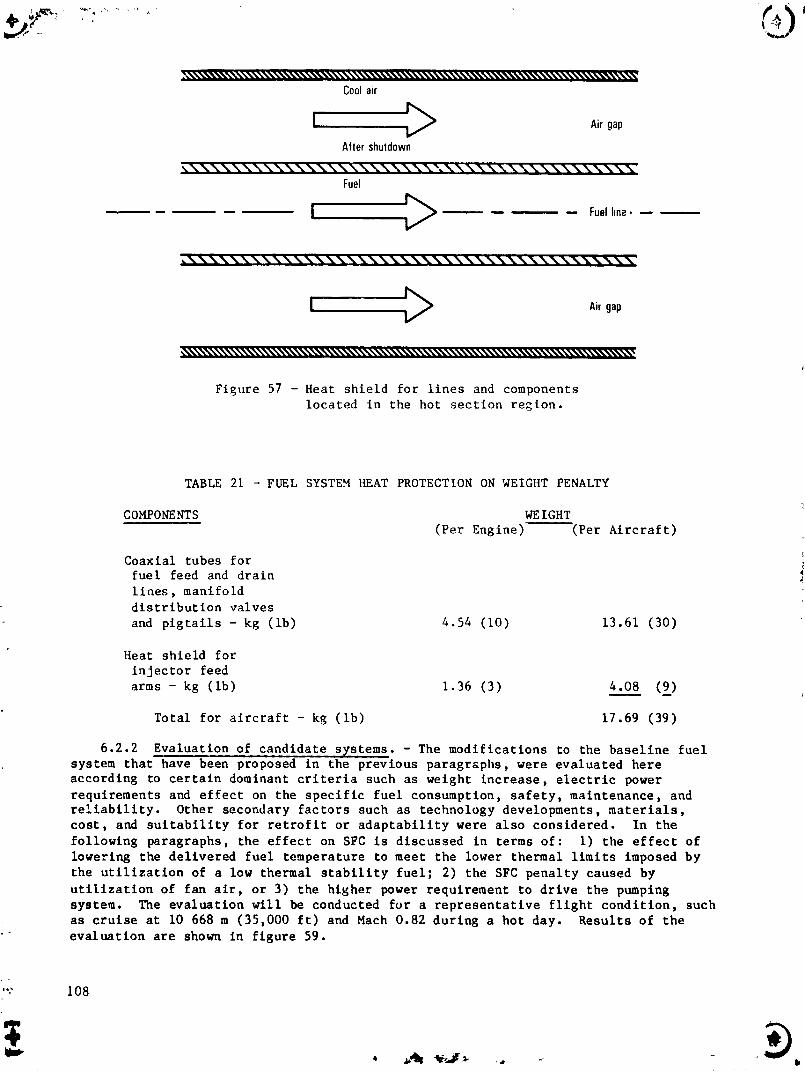
Cool air
[ > Air gapAfter shutdown
_\\\\\\\\\\\k%\\\k\\\\%%\kk%\%\\\\\\\%k%%\_-
Fuel
i > ..... Fuelline-
/ > Airgap
Figure 57 -Heat shield for lines and components
located in the hot section region.
TABLE 21 - FUEL SYSTEM HEAT PROTECTION ON WEIGHT PENALTY
COMPONENTS WEIGHT
(Per Engine) (Per Aircraft)
Coaxial tubes for
fuel feed and drain
lines, manifold
distribution valves
and pigtails - kg (Ib) 4.54 (i0) 13.61 (30)
Heat shield for
injector feed
arms- kg (Ib) 1.36 (3) 4.08 (2)
Total for aircraft - kg (ib) 17.69 (39)
6.2.2 Evaluation of candidate systems. - The modifications to the baseline fuelsystem that have been proposed in the previous paragraphs, were evaluated here
according to certain dominant criteria such as weight increase, electric power
requirements and effect on the specific fuel consumption, safety, maintenance, and
reliability. Other secondary factors such as technology developments, materials,
cost, and suitability for retrofit or adaptability were also considered. In the
following paragraphs, the effect on SFC is discussed in terms of: I) the effect of
lowering the delivered fuel temperature to meet the lower thermal limits imposed by
the utilization of a low thermal stability fuel; 2) the SFC penalty caused by
utilization of fan air, or 3) the higher power requirement to drive the pumping
system. The evaluation will be conducted for a representative flight condition, such
as cruise at i0 668 m (35,000 ft) and Math 0.82 during a hot day. Results of the
evaluation are shown in figure 59.
"," 108
1985010866-117

109I,
1985010866-118

t 110
®
1985010866-119

6.2.2.1 Rejection of oll heat to fuel tank: This scheme requires a return line
in addition to a fuel thermal control system. The weight penalty for the aircraft is
65.77 kg (145 ib) and additional power if needed to drive the LP fuel pump. The
system should be designed to provide oll cooling during takeoff, and the LP fuel p_mp
must therefore accommodate about 15 876 kg/h (35,000 Ib/hr) and be able to boost the
pressure by a_ much as 6894.4 kPa (I00 psi). This represents an increase in power
requirements from the HP rotor of 1.5 kW (2 HP) at takeoff and climb, and 0.7 kW (I
HP) for cruise. The effect on the SFC of the power required to recirculate the fuel
back to the wing tank is negligible.
6.2.2.2 Rejection of excess oll heat to the atmosphere: Rejecting excess heat
to the atmosphere has a simpler implementation than the previous system, and the
increase in SFC, due to heat loss, is negligible. The alr-cooled oil cooler requires
fan air in ground operations and in flight. The fan bleed represents an SFC penalty
in cruise of approximately 0.5 percent.
6.2.2.3 Reduction of fuel pump heat into the fuel: Besides the weight penalties
already discussed, additional electrical power of 12 kW is required to drive the
pumping system. In this case, however, the power required for the pumping system,
except for efficleucy losses, is adjusted exactly to the engine requirements at each
flight condition. This matching has a favorable impact on SFC, despite delivering
the fuel at a lower temperature. This system r_q,llres the installation of adc
motor, and therefore slight increases in maintenance, cost, and a decrease in
reliability. When the pump speed is mechanically controlled, the SFC improves byabout C.I percent; in addition to the weight penalties, there is a decrease in
reliability; and an increase in cost, maintenance, complexity, and oll lubrication
requirements.
When using variable displacement pumps, some of the criteria appear to move in a
favorable direction, including weight and specific fuel consumption. Variable
displacement pumps, however, are less reliable and require higher maintenance. From
the materials point of view, special liners for the cylinders may have to be built
from carbon treated steels to cope with poor lubricity fuels. The cost of these
pumps is also higher.
6.2.2.4 Reduction of fuel wet-surface temperatures in the core region: All the ,_.
schemes described in paragraph 6.2.1.4 can be implemented with minimum impact on the
aircraft, save for the increase in weight and the decrease in structural rigidity of
the injectors. The suggested introduction of ceramics as a structural member for the
injectors would be a new technological development. Because of the lack of detailed
temperature data in the area of the core, it Is difficult to predict the decrease in
surface temperature and the benefits which will be obtained with such schemes, and
further work in this area is recommended. Furthermore, it is not known whether these
surface temperatures are high enough to constitute a source of carbon deposition even
when utilizing fuel with a JFTOT of 204°C.
6.2.3 Recomended system for low thermal stabi!It _. - Limiting the engine
manifold fuel temperature to 79°C on a 54°C day cannot be accomplished by any one ofthe proposed systems. However, a combination of heat rejection to the fuel tanks and
to the atmosphere coupled with the use of a variable displacement high pressure fuel
pump and heat shielding of the fuel injectors can approach the 79°C target. Thissystem is illustr_ted in figure 60.
_i III
-i
1985010866-120

_[ Fueltank
I LPfuel _._ Faiair
pump
#Oil., [ Fuelcooled Aircooled _ _ Oil
(;out-_ [ oilcoo,_.rI Variablel_ oilcooler_ _ _indisplacementHPpump
Bypassto + . Bypassto
maintain [ Fuelflow ] maintainengine regulator engine
fueltemp _, fueltempbelow79°C above75°C
L ...... temperature ..... --Jsensor
Controltempto 77 ±2%Toenginecombustor
Figure 60. Recommended system for low tt.ermal stability fuel.
The primary heat sink for cooling the engine o11 is the engine fan air with anyadditional heat rejection required to limit the manifold fuel to 79°C going to thefuel tanks. A fuel temperature sensor _t the discharge of the fuel flow regulatorsupplies a slgnal to two flow modulating bypass valves which control the amoun, ofheat rejected to the fan air and to the fuel tanks. If the fuel temperature at themanifold exceeds 79°C, all of the engine oil is directed through the alr-cooled ollcooler and the fuel return bypass valve modulates fuel returned to the fuel tank to
supply any addltlonal cooling required. If the fuel temperature drops below 75°C,the fuel return bypass valve remains closed and the alr-cooled oil cooler bypassvalve bypasses oll flow around the cooler to maintain the required minimum tempera-ture.
A weight summary of these modifications in table 22 shows an OEW increase of38.56 kg (85 Zb).
TA3LE 22 - WEIGHT EVALUATION OF RECOMMENDED SYSTEM FOR FUEL COOLING
(Recommended Low Thermal Stability Fuel Only)
(11 Heat Rejection to Fuel Tanks - k8 (ib) + 65.8 (1451
Heat Rejection to Atmosphere - k8 (Ib) + 23.1 (511
(2) Replacement of HP pump wlthVariable Displacement Pump - kg (Ib) - 45.7 (100.8)
(3) Shields - kg (ib) + 4.1 (9)
Net Increase in Empty Weight - k8 (ib) + 47.3 (104.2)
112
1985010866-121
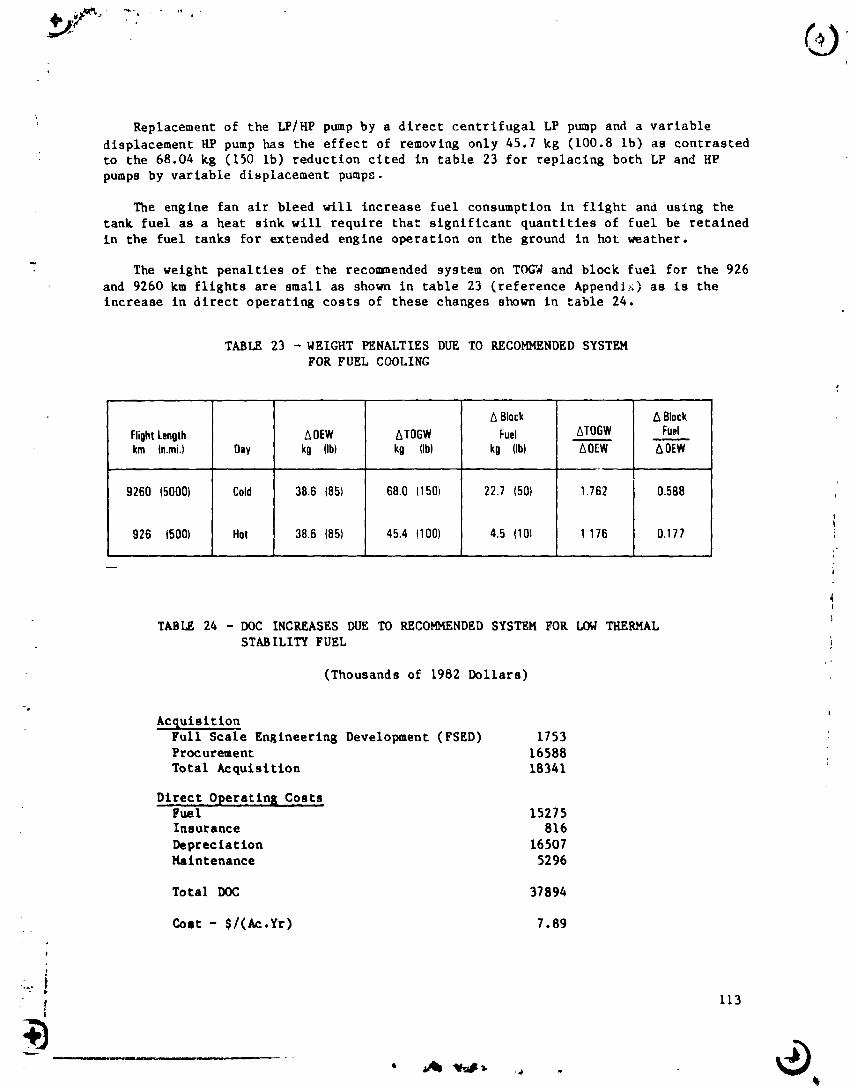
Replacement of the LP/HP pump by a direct centrifugal LP pump and a variable
displacement HP pump has the effect of removing only 45.7 kg (100.8 ib) as contrastedto the 68.04 kg (150 ib) reduction cited in table 23 for replacing both LP and HP
pumps by variable displacement pump_.
The engine fan air bleed will increase fuel consumption in flight and using the
tank fuel as a heat sink will require that significant quantities of fuel be retained
in the fuel tanks for extended engine operation on the ground in hot weather.
The weight penalties of the recommended system on TO_R and block fuel for the 926
and 9260 km flights are small as shown in table 23 (reference Appendix) as is theincrease in direct operating costs of these changes shown in table 24.
TABI_ 23 - WEIGHT PENALTIES DUE TO RECOMMENDED SYSTEM
FOR FUEL COOLING
ABlock A Block
FlightLength A0EW ATOGW Fuel ATOGW Fuelkm (n.mi.) Day kg fib) kg fib) kg (Ib) AOEW AOEW
9260 (5000) Cold 38.6 (851 68.0 (1501 22.7 (50) 1.762 0.588
926 15001 Hot 38.6 1851 45.4 11001 4.5 (lOI 1 176 0.177 iI.
!
TABLE 24 - DOC INCREASES DUE TO RECOMMENDED SYSTEM FOR LOW THERMAL
STABILITY FUEL
(Thousands of 1982 Dollars)
Ac_ulsltlonFull Scale Engineering Development (FSED) 1753Procurement 16588
Total Acquisition 18341
Dlrect Operating CostsFuel 15275Insurance 816
Depreciation 16507Maintenance 5296
Total DOC 37894
Cost - $/(Ac.Yr) 7.89
!
113
- ®
1985010866-122
6.3 Other Property Changes
The extensive aircraft and engine fuel system modifications such as are requiredt
to adapt to high freeze point and low thermal stability fuels are not typical of the
changes required to adapt to the other fuel property changeg being ¢onsldered.
Higher aromatics in the fuel increase the solubility parameter and thus may
require the selection of polymeric materials with higher values of the solubility
: parameter. For example, a transition to Buna-N copolymers with higher acrylonitrile
content can be made. The solubility parameter of Buna-N copolymers are known to
increase _th increasing acrylonitrile content in the copolymers. Another possible
modification is to use materials with very low values of the solubility parameter
such as the fluorocarbon polymers. Both of these approaches are state-of-the-art and
will have no impact on the aircraft performance.
The projected increase in fuel viscosity will cause a small increase in power to
overcome the associated increase in fuel line pressure drop and a minor decrease in
heat exchanger performance. However, the impact on aircraft performance will be
insignificant.
A reduction in lubricity characteristics of the fuel is acceptable providing
corrosion inhibitor additives are used in the fuel. However, because of the adverse
effect that such additives have on the water separation characteristics of the fuel,
a more feasible solution is to change the materials to carbon steel where friction
between surfaces is a problem.
Of the remaining properties, water separation and electrical conductivity are _
easily controlled and the changes being considered for flash point and vapor pressureare well within the range of Jet B fuel characteristics, a fuel on which all existing
Jet aircraft are certificated to operate.
,-."_ I14
1985010866-123
7. CANDIDATE ADVANCED FUEL SYSTEMS CONCEPTS
In Section 6, a number of fuel system design modifications were proposed which
would enable the L-IOII-500 airplane to perform satisfactorily with the relaxation of
a single property of ASTM D 1655-81 Jet A fuel. Although many fuel properties wereconsidered in the study, the vnly fuel properties which had a significant impact onthe aircraft performance were higher freeze point and lower thermal stability. In
this section, three alternative fuel system designs, each enabling the aircraft to
operate satisfactorily using a fuel incorporating all of the relaxed fuel propertiessimultaneously, are described and compared in terms of impact on the aircraft direct
operating costs.
o_ 7.1 Candidate Descriptions
Table 25 describes the three candidate systems, A, B, and C, in te_ms of the
modifications required to permit the use of a fuel having both a high freeze point
and a low thermal Etabillty. Each candidate incorporates the identical means of
protecting the engines and APU from fuel freeze-out by ductlng lot bleed air tonon-operatlng components and from excessive gum, varnish and coke formation by
providing a means of limiting peak temperatures in their fuel systems. The
candidates differ significantly, however, in the means of preventing freeze-out inthe fuel tanks. All of the candidates use electrical fo_l he..ters on the bottoms of
the tanks but candidate A requires an additional dedicated starter/generator to
replace the existing pneumatic starter on each engine and an equivalent generator onthe APU because of the excessive heat loss through the uninsulated skins. Candidate ,.
systems B and C do not require the added generate" capacity because the tank
insulation reduces fuel heat losses to a level that is within the electrical capacity
of the existing aircraft generators. Each of these systems will maintain the fuel
temperature in the tanks above -17"C w_ich is 3°C above the projected freeze point ofthe fuel. All other parts of the aircraft, non-operatlng engine, and APU fuel
systems are warmed by engine bleed air only as required to ensur_ their operationwhen activated.
Peak temperatures In the engine fuel system are reduced to levels which are
compatible with a JFTOT rating of 204°C by using engine fan alr, and wing tank fuel,
as well as fuel consumed by the englne, as a heat sink for engine ell cooling and by
using a variable displacement pump to reduce the high pressure pump heat rejection.
7.2 Performance Evaluation
Each of the candida_e systems impacts th_ overall performance of the airplane bycausing an increase in empty weight. E_pty weight increases cause an increase tn thetakeoff weight and subsequently result in an increase in fuel required to fly themlsslon. Increased power extraction to meet the higher electrical loads required forfuel tank heating also increases fuel consumption. These changes, however, will notprevent the ai:_lane from operating on the desired routes unless a limit, maximumtakeoff weight or maximum fuel capacity is reached. Even in this case the missioncan be completed by accepting a reduction in payload.
7.2.1 All engines operatln 8. - The three candidates are _ompared with each otherand with the baseline airplane in table 26 (established from InfGraatton obtained
from the Appendix). The total effect of :he systems on takeoff gross weight and
I t 15
®
1985010866-124

TABLE Z5 - CANDIDATE FUEL SYSTEMS CONCEPT DESCRIPTIONS
H,ghFreJzePu,,_tFuel LowThermalStabilityFuel
Candidate FuelTankModificatmn._ Engine/APUModifications Engine/APUMod=hcations
A o Electricfoil heaterontank o Replacepneumaticstarterwith o Oil heatrejectionto air,consumed
bottoms. Sin/Cos_arter/generator. _uelandfuel tanks.
o Bleedairheating, o Variabledisplacementhighpressurefuelpump.
B o Electricfoil heater, o Bleedairheati_,_.o Heatshieldingof fuel injectors.
o 3.175 mm (1/Sin.)insulation
ontank bottoms.
C o Electricfoil heater,
o 3.175mm (1/8in.)insulation
ontankbottoms,
o 3.175 mm(1/8 i,.) insulation
ontop of Tank2 outboard.
ModificationsR Jquiredby OtherF':_.;;'r_erW changes(No PerformanceEffects)
o Aromatics-materialschanges.
o Viscosity- nonereq_!red.
o I ubricity- materialchanges.o WaterSeparation- nonerequired.
o Elact,;r.alCoaductivity- antistaticadditivemay beaddedto fuel.o FleshPoint/VaporPressure• nonerequired.
_ 116
1985010866-125
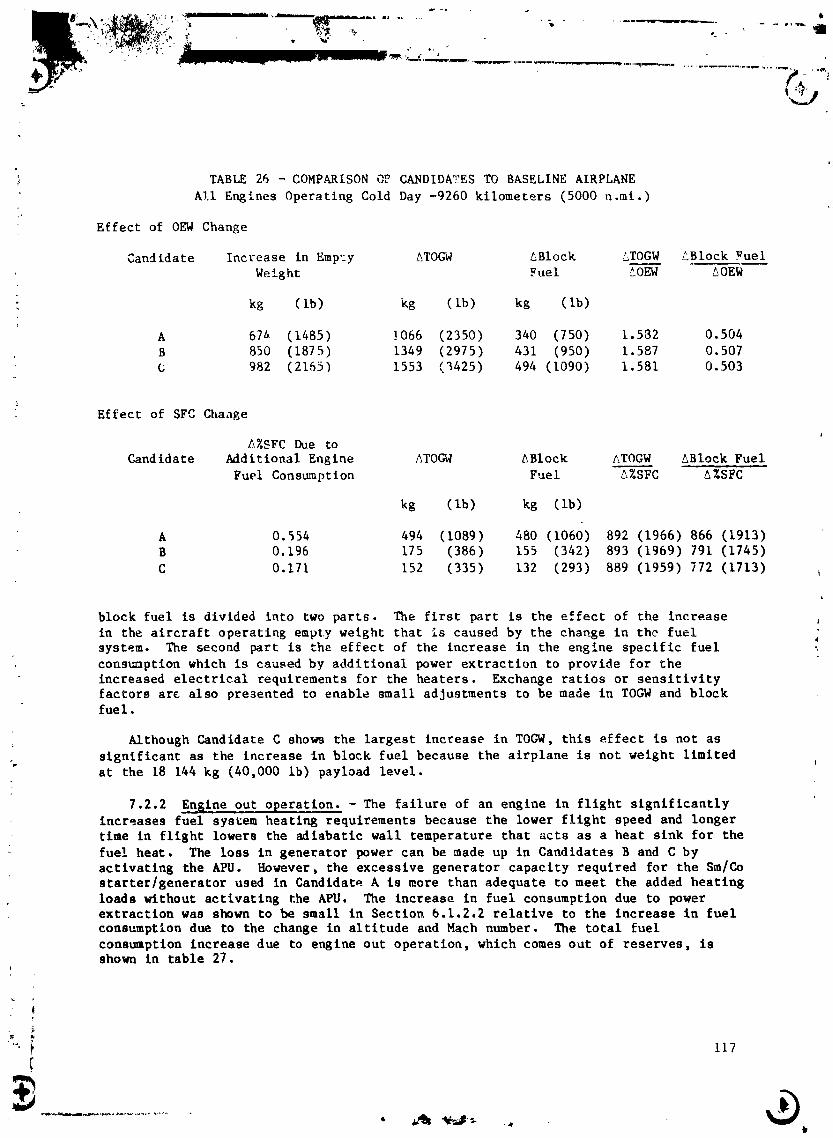
TABLE 26 - COMPARISON _,_=CANDIDATES TO BASELINE AIRPLANE
All Engines Operating Cold Day -9260 kilometers (5000 n.mi.)
Effect of OEW Change
Candidate Increase in Empty ATOGW _Block 5TOGW LBlock Fuel
Weight Fuel 50EW _OEW
- kg (Ib) kg (ib) kg (ib)
A 67& (1485) ]066 (2350) 340 (750) 1.582 0.504B 850 (1875) 1349 (2975) 431 (950) 1.587 0.507
C 982 (2165) 1553 (3425) 494 (1090) 1.581 0.503
Effect of SFC Change
_%SFC Due to
Candidate Additional Engine ATOGW ABlock 5TOGW ABlock Fuel
Fuel Consumption Fuel 5%SFC &%SFC
kg (ib) kg (ib)
A 0.554 494 (1089) 480 (1060) 892 (1966) 866 (1913)
B 0.196 175 (386) 155 (342) 893 (1969) 791 (1745)
C 0.171 152 (335) 132 (293) 889 (1959) 772 (1713)
L
block fuel is divided into two parts. The first part is the effect of the increase j
in the aircraft operating empty weight that is caused by the change in the fuel 4
system. The second part is the effect of the increase in the engine specific fuel
consumption which is caused by additional power extraction to provide for the
increased electrical requirements for the heaters. Exchange ratios or sensitivityfactors ar_ also presented to enable small adjustments to be made in TOGW and blockfuel.
Although Candidate C show_ the largest increase in TOGW, this effect is not as
significant as the increase in block fuel because the airplane is not weight limited
at the 18 144 kg (40,000 Ib) payload level.
7.2.2 Engine out operation. - The failure of an engine in flight significantly
increases fuel system heating requirements because the lower flight speed and longer
time in flight lowers the adiabatic wall temperature that acts as a heat sink for the
fuel heat. The loss in generator power can be made up in Candidates B and C byactivating the APU. However, the excessive generator capacity required for the Sm/Costarter/generator used in Candidate A is more than adequate to meet the added heating
loads without activating the APU. The increase in fuel consumption due to powerextraction was shown to be small in Section 6.1.2.2 relative to the increase in fuel
consumption due to the change in altitude and Mach number. The total fuel
consumption increase due to engine out operation, which comes out of reserves, isshown in table 27.
!
"._, 117f
k
i 9850i 0866-i26

TABLE 27 - INCREASE IN FUEL CONSUMPTION FOR ONE ENGINE CUT OPERATION
Cold Day - 9260 kilometers (5000 n.ml.)
Candidate _Block Fuel
kg (ib )
A 532_ (11,738)B 5297 (11,678)
C 5283 (11,646)
7.2.3 _Maximum payload for 9260 km (5000 n.mi.) rang_. - The operating limits of
the airplane become most critl al on the hot day ml sion. Thruqt limitations of the
engines in climb plus a higher fuel consumption force 'he airplane nearer to its
operaLiL_ limits. The IJwer thermal stability and high freeze point fuels further
impact the situation. The payload range curve for the hot _ay was _hown previously
in figure 7. At a range of 9260 km (5000 n.ml.) the aircraft has the potential to
carry 25 402 kg (56,000 ib) of payload, therefore, it is not limited by the chosen
payload of 18 144 kg (&O,O00 ib). Statistical anal>_Is shows, however, that for the
present airline average annual load factor, approximately 4 percent of the time the
flights will be full, a load factor of I00 percent. The impact of the increase in
OEW on maximum payload for each of the ¢_ndJdates is shown in table 28. The increase
in OEW reduces th_ maximum payload directly which means a reduction in cargo asindicated.
TABLE 28 - COMPARISON OF CANDIDATE SYSTEMS AT MAXIMUM PAYLOAD HOT DAY
9260 km (5000 n.mi.} Range
System AOEW Max. Payload Cargo
k_ (ib) kg (lb) k_ (ib)
Baseline 0 25402 (56,000) 2899 (6390)
A 674 (1485) 24728 (54,)15) 2225 (4905)
B 851 (1875) 24551 (54,125) 2053 (4525)
C 982 (2165) 24420 (53,835) 1916 (4225)
7.2.4 Comparison of direct operating costs. - The acquisition costs includingfull scale engineering development and procuremenL costs for a fleet of 300 aircraft
operating for 16 years have been factored into the direct operating costs for each
candidate aircraft. Direct operating costs for this comparison included fuel con-
sumption, insurance, depreciation, and maintenance only. The data are expressed inthousands of 1982 dollars in table 29. The effect of changing fuel cost is also
shown in the table and is illustrated in figure 61. Direct operating costs were
calculated for fuel costing $1.O0/gal, $1.50/gal, and $2.00/gal. The total fuel
costs for Candidate A are always highest. At the baseline fuel cost of $1.O0/gal the
depreciation and maintenance costs required for the fuel tank insulation inCandidates B and C more than offset the fuel costs. This is reflected by the lower
, direct operating cost for Candidate A. However, at the higher fuel costs, the
reduced fuel usage of Systems B and C overcomes the advantage of the less complex
i System A. The crossover in DOC occurs at $1.27/gai for System B which, on the basis
1985010866-127
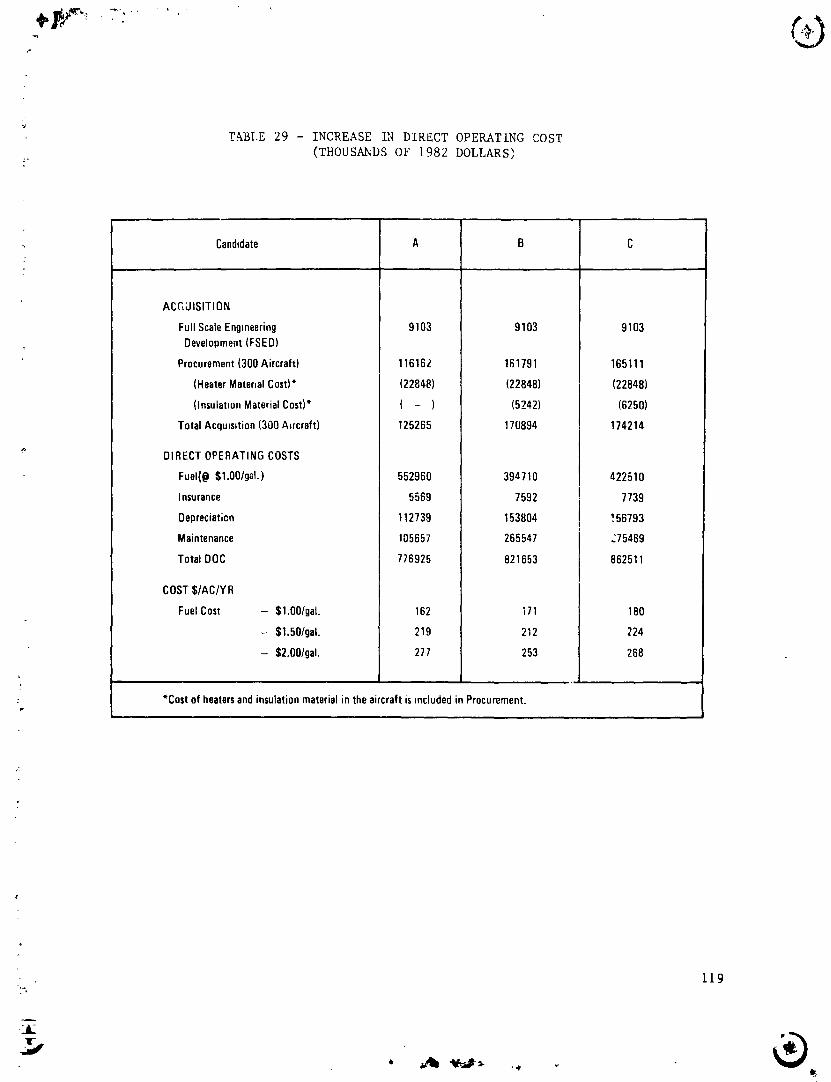
V
TABLE 29 - INCREASE IN DIRECT OPERATING COST
(THOUSANDS OF 1982 DOLLARS)
Candidate A B C
ACGUISITION
FullScaleEngineering 9103 9103 9103Development(FSED)
Procurement(300Aircraft) 116162 161791 165111
(HeaterMaterialCost)* (22848) (22848) (22848)
(InsulationMaterialCost)* ( - ) (5242) (6250)
Total Acquisition(300 Aircraft) 125265 170894 174214
DIRECT OPERATINGCOSTS
Fuel(@$1.00/gaL) 552960 394710 422510
Insurance 5569 7592 7739
Depreciation 112739 153804 1.56793
Maintenance 105657 265547 ._75469
Total DOC 776925 821653 862511
COST$/AC/YR
FuelCost - $1.00/gal. 162 171 180
- $1,50/gal. 219 212 224
- $2.00/gai. 277 253 268
: *Costof heatersandinsulationmaterialinthe aircraftisincludedin Procurement.p
119
1985010866-128

%
• tndldate A
c
i5o I I1.00 1.50 2.00
Fuelcost_dollars/gallon
Figure 61 - Impact of fuel cost on DOC.
of cost considerations, is therefore the preferred candidate. These incrementalcosts we[e Incurred because of baseline aircraft design modifications required to
adapt to a fuel with relaxed fuel properties. Assuming the relaxed properties wouldpermit a reduction In fuel production costs, some of which could be passed elong to
tL_ consumer, the price of fuel based upon 1982 dollars to permit the operator to
: break even after 16 years of operation was estimated to be as follows:
Candidate Fuel Price Reduction
Baseline $1.O0/gal.A $0.9855/gai.
B $0.9844/gai.C $0.9836/gal.
Conversely, if present fuel properties are maintained regardless of the quality
of crudes being delivered to the refinery, the cost of engine and airframe fuelsystem modifications would not be incurred. As an insurance that present fuel
, properties be retained, the aircraft operator could afford to Pay the following for
his fuel depending upon which modification had been contemplated:
" Candidate Fuel Price Increasei
Baseline $1.O0/gal.
A $I.0038/gai.B $I.0074/gai.
_' C $I.0075/gai.
120
1985010866-129
Although these price estimates would have no effect in fuel prices which are
determined primarily by the economic factors of supply and demand, they do represent
an allowable fuel price differential to recover costs of installing the variouscandidate fuel systems or insurance to preclude their need.
7.2.5 Support s_stems_ malntenance, safety. - A Samarium-Cobalt (Sm/Co) starter/generator is incorporated in Candidate A which replaces the pneumatic starter, valve,
and ducting. It requires a small gearbox adaptor, electricl converters, contactors,
and additional wiring. For the aircraft, this means acceptability problems because
of the new starting metLodology. This disadvantage in Candidate A is somewhat offset
by the necessity of recertifying the electrical system of Candidates B and C becauseof the higher electrical loads resulting from tank heating.
The control systems for all of the candidates are essentially the same and add a
degree of complexity which will entail added maintenance. However, it is not
_cpected to necessitate a change in malntenanc intervals. The presence ofinsulation in Candidates B and C should not require any additional _nspectlon time
compared to Candidate A inasmuch as the foll heaters, which all of the candidatesuse, are in essentially the same locations as the insulation and are subject to thesame environment. However, the insulation _s expected to require more cos_ly
maintenance to ensure its integrity and that of the aircraft structure which itcovers •
The insulation material, nylon coating and heaters must be stripped and replaced
during periodic structural inspections as defined in the premise outlined intable 15. The stripping and replacing of the ins Jlation material inside the confined
area of the wing tanks is a significant malnten ,ce task with the overall replacementrequiring approximately twice the original installation time.
The safety aspects of all candidates are identical and are a result of the
presence of additional electrical wiring in the fuel tanks. The physical Integ[Ity
of the heating elements and associated wiring insulation and isolation from fuel
vapors must be assured by the design methods employed to insure s_fe and dependableoperation.
7.3 Summary Comparison and Conclusions
Each of the candidates were compared to each other and to the baseline airplane
in Section 7.2. All of the candidates are capable of operating over flight ranges of
926, 3704, and 9260 km (500, 2000, and 5000 n.ml.) in the extreme hot and cold
environments developed in Section 3.2 using a fuel ,,_h the following propertiesrelaxed from ASTM D 16_5-81 Jet A fuel:
Freezing Point, °C (°F) -20 (-4)Thermal Stability, JFTOT, °C (°F) 204 (400)
Aromatic Contents, % Volume 35Viscosity, mm /s (cSt) at -17.8°C (O°F) 15 (15)Reid Vapor Pressure, kPa absolute (psia) 13.8 (2)
Flash Point, °C (°Y) 27 (80.6)Lubrlclty, WSD, mm 0.45
For purposes of this study, these fuel property changes are assumed to be the
maximum for which system design changes can compensate. Based upon this assumption,the candidate which best meets the goal of operating the aircraft with minimum
,. 121
1985010866-130

! performance penalty for the specified payload of 18 144 kg (40,000 ib) with low costfuel is Candidate A. Although this configuration has the highest fuel consumption,
its direct operating costs are lowest because it does not entail the high development
and maintenance costs necessary to obtain a suitable tank insulation. However, as
fuel costs increase in the future, Candidate B provides an increasing cost advantage
and is therefore considered the preferred system concept in the long term.
1985010866-131

r
8. RECOMMENDATIONS
Based upon the various analyses conducted and the results obtained in this study,
it Is recommended that additional research and development efforts be undertaken
prior to establishing limits for the allowable freeze point and thermal stability of
commercial aviation kerosene. Specifically, these include:
• Experimental determinations of Jet fuel properties at and below its
freeze point with emphasis on heat of fusion, thermal conductivity, and
specific heat.
• Experimental investigation of wax deposition and its effects on heat
transfer Into the fuel immediately adjacent to the bottom of a fuel tank.
• Details of the freeze-out phenomenon and its influence on fuel hold-up,
determined by experimental investigation and analytical modeling.
4
• Develop a dynamic model for the fuel coklng rates, capable of correlating
the laboratory characterization of Jet fuel in a fuel system operated at
high temperature. This model must account for the chemical kinetics of
the reactions occurring in the liquid phase as well as the diffusion of
the primary reactants and products throughout the fuel itself.
• With the help of the dynamic model, develop a small scale test that will
correlate with the maximum temperature that a fuel can be subjected to ina full scale engine fuel system before breakdown occurs. This test
should be capable of predicting the impact of time on the breakdown
temperature, i
• Development of a lightweight insulation which is compatible with Jet fuel
and which will adhere to fuel tank surfaces when subjected to a wide
range of environmental temperatures.
• Analyze requirements for airport facilities to refuel aircraft at ]
environmental temperatures below the fuel freeze point. The cost of .
operating and malntainlng these facilities as well as the equipment
required to transport the fuel from the refinery to its destination must
be included in evaluating the practicality of raising the fuel freeze b
point.
Implementation of these recommendations will provide industry with knowledge that can
provide a basis for making more accurate assessments of fuel property relaxstlon on
aircraft performance and lead to fuel system designs which are more practical and
possibly less expensive than those identified in this report.
_.4 123t
.J!
1985010866-132

APPENDIX
> The effects of the increases in operating empty weight (OEW) and engine specific
fuel consumption (SFC) for the L-lOll-500 are shown as a series of sensitivitycurves, figures 62 through 67. These curves can be used to determine the increase in
takeoff gross weight (TOGW) and block fuel weight necessary to accommodate changes inOEW and SFC.
The effects of increasing OEW were calculated with reference to the baseline OEW
of Iii 307 kg (245,390 ib) using the Lockheed Aircraft Mission Analysis Program. The
flight profiles for the increased OEW aircraft were flown using the same rules as thebaseline OEW aircraft and the profiles are similar to the zero OEW baseline profiles
except on the hot day 9260 kilometer (5000 n.ml.) mission where thrust limitations
force the profile to lower altitudes for the higher OEW increases. This change inaltitudes causes nonlinearity in the Ablock fuel and ATOGW lines for this case
(figure 64) whereas the lines for all of the other cases are linear. The change inTOGW is greater than the change in block fuel weight for a given increase in OEWbecause of the fuel necessary to carry the additional fuel and because of reserveincreases.
The effects of increases in engine SFC were also calculated using the Lockheed
Aircraft Mission Analysis Program. The same OEW of III 307 kg (245,390 ib) was used
for all of the missions and the flight profiles are all similar to the zero percent4change in the SFC baseline profiles that they are referenced to. Increases in block
fuel and TOGW were calculated by increasing the SFC over the entire length of themission. Because Domestic Reserves and International Reserves Part II are based on
the OEW there are no increases for them for an increase in SFC. International
Reserves Part I changes a little however, because of additional fuel flow at the endof the i_st cruise segment, i
;, _ 124
1985010866-133

t
Figure 62 - Effect of OEW on block fuel and TOGW - cold day,
125
"_°,
.......... ®
1985010866-134

' ©
goo|
;o°oF600
=.
__ 500
nm
4OO
3OO
200 _'_
100 _
0
2400
2200 i
_ 9260km(5000n.ml.)mission2000 3704 kr,;(2000n.mi.)m=ss=on
926 km(500 n.mL)missionL
41800
1600 1
°° /;S1400
1200 I
I000 J
.<sS"8OO
600S
4O0
2OO
0 f I I I I I I ,0 200 400 600 800 1000 120L 1400
OEW_ k9
Figure 63 - Effect of OEW on block fuel and rOGW- standard day.
_.,i 126
f
1985010866-135
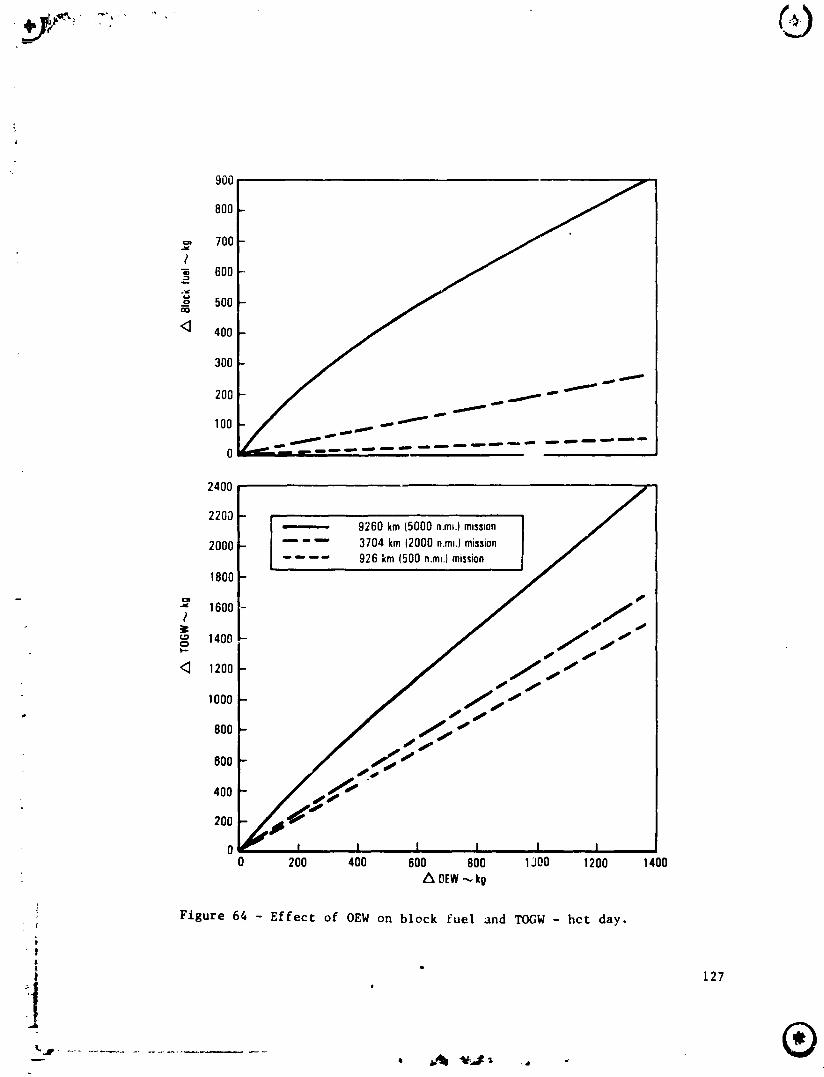
9oot800
,ooI- _ j_°°_ _ I
'°°o_/-_--_:;-------..... -------J2400
2200 - [ _ 9260km(5000n.mJ.)mlssmn
2000 J "" - "" 3704 km(2000n.ml.)mission.... 926 km(500n.mt.)mission1800 -
- _ ,_oo_- 7_''.-_]¢ s
1400
12oo ___ d t
1000 J;s _" J i
800 _ iJ
600 ,,.oj._,St t4O0
2OO
00 200 400 600 800 1300 1200 1400
A OEW._ kg
i Figure 64 - Effect of OEW on block fuel and TOGW - hcf day.I
e
- ®
1985010866-136

• 'r
3000 -
K
2500 -
2000 -
0_ 9260km(5000n.mi.)/
-_ 1500 -..=
,.e,s
1000 -
3704 kn, (2000 n. mi.) _-_
500 / ""
/ " 926km(500n.ml.I
" ---- ' T.]-- ""0 1 _' 0 1 2 3 4 5 6
PercentchangemSFC
Figure 65 - Effect of percen_ change in SFC on block fuel - cold day,
6000--I, w
5000--
4000--
, _ 3000
2000
/ 3704km(n.,,_,)__,
1000- .,_
/ ....."- _.. --_-- --7-----.
0 1 2 3 4 5 6
PercentchangeinSFC
F_gure 66 - Effect of percent change In SFC on block fuel - standard day,
I
I
I 128
I
1985010866-1
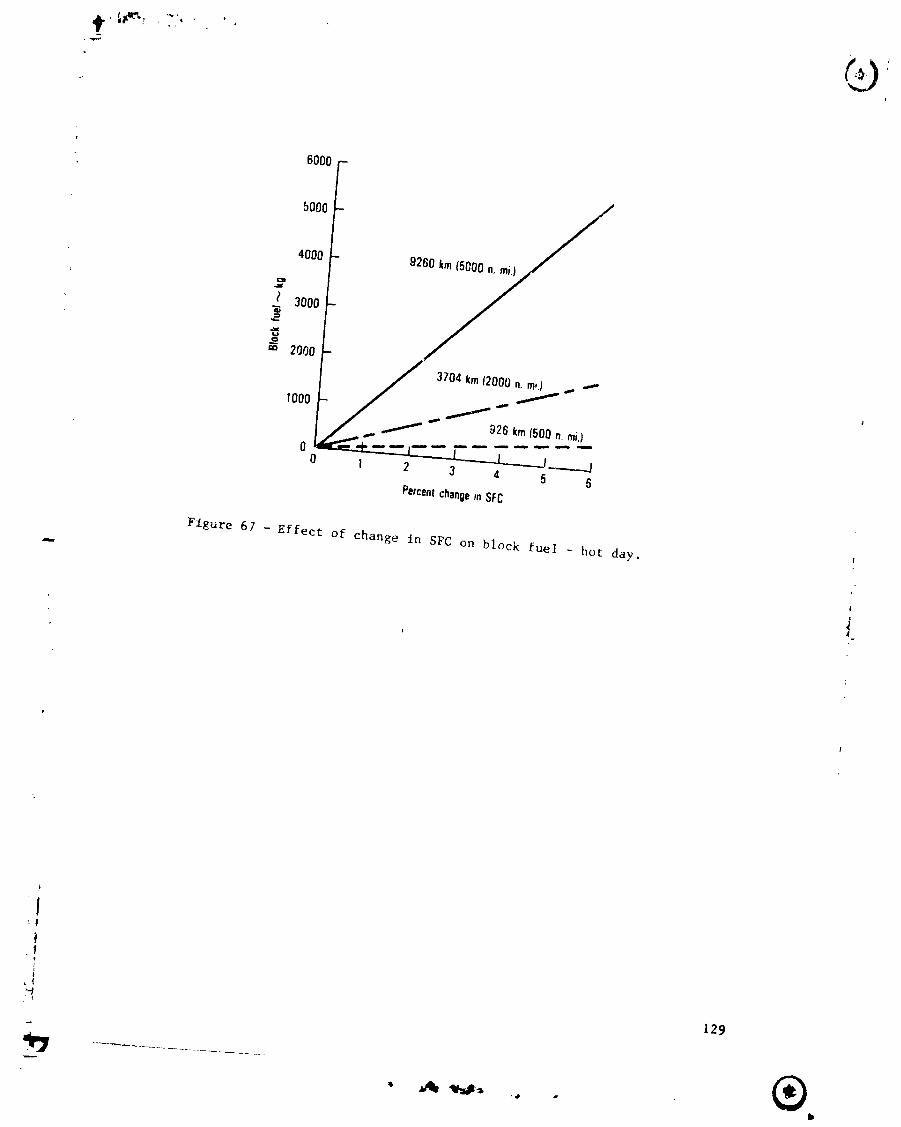
' 6000 F
5000 -
4000 - 926
,az¢
0 3000a)
2000
3704 km(2000n.m,,) ... "_"
1000 - ""/926 km{500._.mi.)
X.__+'-- ,-- r- T'-_0 .----_J0 I 2 3 4 5 6
Percentchange)nSFC
Figure 67 - Effect of change in SFC on block fuel - hot day.
!
ii
I,!t
i,( 129-
- ®1985010866-1_

References
? L Merrill Lynch, "Airline Industry Quarterly Statistics", September 1982.
2 Pasion, A. J., "In-flight Fuel Tank Temperature Survey Data", .NASAContractor
Report CR-159569, Boeing Commercial Airplane Company, Seattle, Washingtonprepared for NASA-Lewis Research Center under contract NAS3-20815, May 1979.
3 "Temperature for World Air Routes", by R. M. Wells, The Boeing Company dated
August 1962.
f 4 Shaw, H., Kalfadelis, C. I. and Jahnig, C. E.: "Evaluation of Methods to Produce
Aviation Turbine Fuels from Synt_:etic Crude Oils - Phase i", Technical Report
AFAPL-TR-75-20, Marc_ 1975 Exxon Research and Engineering Company, GovernmentResearch Laboratory, Linden, New Jersey.
5 Kalfadelis, H., "Evaluation of Methods to Produce Aviation Tdrbine Fuels fro_Synthetic Crude Oils - Phase 2", Technical Report AFAPL-TR-IO, May 1976, Exxon
Research and Engineering Company, Government Research Laboratory, Linden, New
Jersey.
6 Grobman, J. S., Stanley, W. L. with Weyant, J. P. and Mikolowsky, W. T., "The
Potential Role of Technological Modifications and Alternative Fuels inAlleviating Air Force Energy Problems", R-1829-PR, December 1976, a report
prepared for United States Air Force Project Rand, Rand Corporation, Santa
Monica, Californla.
7 Blazowski, W. S. and Jackson, T. A., "Evaluation of Future Jet Fuel Combustion
Characteristics", Technical Report AFAPL-TR-77-933, July 1978, Air Force Aero
Propulsion Laboratory, Air Force Wright Aeronautical Laboratories, Air Force
Systems Command, Wright-Patterson Air Force Base, Ohio.
8 Seng, Gary T., "Characterization of an Experimental Referee Broadened-
Specification (ERBS) Aviation Turbine Fuel and ERBS Fuel Blends", NASA Technical .
Memorandum 82883, Lewis Research Center, Cleveland, Ohio, August 1982.
9 Longwell, J. P., Editor, "Jet Aircraft Hydrocarbon Fuels Technology", NASA
Conference Publication 2033, a workshop held at Lewis Research Center,Cleveland, Ohio, June 7-9,1977.
I0 "1981 Annual Book of ASTM Standards, Part 23, Petroleum Products and Lubricants
(I): D 56-D 1660.
II Friedman, R., "Aviation Turbine Fdel Properties and Their Contents", NASATechnical Memorandum 82603, prepared for the 1981 West Coast International
Meeting sponsored by the Society of Automotive Engineers, Seattle, Washington,August 3-6, 1981.
12 Stockemer_ F. J., "Experimental Study of Low Temperature Behavior of Aviation
i Turbine Fuels in a Wing Tank Model", NASA Contractor Report 15915,
i Lockheed-California Company, Burbank, California, prepared for NASA LewisResearch Center (Contract No. NAS3-20814), Cleveland, Ohio, May 1981.
130
1985010866-139

k
_3 Duke, W. G., "Refining Jet Fuel for Thermal Stability', NASA TM-79231, Jet Fuel
Thermal Stab[llty, a workshop held at the NASA Lewis Research Center, Cleveland,
Ohio, November 1-2, 1978, pp. 79-85.
14 Hazlett, R. N., "Chemical Aspects of Deposit Formation", NASA TM-79231, Jet
Fuel Thermal Stability, a workshop held at the NASA Lewis Research Ce.nter,
Cleveland, Ohio, November 1-2, 1978, pp. 53-78.
15 Taylor, W. F., "Changes and Their Challenges", NASA TM-79231, Jet Fuel Thermal
Stability, a workshop held at the NASA CP2146, Aircraft Research Center,
Cleveland, Ohio, November 1-2, 1978, p. 24.
16 Nowack, C. J. and Delfosse, R. J., "Determination of Jet Fuel Thermal Deposit
Rate Using a Modified JFTOT", NASA CP 2146, Aircraft Research and Technology for
Future Fuels, a symposium held at NASA Lewis Research Center, Cleveland, Ohio,
April 16-17, 1980, pp. 181-193.
17 Vranos, A. and Marteney, P. J., "Experimental Study of Turbine Fuel Thermal
Stability in an Aircraft Fuel System Simulator", NASA CP 2146, Aircraft Research
and Technology for Future Fuels, a symposium held at NASA Lewis Research Center,
Cleveland, Ohio, April 16-17, 1980, pp. 169-179.
18 Moses, C. A., Sefer, N. R. and Valtierra, M. L., "An Alternate Test Procedure to
Qualify New Fuels for Navy Aircraft", A!AA-82-1233, AIAA/SAE/ASME 18th Joint
Propulsion Conference, Clev_land, Ohio, June 21-23, 1982.
19 Vere, R. A., "Aviation Fuel Lubrlclty", AGARD-CP-84-71, AGARD Conference
Proceedings No. 84 on Aircraft Fuels, Lubricants, and Fire Safety, 37th Meeting
of the AGARD Propulsion and Energetics Panel held at the Konlnklijk Instltuut
van Ingenieurs, The Hague, Netherlands, May 10-14, 1971.
20 LR 29665-12 "NASA In-flight Fuel Temperature Profile Measurement",
Lockheed-Callfornia Company report dated 15 October 1981.
21 "IATA In-fllght Fuel Temperature Report", Boeing letter report prepared under
NASA Contract NAS 3-20815 addressed to ASTM Technical Division "J", dated 9 June
1978.
22 Vranos, A. and Marteney, P. J., "Experimental Study of the Stability of Aircraft
. Fuels at Elevated Temperatures", NASA CR-165165, prepared by United Technologies
Research Center, East Hartford, CT, prepared for NASA Lewis Research Canter,
Cleveland, Ohio, December 1980.
23 "Fuel Temperature Survey", CALTEX Affiliated Companies' Aviation Facilities
dated November 1963.
24 Lohmann, R. P., Szetela, E. J., and Vranos, A., "Analytical Evaluation of the
Impact .: Broad Speciflcatlo_ Fuels on High Bypass Turbofan Engine Combustors",
(United Technologies Corporation, East Hartford, CT), NASA CR-159454, December, 1978.
25 Taylor, J. P., "Analytical Evaluation of the Impact of Broad Specification Fuels
; on High Bypas_ Turbo Fan Engine Combustors", Final Report (General Electric
: Company), NASA-CR-159641, August 1979, p. 52.f
. ! 131
- ®
1985010866-140

26 J.H. Hildebrand and R. L. Scott, Solubility of Non-Electrolytes, 3rd Edition,Reinhold, New York, N.Y., 1950.
27 "Standard Handbook of Engineering CalculaLions", by T. G. Hicks, pp. 3-343
through 3-345, McGraw-Hill Book Company, 1972.
28 "Atomization of Crude and Residual Oils", by A. K. Jasuja, Transactions of the
ASME, Vol. I01, April 1979.
29 NASA CR-135198, "Preliminary Analysis of Aircraft Fuel Systems for Use with
Broadened Specification Jet Fuels", A. J. Pasion, I. Thomas, the Boeing Company,dated May 1976.
30 "The All Electric Airplane: Its Development and Logistic Support", by Michael
J. Cronin, Lockheed-Californla Company - IEEE Paper No. 0547-3578/81/000-0241dated 1981.
_ 132
.....Ii
1985010866-141