tsa’s security playbook
TRANSCRIPT

TSA‟S SECURITY PLAYBOOK R E S U L T S O F A N A T I O N A L S U R V E Y O F P L A Y B O O K A N D S E C U R I T Y I M P L E M E N T A T I O N A T C A T E G O R Y X , I , A N D I I A I R P O R T S
January 2012
Principal Investigators: David Weisburd & Cynthia Lum
Project Team: Charlotte Gill, Devon Johnson, Linda Merola,
Julie Hibdon, Jaspreet Chahal, and Heather Vovak
Center for Evidence-Based Crime Policy, George Mason University

i
TSA‟S SECURITY PLAYBOOK P H A S E 2 T E C H N I C A L R E P O R T : R E S U L T S O F A N A T I O N A L S U R V E Y O F P L A Y B O O K A N D S E C U R I T Y I M P L E M E N T A T I O N A T C A T E G O R Y X , I , A N D I I A I R P O R T S
AUTHORED BY:
Charlotte Gill, Julie Hibdon, Cynthia Lum, Devon Johnson, Linda Merola, David Weisburd,
Breanne Cave, and Jaspreet Chahal
Center for Evidence-Based Crime Policy
George Mason University, Department of Criminology, Law and Society
4400 University Drive, MS 6D12
Fairfax, VA 22030
http://www.cebcp.org
FOR:
The Department Of Homeland Security, Science & Technology Directorate
Human Factors/Behavioral Sciences Division
Program Manager: Richard Legault, Ph.D.
S&T HFD MS#0207, DHS
245 Murray Lane
Washington, D.C. 20528-0207
ii
Table of Contents
List of Figures iii
Acknowledgments iv
Executive Summary v
1 INTRODUCTION 1
2 FINDINGS FROM A NATIONAL SURVEY OF CATEGORY X, I, AND II AIRPORTS 4
Survey Methodology and Implementation 4
Survey Results 5
Purpose and Process of Playbook (Questions 1-11) 6
Selection and Implementation of Plays (Questions 12-16) 12
Use of the Randomizer (Questions 17-25) 15
The Nature of Locally Developed Plays (Questions 25-29) 17
Cooperation and Collaboration with Non-TSA Agencies (Questions 31-32) 17
Perceptions of Playbook (Questions 30, 33-37) 19
Effectiveness of Playbook (Questions 39-44) 21
3 ANALYSIS OF HOURLY IMPLEMENTATION DATA 28
Independent (TSA-Only) Plays 29
Plays that Require Cooperation with External Entities 32
Plays Not Classified in the Matrix 35
4 CONCLUSION 37
Future Directions 39
5 REFERENCES 40
APPENDIX A: SURVEY INSTRUMENT AND COVER LETTERS 41
APPENDIX B: AIRPORT CATEGORY DEFINITIONS 52
APPENDIX C: RESEARCH METHODOLOGY 53
iii
LIST OF FIGURES
Figure 1. Response rates by airport category 6
Figure 2. Date of Playbook implementation (Survey Question 4) 7
Figure 3. Approximately what percentage of all security operations at your airport consist of Playbook activities?
(Q5) 8
Figure 4. Individuals attending Playbook meetings frequently (Q8) 9
Figure 5. Individuals attending Playbook meetings rarely (Q8) 10
Figure 6. Which of the following individuals or groups at your airport received formal training about Playbook?
(Q9) 11
Figure 7. How well do the following groups understand the purpose of Playbook? (Q11) 12
Figure 8. During an average week, approximately how many plays are used per day? (Q13) 13
Figure 9. In which areas of the airport do plays occur most frequently? (Q14) 14
Figure 10. In which areas of the airport do plays occur least frequently? (Q15) 15
Figure 11. Approximately how often is the Randomizer run? (Q18) 16
Figure 12. How often do the following organizations/agencies at your airport collaborate with TSA to implement
plays? (Q31) 18
Figure 13. How would you rate the cooperation between TSA and other agencies at your airport when it comes to
Playbook activities? (Q32) 18
Figure 14. When selecting and implementing plays, how often do those in charge take into account how plays
might negatively affect the following factors? (Q30) 19
Figure 15. In your opinion, do the following groups have a positive or negative perception of Playbook activities at
your airport? (Q33) 20
Figure 16. Have complaints from the public about TSA activities in your airport increased, decreased, or stayed
about the same since the introduction of Playbook? (Q37) 21
Figure 17. Generally, how often do Playbook plays uncover security breaches (even minor ones) in the following
areas? (Q39) 22
Figure 18. Were most breaches detected as a result of Playbook activities, or based on other structures at your
airport? [Category X] (Q40) 22
Figure 19. Were most breaches detected as a result of Playbook activities, or based on other structures at your
airport? [Category I] (Q40) 23
Figure 20. Were most breaches detected as a result of Playbook activities, or based on other structures at your
airport? [Category II] (Q40) 23
Figure 21. How often would you estimate that Playbook operations have uncovered security breaches that other
security measures did not detect? [Category X] (Q41) 24
Figure 22. How often would you estimate that Playbook operations have uncovered security breaches that other
security measures did not detect? [Category I] (Q41) 25
Figure 23. How often would you estimate that Playbook operations have uncovered security breaches that other
security measures did not detect? [Category II] (Q41) 25
Figure 24. Probability of reporting that Playbook significantly improved security, by airport category and length
of time using Playbook 26
Figure 25. Independent plays Matrix 30
Figure 26: Hours spent on independent plays (Category X) 31
Figure 27: Hours spent on independent plays (Category I) 32
Figure 28: Hours spent on independent plays (Category II) 32
Figure 29. Cooperative plays Matrix 33
Figure 30: Hours spent on cooperative plays (Category X) 34
Figure 31: Hours spent on cooperative plays (Category I) 34
Figure 32: Hours spent on cooperative plays (Category II) 35
Figure 33. Play hours not in Playbook Matrix 36

iv
ACKNOWLEDGMENTS
We are grateful to the following for their support and assistance in preparing this report:
Richard Legault, Department of Homeland Security
Jennifer Foley, Department of Homeland Security
Raymond Gilmore, Transportation Security Administration
Stephanie Hull, Transportation Security Administration
Benjamin Sears, Transportation Security Administration
Mike Silata, Transportation Security Administration
Erin Steigerwald, Transportation Security Administration
Emily Wyant, Transportation Security Administration
TSA Personnel at major U.S. Airports
Lisa Dario, graduate research assistant

v
EXECUTIVE SUMMARY
R E S U L T S O F A N A T I O N A L S U R V E Y O F P L A Y B O O K A N D S E C U R I T Y I M P L E M E N T A T I O N A T C A T E G O R Y X , I , A N D I I A I R P O R T S
The Project
One of the recent developments in airport security has been the call for a more coordinated security apparatus. In December 2008, the Transportation Security Administration (TSA) revised and re-implemented its Security Playbook to supplement and coordinate security at airports. The Department of Homeland Security, at the request of the TSA, tasked George Mason University‟s Center for Evidence-Based Crime Policy (CEBCP) with carrying out the first comprehensive, independent assessment of the Playbook. This analysis, to occur over two years, includes four phases:
(1) Phase I: Analysis of existing program documentation. Determine the evidence-base of the Playbook using existing criminological research.
(2) Phase II: Assessment of the operational perspective. Survey all Category X, I and II airports to examine how Playbook is implemented.
(3) Phase III: Direct observation of program implementation. Conduct site visits of a selection of airports to gain further information about implementation of the Playbook.
(4) Phase IV: Recommendations for future research. Use information gained in Phases I, II, and III to design a large systematic experimental evaluation of the Playbook.
Contained herein is the Final Report for Phase II of this project. We report on the findings of the national survey (n=136 Category X, I and II airports), and also include supplemental analysis of Playbook implementation using data on personnel hours dedicated to Playbook activity provided by the Playbook program office.
The Phase II Research Study
In Phase I of this study, the research team reported on an evidence-based examination of all plays in TSA's Playbook. We compared the prevention and deterrence dimensions of the plays against research evidence about the effectiveness of similar types of interventions in crime prevention and criminal justice, and categorized plays into a Matrix based on commonly shared mechanisms and locations of prevention. This exercise indicated that there were parallels between the underlying mechanisms of Playbook and other crime prevention interventions, and that some of the common mechanisms were supported by existing evidence. However, examining the plays "on paper" does not offer any insight into the complex interaction between environment, personnel constraints, supervision, resource allocation, and other conditions that drive the reality of implementation of security measures in practice. Phase II, through a national survey and assessment of personnel hours, documents this reality and the variability in the use of Playbook strategies across the nation's airports.
We sent a first-of-its-kind survey to senior TSA personnel at all Category X, I, and II airports in the United States and its overseas territories (N=167). The survey contained a combination of

vi
factual and perceptual questions to be completed by key TSA employees. The goal of these questions was to examine how Playbook is implemented in practice; how well airports understand the purpose and intent of Playbook; the nature and extent of TSA‟s collaboration with other agencies; and how those involved with or affected by Playbook activities may perceive the program. Requests for completion of the surveys by either Federal Security Directors or their designated representatives were sent out in four waves in both paper and online formats. We received a strong response, with over 81 percent (N=136) of these airports completing a survey during the four months of the research.
TSA also provided the research team with extensive data on logged personnel hours received from all airports as part of their Playbook performance management reporting. Using the airport security Matrix we developed in Phase I, we analyzed these data to determine how Playbook resource allocation mapped onto different prevention and deterrence strategies in the various areas of the airport, and to indicate where resources are concentrated. This analysis illustrates which elements of Playbook are most emphasized in practice, and how this varies across types of airport.
Key Findings
(1) The Playbook primarily arises from and is implemented by TSA; collaboration with other
airport entities is limited.
(2) When collaboration between TSA and other airport entities does occur, respondents felt
exchanges were generally positive.
(3) Play implementation is less random than intended.
(4) Playbook implementation tends to be concentrated at .
(5) Despite the intention of Playbook to focus more attention on the ‘ ,’
(6) The majority of airports believe Playbook has improved overall security.
Next Steps
Phase III of the research will build upon the findings of the survey through in-depth qualitative
data collection at a number of selected airports that participated in the survey. We will interview
senior TSA management, Transportation Security Officers, Behavior Detection Officers, and
supervisors, as well as law enforcement and airport authority personnel who collaborate with TSA
in Playbook activities. This phase will build on the numbers presented here to further our
understanding of the variability in Playbook implementation at a range of different airports
operating under different conditions.
Center for Evidence-Based Crime Policy

TSA‟S SECURITY PLAYBOOK P H A S E 2 T E C H N I C A L R E P O R T : R E S U L T S O F A N A T I O N A L S U R V E Y O F P L A Y B O O K A N D S E C U R I T Y I M P L E M E N T A T I O N A T C A T E G O R Y X , I , A N D I I A I R P O R T S
1 INTRODUCTION
Security at U.S. airports has become a major priority in United States homeland security since the
events of September 11, 2001. Not only was the Transportation Security Administration (TSA)
established in response to the attacks of 9/11, but in the last ten years security at airports has
seen dramatic changes. These changes are reflected in the way individuals are screened, the new
and increased use of multiple detection and scanning technologies, the increased use and sharing
of information, and greater coordination between various law enforcement, security, and civilian
agencies. Like many large and semi-enclosed hubs and spaces (e.g., train and bus depots,
amusement parks, schools, malls, and parks), airports present interesting challenges to
implementing security measures. Consequentially, their size, complexity, use, and multiple
functions present a range of opportunities for criminal and terrorist activities, as well as crime
prevention, deterrence, and detection efforts.
One effort by TSA to address these growing
security concerns was to systematize, organize and
deploy various security measures around the
airport to strengthen its "Layers of Security"
approach.1 Thus, in December 2008, TSA revised
and re-implemented its Security Playbook.
Generally, Playbook seeks to enhance existing
security structures by providing a holistic security
apparatus for air transportation. It consists of a
myriad of situational tactics and strategies which
span various domains, sectors, and environs of the airport and are designed to prevent, detect,
deter, and protect against crime committed by airport visitors and employees. The purpose of
Playbook, as described by TSA, is “to create a transportation security system that increases
unpredictability, thereby frustrating terrorist plans and potentially deterring attacks” (U.S.
Transportation Security Administration, 2010).
Prior to our study, there has been no independent assessment of either the implementation or
effectiveness of the Playbook program, or of airport security as a whole. Yet, given the priority,
money, and time spent on airport security, and given its impact on the general public at large,
1 See http://www.tsa.gov/what_we_do/layers/index.shtm.

2 NATIONAL SURVEY OF PLAYBOOK AND SECURITY IMPLEMENTATION AT AIRPORTS
such assessment is necessary Both the U.S. Government Accountability Office (see e.g., U.S.
Government Accountability Office, 2007, 2009, 2010) and the Transportation Research Board
of the National Academies (2003) have formally called for more evaluation, assessment, and
research cooperation in airport security. The demand for more information recognizes that
research and analysis by third parties can greatly benefit government agencies. Rigorous
evaluation can play a crucial role in providing objective assessments of the nature and
effectiveness of airport security, which encompasses prevention, control, and deterrence of many
types of crime, from the most “ordinary” to the most severe. Agencies that regularly engage in
independent assessments have successfully used research findings to focus their program
management and policy-making efforts. Additionally, in times of economic austerity evaluation
research plays an important role in identifying best practices for smart investment.
To address this call for assessment, the Department of Homeland Security (DHS) Science &
Technology Directorate, at the request of the TSA, tasked the Center for Evidence-Based Crime
Policy (CEBCP) at George Mason University (GMU) with carrying out a comprehensive four-phase
assessment of Playbook. Phase I of this project used a "translational criminology" approach to
assess the evidence-base for Playbook‟s prevention and deterrence mechanisms, using existing
knowledge from crime prevention research. The research team compared the prevention and
deterrence dimensions of all plays against research evidence about the effectiveness of
similar types of interventions in crime prevention and criminal justice, and categorized plays into
a Matrix based on commonly shared mechanisms and locations of prevention. By deciphering
these common dimensions of prevention, deterrence and guardianship, the research team could
draw some parallels with existing research knowledge about these dimensions, making a rough
assessment of Playbook's potential as an effective security strategy, and the evidence base
underlying it.
In concluding the Phase I study, the research team discovered that there were parallels between
prevention and deterrence mechanisms of Playbook plays and other crime prevention
interventions and that some of the common mechanisms were supported by existing evidence.
Additionally, the team discovered that most plays were tactical as opposed to strategic, focusing
on the prevention of a specific concern or threat. The majority of plays were discovered to be
deterrent in nature, while a minority of plays concentrated on increased guardianship or reducing
passenger and target vulnerabilities. Many of the plays, as written, were intended to be carried
out by TSA-only teams and personnel. In general, there were a number of airport security
measures that shared the same prevention and deterrence mechanisms as already-evaluated and
effective crime prevention mechanisms.
This first analysis examined the plays as they appeared in their totality in the Playbook. Yet,
security measures are rarely implemented in totality, and the implementation of Playbook at
various airports necessarily involves a complex interaction between environment, personnel
constraints, supervision, resource allocation, and other conditions that drive the reality of
implementation of security measures in practice. An assessment of airport security and Playbook,

Center for Evidence-Based Crime Policy at GMU 3
therefore, requires an understanding of how plays are chosen and implemented, and ultimately,
the consequences and effects of these practices. Thus, Phases II and III of this project document the
implementation of Playbook in practice, from the perspectives of TSA and non-TSA personnel at
airports. These perspectives will be obtained through a national survey and assessment of
personnel timesheets (Phase II), and in-depth focus groups and interviews of airport personnel at
multiple airports (Phase III).
Phase II, which is reported here, involved an in-depth survey of TSA personnel at all Category X,
I, and II airports in the United States to gain an understanding of how Playbook is implemented in
practice. In addition to the Phase II survey findings, this report also examines Playbook
management data provided by TSA Headquarters. Airport personnel engaged in Playbook
activities are required to report back on key performance measures such as the number of
personnel hours, referred to by TSA as Full Time Equivalencies (FTEs) dedicated to Playbook
activities. We use these data to supplement our survey findings and provide an alternative
picture of how Playbook operates in practice.
Phase III, which is under way at the time of this report, builds on the Phase II survey findings
through a series of site visits at a smaller sample of airports that answered the survey, with the
purpose of collecting qualitative data on the implementation of Playbook in practice from the
perspective of airport personnel. Finally, Phase IV will utilize data collected through the
documentation analysis, operational perspective assessment, and direct observation phases to
develop proposals for rigorous evaluations of Playbook. The CEBCP team was additionally
tasked with analyzing incident data from TSA to better understand the nature of problems faced
by law enforcement and TSA officers daily, and ultimately, to assist with developing targets for
intervention and outcome measures for Phase IV. Given that the findings from our airport site
visits in Phase III will enrich our survey findings from Phase II, we provide a technical, rather than
a full narrative report for Phase II here. Survey findings are reported in Section 2 of this report,
and the discussion of the hourly data appears in Section 3.

4 NATIONAL SURVEY OF PLAYBOOK AND SECURITY IMPLEMENTATION AT AIRPORTS
2 FINDINGS FROM A NATIONAL SURVEY OF CATEGORY X, I, AND II AIRPORTS
The purpose of Phase II of this research study was to gain a more realistic and detailed
understanding of how the Playbook program is implemented across U.S. airports. To accomplish
this task, we developed and distributed a 53-question national organizational survey of TSA
personnel at all Category X, I, and II airports in the United States. The survey is the first to
provide DHS and TSA with a comprehensive understanding of the implementation of Playbook,
and the context in which future evaluations of Playbook will occur. The results also provide DHS,
TSA, and airport authorities with a better understanding of the strengths and vulnerabilities in
security and cooperation at airports.
Survey Methodology and Implementation
The survey instrument was developed by the research team in collaboration with two
experienced survey researchers at George Mason University, Professors Devon Johnson and
Linda Merola, and personnel at DHS and TSA. Building off of our Phase I analysis of the
Playbook and also preliminary interviews and focus groups with personnel at TSA Headquarters
and two airports, we developed both factual questions and organizational opinion questions to
gauge perceptions of senior TSA personnel at airports.
In our Phase I analysis, the CEBCP-GMU team discovered various implementation aspects of the
Playbook. Most notable were the use of a computerized randomization program (known to TSA
personnel as "the Randomizer") to allocate and deploy plays in unpredictable ways, as well as
the reliance on a "layers of security" philosophy, in which security measures were implemented
across a wide array of locations and situations. Additionally, Playbook documentation, as well as
key TSA personnel, emphasized that Playbook required and engendered cooperation from
multiple airport entities to successfully implement some security measures. Further, like all security
measures at public places, we anticipated that implementation of Playbook might impact the
public. Given these implementation aspects of Playbook, we developed survey questions around
these issues. The key themes of the survey were:
1. Purpose and process of Playbook
2. Selection and implementation of plays
3. Use of the Randomizer
4. The nature of locally developed plays
5. Cooperation and collaboration with non-TSA agencies
6. Perceptions of Playbook
7. Effectiveness of Playbook
Through a variety of questions within each section, we gleaned from respondents the context in
which Playbook is implemented, the extent of its use, the extent to which agencies must

Center for Evidence-Based Crime Policy at GMU 5
collaborate and share information, the benefits and challenges of the program and how these
might advance or impede successful implementation. The findings provide insight into which
elements of Playbook are most successful, and which factors contribute to strong, moderate, or
weak implementation of the program in different environments. Questions about relationships
with other agencies and specific details of deployment were also designed as preliminary
information-gathering tools to identify themes and talking points for the Phase III site visits and
qualitative data collection. The survey instrument is included as Appendix A of this report.
Our target sample for the survey was all Category X (N=29), I (N=59), and II (N=79) airports in
the United States – 167 airports in total. Airport categories are designated by TSA and reflect a
number of characteristics of airports related to security, structure and business including domestic
passenger volume, international passenger volume, and other specific security attributes
designated by Federal law (see Appendix B for the formal definitions). Category X, I, and II
airports include the nation's medium to large, and often busiest, airports.
The survey therefore targeted only TSA personnel at Category X, I and II airports. We did not
send surveys to representatives from other organizations that may be involved in Playbook
operations, such as the airport authority or local law enforcement, because of the wide variation
across airports in the types of external entities involved in Playbook and how they are structured.
Further information about cooperation and interpersonal relationships with other agencies will be
collected through in-depth interviews of these individuals during Phase III.
Appendix C of this report provides a detailed description of the survey design and
implementation processes.
Survey Results
Our multi-method approach, consistent follow-up, and the letters of endorsement from DHS and
TSA resulted in a very high overall response rate of 81.4 percent. Compared to other
organizational surveys conducted by independent researchers, this is an excellent response rate
(e.g., Baruch & Holtom, 2008; Tomaskovic-Devey, Leiter, & Thompson, 1994). Figure 1 below
shows the variation in response rates by airport category (X, I, and II).

6 NATIONAL SURVEY OF PLAYBOOK AND SECURITY IMPLEMENTATION AT AIRPORTS
Figure 1. Response rates by airport category
Percent of airports contacted who responded to the survey
Category X (N=29)
Category I (N=59)
Category II (N=79)
Category Unknown
All Categories (N=167)
Responses received
19 (65.5%) 48 (81.4%) 52 (65.8%) 17 136 (81.4%)
Figure 1 indicates that Category I airports were somewhat more likely to respond and report
their airport code than airports in Categories X and II. Because the survey and all of its questions
were voluntary, respondents from 17 airports chose not to identify themselves in the area of the
survey that asked for their airport "IATA" code. Thus, we do not know the airport category of
these anonymous respondents.
Purpose and Process of Playbook (Questions 1-11)
Questions 1-11 of the survey (see Appendix A) asked respondents about the use of the Playbook
at their airports, the personnel involved in implementing Playbook, and the extent to which they
understood the program. Of the 136 airports that answered the survey, 135 (99.3%) reported
that Playbook is currently used at their airport. One Category II airport reported that they had
used Playbook in the past but did not currently have the resources to implement it. The majority
of airports (62.7%) first implemented Playbook between October 2008 and March 2009, mostly
in December 2008 when the program was officially rolled out (Figure 2).2 Note that 18.2
percent of airports reported using Playbook prior to October 2008. There was a Playbook pilot
prior to the national rollout, but only six airports (at most 4.4% of the airports that responded)
were involved between September and November 2008. It is possible that some respondents
merged the beginning of Playbook with a program that existed prior to Playbook known as the
Aviation Direct Access Screening Program (ADASP), which was Playbook‟s predecessor and also
emphasized the use of unpredictable plays in screening at direct access points.
2 The official national start date of the full Playbook program was December 15, 2008.

Center for Evidence-Based Crime Policy at GMU 7
Figure 2. Date of Playbook implementation (Survey Question 4)
N=126 (10 respondents did not answer this question).
The Playbook program is intended to provide an additional layer of security at the airport in
addition to other TSA security operations such as manning the checkpoint and screening checked
bags. Question 5 of the survey asked respondents to estimate the proportion of the security
structure at their airport that they perceived to be dedicated to Playbook as opposed to other
security operations.
11.1 7.1
62.7
19.0
0
10
20
30
40
50
60
70
Before Jan 08 Jan-Sep 08 Oct 08-Mar 09 After Mar 09
% o
f A
irport
s

8 NATIONAL SURVEY OF PLAYBOOK AND SECURITY IMPLEMENTATION AT AIRPORTS
Figure 3. Approximately what percentage of all security operations at your airport consist
of Playbook activities? (Q5)
Percent of reported security activities involving Playbook by airport categories
Category X (N=19)
Category I (N=42)
Category II (N=47)
Category Unknown (N=15)
All Categories (N=123)
1-10%
11-20
21-30
31-40
41-50
51-60
61-70
71-80
81-90
91-100
100 100 100 100 100
N=123 (13 respondents did not answer this question).
Respondents were asked whether they held regular meetings to discuss Playbook operations,
which may indicate the extent to which the collaborative intent of Playbook (both within TSA and
with external agencies in the airport, such as law enforcement) is understood at the airport. Of
the 136 airports responding, 73 (53.7%) stated that they hold regular meetings. The majority of
personnel who attend these meetings are employed within TSA. Figure 4 shows that frontline TSA
supervisors attend meetings most often, with 95.8 percent of the airports that held regular
meetings reporting that supervisors attend frequently (i.e. more than half of the meetings, or
response options 4 and 5 on the survey). The Assistant Federal Security Directors (AFSD) attended
frequently at 76.1 percent of airports, and the Playbook Coordinators attended frequently at
62.9 percent. The responses suggest that very few airports involve non-TSA airport stakeholders
in discussions about Playbook activity. Among external personnel who collaborate in Playbook
implementation, respondents indicated that local law enforcement personnel were most likely to
attend frequently; however, this was only the case at 22.1% of airports. No airports reported
frequent representation from the airport authority, vendor representatives, or airline
representatives.

Center for Evidence-Based Crime Policy at GMU 9
Figure 4. Individuals attending Playbook meetings frequently (Q8)
Figure 5 shows the personnel types that attend meetings least frequently (fewer than half the
meetings, or survey response options 1 and 2).3 As the previous graph suggests, most airports
reported that non-TSA personnel such as law enforcement, vendors, airport authority and airline
representatives rarely attend meetings. All respondents who answered this question rated vendor
and airline representative attendance as rare.
3 Response option 3, “half of the meetings,” is not displayed here as few respondents selected that option for each job title.
95.8
76.1
62.9
59.7
59.4
40.8
22.1
17.9
13.4
13.2
6.2
3.1
0.0
0.0
0 10 20 30 40 50 60 70 80 90 100
Playbook Coordinator
Supervisors
AFSD
BDO
TSO
Aviation Inspectors
Airport Police
Airport Authority
Federal Law Enforcement
Local Law Enforcement
Field Intelligence Officers
HQ Personnel
Airline Rep
Vendor Rep
% of Airports Reporting Frequent Attendance
10 NATIONAL SURVEY OF PLAYBOOK AND SECURITY IMPLEMENTATION AT AIRPORTS
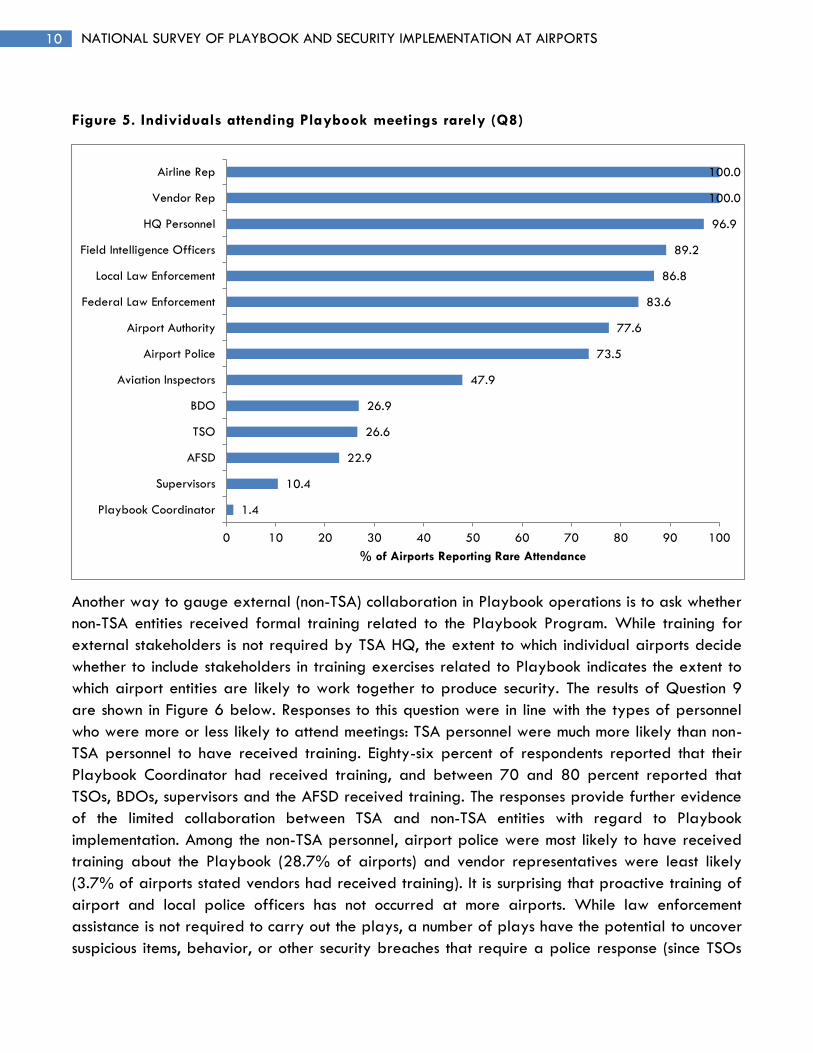
Figure 5. Individuals attending Playbook meetings rarely (Q8)
Another way to gauge external (non-TSA) collaboration in Playbook operations is to ask whether
non-TSA entities received formal training related to the Playbook Program. While training for
external stakeholders is not required by TSA HQ, the extent to which individual airports decide
whether to include stakeholders in training exercises related to Playbook indicates the extent to
which airport entities are likely to work together to produce security. The results of Question 9
are shown in Figure 6 below. Responses to this question were in line with the types of personnel
who were more or less likely to attend meetings: TSA personnel were much more likely than non-
TSA personnel to have received training. Eighty-six percent of respondents reported that their
Playbook Coordinator had received training, and between 70 and 80 percent reported that
TSOs, BDOs, supervisors and the AFSD received training. The responses provide further evidence
of the limited collaboration between TSA and non-TSA entities with regard to Playbook
implementation. Among the non-TSA personnel, airport police were most likely to have received
training about the Playbook (28.7% of airports) and vendor representatives were least likely
(3.7% of airports stated vendors had received training). It is surprising that proactive training of
airport and local police officers has not occurred at more airports. While law enforcement
assistance is not required to carry out the plays, a number of plays have the potential to uncover
suspicious items, behavior, or other security breaches that require a police response (since TSOs
100.0
100.0
96.9
89.2
86.8
83.6
77.6
73.5
47.9
26.9
26.6
22.9
10.4
1.4
0 10 20 30 40 50 60 70 80 90 100
Airline Rep
Vendor Rep
HQ Personnel
Field Intelligence Officers
Local Law Enforcement
Federal Law Enforcement
Airport Authority
Airport Police
Aviation Inspectors
BDO
TSO
AFSD
Supervisors
Playbook Coordinator
% of Airports Reporting Rare Attendance

Center for Evidence-Based Crime Policy at GMU 11
do not have law enforcement powers). Thus, it is important to ensure law enforcement personnel
know about TSA strategies and response tactics to ensure a coordinated response and ensure
that jurisdictional boundaries are clear in an emergency situation.
Figure 6. Which of the following individuals or groups at your airport received formal
training about Playbook? (Q9)
Questions 10 and 11 asked respondents about their understanding of the purpose of Playbook, and how well they thought the various TSA and non-TSA stakeholders in their airport understood what Playbook was about. Respondents stated the purpose of Playbook in their own words. A textual analysis of the responses revealed that the top five words or concepts stated were:
1. Unpredictability/randomness 2. Added layer of security 3. Awareness/command presence 4. Deterrence 5. Extend out from checkpoint
All 122 airports that answered the question cited at least one of these five concepts in their responses; some cited more than one. These statements closely align with the introductory material in the three Playbooks themselves, indicating that respondents were generally aware of the goals of the program. Just over 20 percent of the 122 airports that answered the question (N=25) specifically cited mitigation of insider or internal threats in their response. Other responses included enhanced secondary screening, flexibility, and increased visibility of the security structure.
TSA executives or representatives who answered the survey rated their perceptions of the level
of understanding of Playbook in each group of stakeholders on a scale of 1 to 5, where 5
indicates respondents' belief that the group understands the Playbook very well and 1 indicates
86.0
81.6
80.9
76.3
69.6
58.1
28.7
22.1
15.4
11.8
10.3
6.7
3.7
0 10 20 30 40 50 60 70 80 90 100
Playbook Coordinator
TSO
BDO
Supervisors
AFSD
Aviation Inspectors
Airport Police
Airport Authority
Federal Law Enforcement
Local Law Enforcement
Airline Rep
Field Intelligence Officers
Vendor Rep
% of Airports reporting Formal Training Received

12 NATIONAL SURVEY OF PLAYBOOK AND SECURITY IMPLEMENTATION AT AIRPORTS
that they do not understand it at all. Figure 7 shows the mean score within each group. Again, the
results align with earlier questions about stakeholder involvement and training. TSA personnel
received the highest ratings, although TSOs rated lower than other staff types. Among non-TSA
personnel, airport police received the most favorable ratings, while airline and vendor
representatives were considered least likely to understand the program.
Figure 7. How well do the following groups understand the purpose of Playbook? (Q11)
Selection and Implementation of Plays (Questions 12-16)
Questions 12-16 asked respondents for details about how Playbook is implemented at their
airports on a daily basis. Of the 136 respondents,
4.82
4.79
4.36
4.29
4.22
4.16
3.93
3.49
3.47
3.28
3.07
2.90
2.54
1.94
1 2 3 4 5
Playbook Coordinator
AFSD
Supervisors
BDO
Aviation Inspectors
HQ Personnel
TSO
Field Intelligence Officers
Airport Police
Federal Law Enforcement
Airport Authority
Local Law Enforcement
Airline Rep
Vendor Rep
Mean Rating Not at all Very well

Center for Evidence-Based Crime Policy at GMU 13
Figure 8. During an average week, approximately how many plays are used per day?
(Q13)
N=129 (7 respondents did not answer this question).
Respondents were asked to indicate the top three areas of the airport in which plays usually
occur (Figure 9) and the three areas in which plays occur least frequently (Figure 10), using the
locations from the Airport Security Matrix developed in Phase I. Figure 9 provides some
indication that Playbook is achieving its purpose in emphasizing
0
5
10
15
20
25
30
35
40
45
50
% o
f A
irport
s
X I II Unknown

14 NATIONAL SURVEY OF PLAYBOOK AND SECURITY IMPLEMENTATION AT AIRPORTS
Figure 9. In which areas of the airport do plays occur most frequently? (Q14)
.
% of airports
X I II Unknown

Center for Evidence-Based Crime Policy at GMU 15
Figure 10. In which areas of the airport do plays occur least frequently? (Q15)
Use of the Randomizer (Questions 17-25)
Unpredictability is one of the key features of the Playbook program. To ensure that security
operations do not become predictable, allowing potential offenders to identify vulnerabilities,
plays for a given day are selected at random using a computerized system (“the Randomizer”)
and supplemented with non-randomized plays and directives from Headquarters to account for
immediate threats and intelligence. Playbook coordinators have some discretion over the
randomized plays. They can deselect certain categories of plays prior to running the Randomizer
(for example, airports with no cargo operations can set the parameters of the Randomizer to
prevent cargo plays being selected), and can drop plays after they are selected depending on
available resources on the day. This section of the survey asked respondents about their use of
the Randomizer and the extent to which TSA personnel in their airport exercise discretion in
implementing the randomly-selected plays.
Respondents reported how frequently they run the Randomizer to select new plays (Figure 11).
The majority of airports (55%) run the Randomizer every week, while a further 20 percent obtain
randomized plays on a biweekly basis. Nine percent of airports use the Randomizer every day.
These responses support preliminary findings from the Phase III site visits, in which several
supervisors have reported that they plan program activities on a weekly rather than daily basis,
pulling plays from the Randomizer for a full week and then allocating play hours per day
according to staffing levels and other resources.
X II I Unknown

16 NATIONAL SURVEY OF PLAYBOOK AND SECURITY IMPLEMENTATION AT AIRPORTS
Figure 11. Approximately how often is the Randomizer run? (Q18)
N=126 (10 respondents did not answer this question).
Respondents were asked whether any categories of plays were deselected prior to running the
Randomizer. Most airports stated that they did deselect plays (74.4%, N=121). The top three
categories most commonly deselected were
Most of the airports deselecting plays did so because they were not relevant to the
airport (for example, the airport did not have cargo operations), lacked resources, or did not
perceive the plays as being effective.
Just under half of the airports stated that they chose only some plays from the Randomizer list for
implementation (47.1%, N=121). The slight majority of airports implement every play on the list.
As with the plays deselected prior to randomization, airports mainly chose only some plays from
the randomized list because others were not relevant to the airport, there was a lack of resources
to run the plays, or the plays were not seen as effective.
Respondents were asked to indicate how often Playbook supervisors implemented plays that
were not selected by the Randomizer, such as plays from the
, or locally-developed plays, on a scale of 1 to 5 (5 = very often; 1 = rarely/never).
Just over 35 percent of airports reported using non-randomized plays often (response options 4
and 5; N=125). Twenty-eight percent used them sometimes (response option 3) and 36.8 percent
used them infrequently or rarely (response options 1 and 2). However, of the 123 airports that
responded to the question, 80.4 percent reported that most of the plays implemented at the
airport are selected by the Randomizer, rather than by other means.
7
5
4
20
55
9
0 10 20 30 40 50 60
Other
Never
Monthly
Biweekly
Weekly
Daily
% of airports

Center for Evidence-Based Crime Policy at GMU 17
The Nature of Locally Developed Plays (Questions 25-29)
In addition to the randomized and non-randomized plays, airports also have the option of
creating their own plays to reflect strategies, tactics, and locations that are of particular
relevance to their local conditions. Questions 25 to 29 asked airports about the extent to which
they used locally-developed plays. Of the 124 airports that responded to the question, 16
percent stated that they had created and implemented their own plays. Category X airports
were slightly more likely than Category I and II airports to create their own plays, which may
reflect greater availability of resources or greater variability in local conditions. Thirty-five
percent of airports that used locally developed plays were Category X, 30 percent were
Category I and 25 percent were Category II (the remaining 10 percent were unidentified
airports). Locally developed plays were created in all areas of the airport, but the airports that
used them were most likely to report that they occurred in This is interesting
considering that plays were one of the most frequently deselected categories (see
above). However, among the airports that created their own plays, only one listed
plays among the categories frequently deselected prior to running the Randomizer. It appears
these airports prefer to supplement the existing plays with their own strategies,
although only 20 airports reported using locally developed plays at all so this should be
interpreted with caution.
Cooperation and Collaboration with Non-TSA Agencies (Questions 31-32)
One of the stated principles within Playbook is the establishment of a “networked and
collaborative model”4 that seeks to build links with local security partners, such as the airport
authority, airlines, vendors, and local law enforcement to broaden security coverage and
increase efficiency. To understand how this model operates in practice, we asked survey
respondents to indicate how often TSA collaborates with external agencies in carrying out
Playbook activities, and the quality of cooperation with each one. Respondents rated the
frequency of cooperation with non-TSA organizations within the airport on a scale of 1 to 5, with
5 indicating that TSA cooperated with the organization “very often” and 1 indicating no
cooperation. Figure 12 shows the mean rating for each non-TSA group. Across all categories, the
frequency of cooperation with each agency was considered relatively low, with mean ratings
ranging from 1 (never) to just less than 3 (sometimes). Collaboration with outside agencies
occurred least frequently (mean=1.10) and collaboration with airport police occurred most often
(mean=2.89). These findings reflect the earlier responses about the involvement of non-TSA
agencies in Playbook meetings and training programs. A higher level of collaboration with the
police compared to other non-TSA agencies is to be expected, since the police can provide law
enforcement assistance when breaches are detected, and at some airports provide K-9 support
on certain plays. Among the airports that identified themselves, collaboration appears to occur
slightly more often in Category X airports, followed by Categories I and II. A question for our
Phase III site visits is whether large or busy Category X airports have more complex environments
in which there is a greater need to draw on external resources.
4 Transportation Security Administration Federal Security Director Security Playbook, version 1.3 (December 13, 2010), p. 2.

18 NATIONAL SURVEY OF PLAYBOOK AND SECURITY IMPLEMENTATION AT AIRPORTS
Figure 12. How often do the following organizations/agencies at your airport collaborate
with TSA to implement plays? (Q31)
Mean rating: Frequency of collaboration
Airport Authority
Airport Police
Local Law Enforcement
Federal Law Enforcement
Vendors
Airlines
Outside Contractors
Entities Outside the Airport
Respondents also rated the level of cooperation, i.e. the quality of TSA‟s collaboration with
external agencies, on a scale of 1 to 5, with 5 representing “excellent” and 1 representing
“poor.” Figure 13 shows the mean ratings by airport category. Across all categories the quality
of cooperation was generally considered to be moderate to good, with mean ratings ranging
from just over 2.5 to just less than 4. Cooperation with airport police was rated highest
(mean=3.76) and cooperation with entities outside the airport was rated the lowest
(mean=2.63), reflecting the extent to which collaboration actually occurs with these organizations
(see Figure 12). There is little variation between airport categories, although it appears that
Category X airports rated their cooperation with certain agencies slightly higher than Category I
and II airports, especially with regard to the airport authority and Federal law enforcement.
Again, it may be that larger airports have greater experience in working with non-TSA agencies.
Figure 13. How would you rate the cooperation between TSA and other agencies at your
airport when it comes to Playbook activities? (Q32)
Mean rating: Quality of cooperation
Category X Category I Category II
Category Unknown
All Categories
Airport Authority 4.00 3.58 3.48 3.88 3.63
Airport Police 3.89 3.83 3.62 3.88 3.76
Local Law Enforcement 3.47 3.22 3.37 3.29 3.32
Federal Law Enforcement 4.32 3.73 3.45 4.00 3.74
Vendors 2.76 2.93 3.07 3.86 3.02
Airlines 3.67 3.26 3.29 3.57 3.35
Outside Contractors 2.69 2.78 2.82 3.00 2.79
Entities Outside the Airport 2.79 2.35 2.91 2.25 2.63

Center for Evidence-Based Crime Policy at GMU 19
Perceptions of Playbook (Questions 30, 33-37)
Respondents were asked a series of questions to measure their opinions regarding how Playbook
is perceived – positively or negatively – among TSA and non-TSA airport personnel and
passengers. These questions ultimately examine the perceived legitimacy of Playbook among
those implementing it. Legitimacy refers to the acceptance of institutional activity, such as
Playbook, as valid by those subject to it (Tyler, 1990; 2003; 2004). Unfavorable attitudes
toward such activity may reduce legitimacy, which in turn can lower individuals‟ willingness to
cooperate with authority (Lum et al., 2007; Hasisi & Weisburd, 2011). Since the Playbook relies
on the involvement of both TSA and non-TSA staff and the cooperation of passengers and airport
employees for its effectiveness, its perceived legitimacy among airport stakeholders is critical.
We asked respondents to indicate whether they believed TSA personnel in charge of selecting
and implementing plays took into account the interests of other stakeholders as part of their
work, in terms of negative effects on vendor business, flight times, and effects on passengers
(Figure 14). Responses were measured on a scale of 1 to 5, with 5 indicating a perception that
TSA personnel take into account potential negative effects very often, and 1 indicating that they
never take such effects into account. Overall, respondents were of the opinion that Playbook
coordinators and supervisors were most likely to consider negative effects on airline departure
and arrival times when planning plays, with nearly 50 percent stating that departure and arrival
times were always or almost always taken into account. However, 20 percent said that they
never accounted for effects on flight times. Business at airport vendors was perceived to receive
the least consideration in the scheduling of Playbook activity. This factor was rarely or never
taken into account at nearly two-thirds of airports. Negative effects on passenger views of
security were also a low priority for over 57 percent of airports.
Figure 14. When selecting and implementing plays, how often do those in charge take into
account how plays might negatively affect the following factors? (Q30)
N=124 (12 respondents did not answer this question).
48.4
20.0
37.6
33.6
22.6
15.3
5.6
20.0
20.0
17.7
20.2
25.6
16.8
24.8
22.6
6.5
16.8
7.2
9.6
16.9
9.7
32.0
18.4
12.0
20.2
0 10 20 30 40 50 60 70 80 90 100
Business at airport vendors
Airline departure/arrival times
Passenger views of airport security
Working environment of airline staff
Wait times at security lines/boarding gates
% of airports
Never 2 Sometimes 4 Always

20 NATIONAL SURVEY OF PLAYBOOK AND SECURITY IMPLEMENTATION AT AIRPORTS
Respondents were also asked to indicate whether they thought various Playbook stakeholders,
including TSA personnel, non-TSA personnel, and passengers, had a positive or negative
perception of Playbook (Figure 15). Responses were based on a rating scale of 1 to 5, with 5
representing a very positive perception and 1 representing a very negative perception.
Respondents could also indicate whether they thought the group would be unaware of Playbook
and therefore have no opinion. The results in Figure 15 are as we would expect: senior TSA staff,
including the AFSD and Playbook Coordinator, were believed to have the most positive view of
Playbook (72% and 77% “very positive,” respectively), while TSOs and BDOs were believed to
be more equivocal, although generally still positive. A slight majority (54%) of airports believed
that airport police viewed Playbook positively or very positively, and almost half of the airports
(49%) selected “positive” or “very positive” for the airport authority. Although 25 percent of
respondents did not believe passengers would be aware of Playbook, 20 percent of airports
perceived that passengers would view Playbook positively or very positively. Vendors, airline
personnel, and contractors were considered least likely to have positive views, although few were
considered to have very negative views. Between one-quarter and one-half of these airports did
not think these groups would be aware of Playbook at all.
Figure 15. In your opinion, do the following groups have a positive or negative perception
of Playbook activities at your airport? (Q33)
Percent of respondents rating perceptions as positive or negative
Very Positive
5 4 3 2 Very Negative
1 Not
Aware
AFSD 72% 21% 4% 2% 1% 0%
Playbook Coordinator 77 20 2 1 0 0
BDO 53 31 14 2 0 0
TSO 40 27 28 6 0 0
Aviation Inspectors 41 28 17 6 2 6
Federal LEO 24 19 20 3 0 35
FAM 25 17 10 4 0 44
Field Intelligence Officers 25 9 12 4 1 49
Airport Authority 21 28 28 10 5 8
Airport Police 22 32 22 10 4 9
Local LEO 8 12 18 5 2 2
Airport Personnel 8 16 32 23 7 13
Airport Vendor 4 7 29 23 8 29
Airport Contractors 3 7 24 20 6 41
Airline Passengers 3 17 36 13 7 25
Other Members of Public 1 12 22 6 1 58
Respondents were also asked whether their airport had a formal complaint system where
individuals can report concerns about Playbook. Just over 66 percent reported that they did
have a system, 30.4 percent did not, and 3.2 percent did not know (N=125; 11 respondents did

Center for Evidence-Based Crime Policy at GMU 21
not answer the question). There was no indication from these respondents that Playbook
increased passenger complaints at the airports – of those airports that had a complaint system,
67.5 percent stated that the number of complaints stayed the same and an additional 24.7
percent said complaints had decreased since the implementation of Playbook (Figure 16).
Figure 16. Have complaints from the public about TSA activities in your airport increased,
decreased, or stayed about the same since the introduction of Playbook? (Q37)
N=77 (59 respondents did not answer the question).
Effectiveness of Playbook (Questions 39-44)
The final set of survey questions asked respondents whether Playbook was effective at
uncovering security breaches, and the extent to which detection can be attributed to Playbook
rather than other security structures. “Security breach” in this context is defined broadly: any
event that the respondent considered to be a security threat. Some examples of breaches that
have been raised in our Phase III focus groups include employees entering secure areas with
invalid badges and prohibited items being uncovered during open-and-look bag searches.
This suggests that Playbook is achieving its goal of improving security
operations in areas beyond screening to some extent, but that screening of both passengers and
employees remains a focus. However, the frequency of detection may also be related to the
large number of people passing through these areas whose behavior and belongings are subject
to regulation.
7.8
16.9
67.5
6.5
1.3
0 10 20 30 40 50 60 70
Greatly decreased
Stayed the same
Greatly increased
% of airports

22 NATIONAL SURVEY OF PLAYBOOK AND SECURITY IMPLEMENTATION AT AIRPORTS
Figure 17. Generally, how often do Playbook plays uncover security breaches (even minor
ones) in the following areas? (Q39)
Occurrences of security breaches by area of the airport
Respondents were then asked whether most of the breaches were discovered as a result of
Playbook or other security structures. Responses were on a scale of 1 to 5, where 5 indicated
“almost all Playbook activities” and 1 indicated “almost all other security.” Figures 18, 19, and
20 show the results broken out by airport category.
Figure 18. Were most breaches detected as a result of Playbook activities, or based on other
structures at your airport? [Category X] (Q40)

Center for Evidence-Based Crime Policy at GMU 23
Figure 19. Were most breaches detected as a result of Playbook activities, or based on other
structures at your airport? [Category I] (Q40)
Figure 20. Were most breaches detected as a result of Playbook activities, or based on other
structures at your airport? [Category II] (Q40)
This is likely due to variations in passenger throughput at the
different airport categories: we would expect to see more detection at busier airports simply

24 NATIONAL SURVEY OF PLAYBOOK AND SECURITY IMPLEMENTATION AT AIRPORTS
because the population at risk is larger. We should also note that the primary purpose of
Playbook is to prevent and deter security threats, not detect them, so the frequency of breach
detections should not be construed as an indication of ineffectiveness. However, deterrence-
based programs present challenges for evaluation because of the difficulties in measuring crimes
or breaches prevented, so evaluators must be creative in assessing the effectiveness of such
programs. Studying breaches does not provide a good indication of crime prevention
effectiveness, but it can act as a proxy for certain measures of process effectiveness, such as the
extent of penetration of the program to particular areas of the airport. If breaches are
frequently detected at certain locations it may also be the case that breaches are frequently
deterred at those locations too, since a higher number of detections likely indicates a higher
frequency of breaches overall.
Figure 21. How often would you estimate that Playbook operations have uncovered
security breaches that other security measures did not detect? [Category X] (Q41)

Center for Evidence-Based Crime Policy at GMU 25
Figure 22. How often would you estimate that Playbook operations have uncovered
security breaches that other security measures did not detect? [Category I] (Q41)
Figure 23. How often would you estimate that Playbook operations have uncovered
security breaches that other security measures did not detect? [Category II] (Q41)
Overall, there was a very positive response from airports regarding Playbook‟s overall influence
on security (Question 42). No airports felt that Playbook had diminished security. Of the 125
airports that answered the question, 13.6 percent (N=17) believed security had stayed about
the same and the overwhelming majority (86.4%) felt it had improved (N=71, 56.8%) or
significantly improved (N=37, 29.6%) as a result of Playbook.
We also used ordered logistic regression to explore which factors may have influenced airports‟
responses to this question. The variables in the model were airport category, how long the airport

26 NATIONAL SURVEY OF PLAYBOOK AND SECURITY IMPLEMENTATION AT AIRPORTS
had been using Playbook, what percentage of operations at the airport are Playbook related,
whether TSOs had received formal training, whether plays were most frequently used at the
checkpoint or elsewhere, the number of TSO hours dedicated to Playbook, and the airport‟s
average monthly passenger enplanements. Among the 111 respondents who provided answers to
all these questions, only airport category (X, I, or II) was significantly related to respondents‟
beliefs about the effect of Playbook on security, controlling for all other factors. Smaller airports
perceived less improvement than larger ones (z = -2.33, p ≤ .020). Airports that had been using
Playbook for longer were also more likely to say it improved security, all else being equal, but
this factor was not statistically significant (z = 1.01, p ≤ .313). Figure 24 shows the relationship
between airport category and time for the “average” airport on all other factors. Although
Category I and II airports were less likely to report a significant improvement in security overall,
those who had been using Playbook longer were more likely to perceive a significant
improvement than those who had been using it for less time.
Figure 24. Probability of reporting that Playbook significantly improved security, by airport
category and length of time using Playbook
Finally, respondents were asked to list the top three specific plays they thought were most
effective from a security perspective. We ranked the selections and found the three plays most
commonly listed were:
It is interesting to note that airports found two of the plays most effective, but
plays were often deselected by some airports. It is possible that the perceived utility of
these plays depends on the local conditions and environment at airports.
Playbook activity may depend on
0
0.1
0.2
0.3
0.4
0.5
0.6
0.7
0.8
Under 2 years 2-2.99 years 3-3.99 years 4 or more years
Pro
bability o
f re
port
ing s
ignif
icant
impro
vem
ent
Years since Playbook implementation
X I II

Center for Evidence-Based Crime Policy at GMU 27

28 NATIONAL SURVEY OF PLAYBOOK AND SECURITY IMPLEMENTATION AT AIRPORTS
3 ANALYSIS OF HOURLY IMPLEMENTATION DATA
In addition to the airport survey, we assessed Playbook implementation by examining the
distribution of reported work hours as logged by TSA employees across Category X, I and II
airports. The hours data were obtained from the TSA PIMS system in a series of text files (one
containing the actual data and four containing information on variable codes), which were
converted into Microsoft Access format for analysis.
TSA operations at each airport receive a specific allocation of employee hours (FTE), a set
proportion of which are dedicated to Playbook activity. Supervising officers log the number of
employee hours used for each play. Although this information has some limitations because it is
potentially subject to reporting variability across airports, it provides a realistic understanding of
the amount of time employees spend on plays, thus enhancing our assessment of Playbook
implementation. The original hours file contained 4,065,916 employee working hours logged
from January 3, 2008 to November 2, 2011 for activities that were associated with Playbook
plays.5 Each entry in the dataset contains detailed information about the play, including the
airport, play code, allocation of employee hours, the date and time the information was logged
and the person entering the data.
We used the airport security Matrix developed in Phase I of our study to assess the hours spent
on Playbook across airports. In Phase I, we categorized plays as they appeared in official
Playbook documentation according to common characteristics derived from the situational crime
prevention, deterrence, and interagency cooperation literatures. Following the premise of the
Evidence-Based Policing Matrix©, a visual tool developed by Lum, Koper and Telep (2011) for
summarizing and displaying evaluation evidence, we mapped all plays from the of
the Playbook onto a hypothetical matrix to make generalizations to the broader crime
prevention literature. The three dimensions of prevention we identified in the airport security
matrix were the location within the airport in which a play was implemented (X-axis), which
followed the „layers of security‟ as set out in the Playbook; the primary mechanism of prevention
(Y-axis), and the extent to which collaboration with a non-TSA entity is recommended by the play
as it appears in the Playbook documentation (Z-axis). The mechanisms of prevention were
defined as follows:
Deter offenders/increase their effort: These involve plays that primarily focus on blocking
offenders by increasing the effort they would have to use in order to succeed in a specific
activity. Examples include keypad locks on secure doors, screening at entrances to secured areas,
and hand swabs to test for explosive traces.
Increase guardianship: These plays generally attempt to increase the level of general
watchfulness and oversight to detect criminal activity. Broadly, this classification is used for plays
5 The original hours data contained data that was entered as early as February 16, 2000; however this information was sporadic and only accounted for a total of 19 cases.

Center for Evidence-Based Crime Policy at GMU 29
that intend to increase the risk of being apprehended through increasing surveillance (for
example, directed security patrols, identification checks of employees, watching the airfield).
Reduce vulnerability of passengers and other targets: These plays are designed to decrease the
vulnerability of targets (both people and places) or to make criminal activity less worthwhile for
the offenders by making passengers, employees, or other targets more alert or less available.
Such plays are designed to protect people and locations even in the presence of a motivated
offender. Examples include internal and external inspections of aircraft or audio warnings.
For ease of understanding, we presented two separate matrices, divided by the two levels of the
Z-axis as follows (see Figures 25 and 29 below).
Independent or TSA-Primary: These are plays that are primarily conducted by TSA
officers/employees. Cooperation of other agencies (such as law enforcement) may be sought or
needed for arrest but is not necessary to initiate or carry out the play.
Cooperative: These plays emphasize cooperation between TSA and another agency, such as law
enforcement. The Playbook specifically suggests agencies whose cooperation is strongly
encouraged. However, because the Playbook arises from TSA, there are no plays in which the
TSA does not take a lead or cooperative role.
Thus, the Phase I report provided a theoretical layout of the Playbook‟s key areas of focus, with
each play mapped into the Matrix to show how plays cluster along intersecting dimensions of
location and mechanism of prevention. In the current analysis, we map the hours spent on each
play into the same Matrix to examine the number of hours allocated to plays concentrates in the
same intended areas of focus of Playbook that we identified in the Phase I report.6
To assess the distribution of Playbook hours within the Matrix, we selected data that fell within a
one year time frame between January 1, 2010 and December 31, 2010. Within this period,
there were 1,469,750 entries for employee hours dedicated to Playbook activity. These data
were aggregated by play code ( ) to reflect the number of employee hours spent
on each play during the year. We then coded each play according to its location in the Matrix.
As with the survey data, we examined the total hours for Playbook by each airport classification
(X, I, and II) separately. The analysis is also separated by independent and cooperative plays as
defined above.
Independent (TSA-Only) Plays
The Independent Plays Matrix, we developed in Phase I (Figure 25) shows that most plays that
do not intend for TSA to collaborate with non-TSA agencies are focused on deterrence and
increasing effort at (29 of the 126 independent plays, or 23%) and
(N=22, 17.5%). To a lesser extent, plays also cluster
6 This analysis follows the work of Veigas (2011), who mapped hours logged by police for various deployment strategies into the Evidence-Based Policing Matrix (Lum, Koper, & Telep, 2011) to obtain a realistic view of the extent of deployment for each measure and assess the number of hours spent on evidence-based strategies.

30 NATIONAL SURVEY OF PLAYBOOK AND SECURITY IMPLEMENTATION AT AIRPORTS
around deterrence at the gate (N=13, 10.3%) and reducing vulnerability
(N=13, 10.3%).
Figure 25. Independent plays Matrix
utilize
deterrence tactics , employee hours are thus disproportionately concentrated in
those areas. This is in line with preliminary data from our site visits, where some TSA personnel
have indicated that since large numbers of employees can be deployed to the
are often run to ensure FTE allocations are met. However, we should note that
the concentration of hours at could simply be because more employees, and thus
employee hours, are required to
The second highest number of employee hours was allocated to plays that focused TSA efforts on
strategies that are meant to deter offender efforts This finding was consistent across all
airport categorizations (Category X = ; Category I = ; Category II= ). Only

Center for Evidence-Based Crime Policy at GMU 31
of Playbook plays ) are deterrence-based . Again, the
disproportionate number of hours to run these plays may be due to an increased need for
resources at but it also suggests that the “layers of security” model is being at least
partially implemented. Alternatively, this might also reflect a preference by TSA Playbook
supervisors or Coordinators to provide more plays at , as we have discovered in one of
our site visits.
Figure 26: Hours spent on independent plays (Category X)
Dark blue : Greatest proportion of hours. Medium blue : Second largest proportion of hours. Light blue : Third largest proportion of hours.
Deter Offenders
Increase Guardianship
Reduce Vulnerability
Total

32 NATIONAL SURVEY OF PLAYBOOK AND SECURITY IMPLEMENTATION AT AIRPORTS
Figure 27: Hours spent on independent plays (Category I)
s a s d
Deter Offenders
Increase Guardianshi
Reduce Vulnerability
Total
Dark blue : Greatest proportion of hours. Medium blue : Second largest proportion of hours. Light blue : Third largest proportion of hours.
Figure 28: Hours spent on independent plays (Category II)
Deter Offenders
Increase Guardianship
Reduce Vulnerability
Total
Dark blue : Greatest proportion of hours. Medium blue : Second largest proportion of hours. Light blue : Third largest proportion of hours.
Plays that Require Cooperation with External Entities
The Cooperative Plays Matrix (Figure 29) shows how the 16 Playbook plays that recommended
TSA collaboration with other entities cluster along common dimensions of location and prevention
mechanism. The largest cluster of cooperative plays (N=8, 50%) focuses on strategies to deter
offenders in areas

Center for Evidence-Based Crime Policy at GMU 33
Figure 29. Cooperative plays Matrix
However, most employee hours spent on cooperative plays are dedicated to activities that aim to
increase guardianship (Category X= ; Category I= Category II = see
Figures 30, 31, and 32). Less than of cooperative hours are actually used on
deterrence-based plays (Category X= ; Category I ; Category
II= . Across all areas, half the cooperative plays are designed to deter offenders and just
under half ( are intended to increase guardianship, so the concentration of employee
hours on guardianship plays is highly disproportionate.
Across all three mechanisms of prevention, employee hours for cooperative plays seem to be
concentrated at two primary locations:
Overall, slightly more than of the total employee hours are spent on plays that focus
. This trend aligns with the clustering of the cooperative plays
in the Matrix. The second most common location in which over of
cooperative play hours are spent in all three categories of airports. This is interesting considering
there is only one cooperative play that occurs in

34 NATIONAL SURVEY OF PLAYBOOK AND SECURITY IMPLEMENTATION AT AIRPORTS
The cells that contain the highest proportion of employee hours, (1) increase guardianship
, account for over of hours at all
airports, but these cells house only of all cooperative plays. These four plays include two
. Note that the large discrepancy between the intended
target of cooperative plays and their actual deployment is likely due to the fact that most
As such, they are not selected by airports
themselves but sent down as directives from HQ in response to a specific threat. The concentration
of cooperative play hours among the two reflects the fact that these plays would be
available to airports through the Randomizer and therefore deployed more frequently.
Figure 30: Hours spent on cooperative plays (Category X)
Deter Offenders Increase Guardianship Reduce Vulnerability
Total
Dark blue : Greatest proportion of hours. Medium blue : Second largest proportion of hours. Light blue : Third largest proportion of hours.
Figure 31: Hours spent on cooperative plays (Category I)
Deter Offenders Increase Guardianship Reduce Vulnerability
Total
Dark blue : Greatest proportion of hours. Medium blue : Second largest proportion of hours. Light blue : Third largest proportion of hours.

Center for Evidence-Based Crime Policy at GMU 35
Figure 32: Hours spent on cooperative plays (Category II)
Deter Offenders Increase Guardianship Reduce Vulnerability
Total
Dark blue : Greatest proportion of hours. Medium blue : Second largest proportion of hours. Light blue : Third largest proportion of hours.
Plays Not Classified in the Matrix
A number of employee hours in the data were associated with plays that did not appear in the
Playbook documentation used by the research team during the Phase I analysis. Some are locally
developed plays, while others are plays that have been discontinued, or plays that were added
by newer versions of the Playbook. These plays and their associated hours by airport category
are listed in Figure 33.
Most employee hours for plays outside of the Matrix at both Category X and Category I airports
were logged for This play was related to TSA‟s BDO Validation Study, and was only
available for a short period of time while that study was under way. The largest concentration of
employee hours at Category II airports was play that was not
added until the summer of 2011 (the Phase I study was based on documentation from February
2010).
Other plays that were allocated significant employee hours include

36 NATIONAL SURVEY OF PLAYBOOK AND SECURITY IMPLEMENTATION AT AIRPORTS
Figure 33. Play hours not in Playbook Matrix
Play % Total – Cat X % Total- Cat I % Total – Cat II
Dark blue : Greatest proportion of hours. Medium blue : Second largest proportion of hours. Light blue : Third largest proportion of hours.
Center for Evidence-Based Crime Policy at GMU 37
4 CONCLUSION
This report describes the findings of the second phase of the GMU-TSA project to assess TSA's
comprehensive strategy to security at airports, the Security Playbook. It includes an in-depth,
national organizational survey of Playbook operations at Category X, I, and II airports in the
United States, and an analysis of performance management data collected by the Playbook
Program Office at TSA Headquarters. While there has been a significant expenditure on
counterterrorism and airport security measures since 9/11, very few evaluations of the efficiency
and effectiveness of these strategies exist. The research presented here and in our Phase I report
shows that assessment research at airports is possible, and interesting findings can be discovered.
The survey and PMIS data analysis detail a more realistic picture of the implementation of
Playbook, and also a better understanding of the perceptions of those implementing it. The
feasibility of such a survey is also reflected in the high response rate – over 81 percent of those
contacted returned a completed survey. In addition to the rich data obtained from the airports,
we assessed nearly one and a half million performance management reports of TSA personnel
hours dedicated to Playbook activities, providing a strong basis for drawing conclusions from our
dataset.
From this analysis, the following conclusions can be drawn:
(1) The Playbook primarily arises from, and is implemented by, TSA rather than through
collaboration between TSA and other airport entities. While one of Playbook‟s stated aims is to
enhance cooperation and collaboration between TSA and the various other security stakeholders
in the airport, such as the airport authority and law enforcement, our survey results suggest that
little cooperation with external agencies occurs in practice (and many plays do not require
cooperation). TSA personnel rate both perceived knowledge of and actual involvement in
Playbook among non-TSA entities to be generally low. This is consistent with what we found in the
first phase of our study – the vast majority of plays are designed to be
implemented by TSA personnel only. In our Phase I report, we discuss from an evidence-based
perspective the possible benefits to security that may be derived from cooperation. Increasing
the degree of collaboration between TSA and other agencies within the airport will enhance
Playbook‟s potential for effectiveness.
(2) When collaboration between TSA and other airport entities does occur, respondents felt
exchanges were generally positive. This suggests that Playbook does have the potential to
facilitate working relationships with other stakeholders, a finding anecdotally supported in some
of our site visits. From this starting point, TSA may consider strengthening and increasing the
number of information-sharing plays, and extending opportunities for collaboration, as we
suggested above and in our Phase I report.
(3) Play implementation is less random than intended. One important aspect of Playbook,
according to the TSA Playbook managers at TSA Headquarters, is the Randomizer. They

38 NATIONAL SURVEY OF PLAYBOOK AND SECURITY IMPLEMENTATION AT AIRPORTS
reported in interviews with us that a random scheme of play selection and implementation can
help to increase the unpredictability of security measures, thus improving security. Our literature
review in Phase I suggested that random allocation of security patrols could be an effective
deterrent mechanism if targeted in high risk areas. TSA is currently moving toward more risk-
based deployment, including the REFS (Risk Emphasized Flight Screening) program that is already
reflected in Playbook. Our findings here indicate that while the Randomizer is used, a number of
discretionary actions are taken before and after it is implemented. Our survey indicates that
many airports tailor Playbook activity to the specific environment of their airport. This is positive
from the perspective of place-based crime prevention, because tailored, place-specific strategies
have been shown to be effective, but it also undermines the purpose of randomization to some
extent. Furthermore, airports believe that some plays are either not relevant to their airport or
are not effective from their perspective, attitudes that may be related to one another. Moreover,
the hourly data analysis shows that considerable employee resources are dedicated to locally
developed plays, even though a small proportion of airports reported developing their own
plays. This finding highlights a need for further investigation into incorporating key elements of
unpredictability and randomness into strategies that are tailored to maximizing security in the
specific local conditions of each airport.
(4) Playbook implementation tends to be . Playbook
emphasizes the “layers of security” approach of extending security out beyond
However, the
survey and the hours data, as well as our initial Phase I mapping of the plays themselves, suggest
that there is much concentration of Playbook operations in . This is partly due
to the fact that the
. Preliminary findings from our qualitative data collection in
Phase III suggest some airports may therefore use to ensure FTE allocation
quotas are met. Additionally, these findings suggest that at small airports it was necessary to
. To ensure that Playbook activity is focused at areas other than
, TSA should consider revising Playbook performance measures and FTE allocations
to distribute them between specific locations within Playbook, rather than across Playbook as a
whole. These allocations should also be tailored to airport size. Evaluation findings can help
determine where the highest risk areas are within the airport, and how to optimize the
deployment of resources to those locations.
(5)
However, the survey and hourly data analysis suggest that there is still much more
emphasis on
Further, the survey results suggest that Playbook‟s
. If insider threat

Center for Evidence-Based Crime Policy at GMU 39
is of specific interest for TSA security, and more generally, if TSA wishes to establish a broader
approach to security, reevaluation of the amount of focus
is crucial. In our qualitative research in Phase III, we will provide further information about
TSA employees‟ views of the extent of the insider threat compared to external threats. It could
be the case that over time, security emphasis has
(6) The majority of airports believe Playbook has improved overall security. The
overwhelming majority of airports stated that Playbook had improved or significantly improved
their security, regardless of the extent to which Playbook is used at the airport, how much TSO
time is dedicated to the program and the degree of training they receive and so on. Larger
airports (in terms of airport category) were more likely to perceive a significant improvement
than smaller airports, but among all airport categories respondents‟ positive impressions of
Playbook increased the longer the program was in place.
Future Directions
Phase II of this study confirms that there is considerable variation across airports and airport
categories in the implementation of Playbook. While airports appear to understand the purpose
and intent of Playbook, there is variability in how this is interpreted and put into practice.
Understanding the implementation of Playbook in the field, and identifying the prospects and
challenges to its use are crucial to judging what works in airport security. This knowledge will
strengthen the basis for future research and evaluation in airports, and will also help TSA to
further refine the Playbook program in practice. The next step in this study – the collection of
detailed qualitative data through site visits and interviews at selected airports that participated
in the survey – will build on the results presented here to further increase our understanding of
Playbook in action. Our site visits will enable us to observe some of the key challenges to
Playbook implementation – especially collaboration with external agencies and improving
detection and prevention of insider threats – in action and develop detailed recommendations
for enhancing these goals of Playbook in our next report.

40 NATIONAL SURVEY OF PLAYBOOK AND SECURITY IMPLEMENTATION AT AIRPORTS
5 REFERENCES
Baruch, Y., & Holtom, B. (2008). Survey response rate levels and trends in organizational research.
Human Relations, 61(8), 1139-1160.
Hasisi, B. & Weisburd, D. (2011). Going beyond ascribed identities: The importance of procedural justice
in airport security screening in Israel. Law and Society Review, 45(4), 867-892.
Lum, C., Beech, D., Connors, M., Crafton, Z., Parsons, R., & Smarr, T. (2007). Examining collateral effects of
counterterrorism interventions: Airport security screening. Congressional Briefing, Senate Russell
Building, September 10, 2007. Washington DC.
Lum, C., Koper, C., & Telep, C. (2011). The evidence-based policing Matrix. Journal of Experimental
Criminology, 7(1), 3-26.
Tomaskovic-Devey, D., Leiter, J., & Thompson, S. (1994). Organizational survey nonresponse.
Administrative Science Quarterly, 39(3), 439-457.
Transportation Research Board of the National Academies. (2003). Airport research needs: Cooperative
solutions. Special Report 272. Washington, DC: National Academies. Retrieved January 14, 2011,
from http://onlinepubs.trb.org/onlinepubs/sr/sr272.pdf.
Tyler, T. (1990). Why people obey the law: Procedural justice, legitimacy, and compliance. New Haven, CT:
Yale University.
Tyler, T. (2003). Procedural justice, legitimacy, and the effective rule of law. Crime and Justice, 30, 283–
357.
Tyler, T. (2004). Enhancing police legitimacy. The Annals of the American Academy of Political and Social
Science, 593(1), 84–99.
U.S. Government Accountability Office (2007). Risk, experience, and customer concerns drive changes to
airline passenger screening procedures, but evaluation and documentation of proposed changes could
be improved. Retrieved January 14, 2011, from http://www.gao.gov/new.items/d07634.pdf.
U.S. Government Accountability Office (2009). DHS and TSA have researched, developed, and begun
deploying passenger checkpoint screening technologies, but continue to face challenges. Retrieved
January 14, 2011, from http://www.gao.gov/new.items/d10128.pdf.
U.S. Government Accountability Office (2010). TSA has taken actions to manage risk, improve
coordination, and measure performance, but additional actions would enhance its actions. Retrieved
January 14, 2011, from http://www.gao.gov/new.items/d10650t.pdf.
U.S. Transportation Security Administration (2010). What we do. Retrieved March 1, 2011, from
http://www.tsa.gov/what_we_do/layers/index.shtm.
Veigas, H. (2011). Assessing the evidence-base of strategies and tactics of uniformed patrol in Derbyshire
Police. Unpublished dissertation, M.St. in Applied Criminology and Police Management. Cambridge,
UK: University of Cambridge.

Center for Evidence-Based Crime Policy at GMU 41
APPENDIX A: SURVEY INSTRUMENT AND COVER LETTERS

42 NATIONAL SURVEY OF PLAYBOOK AND SECURITY IMPLEMENTATION AT AIRPORTS

Center for Evidence-Based Crime Policy at GMU 43
AVIATION SECURITY ENHANCEMENT PARTNERSHIP:
EVALUATING THE TRANSPORTATION SECURITY ADMINISTRATION’S
COMPREHENSIVE AIRPORT SECURITY PLAYBOOK
INFORMED CONSENT FORM
RESEARCH PROCEDURES This research is being conducted at the request of Department of Homeland Security, Science
and Technology Directorate, to conduct an independent survey of the implementation of the
Playbook program at Category X, I, and II airports. We are requesting the participation of the
Federal Security Director or Playbook Coordinator in answering this survey (or other relevant
representative). This survey is voluntary and will take 30 minutes to complete. Your assistance is
much appreciated.
RISKS There are no foreseeable risks or discomforts in participating in this research. Data will be
collected and aggregated, and no individual airport or individual person filling out this survey
will be identified in any report about the survey results.
BENEFITS There are no benefits to you as a participant other than to assist George Mason University in
furthering research regarding improving airport security.
CONFIDENTIALITY All responses and results from this survey will be treated as confidential information under DHS
rules, and no individual survey or airport information will be disclosed in the reporting of results.
No personal information about any specific individual is collected. The airport code will be
requested, but only for purposes of data collection and follow-up; however, the airport code will
be kept in a separate table, attached to a random unique identifier so that answers are kept
separate from the airport code. The survey is conducted under the guidelines of SSI, and follows
the DHS security measures. The survey has also been approved by both DHS and the
Institutional Review Board of George Mason University. All GMU researchers associated with
this project have been trained in the handling of Sensitive Security Information (SSI).
PARTICIPATION Your participation is voluntary, and you may withdraw from the study at any time and for any
reason. If you decide not to participate or if you withdraw from the study, there is no penalty or
loss of benefits to which you are otherwise entitled. There are no costs or compensation to you or
any other party in conducting this research.
CONTACT This research is being conducted by the Center for Evidence-Based Crime Policy at George
Mason University under its Director, David Weisburd and Deputy Director, Cynthia Lum. They
may be reached at 703-993-3421 for questions or to report a research-related problem. You may
contact the George Mason University Office of Research Subject Protections at 703-993-4121 if
you have questions or comments regarding your rights as a participant in the research. This
research has been reviewed according to George Mason University procedures governing your
participation in this research.
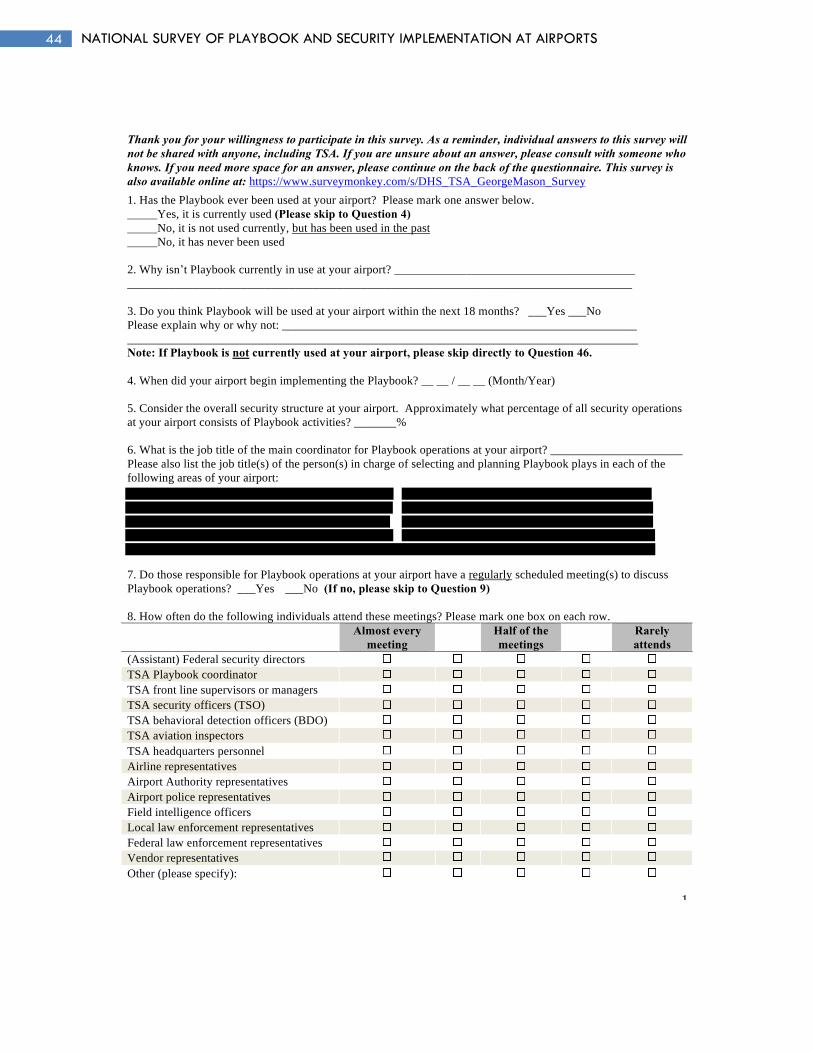
44 NATIONAL SURVEY OF PLAYBOOK AND SECURITY IMPLEMENTATION AT AIRPORTS
1
Thank you for your willingness to participate in this survey. As a reminder, individual answers to this survey will
not be shared with anyone, including TSA. If you are unsure about an answer, please consult with someone who
knows. If you need more space for an answer, please continue on the back of the questionnaire. This survey is
also available online at: https://www.surveymonkey.com/s/DHS_TSA_GeorgeMason_Survey
1. Has the Playbook ever been used at your airport? Please mark one answer below.
_____Yes, it is currently used (Please skip to Question 4)
_____No, it is not used currently, but has been used in the past
_____No, it has never been used
2. Why isn’t Playbook currently in use at your airport? ________________________________________
____________________________________________________________________________________
3. Do you think Playbook will be used at your airport within the next 18 months? ___Yes ___No
Please explain why or why not: ___________________________________________________________
_____________________________________________________________________________________
Note: If Playbook is not currently used at your airport, please skip directly to Question 46.
4. When did your airport begin implementing the Playbook? __ __ / __ __ (Month/Year)
5. Consider the overall security structure at your airport. Approximately what percentage of all security operations
at your airport consists of Playbook activities? _______%
6. What is the job title of the main coordinator for Playbook operations at your airport? ______________________
Please also list the job title(s) of the person(s) in charge of selecting and planning Playbook plays in each of the
following areas of your airport:
7. Do those responsible for Playbook operations at your airport have a regularly scheduled meeting(s) to discuss
Playbook operations? ___Yes ___No (If no, please skip to Question 9)
8. How often do the following individuals attend these meetings? Please mark one box on each row.
Almost every
meeting
Half of the
meetings
Rarely
attends
(Assistant) Federal security directors
TSA Playbook coordinator
TSA front line supervisors or managers
TSA security officers (TSO)
TSA behavioral detection officers (BDO)
TSA aviation inspectors
TSA headquarters personnel
Airline representatives
Airport Authority representatives
Airport police representatives
Field intelligence officers
Local law enforcement representatives
Federal law enforcement representatives
Vendor representatives
Other (please specify):

Center for Evidence-Based Crime Policy at GMU 45
2
9. Which of the following individuals or groups at your airport have received formal training about Playbook?
___ (Assistant) Federal security
directors
___ TSA Playbook coordinator
___ TSA front line supervisors
or managers
___ TSA security officers (TSO)
___ TSA behavioral detection officers
(BDO)
___ TSA aviation inspectors
___ Airline representatives
___ Airport Authority representative
___ Airport police representatives
___ Field intelligence officers
___ Local law enforcement
representatives
___ Federal law enforcement
representatives
___ Vendor representatives
10. To the best of your knowledge, what is the overall purpose of Playbook?
____________________________________________________________________________________________
____________________________________________________________________________________________
___________________________________________________________________________________ _________
11. In your experience, how well do the following groups understand the overall purpose of the Playbook?
Please mark one box on each row.
Very well
5 4 3 2
Not at all
1
(Assistant) Federal security directors
TSA Playbook coordinator
TSA front line supervisors or managers
TSA security officers (TSO)
TSA behavioral detection officers (BDO)
TSA aviation inspectors
TSA headquarters personnel
Airline representatives
Airport Authority representatives
Airport police representatives
Field intelligence officers
Local law enforcement representatives
Federal law enforcement representatives
Vendor representatives
The following questions ask about when and how plays are run at your airport. For these questions,
12. During an average week . . . ?
. . . on how many days are Playbook plays run at your airport? _______
. . . approximately how much personnel time (in FTE) is dedicated to Playbook plays? _______
13. On days that you run Playbook plays, approximately how many plays are used per day? ______
14. In which areas of the airport do plays occur most frequently? Please mark with an X three areas from this list:

46 NATIONAL SURVEY OF PLAYBOOK AND SECURITY IMPLEMENTATION AT AIRPORTS
3
15. In which areas of the airport do plays occur least frequently? Please mark with an N areas where plays have
NEVER been run. Then, please mark with an X three areas where plays occur least frequently.
16. Overall, which plays are used most frequently at your airport? Please list the three plays that are used most
frequently on the first line below. Then, please give a reason or reasons why each play is often used by marking the
appropriate boxes in the column below each choice (you may mark more than one reason for each play).
List play names here: 1.
2. 3.
Have the type of resources necessary to run the play
Play best matched to characteristics of airport
Play best matched to characteristics of passengers
Play perceived to be effective
Usually have the cooperation of other
organizations/agencies needed to run the play
Other (please explain):
The next set of questions asks about the selection of plays using the Randomizer.
17. Please list the job title of the person(s) responsible for generating a list of plays using the Randomizer:
_________________________________
18. Approximately how often is the Randomizer run?
___ Daily ___ Weekly ___ Bi-Weekly ___ Monthly ___ Never ___ Other: __________
19. Prior to running the Randomizer, are any categories of plays de-selected to prevent them from being chosen?
___ Yes ___ No (If no, please skip to Question 21)
20. Please list the three categories of plays that are most often de-selected on the first line below. Then, please give
a reason or reasons why each category is de-selected by marking the appropriate boxes in the column below that
choice (you may mark more than one reason in each column).
List play categories here: 1.
2. 3.
Plays are not relevant to the airport
Not enough resources to run plays
Plays are not perceived as effective
Lack of training/knowledge to run plays
Lack of cooperation with other agencies
needed to run plays
Other reason (Please explain):
21. Once the Randomizer has produced a list of plays, do Playbook supervisors then implement every play on this
list or do they choose only some plays for implementation?
_____ Implement every play (Please skip to Question 23) _____ Choose only some plays

Center for Evidence-Based Crime Policy at GMU 47
4
22. At this point in the process, why are some plays not selected for implementation? Please mark all that apply.
_____ Certain plays are not relevant to the airport
_____ Do not have enough resources to run certain plays
_____ Certain plays are not perceived as effective
_____ Lack of training/knowledge to run certain plays
_____ Lack of cooperation with agencies needed to run certain plays
_____ Other (Please explain):_____________________________________________________________________
The next set of questions asks about plays that are not selected using the Randomizer.
23. Overall, how often would you say that Playbook supervisors implement plays that were not selected by the
Randomizer? For example, these plays
. Please circle a number on the scale below:
Very often
5 4
Sometimes
3 2
Rarely/Never
1
(If you answered Rarely/Never to Question 23, please skip to Question 25.)
24. When Playbook supervisors implement plays that were not chosen by the Randomizer, which plays are most
frequently selected? On the first line below, please list the three plays that are most frequently selected by
supervisors. Then, please give a reason or reasons why each play is selected by marking the appropriate boxes in
the column below (you may mark more than one reason for each play).
List play names here: 1.
2. 3.
Availability of extra resources
Period of a heightened security threat
Play perceived as effective
Required by TSA HQ
Regularly used as part of daily security
Personnel have specialized knowledge of
play tactic
Other (please explain):
25. In an average week, are most of the plays implemented at your airport selected by the Randomizer or are most
plays selected by other means? ___ Most plays from the Randomizer ___ Most plays selected by other means
The following questions ask about locally-developed plays.
26. Have TSA employees at your airport created and implemented locally-developed plays (that is, plays that do not
appear in any Playbook)? ___ Yes ___ No (If no, please skip to Question 30)
27. Please estimate how many plays your airport has developed: ____________
28. In what area(s) of the airport do most of the locally-developed plays occur? Please mark up to three areas
where most of these plays occur:

48 NATIONAL SURVEY OF PLAYBOOK AND SECURITY IMPLEMENTATION AT AIRPORTS
5
29. Please briefly describe the locally-developed play(s) that are most frequently used:
____________________________________________________________________________________________
____________________________________________________________________________________________
30. Overall, when selecting and implementing plays at your airport, how often do those in charge take into account
how plays might negatively affect …? Please mark one box on each row.
Very often
5 4
Sometimes
3 2
Never
1
…business at airport vendors?
…airline arrival/departure times?
…passenger views of airport security?
…the working environment of airline staff?
…wait times at security lines/boarding gates?
31. Many plays in the Playbook encourage collaboration between TSA and other non-TSA units, organizations, and
agencies. How often do the following organizations/agencies at your airport collaborate with TSA to implement
plays? Please mark one box on each row.
Very often
5 4
Sometimes
3 2
Never
1
Airport Authority employees
Airport police
Local law enforcement (not airport police)
Federal law enforcement
Vendors
Airlines
Outside contractors
Entities outside of the airport
Other (Please specify):
32. When it comes to Playbook activities, how would you rate the cooperation between the TSA and other agencies
or organizations at your airport? Please mark one box on each row.
Excellent
5 4 3 2
Poor
1
Airport Authority employees
Airport police
Local law enforcement
Federal law enforcement
Vendors
Airlines
Outside contractors
Entities outside the airport

Center for Evidence-Based Crime Policy at GMU 49
6
Other (please specify):
33. Whenever any new program is launched, there can be variation in how the program is viewed. In your opinion,
do the following groups have a positive or a negative perception of Playbook activities at your airport? Please mark
one box on each row. If a group mentioned is generally not aware of Playbook, please mark the last box in the row.
Very
positive
5
4
3
2
Very
Negative
1
Not
aware
(Assistant) Federal security directors
TSA Playbook coordinator
TSA behavioral detection officers (BDOs)
TSA security officers (TSOs)
TSA aviation inspectors
Federal law enforcement officers
Federal air marshals
Field intelligence officers
Airport authority
Airport police
Local law enforcement officers (not airport police)
Airline personnel
Airport vendors
Airport contractors
Airline passengers
Other members of the public who visit the airport
34. Is there a formal complaint system at your airport where individuals can report concerns about Playbook
activities? ___ Yes ___ No ___ I don’t know
(If you answered No or Don’t Know to Question 34, please skip to Question 38.)
35. Please specify the play that most frequently leads to complaints from the public: ________________________
____________________________________________________________________________________________
36. Please specify the play that most frequently leads to complaints from airport personnel: __________________
____________________________________________________________________________________________
37. In your experience, have complaints from the public about TSA activities at your airport increased, decreased or
stayed about the same since the introduction of Playbook? Please circle one number on the scale below:
Greatly increased
5 4
Stayed the same
3 2
Greatly decreased
1
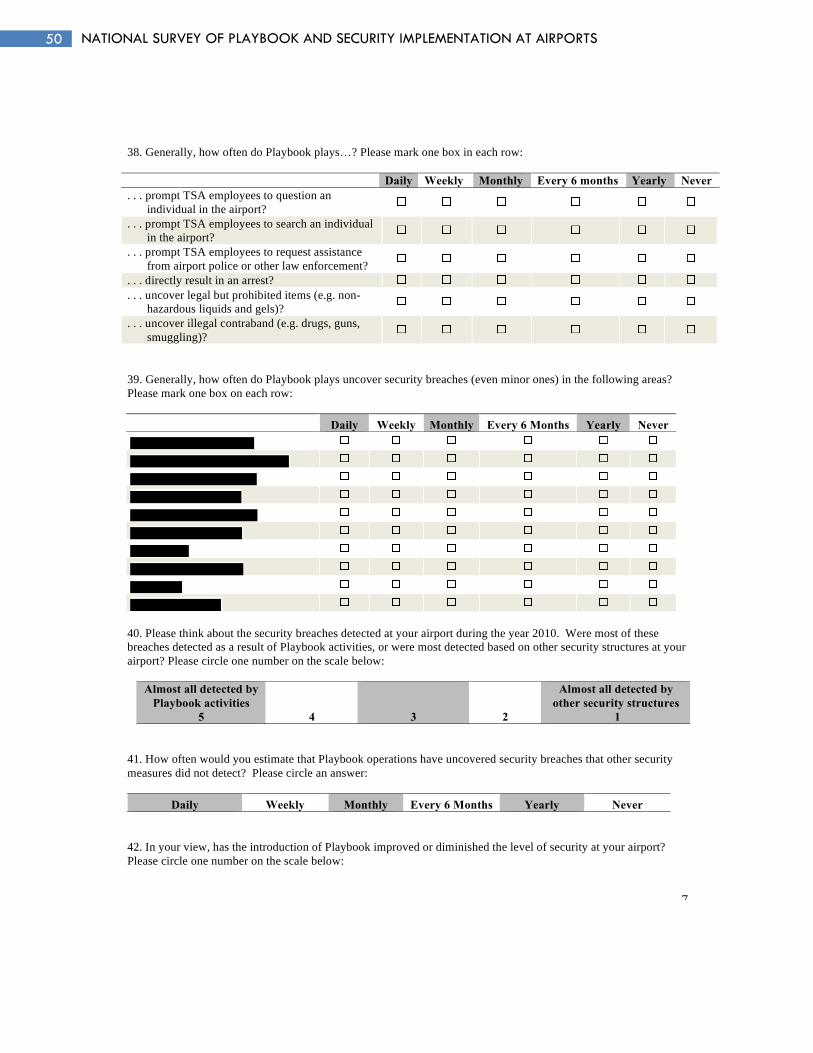
50 NATIONAL SURVEY OF PLAYBOOK AND SECURITY IMPLEMENTATION AT AIRPORTS
7
38. Generally, how often do Playbook plays…? Please mark one box in each row:
Daily Weekly Monthly Every 6 months Yearly Never
. . . prompt TSA employees to question an
individual in the airport?
. . . prompt TSA employees to search an individual
in the airport?
. . . prompt TSA employees to request assistance
from airport police or other law enforcement?
. . . directly result in an arrest?
. . . uncover legal but prohibited items (e.g. non-
hazardous liquids and gels)?
. . . uncover illegal contraband (e.g. drugs, guns,
smuggling)?
39. Generally, how often do Playbook plays uncover security breaches (even minor ones) in the following areas?
Please mark one box on each row:
Daily Weekly Monthly Every 6 Months Yearly Never
40. Please think about the security breaches detected at your airport during the year 2010. Were most of these
breaches detected as a result of Playbook activities, or were most detected based on other security structures at your
airport? Please circle one number on the scale below:
Almost all detected by
Playbook activities
5
4
3
2
Almost all detected by
other security structures
1
41. How often would you estimate that Playbook operations have uncovered security breaches that other security
measures did not detect? Please circle an answer:
Daily Weekly Monthly Every 6 Months Yearly Never
42. In your view, has the introduction of Playbook improved or diminished the level of security at your airport?
Please circle one number on the scale below:

Center for Evidence-Based Crime Policy at GMU 51
8
Significantly improved
5
4
Stayed about the same
3
2
Significantly diminished
1
43. In your opinion, which three plays are most effective from a security perspective? Please list the three plays you
believe are most effective and provide a brief explanation as to why.
Name of Play 1: ______________ Reason: _________________________________________________________
Name of Play 2: ______________ Reason: _________________________________________________________
Name of Play 3: ______________ Reason: _________________________________________________________
44. In your opinion, which three plays are least effective from a security perspective? Please list the three plays you
believe are least effective and provide a brief explanation as to why.
Name of Play 1: ______________ Reason: _________________________________________________________
Name of Play 2: ______________ Reason: _________________________________________________________
Name of Play 3: ______________ Reason: _________________________________________________________
45. Do you agree or disagree with the following statement? Any questions or concerns I have had about Playbook
have been adequately addressed by TSA headquarters. Please circle one number on the scale below:
Strongly agree
5
4
3
2
Strongly disagree
1
Thank you for your participation. In order to complete the survey, please answer a few brief factual questions
about your airport. As a reminder, individual answers to this survey will not be shared with anyone, including
TSA. Any identifying information you provide will be kept confidential and will only be used by the research
team to follow up if we have any questions.
46. Please list the 3 digit ICAO/IATA code of your airport: ____ ____ ____
47. Approximately how many total flights depart from your airport each month? ____________
48. Which types of flights operate from your airport? Please check all that apply:
___ Domestic commercial flights ___ International commercial flights ___ Cargo flights
49. What is the monthly count of departing commercial airline passengers at your airport? _____________
50. What is the monthly volume of cargo (in tons) enplaned and deplaned at your airport? _____________
51. How many TSA employees work at your airport? ____________
52. If we need to clarify an answer to the survey, may we contact you? If so, please provide your contact
information below (name, job title, telephone number, email address). Again, all contacts will be kept confidential.
____________________________________________________________________________________________
_______________________________________________________________ _____________________________
53. If you have any concerns or comments about Playbook that you feel have not been addressed on this survey,
please describe them here: ______________________________________________________________________
____________________________________________________________________________________________
____________________________________________________________________________________________
______________________________________________________________________________________ ______
____________________________________________________________________________________________
____________________________________________________________________________________________
_______________________________________________________________ _____________________________
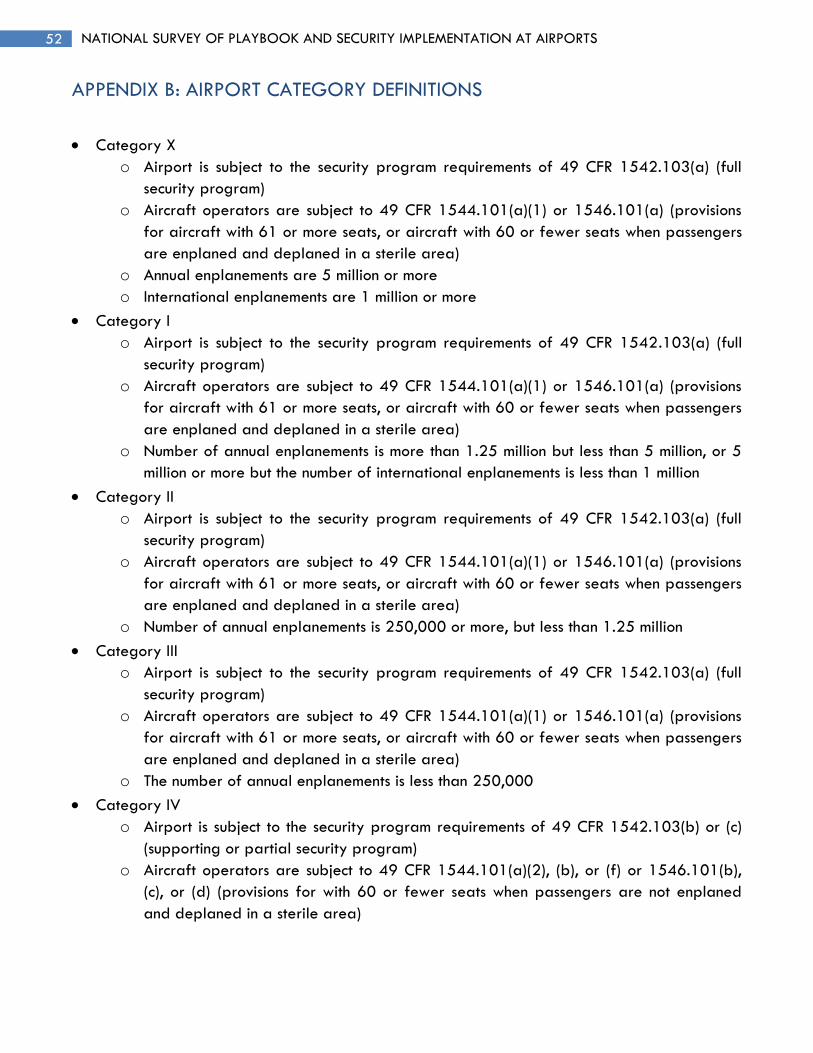
52 NATIONAL SURVEY OF PLAYBOOK AND SECURITY IMPLEMENTATION AT AIRPORTS
APPENDIX B: AIRPORT CATEGORY DEFINITIONS
Category X
o Airport is subject to the security program requirements of 49 CFR 1542.103(a) (full
security program)
o Aircraft operators are subject to 49 CFR 1544.101(a)(1) or 1546.101(a) (provisions
for aircraft with 61 or more seats, or aircraft with 60 or fewer seats when passengers
are enplaned and deplaned in a sterile area)
o Annual enplanements are 5 million or more
o International enplanements are 1 million or more
Category I
o Airport is subject to the security program requirements of 49 CFR 1542.103(a) (full
security program)
o Aircraft operators are subject to 49 CFR 1544.101(a)(1) or 1546.101(a) (provisions
for aircraft with 61 or more seats, or aircraft with 60 or fewer seats when passengers
are enplaned and deplaned in a sterile area)
o Number of annual enplanements is more than 1.25 million but less than 5 million, or 5
million or more but the number of international enplanements is less than 1 million
Category II
o Airport is subject to the security program requirements of 49 CFR 1542.103(a) (full
security program)
o Aircraft operators are subject to 49 CFR 1544.101(a)(1) or 1546.101(a) (provisions
for aircraft with 61 or more seats, or aircraft with 60 or fewer seats when passengers
are enplaned and deplaned in a sterile area)
o Number of annual enplanements is 250,000 or more, but less than 1.25 million
Category III
o Airport is subject to the security program requirements of 49 CFR 1542.103(a) (full
security program)
o Aircraft operators are subject to 49 CFR 1544.101(a)(1) or 1546.101(a) (provisions
for aircraft with 61 or more seats, or aircraft with 60 or fewer seats when passengers
are enplaned and deplaned in a sterile area)
o The number of annual enplanements is less than 250,000
Category IV
o Airport is subject to the security program requirements of 49 CFR 1542.103(b) or (c)
(supporting or partial security program)
o Aircraft operators are subject to 49 CFR 1544.101(a)(2), (b), or (f) or 1546.101(b),
(c), or (d) (provisions for with 60 or fewer seats when passengers are not enplaned
and deplaned in a sterile area)

Center for Evidence-Based Crime Policy at GMU 53
APPENDIX C: RESEARCH METHODOLOGY
Due to the finite number of airports available in our sample, it was crucial to obtain the highest
response rate possible. Response rates can be low in organizational surveys because an
appropriate individual within the organization is not targeted to fill out the survey; survey
distributions are not followed up; and/or the organization is unaware of the research and does
not see it as a priority. To overcome these difficulties, we sent surveys to an identified individual
within TSA at each airport, usually the FSD or other TSA lead executive, or the Playbook
coordinator. TSA provided us with a list of names, mailing and email addresses, and direct
contact numbers for these individuals. In our introductory material we made it clear to FSDs that
they could pass the survey along to other relevant individuals within TSA at their airport. We also
included letters of support from a senior executive from TSA‟s Office of Security Operations and
the DHS Science and Technology Directorate to emphasize the legitimacy of the survey while still
maintaining that the data collection was independent of TSA (see Appendix A). Finally,
respondents were given the option of completing the survey on paper or online through a secure
website controlled by the CEBCP-GMU team. Each paper survey was sent out with a self-
addressed, stamped envelope for airports to return their responses. Providing these flexible
options helped to ensure that airports would be willing to participate. The survey instrument and
accompanying consent letter (see Appendix A) were reviewed and approved by George Mason
University's Human Subjects Review Board in accordance with Federal regulations governing the
participation of human subjects in research and data collection.
The survey implementation and data collection occurred in four waves across a four-month
period. The first wave of surveys was mailed out on July 5, 2011, accompanied by an email to
all FSDs introducing the project and explaining their options for responding to the survey. The
email contained a link to the online version of the survey, and the link was also included on the
paper survey sent via U.S. mail. On August 2, 2011, we followed up with a second wave of
mailings and emails to those who had not yet responded. On September 6, 2011, graduate
research assistants working with the CEBCP team personally called each FSD whose airport had
not yet responded and encouraged them to fill out the survey. A second round of telephone
follow-up took place on October 11, and online data collection officially ended on October 31.
The multi-wave strategy and personal contacts with airports helped to ensure a high response
rate.
Between the final round of telephone calls and the closing date, project staff entered the paper
surveys returned by mail into the same online survey instrument provided to airports to maintain a
consistent data structure. The final dataset was downloaded into SPSS format. Graduate
research assistants also contacted respondents by telephone during these final weeks to clarify
certain questions or duplicate responses from airports as we prepared the data for analysis.