trying, but not much progress in 2014 -...
TRANSCRIPT

PREPARED BY NON-US BROKER-DEALER(S):BNP PARIBAS SECURITIES (ASIA) LTD THIS MATERIAL HAS BEEN APPROVED FOR U.S DISTRIBUTION. ANALYST CERTIFICATION ANDIMPORTANTDISCLOSURES CAN BE FOUND AT APPENDIX ON PAGE 39
EQUITIES RESEARCH
CHINA STEEL SECTOR Trying, but not much progress in 2014
n Achieving forced capacity closures will be difficult in 2014, although geared steel mills could be forced out by tight funding after 2015. Currently, mills have to keep generating cash flow to cover interest expenses even if they are loss-making. Given their cash reserves, we think mills can survive for a year-and-a-half to two years. Hebei and Tangshan have announced aggressive capacity closure plans, but they have no clear compensation or labour relocation plans.
n Key differences between the steel and cement segments lie in fragmentation, links with financial systems, the regional nature of the market, economic impact on particular provinces, and product heterogeneity.
n We recommend being long the cement sector and short the steel sector.
Rachel Cheung [email protected]
+852 2825 1824
Our research is available on Thomson One, Bloomberg, TheMarkets.com, Factset and on http://eqresearch.bnpparibas.com/index. Please contact your salesperson for authorisation. Please see the important notice on the inside back cover.
8 JANUARY 2014
China Steel Sector Rachel Cheung
BNP PARIBAS 8 JANUARY 2014
To find out more about BNP Paribas Equities Research:
Visit : http://eqresearch.bnpparibas.com/ For ipad users : http://appstore.apple.com/BNPP-equities/
2

Trying, but not much progress in 2014
n Forced closures in 2014 are harsh; geared steel mills to be forced out by tight funding in 2015
To curb overcapacity and environmental problems, the State Council and provincial governments
announced capacity closure targets; 60mt in Hebei (40mt in Tangshan) by 2017, 7mt in Jiangsu by
2018, and 15mt of backward capacity by 2015. The government seems more serious than five years
ago, but we are less optimistic than the market and think most of the impact will be back loaded.
Capacity in Hebei will be cut (actual existing capacity is unclear), but new capacity adds in Jiangsu
and Anhui East China mean utilization will not improve. Heavy interest expense will keep steel mills
running, even if loss-making. There is no clear funding source to compensate capacity closures in
Hebei. Based on two years’ of steel trader clean-up (from 3Q11), we think mills’ cash reserves can
support loss-making operations for at least two years with 2013 as the first year of losses for most
steel billet producers. We expect steel mills to struggle in 2014, reaching a critical point in 2015. Our
steel demand growth forecast is 3.5% and supply is 3.4% in 2014 with 78% net utilization at best.
n Fundamental differences between cement and steel determine efficacy of capacity closures
Similar policies to curb overcapacity have been announced in the steel and cement sectors, but the
fundamental differences between them mean the impact for cement is front loaded while steel’s is
back loaded. Thanks to high clinker consolidation, its regional nature, high productivity and more
homogenous products in the cement sector, it is easier for cement leaders to gain market share from
smaller players. Provinces rely less on cement for taxes and revenue since capacity is regionally
diverse. Steel is tradable domestically and internationally. One fundamental difference from the
cement sector is that smaller steel players have better cost control than large SOE steel mills due to
lower environmental concerns, off-spec product quality, and more flexible raw material supply
sources. Steel capacity is clustered in a few provinces and closely linked with local banking/financial
systems via traders. Provinces like Hebei rely heavily on steel businesses for tax revenue and it is
hard to find alternatives to replace this medium term given weak local property market outlook.
n We suggest investors switch from steel to cement
Angang is trading at a 24% P/BV premium to Magang, which we don’t think is sustainable given our
below-market expectations for steel in 2014. As such we downgrade Angang to REDUCE from Hold
and upgrade Magang to HOLD from Reduce. In the cement sector, Given the outperformance of
Angang over Anhui Conch over the past six months and better cement sector fundamentals, we
recommend investors BUY Anhui Conch and REDUCE Angang.
BNPP recommendations
Company BBG code Rating Share price Target price Upside/downside
Anhui Conch Cement 914 HK BUY 26.85 34.20 +27.4%
Maanshan Steel 323 HK HOLD 1.98 2.11 +6.3%
Angang Steel 347 HK REDUCE 5.30 4.65 -12.4%
Sources: Bloomberg; BNP Paribas estimates
8 JANUARY 2014
SECTOR REPORT
CHINA STEEL SECTOR
Rachel Cheung [email protected]
+852 2825 1824
3
China Steel Sector Rachel Cheung
BNP PARIBAS 8 JANUARY 2014
Investment thesis
We spoke with many steel mills and traders during the
annual steel conference in Shanghai at end-December. We
concluded that steel mills’ and traders’ expectations of the
power to enforce capacity closures and emission controls are
lower than what the capital market or investors are
estimating. The number-one problem in steel mills now is
expensive funding costs and tight funding sources, which is
obstructing them from being able to produce rationally, as
they have to keep their operations running to generate cash
flow to at least cover interest expenses. We expect continued
high utilization at thin margins in 2014.
We view the capital market as too optimistic about prospects
for the policies’ implementation in the steel sector, with many
investors preferring to be long steel names after the rally in
cement names. However, we do not agree with this strategy.
We recommend buying cement and selling steel given the
faster correction in cement than in steel stocks recently.
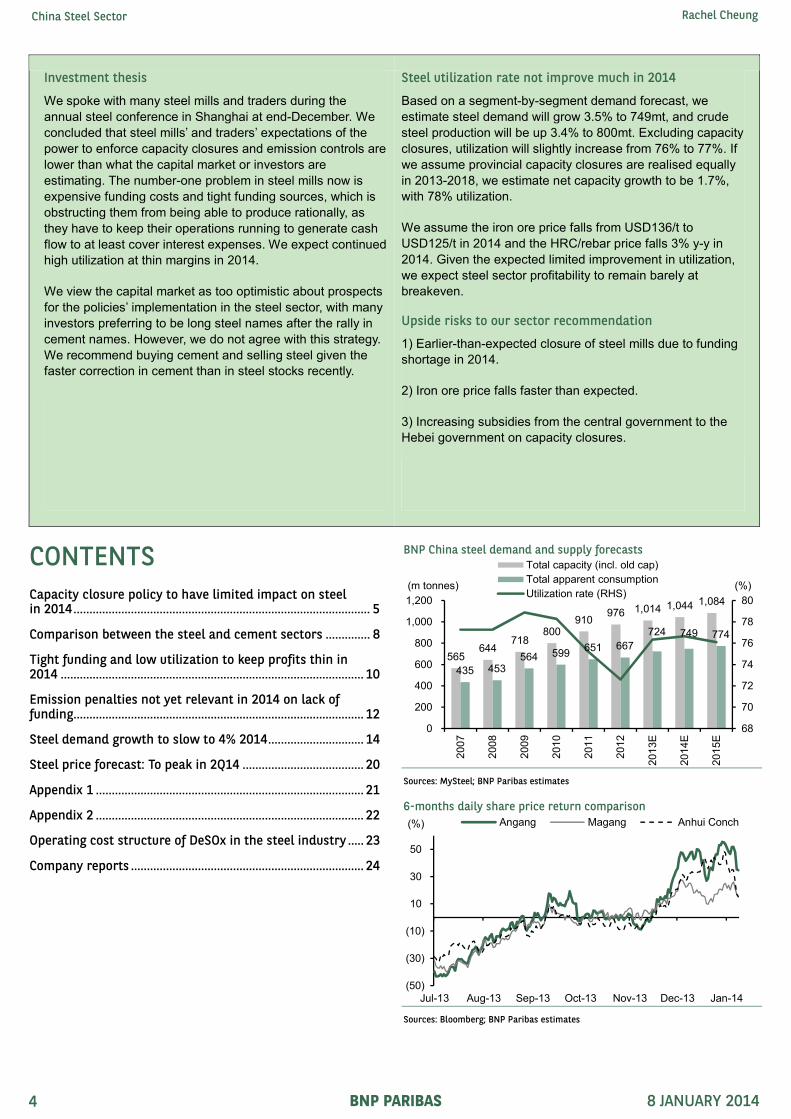
Steel utilization rate not improve much in 2014
Based on a segment-by-segment demand forecast, we
estimate steel demand will grow 3.5% to 749mt, and crude
steel production will be up 3.4% to 800mt. Excluding capacity
closures, utilization will slightly increase from 76% to 77%. If
we assume provincial capacity closures are realised equally
in 2013-2018, we estimate net capacity growth to be 1.7%,
with 78% utilization.
We assume the iron ore price falls from USD136/t to
USD125/t in 2014 and the HRC/rebar price falls 3% y-y in
2014. Given the expected limited improvement in utilization,
we expect steel sector profitability to remain barely at
breakeven.
Upside risks to our sector recommendation
1) Earlier-than-expected closure of steel mills due to funding
shortage in 2014.
2) Iron ore price falls faster than expected.
3) Increasing subsidies from the central government to the
Hebei government on capacity closures.
CONTENTS
Capacity closure policy to have limited impact on steel in 2014 ............................................................................................. 5
Comparison between the steel and cement sectors .............. 8
Tight funding and low utilization to keep profits thin in 2014 ............................................................................................... 10
Emission penalties not yet relevant in 2014 on lack of funding........................................................................................... 12
Steel demand growth to slow to 4% 2014 .............................. 14
Steel price forecast: To peak in 2Q14 ...................................... 20
Appendix 1 .................................................................................... 21
Appendix 2 .................................................................................... 22
Operating cost structure of DeSOx in the steel industry ..... 23
Company reports ......................................................................... 24
BNP China steel demand and supply forecasts
Sources: MySteel; BNP Paribas estimates
6-months daily share price return comparison
Sources: Bloomberg; BNP Paribas estimates
565 644
718 800
910 976 1,014 1,044
1,084
435 453 564 599
651 667
724 749 774
68
70
72
74
76
78
80
0
200
400
600
800
1,000
1,200
2007
2008
2009
2010
2011
2012
2013E
2014E
2015E
(%)(m tonnes)
Total capacity (incl. old cap)
Total apparent consumption
Utilization rate (RHS)
(50)
(30)
(10)
10
30
50
Jul-13 Aug-13 Sep-13 Oct-13 Nov-13 Dec-13 Jan-14
(%) Angang Magang Anhui Conch
4

China Steel Sector Rachel Cheung
BNP PARIBAS 8 JANUARY 2014
Capacity closure policy to have limited impact on steel in 2014
We have recently seen a lot of capacity closure announcements from the State
Council, and local and provincial governments, especially Hebei province.
§ The State Council announced its backward steel capacity closure target of 15mt
by 2015 (1.5% of total capacity).
§ The Hebei government aims to close 60mt (6% of total capacity or 25% of Hebei
capacity) by 2017, with 15mt in 2014. The local government cut 8.3mt in 2013
(mostly non-operational blast furnaces).
§ The Jiangsu government has unveiled a plan to cut 7mt of steelmaking capacity
(0.7% of total capacity) in 2014-18.
§ We expect more local governments to follow the leads of Hebei and Jiangsu.
§ There have been frequent electricity suspensions in Hebei and Shandong to cub
air pollution during periods of continuous smog.
However, after attending the annual steel conference and speaking with many steel
traders and steel mills, we do not believe the capacity closures will be significant
enough to support overall sector profitability or utilization, because:
§ Backward steel capacity closure of 15mt is mostly non-operational or with very
low utilization.
§ We see the most aggressive capacity cut target (60mt) in Hebei, of which
Tangshan city accounts for 40mt. However, we have to bear in mind: 1) the most
serious overcapacity problem is found in Hebei, especially Tangshan. Most the
steel billet producers in Tangshan were loss-making in 2013. Hebei’s total steel
capacity is around 230-250mt, while Tangshan has 150mt capacity; 2) The Hebei
Provincial government understood that most of the steel mills are loss-making at
the cash level in 2013. Tight funding conditions will squeeze small and
problematic steel mills to inevitably close after two years of cash losses. The
government can wait for problematic mills to close by themselves with no need to
force closures, thereby saving the need for compensation, and the aggressive
capacity closure only applies to Hebei province while other provinces are adding
capacity to take the market share from Hebei in 2014, so overall overcapacity will
still not improve significantly in 2014 (i.e. Jiangsu is only closing 7mt by 2018,
while adding 12mt in 2013-2014) (Exhibit 1-4).
§ Frequent electricity suspensions will hinder only the steel processing/rolling
plants, but will have a limited impact on blast furnace operation. It is very costly to
re-heat a blast furnace (around RMB15m-20m to re-heat, not to mention that the
coking plant may break after suspension), so steel mills prefer not to stop their
blast furnaces at all. Therefore, we note that steel mill inventory continue to rise
despite the electricity suspension (Exhibit 12).
Even if we include all the announced capacity closures in our capacity forecast, the
steel utilization rate is still low at around 77-78%, not much different from the gross
utilization of 76-77% in 2014E (Exhibit 5), due to the continuous substantial capacity
additions.
5
China Steel Sector Rachel Cheung
BNP PARIBAS 8 JANUARY 2014
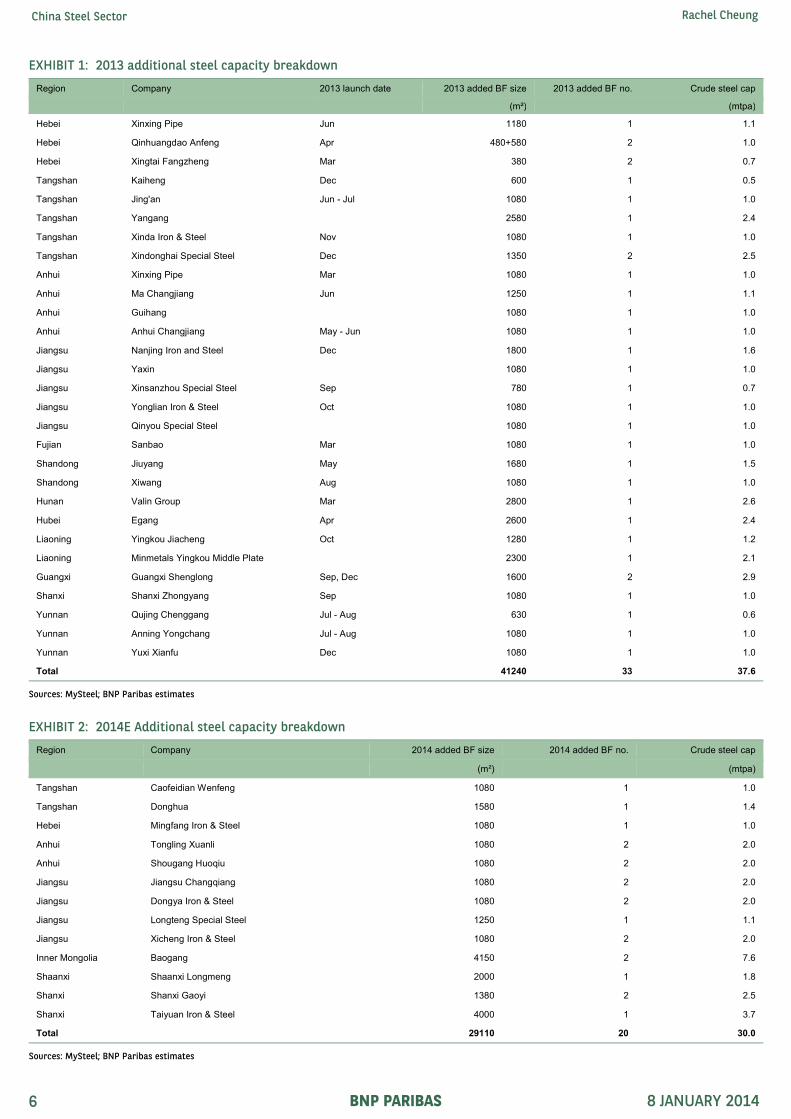
EXHIBIT 1: 2013 additional steel capacity breakdown
Region Company 2013 launch date 2013 added BF size 2013 added BF no. Crude steel cap
(m²)
(mtpa)
Hebei Xinxing Pipe Jun 1180 1 1.1
Hebei Qinhuangdao Anfeng Apr 480+580 2 1.0
Hebei Xingtai Fangzheng Mar 380 2 0.7
Tangshan Kaiheng Dec 600 1 0.5
Tangshan Jing'an Jun - Jul 1080 1 1.0
Tangshan Yangang
2580 1 2.4
Tangshan Xinda Iron & Steel Nov 1080 1 1.0
Tangshan Xindonghai Special Steel Dec 1350 2 2.5
Anhui Xinxing Pipe Mar 1080 1 1.0
Anhui Ma Changjiang Jun 1250 1 1.1
Anhui Guihang
1080 1 1.0
Anhui Anhui Changjiang May - Jun 1080 1 1.0
Jiangsu Nanjing Iron and Steel Dec 1800 1 1.6
Jiangsu Yaxin
1080 1 1.0
Jiangsu Xinsanzhou Special Steel Sep 780 1 0.7
Jiangsu Yonglian Iron & Steel Oct 1080 1 1.0
Jiangsu Qinyou Special Steel
1080 1 1.0
Fujian Sanbao Mar 1080 1 1.0
Shandong Jiuyang May 1680 1 1.5
Shandong Xiwang Aug 1080 1 1.0
Hunan Valin Group Mar 2800 1 2.6
Hubei Egang Apr 2600 1 2.4
Liaoning Yingkou Jiacheng Oct 1280 1 1.2
Liaoning Minmetals Yingkou Middle Plate
2300 1 2.1
Guangxi Guangxi Shenglong Sep, Dec 1600 2 2.9
Shanxi Shanxi Zhongyang Sep 1080 1 1.0
Yunnan Qujing Chenggang Jul - Aug 630 1 0.6
Yunnan Anning Yongchang Jul - Aug 1080 1 1.0
Yunnan Yuxi Xianfu Dec 1080 1 1.0
Total 41240 33 37.6
Sources: MySteel; BNP Paribas estimates
EXHIBIT 2: 2014E Additional steel capacity breakdown
Region Company 2014 added BF size 2014 added BF no. Crude steel cap
(m²)
(mtpa)
Tangshan Caofeidian Wenfeng 1080 1 1.0
Tangshan Donghua 1580 1 1.4
Hebei Mingfang Iron & Steel 1080 1 1.0
Anhui Tongling Xuanli 1080 2 2.0
Anhui Shougang Huoqiu 1080 2 2.0
Jiangsu Jiangsu Changqiang 1080 2 2.0
Jiangsu Dongya Iron & Steel 1080 2 2.0
Jiangsu Longteng Special Steel 1250 1 1.1
Jiangsu Xicheng Iron & Steel 1080 2 2.0
Inner Mongolia Baogang 4150 2 7.6
Shaanxi Shaanxi Longmeng 2000 1 1.8
Shanxi Shanxi Gaoyi 1380 2 2.5
Shanxi Taiyuan Iron & Steel 4000 1 3.7
Total 29110 20 30.0
Sources: MySteel; BNP Paribas estimates
6
China Steel Sector Rachel Cheung
BNP PARIBAS 8 JANUARY 2014
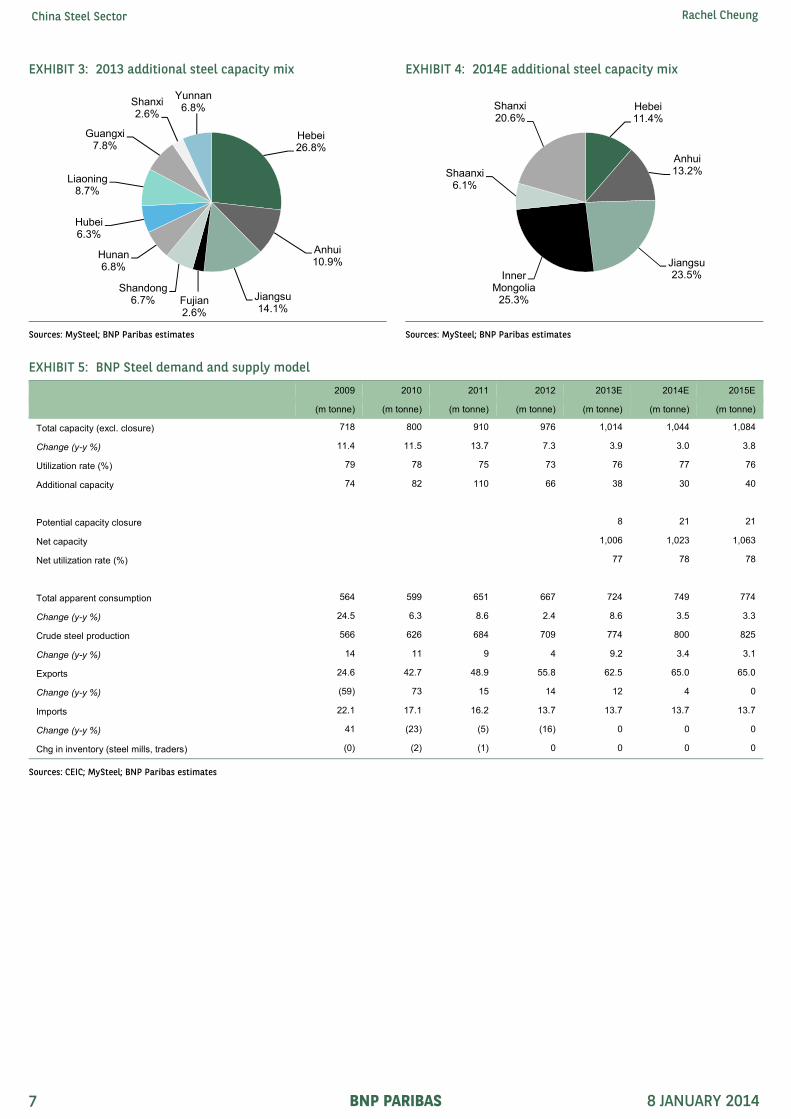
EXHIBIT 3: 2013 additional steel capacity mix EXHIBIT 4: 2014E additional steel capacity mix
Sources: MySteel; BNP Paribas estimates Sources: MySteel; BNP Paribas estimates
EXHIBIT 5: BNP Steel demand and supply model
2009 2010 2011 2012 2013E 2014E 2015E
(m tonne) (m tonne) (m tonne) (m tonne) (m tonne) (m tonne) (m tonne)
Total capacity (excl. closure) 718 800 910 976 1,014 1,044 1,084
Change (y-y %) 11.4 11.5 13.7 7.3 3.9 3.0 3.8
Utilization rate (%) 79 78 75 73 76 77 76
Additional capacity 74 82 110 66 38 30 40
Potential capacity closure 8 21 21
Net capacity 1,006 1,023 1,063
Net utilization rate (%) 77 78 78
Total apparent consumption 564 599 651 667 724 749 774
Change (y-y %) 24.5 6.3 8.6 2.4 8.6 3.5 3.3
Crude steel production 566 626 684 709 774 800 825
Change (y-y %) 14 11 9 4 9.2 3.4 3.1
Exports 24.6 42.7 48.9 55.8 62.5 65.0 65.0
Change (y-y %) (59) 73 15 14 12 4 0
Imports 22.1 17.1 16.2 13.7 13.7 13.7 13.7
Change (y-y %) 41 (23) (5) (16) 0 0 0
Chg in inventory (steel mills, traders) (0) (2) (1) 0 0 0 0
Sources: CEIC; MySteel; BNP Paribas estimates
Hebei 26.8%
Anhui10.9%
Jiangsu14.1%
Fujian2.6%
Shandong 6.7%
Hunan 6.8%
Hubei 6.3%
Liaoning 8.7%
Guangxi 7.8%
Shanxi 2.6%
Yunnan6.8% Hebei
11.4%
Anhui13.2%
Jiangsu23.5%Inner
Mongolia 25.3%
Shaanxi 6.1%
Shanxi20.6%
7

China Steel Sector Rachel Cheung
BNP PARIBAS 8 JANUARY 2014
Comparison between the steel and cement sectors
The cement and steel sectors are two overcapacity sectors that the central
government would like to focus on improving in its 12th Five Year Plan. Although
similar policies have been announced, we think there are fundamental differences
between the steel and cement sectors.
Thanks to high clinker consolidation, the regional nature of the cement sector, high
productivity, and more homogenous products, we believe it is easier to implement
capacity controls in the cement sector and allow cement leaders to take market
share from smaller players. Since cement capacity is spread widely between
provinces in China, each province relies less on the cement sector for its fiscal
revenue or taxes.
We found there are still many hurdles for the government in closing capacity in the
steel sector. Steel is not spread regionally (as cement is) and steel products are
tradable domestically and internationally. We expect steel capacity to grow outside
Hebei, while Hebei is keen on closing capacity. One of the fundamental differences
from the cement sector is that smaller steel players have better cost control than
large SOE steel mills due to lower environmental concerns, off-spec product quality,
and more flexible raw material supply sources. Steel capacity is not only clustered in
a few provinces, but is also linked closely with local banking/financial systems
through traders. Provinces such as like Hebei rely heavily on steel businesses for tax
revenue and we believe it is hard to find alternative non-steel businesses to replace
their contribution in the medium term, given the weak local property market outlook.
Given the outperformance of Angang over Anhui Conch over the past six months and
better fundamentals of the cement sector over the steel sector, we recommend
investors to BUY Anhui Conch and REDUCE Angang (Exhibit 7).
EXHIBIT 6: Differences between China’s cement and steel sectors
Cement Steel
Policies - Straight new capacity approval, replacement with less or equal volume
- Straight new capacity approval, replacement with less or equal volume
- Close 5% backward capacity (100mt) by 2015 - Close 1.5% backward capacity (15mt) by 2015
- Latest tight emission standard announced 27 Dec 2013 - Latest emission standard announced June 2012
- Cancel PC32.5 grade cement from mid-2014 - Hebei to close 60mt steel cap. by 2017
- Tangshan to close 40mt steel cap. by 2017
- Jiangsu to close 7mt steel cap. by 2018
Net profit margin 6.83% [Based on Dcement survey] 0.55% [based on CISA survey]
Electricity suspension impact - Kilns and grinding stations - Rolling/processing facilities
Top 3 provinces’ share 21% 44%
Top 10 capacity concentrate 54% 35%
Annual Labour productivity 2,317t/person 100t/person
No. of impacted employees - 86k people impacted if 10% closure (i.e. 5% small NSP + 5% backward)
- 600k people impacted in Hebei, 70k in Jiangsu
Cost structure Large players lower operating cost Small players lower operating cost
Gearing ratio 57% 123%
(Continued on next page)
8
China Steel Sector Rachel Cheung
BNP PARIBAS 8 JANUARY 2014
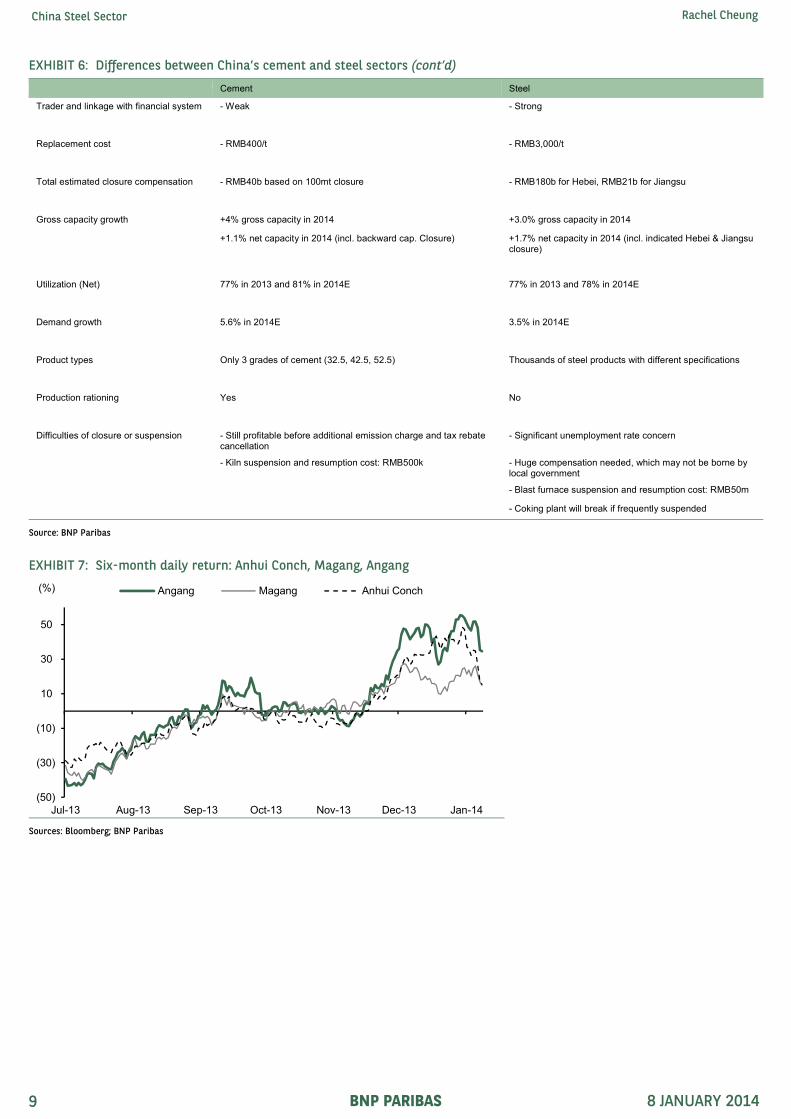
EXHIBIT 6: Differences between China’s cement and steel sectors (cont’d)
Cement Steel
Trader and linkage with financial system - Weak - Strong
Replacement cost - RMB400/t - RMB3,000/t
Total estimated closure compensation - RMB40b based on 100mt closure - RMB180b for Hebei, RMB21b for Jiangsu
Gross capacity growth +4% gross capacity in 2014 +3.0% gross capacity in 2014
+1.1% net capacity in 2014 (incl. backward cap. Closure) +1.7% net capacity in 2014 (incl. indicated Hebei & Jiangsu closure)
Utilization (Net) 77% in 2013 and 81% in 2014E 77% in 2013 and 78% in 2014E
Demand growth 5.6% in 2014E 3.5% in 2014E
Product types Only 3 grades of cement (32.5, 42.5, 52.5) Thousands of steel products with different specifications
Production rationing Yes No
Difficulties of closure or suspension - Still profitable before additional emission charge and tax rebate cancellation
- Significant unemployment rate concern
- Kiln suspension and resumption cost: RMB500k - Huge compensation needed, which may not be borne by local government
- Blast furnace suspension and resumption cost: RMB50m
- Coking plant will break if frequently suspended
Source: BNP Paribas
EXHIBIT 7: Six-month daily return: Anhui Conch, Magang, Angang
Sources: Bloomberg; BNP Paribas
(50)
(30)
(10)
10
30
50
Jul-13 Aug-13 Sep-13 Oct-13 Nov-13 Dec-13 Jan-14
(%) Angang Magang Anhui Conch
9

China Steel Sector Rachel Cheung
BNP PARIBAS 8 JANUARY 2014
Tight funding and low utilization to keep profits thin in 2014
Back in 2011, tight funding was the key reason dragging down the China steel price.
The price drop in 2012 was due to a slowdown in steel demand drivers (i.e., property,
railways, shipbuilding). The increase in the interest rate and tight funding dragged
the steel price down again in 2013.
An increasing number of steel traders have been forced into bankruptcy since 3Q11,
increasing bad loan provisions to banks from 2011 to early 2013. Given their bad
experiences with the steel sector as well as the discouraging message from the
government about overcapacity in the steel sector, many banks are reluctant to lend
to steel-related companies, including steel mills. Due to the heavy capital needs of
steel projects, both private and SOE steel company projects under construction are
heavily geared, which means they suffer from financial risk in a tight funding
environment. The profitable and positive outlook is encouraging cement leaders to
continue M&A to increase market concentration.
After two years of steel trader clean-up with tight funding, most of the speculators
have been closed. Based on our communication with steel traders and mills at the
annual steel conference in Shanghai, we found that the traditionally superior position
of steel mills over steel traders is declining. Many steel traders are not willing to be
direct distributors for steel mills, helping to bear the steel mills’ inventories, which is
causing steel mills’ inventories to inevitably increase while steel traders’ inventories
remain at low levels. In addition, some steel traders, for the first time, have asked
steel mills to sell on bank-draft, instead of the traditional full-cash, basis. Low steel
capacity concentration reduces the bargaining power of overseas iron ore suppliers,
so China steel leaders would prefer to acquire overseas iron ore assets rather than
acquiring loss-making steel mills domestically.
The increasing finance cost burden is forcing steel mills to continue operating at high
utilizations to maintain cash flow even with high inventories and low margins
(Exhibits 8-13). Tangshan steel billet producers have turned from moderately
profitable to loss-making since the beginning of 2013. We believe steel mills normally
have healthy balance sheets, so we think problematic steel mills’ financial reserves
can keep them running for at least another 1-1.5 years, based on reference to the
clean-up period of the steel traders.
EXHIBIT 8: Steel price vs. M2 EXHIBIT 9: Steel price vs. SHIBOR
Sources: CEIC; MySteel; BNP Paribas Sources: MySteel; Bloomberg; BNP Paribas
10
12
14
16
18
20
22
24
26
28
30
2,000
2,500
3,000
3,500
4,000
4,500
5,000
5,500
Jan-03
Jul-03
Jan-04
Jul-04
Jan-05
Jul-05
Jan-06
Jul-06
Jan-07
Jul-07
Jan-08
Jul-08
Jan-09
Jul-09
Jan-10
Jul-10
Jan-11
Jul-11
Jan-12
Jul-12
Jan-13
Jul-13
(%)(RMB/tonne)
Rebar steel price M2 yoy growth (RHS)
0
2
4
6
8
10
12
3,000
3,200
3,400
3,600
3,800
4,000
4,200
4,400
4,600
4,800
5,000
2008-09-28
2009-02-25
2009-07-17
2009-12-09
2010-05-05
2010-09-21
2011-02-18
2011-07-12
2011-12-02
2012-04-26
2012-09-14
2013-02-07
2013-07-04
2013-11-26
(%)(RMB/tonne)
SHIBOR - 1 week (LHS)
HRB400: 20mm price - Shanghai (RHS)
10

China Steel Sector Rachel Cheung
BNP PARIBAS 8 JANUARY 2014
EXHIBIT 10: Key steel mills’ profit margin EXHIBIT 11: Tangshan billet producers’ profit & loss
Sources: MySteel; BNP Paribas Sources: MySteel; BNP Paribas
EXHIBIT 12: Steel mill inventory EXHIBIT 13: Steel trader inventory
Sources: MySteel; BNP Paribas Sources: MySteel; BNP Paribas
(25)
(20)
(15)
(10)
(5)
0
5
10
15
(1,400)
(1,200)
(1,000)
(800)
(600)
(400)
(200)
0
200
400
600
800
1,000
Jan-02
Jul-02
Jan-03
Jul-03
Jan-04
Jul-04
Jan-05
Jul-05
Jan-06
Jul-06
Jan-07
Jul-07
Jan-08
Jul-08
Jan-09
Jul-09
Jan-10
Jul-10
Jan-11
Jul-11
Jan-12
Jul-12
Jan-13
Jul-13
(%)(RMB/tonne) Profit per tonne Profit margin (RHS)
(500)
(400)
(300)
(200)
(100)
0
100
200
300
400
0
1,000
2,000
3,000
4,000
5,000
Apr-11
Jun-11
Aug-11
Oct-11
Dec-11
Feb-12
Apr-12
Jun-12
Aug-12
Oct-12
Dec-12
Feb-13
Apr-13
Jun-13
Aug-13
Oct-13
Dec-13
(RMB/tonne) (RMB/tonne)Tangshan billet profit/(loss) (RHS)
Tangshan billet ex-factory price
Tangshan billet unit cost
0
2,000
4,000
6,000
8,000
10,000
12,000
14,000
16,000
Apr-06
Sep-06
Feb-07
Jul-07
Dec-07
May-08
Oct-08
Mar-09
Aug-09
Jan-10
Jun-10
Nov-10
Apr-11
Sep-11
Feb-12
Jul-12
Dec-12
May-13
Oct-13
('000 tonnes)
0
5,000
10,000
15,000
20,000
25,000
Apr-06
Oct-06
Apr-07
Oct-07
Apr-08
Oct-08
Apr-09
Oct-09
Apr-10
Oct-10
Apr-11
Oct-11
Apr-12
Oct-12
Apr-13
Oct-13
('000 tonnes)
Average since 2006
11

China Steel Sector Rachel Cheung
BNP PARIBAS 8 JANUARY 2014
Emission penalties not yet relevant in 2014 on lack of funding
The Ministry of Environmental Protection (MEP) announced the latest emission
standards for the steel sector in June 2012, effective in January 2015 (Exhibit 14).
Among all the emissions, we think we should focus on DeSOx and water treatment
for steel mills due to their heavy capex (RMB30m-120m per line) and substantial unit
operating cost increase (RMB 30-107/t).
EXHIBIT 14: Steel emission standards table
Unit Current standard
----------------- Standard to be effective from 2015 -----------------
For existing capacity For new capacity In key regions
SOx mg/m³ 600 200 200 180
NOx mg/m³ 500 300 300 300
PM mg/m³ 80 50 50 40
Sources: MEP; BNP Paribas
2013 research on Chinese steel mills’ environmental protection costs, published by
the China Metallurgical Industry Planning and Research Institute, suggested that for
integrated iron and steel works to meet the latest emission standards, the average
expense on environmental protection is around RMB100-107/t on a crude steel
basis. Of this cost, RMB20-26/t is for water treatment and RMB80/t is spent on flue
gas treatment: a RMB69/t additional electricity cost and RMB11/t DeSOx.
EXHIBIT 15: Total unit environmental cost for steel mills
Unit
Unit price
Consumption per ton of crude steel
Cost per ton of crude steel
Remarks
(RMB)
Electricity used in flue gas treatment
kWh 0.65 106.7 69 Majority is electricity
DeSOx for sintering flue gas
ton of sintered ore
8 1.35 11 Fully DeSOx
Subtotal 80
Sewage in steel making
m^3 0.5~0.7 20 10~14
General sewage treatment
m^3 3 2.5~3 7.5~9 Equipped with deep treatment facilities
Coking sewage treatment
m^3 12 0.2~0.3 2.4~3.6 Equipped with deep treatment facilities
Subtotal 19.9~26.6
Total 99.9-106.6
Sources: China Metallurgical Industry Planning and Research Institute
Status of DeSOx equipment installation and operation in China’s steel industry
DeSOx treatment has not been widely employed in China’s steel industry so far. By
the end of 2012, DeSOx equipment had been installed on 389 sets of sintering
machines in China, amounting to around 32% of China’s 1,200 total sintering
machines and around 50% of China total if measured in m2.
Even for the 389 sets of sintering machines with DeSOx equipment, that equipment
is not running 24/7. Big SOE mills perform better on keeping DeSOx equipment
running; while private SMEs are neither willing nor motivated to run DeSOx treatment
all the time, given that the occasional fines on illegal emissions are less than 10
times the daily DeSOx operating expense (for a 360m2 sintering machine). An early
2013 investigation in north China by the MEP reveals that nearly 70% of steel mills
failed to meet emission standards. The grand average of SOx removal efficiency in
China’s steel sector was only 38.6% in June 2013 (as opposed to >=80% designed
efficiency), according to an MEP official. The efficiency for 2011 was 47.3%. More
sintering machines are equipped with DeSOx, while average removal efficiency
declines, indicating a worsening trend in DeSOx operation sectorwide.
The MIIT announced a first and second list of steel mills that meet 2012 Iron and
Steel Industry Standard Conditions in April and December 2013. Total crude steel
12

China Steel Sector Rachel Cheung
BNP PARIBAS 8 JANUARY 2014
capacity of 160 steel mills in these two lists is estimated to be around 640mtpa,
which is about 64% of the 2012 China total. The third list is to be published in 1H14.
The three lists are to include 80-90% of China’s total crude steel capacity, and only
steel mills named in the lists will be eligible for future support policies, according to
the MIIT. A punitive electricity price will be applied to the other steel mills who fail to
appear in the lists.
Given the large percentage electricity takes of steel mills’ environmental protection
costs, a punitive electricity price appears to be quite a big negative for mills not in the
lists if the standards are to be strictly enforced. However, we do not think the timeline
for the implementation of punitive electricity price is clear yet. In addition, most
Chinese steel mills are struggling at breakeven level and face tight funding pressure.
It’s difficult for them to finance DeSOx equipment installation and operation. At the
same time, funding costs keep increasing. Mills are poorly positioned to follow the
stringent emission standards, unless subsidies are to be provided. Although
governments wish to enforce standards for air quality and on overcapacity concerns,
we do not see enough funding from the government for redundancy settlements and
closure compensation in the near term, as explained below. As a result, we do not
see any substantial change in the 2014 outlook.
Enforcement difficulties
We see the hurdles for significant capacity closures as being a lack of clarity on
compensation plans and sources, as well as the unemployment issue. Average steel
labour productivity is 100t per year. Therefore, closing 60mt of steel capacity in
Hebei implies 600,000 workers, or 6% of Hebei’s total workforce, will be affected.
Based on the assumption of a RMB3,000/t replacement cost for steel mills, the
Tangshan government needs total theoretical compensation of RMB120b to close
40mt by 2017. With only an RMB50b central government subsidy for steel capacity
closures for Beijing-Tianjin-Hebei, we find it difficult to see the Tangshan or Hebei
government financing the compensation gap, not to mention the problems of the
associated bad bank loans. Steel traders and mills in Hebei see limited alternatives
for the transfer of the steel sector, given a bearish regional property market and other
non-steel commodities businesses.
In conclusion, we do not expect significant forced closures of steel capacity in the
short term, unless the local government lays out solid plans for compensation and
the source of its funding.
13

China Steel Sector Rachel Cheung
BNP PARIBAS 8 JANUARY 2014
Steel demand growth to slow to 4% 2014
Proactive fiscal policy and Neutral monetary policy in 2014
Based on our economist Chen Xingdong’s report China Perspectives 2014:
Addressing 12 questions (3 January), we expect a proactive fiscal policy and a
neutral monetary policy in 2014. The CEWM maintained the macro policy lines for
2014. Under the reform perspectives, both Xi Jinping and Li Keqiang set the basic
lines: macro policy must remain relatively stable, micro policy must be active and
flexible, and social policy is to provide bottom-line support. As such, fiscal policy
remains proactive. Proactive fiscal policy would mean enlarging the budget deficit;
under strict controls the central government might allow local governments to raise
debt capital through legal and transparent ways. The central government would
continue undertaking structural tax cutting through conversion of business taxes to
VAT in service sectors. For detailed fiscal policy, we should wait for the national fiscal
and financial meeting, which usually follows the CEWM. Through the terms of the so-
called ‘‘prudent’’ monetary policy, policy is neither expansionary nor contractionary,
but the government declines to use the term ‘‘neutral’’. In our observations, the
government and PBOC intend to exercise a policy of neutral-tilted tightening. We
expect the PBOC will fail to meet its controlling target of broad money supply M2 at
13% in 2013 as M2 at November was still a high 14.2%. We believe the central bank
will still set 13% M2 growth as the controlling target in 2014. On the other hand, we
believe lessons have been learnt from 2008-09 and that it is understood that the
China economy is overleveraged. The leverage ratio measured by broad money, M2,
against GDP has exceeded 200%, a rare case globally. The PBOC is under
tremendous pressure to deleverage the economy, although it might take a long time.
Therefore, we expect the ‘‘prudent’’ monetary policy in 2014 to be a passive one, i.e.,
a follower, or accommodative to growth. Liquidity management by monitoring the
weighted interest rate in the interbank market and referring to the changes in bond
yield curves would likely be the key policy focus.
EXHIBIT 16: BNP China macro forecast v. street
---------------------- 2013E ---------------------- ---------------------- 2014E ----------------------
BNPP Street BNPP Street
GDP (y-y %) 7.7 7.7 7.3 7.5
Industrial output (y-y %) 9.7 9.6 9.1 9.4
Retail sales (y-y %) 13.0 12.9 13.2 13.8
FAI (y-y %) 19.8 19.9 17.2 19.3
Exports (y-y %) 7.2 7.7 7.5 8.6
Imports (y-y %) 6.9 7.4 6.8 8.6
Trade balance (USD b) 254.1 254.0 286.8 276.0
Current account to GDP (%) 2.6 2.4 2.4 2.3
M2 (y-y %) 13.4 13.8 12.8 12.9
1-yr deposit rate (EOP, %) 3.00 - 3.00 -
1-yr lending rate, (EOP, %) 6.00 6.00 6.00 6.00
RRR for major banks (%) 20.0 - 19.0 -
RMB/USD (EOP) 6.05 - 5.89 -
Budget balance/GDP (%) (2.1) (1.8) (2.1) (1.8)
CPI (y-y %) 2.6 2.7 2.8 3.1
PPI (y-y%) (2.0) (1.7) 0.5 0.8
Sources: Concensis Economics; BNP Paribas
Steel demand growth to slow from 9% in 2013 to 4% in 2014
We forecast China’s crude steel apparent consumption will grow 8.6% to 724mt in
2013 and 3.5% to 749mt in 2014, with production to slow from 9.2% in 2013 to 3.4%
in 2014.
14

China Steel Sector Rachel Cheung
BNP PARIBAS 8 JANUARY 2014
EXHIBIT 17: Steel demand breakdown in 2014E EXHIBIT 18: Steel demand by segment changes
Sources: Mysteel; BNP Paribas estimates Sources: Mysteel; BNP Paribas estimates
Property (27% of steel demand): Constraints kick in, sales growth has peaked
We forecast steel demand growth in the property segment to slow from 10% in 2013
to 2.8% in 2014. Based on our property team’s report Constraints kick in, sales
growth has peaked (6 December, 2013), growth in floor space sold will slow from
20% in 2013 to 5-10% in 2014E. Key issues in the 2014 property market are:
§ Landbank replenishment will be the biggest constraint on growth. Our property
team has analysed the past landbank replenishment behaviour for each
developer and projected proportions of landbank to contracted sales growth. The
results point to landbank replenishment as the biggest constraint against
sustained 30%-plus annual growth for most developers over the next few years.
§ Balance sheet & funding constraints. The developers who have been more active
in raising funds in the offshore market are those who have been more aggressive
in their landbanking. With QE tapering starting in 2014, the ability to raise funds
via the offshore channel could be constrained. This would further affect the pace
of landbanking in 2014 and beyond. Despite the good sales in 2013, net gearing
positions of most developers have not significantly improved. This should limit
their ability to further gear up to buy land.
§ Saleable resource constraint in 2014. Macro data-wise, floor space starts have
not been able to catch up with the rapid pace of sales growth since July 2012
(Exhibit 19).
§ More tightening before any loosening: 1) Plans are to reduce local governments’
reliance on land sales for financing; 2) Given the pace of property price increases
is continuing to accelerate in Tier 1 & 2 cities, local governments could tighten the
enforcement of existing policies, such as HPR, before their eventual relaxation.
Railway2.5% Highway
2.7%
Property25.7%
Machinery16.9%
Environmental & utility14.8%
Urban transit2.3%
Auto7.2%
White goods1.6%
Shipbuilding2.4%
Energy5.2%
Mines5.3%
Others13.6%
(4)(2)02468101214
Railw
ay
Highway
Property
Machinery
Environmental & utility
Urban transit
Auto
White goods
Shipbuilding
Energy
Mines
(y-y %)
15

China Steel Sector Rachel Cheung
BNP PARIBAS 8 JANUARY 2014
EXHIBIT 19: YTD monthly nationwide area starts vs. area sold y-y % change
Sources: NBS; BNP Paribas
EXHIBIT 20: Steel demand in the property segment
Property 2010 2011 2012 2013E 2014E 2015E
Total property
Total steel consumption- property (k tonnes) 131,659 154,674 170,097 187,266 192,541 196,724
Change (y-y %) 15.0 17.5 10.0 10.1 2.8 2.2
% of total steel consumption 22.0 23.8 25.5 25.9 25.6 25.3
Private commodity prop. consumption as % of total property demand 48 46 44 50 53 54
Public prop. steel consumption % of total property demand 9 14 18 13 10 10
Commercial prop. consumption as % of total property demand 42 40 38 37 37 36
Steel needed per real estate C&I FAI (k/RMB b) 38.97 35.79 34.25 32.74 30.52 28.56
Total property FAI (RMB b) 4,827 6,174 7,096 8,171 9,011 9,840
Change (y-y %) 33.2 27.9 14.9 15.2 10.3 9.2
Investment in property (C&I) (RMB b) 3,379 4,322 4,967 5,720 6,308 6,888
Commodity buildings (private)
Total steel consumption - private commodity (k tonnes) 63,558 71,521 74,884 94,354 102,044 107,146
Change (y-y %) 17.6 12.5 4.7 26.0 8.1 5.0
Investment in non-social housing property (RMB b) 4,278 5,244 5,833 7,166 8,209 9,092
Change (y-y %)
11.2 22.9 14.6 10.8
Floor space sold - Commodity (m sq. m) (private) 1,043 1,099 1,086 1,303 1,368 1,437
Change (y-y %) 10.1 5.4 (1.2) 20.0 5.0 5.0
Average area per flat - commodity (sq.m) 90 90 90 90 90 90
Steel needed (tonne per sq. m) 0.061 0.065 0.069 0.072 0.075 0.075
Social Housing
Total steel consumption - public housing (k tonnes) 12,421 21,514 29,875 24,307 19,833 18,914
Change (y-y %) 2 73 39 (19) (18) (5)
Government target of unit starts (m) 5.9 36
Units to be started (m) 5.9 10.4 8.0 6.5 6.0 5.1
Investment in social housing (RMB b) 549 930 1263 1005 802 748
Change (y-y %) 207 69 36 (20) (20) (7)
Floor space completed (m sq.m) 198 335 456 362 289 270
Change (y-y %) 0 69 36 (20) (20) (7)
Average house size (sq.m) 60 60 60 60 60 60
Steel needed (t/sq. m) 0.063 0.064 0.066 0.067 0.069 0.070
Sources: MySteel; BNP Paribas estimates
(40)
(20)
0
20
40
60
80
100
120
Mar-99
Oct-99
May-00
Dec-00
Jul-01
Feb-02
Sep-02
Apr-03
Nov-03
Jun-04
Jan-05
Aug-05
Mar-06
Oct-06
May-07
Dec-07
Jul-08
Feb-09
Sep-09
Apr-10
Nov-10
Jun-11
Jan-12
Aug-12
Mar-13
Oct-13
(y-y %) YTD floor space sold YTD floor space started
20.8
10.5
16

China Steel Sector Rachel Cheung
BNP PARIBAS 8 JANUARY 2014
Auto segment (7% of steel demand): Growth still on track
Based on our auto team’s report China Auto: 2014 – Growth still on track (6
December, 2013), our house forecast is for passenger vehicle sales to grow 15.7% in
2013 and 14.4% in 2014 due to consumption upgrades and rising penetration in tier-
2 and tier-3 cities. This implies 7.5% steel demand growth in the auto segment in
2014.
EXHIBIT 21: Steel demand in the auto segment
Auto 2010 2011 2012 2013E 2014E 2015E
Total steel consumption - Autos (k tonnes) 42,000 43,200 46,200 49,900 53,660 60,368
Change (y-y %) 22.1 2.9 6.9 8.0 7.5 12.5
Steel needed per unit (t/unit) 2.3 2.3 2.4 2.2 2.1 2.1
% of total steel consumption 7.01 6.64 6.93 6.90 7.17 7.80
Auto production (k units) 18,243 18,432 19,261 22,285 25,494 28,681
Change (y-y %) 32.5 1.0 4.5 15.7 14.4 12.5
Sources: MySteel; BNP Paribas estimates
White goods (1.6% of steel demand): Moderate white goods demand growth of 2%
After the end of the white goods subsidy in June 2013, white goods demand faced a
short-term growth catalyst. In the medium term, we believe the following factors can
support continuous growth of white goods demand:
§ Increasing residential income and urbanization;
§ Upgrades to more environmentally friendly and high-quality goods;
§ Demand tends to be more stable after wider application in public services (i.e.
more public areas with installed air con);
§ Continuous growth in white goods exports.
Based on a 2% white goods demand growth assumption in 2014, we forecast steel
demand to drop 1% y-y in 2014 (vs. +3.5% y-y in 2013E).
EXHIBIT 22: Steel demand in the white goods segment
White goods 2010 2011 2012E 2013E 2014E 2015E
Total steel consumption - Shipping (k tonnes) 9,000 11,300 11,500 11,900 11,774 11,649
Change (y-y %) 11.1 25.6 1.8 3.5 (1.1) (1.1)
Steel needed per FAI (t/k unit) 35.5 37.7 40.0 37.9 36.73 35.6
% of total steel consumption 1.50 1.74 1.73 1.64 1.57 1.51
White goods production (m units) 254 299 287 314 321 327
Change (y-y %) 28.5 18.1 -4.0 9.3 2.0 2.0
Sources: MySteel; BNP Paribas estimates
Machinery segment (18% of steel demand): Relying on replacement and upgrades
Under the stable-growth macro target announced by the central government, we do
not expect significant new demand in machinery. China has a huge reserve of
operating power machinery, cars, construction machinery, etc., which can sustain the
demand for machinery replacement. According to MySteel, when GDP grows at 7-
8%, machinery demand growth is 10-15%. However, we conservatively put it at 8%
y-y for 2014 in our assumptions, as we believe policies to curb overcapacity may
further hinder machinery demand, implying 3.4% steel demand growth in the
machinery segment in 2014.
17

China Steel Sector Rachel Cheung
BNP PARIBAS 8 JANUARY 2014
EXHIBIT 23: Steel demand in the machinery segment
Machinery 2010 2011 2012 2013E 2014E 2015E
Total steel consumption – Machinery (k tonnes) 106,100 114,800 117,500 122,500 126,670 129,904
Change (y-y %) 34 25 9.2 4.3 3.4 2.6
Steel needed per C&I FAI - Road (kt/ RMB b)
% of total steel consumption 17.71 17.64 17.63 18.38 17.50 17.35
Machinery gross output (RMB b) 13,510 16,887 18,441 20,285 21,908 23,222
Change (y-y %) 34 25 9.2 10.0 8.0 6.0
Sources: MySteel; BNP Paribas estimates
Shipbuilding segment (3% of steel demand): Better than 2013
We expect average the shipping rate in 2014 to be higher than 2013, which will
cause a recovery in the shipbuilding sector. After years of decline in the bulk and oil
shipping business, we expect 2014 to start to recover. Following the increasing price
of vessels in 2014, the oversupply situation should improve. We conservatively
forecast shipbuilding demand to grow 10% and cause a 7.2% increase in steel
demand in the segment.
EXHIBIT 24: Steel demand in the shipbuilding segment
Shipbuilding 2010 2011 2012 2013E 2014E 2015E
Total steel consumption - Shipping (k tonnes) 23,400 22,600 20,100 16,700 17,900 18,489
Change (y-y %) 61.4 (3.4) (11.1) (16.9) 7.2 3.3
Steel needed per FAI (kt/10k DWT) 1.1 2.1 2.1 3.2 3.1 3.1
% of total steel consumption 3.91 3.47 3.02 2.31 2.39 2.39
Shipping demand (10k DWT) (Under construction - completed + started orders) 20,553 10,948 6,459 5,167 5,684 6,025
Change (y-y %) 8.7 (46.7) (41.0) (20) 10 6
Sources: MySteel; BNP Paribas estimates
Infrastructure
Infrastructure construction growth slowed in 2012, partly due to inadequate funding,
especially for high-speed railways. We conservatively expect infrastructure projects
started in 2H13 to continue in 1H14. We forecast infrastructure FAI growth to slow
from 23% y-y in 2013 to 16% y-y in 2014.
Investment in environment management and municipal infrastructure (15% of steel demand)
Given greater environmental concerns and urbanization, investment in environment
management and municipal infrastructure will likely continue to see the fastest
growth among all infrastructure segments, with 18% growth in 2013. We expect the
trend to continue in 2014 with 16% growth.
EXHIBIT 25: China construction and installation FAI growth
Sources: CEI; BNP Paribas
0
10
20
30
40
50
60
Jan-04
Jun-04
Nov-04
Apr-05
Sep-05
Feb-06
Jul-06
Dec-06
May-07
Oct-07
Mar-08
Aug-08
Jan-09
Jun-09
Nov-09
Apr-10
Sep-10
Feb-11
Jul-11
Dec-11
May-12
Oct-12
Mar-13
Aug-13
(%) CN: FAI: YoY: ytd: Construction and Installation
18

China Steel Sector Rachel Cheung
BNP PARIBAS 8 JANUARY 2014
Railway (2.5% of steel demand) – slow in railway construction
Based on the most up-to-date government target of 123,000km total railway by 2015,
we forecast 7,500km to be completed in each of 2014 and 2015. Although the length
completed should be more than the 6,200km we expect in 2013, we expect railway
investment to rely more on equipment purchase and installation in 2014 and 2015 as
most of the planned construction works have been completed this year (total railway
FAI growth of 10% y-y vs. railway construction FAI 2% y-y in 2013E). We forecast
steel demand from the railway segment to decline 2% in 2014.
EXHIBIT 26: Steel demand in the railway segment
Railway 2010 2011 2012 2013E 2014E 2015E
Total steel consumption - Railway (kt) 28,386 18,762 19,462 19,245 18,838 17,649
Change (y-y %) 13.6 (33.9) 3.7 (1.1) (2.1) (6.3)
Steel needed per railway FAI (kt/RMB b) 33.68 32.00 31.04 30.11 29.21 28.33
% of total steel consumption 4.74 2.88 2.92 2.66 2.52 2.28
Steel needed per railway C&I FAI (kt/RMB b) 56.8 48.7 47.3 45.8 44.5 43.2
FAI - Railway (RMB b) 843 586 627 691 645 623
Change (y-y %) 19.6 (30.4) 6.9 10.2 (6.7) (3.4)
FAI ratio per mile (RMB b/mile) 231.1 144.6 96.5 92.5 92.5 92.5
Total mileage - Railways ('000 km) 91.2 95.2 101.7 108.0 115.5 123.0
Change (y-y %) 6.6 4.4 6.8 6.2 6.9 6.5
Net increased mileage 3.6 4.1 6.5 6.3 7.5 7.5
FAI ratio per mile (RMB b/mile) 137 95 63 67 56 55
C&I FAI 500 385 412 420 423 409
Change (y-y %) 17.5 (23.0) 6.9 2.0 0.9 (3.4)
Sources: MySteel; BNP Paribas estimates
Highways (3% of steel demand): High growth not sustainable
We forecast highway cement demand based on the 12th Five-Year Plan target to
reach 4,500k km, implying completion of 100k km each year during 2013-15.
However, due to high growth of 19% road FAI in 2013, we conservatively forecast
road FAI to stay flat in 2014, implying steel demand in the highway segment declines
3% for 2014.
EXHIBIT 27: Steel demand in the highway segment
Highway 2010 2011 2012 2013E 2014E 2015E
Total steel consumption - Roads 19,174 20,000 17,834 20,519 19,868 19,984
Change (y-y %) 14.9 4.3 (10.8) 15.1 (3.2) 0.6
Steel needed per FAI - Road (kt/RMB b) 15.62 14.84 14.40 13.97 13.55 13.14
% of total steel consumption 3.20 3.07 2.68 3.08 2.98 3.00
FAI - Road (RMB b) 1,227 1,347 1,436 1,704 1,701 1,764
Change (y-y %) 20.9 9.8 6.6 18.6 (0.2) 3.7
Total mileage - Roads ('000 km) 4,008 4,106 4,205 4,310 4,410 4,510
Change (y-y %) 3.8 2.4 2.4 2.5 2.3 2.3
FAI ratio per mile (RMB b/mile) 8.33 13.73 14.41 14.99 15.71 16.34
Expressways 74 85
1st Grade 64
2nd Grade 309
3rd Grade 388
4th Grade 2,470
Net increased mileage ('000 km) 147.4 98.2 98.5 105.0 100.0 100.0
Sources: MySteel; BNP Paribas estimates
19

China Steel Sector Rachel Cheung
BNP PARIBAS 8 JANUARY 2014
Steel price forecast: To peak in 2Q14
Against a background of capacity pressure and slow demand growth in 2014
lowering the iron ore price, we expect the China steel price to drop 3% y-y in 2014
with limited volatility. We expect the steel price to peak in 2Q14 due to: 1) carried
forward construction projects; 2) less tight funding right after CNY.
Key reasons for our 3% price decline forecast in 2014 are:
§ Tight funding in 2014, especially biased against the steel sector, a limited steel
price hike;
§ Steel utilization remaining low, which hinders price hikes;
§ Increasing international iron ore supply, negative to the steel price;
§ Implementation of tighter emission controls and low steel trader inventories will
moderately improve the overcapacity issue.
EXHIBIT 28: BNP Steel price forecasts
(RMB/tonne) 2006 2007 2008 2009 2010 2011 2012 2013 2014E 2015E
HRC price 3,981 4,294 4,961 3,677 4,174 4,596 3,990 3,686 3,595 3,416
Re-bar price 2,934 3,560 4,528 3,513 4,083 4,705 3,916 3,550 3,442 3,236
HRC (y-y %) (6) 8 16 (26) 14 10 (13) (8) (2.5) (5)
Rebar (y-y %) (10) 21 27 (22) 16 15 (17) (9) (3.0) (6)
(RMB/tonne) 1Q12 2Q12 3Q12 4Q12 1Q13 2Q13E 3Q13 4Q13 1Q14 2Q14 3Q14 4Q14
HRC price 4,251 4,203 3,660 3,883 4,077 3,600 3,595 3,501 3,554 3,784 3,557 3,486
Re-bar price 4,248 4,112 3,640 3,706 3,777 3,477 3,504 3,483 3,483 3,657 3,365 3,264
HRC (q-q %) (2) (1) (13) 6 5 (12) (0) (3) 2 7 (6) (2)
Re-bar (q-q %) (5) (3) (11) 2 2 (8) 1 (1) 0 5 (8) (3)
(USD/tonne) 2013 2014 2015
Iron ore price 136 125 110
Sources: CEIC; MySteel; Bloomberg; BNP Paribas estimates
20

China Steel Sector Rachel Cheung
BNP PARIBAS 8 JANUARY 2014
Appendix 1
EXHIBIT 29: China steel prices EXHIBIT 30: Coking Coal price
Sources: Bloomberg; BNP Paribas estimates Sources: Wind; BNP Paribas estimates
EXHIBIT 31: 10-day China crude steel daily production EXHIBIT 32: China rebar price vs. imported iron ore price
Sources: www.96369.net; BNP Paribas estimates Sources: MySteel; BNP Paribas estimates
EXHIBIT 33: Large mill cash margin vs. utilization EXHIBIT 34: Utilization react to small mills’ profit/loss
Sources: Bloomberg; BNP Paribas estimates Sources: MySteel; BNP Paribas estimates
2,000
3,000
4,000
5,000
6,000
7,000
8,000
Jan-06
Jun-06
Nov-06
Apr-07
Sep-07
Feb-08
Jul-08
Dec-08
May-09
Oct-09
Mar-10
Aug-10
Jan-11
Jun-11
Nov-11
Apr-12
Sep-12
Feb-13
Jul-13
Dec-13
(RMB/tonne) China HRC 3mm spot
China CRC 1mm spot
China Steel Rebar 25mm spot
950
1,050
1,150
1,250
1,350
1,450
1,550
1,650
Jan-09
Apr-09
Jul-09
Oct-09
Jan-10
Apr-10
Jul-10
Oct-10
Jan-11
Apr-11
Jul-11
Oct-11
Jan-12
Apr-12
Jul-12
Oct-12
Jan-13
Apr-13
Jul-13
Oct-13
(RMB/tonne)
1.0
1.2
1.4
1.6
1.8
2.0
2.2
2.4
Jan-09
Apr-09
Jul-09
Oct-09
Jan-10
Apr-10
Jul-10
Oct-10
Jan-11
Apr-11
Jul-11
Oct-11
Jan-12
Apr-12
Jul-12
Oct-12
Jan-13
Apr-13
Jul-13
Oct-13
(m tonnes)
50
250
450
650
850
1,050
1,250
1,450
1,650
2,500
3,000
3,500
4,000
4,500
5,000
5,500
6,000Mar-05
Oct-05
May-06
Dec-06
Jul-07
Feb-08
Sep-08
Apr-09
Nov-09
Jun-10
Jan-11
Aug-11
Mar-12
Oct-12
May-13
Dec-13
(RMB/tonne)(RMB/tonne) China - SH Rebar price (LHS)
China iron ore px (Major ports) (RHS)
(500)
(400)
(300)
(200)
(100)
0
100
200
% 80
% 85
% 90
% 95
% 100
Jun-12
Aug-12
Oct-12
Dec-12
Feb-13
Apr-13
Jun-13
Aug-13
Oct-13
Dec-13
(RMB/tonne)(%)
Big steel rebar cash margin (spot) (RHS)
Tangshan utilization rate
(200)
(100)
0
100
200
300
400
500
600
% 80
% 85
% 90
% 95
% 100
Jun-12
Jul-12
Aug-12
Sep-12
Oct-12
Nov-12
Dec-12
Jan-13
Feb-13
Mar-13
Apr-13
May-13
Jun-13
Jul-13
Aug-13
Sep-13
Oct-13
Nov-13
Dec-13
(RMB/tonne)(%)
Small mill rebar cash margin (spot) (RHS)
Tangshan utilization rate
84%
99% 97%
91%
21

China Steel Sector Rachel Cheung
BNP PARIBAS 8 JANUARY 2014
Appendix 2
DeSOx technology comparison
Emissions generated during the sintering process contribute 60-70% to total SOx
emissions in steelmaking. DeSOx technologies applied in sintering flue gas
treatment can be classified into three categories based on desulfurizer: 1) the wet
method; 2) the semi-dry method; 3) the dry method.
EXHIBIT 35: DeSOx technology comparison
Semi-dry Dry Wet
Example CFB Active coke absorption
Limestone-gypsum, ammonia FDG
SOx removal efficiency >=90% 80~90% >=95%
Corrosion slight no serious
Waste water treatment no no yes
Total investment (RMB m) 72 80 120
Operating cost (RMB/tonne of sintered ore) 3-5 7-8 5-10
Suitable for flue gas amount small-mid small-mid large
Suitable for SO2 density low-mid low-mid mid-high
Sources: Company data; BNP Paribas estimates
The wet method is the more traditional and mature technology, as compared with dry
and semi-dry. Its DeSOx efficiency is the highest of the three. Limestone-gypsum
and ammonia FGD are two common wet methods. Revenue from the sale of
ammonium sulphate, a by-product of ammonia FDG, can help reduce DeSOx cost;
while gypsum, a by-product of limestone-gypsum, is already oversupplied in China.
Main drawbacks of the wet method are: 1) the corrosion it brings, 2) it is difficult to
upgrade/transform if DeNOx equipment is needed in the future, and 3) the sewage
generated is difficult to treat.
The dry method is a more recent development than the wet method, with a more
difficult process and more complex equipment. The major advantage of a dry method
(like active coke absorption) is that it can remove not only SOx, but also NOx and
dioxins. But active coke absorption is usually more expensive than wet methods.
The Circulating Fluidized Bed (CFB) method is one of the semi-dry methods.
EXHIBIT 36: CFB vs. ammonia-ammonium sulphate
CFB Ammonia-ammonium sulphate
Land size small Large
SOx removal efficiency 90%~99.7% 90-95%
Sewage no Yes, but recycled, no external discharge
Corrosion no Serious on equipment
Absorbent consumption 2.1t/h 1.22t/h
Water consumption 36t/h 23t/h
Annual operating & maintenance cost (RMB m) 800 1000
Total investment (for 100 sqm) (RMB m) 34 38
Sources: Sichuan Industrial Research Institute of Environmental Monitoring, BNP Paribas estimates
So far, no method dominates in the sector. All methods, if applied for suitable
machine size and feed flue gas density, can lower SOx emissions to meet the current
200mg/m3 standard in theory. But in practice, poorly designed or installed equipment,
or improper operation may lead to lower-than-designed efficiency.
22

China Steel Sector Rachel Cheung
BNP PARIBAS 8 JANUARY 2014
Operating cost structure of DeSOx in the steel industry
EXHIBIT 37: Operating cost structure of limestone-gypsum
Limestone-gypsum Annual consumption Unit cost Annual cost Cost
(RMB) (RMB m/year) (RMB/tonne of sintered ore)
Operating cost
CaO 16100t 275 4.51 1.45
Sewage treatment 80000t 2.5 0.20 0.064
Electricity 29704000 0.52 15.45 4.966
Water 640000 2 1.28 0.412
Salary 0.66 0.211
Equipment maintenance 0.97 0.313
Revenue from by-product (0.91) (0.293)
Total DeSOx cost 22.16 7.123
Source: BNP Paribas estimates
EXHIBIT 38: Operating cost structure of ammonia FGD
Ammonia FGD Annual ----- Unit cost ----- ---- Annual cost ---- ------------ Cost ------------
Operating cost consumption Liquid
ammonia Aqueous ammonia
Liquid ammonia
Aqueous ammonia
Liquid ammonia
Aqueous ammonia
(RMB/tonne or kwh) (RMB m /year) (RMB/tonne of sintered ore)
Liquid ammonia, Aqueous ammonia
8kt/40kt 2750 400 22.0 16.00 7.07 5.14
Vapor 46kt 65 65 3.0 3.0 0.963 0.963
Electricity 17.2m*kwh 0.52 0.52 89.1 8.9 2.87 2.87
Water 640kt 2 2 1.28 1.28 0.412 0.412
Salary 0.66 0.66 0.211 0.211
Equipment maintenance
0.83 0.83 0.265 0.265
Revenue from by-product
(18.0) (18.0) (5.8) (5.8)
Total DeSOx cost 18.7 12.7 5.99 4.06
Source: BNP Paribas estimates
EXHIBIT 39: Operating cost structure of active coke absorption
Active coke absorption annual operating cost
(RMB m)
Consumables 22.2
Electricity 15.34
Salary 3.0
Maintenance 4.1
Depreciation
other 2.0
Total operating cost 48.7
operating cost/t of sintered ore (RMB) 9.75
Source: BNP Paribas estimates
The unit incremental cost of DeSOx ranges between RMB12-15/t of sintered ore
between the various methods, and 1.275t of sintered ore is needed to produce 1t of
crude steel. So, a RMB15-20/t DeSOx cost would be added for crude steel
production to meet the current (June 2012) emissions standards.
23
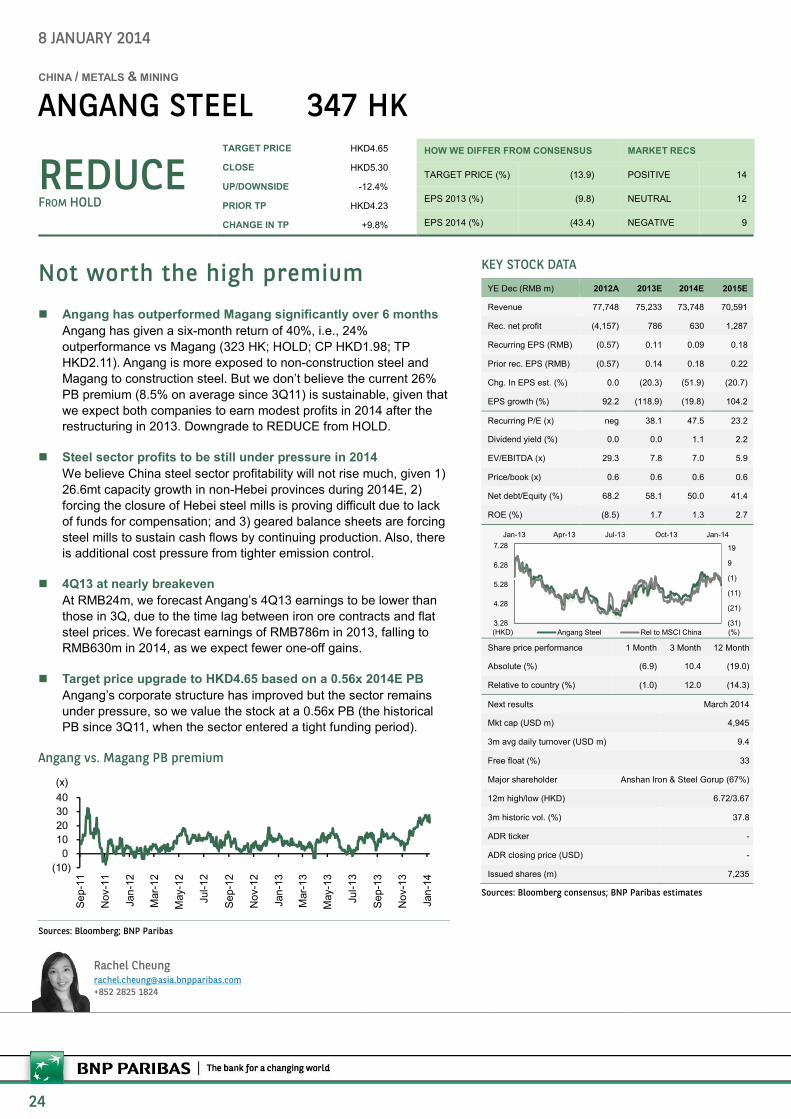
Not worth the high premium
n Angang has outperformed Magang significantly over 6 months
Angang has given a six-month return of 40%, i.e., 24%
outperformance vs Magang (323 HK; HOLD; CP HKD1.98; TP
HKD2.11). Angang is more exposed to non-construction steel and
Magang to construction steel. But we don’t believe the current 26%
PB premium (8.5% on average since 3Q11) is sustainable, given that
we expect both companies to earn modest profits in 2014 after the
restructuring in 2013. Downgrade to REDUCE from HOLD.
n Steel sector profits to be still under pressure in 2014
We believe China steel sector profitability will not rise much, given 1)
26.6mt capacity growth in non-Hebei provinces during 2014E, 2)
forcing the closure of Hebei steel mills is proving difficult due to lack
of funds for compensation; and 3) geared balance sheets are forcing
steel mills to sustain cash flows by continuing production. Also, there
is additional cost pressure from tighter emission control.
n 4Q13 at nearly breakeven
At RMB24m, we forecast Angang’s 4Q13 earnings to be lower than
those in 3Q, due to the time lag between iron ore contracts and flat
steel prices. We forecast earnings of RMB786m in 2013, falling to
RMB630m in 2014, as we expect fewer one-off gains.
n Target price upgrade to HKD4.65 based on a 0.56x 2014E PB
Angang’s corporate structure has improved but the sector remains
under pressure, so we value the stock at a 0.56x PB (the historical
PB since 3Q11, when the sector entered a tight funding period).
Angang vs. Magang PB premium
Sources: Bloomberg; BNP Paribas
(10)
0
10
20
30
40
Se
p-1
1
Nov-1
1
Jan
-12
Mar-
12
May-1
2
Jul-1
2
Se
p-1
2
Nov-1
2
Jan
-13
Mar-
13
May-1
3
Jul-1
3
Se
p-1
3
Nov-1
3
Jan
-14
(x)
8 JANUARY 2014
CHANGE IN RECOMMENDATION 6CHINA / METALS & MINING
ANGANG STEEL 347 HK
REDUCE FROM HOLD
TARGET PRICE HKD4.65
CLOSE HKD5.30
UP/DOWNSIDE -12.4%
PRIOR TP HKD4.23
CHANGE IN TP +9.8%
HOW WE DIFFER FROM CONSENSUS MARKET RECS
TARGET PRICE (%) (13.9) POSITIVE 14
EPS 2013 (%) (9.8) NEUTRAL 12
EPS 2014 (%) (43.4) NEGATIVE 9
Rachel Cheung [email protected]
+852 2825 1824
KEY STOCK DATA
YE Dec (RMB m) 2012A 2013E 2014E 2015E
Revenue 77,748 75,233 73,748 70,591
Rec. net profit (4,157) 786 630 1,287
Recurring EPS (RMB) (0.57) 0.11 0.09 0.18
Prior rec. EPS (RMB) (0.57) 0.14 0.18 0.22
Chg. In EPS est. (%) 0.0 (20.3) (51.9) (20.7)
EPS growth (%) 92.2 (118.9) (19.8) 104.2
Recurring P/E (x) neg 38.1 47.5 23.2
Dividend yield (%) 0.0 0.0 1.1 2.2
EV/EBITDA (x) 29.3 7.8 7.0 5.9
Price/book (x) 0.6 0.6 0.6 0.6
Net debt/Equity (%) 68.2 58.1 50.0 41.4
ROE (%) (8.5) 1.7 1.3 2.7
Share price performance 1 Month 3 Month 12 Month
Absolute (%) (6.9) 10.4 (19.0)
Relative to country (%) (1.0) 12.0 (14.3)
Next results March 2014
Mkt cap (USD m) 4,945
3m avg daily turnover (USD m) 9.4
Free float (%) 33
Major shareholder Anshan Iron & Steel Gorup (67%)
12m high/low (HKD) 6.72/3.67
3m historic vol. (%) 37.8
ADR ticker -
ADR closing price (USD) -
Issued shares (m) 7,235
Sources: Bloomberg consensus; BNP Paribas estimates
(31)
(21)
(11)
(1)
9
19
3.28
4.28
5.28
6.28
7.28
Jan-13 Apr-13 Jul-13 Oct-13 Jan-14
(%)(HKD) Angang Steel Rel to MSCI China
24
Angang Steel 347 HK Rachel Cheung
BNP PARIBAS 8 JANUARY 2014
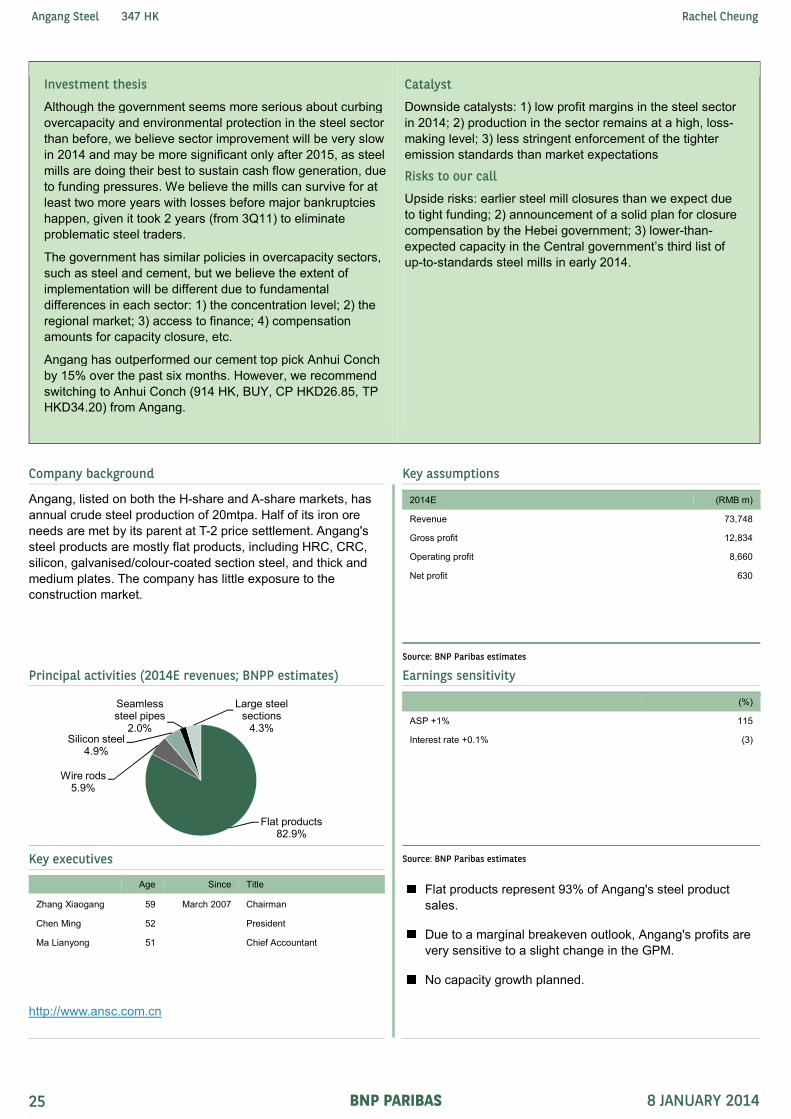
Investment thesis
Although the government seems more serious about curbing
overcapacity and environmental protection in the steel sector
than before, we believe sector improvement will be very slow
in 2014 and may be more significant only after 2015, as steel
mills are doing their best to sustain cash flow generation, due
to funding pressures. We believe the mills can survive for at
least two more years with losses before major bankruptcies
happen, given it took 2 years (from 3Q11) to eliminate
problematic steel traders.
The government has similar policies in overcapacity sectors,
such as steel and cement, but we believe the extent of
implementation will be different due to fundamental
differences in each sector: 1) the concentration level; 2) the
regional market; 3) access to finance; 4) compensation
amounts for capacity closure, etc.
Angang has outperformed our cement top pick Anhui Conch
by 15% over the past six months. However, we recommend
switching to Anhui Conch (914 HK, BUY, CP HKD26.85, TP
HKD34.20) from Angang.
Catalyst
Downside catalysts: 1) low profit margins in the steel sector
in 2014; 2) production in the sector remains at a high, loss-
making level; 3) less stringent enforcement of the tighter
emission standards than market expectations
Risks to our call
Upside risks: earlier steel mill closures than we expect due
to tight funding; 2) announcement of a solid plan for closure
compensation by the Hebei government; 3) lower-than-
expected capacity in the Central government’s third list of
up-to-standards steel mills in early 2014.
Company background Key assumptions
Angang, listed on both the H-share and A-share markets, has
annual crude steel production of 20mtpa. Half of its iron ore
needs are met by its parent at T-2 price settlement. Angang's
steel products are mostly flat products, including HRC, CRC,
silicon, galvanised/colour-coated section steel, and thick and
medium plates. The company has little exposure to the
construction market.
2014E (RMB m)
Revenue 73,748
Gross profit 12,834
Operating profit 8,660
Net profit 630
Source: BNP Paribas estimates
Principal activities (2014E revenues; BNPP estimates) Earnings sensitivity
(%)
ASP +1% 115
Interest rate +0.1% (3)
Key executives Source: BNP Paribas estimates
Age Since Title
Zhang Xiaogang 59 March 2007 Chairman
Chen Ming 52 President
Ma Lianyong 51 Chief Accountant
http://www.ansc.com.cn
Flat products represent 93% of Angang's steel product
sales.
Due to a marginal breakeven outlook, Angang's profits are
very sensitive to a slight change in the GPM.
No capacity growth planned.
Flat products82.9%
Wire rods5.9%
Silicon steel4.9%
Seamless steel pipes
2.0%
Large steel sections
4.3%
25

Angang Steel 347 HK Rachel Cheung
BNP PARIBAS 8 JANUARY 2014
EXHIBIT 1: Angang – changes to key assumptions (2014E)
2014E assumption change New Old Change
(RMB m) (RMB m) (%)
Revenue 73,748 71,469 3.2
COGS (excl depreciation) (60,913) (56,859) 7.1
Gross profit 12,834 14,610 (12.2)
SG&A (4,174) (4,135) 0.9
Operating EBITDA 8,660 10,475 (17.3)
Profit before tax 809 1,704 (52.5)
Minority tax (27) 8 -
Net profit 630 1,311 (51.9)
Source: BNP Paribas estimates
Valuation
EXHIBIT 2: Angang PB band
Sources: Bloomberg; BNP Paribas estimates
EXHIBIT 3: Target price calculation
Unit
BVPS 2014E RMB 6.64
Average P/B since September 2011 x 0.56
Target price in RMB RMB 3.72
Target price in HKD HKD 4.65
Source: BNP Paribas estimates
0.0
0.5
1.0
1.5
2.0
2.5
Feb-09 Aug-09 Feb-10 Aug-10 Feb-11 Aug-11 Feb-12 Aug-12 Feb-13 Aug-13
(x)
+1SD
Avg
-1SD
26

Angang Steel 347 HK Rachel Cheung
BNP PARIBAS 8 JANUARY 2014
Financial statements Angang Steel
Profit and Loss (RMB m) Year Ending Dec 2011A 2012A 2013E 2014E 2015E
Revenue 90,207 77,748 75,233 73,748 70,591
Cost of sales ex depreciation (82,549) (69,789) (61,256) (60,913) (56,905)
Gross profit ex depreciation 7,658 7,959 13,977 12,834 13,686
Other operating income 201 (1,625) 0 0 0
Operating costs (3,306) (4,545) (4,847) (4,174) (3,996)
Operating EBITDA 4,553 1,789 9,130 8,660 9,690
Depreciation (6,778) (5,841) (6,065) (6,290) (6,514)
Goodwill amortisation 0 0 0 0 0
Operating EBIT (2,225) (4,052) 3,065 2,370 3,176
Net financing costs (1,470) (1,846) (1,200) (1,161) (1,124)
Associates 391 402 (1,220) (400) (400)
Recurring non operating income 0 0 80 0 0
Non recurring items 0 0 0 0 0
Profit before tax (3,304) (5,496) 725 809 1,652
Tax 955 1,116 47 (151) (309)
Profit after tax (2,349) (4,380) 772 657 1,343
Minority interests 186 223 14 (27) (56)
Preferred dividends 0 0 0 0 0
Other items 0 0 0 0 0
Reported net profit (2,163) (4,157) 786 630 1,287
Non recurring items & goodwill (net) 0 0 0 0 0
Recurring net profit (2,163) (4,157) 786 630 1,287
Per share (RMB)
Recurring EPS * (0.30) (0.57) 0.11 0.09 0.18
Reported EPS (0.30) (0.57) 0.11 0.09 0.18
DPS 0.00 0.00 0.00 0.04 0.09
Growth
Revenue (%) (2.2) (13.8) (3.2) (2.0) (4.3)
Operating EBITDA (%) (58.3) (60.7) 410.4 (5.1) 11.9
Operating EBIT (%) (168.8) 82.1 (175.6) (22.7) 34.0
Recurring EPS (%) (205.3) 92.2 (118.9) (19.8) 104.2
Reported EPS (%) (205.3) 92.2 (118.9) (19.8) 104.2
Operating performance
Gross margin inc depreciation (%) 1.0 2.7 10.5 8.9 10.2
Operating EBITDA margin (%) 5.0 2.3 12.1 11.7 13.7
Operating EBIT margin (%) (2.5) (5.2) 4.1 3.2 4.5
Net margin (%) (2.4) (5.3) 1.0 0.9 1.8
Effective tax rate (%) - - (6.4) 18.7 18.7
Dividend payout on recurring profit (%) - - 0.0 50.0 50.0
Interest cover (x) (1.2) (2.0) 1.6 1.7 2.5
Inventory days 60.5 65.1 62.4 61.1 63.4
Debtor days 23.1 37.1 39.6 34.9 35.3
Creditor days 42.6 52.6 57.5 54.4 56.5
Operating ROIC (%) (2.0) (4.4) 4.9 3.1 4.3
ROIC (%) (1.5) (3.5) 2.6 2.1 3.1
ROE (%) (4.1) (8.5) 1.7 1.3 2.7
ROA (%) (1.2) (2.8) 2.1 1.6 2.3
*Pre exceptional, pre-goodwill and fully diluted
Revenue By Division (RMB m) 2011A 2012A 2013E 2014E 2015E
Flat products 72,397 63,153 60,235 59,824 57,238
Wire rods 4,393 3,960 4,252 4,222 4,025
Silicon Steel 5,729 3,451 3,583 3,556 3,393
Seamless steel pipes 1,780 1,157 1,444 1,410 1,345
Large steel sections 1,956 2,238 3,087 3,158 3,014
Others 3,951 3,789 1,577 1,577 1,577
Sources: Angang Steel; BNP Paribas estimates
27

Angang Steel 347 HK Rachel Cheung
BNP PARIBAS 8 JANUARY 2014
Financial statements Angang Steel
Cash Flow (RMB m) Year Ending Dec 2011A 2012A 2013E 2014E 2015E
Recurring net profit (2,163) (4,157) 786 630 1,287
Depreciation 6,778 5,841 6,065 6,290 6,514
Associates & minorities (577) (625) 1,206 427 456
Other non-cash items 50 (3,491) (3,491) (3,491) (3,491)
Recurring cash flow 4,088 (2,432) 4,566 3,857 4,766
Change in working capital 218 3,155 1,207 401 9
Capex - maintenance (5,495) (2,918) (3,600) (3,600) (3,600)
Capex - new investment 0 0 0 0 0
Free cash flow to equity (1,189) (2,195) 2,173 658 1,175
Net acquisitions & disposals 0 0 0 0 0
Dividends paid (1,085) 0 0 0 (315)
Non recurring cash flows (1,206) 1,486 2,237 3,016 2,987
Net cash flow (3,480) (709) 4,410 3,673 3,847
Equity finance 0 51 0 0 0
Debt finance 2,170 366 (3,652) 900 200
Movement in cash (1,310) (292) 758 4,573 4,047
Per share (RMB)
Recurring cash flow per share 0.57 (0.34) 0.63 0.53 0.66
FCF to equity per share (0.16) (0.30) 0.30 0.09 0.16
Balance Sheet (RMB m) Year Ending Dec 2011A 2012A 2013E 2014E 2015E
Working capital assets 28,001 24,940 21,749 21,319 20,407
Working capital liabilities (17,970) (18,064) (16,080) (16,051) (15,148)
Net working capital 10,031 6,876 5,669 5,268 5,259
Tangible fixed assets 69,655 60,993 58,528 55,838 52,923
Operating invested capital 79,686 67,869 64,196 61,105 58,182
Goodwill 0 0 0 0 0
Other intangible assets 3 6,677 6,677 6,677 6,677
Investments 2,125 2,740 2,788 2,836 2,884
Other assets 2,790 3,838 3,838 3,838 3,838
Invested capital 84,604 81,124 77,499 74,456 71,581
Cash & equivalents (2,341) (2,049) (2,807) (7,381) (11,428)
Short term debt 20,831 25,891 25,891 26,791 26,991
Long term debt * 13,821 9,053 5,401 5,401 5,401
Net debt 32,311 32,895 28,485 24,811 20,964
Deferred tax 0 0 0 0 0
Other liabilities 0 0 0 0 0
Total equity 50,739 46,598 47,384 48,014 48,986
Minority interests 1,554 1,631 1,631 1,631 1,631
Invested capital 84,604 81,124 77,499 74,456 71,581
* includes convertibles and preferred stock which is being treated as debt
Per share (RMB)
Book value per share 7.01 6.44 6.55 6.64 6.77
Tangible book value per share 7.01 5.52 5.63 5.71 5.85
Financial strength
Net debt/equity (%) 61.8 68.2 58.1 50.0 41.4
Net debt/total assets (%) 30.8 32.5 29.6 25.3 21.4
Current ratio (x) 0.8 0.6 0.6 0.7 0.8
CF interest cover (x) 0.2 (0.2) 2.8 1.6 2.0
Valuation 2011A 2012A 2013E 2014E 2015E
Recurring P/E (x) * neg neg 38.1 47.5 23.2
Recurring P/E @ target price (x) * neg neg 33.4 41.6 20.4
Reported P/E (x) neg neg 38.1 47.5 23.2
Dividend yield (%) 0.0 0.0 0.0 1.1 2.2
P/CF (x) 7.3 (12.3) 6.6 7.8 6.3
P/FCF (x) (25.2) (13.6) 13.8 45.5 25.5
Price/book (x) 0.6 0.6 0.6 0.6 0.6
Price/tangible book (x) 0.6 0.7 0.7 0.7 0.7
EV/EBITDA (x) ** 12.5 29.3 7.8 7.0 5.9
EV/EBITDA @ target price (x) ** 11.8 27.6 7.3 6.6 5.5
EV/invested capital (x) 0.8 0.8 0.8 0.8 0.7
* Pre exceptional, pre-goodwill and fully diluted ** EBITDA includes associate income and recurring non-operating income
Sources: Angang Steel; BNP Paribas estimates
28

Looks fairly valued at 0.5x PB
n Magang’s 2014E 0.5x PB seems fair We upgrade Magang from REDUCE to HOLD, purely based on its
fair valuation. Given the improved corporate structure after disposal
of non-steel assets to its parent in 2013, we value Magang at a 0.55x
PB (the historical PB since 3Q11, when the sector entered a tight
funding period) with a TP of HKD2.11 (HKD1.36 earlier).
n Steel sector profits to be still under pressure in 2014 We believe China steel sector profitability will not rise much, given 1)
26.6mt capacity growth in non-Hebei provinces during 2014E, 2)
forcing the closure of Hebei steel mills is proving difficult due to lack
of funds for compensation; and 3) geared balance sheets are forcing
steel mills to sustain cash flows by continuing production. Also, there
is additional cost pressure from tighter emission control.
n 4Q13 profit thanks to the realisation of disposal gains Management indicates non-steel asset disposal gains realised in
4Q13 were RMB918m. Thus, we forecast earnings of RMB501m in
4Q13 and RMB212m in 2013E.
n Profits in 2014 despite no one-off gains We assume the iron ore price will decline 8.5% to USD125/t in 2014
and Magang’s ASP will fall just 0.5% with limited capacity growth.
Despite no one-off gains, we still estimate NP of RMB277m in 2014.
Angang vs. Magang PB premium – average since Sep-11: 8.5%
Sources: Bloomberg; BNP Paribas
(10)
0
10
20
30
40
Sep-11
Nov-11
Jan-12
Mar-12
May-12
Jul-12
Sep-12
Nov-12
Jan-13
Mar-13
May-13
Jul-13
Sep-13
Nov-13
Jan-14
(x)
8 JANUARY 2014
CHANGE IN RECOMMENDATION 6CHINA / METALS & MINING
MAANSHAN STEEL 323 HK
HOLD FROM REDUCE
TARGET PRICE HKD2.11
CLOSE HKD1.98
UP/DOWNSIDE +6.3%
PRIOR TP HKD1.36
CHANGE IN TP +54.8%
HOW WE DIFFER FROM CONSENSUS MARKET RECS
TARGET PRICE (%) (2.7) POSITIVE 8
EPS 2013 (%) 172.7 NEUTRAL 15
EPS 2014 (%) (38.5) NEGATIVE 11
Rachel Cheung [email protected]
+852 2825 1824
KEY STOCK DATA
YE Dec (RMB m) 2012A 2013E 2014E 2015E
Revenue 74,244 76,174 77,571 77,339
Rec. net profit (3,863) 212 277 1,217
Recurring EPS (RMB) (0.50) 0.03 0.04 0.16
Prior rec. EPS (RMB) (0.50) 0.03 0.06 0.08
Chg. In EPS est. (%) 0.0 (4.9) (43.3) 97.1
EPS growth (%) (5,635.0) (105.5) 30.5 338.9
Recurring P/E (x) neg 56.0 42.9 9.8
Dividend yield (%) 0.0 0.0 0.8 3.6
EV/EBITDA (x) 27.8 4.2 3.6 2.4
Price/book (x) 0.5 0.5 0.5 0.5
Net debt/Equity (%) 76.5 49.9 31.9 9.9
ROE (%) (15.3) 0.9 1.2 5.0
Share price performance 1 Month 3 Month 12 Month
Absolute (%) (10.0) 1.0 (26.7)
Relative to country (%) (4.2) 2.6 (22.0)
Next results March 2014
Mkt cap (USD m) 1,966
3m avg daily turnover (USD m) 2.9
Free float (%) 50
Major shareholder Magang (Group) (50%)
12m high/low (HKD) 2.78/1.64
3m historic vol. (%) 30.4
ADR ticker -
ADR closing price (USD) -
Issued shares (m) 7,701
Sources: Bloomberg consensus; BNP Paribas estimates
(23)
(13)
(3)
7
17
1.53
2.03
2.53
3.03
Dec-12 Mar-13 Jun-13 Sep-13 Dec-13
(%)(HKD) Maanshan Steel Rel to MSCI China
29
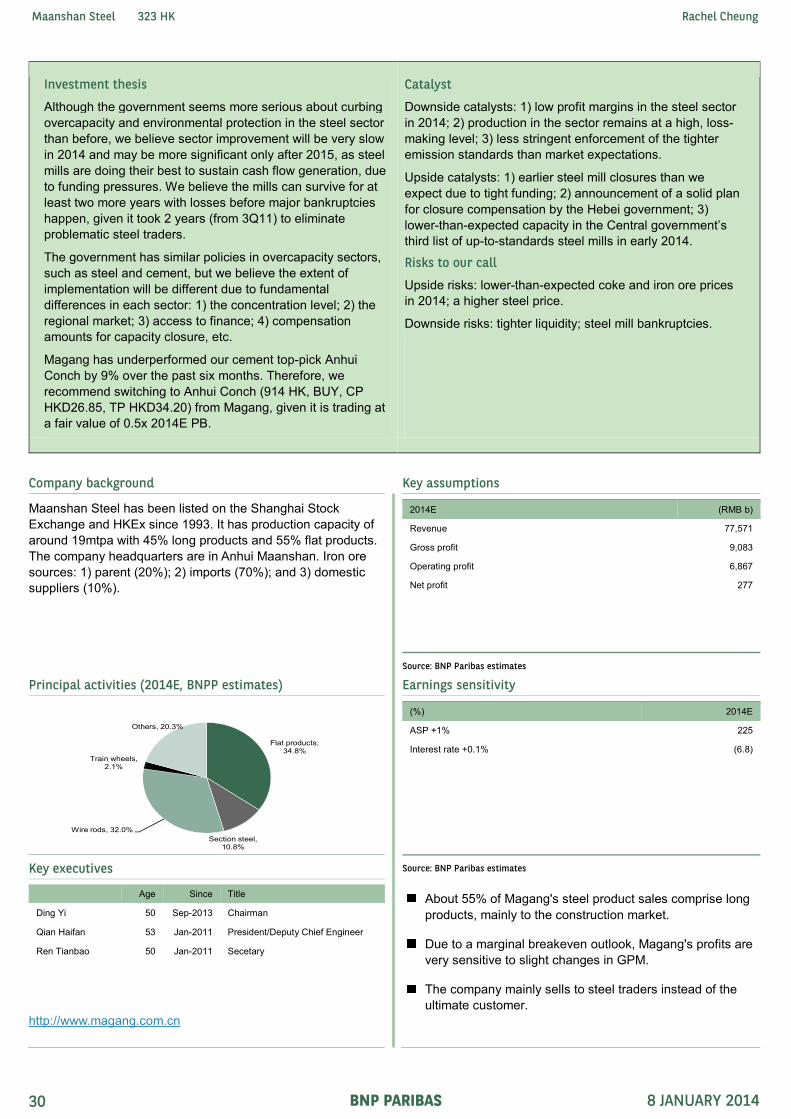
Maanshan Steel 323 HK Rachel Cheung
BNP PARIBAS 8 JANUARY 2014
Investment thesis
Although the government seems more serious about curbing
overcapacity and environmental protection in the steel sector
than before, we believe sector improvement will be very slow
in 2014 and may be more significant only after 2015, as steel
mills are doing their best to sustain cash flow generation, due
to funding pressures. We believe the mills can survive for at
least two more years with losses before major bankruptcies
happen, given it took 2 years (from 3Q11) to eliminate
problematic steel traders.
The government has similar policies in overcapacity sectors,
such as steel and cement, but we believe the extent of
implementation will be different due to fundamental
differences in each sector: 1) the concentration level; 2) the
regional market; 3) access to finance; 4) compensation
amounts for capacity closure, etc.
Magang has underperformed our cement top-pick Anhui
Conch by 9% over the past six months. Therefore, we
recommend switching to Anhui Conch (914 HK, BUY, CP
HKD26.85, TP HKD34.20) from Magang, given it is trading at
a fair value of 0.5x 2014E PB.
Catalyst
Downside catalysts: 1) low profit margins in the steel sector
in 2014; 2) production in the sector remains at a high, loss-
making level; 3) less stringent enforcement of the tighter
emission standards than market expectations.
Upside catalysts: 1) earlier steel mill closures than we
expect due to tight funding; 2) announcement of a solid plan
for closure compensation by the Hebei government; 3)
lower-than-expected capacity in the Central government’s
third list of up-to-standards steel mills in early 2014.
Risks to our call
Upside risks: lower-than-expected coke and iron ore prices
in 2014; a higher steel price.
Downside risks: tighter liquidity; steel mill bankruptcies.
Company background Key assumptions
Maanshan Steel has been listed on the Shanghai Stock
Exchange and HKEx since 1993. It has production capacity of
around 19mtpa with 45% long products and 55% flat products.
The company headquarters are in Anhui Maanshan. Iron ore
sources: 1) parent (20%); 2) imports (70%); and 3) domestic
suppliers (10%).
2014E (RMB b)
Revenue 77,571
Gross profit 9,083
Operating profit 6,867
Net profit 277
Source: BNP Paribas estimates
Principal activities (2014E, BNPP estimates) Earnings sensitivity
(%) 2014E
ASP +1% 225
Interest rate +0.1% (6.8)
Key executives Source: BNP Paribas estimates
Age Since Title
Ding Yi 50 Sep-2013 Chairman
Qian Haifan 53 Jan-2011 President/Deputy Chief Engineer
Ren Tianbao 50 Jan-2011 Secetary
http://www.magang.com.cn
About 55% of Magang's steel product sales comprise long
products, mainly to the construction market.
Due to a marginal breakeven outlook, Magang's profits are
very sensitive to slight changes in GPM.
The company mainly sells to steel traders instead of the
ultimate customer.
Flat products, 34.8%
Section steel, 10.8%
Wire rods, 32.0%
Train wheels, 2.1%
Others, 20.3%
30

Maanshan Steel 323 HK Rachel Cheung
BNP PARIBAS 8 JANUARY 2014
EXHIBIT 1: Magang – changes to key assumptions
2014E assumption change New Old Change
(RMB m) (RMB m) (%)
Revenue 77,571 74,023 4.8
COGS (excl depreciation) (68,488) (64,813) 5.7
Gross profit 9,083 9,210 (1.4)
SG&A (2,365) (2,284) 3.5
Operating EBITDA 6,867 7,075 (2.9)
Profit before tax 373 584 (36.2)
Minority tax (21) (37) (43.3)
Net profit 277 489 (43.3)
Source: BNP Paribas estimates
Valuation
EXHIBIT 2: PB band
Source: BNP Paribas estimates
EXHIBIT 3: Target price derivation
Unit
BVPS 2014E average RMB 3.06
Average PB since September 2011 x 0.55
Target price in RMB RMB 1.68
Target price in HKD HKD 2.11
Source: BNP Paribas estimates
0.0
0.5
1.0
1.5
2.0
2.5
3.0
Jan-04
Jul-04
Jan-05
Jul-05
Jan-06
Jul-06
Jan-07
Jul-07
Jan-08
Jul-08
Jan-09
Jul-09
Jan-10
Jul-10
Jan-11
Jul-11
Jan-12
Jul-12
Jan-13
Jul-13
Jan-14
(x)
Avg
+1 S.D
-1 S.D
31
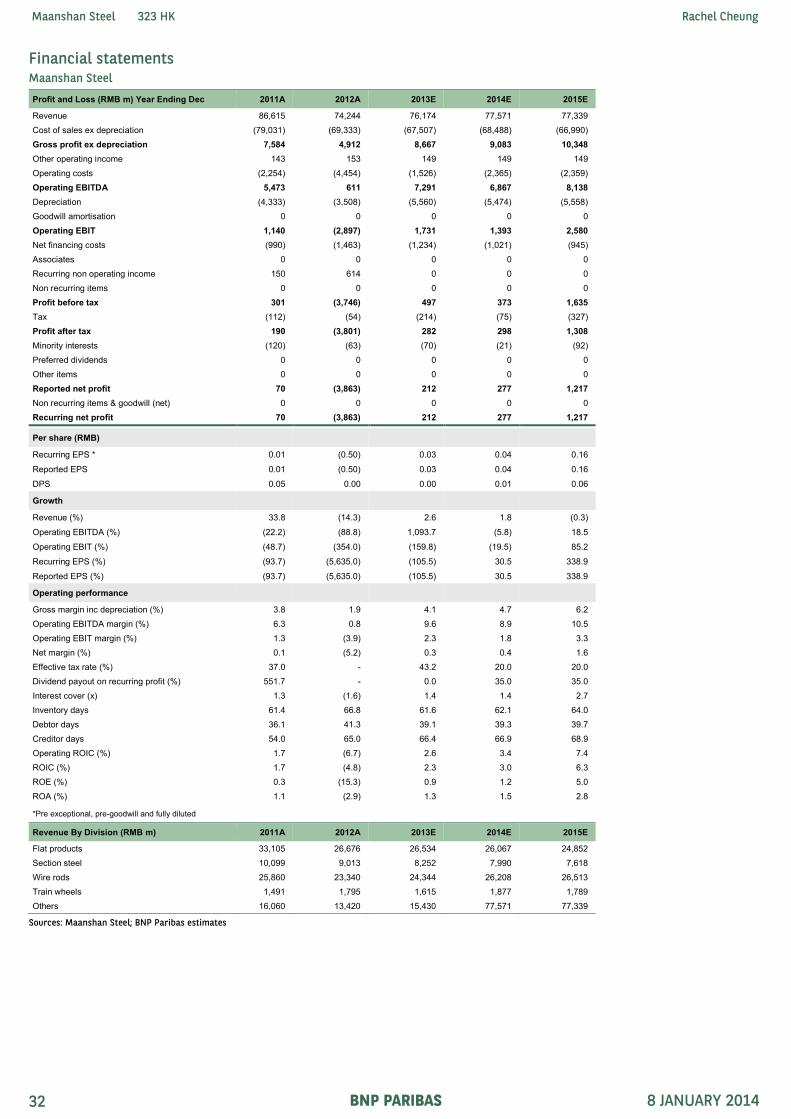
Maanshan Steel 323 HK Rachel Cheung
BNP PARIBAS 8 JANUARY 2014
Financial statements Maanshan Steel
Profit and Loss (RMB m) Year Ending Dec 2011A 2012A 2013E 2014E 2015E
Revenue 86,615 74,244 76,174 77,571 77,339
Cost of sales ex depreciation (79,031) (69,333) (67,507) (68,488) (66,990)
Gross profit ex depreciation 7,584 4,912 8,667 9,083 10,348
Other operating income 143 153 149 149 149
Operating costs (2,254) (4,454) (1,526) (2,365) (2,359)
Operating EBITDA 5,473 611 7,291 6,867 8,138
Depreciation (4,333) (3,508) (5,560) (5,474) (5,558)
Goodwill amortisation 0 0 0 0 0
Operating EBIT 1,140 (2,897) 1,731 1,393 2,580
Net financing costs (990) (1,463) (1,234) (1,021) (945)
Associates 0 0 0 0 0
Recurring non operating income 150 614 0 0 0
Non recurring items 0 0 0 0 0
Profit before tax 301 (3,746) 497 373 1,635
Tax (112) (54) (214) (75) (327)
Profit after tax 190 (3,801) 282 298 1,308
Minority interests (120) (63) (70) (21) (92)
Preferred dividends 0 0 0 0 0
Other items 0 0 0 0 0
Reported net profit 70 (3,863) 212 277 1,217
Non recurring items & goodwill (net) 0 0 0 0 0
Recurring net profit 70 (3,863) 212 277 1,217
Per share (RMB)
Recurring EPS * 0.01 (0.50) 0.03 0.04 0.16
Reported EPS 0.01 (0.50) 0.03 0.04 0.16
DPS 0.05 0.00 0.00 0.01 0.06
Growth
Revenue (%) 33.8 (14.3) 2.6 1.8 (0.3)
Operating EBITDA (%) (22.2) (88.8) 1,093.7 (5.8) 18.5
Operating EBIT (%) (48.7) (354.0) (159.8) (19.5) 85.2
Recurring EPS (%) (93.7) (5,635.0) (105.5) 30.5 338.9
Reported EPS (%) (93.7) (5,635.0) (105.5) 30.5 338.9
Operating performance
Gross margin inc depreciation (%) 3.8 1.9 4.1 4.7 6.2
Operating EBITDA margin (%) 6.3 0.8 9.6 8.9 10.5
Operating EBIT margin (%) 1.3 (3.9) 2.3 1.8 3.3
Net margin (%) 0.1 (5.2) 0.3 0.4 1.6
Effective tax rate (%) 37.0 - 43.2 20.0 20.0
Dividend payout on recurring profit (%) 551.7 - 0.0 35.0 35.0
Interest cover (x) 1.3 (1.6) 1.4 1.4 2.7
Inventory days 61.4 66.8 61.6 62.1 64.0
Debtor days 36.1 41.3 39.1 39.3 39.7
Creditor days 54.0 65.0 66.4 66.9 68.9
Operating ROIC (%) 1.7 (6.7) 2.6 3.4 7.4
ROIC (%) 1.7 (4.8) 2.3 3.0 6.3
ROE (%) 0.3 (15.3) 0.9 1.2 5.0
ROA (%) 1.1 (2.9) 1.3 1.5 2.8
*Pre exceptional, pre-goodwill and fully diluted
Revenue By Division (RMB m) 2011A 2012A 2013E 2014E 2015E
Flat products 33,105 26,676 26,534 26,067 24,852
Section steel 10,099 9,013 8,252 7,990 7,618
Wire rods 25,860 23,340 24,344 26,208 26,513
Train wheels 1,491 1,795 1,615 1,877 1,789
Others 16,060 13,420 15,430 77,571 77,339
Sources: Maanshan Steel; BNP Paribas estimates
32

Maanshan Steel 323 HK Rachel Cheung
BNP PARIBAS 8 JANUARY 2014
Financial statements Maanshan Steel
Cash Flow (RMB m) Year Ending Dec 2011A 2012A 2013E 2014E 2015E
Recurring net profit 70 (3,863) 212 277 1,217
Depreciation 4,333 3,508 5,560 5,474 5,558
Associates & minorities 120 63 70 21 92
Other non-cash items 2,404 2,404 2,404 2,404 2,404
Recurring cash flow 6,926 2,111 8,246 8,176 9,270
Change in working capital (5,482) 6,335 (75) (54) 9
Capex - maintenance 0 0 0 0 0
Capex - new investment (4,211) (4,947) (1,107) (1,107) (1,107)
Free cash flow to equity (2,766) 3,499 7,064 7,015 8,173
Net acquisitions & disposals 0 0 0 0 0
Dividends paid (308) (385) 0 0 (97)
Non recurring cash flows (3,804) (2,605) (364) (2,487) (2,485)
Net cash flow (6,878) 509 6,700 4,527 5,591
Equity finance 1,365 316 0 0 0
Debt finance 9,433 (1,345) (4,025) 0 0
Movement in cash 3,920 (521) 2,674 4,527 5,591
Per share (RMB)
Recurring cash flow per share 0.90 0.27 1.07 1.06 1.20
FCF to equity per share (0.36) 0.45 0.92 0.91 1.06
Balance Sheet (RMB m) Year Ending Dec 2011A 2012A 2013E 2014E 2015E
Working capital assets 29,818 23,498 24,107 24,548 24,475
Working capital liabilities (20,536) (20,550) (21,085) (21,471) (21,407)
Net working capital 9,282 2,947 3,023 3,077 3,068
Tangible fixed assets 37,472 38,176 31,492 27,125 22,673
Operating invested capital 46,754 41,124 34,515 30,202 25,741
Goodwill 0 0 0 0 0
Other intangible assets 0 0 0 0 0
Investments 1,121 1,215 1,215 1,215 1,215
Other assets 2,894 3,339 3,426 3,489 3,479
Invested capital 50,770 45,678 39,156 34,906 30,435
Cash & equivalents (10,304) (9,783) (12,457) (16,985) (22,575)
Short term debt 8,884 11,113 11,113 11,113 11,113
Long term debt * 21,750 18,176 14,151 14,151 14,151
Net debt 20,331 19,506 12,807 8,279 2,689
Deferred tax 0 0 0 0 0
Other liabilities 0 0 0 0 0
Total equity 27,387 23,127 23,304 23,581 24,701
Minority interests 2,070 2,385 2,385 2,385 2,385
Invested capital 50,385 45,678 39,156 34,906 30,435
* includes convertibles and preferred stock which is being treated as debt
Per share (RMB)
Book value per share 3.56 3.00 3.03 3.06 3.21
Tangible book value per share 3.56 3.00 3.03 3.06 3.21
Financial strength
Net debt/equity (%) 69.0 76.5 49.9 31.9 9.9
Net debt/total assets (%) 24.9 25.7 17.6 11.3 3.6
Current ratio (x) 1.4 1.1 1.1 1.3 1.4
CF interest cover (x) 2.5 6.8 7.6 9.0 10.8
Valuation 2011A 2012A 2013E 2014E 2015E
Recurring P/E (x) * 170.5 neg 56.0 42.9 9.8
Recurring P/E @ target price (x) * 181.3 neg 59.6 45.6 10.4
Reported P/E (x) 170.5 neg 56.0 42.9 9.8
Dividend yield (%) 3.2 0.0 0.0 0.8 3.6
P/CF (x) 1.7 5.6 1.4 1.5 1.3
P/FCF (x) (4.3) 3.4 1.7 1.7 1.5
Price/book (x) 0.4 0.5 0.5 0.5 0.5
Price/tangible book (x) 0.4 0.5 0.5 0.5 0.5
EV/EBITDA (x) ** 5.5 27.8 4.2 3.6 2.4
EV/EBITDA @ target price (x) ** 5.6 28.4 4.3 3.7 2.5
EV/invested capital (x) 0.7 0.7 0.7 0.6 0.6
* Pre exceptional, pre-goodwill and fully diluted ** EBITDA includes associate income and recurring non-operating income
Sources: Maanshan Steel; BNP Paribas estimates
33

China Steel Sector Rachel Cheung
BNP PARIBAS 8 JANUARY 2014
Financial statements Anhui Conch Cement
Profit and Loss (RMB m) Year Ending Dec 2011A 2012A 2013E 2014E 2015E
Revenue 48,654 45,766 53,129 60,478 62,338
Cost of sales ex depreciation (27,010) (30,149) (32,736) (35,852) (37,419)
Gross profit ex depreciation 21,644 15,617 20,393 24,626 24,919
Other operating income 1,028 1,102 931 1,060 1,093
Operating costs (3,658) (4,458) (5,175) (5,891) (6,072)
Operating EBITDA 19,014 12,261 16,149 19,795 19,939
Depreciation (2,467) (3,115) (3,449) (3,761) (3,988)
Goodwill amortisation 0 0 0 0 0
Operating EBIT 16,547 9,145 12,700 16,034 15,951
Net financing costs (625) (997) (890) (845) (793)
Associates 27 (23) (153) (153) (153)
Recurring non operating income 0 0 0 0 0
Non recurring items 0 0 0 0 0
Profit before tax 15,948 8,126 11,657 15,036 15,005
Tax (3,880) (1,639) (2,627) (3,388) (3,381)
Profit after tax 12,068 6,487 9,030 11,647 11,623
Minority interests (233) (156) (463) (598) (597)
Preferred dividends 0 0 0 0 0
Other items 0 0 0 0 0
Reported net profit 11,836 6,331 8,566 11,049 11,027
Non recurring items & goodwill (net) 0 0 0 0 0
Recurring net profit 11,836 6,331 8,566 11,049 11,027
Per share (RMB)
Recurring EPS * 2.23 1.19 1.62 2.09 2.08
Reported EPS 2.23 1.19 1.62 2.09 2.08
DPS 0.38 0.21 0.28 0.36 0.36
Growth
Revenue (%) 41.0 (5.9) 16.1 13.8 3.1
Operating EBITDA (%) 80.4 (35.5) 31.7 22.6 0.7
Operating EBIT (%) 92.4 (44.7) 38.9 26.2 (0.5)
Recurring EPS (%) 91.0 (46.5) 35.3 29.0 (0.2)
Reported EPS (%) 91.0 (46.5) 35.3 29.0 (0.2)
Operating performance
Gross margin inc depreciation (%) 39.4 27.3 31.9 34.5 33.6
Operating EBITDA margin (%) 39.1 26.8 30.4 32.7 32.0
Operating EBIT margin (%) 34.0 20.0 23.9 26.5 25.6
Net margin (%) 24.3 13.8 16.1 18.3 17.7
Effective tax rate (%) 24.3 20.2 22.5 22.5 22.5
Dividend payout on recurring profit (%) 16.8 17.2 17.2 17.2 17.2
Interest cover (x) 26.5 9.2 14.1 18.8 19.9
Inventory days 46.4 50.9 46.1 46.3 49.3
Debtor days 65.1 77.1 59.0 57.0 61.5
Creditor days 61.4 61.8 58.6 58.8 62.7
Operating ROIC (%) 26.7 13.3 16.9 20.2 19.6
ROIC (%) 22.7 11.2 14.0 16.8 16.4
ROE (%) 29.9 13.6 16.6 19.4 18.1
ROA (%) 17.4 8.5 10.7 12.5 11.7
*Pre exceptional, pre-goodwill and fully diluted
Revenue By Division (RMB m) 2011A 2012A 2013E 2014E 2015E
Grade 42.5 26,600 23,663 28,585 32,191 33,709
Grade 32.5 12,714 13,482 16,286 18,341 19,206
Clinker 8,832 7,918 9,565 10,772 11,280
Others 507 703 (1,307) (826) (1,858)
Sources: Anhui Conch Cement; BNP Paribas estimates
34

China Steel Sector Rachel Cheung
BNP PARIBAS 8 JANUARY 2014
Financial statements Anhui Conch Cement
Cash Flow (RMB m) Year Ending Dec 2011A 2012A 2013E 2014E 2015E
Recurring net profit 11,836 6,331 8,566 11,049 11,027
Depreciation 2,467 3,115 3,449 3,761 3,988
Associates & minorities 206 178 617 751 750
Other non-cash items (2,235) (1,393) 0 0 0
Recurring cash flow 12,273 8,232 12,632 15,561 15,765
Change in working capital (3,550) 823 (283) (696) (371)
Capex - maintenance (1,676) (715) 0 0 0
Capex - new investment (7,254) (6,157) (8,300) (10,000) (10,000)
Free cash flow to equity (207) 2,183 4,049 4,865 5,394
Net acquisitions & disposals 0 0 0 0 0
Dividends paid (1,994) (1,089) (1,474) (1,901) (1,897)
Non recurring cash flows (1,238) (1,598) (140) (147) (155)
Net cash flow (3,438) (504) 2,434 2,817 3,342
Equity finance 0 0 0 0 0
Debt finance 8,368 727 0 0 0
Movement in cash 4,929 223 2,434 2,817 3,342
Per share (RMB)
Recurring cash flow per share 2.32 1.55 2.38 2.94 2.97
FCF to equity per share (0.04) 0.41 0.76 0.92 1.02
Balance Sheet (RMB m) Year Ending Dec 2011A 2012A 2013E 2014E 2015E
Working capital assets 18,251 15,497 16,326 18,744 20,208
Working capital liabilities (13,794) (11,863) (12,409) (14,131) (15,224)
Net working capital 4,457 3,634 3,917 4,613 4,984
Tangible fixed assets 48,804 52,607 56,159 58,398 57,910
Operating invested capital 53,261 56,241 60,076 63,011 62,894
Goodwill 1,797 1,901 1,901 1,901 1,901
Other intangible assets 0 0 0 0 0
Investments 923 2,805 2,945 3,092 3,247
Other assets 3,579 3,297 3,297 3,297 3,297
Invested capital 62,240 67,536 71,510 74,593 74,631
Cash & equivalents (7,969) (8,125) (10,561) (13,396) (16,661)
Short term debt 3,197 2,658 2,658 2,658 2,658
Long term debt * 19,239 21,080 21,080 21,080 21,080
Net debt 14,467 15,613 13,177 10,342 7,077
Deferred tax 446 347 382 420 462
Other liabilities 474 418 418 418 418
Total equity 44,457 48,538 54,450 59,732 62,396
Minority interests 1,992 2,266 2,729 3,327 3,923
Invested capital 62,240 67,536 71,510 74,593 74,631
* includes convertibles and preferred stock which is being treated as debt
Per share (RMB)
Book value per share 8.39 9.16 10.27 11.27 11.77
Tangible book value per share 7.54 8.18 9.30 10.29 10.79
Financial strength
Net debt/equity (%) 31.1 30.7 23.0 16.4 10.7
Net debt/total assets (%) 17.2 17.8 13.9 10.1 6.6
Current ratio (x) 1.5 1.6 1.8 1.9 2.1
CF interest cover (x) 12.3 9.4 14.9 18.6 20.4
Valuation 2011A 2012A 2013E 2014E 2015E
Recurring P/E (x) * 9.4 17.5 13.0 10.0 10.1
Recurring P/E @ target price (x) * 11.9 22.3 16.5 12.8 12.8
Reported P/E (x) 9.4 17.5 13.0 10.0 10.1
Dividend yield (%) 1.8 1.0 1.3 1.7 1.7
P/CF (x) 9.0 13.5 8.8 7.1 7.0
P/FCF (x) (537.0) 50.9 27.4 22.8 20.6
Price/book (x) 2.5 2.3 2.0 1.9 1.8
Price/tangible book (x) 2.8 2.6 2.3 2.0 1.9
EV/EBITDA (x) ** 6.6 10.5 8.0 6.4 6.2
EV/EBITDA @ target price (x) ** 8.2 13.0 9.9 8.0 7.8
EV/invested capital (x) 2.0 1.9 1.8 1.7 1.6
* Pre exceptional, pre-goodwill and fully diluted ** EBITDA includes associate income and recurring non-operating income
Sources: Anhui Conch Cement; BNP Paribas estimates
35

China Steel Sector Rachel Cheung
BNP PARIBAS 8 JANUARY 2014
NOTES
NOTES
\
\
\
\
\
\
\
\
\
\
36

China Steel Sector Rachel Cheung
BNP PARIBAS 8 JANUARY 2014
NOTES
NOTES
\
\
\
\
\
\
\
\
\
\
37

China Steel Sector Rachel Cheung
BNP PARIBAS 8 JANUARY 2014
NOTES
NOTES
\
\
\
\
\
\
\
\
\
\
38

China Steel Sector Rachel Cheung
BNP PARIBAS 8 JANUARY 2014
Disclaimers and Disclosures
APPENDIX
DISCLAIMERS AND DISCLOSURES APPLICABLE TO NON-US BROKER-DEALER(S) (BNP Paribas Securities (Asia) Ltd)
ANALYST(S) CERTIFICATION
Rachel Cheung, BNP Paribas Securities (Asia) Ltd, +852 2825 1824, [email protected].
The analyst(s) or strategist(s) herein each referred to as analyst(s) named in this report certify(ies) that (i) all views expressed in this report accurately reflect the personal view of the analyst(s) with regard to any and all of the subject securities, companies or issuers mentioned in this report; and (ii) no part of the compensation of the analyst(s) was, is, or will be, directly or indirectly, related to the specific recommendations or views expressed by the research analyst herein. Analysts mentioned in this disclaimer are employed by a non-US affiliate of BNP Paribas Securities Corp., and are not registered/ qualified pursuant to NYSE and/or FINRA regulations.
IMPORTANT DISCLOSURES REQUIRED IN THE UNITED STATES BY FINRA RULES AND OTHER JURISDICTIONS "BNP Paribas” is the marketing name for the global banking and markets business of BNP Paribas Group. No portion of this report was prepared by BNP Paribas Securities Corp (US) personnel, and it is considered Third-Party Affiliate research under NASD Rule 2711. The following disclosures relate to relationships between companies covered in this research report and the BNP entity identified on the cover of this report, BNP Securities Corp., and other entities within the BNP Paribas Group (collectively, "BNP Paribas").
The disclosure column in the following table lists the important disclosures applicable to each company that has been rated and/or recommended in this report:
Company Ticker Disclosure (as applicable)
Angang Steel 347 HK 6
Anhui Conch Cement 914 HK 6
BNP Paribas represents that: 1. Within the past year, it has managed or co-managed a public offering for this company, for which it received fees. 2. It had an investment banking relationship with this company in the last 12 months. 3. It received compensation for investment banking services from this company in the last 12 months. 4. It expects to receive or intends to seek compensation for investment banking services from the subject company/ies in the next 3 months. 5. It beneficially owns 1% or more of any class of common equity securities of the subject company. 6. It makes a market in securities in respect of this company. 7. The analyst(s) or an individual who assisted in the preparation of this report (or a member of his/her household) has a financial interest position in
securities issued by this company. The financial interest is in the common stock of the subject company, unless otherwise noted. 8. The analyst (or a member of his/her household) is an officer, director, or advisory board member of this company or has received compensation from the
company.
IMPORTANT DISCLOSURES REQUIRED IN KOREA The disclosure column in the following table lists the important disclosures applicable to each Korea listed company that has been rated and/or recommended in this report:
Company Ticker Price (as of 08-Jan-2014 closing price) Interest
N/A N/A N/A N/A
1. The performance of obligations of the Company is directly or indirectly guaranteed by BNP Paribas Securities Korea Co. Ltd (“BNPPSK”) by means of payment guarantees, endorsements, and provision of collaterals and/or taking over the obligations.
2. BNPPSK owns 1/100 or more of the total outstanding shares issued by the Company. 3. The Company is an affiliate of BNPPSK as prescribed by Item 3, Article 2 of the Monopoly Regulation and Fair Trade Act. 4. BNPPSK is the financial advisory agent of the Company for the Merger and Acquisition transaction or of the Target Company whereby the size of the
transaction does not exceed 5/100 of the total asset of the Company or the total number of outstanding shares. 5. BNPPSK has taken financial advisory service regarding listing to the Company within the past 1 year. 6. With regards to the tender offer initiated by the Company based on Item 2, Article 133 of the Financial Investment Services and Capital Market Act,
BNPPSK acts in the capacity of the agent for the tender offer designated either by the Company or by the target company, provided that this provision shall apply only where tender offer has not expired.
7. the listed company which issued the stocks in question in case where 40 days has not passed since the new shares were listed from the date of entering into arrangement for public offering or underwriting-related agreement for issuance of stocks
8. The Company is recognized as having considerable interests with BNPPSK. 9. The analyst or his/her spouse owns (including delivery claims of marketable securities based on legal regulations and trading and misc. contracts) the
following securities or rights (hereinafter referred to as “Securities, etc.” in this Article) regardless of whose name is used in the trading. 1) Stocks, bond with stock certificate, and certificate of pre-emptive rights issued by the Company whose securities dealings are being solicited. 2) Stock options of the Company whose securities dealings are being solicited. 3) Individual stock future, stock option, and warrants that use the stocks specified in Item 1) as underlying.
39

China Steel Sector Rachel Cheung
BNP PARIBAS 8 JANUARY 2014
History of change in investment rating and/or target price
Angang Steel (347 HK)
Rachel Cheung started covering this stock from 07-Feb-2012 Price and TP are in local currency Valuation and risks: Upside risks to our PB-based target price are: 1) earlier steel mills closure than we expect due to tight funding; 2) announcement of a solid plan for closure compensation by the Hebei government; 3) lower-than-expected capacity in the Central government’s third list of up-to-standard steel mills in early 2014.
Sources: Bloomberg; BNP Paribas
Maanshan Steel (323 HK)
Rachel Cheung started covering this stock from 07-Feb-2012
Price and TP are in local currency
Valuation and risks: Upside risks to our PB-based target price are: lower-than-expected coke and iron ore prices in 2014; a higher steel price. Downside risks: tighter liquidity; steel mill bankruptcies.
Sources: Bloomberg; BNP Paribas
Anhui Conch Cement (914 HK)
Rachel Cheung started covering this stock from 10-Oct-2012 Price and TP are in local currency
Valuation and risks: Target price is based on earnings and asset multiples. 1) lower than expected cement price hike in east and south China, 2) faster than expected capacity growth in China in 2014E, 3) final emission standard below 400 mg/m³.
Sources: Bloomberg; BNP Paribas
Date Reco TP
7-Jan-10 REDUCE 13.10
20-Jan-10 BUY 21.20
7-Mar-11 HOLD 10.20
7-Feb-12 BUY 7.12
5-Jul-13 HOLD 3.42
3.07
8.07
13.07
18.07
23.07
Jan-10 Jul-10 Jan-11 Jul-11 Jan-12 Jul-12 Jan-13 Jul-13 Jan-14
(HKD) Angang Steel Target Price
Date Reco TP
7-Jan-10 HOLD 4.80
20-Jan-10 BUY 7.20
7-Mar-11 HOLD 3.80
7-Feb-12 BUY 3.57
5-Jul-13 REDUCE 1.32
1.18
2.18
3.18
4.18
5.18
6.18
7.18
Jan-10 Jul-10 Jan-11 Jul-11 Jan-12 Jul-12 Jan-13 Jul-13 Jan-14
(HKD) Maanshan Steel Target Price
Date Reco TP
7-Jan-10 BUY 37.67
23-Jun-10 HOLD 16.33
25-Mar-11 BUY 32.67
12.90
17.90
22.90
27.90
32.90
37.90
42.90
Jan-10 Jul-10 Jan-11 Jul-11 Jan-12 Jul-12 Jan-13 Jul-13 Jan-14
(HKD) Anhui Conch Cement Target Price
40

China Steel Sector Rachel Cheung
BNP PARIBAS 8 JANUARY 2014
GENERAL DISCLAIMER This report was produced by BNP Paribas Securities (Asia) Ltd, member company(ies) of the BNP Paribas Group. This report is for the use of intended recipients only and may not be reproduced (in whole or in part) or delivered or transmitted to any other person without our prior written consent. By accepting this report, the recipient agrees to be bound by the terms and limitations set forth herein. This report does not constitute a personal recommendation or take into account the particular investment objectives, financial situations, or needs of individual clients. Customers are advised to use the information contained herein as just one of many inputs and considerations prior to engaging in any trading activity. This report does not constitute a prospectus or other offering document or an offer or solicitation to buy or sell any securities or other investments. This report is not intended to provide the sole basis of any evaluation of the subject securities and companies mentioned in this report. Information and opinions contained in this report are published for reference of the recipients and are not to be relied upon as authoritative or without the recipient’s own independent verification, or taken in substitution for the exercise of judgment by the recipient. Additionally, the products mentioned in this report may not be available for sale in certain jurisdictions. As an investment bank with a wide range of activities, BNP Paribas may face conflicts of interest, which are resolved under applicable legal provisions and internal guidelines. You should be aware, however, that BNP Paribas may engage in transactions in a manner inconsistent with the views expressed in this document, either for its own account or for the account of its clients.
Australia: This report is being distributed in Australia by BNP Paribas Sydney Branch, registered in Australia as ABN 23 000 000 117 at 60 Castlereagh Street Sydney NSW 2000. BNP Paribas Sydney Branch is licensed under the Banking Act 1959 and the holder of Australian Financial Services Licence no. 238043 and therefore subject to regulation by the Australian Securities & Investments Commission in relation to delivery of financial services. By accepting this document you agree to be bound by the foregoing limitations, and acknowledge that information and opinions in this document relate to financial products or financial services which are delivered solely to wholesale clients (in terms of the Corporations Act 2001, sections 761G and 761GA; Corporations Regulations 2001, division 2, reg. 7.1.18 & 7.1.19) and/or professional investors (as defined in section 9 of the Corporations Act 2001).
Canada: The information contained herein is not, and under no circumstances is to be construed as, a prospectus, an advertisement, a public offering, an offer to sell securities described herein, or solicitation of an offer to buy securities described herein, in Canada or any province or territory thereof. Any offer or sale of the securities described herein in Canada will be made only under an exemption from the requirements to file a prospectus with the relevant Canadian securities regulators and only by a dealer properly registered under applicable securities laws or, alternatively, pursuant to an exemption from the dealer registration requirement in the relevant province or territory of Canada in which such offer or sale is made. The information contained herein is under no circumstances to be construed as investment advice in any province or territory of Canada and is not tailored to the needs of the recipient. To the extent that the information contained herein references securities of an issuer incorporated, formed or created under the laws of Canada or a province or territory of Canada, any trades in such securities must be conducted through a dealer registered in Canada. No securities commission or similar regulatory authority in Canada has reviewed or in any way passed judgment upon these materials, the information contained herein or the merits of the securities described herein, and any representation to the contrary is an offence.
Hong Kong: This report is prepared for professional investors and is being distributed in Hong Kong by BNP Paribas Securities (Asia) Limited to persons whose business involves the acquisition, disposal or holding of securities, whether as principal or agent. BNP Paribas Securities (Asia) Limited, a subsidiary of BNP Paribas, is regulated by the Securities and Futures Commission for the conduct of dealing in securities, advising on securities, providing automated trading services, dealing in futures contacts and advising on corporate finance. For professional investors in Hong Kong, please contact BNP Paribas Securities (Asia) Limited for all matters and queries relating to this report.
India: In India, this document is being distributed by BNP Paribas Securities India Pvt. Ltd. ("BNPPSIPL"), having its registered office at 5th floor, BNP Paribas House, 1 North Avenue, Maker Maxity, Bandra Kurla Complex, Bandra (East), Mumbai 400 051 (Tel. no. +91 22 3370 4000 / 6196 4000). BNPPSIPL is registered with the Securities and Exchange Board of India (“SEBI”) as a stockbroker in the Equities and the Futures & Options segments of National Stock Exchange of India Ltd. and Bombay Stock Exchange Ltd. (SEBI regn. nos. INB/INF231474835, INB/INF011474831).
Indonesia: This report is being distributed by PT BNP Paribas Securities Indonesia and is delivered by licensed employee(s) to its clients. PT BNP Paribas Securities Indonesia, having its registered office at Menara BCA, 35th Floor, Grand Indonesia, Jl. M.H.Thamrin No.1, Jakarta, 10310, Indonesia, is a fully subsidiaries company of BNP Paribas SA and is licensed under Capital Market Law No. 8 of 1995 and the holder of broker-dealer and underwriter licenses issued by the Capital Market and Financial Institutions Supervisory Agency (BAPEPAM-LK). PT BNP Paribas Securities Indonesia is also a member of Indonesia Stock Exchange. Neither this research publication nor any copy hereof may be distributed in Indonesia or to any Indonesian citizens except in compliance with applicable Indonesian capital market laws and regulations. This research publication is not an offer of securities in Indonesia. Some of the securities referred to in this research publication have not been registered with the Capital Market and Financial Institutions Supervisory Agency (BAPEPAM-LK) pursuant to relevant capital market laws and regulations, and may not be offered or sold within the territory of the Republic of Indonesia or to Indonesian citizens through a public offering or in circumstance which constitute an offer within the meaning of Indonesian capital market laws and regulations.
Japan: This report is being distributed to Japanese based firms by BNP Paribas Securities (Japan) Limited or by a subsidiary or affiliate of BNP Paribas not registered as a financial instruments firm in Japan, to certain financial institutions defined by article 17-3, item 1 of the Financial Instruments and Exchange Law Enforcement Order. BNP Paribas Securities (Japan) Limited is a financial instruments firm registered according to the Financial Instruments and Exchange Law of Japan and a member of the Japan Securities Dealers Association, the Financial Futures Association of Japan and the Type II Financial Instruments Firms Association. BNP Paribas Securities (Japan) Limited accepts responsibility for the content of a report prepared by another non-Japan affiliate only when distributed to Japanese based firms by BNP Paribas Securities (Japan) Limited. Some of the foreign securities stated on this report are not disclosed according to the Financial Instruments and Exchange Law of Japan.
Malaysia: This report is issued and distributed by BNP Paribas Capital (Malaysia) Sdn Bhd. The views and opinions in this research report are our own as of the date hereof and are subject to change. BNP Paribas Capital (Malaysia) Sdn Bhd has no obligation to update its opinion or the information in this research report. This publication is strictly confidential and is for private circulation only to clients of BNP Paribas Capital (Malaysia) Sdn Bhd. This publication is being provided to you strictly on the basis that it will remain confidential. No part of this material may be (i) copied, photocopied, duplicated, stored or reproduced in any form by any means or (ii) redistributed or passed on, directly or indirectly, to any other person in whole or in part, for any purpose without the prior written consent of BNP Paribas Capital (Malaysia) Sdn Bhd.
Philippines: This report is being distributed in the Philippines by BNP Paribas Manila Branch, an Offshore Banking Unit (OBU) of BNP Paribas whose head office is in Paris, France. BNP Paribas Manila OBU is registered as an offshore banking unit under Presidential Decree No. 1034 (PD 1034), and regulated by the Bangko Sentral ng Pilipinas. This report is being distributed in the Philippines to qualified clients of OBUs as allowed under PD 1034, and is qualified in its entirety to the products and services allowed under PD 1034.
Singapore: This report is distributed in Singapore by BNP Paribas Securities (Singapore) Pte Ltd ("BNPPSSL") and may be distributed in Singapore only to an Accredited or Institutional Investor, each as defined under the Financial Advisers Regulations ("FAR") and the Securities and Futures Act (Chapter 289) of Singapore, as amended from time to time. In relation to the distribution to such categories of investors, BNPPSSL and its representatives are exempted under Regulation 35 of the FAR from the requirements in Section 36 of the Financial Advisers Act of Singapore, regarding the disclosure of certain interests in, or certain interests in the acquisition or disposal of, securities referred to in this report. For Institutional and Accredited Investors in Singapore, please contact BNP Paribas Securities (Singapore) Ptd Ltd for all matters and queries relating to this report.
South Africa: In South Africa, BNP Paribas Cadiz Securities (Pty) Ltd and BNP Paribas Cadiz Stock Broking (Pty) Ltd (hereinafter referred to as “BNPP Cadiz”) are licensed members of Johannesburg Stock Exchange and are authorised Financial Services Providers and subject to regulation by the Financial Services Board. BNPP Cadiz does not expressly or by implication represent, recommend or propose that the financial products referred to in this report are appropriate to the particular investment objectives, financial situation or particular needs of the recipient.
Switzerland: This report is intended solely for customers who are “Qualified Investors” as defined in article 10 paragraphs 3 and 4 of the Swiss Federal Act on Collective Investment Schemes of 23 June 2006 (CISA) and the relevant provisions of the Swiss Federal Ordinance on Collective Investment Schemes of 22 November 2006 (CISO). “Qualified Investors” includes, among others, regulated financial intermediaries such as banks, securities dealers, fund management companies and asset managers of collective investment schemes, regulated insurance companies as well as pension funds and companies with professional treasury operations. This document may not be suitable for customers who are not Qualified Investors and should only be used and passed on to Qualified Investors. For specification purposes, a “Swiss Corporate Customer” is a Client which is a corporate entity, incorporated and existing under the laws of
41
China Steel Sector Rachel Cheung
BNP PARIBAS 8 JANUARY 2014
Switzerland and which qualifies as “Qualified Investor” as defined above." BNP Paribas (Suisse) SA is authorised as bank and as securities dealer by the Swiss Federal Market Supervisory Authority FINMA. BNP Paribas (Suisse) SA is registered at the Geneva commercial register under No. CH-270-3000542-1. BNP Paribas (Suisse) SA is incorporated in Switzerland with limited liability. Registered Office: 2 place de Hollande, CH-1204 Geneva.
Taiwan: Information on securities that trade in Taiwan is distributed by BNP Paribas Securities (Taiwan) Co., Ltd. Such information is for your reference only. The reader should independently evaluate the investment risks and is solely responsible for their investment decision. Information on securities that do not trade in Taiwan is for informational purposes only and is not to be construed as a recommendation or a solicitation to trade in such securities. BNP Paribas Securities (Taiwan) Co., Ltd. may not execute transactions for clients in these securities. This publication may not be distributed to the public media or quoted or used by the public media without the express written consent of BNP Paribas.
Thailand: Research relating to Thailand and Thailand based issuers is produced pursuant to an arrangement between BNP PARIBAS (“BNPP”) and Finansia Syrus Securities Public Company Limited (“FSS”). The International Investment Advisory Team at FSS prepares and distributes research under the brand name “BNP PARIBAS/FSS”. FSS is not an affiliate of BNPP. FSS also publishes a different research product under the brand name “FINANSIA SYRUS,” which is prepared by research analysts who are not part of the International Investment Advisory Team and who may cover the same securities, issuers, or industries that are the subject of this report. The ratings, recommendations, and views expressed in this report may differ from the ratings, recommendations, and views expressed by other research analysts or research teams employed by FSS. This report is being distributed outside Thailand by members of BNP Paribas.
Turkey: This report is being distributed in Turkey by TEB Investment (TEB YATIRIM MENKUL DEGERLER A.S., Teb Kampus D Blok Saray Mah. Kucuksu Cad. Sokullu Sok., No:7 34768 Umraniye, Istanbul, Turkey, Trade register number: 358354, www.tebyatirim.com.tr) and outside Turkey jointly by TEB Investment and BNP Paribas. Notice Published in accordance with “Communiqué Regarding the Principles on Investment Consultancy Activities and the Investment Consultancy Institutions” Series: V, No: 55 issued by the Capital Markets Board. The investment related information, commentary and recommendations contained herein do not constitute investment consultancy services. Investment consultancy services are provided in accordance with investment consultancy agreements executed between investors and brokerage companies or portfolio management companies or non-deposit accepting banks. The commentary and recommendations contained herein are based on the personal views of the persons who have made such commentary and recommendations. These views may not conform to your financial standing or to your risk and return preferences. Therefore, investment decisions based solely on the information provided herein may fail to produce results in accordance with your expectations.
United States: This report may be distributed in the United States only to U.S. Persons who are “major U.S. institutional investors” (as such term is defined in Rule 15a-6 under the Securities Exchange Act of 1934, as amended) and is not intended for the use of any person or entity that is not a “major U.S. institutional investor”. U.S persons who wish to effect transactions in securities discussed herein must do so through BNP Paribas Securities Corp., a US-registered broker dealer and member of FINRA, SIPC, NFA, NYSE and other principal exchanges.
Certain countries within the European Economic Area: This document may only be distributed in the United Kingdom to eligible counterparties and professional clients and is not intended for, and should not be circulated to, retail clients (as such terms are defined in the Markets in Financial Instruments Directive 2004/39/EC (“MiFID”)). This document will have been approved for publication and distribution in the United Kingdom by BNP Paribas London Branch, a branch of BNP Paribas SA whose head office is in Paris, France. BNP Paribas SA is incorporated in France with limited liability with its registered office at 16 boulevard des Italiens, 75009 Paris. BNP Paribas London Branch (registered office: 10 Harewood Avenue, London NW1 6AA; tel: [44 20] 7595 2000; fax: [44 20] 7595 2555) is authorised by the Autorité de Contrôle Prudentiel and the Prudential Regulation Authority and subject to limited regulation by the Financial Conduct Authority and Prudential Regulation Authority. Details about the extent of our authorisation and regulation by the Prudential Regulation Authority, and regulation by the Financial Conduct Authority are available from us on request. This report has been approved for publication in France by BNP Paribas, a credit institution licensed as an investment services provider by the Autorité de Contrôle Prudentiel whose head office is 16, Boulevard des Italiens 75009 Paris, France. This report is being distributed in Germany either by BNP Paribas London Branch or by BNP Paribas Niederlassung Frankfurt am Main, regulated by the Bundesanstalt für Finanzdienstleistungsaufsicht (BaFin).
Other Jurisdictions: The distribution of this report in other jurisdictions or to residents of other jurisdictions may also be restricted by law, and persons into whose possession this report comes should inform themselves about, and observe, any such restrictions. By accepting this report you agree to be bound by the foregoing instructions. This report is not directed to, or intended for distribution to or use by, any person or entity that is a citizen or resident of or located in any locality, state, country, or other jurisdiction where such distribution, publication, availability or use would be contrary to law or regulation.
All research reports are disseminated and available to all clients simultaneously through our internal client websites. For all research available on a particular stock, please contact the relevant BNP Paribas research team or the author(s) of this report.
Additional Disclosures Target price history, stock price charts, valuation and risk details, and equity rating histories applicable to each company rated in this report is available in our most recently published reports available on our website: http://eqresearch.bnpparibas.com, or you can contact the analyst named on the front of this note or your BNP Paribas representative.
All share prices are as at market close on 8 January 2014 unless otherwise stated.
RECOMMENDATION STRUCTURE
Stock Ratings Stock ratings are based on absolute upside or downside, which we define as (target price* - current price) / current price. BUY (B). The upside is 10% or more. HOLD (H). The upside or downside is less than 10%. REDUCE (R). The downside is 10% or more. Unless otherwise specified, these recommendations are set with a 12-month horizon. Thus, it is possible that future price volatility may cause a temporary mismatch between upside/downside for a stock based on market price and the formal recommendation. * In most cases, the target price will equal the analyst's assessment of the current fair value of the stock. However, if the analyst doesn't think the market will reassess the stock over the specified time horizon due to a lack of events or catalysts, then the target price may differ from fair value. In most cases, therefore, our recommendation is an assessment of the mismatch between current market price and our assessment of current fair value.
Industry Recommendations Improving (é): The analyst expects the fundamental conditions of the sector to be positive over the next 12 months. Stable (previously known as Neutral) (çè): The analyst expects the fundamental conditions of the sector to be maintained over the next 12 months. Deteriorating (ê): The analyst expects the fundamental conditions of the sector to be negative over the next 12 months. Country (Strategy) Recommendations Overweight (O). Over the next 12 months, the analyst expects the market to score positively on two or more of the criteria used to determine market recommendations: index returns relative to the regional benchmark, index sharpe ratio relative to the regional benchmark and index returns relative to the market cost of equity. Neutral (N). Over the next 12 months, the analyst expects the market to score positively on one of the criteria used to determine market recommendations: index returns relative to the regional benchmark, index sharpe ratio relative to the regional benchmark and index returns relative to the market cost of equity. Underweight (U). Over the next 12 months, the analyst does not expect the market to score positively on any of the criteria used to determine market recommendations: index returns relative to the regional benchmark, index sharpe ratio relative to the regional benchmark and index returns relative to the market cost of equity.
42
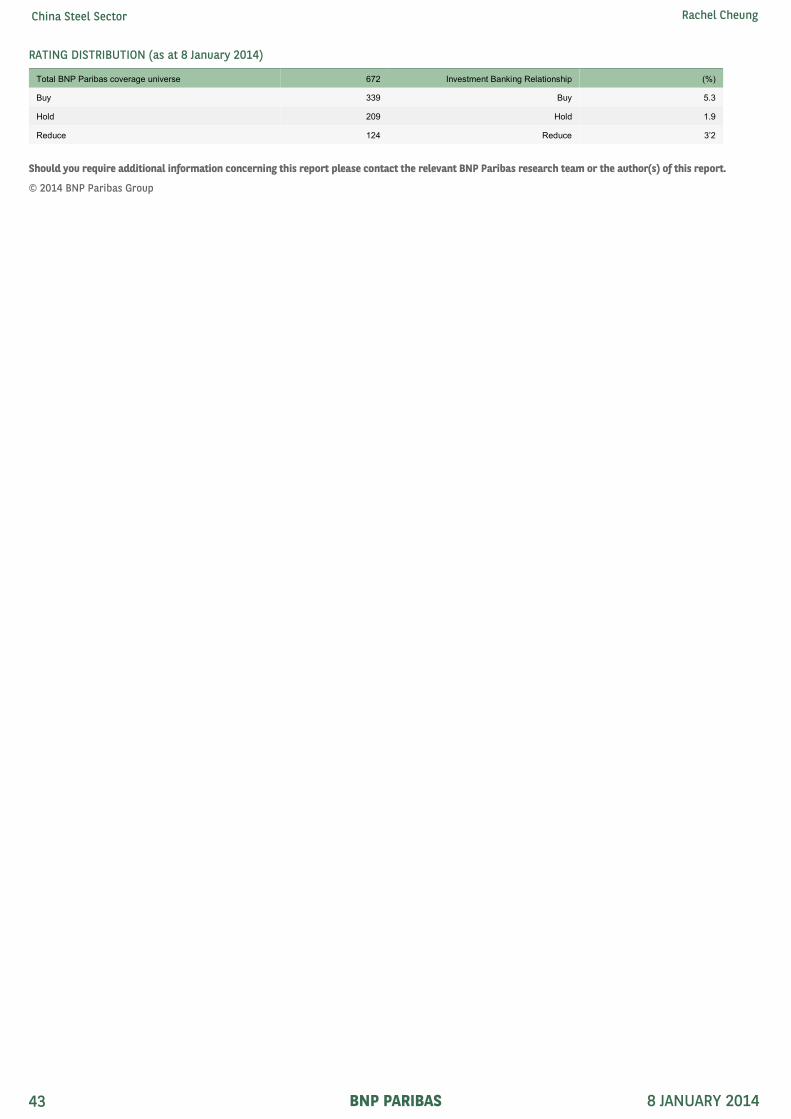
China Steel Sector Rachel Cheung
BNP PARIBAS 8 JANUARY 2014
RATING DISTRIBUTION (as at 8 January 2014)
Total BNP Paribas coverage universe 672 Investment Banking Relationship (%)
Buy 339 Buy 5.3
Hold 209 Hold 1.9
Reduce 124 Reduce 3’2
Should you require additional information concerning this report please contact the relevant BNP Paribas research team or the author(s) of this report.
© 2014 BNP Paribas Group
43

.
.
HONG KONG BNP Paribas Securities (Asia) Ltd 63/F, Two International Finance Centre 8 Finance Street, Central Hong Kong SAR China Tel (852) 2825 1888 Fax (852) 2845 9411
SHANGHAI
KUALA LUMPUR
Malaysia
SEOUL BNP Paribas Securities Korea Co Ltd 22/F, Taepyeongno Building 310 Taepyeongno 2-ga Jung-gu, Seoul 100-767 Korea Tel (82 2) 2125 0500 Fax (82 2) 2125 0593
NEW YORK BNP Paribas The Equitable Tower 787 Seventh Avenue New York NY 10019, USA Tel (1 212) 841 3800 Fax (1 212) 841 3810
BASEL BNP Paribas Aeschengraben 26 CH 4002 Basel Switzerland Tel (41 61) 276 5555 Fax (41 61) 276 5514
FRANKFURT BNP Paribas Mainzer Landstrasse 16 60325 Frankfurt Germany Tel (49 69) 7193 6637 Fax (49 69) 7193 2520
GENEVA BNP Paribas 2 Place de Hollande 1211 Geneva 11 Switzerland Tel (41 22) 787 7377 Fax (41 22) 787 8020
LONDON BNP Paribas 10 Harewood Avenue London NW1 6AA UK Tel (44 20) 7595 2000 Fax (44 20) 7595 2555
MADRID BNP Paribas SA, sucursal en Espana Hermanos Becquer 3 PO Box 50784 28006 Madrid Spain Tel (34 91) 745 9000 Fax (34 91) 745 8888
MILAN BNP Paribas Equities Italia SIM SpA Piazza San Fedele, 2 20121 Milan Italy Tel (39 02) 72 47 1 Fax (39 02) 72 47 6562
PARIS BNP Paribas Equities France Société de Bourse 20 boulevard des Italiens 75009 Paris France Tel (33 1) 4014 9673 Fax (33 1) 4014 0066
ZURICH BNP Paribas Talstrasse 41 8022 Zurich Switzerland Tel (41 1) 229 6891 Fax (41 1) 267 6813
MANAMA BNP Paribas Bahrain PO Box 5253 Manama Bahrain Tel (973) 53 3978 Fax (973) 53 1237
TOKYO BNP Paribas Securities (Japan) Ltd GranTokyo North Tower 1-9-1 Marunouchi, Chiyoda-Ku Tokyo 100-6740 Japan Tel (81 3) 6377 2000 Fax (81 3) 5218 5970
MUMBAI
BNP Paribas Equities (Asia) Ltd Shanghai Representative Office Room 2630, 26/F Shanghai World Financial Center 100 Century Avenue Shanghai 200120, China Tel (86 21) 6096 9000 Fax (86 21) 6096 9018
JAKARTA PT BNP Paribas Securities Indonesia Grand Indonesia, Menara BCA, JI. M.H. Thamrin No. 1Jakarta 10 0 Indonesia Tel (62 21) 2358 6586 Fax (62 21) 2358 7587
35/F
31
TAIPEI BNP Paribas Securities (Taiwan) Co Ltd 72 F, Taipei 101 No. 7 Xin Yi Road, Sec. 5 Taipei, Taiwan
(886 2) 8729 7000 Fax (886 2) 8101 2168
Tel
/Vista Tower, Level 48CThe Intermark, 182 Jalan Tun Razak50400 Kuala Lumpur
Tel (60 3) 2179 6222Fax (60 3) 2179 6226
BNP Paribas Capital (Malaysia) Sdn Bhd BNP Paribas Securities India Pvt Ltd BNP Paribas House1 North Avenue, Maker MaxityBandra Kurla ComplexBandra EastMumbai 400 051Tel (91 22) 3370 4000Fax (91 22) 3370 4386
https://eqresearch.bnpparibas.com
TEB Investment (A JV between TEB Bank and BNP Paribas) TEB Kampus D7 Saray Mahallesi Sokullu Sok No 7 Umraniye 34768 Istanbul Turkey Tel: (90 216) 636 44 44 Fax: (90 216) 631 44 00
SINGAPORE BNP Paribas Securities (Singapore) Pte Ltd (Co. Reg. No. 199801966C)
Tel (65) 6210 1288 Fax (65) 6210 1980
10 Collyer Quay
Singapore 049315 34/F Ocean Financial Centre
ISTANBUL CAPE TOWN Ground floor, Fernwood House The Oval, 1 Oakdale Road, Newlands Cape Town South Africa 7700 Tel (27 21) 657 8300 Fax (27 21) 657 8301
BNP Paribas Cadiz Securities (Pty) Ltd
BEIJING BNP Paribas (China) Ltd Beijing Branch Room 2001, 20/F China World Tower 1 Jianguomenwai Avenue Beijing, China Tel: +86-10-6535 0888 Fax: +86-10-6535 0883
BANGKOK(In cooperation with BNP Paribas) FSS International Investment Advisory Securities Co., Ltd 990 Abdulrahim Place, 12/F, Room 1210 Rama IV Road, Bangrak Bangkok 10500 Thailand Tel (66 2) 611 3500 Fax (66 2) 611 3551