trw 2010 annual report
TRANSCRIPT

8/3/2019 TRW 2010 Annual Report
http://slidepdf.com/reader/full/trw-2010-annual-report 1/116
front cover
2010 ANNUAL REPORTCOGNITIVE SAFETY SYSTEMS
THE GLOBAL SAFETY STANDARD.

8/3/2019 TRW 2010 Annual Report
http://slidepdf.com/reader/full/trw-2010-annual-report 2/116
COGNITIVE SAFETY SYSTEMSSAFETY SYSTEMS FROM TRW ARE RAISING THE INTELLIGENCE OF SAFETY. ALWAYS THERE
AND ALWAYS AWARE, COGNITIVE SAFETY SYSTEMS ARE HELPING TO PROTECT DRIVERS,PASSENGERS AND PEDESTRIANS WORLDWIDE.
Integrated Vehicle Control Sensor Technologies Electronics Integration Driver Assist Systems
ADVANCED THINKING / READY FOR WHATEVER COMES DOWN THE ROAD.
Safer roads start with smarter cars. TRW’s advanced cognitive safety systems are
always aware, helping to protect drivers, passengers and pedestrians worldwide.
Modular Family of ESC Systems Cost-optimized Seat Belt Retractors Modular Airbag Kits Electric Park Brake Systems
SMART THINKING / THE SAFETY EVERYONE DESERVES.
Low-cost, scalable technologies are making cognitive safety systems affordable across
the globe. Intelligent solutions deliver value and enhance safety for all drivers.
Regenerative Braking Systems Electrically Powered Steering Lightweight, Low-drag Braking Technologies Tire Pressure Monitoring
GREEN THINKING / SAFETY SYSTEMS THAT HELP PROTECT PEOPLE AND THE PLANET.
The drive for fuel efficiency is global. Cognitive safety systems provide intelligent
solutions to help protect people and the planet.
8/3/2019 TRW 2010 Annual Report
http://slidepdf.com/reader/full/trw-2010-annual-report 3/116
2010 was a highly
successful year for
TRW. Record results
were achieved
with respect to the
Company’s overallprofitability, cash
flow generation, debt
reduction and new
business wins. These
accomplishments
were even more
meaningful considering
the challenges and
headwinds the
automotive industry faced, against a backdrop of a fragile and
slow paced global economic recovery from the extraordinarylows of 2009. In Europe, the termination of government
incentive programs, sovereign debt concerns, and austerity
plans aimed at reducing deficits resulted in weak demand
for vehicles across the region. Restocking inventory from the
depleted 2009 levels combined with exports of large, luxury
vehicles out of Europe and into China, a market that continued
as a major growth-champion for the industry in 2010, more
than offset the impact of the lower consumer demand in the
region. In the U.S., economic policies directed at stimulating
growth and reducing stubbornly high unemployment levels kept
the recovery for the automotive industry moving in the right
direction, although at a slow and gradual pace and well below
“normal” levels.
TRW’s outstanding business performance was led by strong
revenue growth combined with an improved cost structure
and the impact of a broad array of innovative technologies.
The continuing focus on our strategic priorities of quality,
cost, innovative technologies, and leveraging our global reach
has served us well, as evidenced by our record results.
These priorities will continue to be the foundation of TRW’s
future success.
2010 Financial Highlights Sales of $14.4 billion, an increase of 24% compared with
the previous year.
Sales from emerging markets (defined as markets outside
Europe and North America) increased to approximately
19% of total sales.
Record full year GAAP net earnings of $834 million or
$6.49 per diluted share.
Record full year free cash flow after discretionary pension
contributions (cash flow from operating activities less
capital expenditures) of $758 million. a
Year-end net debt of $768 million – a record low and decline
of $815 million compared to year-end 2009. b
Contributed $170 million in discretionary payments to certain
of the Company’s pension plans.
In 2010, TRW posted growth in each of our major geographic
operating regions, resulting in sales of $14.4 billion, up $2.8
billion or 24% compared with 2009. The improvement was
primarily driven by the positive impact of increasing vehicle
production, as volumes began to rebound from the low levels
established in 2009. Although production remains below
normalized levels in our two largest markets, Europe and North
America, we are encouraged that the long-term fundamentals
remain favorable, which should support the gradual recoverypresently underway. Sales outside Europe and North America
accounted for approximately 19% of the Company’s total sales
and grew 38% compared to the previous year. The robust
growth was led by China and Brazil where sales were up 51%
and 28%, respectively. Increasing vehicle production combined
with increased demand for vehicle safety in those markets
should continue to strengthen our regional diversification.
The Company reported record GAAP net earnings of $834
million, or $6.49 per diluted share in 2010, which compares to
$55 million or $0.51 per diluted share in 2009. The significant
year-to-year improvement was driven primarily by thecontribution from higher sales between the two years,
the positive impact of the Company’s restructuring and
cost containment actions implemented in 2009, and lower
restructuring charges and asset impairments. Earnings before
interest, taxes, depreciation and amortization and special
items (“adjusted EBITDA”) totaled $1,673 million in 2010, as
compared to $911 million in 2009.a This best-ever result for
the Company reflects the improvement in the strength of
TRW’s operating performance.
The level of profitability achieved in 2010, combined with
TRW’s focus on capital management, resulted in free cashflow of $758 million, which compares to $254 million in 2009.a In
support of future growth and the launch plans of our customers,
capital expenditures increased to $294 million, compared with
$201 million in 2009. Although the Company is proud to have
set a record for cash generation in 2010, perhaps the most
impressive highlight was what TRW was able to accomplish
with its capital structure as a result of the cash flow. During the
course of 2010, TRW permanently repaid $400 million in bank
TRW 2010 Annual Report
To Our Stockholders,
8/3/2019 TRW 2010 Annual Report
http://slidepdf.com/reader/full/trw-2010-annual-report 4/116
term loans and reduced the Company’s gross and net debt to
historic lows of $1,846 million and $768 million, respectively.b
The $815 million reduction in net debt compared to year-end
2009 marked the fifth consecutive year the Company has
reduced its net debt. Since becoming an independent Company
in 2003, net debt has been reduced by over $2.6 billion. Inessence, TRW has transitioned from a “levered” company to
a company with investment grade characteristics. The record
cash generation during the year also enabled the Company to
make $170 million of discretionary contributions to certain of
its pension plans. The discretionary contributions, along with
other actions such as lowering plan accrual rates, closing plans
to new participants and ultimately curtailing certain plans, has
allowed the Company to limit and, in fact, reduce its pension and
other postretirement liabilities significantly from the prior year.
Strategically, TRW continues its focus on innovative technology
with its range of intelligent or Cognitive Safety Systems under
the three elements – ‘Advanced, Smart and Green Thinking.’
Advanced Thinking technologies are the latest developments in
active and passive safety, which include Driver Assist Systems.
In established markets, governments are looking at ways of
facilitating early adoption of these technologies to reduce
the impact of road traffic incidents. TRW is well positioned to
capitalize on the increasing market focus of integrating active
and passive technologies and was awarded the Company’s first
contract for its Safety Domain ECU (SDE) or ‘Chassis Controller’
during 2010.
Smart Thinking solutions offer a range of technologies designed
to ensure safety is affordable to all – whether in emerging
markets or in support of the growing small car segments across
all markets of the world. TRW’s ability to offer scalable and cost
optimized products is a major contributor behind the Company’s
successful growth in China and Brazil. In fact, in support of the
growth experienced and projected in those markets, during
2010, the Company started the localization of key technologies
such as electrically powered steering from a plant just outside
Shanghai, China and airbag control units in Limeira, Brazil. The
Company will continue to make investments in these and other
strategic, high growth areas going forward.
Rounding out TRW’s intelligent systems are the Company’s
‘Green Thinking’ technologies. Products such as electrically
powered steering and regenerative braking look beyond
powertrain solutions and offer significant benefits with an
attractive value proposition in support of manufacturers’ desire
to increase fuel efficiency and lower emissions in vehicles
across the globe. TRW is more convinced than ever that it is
executing the right strategy for long-term success. Acceptance
of our innovative technologies by our customers remains at
a high level as evidenced by our future business wins, whichestablished a record in 2010.
Business Outlook
Looking to the future, it’s hard to remember a time when the
outlook was brighter. TRW’s broad and expanding array of
technologies and global position will enable the Company to
support the increased demand for vehicle safety around the
world. Vehicle production in Europe and North America is
expected to increase modestly in 2011, further supporting the
gradual recovery. In addition, our two fastest growing markets,
China and Brazil, are expected to remain growth-champions;solidifying the importance of those markets on TRW’s future
success.
TRW’s outstanding business performance in 2010 has enabled
the Company to enter 2011 from a position of strength.
Combining the Company’s growth prospects with its low cost
structure, strong and vastly improved capital structure and
leading technology portfolio, gives us confidence as we look
to the future. Thank you for your continued support.
Sincerely,
John C. Plant
Chairman of the Board,
President and Chief Executive Officer
TRW Automotive
This letter contains forward-looking statements, which involve risks and uncertainties that could cause our actual results to differ materially from those contained in such statements, including those set forth in “RiskFactors” and “Management’s Discussion and Analysis of Financial Condition and Results of Operations” in the accompanying Annual Report on Form 10-K. We do not undertake any obligation to publicly update anyof such statements. All references to “TRW Automotive”, “TRW” or the “Company” throughout this report refer to TRW Automotive Holdings Corp. and its subsidiaries, unless otherwise indicated.
a Please see the Reconciliation Section after the Annual Report on Form 10-K herein for a reconciliation to the most comparable GAAP equivalent.b Net debt of $768 million is equal to total debt of $1,846 million less cash and cash equivalents of $1,078 million.

8/3/2019 TRW 2010 Annual Report
http://slidepdf.com/reader/full/trw-2010-annual-report 5/116
UNITED STATES SECURITIES AND EXCHANGE COMMISSIONWashington, DC 20549
Form 10-K¥ ANNUAL REPORT PURSUANT TO SECTION 13 OR 15(d)
OF THE SECURITIES EXCHANGE ACT OF 1934
For the fiscal year ended December 31, 2010OR
n TRANSITION REPORT PURSUANT TO SECTION 13 OR 15(d)OF THE SECURITIES EXCHANGE ACT OF 1934
For the transition period from to .
Commission File No. 001-31970
TRW Automotive Holdings Corp.(Exact name of registrant as specified in its charter)
Delaware 81-0597059(State or other jurisdiction of
incorporation or organization)
(I.R.S. Employer
Identification Number)
12001 Tech Center DriveLivonia, Michigan 48150
(734) 855-2600(Address, Including Zip Code, and Telephone Number, Including Area Code, of Registrant’s Principal Executive Offices)
Securities registered pursuant to Section 12(b) of the Act:
Title of Each Class Name of Each Exchange on Which Registered
Common Stock, $0.01 par value per share New York Stock Exchange
Securities registered pursuant to Section 12(g) of the Act:
NoneIndicate by check mark if the registrant is a well-known seasoned issuer, as defined in Rule 405 of the Securities Act. Yes ¥ No n
Indicate by check mark if the registrant is not required to file reports pursuant to Section 13 or Section 15(d) of the Act. Yes n No ¥
Indicate by check mark whether the registrant: (1) has filed all reports required to be filed by Section 13 or 15(d) of the Securities Exchange Act of 1934 during the preceding 12 months (or for such shorter period that the registrant was required to file such reports), and (2) has been subject to suchfiling requirements for the past 90 days. Yes ¥ No n
Indicate by check mark whether the registrant has submitted electronically and posted on its corporate Website, if any, every Interactive Data Filerequired to be submitted and posted pursuant to Rule 405 of Regulation S-T (§ 232.405 of this chapter) during the preceding 12 months (or for suchshorter period that the registrant was required to submit and post such files). Yes ¥ No n
Indicate by check mark if disclosure of delinquent filers pursuant to Item 405 of Regulation S-K (§ 229.405 of this chapter) is not contained herein,and will not be contained, to the best of registrant’s knowledge, in definitive proxy or information statements incorporated by reference in Part III of thisForm 10-K or any amendment to this Form 10-K. ¥
Indicate by check mark whether the registrant is a large accelerated filer, an accelerated filer, a non-accelerated filer, or a smaller reporting
company. See the definitions of “large accelerated filer,” “accelerated filer” and “smaller reporting company” in Rule 12b-2 of the Exchange Act.(Check one):
Large accelerated filer ¥ Accelerated filer n Non-accelerated filer n Smaller reporting company n
(Do not check if a smaller reporting company)
Indicate by check mark whether the registrant is a shell company (as defined in Rule 12b-2 of the Exchange Act). Yes n No ¥
As of July 2, 2010, the last day of the registrant’s most recently completed second fiscal quarter, the aggregate market value of the registrant’sCommon Stock, $0.01 par value per share, held by non-affiliates of the registrant was approximately $2.2 billion based on the closing sale price of theregistrant’s Common Stock as reported on the New York Stock Exchange on that date. As of February 9, 2011, the number of shares outstanding of theregistrant’s Common Stock was 122,540,732.
Documents Incorporated by Reference
Certain portions, as expressly described in this report, of the Registrant’s Proxy Statement for the 2011 Annual Meeting of the Stockholders, to befiled within 120 days of December 31, 2010, are incorporated by reference into Part III, Items 10-14.

8/3/2019 TRW 2010 Annual Report
http://slidepdf.com/reader/full/trw-2010-annual-report 6/116
TRW Automotive Holdings Corp.
Index
Page
PART I
Item 1. Business . . . . . . . . . . . . . . . . . . . . . . . . . . . . . . . . . . . . . . . . . . . . . . . . . . . . . . . . . . . . . . . 1
Item 1A. Risk Factors . . . . . . . . . . . . . . . . . . . . . . . . . . . . . . . . . . . . . . . . . . . . . . . . . . . . . . . . . . . . 11Item 1B. Unresolved Staff Comments . . . . . . . . . . . . . . . . . . . . . . . . . . . . . . . . . . . . . . . . . . . . . . . . 16
Item 2. Properties . . . . . . . . . . . . . . . . . . . . . . . . . . . . . . . . . . . . . . . . . . . . . . . . . . . . . . . . . . . . . . 16
Item 3. Legal Proceedings . . . . . . . . . . . . . . . . . . . . . . . . . . . . . . . . . . . . . . . . . . . . . . . . . . . . . . . . 17
Item 4. (Removed and reserved) . . . . . . . . . . . . . . . . . . . . . . . . . . . . . . . . . . . . . . . . . . . . . . . . . . . 17
PART II
Item 5. Market for Registrant’s Common Equity, Related Stockholder Matters and Issuer Purchasesof Equity Securities. . . . . . . . . . . . . . . . . . . . . . . . . . . . . . . . . . . . . . . . . . . . . . . . . . . . . . . 18
Item 6. Selected Financial Data . . . . . . . . . . . . . . . . . . . . . . . . . . . . . . . . . . . . . . . . . . . . . . . . . . . . 21
Item 7. Management’s Discussion and Analysis of Financial Condition and Results of Operations . . . 21
Item 7A. Quantitative and Qualitative Disclosures about Market Risk . . . . . . . . . . . . . . . . . . . . . . . . . 40
Item 8. Financial Statements and Supplementary Data . . . . . . . . . . . . . . . . . . . . . . . . . . . . . . . . . . . 42Reports of Independent Registered Public Accounting Firm . . . . . . . . . . . . . . . . . . . . . . . . . 89
Item 9. Changes in and Disagreements with Accountants on Accounting and Financial Disclosure . . 91
Item 9A. Control and Procedures . . . . . . . . . . . . . . . . . . . . . . . . . . . . . . . . . . . . . . . . . . . . . . . . . . . . 91
Item 9B. Other Information . . . . . . . . . . . . . . . . . . . . . . . . . . . . . . . . . . . . . . . . . . . . . . . . . . . . . . . . 91
PART III
Item 10. Directors, Executive Officers and Corporate Governance . . . . . . . . . . . . . . . . . . . . . . . . . . . 91
Item 11. Executive Compensation . . . . . . . . . . . . . . . . . . . . . . . . . . . . . . . . . . . . . . . . . . . . . . . . . . . 92
Item 12. Security Ownership of Certain Beneficial Owners and Management and Related StockholderMatters . . . . . . . . . . . . . . . . . . . . . . . . . . . . . . . . . . . . . . . . . . . . . . . . . . . . . . . . . . . . . . . . 92
Item 13. Certain Relationships and Related Transactions, and Director Independence . . . . . . . . . . . . . 92
Item 14. Principal Accounting Fees and Services . . . . . . . . . . . . . . . . . . . . . . . . . . . . . . . . . . . . . . . . 92PART IV
Item 15. Exhibits, Financial Statement Schedules. . . . . . . . . . . . . . . . . . . . . . . . . . . . . . . . . . . . . . . . 93
Signatures . . . . . . . . . . . . . . . . . . . . . . . . . . . . . . . . . . . . . . . . . . . . . . . . . . . . . . . . . . . . . . . . . . . . . . 101

8/3/2019 TRW 2010 Annual Report
http://slidepdf.com/reader/full/trw-2010-annual-report 7/116
PART I
Item 1. Business
The Company
TRWAutomotive Holdings Corp. (together with its subsidiaries, “we,” “our,” “us,” “TRWAutomotive” or the
“Company”) is among the world’s largest and most diversified suppliers of automotive systems, modules andcomponents to global automotive original equipment manufacturers (“OEMs”) and related aftermarkets. We
conduct substantially all of our operations through subsidiaries. These operations primarily encompass the design,
manufacture and sale of active and passive safety related products. Active safety related products principally refer to
vehicle dynamic controls (primarily braking and steering), and passive safety related products principally refer to
occupant restraints (primarily airbags and seat belts) and safety electronics (electronic control units and crash and
occupant weight sensors). We operate our business along four segments: Chassis Systems, Occupant Safety
Systems, Electronics and Automotive Components. We are primarily a “Tier 1” original equipment supplier, with
approximately 85% of our end-customer sales in 2010 made to major OEMs. Of our 2010 sales, approximately 51%
were in Europe, 30% were in North America, 14% were in Asia, and 5% were in the rest of the world.
History. The Company is a Delaware corporation formed in 2002; however, its business history stretches
back to the turn of the twentieth century to a company that eventually became Thompson Products, Inc. which
invented the two piece engine valve. In 1958, the Ramo-Wooldridge Corporation merged into Thompson Products,Inc. and after a period of time, the Company’s name was shortened to TRW Inc. In 1999, TRW Inc. completed its
acquisition of LucasVarity plc that significantly expanded its automotive product offerings and positioned the
company as a major supplier of both active and passive safety systems products. In 2002, TRW Inc. was acquired by
Northrop Grumman Corporation (“Northrop”) and in February 2003, Northrop sold the former TRW Inc.’s
automotive operations to an indirect wholly-owned subsidiary of the Company. In 2004, the Company completed an
initial public offering and its common stock is traded on the New York Stock Exchange under the ticker symbol
TRW.
Business Developments and Industry Trends
References in this Annual Report on Form 10-K (this “Report”) to our being a leading supplier and other
similar statements as to our relative market position are based principally on calculations we have made. These
calculations are based on information we have collected, including company and industry sales data obtained from
internal and available external sources, as well as our estimates. In addition to such quantitative data, our
statements are based on other competitive factors such as our technological capabilities, the breadth of our product
offerings, our research and development efforts and innovations and the quality of our products and services, in
each case relative to that of our competitors in the markets we address.
The statements regarding industry outlook, trends, the future development of certain automotive systems and
other non-historical statements contained in this section are forward-looking statements as that term is defined by
the federal securities laws.
Business Development and Strategy. We have become a leader in the global automotive supply industry by
capitalizing on the strength of our products, technological capabilities and systems integration skills. Notwith-
standing the economic downturn experienced in 2008 and 2009, over the last decade, we have experienced sales
growth in many of our product lines due to an increasing focus by both governments and consumers on safety andfuel efficiency. We believe that such focus is continuing as evidenced by ongoing regulatory activities and
uncertainty over fluctuating fuel costs as well as advances in the electrification of vehicles. We believe that this will
help drive growth in the most recent generation of our advanced safety and fuel efficient products. Such advanced
products include vehicle stability control systems, brake controls for regenerative brake systems, electric park brake
and electrically assisted power steering systems, curtain and side airbags, occupant sensing systems, front and side
crash sensors, vehicle rollover sensors, and tire pressure monitoring systems, active cruise control systems and lane
keeping/lane departure warning systems.
1

8/3/2019 TRW 2010 Annual Report
http://slidepdf.com/reader/full/trw-2010-annual-report 8/116
Throughout our long history as a leading supplier to major OEMs, we have focused on products for which we
have a technological advantage. We have extensive technical experience in a focused range of safety-related
product lines and strong systems integration skills. These traits enable us to provide comprehensive, systems-based
solutions for our OEM customers. We have a broad and established global presence and sell to major OEMs across
the world’s major vehicle producing regions, including the expanding Chinese and Brazilian markets. We believe
our business diversification mitigates our exposure to the risks of any one geographic economy, product line or
major customer concentration. It also enables us to extend our portfolio of products and new technologies across our
customer base and geographic regions, and provides us the necessary scale to optimize our cost structure.
The Automotive Industry Climate. After several years of relative stability, the global economic downturn that
began in the second half of 2008 had a significant negative impact on the automotive industry. After struggling
through several months of significant distress, during the second quarter of 2009, the automotive industry began a
slow recovery that continued through 2010. While industry conditions have improved, they remain below those
experienced prior to the start of the economic downturn. The primary trends and conditions impacting our business
in 2010, many of which we expect to continue in the near term, include:
General Economic Conditions:
• Overall, the automotive industry experienced a modest recovery due to a general improvement in
economic conditions and consumer demand.
Production Levels:
• Global vehicle production continued a positive trend and was substantially higher compared with 2009.
However, production levels in 2010 were still below levels experienced prior to the start of the
economic downturn in 2008.
• In Europe, vehicle production was higher than anticipated, largely due to increased exports, restocking
of depleted inventory levels, and to a lesser degree, the continued European automobile scrappage
programs during the first half of the year.
• In North America, the automobile market experienced significantly higher production levels compared
with 2009. This improvement was primarily attributable to increased consumer demand resulting from
improved consumer sentiment and pent-up demand for durable goods.
• Production in other regions, primarily China and Brazil, increased considerably due to increased
consumer demand.
Product Mix:
• Product mix continued to be influenced by a variety of factors. In 2010, Europe experienced an increase
in demand for larger luxury vehicles due to pent up demand in the region and demand in Asia, as
compared to smaller, more fuel efficient vehicles produced in 2009 as a result of the scrappage
programs. In North America, product mix has been more correlated to short-term fluctuations in the
price of gasoline.
Supply Base:
• Automotive suppliers implemented varying levels of operational and financial restructuring actions
during 2009 and 2010 with the primary focus on better aligning their cost structures with production
levels as well as strengthening their financial positions and liquidity.
• The economic viability of our Tier 2 and Tier 3 supply base, and their ability to handle increased
working capital requirements and potential inflationary pressures associated with rising production,
continues to be monitored.
2

8/3/2019 TRW 2010 Annual Report
http://slidepdf.com/reader/full/trw-2010-annual-report 9/116
Pricing Pressure and Inflation:
• Pressure from OEMs to reduce prices continues to impact the automotive supply industry.
• Commodity pricing volatility continues to be a factor for our business. During 2010, our operating
results were negatively impacted by the rising cost of certain commodities essential to our business.
Foreign Currencies:
• Changes in foreign currency exchange rates continue to affect the relative competitiveness of man-
ufacturing operations in different geographic regions and the relative attractiveness of different
geographic markets.
These developments and trends are discussed in more detail in “Item 7 — Management’s Discussion and
Analysis of Financial Condition and Results of Operations.”
In addition, the following are significant characteristics of the automotive and automotive supply industries.
Consumer and Regulatory Focus on Safety:
• Consumers, and therefore OEMs, are increasingly focused on, and governments are increasingly
requiring, improved safety in vehicles. For example:
— The Alliance of Automobile Manufacturers and the Insurance Institute for Highway Safetyannounced voluntary performance criteria which encompass a wide range of occupant protection
technologies and designs, including enhanced matching of vehicle front structural components and
enhanced side-impact protection through the use of features such as side airbags, airbag curtains
and revised side-impact structures. By September 2009, all of the vehicles offered in the United
States by participating manufacturers were required to meet the front-to-side performance criteria.
— In November 2008, the National Highway Traffic Safety Administration (“NHTSA”) finalized a
rule requiring standard fitment of electronic stability control (“ESC”) on all North American
vehicles under 10,000 lbs. gross vehicle weight. The rule included a phase-in plan, with ESC to
have been fitted on 55% of new vehicle production by September 2009, 75% to be fitted by
September 2010, 95% by September 2011 and on all vehicles thereafter. Similarly, European
braking regulations were enacted which require ESC on heavy commercial trucks by 2010 and on
all cars sold in Europe by 2012.
— Over the last few years, automobile safety regulations in Brazil have increased significantly.
Brazil’s government is mandating the use of driver and passenger airbags and anti-lock braking
systems for all vehicles sold in the Brazilian market by 2014.
• Advances in technology by us and others have led to a number of innovations in our product portfolio,
which will allow us to benefit from the ongoing focus on safety in vehicles. Such innovations include
rollover sensing and curtain and side airbag systems, occupant sensing systems, ESC systems and tire
pressure monitoring systems.
Consumer and Regulatory Focus on Fuel Efficiency and Greenhouse Gas Emissions:
• Consumers, and therefore OEMs, are increasingly focused on, and governments are increasingly
requiring, improved fuel efficiency and reduced greenhouse gas emissions in vehicles. For example:— In 2010, the U.S. Environmental Protection Agency (the “EPA”) and NHTSA jointly approved a
rule establishing new standards for model year 2012 through 2016 passenger cars, light-duty trucks
and medium-duty passenger vehicles to reduce greenhouse gas emissions and improve fuel
economy. These standards require those vehicles to meet a specified average emission level in
model year 2016 equivalent to 35.5 miles per gallon, if achieved exclusively through fuel economy
improvements. These standards include miles per gallon requirements under NHTSA’s Corporate
Average Fuel Economy Standards (“CAFE”) program which was established in 2007.
3

8/3/2019 TRW 2010 Annual Report
http://slidepdf.com/reader/full/trw-2010-annual-report 10/116
— In 2009, the European Parliament and the Council of the European Union adopted regulations to
reduce the average CO2 emissions of all new passenger cars sold in Europe by 19% to 130 grams
per kilometer by 2015; and in October 2009, the European Commission proposed reduced CO2
emission limits for light trucks and vans of 175 grams per kilometer by 2016, with further
reductions that may be required by 2020.
• The desire to lessen environmental impacts and reduce oil dependence is spurring interest in green
technologies and alternative fuels. As such, there is an increased focus on production of hybrid andelectric vehicles because of their fuel efficiency, and developing ethanol, hydrogen, natural gas and
other clean burning fuel sources for vehicles.
• Advances in technology by us and others have led to a number of innovations in our product portfolio,
which will allow us to benefit from the ongoing focus on fuel efficiency and CO2 emissions. Such
innovations include electric and electro-hydraulic power steering systems, brake controls for regen-
erative braking systems, efficient HVAC control systems and advanced-material/heat-resistant engine
valves.
Globalization of Suppliers:
• To serve multiple markets more cost effectively, many OEMs are manufacturing global vehicle
platforms, which typically are designed in one location but are produced and sold in many different
geographic markets around the world. Having operations in the geographic markets in which OEMsproduce global platforms enables suppliers to meet OEMs’ needs more economically and efficiently.
This global coverage is a source of significant competitive advantage for those suppliers who have it.
Increased Electronic Content and Electronics Integration:
• The electronic content of vehicles has increased in recent years. Consumer and regulatory requirements
in Europe and the United States for improved automotive safety and environmental performance, as
well as consumer demand for increased vehicle performance and functionality at lower cost, largely
drive the increase in electronic content. Electronics integration generally refers to replacing mechanical
with electronic components and integration of mechanical and electrical functions within the vehicle.
This allows OEMs to achieve a reduction in the weight of vehicles and the number of mechanical parts,
resulting in easier assembly, enhanced fuel economy, improved emissions control, increased safety and
better vehicle performance. As consumers seek more competitively-priced ride and handling perfor-
mance, safety, security and convenience options in vehicles, such as electronic stability control,electrically powered steering, active cruise control, airbags, keyless entry and tire pressure monitoring,
we believe that electronic content per vehicle will continue to increase.
Emphasis on Speed to Market:
• As OEMs are under increasing pressure to adjust to changing consumer preferences and to incorporate
technological advances, they are shortening product development times. Shorter product development
times also generally reduce product development costs. We believe suppliers that are able to deliver
new products to OEMs in a timely fashion to accommodate the OEMs’ needs will be well-positioned to
succeed in this evolving marketplace.
Competition
The automotive supply industry is extremely competitive. OEMs rigorously evaluate us and other suppliersbased on many criteria such as quality, price/cost competitiveness, system and product performance, reliability and
timeliness of delivery, new product and technology development capability, excellence and flexibility in operations,
degree of global and local presence, effectiveness of customer service and overall management capability. We
believe we compete effectively with other leading automotive suppliers on all of these criteria. For example, we
follow manufacturing practices designed to improve efficiency and quality, including but not limited to, one-piece-
flow machining and assembly, and just-in-time scheduling of our manufacturing plants, all of which enable us to
manage inventory so that we can deliver quality components and systems to our customers in the quantities and at
4

8/3/2019 TRW 2010 Annual Report
http://slidepdf.com/reader/full/trw-2010-annual-report 11/116
the times ordered. Our resulting quality and delivery performance, as measured by our customers, generally meets
or exceeds their expectations.
Additionally, due to the recent general economic and automotive industry downturns, we believe OEMs will
remain focused on the financial strength and viability of their supply base. We believe that such scrutiny of suppliers
may result in further contraction in the supply base and could force combinations of some suppliers. We feel that
this will provide us with the opportunity to win additional business.
Within each of our product segments, we face significant competition. Our principal competitors include
Advics, Bosch, Continental-Teves, JTEKT and ZF in the Chassis Systems segment; Autoliv and Takata in the
Occupant Safety Systems segment; Autoliv, Bosch, Continental-Teves and Nippondenso in the Electronics
segment; and Delphi, Eaton, ITW, Kostal, Nifco, Raymond, Tokai Rika and Valeo in the Automotive Components
segment.
Sales and Products by Segment
Sales. The following table provides external sales for each of our segments:
Sales % Sales % Sales %
2010 2009 2008
Years Ended December 31,
(Dollars in millions)
Chassis Systems . . . . . . . . . . . . . . . . . . $ 8,524 59.3% $ 6,819 58.7% $ 8,505 56.7%
Occupant Safety Systems . . . . . . . . . . . 3,441 23.9% 2,893 24.9% 3,782 25.2%
Electronics . . . . . . . . . . . . . . . . . . . . . . 777 5.4% 588 5.1% 871 5.8%
Automotive Components . . . . . . . . . . . . 1,641 11.4% 1,314 11.3% 1,837 12.3%
Total Sales . . . . . . . . . . . . . . . . . . . . $14,383 100.0% $11,614 100.0% $14,995 100.0%
See “Results of Operations — Segment Results of Operations” under “Item 7 — Management’s Discussion
and Analysis of Financial Condition and Results of Operations” and Note 18 to our consolidated financial
statements included under Item 8 of this Report for further information on our segments.
Products. The following tables describe the principal product lines by segment, in order of 2010 sales levels:
Chassis Systems
Product Line Description
Steering Gears and Systems . . . . Electrically assisted power steering systems (column-drive andrack-drive types), electrically powered hydraulic steering systems,hydraulic power and manual rack and pinion steering gears,hydraulic steering pumps, fully integral commercial steeringsystems, commercial steering columns and pumps
Foundation Brakes. . . . . . . . . . . Front and rear disc brake calipers, drum brake and drum-in-hatparking brake assemblies, rotors, drums, electric park brakesystems
Modules . . . . . . . . . . . . . . . . . . Brake modules, corner modules, pedal box modules, strutmodules, front cross-member modules, rear axle modules
Brake Controls . . . . . . . . . . . . . Four-wheel Anti-Lock Braking Systems, electronic vehiclestability control systems, actuation boosters and master cylinders,electronically controlled actuation, brake controls for regenerativebrake systems
Linkage and Suspension. . . . . . . Forged steel and aluminum control arms, suspension ball joints,rack and pinion linkage assemblies, conventional linkages,commercial steering linkages and suspension ball joints
5
8/3/2019 TRW 2010 Annual Report
http://slidepdf.com/reader/full/trw-2010-annual-report 12/116
Our Chassis Systems segment focuses on the design, manufacture and sale of product lines relating to steering,
foundation brakes, modules, brake control, and linkage and suspension. We sell our Chassis Systems products
primarily to OEMs and other Tier 1 suppliers. We also sell these products to OEM service organizations and in the
independent aftermarket, through a licensee in North America, and to independent distributors in the rest of the
world. We believe our Chassis Systems segment is well-positioned to capitalize on growth trends toward
(1) increasing active safety systems, particularly in the areas of electric steering, electronic vehicle stability
control and other advanced braking systems and integrated vehicle control systems; (2) increasing electronic
content per vehicle; (3) integration of active and passive safety systems and (4) improving fuel economy andreducing CO2 emissions.
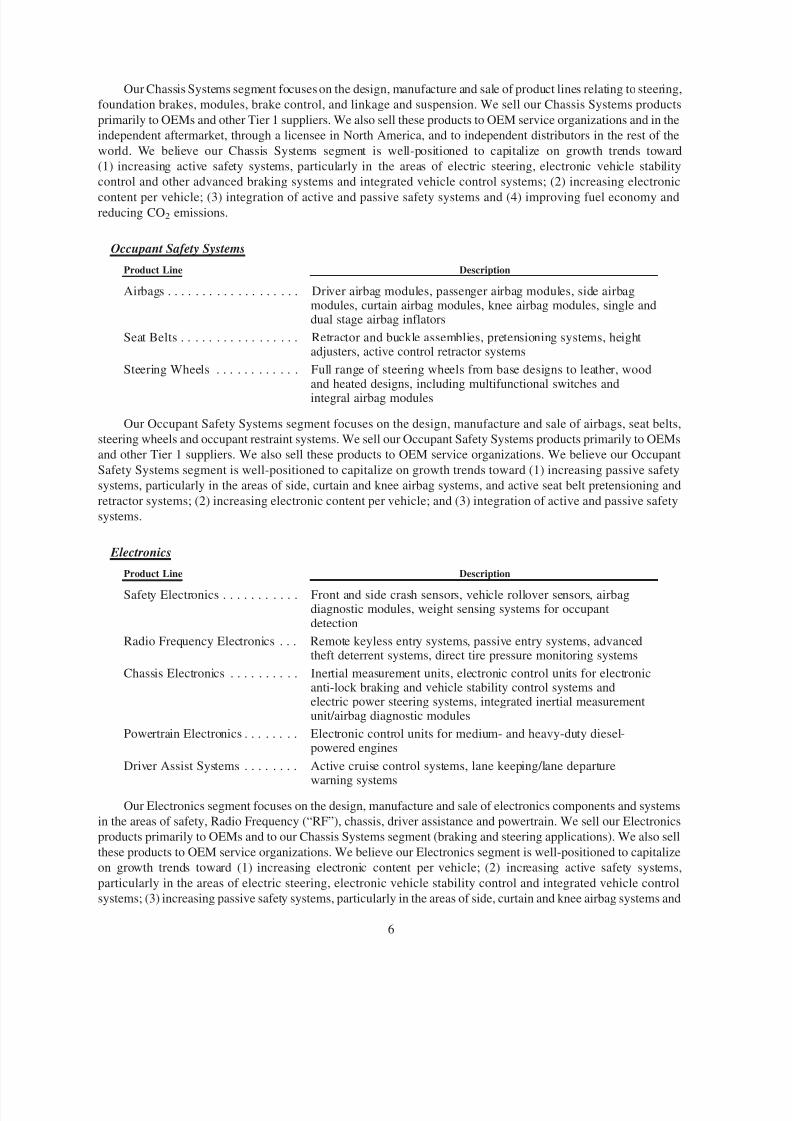
Occupant Safety Systems
Product Line Description
Airbags . . . . . . . . . . . . . . . . . . . Driver airbag modules, passenger airbag modules, side airbagmodules, curtain airbag modules, knee airbag modules, single anddual stage airbag inflators
Seat Belts . . . . . . . . . . . . . . . . . Retractor and buckle assemblies, pretensioning systems, heightadjusters, active control retractor systems
Steering Wheels . . . . . . . . . . . . Full range of steering wheels from base designs to leather, woodand heated designs, including multifunctional switches andintegral airbag modules
Our Occupant Safety Systems segment focuses on the design, manufacture and sale of airbags, seat belts,
steering wheels and occupant restraint systems. We sell our Occupant Safety Systems products primarily to OEMs
and other Tier 1 suppliers. We also sell these products to OEM service organizations. We believe our Occupant
Safety Systems segment is well-positioned to capitalize on growth trends toward (1) increasing passive safety
systems, particularly in the areas of side, curtain and knee airbag systems, and active seat belt pretensioning and
retractor systems; (2) increasing electronic content per vehicle; and (3) integration of active and passive safety
systems.
Electronics
Product Line Description
Safety Electronics . . . . . . . . . . . Front and side crash sensors, vehicle rollover sensors, airbagdiagnostic modules, weight sensing systems for occupantdetection
Radio Frequency Electronics . . . Remote keyless entry systems, passive entry systems, advancedtheft deterrent systems, direct tire pressure monitoring systems
Chassis Electronics . . . . . . . . . . Inertial measurement units, electronic control units for electronicanti-lock braking and vehicle stability control systems andelectric power steering systems, integrated inertial measurementunit/airbag diagnostic modules
Powertrain Electronics . . . . . . . . Electronic control units for medium- and heavy-duty diesel-powered engines
Driver Assist Systems . . . . . . . . Active cruise control systems, lane keeping/lane departure
warning systemsOur Electronics segment focuses on the design, manufacture and sale of electronics components and systems
in the areas of safety, Radio Frequency (“RF”), chassis, driver assistance and powertrain. We sell our Electronics
products primarily to OEMs and to our Chassis Systems segment (braking and steering applications). We also sell
these products to OEM service organizations. We believe our Electronics segment is well-positioned to capitalize
on growth trends toward (1) increasing electronic content per vehicle; (2) increasing active safety systems,
particularly in the areas of electric steering, electronic vehicle stability control and integrated vehicle control
systems; (3) increasing passive safety systems, particularly in the areas of side, curtain and knee airbag systems and
6

8/3/2019 TRW 2010 Annual Report
http://slidepdf.com/reader/full/trw-2010-annual-report 13/116
active seat belt pretensioning and retractor systems; (4) integration of active and passive safety systems; and
(5) improving fuel economy and reducing CO2 emissions.
Automotive Components
Product Line Description
Body Controls . . . . . . . . . . . . . . Electronic heating and air conditioning controls and displays;
integrated electronic center panels with capacitive switching;modular steering column controls with integrated steering anglesensors and rain sensors; man/machine interface controls andswitches, including a wide array of automotive ergonomicapplications
Engine Valves . . . . . . . . . . . . . . Engine valves, valve train components
Engineered Fasteners andComponents. . . . . . . . . . . . . . Engineered and plastic fasteners and precision plastic moldings
and assemblies
Our Automotive Components segment focuses on the design, manufacture and sale of body controls, engine valves,
and engineered fasteners and components. We sell our Automotive Components products primarily to OEMs and other
Tier 1 suppliers. We also sell these products to OEM service organizations. In addition, we sell some engine valve and
body control products to independent distributors for the automotive aftermarket. We believe our Automotive Com-
ponents segment is well-positioned to capitalize on growth trends toward (1) multi-valve and more fuel-efficient engines;(2) increasing electronic content per vehicle; and (3) improving fuel economy and reducing CO2 emissions.
Sales by Product Line and Geography
Sales by Product Line. Our 2010 sales by product line are as follows:
Product LinePercentage of
Sales
Steering gears and systems . . . . . . . . . . . . . . . . . . . . . . . . . . . . . . . . . . . . . . . . . . . . . 15.5%
Foundation brakes. . . . . . . . . . . . . . . . . . . . . . . . . . . . . . . . . . . . . . . . . . . . . . . . . . . . 13.7%
Airbags . . . . . . . . . . . . . . . . . . . . . . . . . . . . . . . . . . . . . . . . . . . . . . . . . . . . . . . . . . . 12.6%
Modules . . . . . . . . . . . . . . . . . . . . . . . . . . . . . . . . . . . . . . . . . . . . . . . . . . . . . . . . . . . 11.6%
Aftermarket . . . . . . . . . . . . . . . . . . . . . . . . . . . . . . . . . . . . . . . . . . . . . . . . . . . . . . . . 8.5%Seat belts . . . . . . . . . . . . . . . . . . . . . . . . . . . . . . . . . . . . . . . . . . . . . . . . . . . . . . . . . . 7.6%
Brake controls . . . . . . . . . . . . . . . . . . . . . . . . . . . . . . . . . . . . . . . . . . . . . . . . . . . . . . 6.9%
Electronics . . . . . . . . . . . . . . . . . . . . . . . . . . . . . . . . . . . . . . . . . . . . . . . . . . . . . . . . . 5.1%
Steering wheels. . . . . . . . . . . . . . . . . . . . . . . . . . . . . . . . . . . . . . . . . . . . . . . . . . . . . . 4.5%
Body controls . . . . . . . . . . . . . . . . . . . . . . . . . . . . . . . . . . . . . . . . . . . . . . . . . . . . . . . 4.4%
Engine valves . . . . . . . . . . . . . . . . . . . . . . . . . . . . . . . . . . . . . . . . . . . . . . . . . . . . . . . 4.0%
Linkage and suspension . . . . . . . . . . . . . . . . . . . . . . . . . . . . . . . . . . . . . . . . . . . . . . . 2.9%
Engineered fasteners and components . . . . . . . . . . . . . . . . . . . . . . . . . . . . . . . . . . . . . 2.7%
Sales by Geography. Our 2010 sales by geographic region are as follows:
Geographic Region
Percentage of
Sales
Europe . . . . . . . . . . . . . . . . . . . . . . . . . . . . . . . . . . . . . . . . . . . . . . . . . . . . . . . . . . . . 50.9%
North America . . . . . . . . . . . . . . . . . . . . . . . . . . . . . . . . . . . . . . . . . . . . . . . . . . . . . . 30.4%
Asia . . . . . . . . . . . . . . . . . . . . . . . . . . . . . . . . . . . . . . . . . . . . . . . . . . . . . . . . . . . . . . 13.7%
Rest of the World . . . . . . . . . . . . . . . . . . . . . . . . . . . . . . . . . . . . . . . . . . . . . . . . . . . . 5.0%
See Note 18 to our consolidated financial statements under Item 8 of this Report for additional product sector
and geographical information.
7
8/3/2019 TRW 2010 Annual Report
http://slidepdf.com/reader/full/trw-2010-annual-report 14/116
Customers
We sell to all the major OEM customers across theworld’s major vehicle producing regions. Our long-standing
relationships with our customers have enabled us to understand global customers’ needs and business opportunities.
We believe that we will continue to be able to compete effectively for our customers’ business because of the high
quality of our products, our ongoing cost reduction efforts, our strong global presence, our product and technology
innovations, and our financial stability.
Our customers have demonstrated improved financial health and profitability after having implementedsignificant restructuring and, in some cases, receiving government support during the 2008 and 2009 industry
downturn.
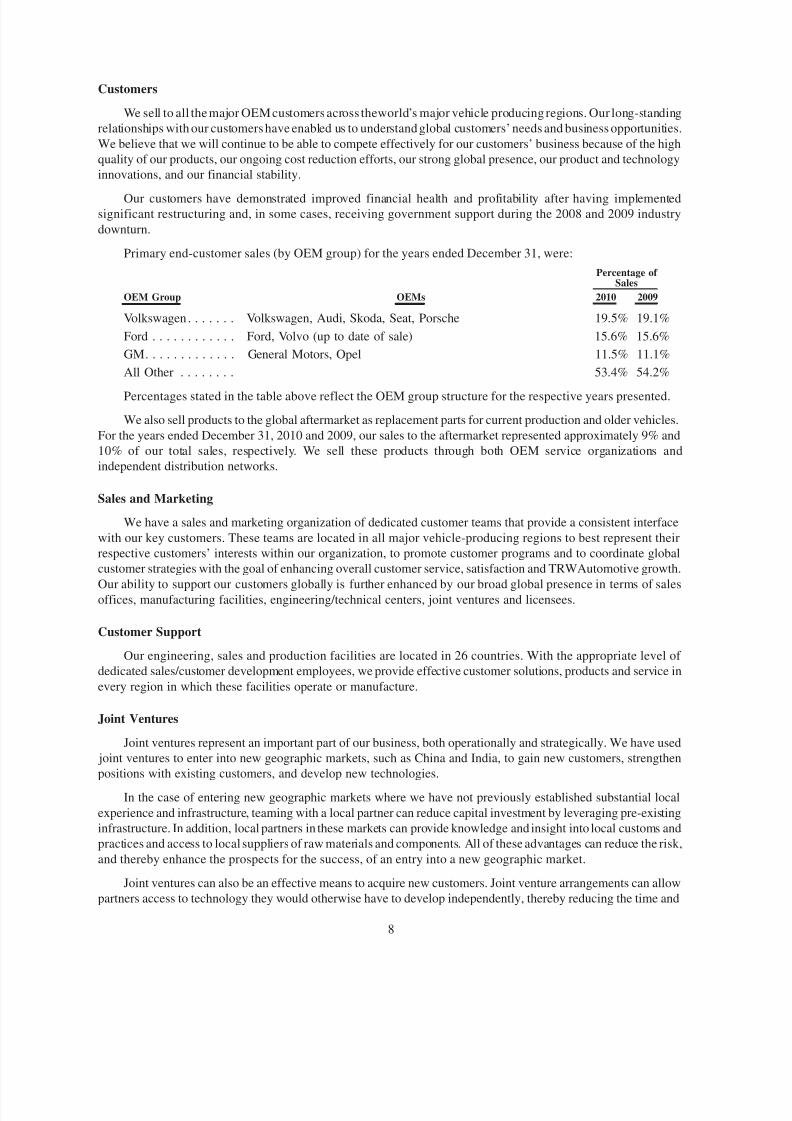
Primary end-customer sales (by OEM group) for the years ended December 31, were:
OEM Group OEMs 2010 2009
Percentage of Sales
Volkswagen . . . . . . . Volkswagen, Audi, Skoda, Seat, Porsche 19.5% 19.1%
Ford . . . . . . . . . . . . Ford, Volvo (up to date of sale) 15.6% 15.6%
GM. . . . . . . . . . . . . General Motors, Opel 11.5% 11.1%
All Other . . . . . . . . 53.4% 54.2%
Percentages stated in the table above reflect the OEM group structure for the respective years presented.
We also sell products to the global aftermarket as replacement parts for current production and older vehicles.
For the years ended December 31, 2010 and 2009, our sales to the aftermarket represented approximately 9% and
10% of our total sales, respectively. We sell these products through both OEM service organizations and
independent distribution networks.
Sales and Marketing
We have a sales and marketing organization of dedicated customer teams that provide a consistent interface
with our key customers. These teams are located in all major vehicle-producing regions to best represent their
respective customers’ interests within our organization, to promote customer programs and to coordinate global
customer strategies with the goal of enhancing overall customer service, satisfaction and TRWAutomotive growth.
Our ability to support our customers globally is further enhanced by our broad global presence in terms of salesoffices, manufacturing facilities, engineering/technical centers, joint ventures and licensees.
Customer Support
Our engineering, sales and production facilities are located in 26 countries. With the appropriate level of
dedicated sales/customer development employees, we provide effective customer solutions, products and service in
every region in which these facilities operate or manufacture.
Joint Ventures
Joint ventures represent an important part of our business, both operationally and strategically. We have used
joint ventures to enter into new geographic markets, such as China and India, to gain new customers, strengthen
positions with existing customers, and develop new technologies.
In the case of entering new geographic markets where we have not previously established substantial local
experience and infrastructure, teaming with a local partner can reduce capital investment by leveraging pre-existing
infrastructure. In addition, local partners in these markets can provide knowledge and insight into local customs and
practices and access to local suppliers of raw materials and components. All of these advantages can reduce the risk,
and thereby enhance the prospects for the success, of an entry into a new geographic market.
Joint ventures can also be an effective means to acquire new customers. Joint venture arrangements can allow
partners access to technology they would otherwise have to develop independently, thereby reducing the time and
8

8/3/2019 TRW 2010 Annual Report
http://slidepdf.com/reader/full/trw-2010-annual-report 15/116
cost of development. More importantly, they can provide the opportunity to create synergies and applications of the
technology that would not otherwise be possible.
The following table shows our significant unconsolidated joint ventures in which we have a 49% or greater
interest that are accounted for under the equity method:
Country Name
OurOwnershipPercentage Products
2010Sales
(Dollars in millions)
Brazil . . . . . . . SM-Sistemas Modulares Ltda. 50.0% Brake modules $ 18.3
China . . . . . . . Shanghai TRW AutomotiveSafety Systems Company Ltd.
50.0% Seat belt systems, airbags andsteering wheels
183.2
CSG TRW Chassis SystemsCo., Ltd.
50.0% Foundation brakes 221.4
India . . . . . . . . Brakes India Limited 49.0% Foundation brakes, actuationbrakes, valves and hoses
560.1
Rane TRW Steering SystemsLimited
50.0% Steering gears, systems andcomponents and seat beltsystems
114.4
TRW Sun Steering Wheels
Private Limited
49.0% Steering wheels and injection
molded seats
15.2
Intellectual Property
We own a significant quantity of intellectual property, including a large number of patents, trademarks,
copyrights and trade secrets, and are involved in numerous licensing arrangements. Although our intellectual
property plays an important role in maintaining our competitive position in a number of the markets that we serve,
no single patent, copyright, trade secret or license, or group of related patents, copyrights, trade secrets or licenses,
is, in our opinion, of such value to us that our business would be materially affected by the expiration or termination
thereof. However, we view the name TRW Automotive and primary mark “TRW” as material to our business as a
whole. We own a number of secondary trade names and trademarks applicable to certain of our businesses and
products that we view as important to such businesses and products as well. Our general policy is to apply for patents
on an ongoing basis to protect our patentable developments.
Our portfolio of patents and pending patent applications reflects our commitment to invest in technology and
covers many aspects of our products and the processes for making those products. In addition, we have developed a
substantial body of manufacturing know-how that we believe provides a significant competitive advantage in the
marketplace.
We have entered into numerous technology license agreements that either strategically capitalize on our
intellectual property rights or provide a conduit for us into third party intellectual property rights useful in our
businesses. In many of the agreements, we license technology to our suppliers, joint venture companies and other
local manufacturers in support of product production for our customers and us. In other agreements, we license the
technology to other companies to obtain royalty income.
Seasonality
Our business is moderately seasonal because our largest North American customers typically halt operations
for approximately twoweeks in July and one week in December. Additionally, customers in Europe historically shut
down vehicle production during portions of August and one week in December. Accordingly, our third and fourth
quarter results may reflect these trends.
The normal seasonality of the automotive industry, as described above, was not experienced in 2008 and 2009
due to the reaction of our customers to the economic conditions during those years and the timing of government
stimulus programs implemented in Europe and North America in 2009. As a result of the improved economic
9

8/3/2019 TRW 2010 Annual Report
http://slidepdf.com/reader/full/trw-2010-annual-report 16/116
conditions and vehicle production during 2010, a return to more normal seasonality of the automotive industry was
experienced in 2010 and is expected to continue in 2011.
Research, Development and Engineering
We operate a global network of technical centers worldwide where we employ and contract several thousand
engineers, researchers, designers, technicians and their supporting functions. This global network allows us to
develop active and passive automotive safety technologies while improving existing products and systems. We
utilize sophisticated testing and computer simulation equipment, including computer-aided engineering, noise-
vibration-harshness, crash sled, math modeling and vehicle simulations. We have advanced engineering and
research and development programs for next-generation products in all of our segments. We are disciplined and
innovative in our approach to research and development, employing various tools to improve efficiency and reduce
cost, such as Six Sigma, “follow-the-sun” (a 24-hour a day engineering program that utilizes our global network)
and other e-Engineering programs, and by outsourcing non-core activities.
We believe that continued research, development and engineering activities are critical to maintaining our
leadership position in the industry and will provide us with a competitive advantage as we seek additional business
with new and existing customers. Company-funded research, development and engineering costs were approx-
imately $669 million, $653 million and $857 million for the years ended December 31, 2010, 2009, and 2008,
respectively. Certain vehicle manufacturers have continued their shift away from funding development contracts for
new technology.
For research and development expenditures in each of the years ended December 31, 2010, 2009 and 2008, see
“— Research and Development ” in Note 2 to our consolidated financial statements included in Item 8 of this
Report.
Supply Base — Manufactured Components and Raw Materials
We purchase various manufactured components and raw materials for use in our manufacturing processes. The
principal components and raw materials we purchase include castings, electronic parts, molded plastic parts,
finished subcomponents, fabricated metal, aluminum, steel, resins, textiles, leather and wood. All of these
components and raw materials are available from numerous sources. During 2010, we experienced a continued
rise in inflationary pressures impacting certain commodities, such as resins and other petroleum-based products,yarns, ferrous metals, base metals, and certain chemicals, as well as aluminum and electronic components.
Additionally, because we purchase various types of equipment, raw materials and component parts from our
suppliers, we may be adversely affected by their failure to perform as expected or their inability to adequately
mitigate inflationary, industry, or economic pressures. The overall strain on our supply base may possibly lead to
delivery delays, production issues or delivery of non-conforming products by our suppliers. As such, we continue to
monitor our vendor base for the best source of supply and work with those vendors and customers to attempt to
mitigate the impact of the pressures mentioned above.
Although we have not, in recent years, experienced any significant shortages of manufactured components or
raw materials, we normally do not carry inventories of these items in excess of those reasonably required to meet our
production and shipping schedules. The possibility of shortages exists, especially in light of the potential increase in
working capital demands on our suppliers as production levels increase.
Employees
As of December 31, 2010, we had approximately 61,300 full-time employees and approximately 8,500
temporary/contract employees (excluding employees who were on approved forms of leave).
As of December 31, 2009, we had approximately 57,500 full-time employees and approximately 6,100
temporary/contract employees (excluding employees who were on approved forms of leave).
10

8/3/2019 TRW 2010 Annual Report
http://slidepdf.com/reader/full/trw-2010-annual-report 17/116
Environmental Matters
Governmental requirements relating to the discharge of materials into the environment, or otherwise relating to
the protection of the environment, have had, and will continue to have, an effect on our operations and us. We have
made, and continue to make, expenditures for projects relating to the environment, including pollution control
devices for new and existing facilities. We are conducting a number of environmental investigations and remedial
actions at current and former locations to comply with applicable requirements and, along with other companies,
have been named a potentially responsible party for certain waste management sites. Each of these matters issubject to various uncertainties, and some of these matters may be resolved unfavorably to us. Further information
regarding environmental matters, including the related reserves, is contained in Note 17 to our consolidated
financial statements included in Item 8 of this Report, and is incorporated herein by reference.
We do not believe that compliance with environmental protection laws and regulations will have a material
effect upon our capital expenditures, cash flows, results of operations or competitive position. Our capital
expenditures pertaining to environmental control during 2011 are not expected to be material to us.
International Operations
We have significant manufacturing operations outside the United States and, in 2010, approximately 78% of
our sales originated outside the United States. See Note 18 to our consolidated financial statements included in
Item 8 of this Report for financial information by geographic area. Also, see “Item 1A — Risk Factors” for a
description of risks inherent in such international operations.
Available Company Information
TRW Automotive Holdings Corp.’s Internet website is www.trw.com. Our annual reports on Form 10-K,
quarterly reports on Form 10-Q, current reports on Form 8-K and amendments to those reports filed or furnished
pursuant to section 13(a) or 15(d) of the Securities Exchange Act of 1934 are available free of charge through our
website as soon as reasonably practicable after they are electronically filed with, or furnished to, the Securities and
Exchange Commission. Our Audit Committee Charter, Compensation Committee Charter, Corporate Governance
and Nominating Committee Charter, Corporate Governance Guidelines and Standards of Conduct (our code of
business conduct and ethics) are also available on our website. From time to time we may amend our Standards of
Conduct, as we did in August 2010. We intend to disclose, by posting on our website, information about any future
amendments, as well as information concerning any waiver of the Standards of Conduct that may be granted by the
Board, in accordance with SEC regulations.
ITEM 1A. RISK FACTORS
Our business is subject to a number of risks, including those described below and elsewhere in this Report. The
occurrence of any of these risks could materially adversely affect our results of operations, financial condition
and/or cash flow, and the impact could be compounded if multiple risks were to occur.
Tighter financial markets adversely impacting the availability and cost of credit could negatively affect
our business.
Tighter financial markets resulting in reduced liquidity and increased borrowing costs in the consumer market
could reduce consumer spending for automobiles, which would negatively impact production volumes. Further,
reduced liquidity continues to adversely impact the availability and cost of incremental credit for many companies.As our customers and suppliers respond to rapidly changing consumer preferences and attempt to increase
production volumes as the industry recovery progresses, they may require access to additional capital. If required
capital is not obtained or its cost is prohibitively high, any production volume increase could be constrained, or
worse, their business could be negatively impacted, possibly resulting in further restructuring. Any such negative
impact, in turn, could negatively affect our business, either through lower sales to any of our customers so affected
or through inability to meet our commitments (or inability to meet them without excess expense) because of our
suppliers’ inability to perform.
11

8/3/2019 TRW 2010 Annual Report
http://slidepdf.com/reader/full/trw-2010-annual-report 18/116

8/3/2019 TRW 2010 Annual Report
http://slidepdf.com/reader/full/trw-2010-annual-report 19/116
Continuing pricing pressures from our customers may adversely affect our profitability.
Pricing pressure in the automotive supply industry has been substantial and is likely to continue. Virtually all
vehicle manufacturers seek price reductions in both the initial bidding process and during the term of the contract.
Price reductions have impacted our sales and profit margins and are expected to do so in the future. If we are not able
to offset continued price reductions through improved operating efficiencies and reduced expenditures, those price
reductions may have a material adverse effect on our results of operations.
We could be adversely affected by any shortage of supplies causing a production disruption.
Either we, our customers, or other suppliers may experience supply shortages of components or raw materials.
This could be caused by a number of factors, including insufficient production line capacity or manpower or
working capital constraints or other factors, including weather emergencies impacting the accessibility of raw
materials, labor unrest, commercial disputes or acts of terrorism. In order to manage and reduce the cost of
purchased goods and services, we and others in our industry have been rationalizing and consolidating our supply
base. In addition, due to the turbulence in the automotive industry, several suppliers have ceased operations. As a
result, there is greater dependence on fewer sources of supply for certain components and materials, which could
increase the possibility of a supply shortage of any particular component or material. In addition, if any of our
customers experience a material supply shortage, either directly or as a result of a supply shortage at another
supplier, that customer may halt or limit the purchase of our products. Similarly, if we or one of our own suppliers
experience a supply shortage, we may become unable to produce the affected products if we cannot procure the
components from another source. Such production interruptions could impede a ramp-up in vehicle production and
could have a material adverse effect on our business, results of operations and financial condition.
We consider the production capacities and financial condition of suppliers in our selection process, and expect
that they will meet our delivery requirements. However, there can be no assurance that strong demand, capacity
limitations, shortages of raw materials or other problems will not result in any shortages or delays in the supply of
components to us.
Our costs may increase as the industry recovery progresses, negatively impacting our profitability.
In reaction to the decline in production volumes in 2008 and 2009, we undertook various initiatives to
restructure our business and cut our costs, many of which may not be sustainable as the industry recovery
progresses. For example, in 2009 we did not provide merit increases to our salaried employees and we significantly
curtailed a number of expenses including, among other things, our training and travel budgets. However, in 2010 weresumed our practice of providing merit increases and we relaxed our spending limitations in certain areas. In
addition, as the industry stabilizes and/or production increases and we look to future growth, we have been
increasing our hiring as well as our budgeted capital expenditures. Such actions may negatively impact our future
profitability.
Our business and results of operations would be materially and adversely affected if we lost any of our
largest customers.
For the year ended December 31, 2010, sales to our three largest customer groups on a worldwide basis were
approximately 47% of our total sales. Although business with each customer is typically split among numerous
contracts, if we lost a major customer or that customer significantly reduced its purchases of our products, there
could be a material adverse affect on our business, results of operations and financial condition.
We may incur material losses and costs as a result of product liability, warranty and recall claims that
may be brought against us.
In our business we are exposed to product liability and warranty claims, and we may be required to participate
in product recalls. Vehicle manufacturers are increasingly looking to their suppliers for contribution when faced
with product liability, warranty and recall claims and we have been subject to continuing efforts by our customers to
change contract terms and conditions concerning warranty and recall participation. Further, as vehicle manufac-
turers lengthen their warranty commitments to consumers and the affected vehicles age, warranty claims may
13

8/3/2019 TRW 2010 Annual Report
http://slidepdf.com/reader/full/trw-2010-annual-report 20/116
increase. In addition, we may see an increase in the number of product liability cases brought against us, as well as
in our costs to defend product liability cases, due to the bankruptcies of Chrysler LLC and General Motors
Corporation. Vehicle manufacturers have experienced increasing recall campaigns in recent years. Further, some
have speculated that the National Highway Traffic Safety Administration may utilize a lower threshold in ordering
product recalls in the future, given recent experience. Product liability, warranty and recall costs could have a
material adverse effect on our financial condition, results of operations and cash flows.
Our results of operations may be adversely affected by environmental and safety regulations or concerns.
Laws and regulations governing environmental and occupational safety and health are complicated, change
frequently and have tended to become stricter over time. As a manufacturing company, we and our operations are
subject to these laws and regulations both inside and outside the United States. We may not be in complete
compliance with such laws and regulations at all times, and violations of these requirements could result in fines or
sanctions, obligations to investigate or remediate contamination, third party property damage or personal injury
claims, or modification or revocation of our operating permits. As an owner and operator, we could also be
responsible under some laws for responding to contamination detected at any of our operating sites or at third party
sites to which our wastes were sent for disposal, regardless of whether we caused the contamination, or the legality
of the original activity. Our costs or liabilities relating to these matters may be more than the amount we have
reserved and the difference may be material. We have spent (and in the future will spend) money to comply with
environmental requirements, which expenditures could be significant in order to comply with evolving environ-mental, health and safety laws that may be adopted in the future. In addition, certain of our subsidiaries are subject
to pending litigation raising various environmental and health and safety claims, including certain asbestos-related
claims. While our annual costs to defend and settle these claims in the past have not been material, we cannot
provide assurance that this will remain so in the future.
We are subject to risks associated with our non-U.S. operations that could have an adverse effect on our
business, results of operations and financial condition.
We have significant manufacturing operations outside the United States and we intend to continue to expand
our operations in certain emerging markets such as China and Brazil. Operations outside of the United States,
particularly operations in emerging markets, are subject to various risks which may not be present or as significant
for operations within U.S. markets. Economic uncertainty in some geographic regions in which we operate,including certain emerging markets, could result in the disruption of markets and negatively affect our results of
operations and cash flows in those areas.
Risks inherent in our international operations include: social plans that prohibit or increase the cost of certain
restructuring actions; the impact of changes in local economic conditions, such as inflation levels; currency
exchange controls; foreign currency exchange rate fluctuations including devaluations; variations in protection of
intellectual property and other legal rights; the difficulty of enforcing agreements and collecting receivables
through certain foreign legal systems; restrictive governmental actions such as restrictions on transfer or repa-
triation of funds and trade protection matters, including antidumping duties, tariffs, embargoes and prohibitions or
restrictions on acquisitions or joint ventures; changes in laws and regulations, including the laws and policies of the
United States affecting trade and foreign investment; more expansive legal rights of foreign labor unions; the
potential for nationalization of enterprises; and unsettled political conditions and possible terrorist attacks against
United States’ or other interests. Further, there are potential tax inefficiencies in repatriating funds from
non-U.S. subsidiaries.
Our non-U.S. operations include joint ventures and other alliances, most significantly in the Asia-Pacific
region. Additional risks characteristic of these arrangements include the risk of conflicts arising between us and our
joint venture partners and the lack of unilateral control of management. We also risk circumstances where our joint
venture partner may fail to satisfy its obligations, which could result in increased liabilities to us. Further, our ability
to repatriate funds may be constrained by the terms of particular agreements with our joint venture partners.
14

8/3/2019 TRW 2010 Annual Report
http://slidepdf.com/reader/full/trw-2010-annual-report 21/116
These and other factors may have an adverse effect on our international operations and, therefore, on our
business, results of operations and financial condition, which may become more pronounced as we expand further
in these areas.
If we are unable to protect our intellectual property rights, our business and our competitive position
could be materially adversely impacted.
We own significant intellectual property, including a large number of patents, trademarks, copyrights and trade
secrets, and are involved in numerous licensing arrangements. Our intellectual property plays an important role in
maintaining our competitive position in a number of the markets that we serve. Our competitors may develop
technologies that are similar or superior to our proprietary technologies or design around the patents we own or
license. Further, as we expand our operations in jurisdictions where the protection of intellectual property rights is
less robust, the risk of others duplicating our proprietary technologies increases, despite efforts we undertake to
protect them. Developments or assertions by or against us relating to intellectual property rights, and any inability to
protect these rights, could materially adversely impact our business and our competitive position.
Our pension and other postretirement benefits expense and the funding requirements of our pension
plans could materially increase, reducing our profitability.
A significant number of our employees participate in defined benefit pension plans or retirement/termination
indemnity plans. However, we have taken action to limit our future liabilities under certain of these plans, including
the two largest. Effective September 30, 2009 we froze our U.K. pension plan and effective December 31, 2010 we
froze our U.S. salaried pension plan so that benefits would not continue to accrue beyond those dates. The
obligations and expense recognized in our financial statements for these plans is actuarially determined based on
certain assumptions which are driven by market conditions, including interest rates. Additionally, market conditions
impact the underlying value of the assets held by the plans for settlement of these obligations.
General economic conditions have negatively affected our pension liabilities and related investments as of
December 31, 2010. Although we made additional pension funding payments in 2010, further declines in interest
rates or the market values of the securities held by the plans, or certain other changes, could negatively affect the
funded status of these plans and the level and timing of required contributions in 2012 and beyond. Further
deterioration in the funded status of the plans could significantly increase our pension expense and cashcontributions, and reduce our profitability.
We also sponsor other postretirement employee benefits (“OPEB”) primarily in the United States and Canada.
We fund our OPEB costs on a pay-as-you-go basis; accordingly, the related plans have no assets. We are subject to
increased OPEB cash outlays and costs due to increasing health care costs, among other factors. Increases in the
expected costs of health care in excess of current assumptions could increase our actuarially determined obligations
and our related OPEB expense along with future cash outlays.
Work stoppages or other labor issues at our facilities or the facilities of our customers or suppliers could
adversely affect our operations.
Due to normal and ordinary labor negotiations or as a result of a specific labor dispute, a work stoppage mayoccur in our facilities or those of our customers or other suppliers. Actions taken to address negative industry trends
in recent years, coupled with the industry recovery, may have the side effect of exacerbating labor relations
problems which could increase the possibility of such a work stoppage. If any of our customers experience a
material work stoppage, either directly or as a result of a work stoppage at another supplier, that customer may halt
or limit the purchase of our products. Similarly, a work stoppage at our facilities or one of our own suppliers could
limit or stop our production of the affected products. Such interruptions in our production could have a material
adverse effect on our business, results of operations and financial condition.
15

8/3/2019 TRW 2010 Annual Report
http://slidepdf.com/reader/full/trw-2010-annual-report 22/116
Our annual effective tax rate could be volatile and materially change as a result of our valuation allow-
ances position and other factors.
The overall effective tax rate is equal to consolidated tax expense as a percentage of consolidated earnings
before tax. However, tax expense and benefits are not recognized on a global basis but rather on a jurisdictional or
legal entity basis. Therefore, a material shift in the mix of earnings between jurisdictions could result in a material
change in our effective tax rate. In addition, we have recorded a valuation allowance against deferred tax assets in
various taxing jurisdictions, including the United States. As a result, pre-tax earnings and losses in those
jurisdictions do not result in a corresponding income tax expense or benefit. If operating results improve or
deteriorate on a sustained basis, jurisdiction by jurisdiction, our conclusions regarding the need for a valuation
allowance could change. Both the reversal of an existing valuation allowance or the initial recognition of a new
valuation allowance could have a significant impact on income tax expense, and therefore the effective tax rate, in
the period recognized and subsequent periods.
We have recorded a significant amount of goodwill and other identifiable intangible assets, which may
become impaired in the future, adversely affecting our financial condition.
We have recorded a significant amount of goodwill, which represents the excess of cost over the fair value of
the net assets of the business acquired, and other identifiable intangible assets, including trademarks and customer
relationships. Impairment of goodwill and other identifiable intangible assets may result from, among other things,
deterioration in our performance, adverse market conditions, adverse changes in applicable laws or regulations,
including changes that restrict the activities of or affect the products sold by our business, and a variety of otherfactors. The amount of any quantified impairment must be expensed immediately as a charge that is included in
operating income. In connection with our fiscal year ended December 31, 2008, we recorded an impairment charge
related to goodwill and customer relationships of $787 million, and in the first quarter of 2009, we recorded an
impairment charge related to our trademark intangible asset of $30 million. As of December 31, 2010, goodwill and
other identifiable intangible assets totaled $2,065 million, or 22% of our total assets. We remain subject to future
financial statement risk in the event that goodwill or other identifiable intangible assets become further impaired.
ITEM 1B. UNRESOLVED STAFF COMMENTS
None.
ITEM 2. PROPERTIES
Our principal executive offices are located in Livonia, Michigan. Our operations include numerous manu-
facturing, research and development, warehousing facilities and offices. We own or lease principal facilities located
in 12 states in the United States and in 25 other countries as follows: Austria, Brazil, Canada, China, the Czech
Republic, France, Germany, Italy, Japan, Malaysia, Mexico, Poland, Portugal, Romania, Singapore, Slovakia,
South Africa, South Korea, Spain, Sweden, Switzerland, Thailand, Tunisia, Turkey, and the United Kingdom.
Approximately 53% of our principal facilities are used by the Chassis Systems segment, 21% are used by the
Occupant Safety Systems segment, 4% are used by the Electronics segment and 22% are used by the Automotive
Components segment. Our corporate headquarters are contained within the Chassis Systems segment numbers
below. We consider our facilities to be adequate for our current uses.
Of the total number of principal facilities operated by us, approximately 59% of such facilities are owned and
41% are leased.
16

8/3/2019 TRW 2010 Annual Report
http://slidepdf.com/reader/full/trw-2010-annual-report 23/116
A summary of our principal facilities, by segment, type of facility and geographic region, as of December 31,
2010 is set forth in the following tables. Additionally, where more than one segment utilizes a single facility, that
facility is categorized by the purposes for which it is primarily used.
Chassis Systems
Principal Use of Facility North America Europe Asia Pacific(2) Other(2) Total
Manufacturing(1) . . . . . . . . . . . . . . . . . . . 21 27 11 4 63
Research and Development . . . . . . . . . . . . 3 4 3 1 11
Warehouse . . . . . . . . . . . . . . . . . . . . . . . . 3 7 1 2 13
Office . . . . . . . . . . . . . . . . . . . . . . . . . . . 2 5 5 — 12
Total number of facilities . . . . . . . . . . . . . 29 43 20 7 99
Occupant Safety Systems
Principal Use of Facility North America Europe Asia Pacific Other Total
Manufacturing(1) . . . . . . . . . . . . . . . . . . . 5 19 — 1 25
Research and Development . . . . . . . . . . . . 2 3 — — 5
Warehouse . . . . . . . . . . . . . . . . . . . . . . . . 2 4 — — 6
Office . . . . . . . . . . . . . . . . . . . . . . . . . . . 1 2 — — 3
Total number of facilities . . . . . . . . . . . . . 10 28 — 1 39
Electronics
Principal Use of Facility North America Europe Asia Pacific Other Total
Manufacturing(1) . . . . . . . . . . . . . . . . . . . 2 3 1 — 6
Research and Development . . . . . . . . . . . . 1 — — — 1
Total number of facilities . . . . . . . . . . . . . 3 3 1 — 7
Automotive Components
Principal Use of Facility North America Europe Asia Pacific Other Total
Manufacturing(1) . . . . . . . . . . . . . . . . . . . 7 19 9 3 38
Research and Development . . . . . . . . . . . . 1 — — — 1
Office . . . . . . . . . . . . . . . . . . . . . . . . . . . 1 — — — 1
Total number of facilities . . . . . . . . . . . . . 9 19 9 3 40
(1) Although primarily classified as Manufacturing locations, several sites maintain a large Research and
Development presence located within the same facility.
(2) For management reporting purposes Chassis Systems — Asia Pacific and Other contain several primarily Occupant
Safety Systems facilities including Research and Development Technical Centers and Manufacturing locations.
ITEM 3. LEGAL PROCEEDINGS
The information concerning various claims, lawsuits and administrative proceedings contained in Note 17 of
our consolidated financial statements included in Item 8 of this Report is incorporated herein by reference.
ITEM 4. (REMOVED AND RESERVED)
17

8/3/2019 TRW 2010 Annual Report
http://slidepdf.com/reader/full/trw-2010-annual-report 24/116
PART II
ITEM 5. MARKET FOR REGISTRANT’S COMMON EQUITY, RELATED STOCKHOLDER MATTERS
AND ISSUER PURCHASES OF EQUITY SECURITIES
Our common stock is listed on the New York Stock Exchange under the symbol “TRW”. As of February 9,
2011, we had 122,540,732 shares of common stock, $0.01 par value, outstanding (122,545,400 shares issued less
4,668 shares held as treasury stock) and 89 holders of record of such common stock. The transfer agent and registrar
for our common stock is Computershare Trust Company, N.A.
The tables below show the high and low sales prices for our common stock as reported by the New York Stock
Exchange for each of our fiscal quarters in 2010 and 2009.
High Low High Low
2010 2009
Years Ended December 31,
Price Range of Common Stock
4th Quarter . . . . . . . . . . . . . . . . . . . . . . . . . . . . . . . . . . . . . $54.83 $39.38 $25.52 $14.87
3rd Quarter . . . . . . . . . . . . . . . . . . . . . . . . . . . . . . . . . . . . . 42.07 26.20 20.94 10.91
2nd Quarter . . . . . . . . . . . . . . . . . . . . . . . . . . . . . . . . . . . . . 35.34 24.60 12.20 4.86
1st Quarter . . . . . . . . . . . . . . . . . . . . . . . . . . . . . . . . . . . . . . 30.48 21.30 5.18 1.38
Issuer Purchases of Equity Securities
The independent trustee of our 401(k) plans and similar plans purchases shares in the open market to fund
(i) investments by employees in our common stock, one of the investment options available under such plans, and
(ii) matching contributions in Company stock we provided under certain of such plans. In addition, our stock
incentive plan permits payment of an option exercise price by means of cashless exercise through a broker and
permits the satisfaction of the minimum statutory tax obligations upon exercise of options through stock with-
holding. Further, while our stock incentive plan also permits the satisfaction of the minimum statutory tax
obligations upon the vesting of restricted stock and upon the exercise of stock appreciation rights through stock
withholding, the shares withheld for such purpose are issued directly to us and are then immediately retired and
returned to our authorized but unissued reserve. We do not believe that the foregoing purchases or transactions are
issuer repurchases for the purposes of Item 5 of this Report on Form 10-K.
Dividend Policy
We do not currently pay any cash dividends on our common stock, and instead intend to retain any earnings for
debt repayment, future operations and expansion. The amounts available to us to pay cash dividends are restricted
by our debt agreements. Under TRWAutomotive’s senior credit facilities, we have a limited ability to pay dividends
on our common stock pursuant to a formula based on our consolidated net income after July 4, 2009 and our
leverage ratio as specified in our amended and restated credit agreement. Certain of the indentures governing our
outstanding notes also limit our ability to pay dividends. Any decision to declare and pay dividends in the futurewill
be made at the discretion of our board of directors and will depend on, among other things, our results of operations,
cash requirements, financial condition, contractual restrictions and other factors that our board of directors may
deem relevant.
18

8/3/2019 TRW 2010 Annual Report
http://slidepdf.com/reader/full/trw-2010-annual-report 25/116
Equity Compensation Plan Information
The following table provides information about our equity compensation plans as of December 31, 2010.
Plan Category
Number of Securities to be
Issued Upon Exerciseof Outstanding
Options, Warrantsand Rights
Weighted-AverageExercise Priceof Outstanding
Options, Warrantsand Rights
Number of SecuritiesRemaining
Available forFuture Issuance
Under EquityCompensation Plans(1)
Equity compensation plans approvedby security holders(2) . . . . . . . . . . . 5,195,220 $22.74(3) 4,943,762
Equity compensation plans notapproved by security holders . . . . . . N/A N/A N/A
Total . . . . . . . . . . . . . . . . . . . . . . . 5,195,220 $22.74 4,943,762
(1) Excludes securities reflected in the first column, “Number of Securities to be Issued Upon Exercise of
Outstanding Options, Warrants and Rights.”(2) The Plan was approved by our stockholders prior to our initial public offering.(3) Represents the weighted average exercise price of 3,510,902 outstanding stock options and 529,800 outstand-
ing stock-settled stock appreciation rights as of December 31, 2010. The remaining securities outstanding as of
December 31, 2010 represent 1,154,518 restricted stock units which have no exercise price and have beenexcluded from the calculation of the weighted average exercise price above.
19
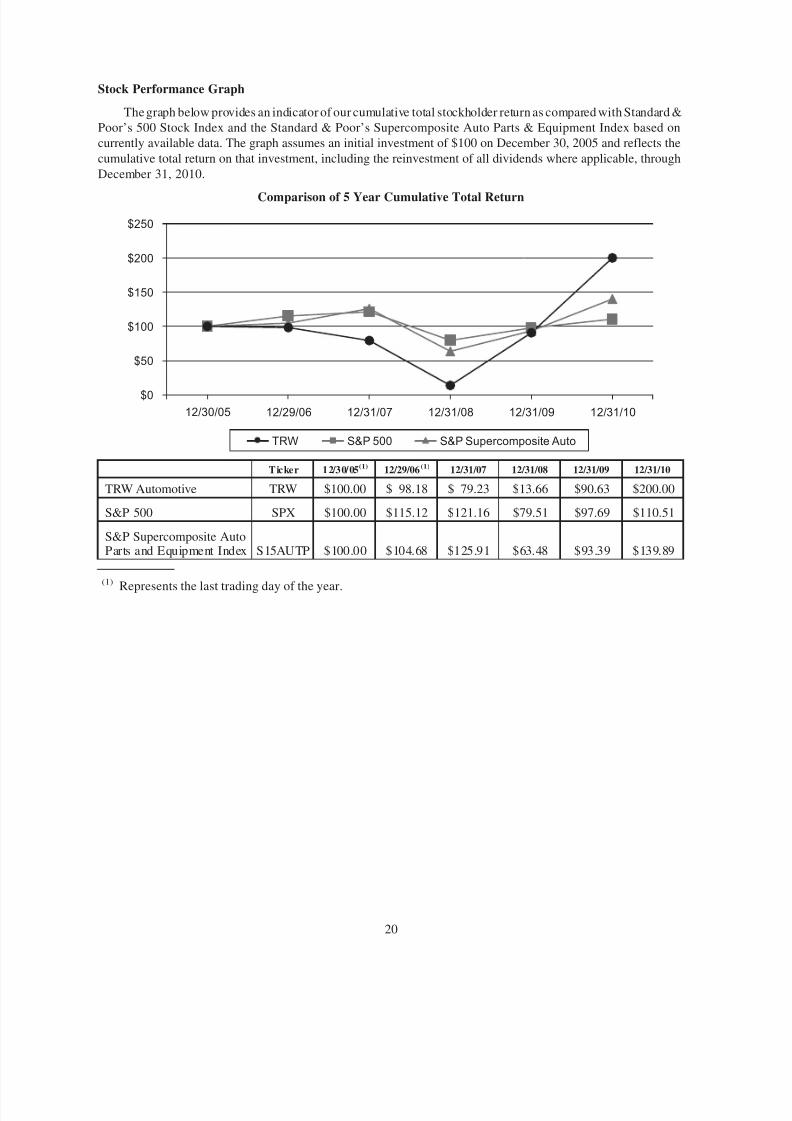
8/3/2019 TRW 2010 Annual Report
http://slidepdf.com/reader/full/trw-2010-annual-report 26/116
Stock Performance Graph
The graph below provides an indicator of our cumulative total stockholder return as compared with Standard &
Poor’s 500 Stock Index and the Standard & Poor’s Supercomposite Auto Parts & Equipment Index based on
currently available data. The graph assumes an initial investment of $100 on December 30, 2005 and reflects the
cumulative total return on that investment, including the reinvestment of all dividends where applicable, through
December 31, 2010.
Comparison of 5 Year Cumulative Total Return
12/31/08 12/31/1012/31/0912/31/0712/29/0612/30/05$0
$50
$150
$100
$250
$200
TRW S&P 500 S&P Supercomposite Auto
Ticker 12/30/05(1) 12/29/06(1) 12/31/07 12/31/08 12/31/09 12/31/10
TRW Automotive TRW $100.00 $ 98.18 $ 79.23 $13.66 $90.63 $200.00
S&P 500 SPX $100.00 $115.12 $121.16 $79.51 $97.69 $110.51
S&P Supercomposite AutoParts and Equipment Index S15AUTP $100.00 $104.68 $125.91 $63.48 $93.39 $139.89
(1)
Represents the last trading day of the year.
20
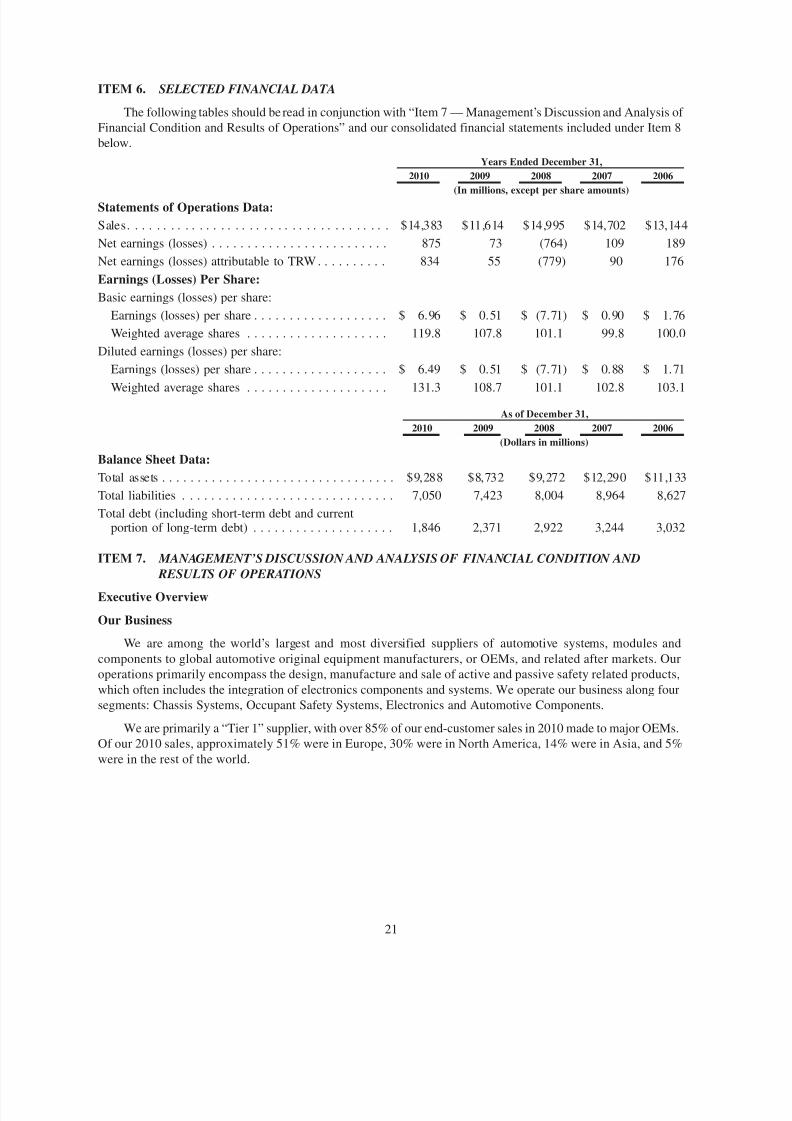
8/3/2019 TRW 2010 Annual Report
http://slidepdf.com/reader/full/trw-2010-annual-report 27/116
ITEM 6. SELECTED FINANCIAL DATA
The following tables should be read in conjunction with “Item 7 — Management’s Discussion and Analysis of
Financial Condition and Results of Operations” and our consolidated financial statements included under Item 8
below.
2010 2009 2008 2007 2006
Years Ended December 31,
(In millions, except per share amounts)
Statements of Operations Data:
Sales. . . . . . . . . . . . . . . . . . . . . . . . . . . . . . . . . . . . . $14,383 $11,614 $14,995 $14,702 $13,144
Net earnings (losses) . . . . . . . . . . . . . . . . . . . . . . . . . 875 73 (764) 109 189
Net earnings (losses) attributable to TRW . . . . . . . . . . 834 55 (779) 90 176
Earnings (Losses) Per Share:
Basic earnings (losses) per share:
Earnings (losses) per share . . . . . . . . . . . . . . . . . . . $ 6.96 $ 0.51 $ (7.71) $ 0.90 $ 1.76
Weighted average shares . . . . . . . . . . . . . . . . . . . . 119.8 107.8 101.1 99.8 100.0
Diluted earnings (losses) per share:
Earnings (losses) per share . . . . . . . . . . . . . . . . . . . $ 6.49 $ 0.51 $ (7.71) $ 0.88 $ 1.71
Weighted average shares . . . . . . . . . . . . . . . . . . . . 131.3 108.7 101.1 102.8 103.1
2010 2009 2008 2007 2006
As of December 31,
(Dollars in millions)
Balance Sheet Data:
Total assets . . . . . . . . . . . . . . . . . . . . . . . . . . . . . . . . . $9,288 $8,732 $9,272 $12,290 $11,133
Total liabilities . . . . . . . . . . . . . . . . . . . . . . . . . . . . . . 7,050 7,423 8,004 8,964 8,627
Total debt (including short-term debt and currentportion of long-term debt) . . . . . . . . . . . . . . . . . . . . 1,846 2,371 2,922 3,244 3,032
ITEM 7. MANAGEMENT’S DISCUSSION AND ANALYSIS OF FINANCIAL CONDITION AND
RESULTS OF OPERATIONS
Executive Overview
Our Business
We are among the world’s largest and most diversified suppliers of automotive systems, modules and
components to global automotive original equipment manufacturers, or OEMs, and related after markets. Our
operations primarily encompass the design, manufacture and sale of active and passive safety related products,
which often includes the integration of electronics components and systems. We operate our business along four
segments: Chassis Systems, Occupant Safety Systems, Electronics and Automotive Components.
We are primarily a “Tier 1” supplier, with over 85% of our end-customer sales in 2010 made to major OEMs.
Of our 2010 sales, approximately 51% were in Europe, 30% were in North America, 14% were in Asia, and 5%
were in the rest of the world.
21

8/3/2019 TRW 2010 Annual Report
http://slidepdf.com/reader/full/trw-2010-annual-report 28/116
Financial Results
For the year ended December 31, 2010:
• Our net sales were $14.4 billion, which represents an increase of 24% from the prior year. The increase in
sales was driven primarily by significantly higher vehicle production volumes in all major geographic
regions.
• We experienced record best operating income, net earnings and operating cash flow, as well as the highestcash on-hand and lowest level of outstanding debt since becoming an independent company in 2003.
— Operating income was $1,184 million compared to $289 million from the prior year. The improvement
in operating results of $895 million resulted primarily from the contribution of higher sales volumes,
positive benefits from ongoing cost reductions as well as our cost containment and restructuring actions
implemented in 2009, lower restructuring charges and fixed and intangible asset impairments and
favorable foreign currency exchange. Also included in operating income was a net gain of $18 million
related to certain pension matters.
— Net earnings attributable to TRW were $834 million as compared to $55 million from the prior year.
This increase of $779 million was primarily the result of the significant improvement in operating
income and, to a lesser extent, lower interest expense, partially offset by increased income tax expense
and a loss on retirement of debt compared to a gain on retirement of debt recognized in the prior year.
— We generated positive operating cash flow of $1,052 million, while capital expenditures were $294 mil-
lion. Our outstanding debt at year end was $1.8 billion, which was a reduction of $525 million from the
prior year end, while our cash on-hand was $1.1 billion, an increase of $290 million from the prior year
end.
Recent Trends and Market Conditions
The automotive industry continued to progress through a gradual recovery during 2010 with the following
primary trends and market conditions impacting our business:
General Economic Conditions:
During 2010, automobile suppliers benefitted from a general improvement in global economic conditions andconsumer demand for vehicles (despite continuing high levels of unemployment) and production requirements
associated with the replenishment of low vehicle inventory levels. The automotive industry as a whole experienced
a modest recovery over the past year, but remains susceptible to the impacts that consumer income and wealth, gas
prices, housing prices and perceptions about global and local economic stability have on consumer spending.
Production Levels:
Vehicle production levels during 2010 continued on a positive trend, and were substantially higher compared
with 2009 primarily due to increased consumer demand and the restocking of depleted inventory levels.
In 2010, approximately 51% of our sales originated in Europe. Despite subdued consumer demand in the
region, vehicle production was stronger than anticipated, primarily as a result of increased exports, the restocking of
depleted inventory levels, and to a lesser extent, continued European automobile scrappage programs during thefirst half of the year. Although the overall trends are improving, uncertainty remains regarding the sustainability of
recent production levels as consumer demand may diminish due to concern over general economic conditions.
In 2010, approximately 30% of our sales originated in North America. The automobile market in this region
experienced higher production levels compared to 2009, primarily attributable to increased consumer demand
resulting from improved consumer sentiment and pent-up demand for durable goods. The extent of the increased
production levels was somewhat suppressed by the continuing high levels of unemployment, concern over the
housing market and availability of credit.
22
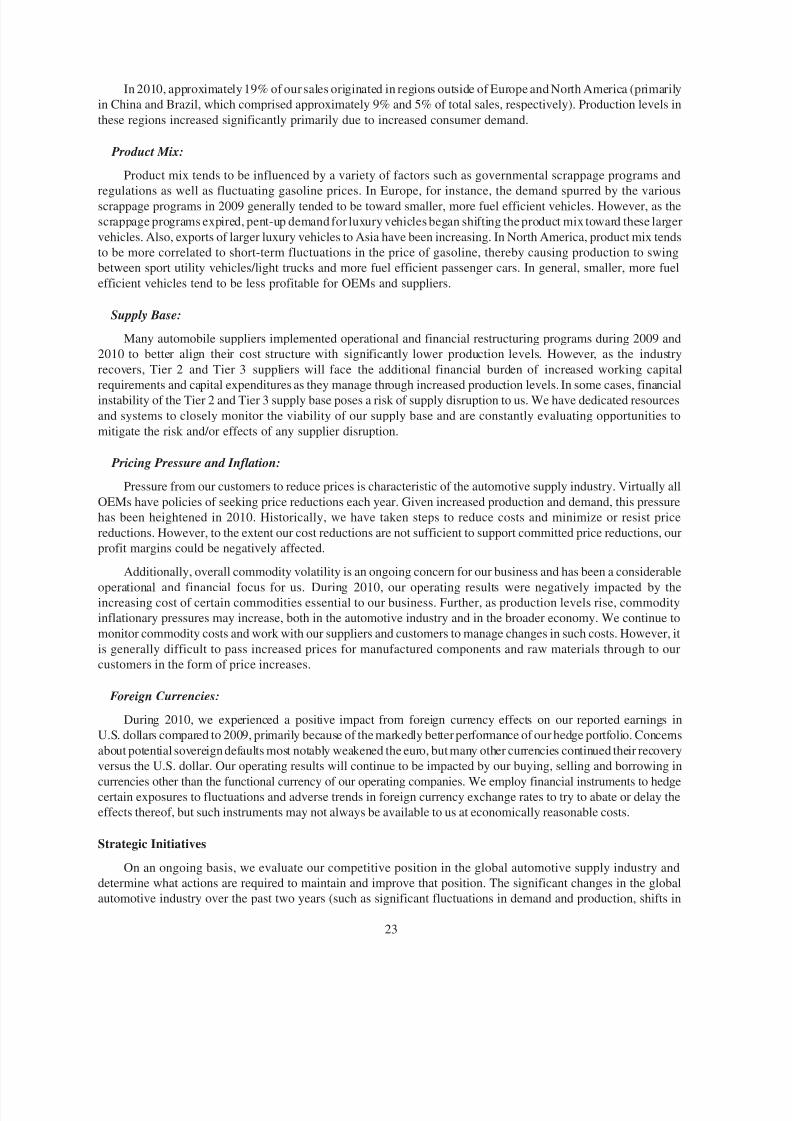
8/3/2019 TRW 2010 Annual Report
http://slidepdf.com/reader/full/trw-2010-annual-report 29/116

8/3/2019 TRW 2010 Annual Report
http://slidepdf.com/reader/full/trw-2010-annual-report 30/116
product mix and industry-wide financial distress) caused us to reevaluate and reconfigure our business to establish a
more appropriate cost and capital structure relative to anticipated production levels.
Throughout 2009 and into 2010, we implemented a number of operational restructuring and cost reduction
initiatives as we managed through the recent economic downturn and gradual recovery. We also completed various
financing transactions to improve the strength and flexibility of our capital structure. As production levels rise, and
considering the significant growth in developing markets such as China and Brazil, we continue to focus on
establishing appropriate levels of capital investment to support anticipated growth and expansion.Our ongoing initiatives are focused on managing costs during periods of increasing production levels,
maintaining discipline on capital expenditures and other discretionary spending and reducing debt.
Although we believe that we have established a firm foundation for continued profitability, we continue to
evaluate our global footprint to ensure that we are properly configured and sized based on changing market
conditions. As such, further plant rationalization and targeted workforce reduction efforts may be warranted.
Our Debt and Capital Structure
During 2010, we continued to focus on improving the strength and flexibility of our capital structure, resulting
in outstanding debt of $1.8 billion and a cash balance of $1.1 billion. We significantly reduced our debt by
optionally repaying in full the $225 million Tranche A-2 Term Loan Facility (the “Term Loan A-2”) and the
$175 million Tranche B-3 Term Loan Facility (the “Term Loan B-3”), and by repurchasing $152 million in principalof our senior unsecured notes with cash on hand.
As market conditions warrant, we and our major equity holders, including The Blackstone Group L.P. and its
affiliates, may from time to time repurchase debt securities issued by the Company or its subsidiaries, in privately
negotiated or open market transactions, by tender offer, exchange offer, or otherwise.
See “LIQUIDITYAND CAPITAL RESOURCES” below and Note 11 to our consolidated financial statements
included in Item 8 of this Report for further information.
Critical Accounting Estimates
The critical accounting estimates that affect our financial statements and that use judgments and assumptions
are listed below. Materially different amounts could be reported under varied conditions and assumptions.
Goodwill. Goodwill, which represents the excess of cost over the fair value of the net assets of businesses
acquired, was approximately $1,761 million as of December 31, 2010, or 19% of our total assets.
In accordance with Accounting Standards Codification (“ASC”) 350, “Intangibles — Goodwill and Other,” we
perform impairment testing at a reporting unit level on at least an annual basis. To test goodwill for impairment, we
estimate the fair value of each reporting unit and compare the fair value to the carrying value. If the carrying value
exceeds the fair value, then a possible impairment of goodwill exists and requires further evaluation. Fair values are
based on the cash flows projected in the reporting units’ strategic plans and long-range planning forecasts,
discounted at a risk-adjusted rate of return. Revenue growth rates included in the plans are generally based on
industry specific data. We use external vehicle build assumptions published by widely used external sources and
market share data by customer based on known and targeted awards over a five-year period. The projected profit
margin assumptions included in the plans are based on the current cost structure, anticipated price givebacks
provided to our customers and cost reductions/increases. If different assumptions were used in these plans, the
related cash flows used in measuring fair value could be different and impairment of goodwill might be required tobe recorded.
See Note 5 to our consolidated financial statements included in Item 8 of this Report for further information on
our annual impairment analysis of goodwill.
Impairment of Long-Lived and Intangible Assets. We evaluate long-lived assets and definite-lived intangible
assets for impairment when events and circumstances indicate that the assets may be impaired and the projected
undiscounted cash flows to be generated by those assets are less than their carrying value. If the undiscounted cash
24

8/3/2019 TRW 2010 Annual Report
http://slidepdf.com/reader/full/trw-2010-annual-report 31/116
flows are less than the carrying value of the assets, the assets are written down to their fair value. Fair value is
determined using projected discounted cash flows or appraisals.
We test our trademark indefinite-lived intangible assets for impairment on at least an annual basis, or when
events and circumstances indicate that the indefinite-lived intangible assets may be impaired, by comparing the fair
values to the carrying values. If the carrying value exceeds the fair value, the asset is written down to its fair value.
Fair value is determined utilizing the relief from royalty method, which is based on projected cash flows, discounted
at a risk-adjusted rate of return.See Notes 5 and 12 to our consolidated financial statements included in Item 8 of this Report for further
information on our annual impairment analysis of intangibles and our evaluation of long-lived assets for impair-
ment, respectively.
Product Recalls. We are at risk for product recall costs. Recall costs are costs incurred when a customer or we
decide to recall a product through a formal campaign, soliciting the return of specific products due to a known or
suspected safety concern. In addition, NHTSA has the authority, under certain circumstances, to require recalls to
remedy safety concerns. Product recall costs typically include the cost of the product being replaced, customer cost
of the recall and labor to remove and replace the defective part.
Recall costs are recorded based on management estimates developed utilizing actuarially established loss
projections based on historical claims data. Based on this actuarial estimation methodology, we accrue for expected
but unannounced recalls when revenues are recognized upon shipment of product. In addition, as recalls are
announced, we review the actuarial estimation methodology and make appropriate adjustments to the accrual, if
necessary.
Valuation Allowances on Deferred Income Tax Assets
We review the likelihood that we will realize the benefit of our deferred tax assets and therefore the need for
valuation allowances on a quarterly basis, or more frequently if events indicate that a review is required. In
determining the requirement for a valuation allowance, the historical and projected financial results of the legal
entity or consolidated group recording the net deferred tax asset is considered, along with all other available positive
and negative evidence. The factors considered in our determination of the probability of the realization of the
deferred tax assets include: historical taxable income, projected future taxable income, the expected timing of the
reversals of existing temporary differences and tax planning strategies. If, based upon the weight of available
evidence, it is more likely than not the deferred tax assets will not be realized, a valuation allowance is recorded. We
believe it is more likely than not that the net deferred tax asset in the United States and certain foreign jurisdictions
may not be realized in the future. Accordingly, we continue to maintain a valuation allowance related to the net
deferred tax assets in the United States and certain foreign jurisdictions.
There is no corresponding income tax benefit recognized with respect to losses incurred and no corresponding
income tax expense recognized with respect to earnings generated in jurisdictions with a valuation allowance. This
causes variability in our effective tax rate. We intend to maintain the valuation allowance until it is more likely than
not that the net deferred tax asset will be realized. If operating results improve or deteriorate on a sustained basis,
our conclusions regarding the need for a valuation allowance could change, resulting in either the reversal or initial
recognition of a valuation allowance in the future, which could have a significant impact on income tax expense in
the period recognized and subsequent periods.
As part of the review in determining the need for a valuation allowance, we assess the potential release of
existing valuation allowances. Based upon this assessment, we have concluded that there is more than a remotepossibility that the existing valuation allowance on our U.S. net deferred tax assets could be released. As of
December 31, 2010, the U.S. valuation allowance is approximately $500 million. If such a release of the valuation
allowance occurs, it will have a significant impact on net income in the quarter in which it is deemed appropriate to
release the reserve.
Environmental. Governmental regulations relating to the discharge of materials into the environment, or
otherwise relating to the protection of the environment, have had, and will continue to have, an effect on our
operations. We have made and continue to make expenditures for projects relating to the environment, including
25

8/3/2019 TRW 2010 Annual Report
http://slidepdf.com/reader/full/trw-2010-annual-report 32/116
pollution control devices for new and existing facilities. We are conducting a number of environmental inves-
tigations and remedial actions at current and former locations to comply with applicable requirements and, along
with other companies, have been named a potentially responsible party for certain waste management sites.
A reserve estimate for each matter is established using standard engineering cost estimating techniques on an
undiscounted basis. In the determination of such costs, consideration is given to the professional judgment of our
environmental engineers, in consultation with outside environmental specialists when necessary. At multi-party
sites, the reserve estimate also reflects the expected allocation of total project costs among the various potentiallyresponsible parties. Each of the environmental matters is subject to various uncertainties, and some of these matters
may be resolved unfavorably to us. We believe that any liability, in excess of amounts accrued in our consolidated
financial statements, that may result from the resolution of these matters for which sufficient information is
available to support cost estimates, will not have a material adverse affect on our financial position, results of
operations or cash flows. However, we cannot predict the effect on our financial position, results of operations or
cash flows for aspects of certain matters for which there is insufficient information. Further, we cannot predict the
effect of compliance with environmental laws and regulations with respect to unknown environmental matters.
Pensions. We account for our defined benefit pension plans in accordance with ASC 715 “Compensation —
Retirement Benefits,” which requires that amounts recognized in financial statements be determined on an actuarial
basis. This determination involves the selection of various assumptions, including expected rates of return on plan
assets and discount rates.
A key assumption in determining our net pension expense in accordance with ASC 715 is the expected long-
term rate of return on plan assets. The expected return on plan assets that is included in pension expense is
determined by applying the expected long-term rate of return on assets to a calculated market-related value of plan
assets, which recognizes changes in the fair value of plan assets in a systematic manner over five years. Asset gains
and losses will be amortized over five years in determining the market-related value of assets used to calculate the
expected return component of pension income. We review our long-term rate of return assumptions annually
through comparison of our historical actual rates of return with our expectations, and consultation with our actuaries
and investment advisors regarding their expectations for future returns. While we believe our assumptions of future
returns are reasonable and appropriate, significant differences in our actual experience or significant changes in our
assumptions may materially affect our pension obligations and our future pension expense. The weighted average
expected long-term rate of return on assets used to determine net periodic benefit cost was 6.76% for 2010 as
compared to 6.97% for each of the years 2009 and 2008.
Another key assumption in determining our net pension expense is the assumed discount rate to be used to
discount plan liabilities. The discount rate reflects the current rate at which the pension liabilities could be
effectively settled. In estimating this rate, we look to rates of return on high quality, fixed-income investments that
receive one of the highest ratings given by a recognized ratings agency, and that have cash flows similar to those of
the underlying benefit obligation. The weighted average discount rate used to calculate the benefit obligations as of
December 31, 2010 was 5.49% as compared to 5.73% as of December 31, 2009. The weighted average discount rate
used to determine net periodic benefit cost for 2010 was 5.73% as compared to 6.42% for 2009 and 5.74% for 2008.
Based on our assumptions as of December 31, 2010, the measurement date, a change in these assumptions,
holding all other assumptions constant, would have the following effect on our pension costs and obligations on an
annual basis:
U.S. U.K.All
Other U.S. U.K.All
Other
Increase DecreaseImpact on Net Periodic Benefit Cost
(Dollars in millions)
.25% change in discount rate . . . . . . . . . . . . . . . . . . . . $— $ 2 $(1) $2 $ ( 3) $1
.25% change in expected long-term rate of return . . . . . (2) (13) (1) 2 13 1
26

8/3/2019 TRW 2010 Annual Report
http://slidepdf.com/reader/full/trw-2010-annual-report 33/116
U.S. U.K.All
Other U.S. U.K.All
Other
Increase Decrease
Impact on Obligations
(Dollars in millions)
.25% change in discount rate . . . . . . . . . . . . . . . . . $(37) $(143) $(23) $38 $148 $24
ASC 715 and the policies we have used (most notably the use of a calculated value of plan assets for pensions
as described above and the use of the minimum corridor approach to amortize gains and losses) generally reduce thevolatility of pension expense that would otherwise result from changes in the value of the pension plan assets and
pension liability discount rates. A substantial portion of our pension benefits relate to our plans in the United States
and the United Kingdom.
During 2010 and 2009, certain amendments reducing future benefits for salaried and nonunion employees
were adopted that will reduce future service costs. Our 2011 pension income is estimated to be approximately
$9 million in the U.S. and $96 million in the U.K., while our pension expense is estimated to be approximately
$42 million for the rest of the world (based on December 31, 2010 exchange rates). During 2011, our minimum
expected funding is approximately $1 million for U.S. pension plans and $41 million for pension plans in the rest of
the world, however, we may, at our discretion, make additional contributions.
In respect of the U.K. Pension Plan (the “U.K. Plan”), the March 31, 2009 triennial funding valuation was
completed and filed in June 2010. The valuation reflected a deficit of $814 million. Since the valuation date, a
number of actions were undertaken to reduce this deficit including the cessation of future benefit accruals as of
September 30, 2009, and the transfer of $63 million to the U.K. Plan from a separate and unrelated trust. As a result
of these actions and favorable movements in financial markets, the deficit as of October 31, 2010, as estimated by
the U.K. Plan’s actuary, was $620 million. In 2010, we entered into discussions with the plan fiduciaries/trustees
relative to a deficit recovery plan culminating in our agreement to make annual contributions of £20 million to the
U.K. Plan through March 2019. These contributions, in conjunction with investment performance, are expected to
eliminate the deficit by that date. In addition to the 2010 payment, we accelerated the contributions otherwise due in
2011 and 2012 into 2010, resulting in total contributions of £60 million, or $93 million. Required contributions to
the U.K. Plan will resume in 2013, however we may, at our discretion, make contributions during 2011 and 2012.
Other Postretirement Benefits. We account for our postemployment benefits other than pensions (“OPEB”)
in accordance with ASC 715 which requires that amounts recognized in financial statements be determined on an
actuarial basis. This determination involves the selection of various assumptions, including a discount rate and
health care cost trend rates used to value benefit obligations. The discount rate reflects the current rate at which the
OPEB liabilities could be effectively settled at the end of the year. In estimating this rate, we look to rates of return
on high quality, fixed-income investments that receive one of the highest ratings given by a recognized ratings
agency and that have cash flows similar to those of the underlying benefit obligation. We develop our estimate of the
health care cost trend rates used to value the benefit obligation through review of our recent health care cost trend
experience and through discussions with our actuary regarding the experience of similar companies. Changes in the
assumed discount rate or health care cost trend rate can have a significant impact on our actuarially determined
liability and related OPEB expense.
The following are the significant assumptions used in the measurement of the accumulated projected benefit
obligation (“APBO”) as of the measurement date for each year:
U.S.
Rest of
World U.S.
Rest of
World
2010 2009
Discount rate. . . . . . . . . . . . . . . . . . . . . . . . . . . . . . . . . . . . . . . . 5.50% 5.50% 6.00% 5.75%
Initial health care cost trend rate at end of year . . . . . . . . . . . . . . 7.63% 7.50% 8.00% 8.00%
Ultimate health care cost trend rate . . . . . . . . . . . . . . . . . . . . . . . 5.00% 5.00% 5.00% 5.00%
Year in which ultimate rate is reached . . . . . . . . . . . . . . . . . . . . . 2018 2015 2018 2015
Based on our assumptions as of December 31, 2010, the measurement date, a change in these assumptions, holding
all other assumptions constant, would have the following effect on our OPEB expense and obligation on an annual basis.
27
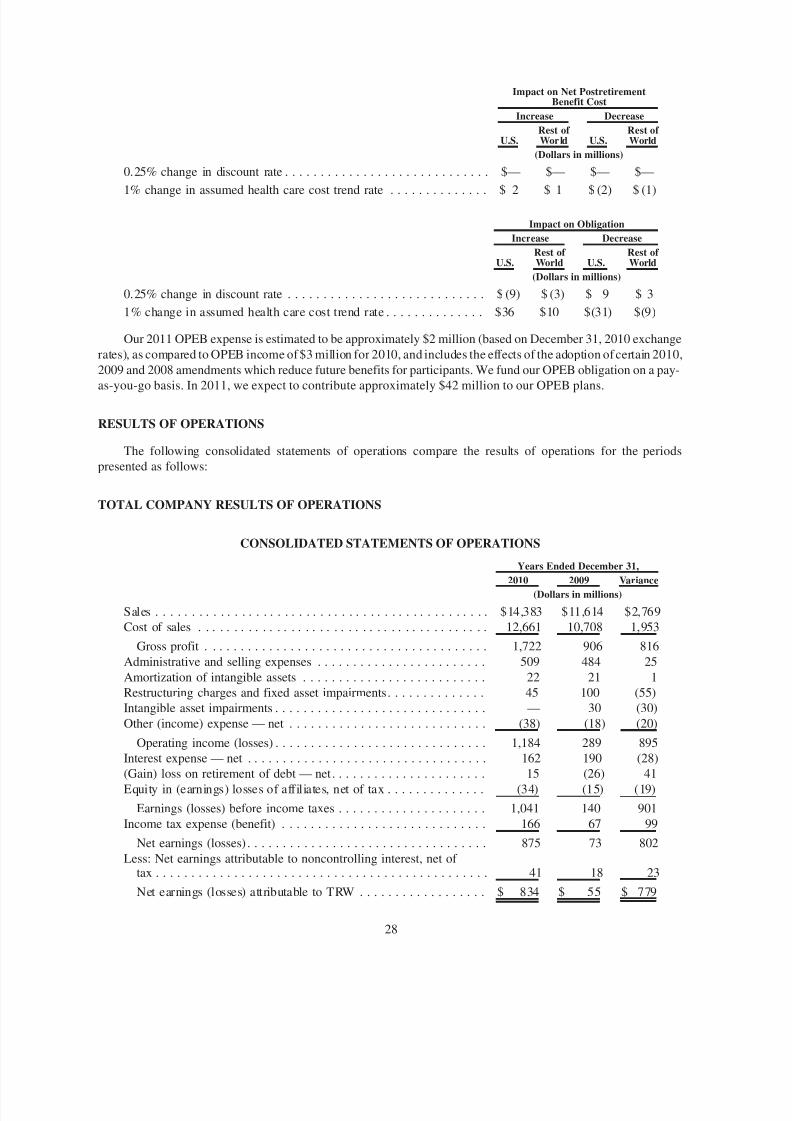
8/3/2019 TRW 2010 Annual Report
http://slidepdf.com/reader/full/trw-2010-annual-report 34/116
U.S.Rest of World U.S.
Rest of World
Increase Decrease
Impact on Net PostretirementBenefit Cost
(Dollars in millions)
0.25% change in discount rate . . . . . . . . . . . . . . . . . . . . . . . . . . . . . $— $— $— $—
1% change in assumed health care cost trend rate . . . . . . . . . . . . . . $ 2 $ 1 $ (2) $ (1)
U.S.Rest of World U.S.
Rest of World
Increase Decrease
Impact on Obligation
(Dollars in millions)
0.25% change in discount rate . . . . . . . . . . . . . . . . . . . . . . . . . . . . $ (9) $ (3) $ 9 $ 3
1% change in assumed health care cost trend rate . . . . . . . . . . . . . . $36 $10 $(31) $(9)
Our 2011 OPEB expense is estimated to be approximately $2 million (based on December 31, 2010 exchange
rates), as compared to OPEB income of $3 million for 2010, and includes the effects of the adoption of certain 2010,
2009 and 2008 amendments which reduce future benefits for participants. We fund our OPEB obligation on a pay-
as-you-go basis. In 2011, we expect to contribute approximately $42 million to our OPEB plans.
RESULTS OF OPERATIONS
The following consolidated statements of operations compare the results of operations for the periods
presented as follows:
TOTAL COMPANY RESULTS OF OPERATIONS
CONSOLIDATED STATEMENTS OF OPERATIONS
2010 2009 Variance
Years Ended December 31,
(Dollars in millions)
Sales . . . . . . . . . . . . . . . . . . . . . . . . . . . . . . . . . . . . . . . . . . . . . . . $14,383 $11,614 $2,769
Cost of sales . . . . . . . . . . . . . . . . . . . . . . . . . . . . . . . . . . . . . . . . . 12,661 10,708 1,953
Gross profit . . . . . . . . . . . . . . . . . . . . . . . . . . . . . . . . . . . . . . . . 1,722 906 816
Administrative and selling expenses . . . . . . . . . . . . . . . . . . . . . . . . 509 484 25
Amortization of intangible assets . . . . . . . . . . . . . . . . . . . . . . . . . . 22 21 1
Restructuring charges and fixed asset impairments. . . . . . . . . . . . . . 45 100 (55)
Intangible asset impairments . . . . . . . . . . . . . . . . . . . . . . . . . . . . . . — 30 (30)
Other (income) expense — net . . . . . . . . . . . . . . . . . . . . . . . . . . . . (38) (18) (20)
Operating income (losses) . . . . . . . . . . . . . . . . . . . . . . . . . . . . . . 1,184 289 895
Interest expense — net . . . . . . . . . . . . . . . . . . . . . . . . . . . . . . . . . . 162 190 (28)
(Gain) loss on retirement of debt — net . . . . . . . . . . . . . . . . . . . . . . 15 (26) 41
Equity in (earnings) losses of affiliates, net of tax . . . . . . . . . . . . . . (34) (15) (19)
Earnings (losses) before income taxes . . . . . . . . . . . . . . . . . . . . . 1,041 140 901
Income tax expense (benefit) . . . . . . . . . . . . . . . . . . . . . . . . . . . . . 166 67 99
Net earnings (losses) . . . . . . . . . . . . . . . . . . . . . . . . . . . . . . . . . . 875 73 802
Less: Net earnings attributable to noncontrolling interest, net of tax . . . . . . . . . . . . . . . . . . . . . . . . . . . . . . . . . . . . . . . . . . . . . . . 41 18 23
Net earnings (losses) attributable to TRW . . . . . . . . . . . . . . . . . . $ 834 $ 55 $ 779
28

8/3/2019 TRW 2010 Annual Report
http://slidepdf.com/reader/full/trw-2010-annual-report 35/116
Comparison of the Year Ended December 31, 2010 to the Year Ended December 31, 2009
Sales for the year ended December 31, 2010 increased by $2,769 million as compared to the year ended
December 31, 2009. The increase in sales was driven primarily by favorable volume (net of price reductions
provided to customers) of $2,860 million, which is mainly due to increased vehicle production in all major
geographic regions. Partially offsetting this favorable variance is the unfavorable impact of foreign currency
exchange of $91 million.
Gross profit for the year ended December 31, 2010 increased by $816 million as compared to the year endedDecember 31, 2009. The increase in gross profit was driven primarily by increased volume (net of adverse mix) of
$688 million, cost reductions (partially offset by inflation and price reductions provided to customers) of
$145 million and the positive effect of foreign currency exchange of $26 million. Partially offsetting these
favorable items were the non-recurrence of certain customer related settlements of $25 million, the non-recurrence
of the reversal of accruals in the prior period related to certain benefit programs at several European facilities of
$6 million, higher engineering costs related to increased production of $6 million, and higher pension and
postretirement benefit costs of $5 million, net of a $26 million gain on curtailment of the U.S. salaried pension plan.
Gross profit as a percentage of sales for the year ended December 31, 2010 was 12.0% compared to 7.8% for the
year ended December 31, 2009.
Administrative and selling expenses for the year ended December 31, 2010 increased by $25 million as
compared to the year ended December 31, 2009. The increase was driven primarily by higher inflation and other
costs in excess of cost reductions, together which net to $35 million, and an expense related to the settlement of certain supplemental retirement plans of $9 million. Partially offsetting the increase in administrative and selling
expenses was lower pension and post retirement benefit expense of $12 million, which includes a gain on
curtailment related to the U.S. salaried pension plan of $9 million. Foreign currency exchange also had a favorable
impact of $6 million. Administrative and selling expenses as a percentage of sales for the year ended December 31,
2010 were 3.5% as compared to 4.2% for the year ended December 31, 2009.
Restructuring charges and fixed asset impairmentsdecreased by $55 million for the year ended December 31,
2010 compared to the year ended December 31, 2009. This was primarily driven by lower severance and other
charges of $45 million, reduced fixed asset impairments of $14 million, and a gain on the sale of a restructured
property in the amount of $4 million. The decrease was offset by lower net curtailment gains of $8 million.
Intangible asset impairments were $30 million for the year ended December 31, 2009. During the first quarter
of 2009, due to the negative economic and industry conditions, impairment charges of $30 million were recorded asa result of testing the recoverability of our trademark intangible assets.
Other income — net improved by $20 million for the year ended December 31, 2010 as compared to the year
ended December 31, 2009. This was primarily due to favorable foreign currency exchange of $21 million, a
favorable variance in the marking to market of forward electricity purchase contracts of $18 million and a decline in
the provision for bad debts of $9 million. These improvements were partially offset by a decrease in royalty and
grant income of $12 million, litigation charges related to a legacy pension matter of $8 million, and a decrease in
other miscellaneous income of $7 million.
Interest expense — net decreased by $28 million for the year ended December 31, 2010 compared to the year
ended December 31, 2009, primarily as the result of lower overall debt levels.
Loss on retirement of debt was $15 million for the year ended December 31, 2010. We repurchased
$152 million in principal amount of our senior unsecured notes and recorded a loss on retirement of debt of $10 million, which included the write-off of a portion of related deferred debt issuance costs. In addition, as a result
of the full repayment of the Term Loan A-2 and Term Loan B-3, we recorded a loss on retirement of debt of
$5 million relating to the write-off of deferred debt issuance costs and the acceleration of interest rate swap losses
that had been included in other comprehensive income.
Income tax expense for the year ended December 31, 2010 was $166 million on pre-tax earnings of
$1,041 million as compared to income tax expense of $67 million on pre-tax earnings of $140 million for the
year ended December 31, 2009. Income tax expense for the year ended December 31, 2010 includes a benefit of
29

8/3/2019 TRW 2010 Annual Report
http://slidepdf.com/reader/full/trw-2010-annual-report 36/116
$12 million resulting from changes in determinations relating to the potential realization of deferred tax assets and
the resulting reversal of a valuation allowance on net deferred tax assets in certain foreign subsidiaries. Income tax
expense for the year ended December 31, 2010 also includes a benefit of $24 million related to the favorable
resolution of various tax matters in foreign jurisdictions. Income tax expense for the year ended December 31, 2009
includes a charge of approximately $33 million resulting from changes in determinations relating to the potential
realization of deferred tax assets in certain foreign subsidiaries. The income tax rate varies from the United States
statutory income tax rate due primarily to the items noted above and the impact of results in the United States and
certain foreign jurisdictions that are currently in a valuation allowance position for which pre-tax earnings or lossesdo not result in the recognition of a corresponding income tax expense or benefit, as well as favorable foreign tax
rates, holidays, and credits.
CONSOLIDATED STATEMENTS OF OPERATIONS
2009 2008 Variance
Years Ended December 31,
(Dollars in millions)
Sales . . . . . . . . . . . . . . . . . . . . . . . . . . . . . . . . . . . . . . . . . . . . . . . $11,614 $14,995 $(3,381)
Cost of sales . . . . . . . . . . . . . . . . . . . . . . . . . . . . . . . . . . . . . . . . . 10,708 13,977 (3,269)
Gross profit . . . . . . . . . . . . . . . . . . . . . . . . . . . . . . . . . . . . . . . . 906 1,018 (112)
Administrative and selling expenses . . . . . . . . . . . . . . . . . . . . . . . . 484 523 (39)Amortization of intangible assets . . . . . . . . . . . . . . . . . . . . . . . . . . 21 31 (10)
Restructuring charges and fixed asset impairments . . . . . . . . . . . . . 100 145 (45)
Goodwill impairments . . . . . . . . . . . . . . . . . . . . . . . . . . . . . . . . . . — 458 (458)
Intangible asset impairments . . . . . . . . . . . . . . . . . . . . . . . . . . . . . . 30 329 (299)
Other (income) expense — net . . . . . . . . . . . . . . . . . . . . . . . . . . . . (18) — (18)
Operating income (losses) . . . . . . . . . . . . . . . . . . . . . . . . . . . . . . 289 (468) 757
Interest expense — net . . . . . . . . . . . . . . . . . . . . . . . . . . . . . . . . . . 190 184 6
(Gain) loss on retirement of debt — net . . . . . . . . . . . . . . . . . . . . . (26) — (26)
Equity in (earnings) losses of affiliates, net of tax . . . . . . . . . . . . . . (15) (14) (1)
Earnings (losses) before income taxes . . . . . . . . . . . . . . . . . . . . . 140 (638) 778
Income tax expense (benefit) . . . . . . . . . . . . . . . . . . . . . . . . . . . . . 67 126 (59)
Net earnings (losses) . . . . . . . . . . . . . . . . . . . . . . . . . . . . . . . . . . 73 (764) 837
Less: Net earnings attributable to noncontrolling interest, net of tax . . . . . . . . . . . . . . . . . . . . . . . . . . . . . . . . . . . . . . . . . . . . . . . 18 15 3
Net earnings (losses) attributable to TRW . . . . . . . . . . . . . . . . . . $ 55 $ (779) $ 834
Comparison of the Year Ended December 31, 2009 to the Year Ended December 31, 2008
Sales for the year ended December 31, 2009 decreased by $3,381 million as compared to the year ended
December 31, 2008. The decrease in sales was driven primarily by lower volume and, to a much lesser degree, price
reductions provided to customers, which combined totaled $2,511 million. The lower volume was attributed to a
decline in light vehicle production volumes in all major geographic regions. Foreign currency exchange also had a
net unfavorable impact on sales of $870 million due to the relative strength of the dollar against other currencies(most notably the euro).
Gross profit for the year ended December 31, 2009 decreased by $112 million as compared to the year ended
December 31, 2008. The decrease in gross profit was driven primarily by lower volume and adverse mix, together
which totaled $698 million, and the net unfavorable impact of foreign currency exchange of $110 million. Also
contributing to the decrease in gross profit were higher warranty expense of $29 million and the non-recurrence of
net insurance recoveries of $17 million related to a business disruption at our brake line production facility in South
America in the prior year. These unfavorable variances were partially offset by cost reductions (in excess of
30

8/3/2019 TRW 2010 Annual Report
http://slidepdf.com/reader/full/trw-2010-annual-report 37/116
inflation and price reductions provided to customers) of $626 million, which includes the benefit of recently enacted
restructuring and downturn management actions. Also offsetting the decrease in gross profit was lower pension and
postretirement benefit expense of $82 million which includes an increase of $11 million of net settlement gains.
Further mitigating the decrease in gross profit were the favorable impact of certain customer related settlements of
$17 million, contractual settlements related to a recent acquisition of $8 million and the reversal of accruals related
to certain benefit programs at several of our European facilities of $6 million. Gross profit as a percentage of sales
for the year ended December 31, 2009 was 7.8% compared to 6.8% for the year ended December 31, 2008.
Administrative and selling expenses for the year ended December 31, 2009 decreased by $39 million as
compared to the year ended December 31, 2008. The decrease was driven primarily by cost reductions in excess of
inflation and other costs, which in total net to $26 million, and the favorable impact of foreign currency exchange of
$19 million. These items were partially offset by an increase in pension and postretirement benefit expense of
$7 million primarily driven by lower net settlement gains of $4 million. Administrative and selling expenses as a
percentage of sales for the year ended December 31, 2009 were 4.2% as compared to 3.5% for the year ended
December 31, 2008.
Restructuring charges and fixed asset impairmentsdecreased by $45 million for the year ended December 31,
2009 compared to the year ended December 31, 2008. Net fixed asset impairments decreased by $70 million, as
general economic and industry conditions improved in 2009 compared to 2008. This decrease was offset by an
increase in severance and other charges of $23 million and decrease in net curtailment gains of $2 million.
Goodwill impairments were $458 million for the year ended December 31, 2008. On October 31, 2008, werecognized full impairment of goodwill in the three reporting units within our Automotive Components segment.
No similar charges were required in 2009.
Intangible asset impairmentsdecreased by $299 million for the year ended December 31, 2009 compared to
the year ended December 31, 2008. During the first quarter of 2009, we recorded an impairment loss on its
trademark of $30 million. During the fourth quarter of 2008, we recorded impairment charges of $329 million as a
result of testing the recoverability of our customer relationships.
Other income — net improved by $18 million for the year ended December 31, 2009 as compared to the year
ended December 31, 2008. This was primarily due to a reduction in foreign currency exchange losses of $26 million
and an increase in royalty and grant income of $5 million. These positive variances were partially offset by a
decrease in miscellaneous other income of $9 million, an unfavorable change in net provision for bad debts of
$3 million, and a decrease in net gain on sales of assets of $1 million.
Interest expense — net increased by $6 million for the year ended December 31, 2009 compared to the year
ended December 31, 2008, primarily as the result of lower interest income and higher borrowing margins under the
prior credit agreement, which became effective on June 24, 2009, largely offset by lower interest rates on our
variable rate debt.
Gain on retirement of debt was $26 million for the year ended December 31, 2009. We repurchased $57 million
in principal amount of our senior unsecured notes issued in 2007 and recorded a gain on retirement of debt of
$41 million, offset by $6 million of debt issuance costs written off relating to entering into our prior credit
agreement. In addition, as a result of the full repayment of the term loan A-1 and term loan B-1, we recorded a loss
on retirement of debt of approximately $9 million relating to the write-off of debt issuance costs.
Income tax expense for the year ended December 31, 2009 was $67 million on pre-tax earnings of $140 million
as compared to income tax expense of $126 million on a pre-tax loss of $638 million for the year ended
December 31, 2008. Income tax expense for the year ended December 31, 2009 includes a charge of $33 millionresulting from changes in determinations relating to the potential realization of deferred tax assets in certain foreign
subsidiaries. Income tax expense for the year ended December 31, 2008 includes a net charge of approximately
$15 million resulting from changes in determinations relating to the potential realization of deferred tax assets in
certain foreign subsidiaries. The income tax rate varies from the United States statutory income tax rate due
primarily to the items noted above and the impact of results in the United States and certain foreign jurisdictions that
are currently in a valuation allowance position for which pre-tax earnings or losses do not result in the recognition of
a corresponding income tax expense or benefit, as well as favorable foreign tax rates, holidays, and credits.
31

8/3/2019 TRW 2010 Annual Report
http://slidepdf.com/reader/full/trw-2010-annual-report 38/116
SEGMENT RESULTS OF OPERATIONS
The following tables reconcile segment sales and earnings (losses) before taxes to consolidated sales and
earnings (losses) before taxes for 2010, 2009, and 2008. See Note 18 to our consolidated financial statements
included in Item 8 of this Report for a description of segment earnings (losses) before taxes for the periods
presented.
Segment Results of OperationsSales, Including Intersegment Sales
2010 2009 20082010 vs. 2009
Variance2009 vs. 2008
Variance
Years Ended December 31,
(Dollars in millions)
Chassis Systems . . . . . . . . . . . . . . . . . . . . . . . $ 8 ,577 $ 6 ,856 $ 8 ,545 $1,721 $(1,689)
Occupant Safety Systems . . . . . . . . . . . . . . . . . 3,482 2,922 3,823 560 (901)
Electronics . . . . . . . . . . . . . . . . . . . . . . . . . . . 1,150 864 1,184 286 (320)
Automotive Components . . . . . . . . . . . . . . . . . 1,707 1,341 1,889 366 (548)
Intersegment eliminations . . . . . . . . . . . . . . . . (533) (369) (446) (164) 77
Total sales . . . . . . . . . . . . . . . . . . . . . . . . . . $14,383 $11,614 $14,995 $2,769 $(3,381)
Earnings (Losses) Before Taxes
2010 2009 20082010 vs. 2009
Variance2009 vs. 2008
Variance
Years Ended December 31,
(Dollars in millions)
Chassis Systems . . . . . . . . . . . . . . . . . . . . . . . . . . . . $ 660 $ 211 $ 144 $449 $ 67
Occupant Safety Systems . . . . . . . . . . . . . . . . . . . . . 373 138 (42) 235 180
Electronics . . . . . . . . . . . . . . . . . . . . . . . . . . . . . . . . 138 47 111 91 (64)
Automotive Components . . . . . . . . . . . . . . . . . . . . . 72 (56) (592) 128 536
Segment earnings (losses) before taxes . . . . . . . . . 1,243 340 (379) 903 719
Corporate expense and other . . . . . . . . . . . . . . . . . . . (66) (54) (90) (12) 36
Financing costs . . . . . . . . . . . . . . . . . . . . . . . . . . . . (162) (190) (184) 28 (6)
Gain (loss) on retirement of debt — net . . . . . . . . . . (15) 26 — (41) 26
Net earnings attributable to noncontrolling interest,net of tax . . . . . . . . . . . . . . . . . . . . . . . . . . . . . . . 41 18 15 23 3
Earnings (losses) before income taxes . . . . . . . . . . $1,041 $ 140 $(638) $901 $778
Restructuring Charges and Asset Impairments Included in Earnings (Losses) Before Taxes
2010 2009 20082010 vs. 2009
Variance2009 vs. 2008
Variance
Years Ended December 31,
(Dollars in millions)Chassis Systems . . . . . . . . . . . . . . . . . . . . . . . . . . . . $10 $ 59 $ 89 $(49) $ (30)
Occupant Safety Systems . . . . . . . . . . . . . . . . . . . . . 23 19 217 4 (198)
Electronics . . . . . . . . . . . . . . . . . . . . . . . . . . . . . . . . (1) 4 4 (5) —
Automotive Components . . . . . . . . . . . . . . . . . . . . . . 12 21 621 (9) (600)
Corporate . . . . . . . . . . . . . . . . . . . . . . . . . . . . . . . . . 1 27 1 (26) 26
Total restructuring charges and asset impairments. . $45 $130 $932 $(85) $(802)
32

8/3/2019 TRW 2010 Annual Report
http://slidepdf.com/reader/full/trw-2010-annual-report 39/116
CHASSIS SYSTEMS
Comparison of the year ended December 31, 2010 and December 31, 2009:
Sales, including intersegment sales increased $1,721 million for the year ended December 31, 2010 as
compared to the year ended December 31, 2009. This increase was driven primarily by an increase in volume (net of
price reductions provided to customers) of $1,718 million.
Earnings (losses) before taxes increased by $449 million for the year ended December 31, 2010 as compared tothe year ended December 31, 2009. This increase was driven primarily by higher volume (net of adverse mix) of
$354 million, lower restructuring and impairment costs of $49 million, cost reductions (in excess of inflation and
price reductions provided to customers) of $36 million, the favorable impact of foreign currency exchange of
$28 million, and a $10 million gain on curtailment of the U.S. salaried pension plan. Partially offsetting these
favorable items were the non-recurrence of various favorable customer settlements of $25 million.
Restructuring charges and asset impairments decreased by $49 million for the year ended December 31, 2010
as compared to the year ended December 31, 2009. The decrease was driven primarily by lower severance and other
charges of $37 million, reduced fixed asset impairments of $11 million and a gain on the sale of a restructured
property in the amount of $4 million, partially offset by a decrease in net curtailment gains of $3 million.
Comparison of the year ended December 31, 2009 and December 31, 2008:
Sales, including intersegment sales decreased $1,689 million for the year ended December 31, 2009 ascompared to the year ended December 31, 2008. The decrease in sales was driven primarily by lower volume and, to
a much lesser degree, price reductions provided to customers, which combined totaled $1,246 million. The lower
volume was attributed to a decline in light vehicle production volumes in all major geographic regions. Foreign
currency exchange also had a net unfavorable impact on sales of $443 million.
Earnings (losses) before taxes increased by $67 million for the year ended December 31, 2009 as compared to
the year ended December 31, 2008. The increase in earnings was driven primarily by cost reductions (in excess of
inflation and price reductions provided to customers) of $303 million, decreased restructuring and impairment costs
of $30 million, lower pension and postretirement benefit expense of $16 million (which includes an increase of
$9 million of net settlement gains) as well as the favorable impact of certain customer related settlements of
$12 million and contractual settlements related to a recent acquisition of $8 million. Also contributing to the
increase in earnings was a customer reimbursement of $5 million for costs incurred as a result of the premature
closure of an operating facility. These items were partially offset by lower volume and adverse mix which totaled$240 million, the net unfavorable impact of foreign currency exchange of $27 million, increased warranty expense
of $26 million and the non-recurrence of net insurance recoveries of $17 million related to a business disruption at
our brake line production facility in South America in the prior period.
Restructuring charges and asset impairmentsdecreased by $30 million for the year ended December 31, 2009 as
compared to the year ended December 31, 2008. The decrease was driven primarily by a decrease in fixed asset
impairments of $55 million. This decrease was offset by a net increase in severance and other charges and net
curtailment gains of $25 million related to the workforce reduction initiatives that began in the fourth quarter of 2008.
OCCUPANT SAFETY SYSTEMS
Comparison of the year ended December 31, 2010 and December 31, 2009:
Sales, including intersegment salesincreased $560 million for the year ended December 31, 2010 as comparedto the year ended December 31, 2009. This increase in sales was driven primarily by an increase in volume (net of
price reductions provided to customers) of $664 million, partially offset by the unfavorable impact of foreign
currency exchange of $104 million.
Earnings (losses) before taxes increased $235 million for the year ended December 31, 2010 as compared to
the year ended December 31, 2009. This increase in earnings was driven primarily by favorable volume (net of
adverse mix) of $165 million, cost reductions (in excess of inflation and price reductions provided to customers) of
$94 million, and lower costs related to pension and postretirement benefits of $6 million, which includes a
33

8/3/2019 TRW 2010 Annual Report
http://slidepdf.com/reader/full/trw-2010-annual-report 40/116
$4 million gain on curtailment of the U.S. salaried pension plan. Partially offsetting these favorable items were the
non-recurrence of certain customer settlements and favorable patent dispute resolutions totaling $13 million, higher
warranty costs of $6 million, the non-recurrence of accrual reversals in the prior period related to certain benefit
programs at several of our European facilities of $5 million, and an increase in restructuring and impairment costs of
$4 million.
Restructuring charges and asset impairments increased by $4 million for the year ended December 31, 2010 as
compared to the year ended December 31, 2009 due to higher severance and other charges.
Comparison of the year ended December 31, 2009 and December 31, 2008:
Sales, including intersegment salesdecreased $901 million for the year ended December 31, 2009 as compared
to the year ended December 31, 2008. The decrease in sales was driven primarily by lower volume and, to a lesser
degree, price reductions provided to customers, which combined totaled $661 million and the net unfavorable
impact of foreign currency exchange of $240 million.
Earnings (losses) before taxes increased $180 million for the year ended December 31, 2009 as compared to
the year ended December 31, 2008. The increase in earnings was driven primarily by decreased restructuring and
impairment costs of $198 million, and cost reductions (in excess of inflation and price reductions) of $177 million
and the beneficial impact of certain customer related settlements and favorable patent dispute resolutions totaling
$13 million. Also contributing to the increase in earnings were the reversal of accruals related to certain benefit
programs at several of our European facilities which increased earnings by $5 million and lower warranty costs of
$4 million. These items were partially offset by lower volume and adverse mix which totaled $203 million, and the
net unfavorable impact of foreign currency exchange of $15 million.
Restructuring charges and asset impairmentsdecreased by $198 million for the year ended December 31, 2009
as compared to the year ended December 31, 2008. During 2008, this segment recorded an impairment loss of
$174 million related to customer relationships, the non-recurrence of which was the primary contributor to the
decrease period over period. In addition, a decrease in fixed asset impairments of $16 million along with a net
decrease in severance and other charges and net curtailment gains of $8 million contributed to the significant overall
decrease.
ELECTRONICS
Comparison of the year ended December 31, 2010 and December 31, 2009:
Sales, including intersegment sales increased by $286 million for the year ended December 31, 2010 as
compared to the year ended December 31, 2009. This increase was driven primarily by an increase in volume (net of
price reductions provided to customers) of $276 million and the favorable impact of foreign currency exchange of
$10 million.
Earnings (losses) before taxes increased by $91 million for the year ended December 31, 2010 as compared to
the year ended December 31, 2009. This increase was driven primarily by higher volume (net of adverse mix) of
$76 million, favorable impact of foreign currency exchange of $17 million, lower pension and post retirement
benefit costs of $5 million, and lower restructuring and impairment costs of $5 million. Partially offsetting these
favorable items were price reductions and inflation in excess of cost reductions of $11 million.
Restructuring charges and asset impairments decreased by $5 million for the year ended December 31, 2010
as compared to the year ended December 31, 2009, primarily due to lower severance and other charges.
Comparison of the year ended December 31, 2009 and December 31, 2008:
Sales, including intersegment sales decreased by $320 million for the year ended December 31, 2009 as
compared to the year ended December 31, 2008. The decrease in sales was driven primarily by lower volume and, to
a much lesser degree, price reductions provided to customers, which combined totaled $263 million, and the net
unfavorable impact of foreign currency exchange of $57 million.
34

8/3/2019 TRW 2010 Annual Report
http://slidepdf.com/reader/full/trw-2010-annual-report 41/116
Earnings (losses) before taxesdecreased by $64 million for the year ended December 31, 2009 as compared to
the year ended December 31, 2008. The decrease in earnings was driven primarily by lower volume and adverse mix
which totaled $115 million, the net unfavorable impact of foreign currency exchange of $4 million and increased
warranty costs of $4 million. These items were partially offset by cost reductions (in excess of inflation and price
reductions) of $58 million.
Restructuring charges and asset impairments were $4 million for both of the years ended December 31, 2009
and 2008. The charges primarily related to severance and other charges and fixed asset impairments not related torestructuring.
AUTOMOTIVE COMPONENTS
Comparison of the year ended December 31, 2010 and December 31, 2009:
Sales, including intersegment sales increased by $366 million for the year ended December 31, 2010 as
compared to the year ended December 31, 2009. This increase in sales was driven primarily by an increase in
volume (net of price reductions provided to customers) of $371 million, partially offset by the unfavorable impact of
foreign currency exchange of $5 million.
Earnings (losses) before taxes increased by $128 million for the year ended December 31, 2010 as compared to
the year ended December 31, 2009. The increase in earnings was driven primarily by volume (net of adverse mix) of
$93 million, favorable impact of foreign currency exchange of $15 million, lower restructuring and impairmentcosts of $9 million, lower pension and post retirement benefit costs of $7 million all of which is attributed to gains
on curtailments, and lower warranty costs of $2 million.
Restructuring charges and asset impairments decreased by $9 million for the year ended December 31, 2010
as compared to the year ended December 31, 2009. This was primarily driven by lower severance and other charges
of $7 million and reduced fixed asset impairments of $3 million.
Comparison of the year ended December 31, 2009 and December 31, 2008:
Sales, including intersegment sales decreased by $548 million for the year ended December 31, 2009 as
compared to the year ended December 31, 2008. The decrease in sales was driven primarily by lower volume and, to
a much lesser degree, price reductions provided to customers, which combined totaled $405 million and the net
unfavorable impact of foreign currency exchange of $143 million.
Earnings (losses) before taxes increased by $536 million for the year ended December 31, 2009 as compared to
the year ended December 31, 2008. The increase in earnings was driven primarily by decreased restructuring and
impairment costs of $600 million and cost reductions (in excess of inflation and price reductions) of $104 million.
These items were partially offset by lower volume and adverse mix which totaled $139 million and the net
unfavorable impact of foreign currency exchange of $29 million.
Restructuring charges and asset impairmentsdecreased by $600 million for the year ended December 31, 2009
as compared to the year ended December 31, 2008. During 2008, this segment recorded an impairment loss of
$613 million related to goodwill and customer relationships, which primarily contributed to the decrease period
over period. This was offset by net increases in severance and other charges, and net curtailment gains of
$11 million and fixed asset impairments not related to restructuring of $2 million.
LIQUIDITY AND CAPITAL RESOURCESWe believe that funds generated from operations, cash on hand and available borrowing capacity will be
adequate to fund our liquidity requirements. These requirements, which are significant, generally consist of
working capital requirements, company-sponsored research and development programs, capital expenditures,
contributions for pensions and other postretirement benefits, and debt service requirements. In addition, our current
financing plans are intended to provide flexibility in worldwide financing activities and permit us to respond to
changing conditions in credit markets. However, our ability to continue to fund these items and to reduce debt may
be affected by general economic, industry specific, financial market, competitive, legislative and regulatory factors.
35

8/3/2019 TRW 2010 Annual Report
http://slidepdf.com/reader/full/trw-2010-annual-report 42/116
On an annual basis, our primary source of liquidity remains cash flows generated from operations. At various
points during the course of a given year, we may be in an operating cash usage position, which is not unusual given
the seasonality of our business. We also have available liquidity under our revolving credit facility and the credit
facilities described below, subject to certain conditions. We continuously focus on our working capital position and
associated cash requirements and explore opportunities to more effectively manage our inventory and capital
spending. Working capital is highly influenced by the timing of cash flows associated with sales and purchases, and
therefore can be difficult to manage at times. Although we have historically been successful in managing the timing
of our cash flows, future success will be dependent on the financial position of our customers and suppliers, and onindustry conditions.
Cash Flows
Operating Activities. Cash provided by operating activities for the year ended December 31, 2010, was
$1,052 million, as compared to $455 million for the year ended December 31, 2009. The increase in cash provided
by operations was primarily the result of our improved operating results for 2010, as compared with 2009. Other
items contributing to the improvement in cash provided by operations were favorable working capital changes of
$124 million, primarily due to increased collections on our accounts receivable, and reduced restructuring and other
severance-related payments of $36 million. These favorable changes in operating cash flows were partially offset by
increased cash paid for pension and OPEB benefits of $185 million, which includes discretionary pension
contributions in 2010 totaling approximately $170 million.
Investing Activities. Cash used in investing activities for the year ended December 31, 2010 was $289 million
as compared to $197 million for the year ended December 31, 2009.
For the years ended December 31, 2010 and 2009, we spent $294 million and $201 million, respectively, in
capital expenditures, primarily in connection with upgrading existing products, continuing new product launches,
and infrastructure and equipment at our facilities to support our manufacturing and cost reduction efforts. We expect
to spend approximately $540 million on capital expenditures during 2011 as we continue to invest in strategic
growth.
We received proceeds from the sale of various assets of $7 million and $4 million for the years ended
December 31, 2010 and 2009, respectively.
Financing Activities. Cash used in financing activities was $463 million for the year ended December 31,
2010 as compared to $250 million for the year ended December 31, 2009. During 2010, we optionally repaid in fullthe outstanding Term Loan A-2 of $225 million and Term Loan B-3 of $175 million and repurchased portions of our
senior unsecured notes totaling approximately $152 million in principal amount. Also in 2010, we received
$76 million of net proceeds from exercise of stock options.
During 2009, we received approximately $884 million of proceeds from issuance of certain senior unsecured
notes and term loan facilities and $269 million of net proceeds from issuance of common stock. The net proceeds
from these financing transactions, together with cash on hand, were used to repay $1,093 million of borrowings
under previous term loan facilities, $203 million of our revolving credit facility, $57 million of our senior unsecured
notes, and $48 million of our short-term debt.
Other Sources of Liquidity
Liquidity Facilities. We may draw down on, and use proceeds from, our revolving credit facility which is partof our senior secured credit facilities described below to fund normal working capital needs from month to month in
conjunction with available cash on hand. As of December 31, 2010, we had approximately $1.2 billion of
availability under our revolving credit facility. This availability reflects no outstanding borrowings and reduced
availability as a result of $39 million in outstanding letters of credit and bank guarantees and a $48 million unfunded
commitment of Lehman Commercial Paper Inc. (“LCP”) under the revolving credit facility. We have excluded
LCP’s commitment from the description of the revolving credit facility and all references to availability contained
in this Report.
36

8/3/2019 TRW 2010 Annual Report
http://slidepdf.com/reader/full/trw-2010-annual-report 43/116
On December 31, 2010, our subsidiaries in the Asia Pacific region also had various uncommitted credit
facilities, of which $217 million was unutilized. We expect that these additional facilities will be drawn from time to
time for normal working capital purposes.
Under normal working capital utilization of liquidity, portions of the amounts drawn under the revolving credit
facility typically are paid back throughout the month as cash from customers is received. We could then draw upon
such facilities again for working capital purposes in the same or succeeding months. However, during any given
month, upon examination of economic and industry conditions, we may fully draw on our revolving credit facility.
Senior Secured Credit Facilities. Our Seventh Amended and Restated Credit Agreement (the “Seventh
Credit Agreement”), entered into in December 2009, provides for senior secured credit facilities consisting of (i) the
revolving credit facility in the amount of $1,256 million, of which $411 million matures May 9, 2012 and
$845 million matures November 30, 2014, subject to certain conditions, (ii) the $225 million Term Loan A-2, and
(iii) the $175 million Term Loan B-3. Net proceeds from the Term Loan A-2 and Term Loan B-3, together with cash
on hand, were used to repay the remaining balance of the existing term loan A-1 and term loan B-1 and pay fees and
expenses associated with the Seventh Credit Agreement. See “— Senior Secured Credit Facilities” in Note 11 to our
consolidated financial statements included in Item 8 of this Report for a description of these facilities.
During 2010, we optionally repaid in full the outstanding Term Loan A-2 and Term Loan B-3 balances of
$225 million and $175 million, respectively, with cash on hand. In conjunction with the repayment of the Term Loan
A-2 and the Term Loan B-3, we recorded a loss on retirement of debt of $5 million, $3 million of which was for the
write-off of deferred financing fees relating to the term loans, and $2 million was related to the acceleration of interest rate swap losses that had been included in other comprehensive income.
Our Seventh Credit Agreement contains a number of covenants, including financial covenants that would
impact our ability to borrow on the facility if not met and restrictive covenants that, among other things, restrict the
ability to incur additional indebtedness and the payment of cash dividends on our common stock. As of
December 31, 2010, we were in compliance with all of our financial covenants. See “— Debt Covenants” in
Note 11 to our consolidated financial statements included in Item 8 of this Report for further information on
additional debt covenants.
Other Capital Transactions
Senior Note Debt Repurchases. In 2010, we entered into transactions to repurchase portions of our senior
unsecured notes totaling approximately $152 million in principal amount. As a result of these transactions, we
recorded a loss on retirement of debt of $10 million, including the write-off of a portion of debt issuance costs andpremiums. These repurchases were funded from cash on hand.
37

8/3/2019 TRW 2010 Annual Report
http://slidepdf.com/reader/full/trw-2010-annual-report 44/116
Contractual Obligations and Commitments
The following table reflects our significant contractual obligations as of December 31, 2010:
Less ThanOne Year
One toThree Years
Three toFive Years
More ThanFive Years Total
(Dollars in millions)
Short-term borrowings . . . . . . . . . . . . . . . . . $ 23 $ — $ — $ — $ 23
Long-term debt obligations . . . . . . . . . . . . . 12 69 1,030(b)
738 1,849Capital lease obligations . . . . . . . . . . . . . . . 8 9 5 8 30
Operating lease obligations . . . . . . . . . . . . . 84 110 81 77 352
Projected interest payment on long-termdebt(a) . . . . . . . . . . . . . . . . . . . . . . . . . . . 129 249 162 96 636
Transaction and Monitoring FeeAgreement . . . . . . . . . . . . . . . . . . . . . . . . 5 10 10 —(c) 25(c)
Total . . . . . . . . . . . . . . . . . . . . . . . . . . . . $261 $447 $1,288 $919 $2,915
(a) Long term debt includes both fixed rate and variable rate obligations. As of December 31, 2010, approximately
1% of our total debt was at variable interest rates. The projected interest payment obligations are based upon
(1) fixed rates where appropriate and (2) projected London Interbank Borrowing Rates (LIBOR) obtained from
third parties plus applicable margins as of the current balance sheet date for variable rate obligations. Theprojected interest payment obligations are also based upon debt outstanding at the balance sheet date and
assumes retirement at scheduled maturity dates.(b) In accordance with ASC 470-20, “Debt,” upon issuance of our exchangeable notes a debt discount was
recognized as a decrease in debt and an increase in equity. Accordingly, the fair value and carrying value of
long-term fixed rate debt is net of the unamortized discount of $56 million as of December 31, 2010. The debt
discount does not affect the actual amount we are required to repay, therefore it is included in the contractual
obligation table but is not reflected in the carrying value disclosed in Note 11 of this Report.(c) The Transaction and Monitoring Fee Agreement was entered into with Blackstone in February 2003 and has a
fairly indefinite term. The agreement terminates when Blackstone owns less than 5% of our outstanding shares
or when we and Blackstone mutually agree.
We have unrecognized tax benefits amounting to $172 million. However, due to a high degree of uncertainty
regarding the timing of such future cash outflows, reasonable estimates cannot be made regarding the period of cashsettlement with the applicable taxing authority.
In addition to the obligations discussed above, we sponsor defined benefit pension plans that cover a
significant portion of our U.S. employees and certain non-U.S. employees. Commencing in 2008, our pension
plans in the U.S. are funded in conformity with the Pension Protection Act of 2006. Funding for our pension plans in
other countries is based upon actuarial recommendations or statutory requirements. In 2011, our minimum expected
funding is $1 million for our U.S. pension plans and $41 million for pension plans in the rest of the world, however,
we may, at our discretion, make additional contributions.
As of October 31, 2010, the U.K. Plan had a deficit of $620 million, as estimated by the Plan’s actuary. We and
the plan fiduciaries/trustees agreed on a deficit recovery plan where we are to make annual contributions of
£20 million to the Plan through March 2019. These contributions, in conjunction with investment performance, are
expected to eliminate the deficit by that date. In addition to the 2010 payment, we accelerated the contributionsotherwise due in 2011 and 2012 into 2010, resulting in total contributions in 2010 of £60 million, or $93 million.
Required contributions to the Plan will resume in 2013, however, we may, at our discretion, make contributions
during 2011 and 2012.
We sponsor OPEB plans that cover the majority of our U.S. and certain non-U.S. retirees and provide for
benefits to eligible employees and dependents upon retirement. We are subject to increased OPEB cash costs due to,
among other factors, rising health care costs. We fund our OPEB obligations on a pay-as-you-go basis. In 2011, we
expect to contribute approximately $42 million to our OPEB plans.
38
8/3/2019 TRW 2010 Annual Report
http://slidepdf.com/reader/full/trw-2010-annual-report 45/116
We also have liabilities recorded for various environmental matters. As of December 31, 2010, we had reserves
for environmental matters of $61 million. We expect to pay approximately $13 million in 2011 in relation to these
matters.
In addition to the contractual obligations and commitments noted above, we have contingent obligations in the
form of severance and bonus payments for our executive officers. We have no unconditional purchase obligations
other than those related to inventory, services, tooling and property, plant and equipment in the ordinary course of
business.Other Commitments. Continuing pressure from customers to reduce prices is characteristic of the automotive
parts industry. Historically, we have taken steps to reduce costs and minimize and/or resist price reductions;
however, to the extent we are unsuccessful at resisting price reductions, or are not able to offset price reductions
through improved operating efficiencies and reduced expenditures, such price reductions may have a material
adverse effect on our financial condition, results of operations and cash flows.
In addition to pricing concerns, customers continue to seek changes in terms and conditions in our contracts
concerning warranty and recall participation and payment terms on product shipped. We believe that the likely
resolution of these proposed modifications will not have a material adverse effect on our financial condition, results
of operations or cash flows.
Off-Balance Sheet Arrangements
We do not have material off-balance sheet arrangements. Also, we do not have guarantees related to
unconsolidated entities, which have, or are reasonably likely to have, a material current or future effect on our
financial position, results of operations or cash flows.
Environmental Matters and other Contingencies
The information concerning various claims, lawsuits and administrative proceedings contained in Note 17 to
our consolidated financial statements included in Item 8 of this Report is incorporated herein by reference. The
additional information concerning environmental matters included in Item 1 “Business — Environmental Matters”
of this Report is incorporated herein by reference.
Recently Issued Accounting Pronouncements
See Note 2 to our consolidated financial statements included in Item 8 of this Report for a discussion of
recently issued accounting pronouncements.
Outlook
We expect full year 2011 sales to be in the range of $14.9 billion to $15.3 billion, including first quarter sales of
approximately $3.9 billion. These sales figures are based on expected 2011 production levels of 12.7 million units in
North America, 18.7 million units in Europe, continued strong growth in our fastest growing market, China, and our
expectations for foreign currency exchange rates.
During 2010, vehicle production continued an upward trend. North America experienced a slow and steady
increase in production from 2009, which is expected to continue in the near-term. In Europe, production levels were
significantly higher compared with 2009, however, we expect that they will stabilize in the near-term. Despite thevarious challenges that the industry faces (such as the impact of macroeconomic conditions and fluctuating
production levels and commodity prices), we are confident that we will manage through them successfully. We
continue to expect that full recovery of the automotive industry will be a gradual process.
Growth in the rest of the world, such as China and Brazil, continued at a robust pace in 2010. We expect this
growth to continue in 2011 and beyond. Establishing the appropriate levels of capital, infrastructure, and
engineering investment to support expansion in these areas will become increasingly important as these regions
become a more substantial portion of our business.
39
8/3/2019 TRW 2010 Annual Report
http://slidepdf.com/reader/full/trw-2010-annual-report 46/116
We believe that our liquidity, continued focus on controlling costs, leading technology portfolio and our
business prospects, particularly in developing markets, driven by the continued focus on safety in vehicles, provide
a firm foundation for continued profitability.
We continue to be exposed to the potential inflationary impact of certain commodities such as ferrous metals,
base metals, yarns, resins and other petroleum-based products as well as energy costs. As production increases,
commodity inflationary pressures may increase, both in the automotive industry and in the broader economy.
Although the impact of commodity inflation may not affect us immediately, it is typically evidenced by near-termcontribution margin contraction and can put significant operational and financial burdens on us and our suppliers.
We remain concerned about the viability of the Tier 2 and Tier 3 supply base as they face financial difficulties
in the current environment due to increased working capital requirements resulting from increased production
levels and commodity inflationary pressures. The inability of any major supplier to meet its commitments could
negatively impact us either directly or by negatively affecting our customers. While we continue our efforts to
mitigate the impact of our suppliers’ financial distress on our financial results, our efforts may be insufficient and
the pressures may worsen, thereby potentially having a negative impact on our future results.
Forward-Looking Statements
This Report includes “forward-looking statements,” as that term is defined by the federal securities laws.
Forward-looking statements include statements concerning our plans, intentions, objectives, goals, strategies,
forecasts, future events, future revenue or performance, capital expenditures, financing needs, business trends andother information that is not historical information. When used in this Report, the words “estimates,” “expects,”
“anticipates,” “projects,” “plans,” “intends,” “believes,” “forecasts,” and future or conditional verbs, such as “will,”
“should,” “could” or “may,” as well as variations of such words or similar expressions are intended to identify
forward-looking statements, although not all forward-looking statements are so designated. All forward-looking
statements, including, without limitation, management’s examination of historical operating trends and data, are
based upon our current expectations and various assumptions, and apply only as of the date of this Report. Our
expectations, beliefs and projections are expressed in good faith and we believe there is a reasonable basis for them.
However, there can be no assurance that management’s expectations, beliefs and projections will be achieved.
There are a number of risks, uncertainties and other important factors that could cause our actual results to
differ materially from those suggested by our forward-looking statements, including those set forth in “Item 1A.
Risk Factors” in this Report and in our other filings with the Securities and Exchange Commission. All forward-
looking statements are expressly qualified in their entirety by such cautionary statements. We undertake noobligation to update or revise forward-looking statements which have been made to reflect events or circumstances
that arise after the date made or to reflect the occurrence of unanticipated events.
ITEM 7A. QUANTITATIVE AND QUALITATIVE DISCLOSURES ABOUT MARKET RISKS
Our primary market risk arises from fluctuations in foreign currency exchange rates, interest rates and
commodity prices. We manage foreign currency exchange rate risk, interest rate risk and, to a lesser extent,
commodity price risk by utilizing various derivative instruments. We limit the use of such instruments to hedging
activities; we do not use such instruments for speculative or trading purposes. If we did not use derivative instruments,
our exposure to such risks would be higher. We are exposed to credit loss in the event of nonperformance by the
counterparty to the derivative financial instruments. We attempt to manage this exposure by entering into agreements
directly with a number of major financial institutions that meet our credit standards and that are expected to fully
satisfy their obligations under the contracts. However, given historical disruptions in the financial markets, includingthe bankruptcy, insolvency or restructuring of certain financial institutions, there is no guarantee that the financial
institutions with whom we contract will be able to fully satisfy their contractual obligations.
Foreign Currency Exchange Rate Risk. We utilize derivative financial instruments to manage foreign
currency exchange rate risks. We enter into forward contracts and, to a lesser extent, options to hedge portions
of our foreign currency denominated forecasted revenues, purchases and the subsequent cash flow from adverse
movements in exchange rates. Foreign currency exposures are reviewed monthly and any natural offsets are
considered prior to entering into a derivative financial instrument.
40

8/3/2019 TRW 2010 Annual Report
http://slidepdf.com/reader/full/trw-2010-annual-report 47/116
During 2010, we repaid approximately $520 million of our U.S. dollar-denominated debt resulting in an
increase in the percentage of debt denominated in foreign currencies compared to total debt. As of December 31,
2010, approximately 24% of our total debt was in foreign currencies, as compared to 19% as of December 31, 2009.
Interest Rate Risk. We are subject to interest rate risk in connection with variable- and fixed-rate debt. In
order to manage interest costs, we may occasionally utilize interest rate swap agreements to exchange fixed- and
variable-rate interest payment obligations over the life of the agreements. As of December 31, 2010, approximately
1% of our total debt was at variable interest rates, as compared to 18% (or 5% when considering the effect of interest
rate swaps) as of December 31, 2009.
Commodity Price Risk. From time to time, we may utilize derivative financial instruments to manage select
commodity price risks. Forward purchase agreements generally meet the criteria to be accounted for as normal
purchases. Forward purchase agreements which do not or no longer meet these criteria are classified and accounted
for as derivatives.
Sensitivity Analysis. We utilize a sensitivity analysis model to calculate the fair value, cash flows or
statement of operations impact that a hypothetical 10% change in market rates would have on our debt and
derivative instruments. For derivative instruments, we utilized applicable forward rates in effect as of December 31,
2010 to calculate the fair value or cash flow impact resulting from this hypothetical change in market rates. The
analyses also do not factor in a potential change in the level of variable rate borrowings or derivative instruments
outstanding that could take place if these hypothetical conditions prevailed. The results of the sensitivity model
calculations follow:
Market Risk
Assuming a10% U.S.$
Strengthening
Assuming a10% U.S.$Weakening
Favorable(Unfavorable)
Change in
(Dollars in millions)
Foreign Currency Rate Sensitivity:
— Forward sales contracts of U.S.$ and net purchasedU.S.$ put options . . . . . . . . . . . . . . . . . . . . . . . . . . . $(53) $ 55 Fair value
— Forward purchase contracts of U.S.$ and netpurchased U.S.$ call options . . . . . . . . . . . . . . . . . . . $ 21 $(21) Fair value
— Foreign currency denominated debt . . . . . . . . . . . . . $ 43 $(43) Fair value
Assuming a10% Increase
in Rates
Assuming a10% Decrease
in Rates
Favorable(Unfavorable)
Change in
(Dollars in millions)
Interest Rate Sensitivity:
Debt
— Fixed rate . . . . . . . . . . . . . . . . . . . . . . . . . . . . . . $38 $(39) Fair value
— Variable rate . . . . . . . . . . . . . . . . . . . . . . . . . . . . $— $ — Cash flow
41

8/3/2019 TRW 2010 Annual Report
http://slidepdf.com/reader/full/trw-2010-annual-report 48/116
ITEM 8. FINANCIAL STATEMENTS AND SUPPLEMENTARY DATA
TRW Automotive Holdings Corp.
Consolidated Statements of Operations
2010 2009 2008
Years Ended December 31,
(In millions, except per shareamounts)
Sales . . . . . . . . . . . . . . . . . . . . . . . . . . . . . . . . . . . . . . . . . . . . . . . . . . . . . . $14,383 $11,614 $14,995
Cost of sales . . . . . . . . . . . . . . . . . . . . . . . . . . . . . . . . . . . . . . . . . . . . . . . . 12,661 10,708 13,977
Gross profit . . . . . . . . . . . . . . . . . . . . . . . . . . . . . . . . . . . . . . . . . . . . . 1,722 906 1,018
Administrative and selling expenses . . . . . . . . . . . . . . . . . . . . . . . . . . . . . . . 509 484 523
Amortization of intangible assets . . . . . . . . . . . . . . . . . . . . . . . . . . . . . . . . . 22 21 31
Restructuring charges and fixed asset impairments . . . . . . . . . . . . . . . . . . . . 45 100 145
Goodwill impairments . . . . . . . . . . . . . . . . . . . . . . . . . . . . . . . . . . . . . . . . . — — 458
Intangible asset impairments . . . . . . . . . . . . . . . . . . . . . . . . . . . . . . . . . . . . . — 30 329
Other (income) expense — net . . . . . . . . . . . . . . . . . . . . . . . . . . . . . . . . . . . (38) (18) —
Operating income (losses) . . . . . . . . . . . . . . . . . . . . . . . . . . . . . . . . . . . 1,184 289 (468)
Interest expense — net . . . . . . . . . . . . . . . . . . . . . . . . . . . . . . . . . . . . . . . . . 162 190 184
(Gain) loss on retirement of debt — net . . . . . . . . . . . . . . . . . . . . . . . . . . . . 15 (26) —
Equity in (earnings) losses of affiliates, net of tax . . . . . . . . . . . . . . . . . . . . . (34) (15) (14)
Earnings (losses) before income taxes . . . . . . . . . . . . . . . . . . . . . . . . . . 1,041 140 (638)
Income tax expense (benefit) . . . . . . . . . . . . . . . . . . . . . . . . . . . . . . . . . . . . 166 67 126
Net earnings (losses) . . . . . . . . . . . . . . . . . . . . . . . . . . . . . . . . . . . . . . . 875 73 (764)
Less: Net earnings attributable to noncontrolling interest, net of tax. . . . . . . . 41 18 15
Net earnings (losses) attributable to TRW . . . . . . . . . . . . . . . . . . . . . . . $ 834 $ 55 $ (779)
Basic earnings (losses) per share:Earnings (losses) per share . . . . . . . . . . . . . . . . . . . . . . . . . . . . . . . . . . . . $ 6.96 $ 0.51 $ (7.71)
Weighted average shares outstanding. . . . . . . . . . . . . . . . . . . . . . . . . . . . . 119.8 107.8 101.1
Diluted earnings (losses) per share:
Earnings (losses) per share . . . . . . . . . . . . . . . . . . . . . . . . . . . . . . . . . . . . $ 6.49 $ 0.51 $ (7.71)
Weighted average shares outstanding. . . . . . . . . . . . . . . . . . . . . . . . . . . . . 131.3 108.7 101.1
See accompanying notes to consolidated financial statements.
42

8/3/2019 TRW 2010 Annual Report
http://slidepdf.com/reader/full/trw-2010-annual-report 49/116
TRW Automotive Holdings Corp.
Consolidated Balance Sheets
2010 2009
As of December 31,
(Dollars in millions)
ASSETS
Current assets:Cash and cash equivalents . . . . . . . . . . . . . . . . . . . . . . . . . . . . . . . . . . . . . . . . . . . . . . . $1,078 $ 788
Accounts receivable — net. . . . . . . . . . . . . . . . . . . . . . . . . . . . . . . . . . . . . . . . . . . . . . . 2,087 1,943
Inventories . . . . . . . . . . . . . . . . . . . . . . . . . . . . . . . . . . . . . . . . . . . . . . . . . . . . . . . . . . 760 660
Prepaid expenses and other current assets. . . . . . . . . . . . . . . . . . . . . . . . . . . . . . . . . . . . 126 135
Deferred income taxes . . . . . . . . . . . . . . . . . . . . . . . . . . . . . . . . . . . . . . . . . . . . . . . . . . 89 66
Total current assets . . . . . . . . . . . . . . . . . . . . . . . . . . . . . . . . . . . . . . . . . . . . . . . . . . . . . . 4,140 3,592
Property, plant and equipment — net . . . . . . . . . . . . . . . . . . . . . . . . . . . . . . . . . . . . . . . . . 2,100 2,334
Goodwill . . . . . . . . . . . . . . . . . . . . . . . . . . . . . . . . . . . . . . . . . . . . . . . . . . . . . . . . . . . . . 1,761 1,768
Intangible assets — net . . . . . . . . . . . . . . . . . . . . . . . . . . . . . . . . . . . . . . . . . . . . . . . . . . . 304 324
Pension assets . . . . . . . . . . . . . . . . . . . . . . . . . . . . . . . . . . . . . . . . . . . . . . . . . . . . . . . . . . 454 179
Deferred income taxes. . . . . . . . . . . . . . . . . . . . . . . . . . . . . . . . . . . . . . . . . . . . . . . . . . . . 83 138
Other assets . . . . . . . . . . . . . . . . . . . . . . . . . . . . . . . . . . . . . . . . . . . . . . . . . . . . . . . . . . . 446 397Total assets . . . . . . . . . . . . . . . . . . . . . . . . . . . . . . . . . . . . . . . . . . . . . . . . . . . . . . . . . . $9,288 $8,732
LIABILITIES AND EQUITY
Current liabilities:
Short-term debt . . . . . . . . . . . . . . . . . . . . . . . . . . . . . . . . . . . . . . . . . . . . . . . . . . . . . . . $ 23 $ 18
Current portion of long-term debt . . . . . . . . . . . . . . . . . . . . . . . . . . . . . . . . . . . . . . . . . 20 28
Trade accounts payable . . . . . . . . . . . . . . . . . . . . . . . . . . . . . . . . . . . . . . . . . . . . . . . . . 2,079 1,912
Accrued compensation. . . . . . . . . . . . . . . . . . . . . . . . . . . . . . . . . . . . . . . . . . . . . . . . . . 251 256
Income taxes . . . . . . . . . . . . . . . . . . . . . . . . . . . . . . . . . . . . . . . . . . . . . . . . . . . . . . . . . 50 26
Other current liabilities . . . . . . . . . . . . . . . . . . . . . . . . . . . . . . . . . . . . . . . . . . . . . . . . . 1,096 1,068
Total current liabilities . . . . . . . . . . . . . . . . . . . . . . . . . . . . . . . . . . . . . . . . . . . . . . . . . . . 3,519 3,308
Long-term debt . . . . . . . . . . . . . . . . . . . . . . . . . . . . . . . . . . . . . . . . . . . . . . . . . . . . . . . . . 1,803 2,325Postretirement benefits other than pensions . . . . . . . . . . . . . . . . . . . . . . . . . . . . . . . . . . . . 453 479
Pension benefits . . . . . . . . . . . . . . . . . . . . . . . . . . . . . . . . . . . . . . . . . . . . . . . . . . . . . . . . 681 804
Deferred income taxes. . . . . . . . . . . . . . . . . . . . . . . . . . . . . . . . . . . . . . . . . . . . . . . . . . . . 95 34
Long-term liabilities . . . . . . . . . . . . . . . . . . . . . . . . . . . . . . . . . . . . . . . . . . . . . . . . . . . . . 499 473
Total liabilities . . . . . . . . . . . . . . . . . . . . . . . . . . . . . . . . . . . . . . . . . . . . . . . . . . . . . . . 7,050 7,423
Commitments and contingencies
Stockholders’ equity:
Preferred stock . . . . . . . . . . . . . . . . . . . . . . . . . . . . . . . . . . . . . . . . . . . . . . . . . . . . . . . — —
Capital stock . . . . . . . . . . . . . . . . . . . . . . . . . . . . . . . . . . . . . . . . . . . . . . . . . . . . . . . . . 1 1
Treasury stock . . . . . . . . . . . . . . . . . . . . . . . . . . . . . . . . . . . . . . . . . . . . . . . . . . . . . . . . — —
Paid-in-capital . . . . . . . . . . . . . . . . . . . . . . . . . . . . . . . . . . . . . . . . . . . . . . . . . . . . . . . . 1,638 1,553
Retained earnings (accumulated deficit) . . . . . . . . . . . . . . . . . . . . . . . . . . . . . . . . . . . . . 511 (323)
Accumulated other comprehensive earnings (losses) . . . . . . . . . . . . . . . . . . . . . . . . . . . . (87) (71)
Total TRW stockholders’ equity. . . . . . . . . . . . . . . . . . . . . . . . . . . . . . . . . . . . . . . . . . . . . 2,063 1,160
Noncontrolling interest . . . . . . . . . . . . . . . . . . . . . . . . . . . . . . . . . . . . . . . . . . . . . . . . . . . 175 149
Total equity . . . . . . . . . . . . . . . . . . . . . . . . . . . . . . . . . . . . . . . . . . . . . . . . . . . . . . . . . . . 2,238 1,309
Total liabilities and equity . . . . . . . . . . . . . . . . . . . . . . . . . . . . . . . . . . . . . . . . . . . . . . . . . $9,288 $8,732
See accompanying notes to consolidated financial statements.
43

8/3/2019 TRW 2010 Annual Report
http://slidepdf.com/reader/full/trw-2010-annual-report 50/116
TRW Automotive Holdings Corp.
Consolidated Statements of Cash Flows
2010 2009 2008
Years Ended December 31,
(Dollars in millions)
Operating Activities
Net earnings (losses) . . . . . . . . . . . . . . . . . . . . . . . . . . . . . . . . . . . . . . . . . . . . . $ 875 $ 73 $(764)Adjustments to reconcile net earnings (losses) to net cash provided by (used in)operating activities:Depreciation and amortization . . . . . . . . . . . . . . . . . . . . . . . . . . . . . . . . . . . . 469 495 576Net pension and other postretirement benefits income and contributions . . . . . . (407) (234) (192)Net (gain) loss on sales of assets . . . . . . . . . . . . . . . . . . . . . . . . . . . . . . . . . . (3) (4) (5)Amortization of debt issuance costs . . . . . . . . . . . . . . . . . . . . . . . . . . . . . . . . 12 7 3Net (gain) loss on retirement of debt . . . . . . . . . . . . . . . . . . . . . . . . . . . . . . . . 15 (26) —Fixed asset impairment charges . . . . . . . . . . . . . . . . . . . . . . . . . . . . . . . . . . . . (1) 17 87Goodwill and intangible asset impairment charges. . . . . . . . . . . . . . . . . . . . . . — 30 787Deferred income taxes . . . . . . . . . . . . . . . . . . . . . . . . . . . . . . . . . . . . . . . . . . 56 (4) 12Share-based compensation expense . . . . . . . . . . . . . . . . . . . . . . . . . . . . . . . . . 13 14 20Exchangeable bond premium amortization . . . . . . . . . . . . . . . . . . . . . . . . . . . 9 — —Other — net . . . . . . . . . . . . . . . . . . . . . . . . . . . . . . . . . . . . . . . . . . . . . . . . . . (22) 7 (7)
Changes in assets and liabilities, net of effects of businesses acquired:Accounts receivable — net . . . . . . . . . . . . . . . . . . . . . . . . . . . . . . . . . . . . . . . (188) (312) 612Inventories . . . . . . . . . . . . . . . . . . . . . . . . . . . . . . . . . . . . . . . . . . . . . . . . . . . (113) 63 91Trade accounts payable . . . . . . . . . . . . . . . . . . . . . . . . . . . . . . . . . . . . . . . . . 223 47 (460)Prepaid expense and other assets. . . . . . . . . . . . . . . . . . . . . . . . . . . . . . . . . . . (14) 151 (67)Other liabilities . . . . . . . . . . . . . . . . . . . . . . . . . . . . . . . . . . . . . . . . . . . . . . . 128 131 80
Net cash provided by (used in) operating activities . . . . . . . . . . . . . . . . . . . 1,052 455 773 Investing ActivitiesCapital expenditures, including other intangible assets. . . . . . . . . . . . . . . . . . . . . (294) (201) (482)Acquisitions of businesses, net of cash acquired . . . . . . . . . . . . . . . . . . . . . . . . . — — (40)Net proceeds from asset sales . . . . . . . . . . . . . . . . . . . . . . . . . . . . . . . . . . . . . . . 7 4 15Other — net . . . . . . . . . . . . . . . . . . . . . . . . . . . . . . . . . . . . . . . . . . . . . . . . . . . . (2) — —
Net cash provided by (used in) investing activities. . . . . . . . . . . . . . . . . . . . (289) (197) (507)
Financing ActivitiesChange in short-term debt . . . . . . . . . . . . . . . . . . . . . . . . . . . . . . . . . . . . . . . . . 4 (48) 6Net (repayments on) proceeds from revolving credit facility . . . . . . . . . . . . . . . . — (203) (229)Proceeds from issuance of long-term debt, net of fees . . . . . . . . . . . . . . . . . . . . . 53 1,960 6Redemption of long-term debt . . . . . . . . . . . . . . . . . . . . . . . . . . . . . . . . . . . . . . (581) (2,225) (68)Proceeds from issuance of capital stock, net of fees . . . . . . . . . . . . . . . . . . . . . . — 269 —Proceeds from exercise of stock options . . . . . . . . . . . . . . . . . . . . . . . . . . . . . . . 76 6 4Dividends paid to noncontrolling interest . . . . . . . . . . . . . . . . . . . . . . . . . . . . . . (20) (9) (6)Capital contribution from noncontrolling interest. . . . . . . . . . . . . . . . . . . . . . . . . 5 — —
Net cash provided by (used in) financing activities . . . . . . . . . . . . . . . . . . . (463) (250) (287)Effect of exchange rate changes on cash . . . . . . . . . . . . . . . . . . . . . . . . . . . . . . . (10) 24 (118)
Increase (decrease) in cash and cash equivalents . . . . . . . . . . . . . . . . . . . . . . . . . 290 32 (139)Cash and cash equivalents at beginning of period . . . . . . . . . . . . . . . . . . . . . . . . 788 756 895
Cash and cash equivalents at end of period . . . . . . . . . . . . . . . . . . . . . . . . . . . . . $1,078 $ 788 $ 756
Supplemental Cash Flow Information:Interest paid. . . . . . . . . . . . . . . . . . . . . . . . . . . . . . . . . . . . . . . . . . . . . . . . . . . . $ 155 $ 192 $ 191Income tax paid — net . . . . . . . . . . . . . . . . . . . . . . . . . . . . . . . . . . . . . . . . . . . . $ 76 $ 61 $ 148
See accompanying notes to consolidated financial statements.
44

8/3/2019 TRW 2010 Annual Report
http://slidepdf.com/reader/full/trw-2010-annual-report 51/116
TRW Automotive Holdings Corp.
Consolidated Statements of Changes in Stockholders’ Equity
Shares Amount Shares Amount Shares Amount
2010 2009 2008
As of December 31,
(In millions, except for share amounts)
Capital Stock and Paid-in-CapitalBeginning Balance . . . . . . . . . . . . . . . . . . . . . . . . . 117,894,443 $1,554 101,172,769 $1,200 100,629,495 $ 1,177Sale of common stock under stock option plans . . . 4,250,959 76 340,957 6 266,254 —Issuance of common stock upon vesting of
restricted stock units . . . . . . . . . . . . . . . . . . . . 320,452 (5) 280,717 — 277,020 —Shares issued in public offering. . . . . . . . . . . . . . . — — 16,100,000 269 — —Share-based compensation expense . . . . . . . . . . . . 13 14 20Tax benefits on share-based compensation . . . . . . . 1 — 3Equity component of 3.5% exchangeable notes . . . . — 65 —
Ending Balance . . . . . . . . . . . . . . . . . . . . . . . . . . . 122,465,854 $1,639 117,894,443 $1,554 101,172,769 $ 1,200
Retained Earnings (Accumulated Deficit)Beginning Balance . . . . . . . . . . . . . . . . . . . . . . . . . $ (323) $ (378) $ 398
Net earnings (losses) attributable to TRW . . . . . . . . 834 55 (779)Impact of change in measurement date on benefit
plans . . . . . . . . . . . . . . . . . . . . . . . . . . . . . . . — — 3
Ending Balance . . . . . . . . . . . . . . . . . . . . . . . . . . . $ 511 $ (323) $ (378)
Accumulated Other Comprehensive Earnings (Losses)Beginning Balance . . . . . . . . . . . . . . . . . . . . . . . . . $ (71) $ 309 $ 1,617
Foreign currency translation . . . . . . . . . . . . . . . . . 12 126 (367)Retirement obligations, net of tax(a) . . . . . . . . . . . . (35) (648) (804)Deferred cash flow hedges, net of tax(b) . . . . . . . . . 7 142 (137)
Ending Balance . . . . . . . . . . . . . . . . . . . . . . . . . . . $ (87) $ (71) $ 309
Total TRW Stockholders’ EquityBeginning Balance . . . . . . . . . . . . . . . . . . . . . . . . . $1,160 $1,131 $ 3,192
Change in capital stock and paid-in-capital . . . . . . . 85 354 23Change in retained earnings (accumulated deficit) . . 834 55 (776)Change in accumulated other comprehensive
earnings (losses) . . . . . . . . . . . . . . . . . . . . . . . (16) (380) (1,308)
Ending Balance . . . . . . . . . . . . . . . . . . . . . . . . . . . $2,063 $1,160 $ 1,131
Noncontrolling Interest
Beginning Balance . . . . . . . . . . . . . . . . . . . . . . . . . $ 149 $ 137 $ 134Net earnings (losses) . . . . . . . . . . . . . . . . . . . . . . 41 18 15Foreign currency translation . . . . . . . . . . . . . . . . . — 3 (5)Cash dividends paid to noncontrolling interest . . . . . (20) (9) (7)Capital contribution from noncontrolling interest . . . 5 — —
Ending Balance . . . . . . . . . . . . . . . . . . . . . . . . . . . $ 175 $ 149 $ 137
Total Equity . . . . . . . . . . . . . . . . . . . . . . . . . . . . . . . $2,238 $1,309 $ 1,268
Comprehensive Earnings (Losses)Net earnings (losses) . . . . . . . . . . . . . . . . . . . . . . $ 875 $ 73 $ (764)Foreign currency translation . . . . . . . . . . . . . . . . . 12 129 (372)Retirement obligations, net of tax(a) . . . . . . . . . . . . (35) (648) (804)Deferred cash flow hedges, net of tax(b) . . . . . . . . . 7 142 (137)Impact of change in measurement date on benefit
plans . . . . . . . . . . . . . . . . . . . . . . . . . . . . . . . — — 3
Total comprehensive earnings (losses) . . . . . . . . . . . . $ 859 $ (304) $(2,074)
(a) Tax on retirement obligations for the years ended December 31, 2010, 2009 and 2008 was $(39) million,
$227 million, and $161 million, respectively.(b) Tax on deferred cash flow hedges as of December 31, 2010, 2009 and 2008 was $(3) million, $(28) million, and
$30 million, respectively.
See accompanying notes to consolidated financial statements.
45

8/3/2019 TRW 2010 Annual Report
http://slidepdf.com/reader/full/trw-2010-annual-report 52/116
TRW Automotive Holdings Corp.
Notes to Consolidated Financial Statements
1. Description of Business
TRWAutomotive Holdings Corp. (also referred to herein as the “Company”) is among the world’s largest and
most diversified suppliers of automotive systems, modules and components to global automotive original equip-
ment manufacturers (“OEMs”) and related aftermarkets. The Company conducts substantially all of its operationsthrough subsidiaries. These operations primarily encompass the design, manufacture and sale of active and passive
safety related products. Active safety related products principally refer to vehicle dynamic controls (primarily
braking and steering), and passive safety related products principally refer to occupant restraints (primarily airbags
and seat belts) and safety electronics (electronic control units and crash and occupant weight sensors). The
Company operates its business along four segments: Chassis Systems, Occupant Safety Systems, Electronics and
Automotive Components. The Company is primarily a “Tier 1” supplier (a supplier that sells to OEMs). In 2010,
approximately 85% of the Company’s end-customer sales were to major OEMs.
2. Basis of Presentation and Summary of Significant Accounting Policies
Basis of Presentation
The consolidated financial statements are prepared in accordance with United States generally acceptedaccounting principles (“GAAP”).
Summary of Significant Accounting Policies
Principles of Consolidation. The Company’s consolidation policy requires the consolidation of entities
where a controlling financial interest is held, as well as consolidation of variable interest entities (“VIEs”) in which
the Company is determined to have a controlling financial interest in accordance with the Financial Accounting
Standards Board (“FASB”) Accounting Standards Codification (“ASC”) 810 “Consolidations.” Investments in 20%
to 50% owned affiliates, which are not required to be consolidated, are accounted for under the equity method and
presented in other assets in the consolidated balance sheets. Equity in earnings from these investments is presented
separately in the consolidated statements of operations, net of tax. Intercompany accounts are eliminated.
Use of Estimates. The preparation of financial statements in conformity with GAAP requires management to
make estimates and assumptions that affect the reported amounts of assets and liabilities, disclosures of contingentassets and liabilities and reported amounts of revenues and expenses in the consolidated statements of operations.
Considerable judgment is often involved in making these determinations; the use of different assumptions could
result in significantly different results. Management believes its assumptions and estimates are reasonable and
appropriate. However, actual results could differ from those estimates.
Foreign Currency. The financial statements of foreign subsidiaries are translated to U.S. dollars at
end-of-period exchange rates for assets and liabilities and an average exchange rate for each period for revenues
and expenses. Translation adjustments for those subsidiaries whose local currency is their functional currency are
recorded as a component of accumulated other comprehensive earnings (losses) in stockholders’ equity. Trans-
action gains and losses arising from fluctuations in foreign currency exchange rates on transactions denominated in
currencies other than the functional currency are recognized in earnings as incurred, except for those transactions
which hedge purchase commitments and for those intercompany balances which are designated as being of a long-
term investment nature. Revenue Recognition. Sales are recognized in accordance with the criteria outlined in the Securities and
Exchange Commission (“SEC”) Staff Accounting Bulletin No. 104, “Revenue Recognition,” which requires that
sales be recognized when there is persuasive evidence of a sales agreement, the delivery of goods has occurred, the
sales price is fixed or determinable and collection of related billings is reasonably assured. Sales are recorded upon
shipment of product to customers and transfer of title and risk of loss under standard commercial terms (typically
F.O.B. shipping point). In those limited instances where other terms are negotiated and agreed, revenue is recorded
when title and risk of loss are transferred to the customer.
46

8/3/2019 TRW 2010 Annual Report
http://slidepdf.com/reader/full/trw-2010-annual-report 53/116
Earnings (Losses) per Share. Basic earnings (losses) per share are calculated by dividing net earnings
(losses) by the weighted average shares outstanding during the period. Diluted earnings (losses) per share reflect the
weighted average dilutive impact of all potentially dilutive securities from the date of issuance, including stock
options, restricted stock units and stock-settled stock appreciation rights. Further, if the inclusion of sharespotentially issuable for the Company’s 3.50% exchangeable senior unsecured notes (see Note 11) is more dilutive
than the inclusion of the interest expense for those exchangeable notes, the Company utilizes the “if-converted”
method to calculate diluted earnings per share. Under the if-converted method, the Company adjusts net earnings to
add back interest expense and amortization of the discount recognized on the exchangeable notes and includes the
number of shares potentially issuable related to the exchangeable notes in the weighted average shares outstanding.
If the average market price of the Company’s common stock exceeds the exercise price of stock options
outstanding or the fair market value on the date of grant of the stock-settled stock appreciation rights, the treasury
stock method is used to determine the incremental number of shares to be included in the diluted earnings per share
computation.
Net earnings (losses) attributable to TRW and the weighted average shares outstanding used in calculating
basic and diluted earnings (losses) per share were:
2010 2009 2008
Years Ended December 31,
(In millions, except per shareamounts)
Net earnings (losses) attributable to TRW . . . . . . . . . . . . . . . . . . . . . . $ 834 $ 55 $ (779)
Interest expense on exchangeable notes, net of tax of zero . . . . . . . . . . 9 — —
Amortization of discount on exchangeable notes, net of tax of zero . . . 9 — —
Net earnings (losses) attributable to TRW for purposes of calculatingdiluted earnings (losses) per share . . . . . . . . . . . . . . . . . . . . . . . . . . $ 852 $ 55 $ (779)
Basic:
Weighted average shares outstanding . . . . . . . . . . . . . . . . . . . . . . . . 119.8 107.8 101.1
Basic earnings (losses) per share . . . . . . . . . . . . . . . . . . . . . . . . . . . $ 6.96 $ 0.51 $ (7.71)
Diluted:
Weighted average shares outstanding . . . . . . . . . . . . . . . . . . . . . . . . 119.8 107.8 101.1
Effect of dilutive stock options, restricted stock units and stock-settled stock appreciation rights . . . . . . . . . . . . . . . . . . . . . . . . . . 2.7 0.9 —
Shares applicable to exchangeable notes . . . . . . . . . . . . . . . . . . . . . . 8.8 — —
Diluted weighted average shares outstanding . . . . . . . . . . . . . . . . . . 131.3 108.7 101.1
Diluted earnings (losses) per share . . . . . . . . . . . . . . . . . . . . . . . . . . $ 6.49 $ 0.51 $ (7.71)
For the year ended December 31, 2010 and 2009, the number of securities excluded from the calculation of
diluted earnings per share because the inclusion of such securities in the calculation would have been anti-dilutive
was de minimis and 3.2 million, respectively. For the year ended December 31, 2008, 8.6 million securities were
excluded from the calculation of diluted loss per share because the inclusion of any such securities in the calculation
would have been anti-dilutive due to the net loss.
In addition, shares potentially issuable for the exchangeable notes were not included in the calculation of
earnings (losses) per share for the year ended December 31, 2009 because inclusion of the shares would have been
less dilutive than inclusion of interest expense.
47
TRW Automotive Holdings Corp.
Notes to Consolidated Financial Statements — (Continued)
8/3/2019 TRW 2010 Annual Report
http://slidepdf.com/reader/full/trw-2010-annual-report 54/116
Cash and Cash Equivalents. Cash and cash equivalents include all highly liquid investments with remaining
maturity dates of three months or less at time of purchase.
Accounts Receivable. Receivables are stated at amounts estimated by management to be the net realizable
value. An allowance for doubtful accounts is recorded when it is probable amounts will not be collected based onspecific identification of customer circumstances or age of the receivable. The allowance for doubtful accounts was
$29 million and $40 million as of December 31, 2010 and 2009, respectively. Accounts receivable are written off
when it becomes apparent such amounts will not be collected. Collateral is not typically required, nor is interest
charged on accounts receivable balances.
Inventories. Inventories are stated at the lower of cost or market, with cost determined by the first-in, first-out
(FIFO) method. Cost includes the cost of materials, direct labor, in-bound freight and the applicable share of
manufacturing overhead.
Property, Plant and Equipment. Property, plant and equipment are stated at cost. Generally, estimated useful
lives are as follows:
Estimated
Useful Lives
Buildings . . . . . . . . . . . . . . . . . . . . . . . . . . . . . . . . . . . . . . . . . . . . . . . . . . . . . . . . 30 to 40 years
Machinery and equipment . . . . . . . . . . . . . . . . . . . . . . . . . . . . . . . . . . . . . . . . . . . . 5 to 10 years
Computers and capitalized software. . . . . . . . . . . . . . . . . . . . . . . . . . . . . . . . . . . . . 3 to 5 years
Depreciation is computed over the assets’ estimated useful lives, using the straight-line method for the
majority of depreciable assets. Amortization expense for assets held under capital leases is included in depreciation
expense.
Product Tooling. Product tooling is tooling that is limited to the manufacture of a specific part or parts of the
same basic design. Product tooling includes dies, patterns, molds and jigs. Customer-owned tooling for which
reimbursement was contractually guaranteed by the customer is classified in other assets on the consolidated
balance sheets. When contractually guaranteed charges are approved for billing to the customer, such charges are
reclassified into accounts receivable. Customer-owned tooling for which the Company has a non-cancellable rightto use the tooling is classified in other assets on the consolidated balance sheet. Tooling owned by the Company is
capitalized as property, plant and equipment, and amortized as cost of sales over its estimated economic life, not to
exceed five years.
Pre-production Costs. Pre-production engineering and research and development costs for which the
customer does not contractually guarantee reimbursement are expensed as incurred.
Goodwill and Other Intangible Assets. Goodwill and other indefinite-lived intangible assets are subject to
impairment analysis annually, or more frequently if an event occurs or circumstances indicate the carrying amount
may be impaired. Goodwill impairment testing is performed at the reporting unit level. The fair value of each
reporting unit is determined and compared to the carrying value. If the carrying value exceeds the fair value, then
possible goodwill impairment may exist and further evaluation is required.
Indefinite-lived intangible assets are tested for impairment by comparing the fair value to the carrying value. If
the carrying value exceeds the fair value, the asset is adjusted to fair value. Other definite-lived intangible assets are
amortized over their estimated useful lives, and tested for impairment in accordance with the methodology
discussed in “Asset Impairment Losses.”
Asset Impairment Losses. Asset impairment losses are recorded on long-lived assets and definite-lived
intangible assets when events and circumstances indicate that such assets may be impaired and the projected
undiscounted net cash flows to be generated by those assets are less than their carrying amounts. If estimated future
48
TRW Automotive Holdings Corp.
Notes to Consolidated Financial Statements — (Continued)

8/3/2019 TRW 2010 Annual Report
http://slidepdf.com/reader/full/trw-2010-annual-report 55/116
undiscounted cash flows are not sufficient to recover the carrying value of the assets, the assets are adjusted to their
fair values. Fair value is determined using appraisals or discounted cash flow calculations.
Environmental Costs. Costs related to environmental assessments and remediation efforts at current oper-
ating facilities, previously owned or operated facilities, and U.S. Environmental Protection Agency Superfund orother waste site locations are accrued when it is probable that a liability has been incurred and the amount of that
liability can be reasonably estimated. Estimated costs are recorded at undiscounted amounts, based on experience
and assessments, and are regularly evaluated. The liabilities are recorded in other current liabilities and long-term
liabilities in the consolidated balance sheets.
Debt Issuance Costs. The costs related to the issuance of long-term debt are deferred and amortized into
interest expense over the life of each respective debt issuance. Deferred amounts associated with debt extinguished
prior to maturity are expensed upon extinguishment as a loss on retirement of debt.
Warranties. Product warranty liabilities are recorded based upon management estimates including such
factors as the written agreement with the customer, the length of the warranty period, the historical performance of
the product and likely changes in performance of newer products and the mix and volume of products sold. Product
warranty liabilities are reviewed on a regular basis and adjusted to reflect actual experience.
The following table presents the movement in the product warranty liability for the periods indicated:
2010 2009
Years EndedDecember 31,
(Dollars inmillions)
Beginning balance . . . . . . . . . . . . . . . . . . . . . . . . . . . . . . . . . . . . . . . . . . . . . . . . . . $118 $108
Current period accruals, net of changes in estimates . . . . . . . . . . . . . . . . . . . . . . . . . 67 63
Used for purposes intended . . . . . . . . . . . . . . . . . . . . . . . . . . . . . . . . . . . . . . . . . . . (59) (58)
Effects of foreign currency translation . . . . . . . . . . . . . . . . . . . . . . . . . . . . . . . . . . . (2) 5
Ending balance . . . . . . . . . . . . . . . . . . . . . . . . . . . . . . . . . . . . . . . . . . . . . . . . . . . . $124 $118
Product Recall. The Company or its customers may decide to recall a product through a formal campaign
soliciting the return of specific products due to a known or suspected safety or performance concern. Recall costs
typically include the cost of the product being replaced, customer cost of the recall and labor to remove and replace
the defective part.
Recall costs are recorded based on management estimates developed utilizing actuarially established loss
projections based on historical claims data. Based on this actuarial estimation methodology, the Company accrues
for expected but unannounced recalls when revenues are recognized upon the shipment of product. In addition, as
recalls are announced, the Company reviews the actuarial estimation methodology and makes the appropriate
adjustments to the accrual, if necessary.
Research and Development. Research and development programs include research and development forcommercial products. Costs for such programs are expensed as incurred. Any reimbursements received from
customers are netted against such expenses. Research and development expenses were $132 million, $134 million,
and $179 million for the years ended December 31, 2010, 2009, and 2008, respectively. The 2009 and 2008
expenses have been adjusted to correspond with 2010 classifications.
Shipping and Handling. Shipping costs include payments to third-party shippers to move products to
customers. Handling costs include costs from the point the products were removed from finished goods inventory to
when provided to the shipper. Shipping and handling costs are expensed as incurred as cost of sales.
49
TRW Automotive Holdings Corp.
Notes to Consolidated Financial Statements — (Continued)

8/3/2019 TRW 2010 Annual Report
http://slidepdf.com/reader/full/trw-2010-annual-report 56/116
Income Taxes. Income taxes are accounted for in accordance with ASC 740, “Income Taxes,” under the asset
and liability method. Deferred tax assets and liabilities are recognized for the future tax consequences attributable to
differences between the financial statement carrying amounts of existing assets and liabilities and their respective
tax bases and operating loss and tax credit carryforwards. Deferred tax assets and liabilities are measured usingenacted tax rates expected to apply to taxable income in the years in which those temporary differences are expected
to be recovered or settled. The effect on deferred tax assets and liabilities of a change in tax rates is recognized in
income in the period that includes the enactment date. A valuation allowance is recognized to reduce the deferred
tax assets to the amount management believes is more likely than not to be realized.
Financial Instruments. The Company follows ASC 815, “Derivatives and Hedging,” in accounting for
financial instruments. Under ASC 815, the gain or loss on derivative instruments that have been designated and
qualify as hedges of the exposure to changes in the fair value of an asset or a liability, as well as the offsetting gain or
loss on the hedged item, are recognized in net earnings (losses) during the period of the change in fair values. For
derivative instruments that have been designated and qualify as hedges of the exposure to variability in expected
future cash flows, the gain or loss on the derivative is initially reported as a component of other comprehensive
earnings and reclassified to the consolidated statement of operations when the underlying hedged transaction affects
net earnings. Any gain or loss on the derivative in excess of the cumulative change in the present value of future cash
flows of the hedged item is recognized in net earnings (losses) during the period of change. Derivatives not
designated as hedges are adjusted to fair value through net earnings (losses).
Share-based Compensation. The Company recognizes compensation expense related to time-vested stock
options, stock-settled stock appreciation rights and restricted stock units subject to graded vesting using the straight-
line method over the applicable service period, in accordance with ASC 718, “Compensation — Stock
Compensation.”
Share-based awards that are settled in cash are subject to liability accounting. Accordingly, the fair value for
such awards are calculated on a quarterly basis based generally on a lattice model and the liability is adjusted, and
expense is recognized, based on changes to the fair value and the percentage of time vested.
Accumulated Other Comprehensive Earnings (Losses). The components of accumulated other comprehen-
sive earnings (losses), net of related tax, (excluding noncontrolling interest) are as follows:
2010 2009
As of December 31,
(Dollars inmillions)
Foreign currency translation, net . . . . . . . . . . . . . . . . . . . . . . . . . . . . . . . . . . . . . $ 158 $ 146
Retirement obligations, net. . . . . . . . . . . . . . . . . . . . . . . . . . . . . . . . . . . . . . . . . . (253) (218)
Unrealized net losses on cash flow hedges, net . . . . . . . . . . . . . . . . . . . . . . . . . . . 8 1
Accumulated other comprehensive earnings (losses) . . . . . . . . . . . . . . . . . . . . . . . $ (87) $ (71)
Recently Adopted Accounting Pronouncements. In January 2010, the FASB issued Accounting Standards
Update (“ASU”) No. 2010-06, “Fair Value Measurements and Disclosures (Topic 820),” which amends ASC 820.
ASU No. 2010-06 requires disclosures of significant transfers between Level 1 and Level 2 of the fair valuehierarchy. ASU No. 2010-06 further requires entities to report, on a gross basis, activity in the Level 3 fair value
measurement reconciliation beginning on January 1, 2011. The January 1, 2010 adoption of ASU No. 2010-06 did
not have a material impact on the Company’s consolidated financial statements.
In June 2009, the FASB issued Statement of Financial Accounting Standards (“SFAS”) No. 167, “Amend-
ments to FASB Interpretation 46(R) (FIN 46(R)),” which has been codified as ASU No. 2009-17. ASU No. 2009-17
requires that the assessment of whether an entity has a controlling financial interest in a VIE must be performed on
an ongoing basis. ASU No. 2009-17 also requires that the assessment to determine if an entity has a controlling
50
TRW Automotive Holdings Corp.
Notes to Consolidated Financial Statements — (Continued)

8/3/2019 TRW 2010 Annual Report
http://slidepdf.com/reader/full/trw-2010-annual-report 57/116
financial interest in a VIE must be qualitative in nature, and eliminates the quantitative assessment required in
ASC 810. The January 1, 2010 adoption of ASU No. 2009-17 did not have a material impact on the Company’s
consolidated financial statements.
In June 2009, the FASB issued SFAS No. 166, “Accounting for Transfers of Financial Assets — anAmendment of SFAS No. 140,” which has been codified as ASU No. 2009-16. ASU No. 2009-16 eliminates
the concept of a qualified special-purpose entity from GAAP. ASU No. 2009-16 also clarifies the language
surrounding when a transferor of financial assets has surrendered control over the transferred financial assets. ASU
No. 2009-16 establishes additional guidelines for the recognition of a sale related to the transfer of a portion of a
financial asset, and requires that all transfers be measured at fair value. The January 1, 2010 adoption of ASU
No. 2009-16 did not have a material impact on the Company’s consolidated financial statements.
Recently Issued Accounting Pronouncements. In October 2009, the FASB issued ASU No. 2009-13,
“Revenue Recognition (Topic 605): Multiple-Deliverable Revenue Arrangements — a Consensus of the FASB
Emerging Issues Task Force,” which amends ASC 605. ASU No. 2009-13 establishes a selling price hierarchy of
vendor-specific objective evidence (“VSOE”), followed by third party evidence, followed by estimated selling price
for the good or service, in that order. ASU No. 2009-13 is effective, on a prospective basis, for revenue arrangements
entered into for fiscal years beginning on or after June 15, 2010, with early adoption permitted. The adoption of ASU No. 09-13 will not have a material impact on the Company’s consolidated financial statements.
3. Inventories
The major classes of inventory are as follows:
2010 2009
As of December 31,
(Dollars inmillions)
Finished products and work in process . . . . . . . . . . . . . . . . . . . . . . . . . . . . . . . . . . . $369 $342
Raw materials and supplies . . . . . . . . . . . . . . . . . . . . . . . . . . . . . . . . . . . . . . . . . . . 391 318
Total inventories. . . . . . . . . . . . . . . . . . . . . . . . . . . . . . . . . . . . . . . . . . . . . . . . . . $760 $660
51
TRW Automotive Holdings Corp.
Notes to Consolidated Financial Statements — (Continued)
8/3/2019 TRW 2010 Annual Report
http://slidepdf.com/reader/full/trw-2010-annual-report 58/116
4. Property, Plant and Equipment
The major classes of property, plant and equipment are as follows:
2010 2009
As of December 31,
(Dollars in millions)
Property, plant and equipment:
Land and improvements . . . . . . . . . . . . . . . . . . . . . . . . . . . . . . . . . . . . . . . . $ 235 $ 237
Buildings . . . . . . . . . . . . . . . . . . . . . . . . . . . . . . . . . . . . . . . . . . . . . . . . . . . 746 771
Machinery and equipment. . . . . . . . . . . . . . . . . . . . . . . . . . . . . . . . . . . . . . . 4,487 4,427
Computers and capitalized software . . . . . . . . . . . . . . . . . . . . . . . . . . . . . . . 92 86
5,560 5,521
Accumulated depreciation and amortization:
Land and improvements . . . . . . . . . . . . . . . . . . . . . . . . . . . . . . . . . . . . . . . . (28) (23)
Buildings . . . . . . . . . . . . . . . . . . . . . . . . . . . . . . . . . . . . . . . . . . . . . . . . . . . (332) (310)
Machinery and equipment. . . . . . . . . . . . . . . . . . . . . . . . . . . . . . . . . . . . . . . (3,016) (2,778)
Computers and capitalized software . . . . . . . . . . . . . . . . . . . . . . . . . . . . . . . (84) (76)
(3,460) (3,187)
Total property, plant and equipment — net . . . . . . . . . . . . . . . . . . . . . . . . . . $ 2,100 $ 2,334
Depreciation expense was $447 million, $474 million, and $545 million for the years ended December 31,
2010, 2009 and 2008, respectively.
5. Goodwill and Intangible Assets
Goodwill
In the first quarter of 2009, the Company began to manage and report on the Electronics business separatelyfrom its other reporting units. The Electronics segment was derived from the Chassis Systems and Occupant Safety
Systems segments. In 2009, goodwill was reallocated using a relative fair value allocation approach, consistent with
the guidance under ASC 350, “Intangibles — Goodwill and Other.”
The changes in goodwill are as follows:
ChassisSystemsSegment
OccupantSafety
SystemsSegment
ElectronicsSegment
AutomotiveComponents
Segment Total
(Dollars in millions)
Balance as of December 31, 2008 . . . . . . $831 $ 934 $ — $— $1,765
Allocation of goodwill due to change insegment reporting. . . . . . . . . . . . . . . . . (31) (392) 423 — —
Effects of foreign currency translation . . . — 3 — — 3
Balance as of December 31, 2009 . . . . . . $800 $ 545 $423 $— $1,768
Effects of foreign currency translation . . . — (7) — — (7)
Balance as of December 31, 2010 . . . . . . $800 $ 538 $423 $— $1,761
Annual Impairment Analysis. The Company performed its annual impairment analysis of goodwill for its
Chassis Systems, Occupant Safety Systems and Electronics segments as of October 31, 2010 and 2009. Goodwill
52
TRW Automotive Holdings Corp.
Notes to Consolidated Financial Statements — (Continued)
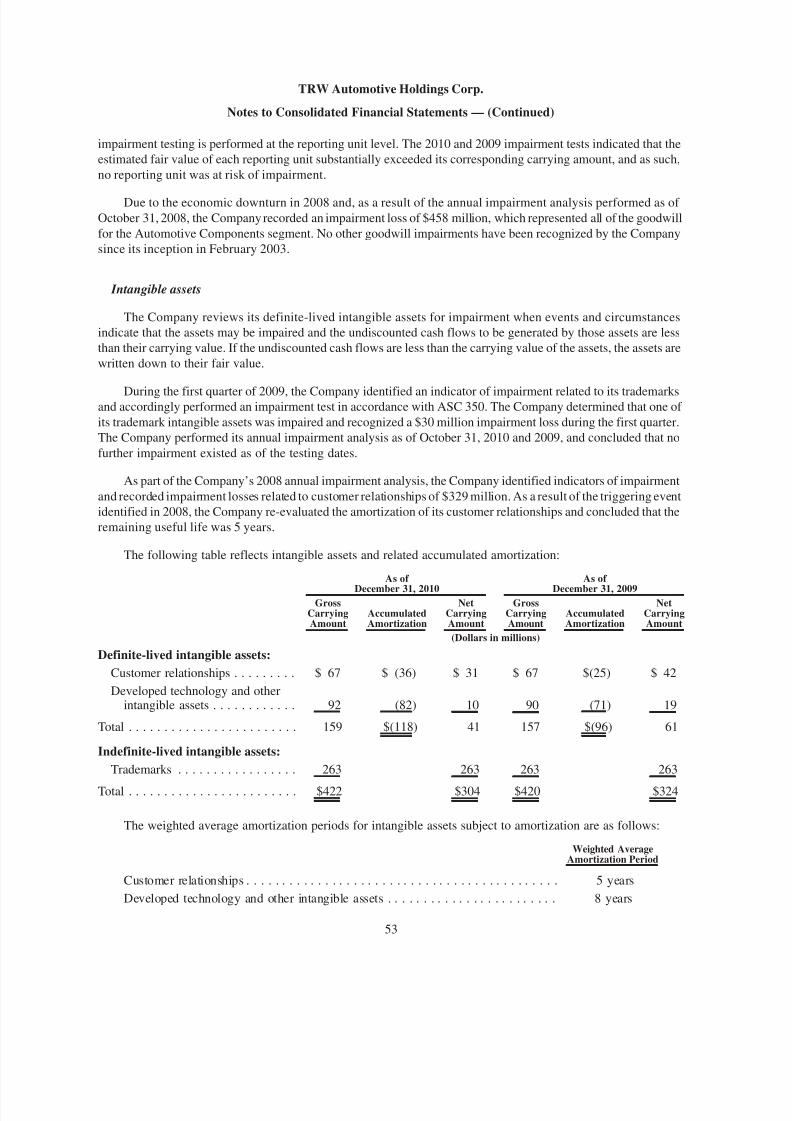
8/3/2019 TRW 2010 Annual Report
http://slidepdf.com/reader/full/trw-2010-annual-report 59/116
impairment testing is performed at the reporting unit level. The 2010 and 2009 impairment tests indicated that the
estimated fair value of each reporting unit substantially exceeded its corresponding carrying amount, and as such,
no reporting unit was at risk of impairment.
Due to the economic downturn in 2008 and, as a result of the annual impairment analysis performed as of
October 31, 2008, the Company recorded an impairment loss of $458 million, which represented all of the goodwill
for the Automotive Components segment. No other goodwill impairments have been recognized by the Company
since its inception in February 2003.
Intangible assets
The Company reviews its definite-lived intangible assets for impairment when events and circumstances
indicate that the assets may be impaired and the undiscounted cash flows to be generated by those assets are less
than their carrying value. If the undiscounted cash flows are less than the carrying value of the assets, the assets are
written down to their fair value.
During the first quarter of 2009, the Company identified an indicator of impairment related to its trademarksand accordingly performed an impairment test in accordance with ASC 350. The Company determined that one of
its trademark intangible assets was impaired and recognized a $30 million impairment loss during the first quarter.
The Company performed its annual impairment analysis as of October 31, 2010 and 2009, and concluded that no
further impairment existed as of the testing dates.
As part of the Company’s 2008 annual impairment analysis, the Company identified indicators of impairment
and recorded impairment losses related to customer relationships of $329 million. As a result of the triggering event
identified in 2008, the Company re-evaluated the amortization of its customer relationships and concluded that the
remaining useful life was 5 years.
The following table reflects intangible assets and related accumulated amortization:
GrossCarryingAmount
AccumulatedAmortization
NetCarryingAmount
GrossCarryingAmount
AccumulatedAmortization
NetCarryingAmount
As of
December 31, 2010
As of
December 31, 2009
(Dollars in millions)
Definite-lived intangible assets:
Customer relationships . . . . . . . . . $ 67 $ (36) $ 31 $ 67 $(25) $ 42
Developed technology and otherintangible assets . . . . . . . . . . . . 92 (82) 10 90 (71) 19
Total . . . . . . . . . . . . . . . . . . . . . . . . 159 $(118) 41 157 $(96) 61
Indefinite-lived intangible assets:
Trademarks . . . . . . . . . . . . . . . . . 263 263 263 263
Total . . . . . . . . . . . . . . . . . . . . . . . . $422 $304 $420 $324
The weighted average amortization periods for intangible assets subject to amortization are as follows:
Weighted AverageAmortization Period
Customer relationships . . . . . . . . . . . . . . . . . . . . . . . . . . . . . . . . . . . . . . . . . . . . 5 years
Developed technology and other intangible assets . . . . . . . . . . . . . . . . . . . . . . . . 8 years
53
TRW Automotive Holdings Corp.
Notes to Consolidated Financial Statements — (Continued)
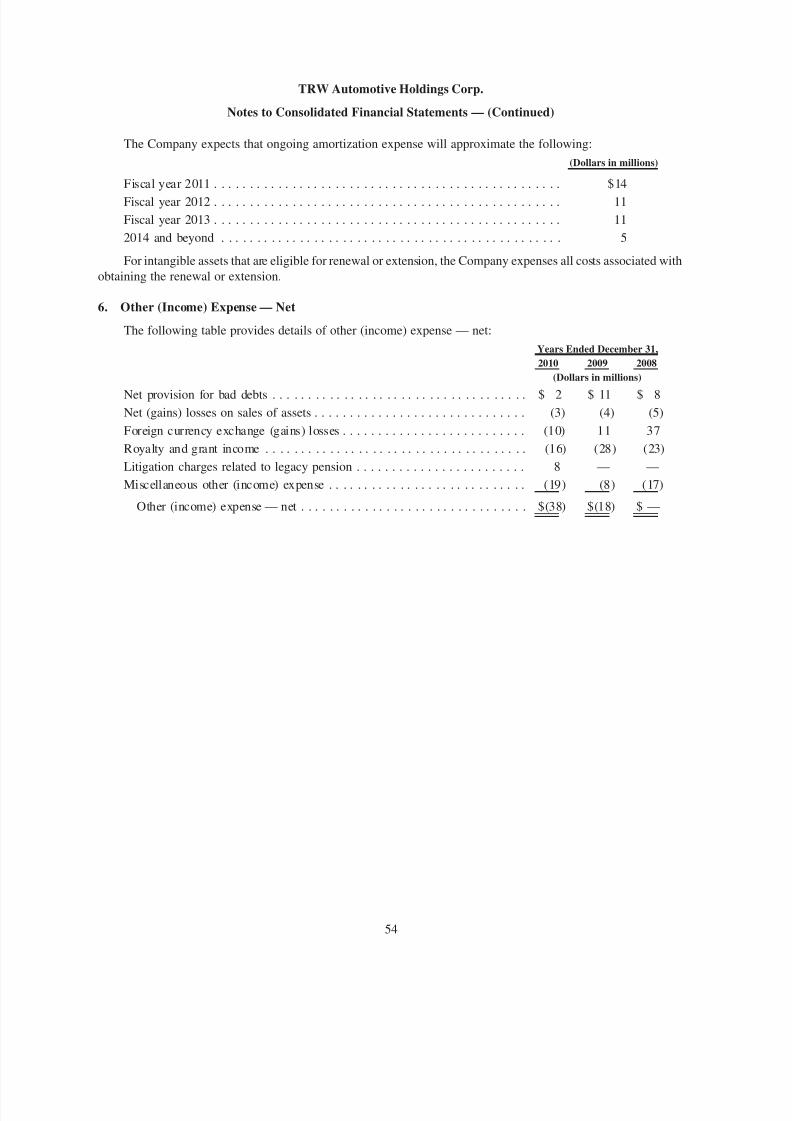
8/3/2019 TRW 2010 Annual Report
http://slidepdf.com/reader/full/trw-2010-annual-report 60/116
The Company expects that ongoing amortization expense will approximate the following:
(Dollars in millions)
Fiscal year 2011 . . . . . . . . . . . . . . . . . . . . . . . . . . . . . . . . . . . . . . . . . . . . . . . . . $14
Fiscal year 2012 . . . . . . . . . . . . . . . . . . . . . . . . . . . . . . . . . . . . . . . . . . . . . . . . . 11
Fiscal year 2013 . . . . . . . . . . . . . . . . . . . . . . . . . . . . . . . . . . . . . . . . . . . . . . . . . 11
2014 and beyond . . . . . . . . . . . . . . . . . . . . . . . . . . . . . . . . . . . . . . . . . . . . . . . . 5
For intangible assets that are eligible for renewal or extension, the Company expenses all costs associated with
obtaining the renewal or extension.
6. Other (Income) Expense — Net
The following table provides details of other (income) expense — net:
2010 2009 2008
Years Ended December 31,
(Dollars in millions)
Net provision for bad debts . . . . . . . . . . . . . . . . . . . . . . . . . . . . . . . . . . . . $ 2 $ 11 $ 8Net (gains) losses on sales of assets . . . . . . . . . . . . . . . . . . . . . . . . . . . . . . (3) (4) (5)
Foreign currency exchange (gains) losses . . . . . . . . . . . . . . . . . . . . . . . . . . (10) 11 37
Royalty and grant income . . . . . . . . . . . . . . . . . . . . . . . . . . . . . . . . . . . . . (16) (28) (23)
Litigation charges related to legacy pension . . . . . . . . . . . . . . . . . . . . . . . . 8 — —
Miscellaneous other (income) expense . . . . . . . . . . . . . . . . . . . . . . . . . . . . (19) (8) (17)
Other (income) expense — net . . . . . . . . . . . . . . . . . . . . . . . . . . . . . . . . $(38) $(18) $ —
54
TRW Automotive Holdings Corp.
Notes to Consolidated Financial Statements — (Continued)

8/3/2019 TRW 2010 Annual Report
http://slidepdf.com/reader/full/trw-2010-annual-report 61/116
7. Income Taxes
Income tax expense for each of the periods presented is as follows:
2010 2009 2008
Years Ended December 31,
(Dollars in millions)
The components of earnings (losses) before income taxes are as follows:
U.S. . . . . . . . . . . . . . . . . . . . . . . . . . . . . . . . . . . . . . . . . . . . . . . . . . . . . $ 390 $ 82 $(852)
Non-U.S. . . . . . . . . . . . . . . . . . . . . . . . . . . . . . . . . . . . . . . . . . . . . . . . . 651 58 214
$1,041 $140 $(638)
Significant components of the provision for income taxes are as follows:
Current . . . . . . . . . . . . . . . . . . . . . . . . . . . . . . . . . . . . . . . . . . . . . . . . . .
U.S. Federal . . . . . . . . . . . . . . . . . . . . . . . . . . . . . . . . . . . . . . . . . . . . $ — $ (1) $ (1)
Non-U.S. . . . . . . . . . . . . . . . . . . . . . . . . . . . . . . . . . . . . . . . . . . . . . . 108 72 114
U.S. State and Local . . . . . . . . . . . . . . . . . . . . . . . . . . . . . . . . . . . . . . 2 — 1Total current . . . . . . . . . . . . . . . . . . . . . . . . . . . . . . . . . . . . . . . . . . 110 71 114
Deferred
U.S. Federal . . . . . . . . . . . . . . . . . . . . . . . . . . . . . . . . . . . . . . . . . . . . 8 (2) 1
Non-U.S. . . . . . . . . . . . . . . . . . . . . . . . . . . . . . . . . . . . . . . . . . . . . . . 48 (2) 11
U.S. State and Local . . . . . . . . . . . . . . . . . . . . . . . . . . . . . . . . . . . . . . — — —
Total deferred . . . . . . . . . . . . . . . . . . . . . . . . . . . . . . . . . . . . . . . . . 56 (4) 12
Income tax expense . . . . . . . . . . . . . . . . . . . . . . . . . . . . . . . . . . . . . . . . . $ 166 $ 67 $ 126
The reconciliation of income taxes calculated at the U.S. Federalstatutory income tax rate of 35% to income tax expense is:
Income taxes at U.S. statutory rate. . . . . . . . . . . . . . . . . . . . . . . . . . . . . . $ 364 $ 49 $(223)U.S. state and local income taxes net of U.S. federal tax benefit . . . . . . . . — — 1
Difference in income tax on foreign earnings, losses and remittances . . . . (36) 1 14
Tax holidays and incentives . . . . . . . . . . . . . . . . . . . . . . . . . . . . . . . . . . . (23) (17) (13)
Valuation allowance . . . . . . . . . . . . . . . . . . . . . . . . . . . . . . . . . . . . . . . . (144) 44 350
Intraperiod tax allocation from other comprehensive earnings . . . . . . . . . . — (5) (2)
Nondeductible expenses . . . . . . . . . . . . . . . . . . . . . . . . . . . . . . . . . . . . . . 6 3 3
Other . . . . . . . . . . . . . . . . . . . . . . . . . . . . . . . . . . . . . . . . . . . . . . . . . . . (1) (8) (4)
$ 166 $ 67 $ 126
55
TRW Automotive Holdings Corp.
Notes to Consolidated Financial Statements — (Continued)
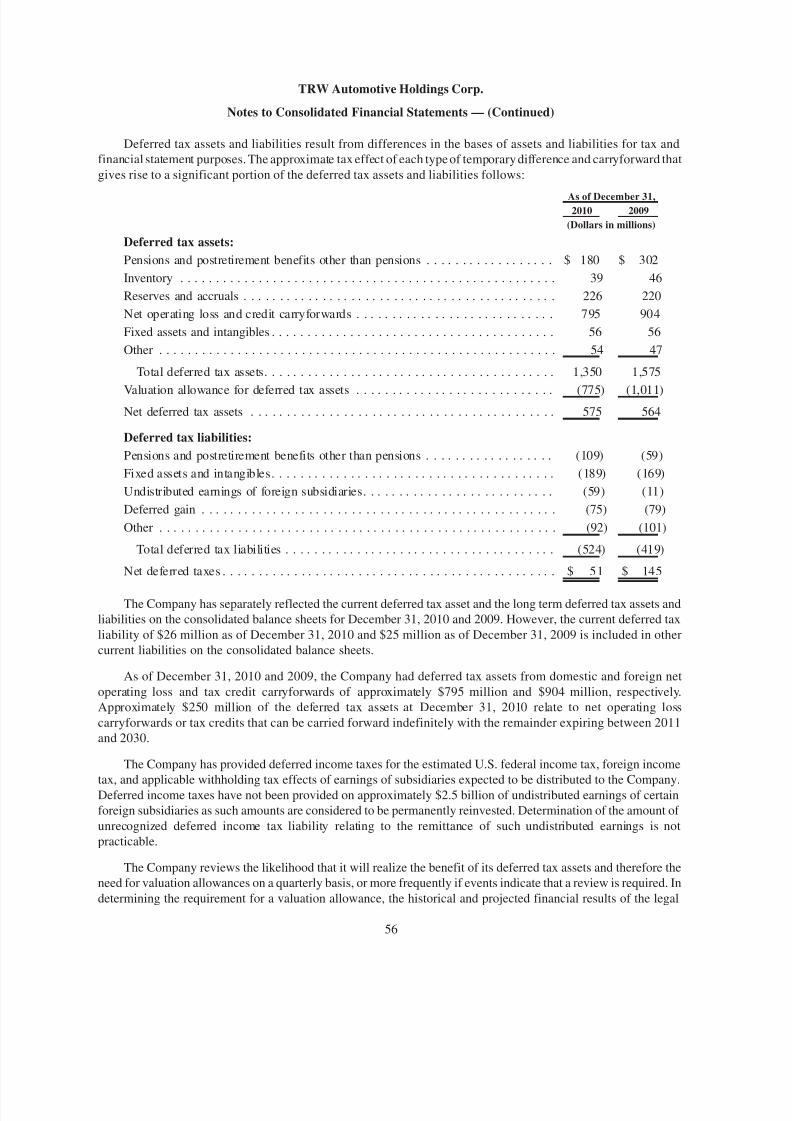
8/3/2019 TRW 2010 Annual Report
http://slidepdf.com/reader/full/trw-2010-annual-report 62/116
Deferred tax assets and liabilities result from differences in the bases of assets and liabilities for tax and
financial statement purposes. The approximate tax effect of each type of temporary difference and carryforward that
gives rise to a significant portion of the deferred tax assets and liabilities follows:
2010 2009As of December 31,
(Dollars in millions)
Deferred tax assets:
Pensions and postretirement benefits other than pensions . . . . . . . . . . . . . . . . . . $ 180 $ 302
Inventory . . . . . . . . . . . . . . . . . . . . . . . . . . . . . . . . . . . . . . . . . . . . . . . . . . . . . 39 46
Reserves and accruals . . . . . . . . . . . . . . . . . . . . . . . . . . . . . . . . . . . . . . . . . . . . 226 220
Net operating loss and credit carryforwards . . . . . . . . . . . . . . . . . . . . . . . . . . . . 795 904
Fixed assets and intangibles . . . . . . . . . . . . . . . . . . . . . . . . . . . . . . . . . . . . . . . . 56 56
Other . . . . . . . . . . . . . . . . . . . . . . . . . . . . . . . . . . . . . . . . . . . . . . . . . . . . . . . . 54 47
Total deferred tax assets. . . . . . . . . . . . . . . . . . . . . . . . . . . . . . . . . . . . . . . . . 1,350 1,575
Valuation allowance for deferred tax assets . . . . . . . . . . . . . . . . . . . . . . . . . . . . (775) (1,011)Net deferred tax assets . . . . . . . . . . . . . . . . . . . . . . . . . . . . . . . . . . . . . . . . . . . 575 564
Deferred tax liabilities:
Pensions and postretirement benefits other than pensions . . . . . . . . . . . . . . . . . . (109) (59)
Fixed assets and intangibles. . . . . . . . . . . . . . . . . . . . . . . . . . . . . . . . . . . . . . . . (189) (169)
Undistributed earnings of foreign subsidiaries. . . . . . . . . . . . . . . . . . . . . . . . . . . (59) (11)
Deferred gain . . . . . . . . . . . . . . . . . . . . . . . . . . . . . . . . . . . . . . . . . . . . . . . . . . (75) (79)
Other . . . . . . . . . . . . . . . . . . . . . . . . . . . . . . . . . . . . . . . . . . . . . . . . . . . . . . . . (92) (101)
Total deferred tax liabilities . . . . . . . . . . . . . . . . . . . . . . . . . . . . . . . . . . . . . . (524) (419)
Net deferred taxes . . . . . . . . . . . . . . . . . . . . . . . . . . . . . . . . . . . . . . . . . . . . . . . $ 51 $ 145
The Company has separately reflected the current deferred tax asset and the long term deferred tax assets and
liabilities on the consolidated balance sheets for December 31, 2010 and 2009. However, the current deferred tax
liability of $26 million as of December 31, 2010 and $25 million as of December 31, 2009 is included in other
current liabilities on the consolidated balance sheets.
As of December 31, 2010 and 2009, the Company had deferred tax assets from domestic and foreign net
operating loss and tax credit carryforwards of approximately $795 million and $904 million, respectively.
Approximately $250 million of the deferred tax assets at December 31, 2010 relate to net operating loss
carryforwards or tax credits that can be carried forward indefinitely with the remainder expiring between 2011
and 2030.
The Company has provided deferred income taxes for the estimated U.S. federal income tax, foreign income
tax, and applicable withholding tax effects of earnings of subsidiaries expected to be distributed to the Company.Deferred income taxes have not been provided on approximately $2.5 billion of undistributed earnings of certain
foreign subsidiaries as such amounts are considered to be permanently reinvested. Determination of the amount of
unrecognized deferred income tax liability relating to the remittance of such undistributed earnings is not
practicable.
The Company reviews the likelihood that it will realize the benefit of its deferred tax assets and therefore the
need for valuation allowances on a quarterly basis, or more frequently if events indicate that a review is required. In
determining the requirement for a valuation allowance, the historical and projected financial results of the legal
56
TRW Automotive Holdings Corp.
Notes to Consolidated Financial Statements — (Continued)

8/3/2019 TRW 2010 Annual Report
http://slidepdf.com/reader/full/trw-2010-annual-report 63/116
entity or consolidated group recording the net deferred tax asset is considered, along with all other available positive
and negative evidence. The factors considered by management in its determination of the probability of the
realization of the deferred tax assets include: historical taxable income, projected future taxable income, the
expected timing of the reversals of existing temporary differences and tax planning strategies. If, based upon theweight of available evidence, it is more likely than not the deferred tax asset will not be realized, a valuation
allowance is recorded. Management believes it is more likely than not that the net deferred tax asset in the United
States and certain foreign jurisdictions may not be realized in the future. Accordingly, the Company continues to
maintain a valuation allowance related to the net deferred tax assets in the United States and certain foreign
jurisdictions.
There is no corresponding income tax benefit recognized with respect to losses incurred and no corresponding
income tax expense recognized with respect to earnings generated in jurisdictions with a valuation allowance. This
causes variability in our effective tax rate. The Company intends to maintain the valuation allowance until it is more
likely than not that the net deferred tax asset will be realized. If operating results improve or deteriorate on a
sustained basis, our conclusions regarding the need for a valuation allowance could change, resulting in either the
reversal or initial recognition of a valuation allowance in the future, which could have a significant impact on
income tax expense in the period recognized and subsequent periods.
As part of the review in determining the need for a valuation allowance, the Company assesses the potential
release of existing valuation allowances. Based upon this assessment, the Company has concluded that there is more
than a remote possibility that the existing valuation allowance on U.S. net deferred tax assets could be released. As
of December 31, 2010, the U.S. valuation allowance is approximately $500 million. If such a release of the valuation
allowance occurs, it will have a significant impact on net income in the quarter in which it is deemed appropriate to
release the reserve.
During 2010, the Company recorded a tax benefit of $12 million resulting from changes in assessments
regarding the potential realization of deferred tax assets and the resulting reversal of a valuation allowance on net
deferred tax assets of certain subsidiaries in China, Romania, and Slovakia. During 2009, the Company recorded a
tax charge of $33 million resulting from changes in assessments regarding the potential realization of deferred tax
assets, consisting of a tax expense of approximately $20 million in recording a valuation allowance against the net
deferred tax assets of a Spanish subsidiary, and approximately $13 million in recording a valuation allowanceagainst the net deferred tax assets of various subsidiaries in the Czech Republic, China, and Italy.
At December 31, 2010, 2009, and 2008, the Company had $172 million, $166 million, and $213 million of
gross unrecognized tax benefits, respectively. In addition, at December 31, 2010, 2009, and 2008 the amount of
unrecognized tax benefits that, if recognized, would affect the effective tax rate was $121 million, $105 million, and
$108 million, respectively. The gross unrecognized tax benefits differ from the amount that would affect the
effective tax rate due to the impact of valuation allowances, and foreign country offsets relating to transfer pricing
adjustments.
57
TRW Automotive Holdings Corp.
Notes to Consolidated Financial Statements — (Continued)
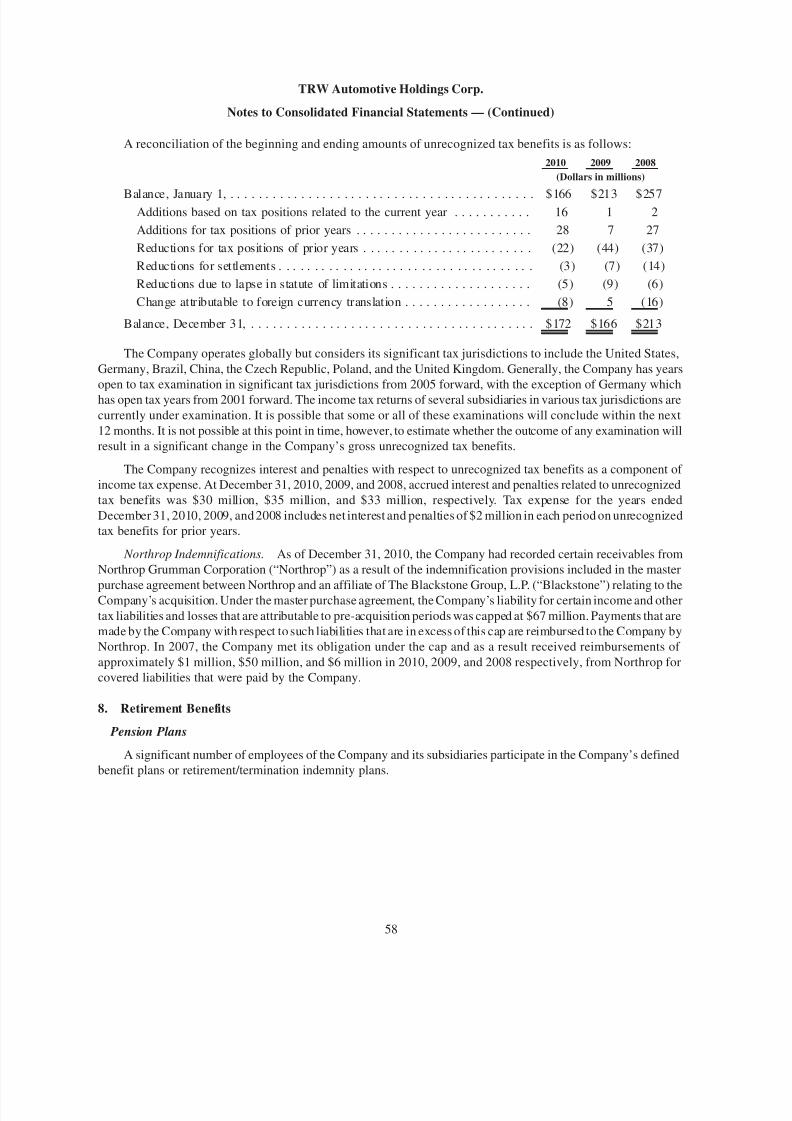
8/3/2019 TRW 2010 Annual Report
http://slidepdf.com/reader/full/trw-2010-annual-report 64/116
A reconciliation of the beginning and ending amounts of unrecognized tax benefits is as follows:
2010 2009 2008
(Dollars in millions)
Balance, January 1, . . . . . . . . . . . . . . . . . . . . . . . . . . . . . . . . . . . . . . . . . . . $166 $213 $257Additions based on tax positions related to the current year . . . . . . . . . . . 16 1 2
Additions for tax positions of prior years . . . . . . . . . . . . . . . . . . . . . . . . . 28 7 27
Reductions for tax positions of prior years . . . . . . . . . . . . . . . . . . . . . . . . (22) (44) (37)
Reductions for settlements . . . . . . . . . . . . . . . . . . . . . . . . . . . . . . . . . . . . (3) (7) (14)
Reductions due to lapse in statute of limitations . . . . . . . . . . . . . . . . . . . . (5) (9) (6)
Change attributable to foreign currency translation . . . . . . . . . . . . . . . . . . (8) 5 (16)
Balance, December 31, . . . . . . . . . . . . . . . . . . . . . . . . . . . . . . . . . . . . . . . . $172 $166 $213
The Company operates globally but considers its significant tax jurisdictions to include the United States,
Germany, Brazil, China, the Czech Republic, Poland, and the United Kingdom. Generally, the Company has years
open to tax examination in significant tax jurisdictions from 2005 forward, with the exception of Germany which
has open tax years from 2001 forward. The income tax returns of several subsidiaries in various tax jurisdictions are
currently under examination. It is possible that some or all of these examinations will conclude within the next
12 months. It is not possible at this point in time, however, to estimate whether the outcome of any examination will
result in a significant change in the Company’s gross unrecognized tax benefits.
The Company recognizes interest and penalties with respect to unrecognized tax benefits as a component of
income tax expense. At December 31, 2010, 2009, and 2008, accrued interest and penalties related to unrecognized
tax benefits was $30 million, $35 million, and $33 million, respectively. Tax expense for the years ended
December 31, 2010, 2009, and 2008 includes net interest and penalties of $2 million in each period on unrecognized
tax benefits for prior years.
Northrop Indemnifications. As of December 31, 2010, the Company had recorded certain receivables from
Northrop Grumman Corporation (“Northrop”) as a result of the indemnification provisions included in the master
purchase agreement between Northrop and an affiliate of The Blackstone Group, L.P. (“Blackstone”) relating to theCompany’s acquisition. Under the master purchase agreement, the Company’s liability for certain income and other
tax liabilities and losses that are attributable to pre-acquisition periods was capped at $67 million. Payments that are
made by the Company with respect to such liabilities that are in excess of this cap are reimbursed to the Company by
Northrop. In 2007, the Company met its obligation under the cap and as a result received reimbursements of
approximately $1 million, $50 million, and $6 million in 2010, 2009, and 2008 respectively, from Northrop for
covered liabilities that were paid by the Company.
8. Retirement Benefits
Pension Plans
A significant number of employees of the Company and its subsidiaries participate in the Company’s defined
benefit plans or retirement/termination indemnity plans.
58
TRW Automotive Holdings Corp.
Notes to Consolidated Financial Statements — (Continued)

8/3/2019 TRW 2010 Annual Report
http://slidepdf.com/reader/full/trw-2010-annual-report 65/116
The following table provides a reconciliation of the changes in the plans’ benefit obligation and fair value of
assets for the years ended December 31, 2010 and December 31, 2009 and a statement of the funded status as of
December 31, 2010 and 2009:
U.S. U.K.Rest of World U.S. U.K.
Rest of World
2010 2009
(Dollars in millions)
Total accumulated benefit obligation atDecember 31, . . . . . . . . . . . . . . . . . . . . . . . . . . $1,152 $4,381 $ 717 $1,082 $4,602 $ 741
Change in benefit obligation:
Benefit obligations at beginning of period . . . . . . . $1,085 $4,602 $ 789 $1,066 $3,651 $ 659
Service cost . . . . . . . . . . . . . . . . . . . . . . . . . . . . 6 — 18 10 12 16
Interest cost . . . . . . . . . . . . . . . . . . . . . . . . . . . . 63 250 39 65 248 40
Plan amendments . . . . . . . . . . . . . . . . . . . . . . . . — — 2 (2) — 1
Actuarial (gain) loss . . . . . . . . . . . . . . . . . . . . . . 105 (47) (18) 41 713 82
Foreign currency exchange rate changes . . . . . . . — (122) (18) — 315 52
Curtailment / settlement (gain) loss . . . . . . . . . . (33) (5) (3) (6) (32) (3)
Plan participant contributions . . . . . . . . . . . . . . . — — — — 2 —
Benefits paid . . . . . . . . . . . . . . . . . . . . . . . . . . . (67) (297) (49) (89) (307) (58)
Benefit obligations at December 31,. . . . . . . . . . . . 1,159 4,381 760 1,085 4,602 789
Change in plan assets:
Fair value of plan assets at beginning of period . . . 779 4,775 274 705 4,449 221
Actual return on plan assets, less plan expense . . 101 388 21 127 186 31
Foreign currency exchange rate changes . . . . . . . — (127) 13 — 380 34
Company contributions . . . . . . . . . . . . . . . . . . . 143 93 38 38 2 46
Plan participant contributions . . . . . . . . . . . . . . . — — — — 2 —Settlements . . . . . . . . . . . . . . . . . . . . . . . . . . . . (29) (5) — (2) — —
Transfer in . . . . . . . . . . . . . . . . . . . . . . . . . . . . . — — — — 63 —
Benefits paid . . . . . . . . . . . . . . . . . . . . . . . . . . . (67) (297) (49) (89) (307) (58)
Fair value of plan assets at December 31, . . . . . . . . 927 4,827 297 779 4,775 274
Funded status at December 31,. . . . . . . . . . . . . . . . $ (232) $ 446 $(463) $ (306) $ 173 $(515)
In 2010, certain supplemental retirement plans were settled resulting in a reduction in the obligations as well as
payments of $29 million and $5 million in the U.S. and U.K., respectively. Also in 2010, the U.S. salaried pension
plan was closed to future benefit accruals resulting in a reduction in the obligation of $4 million in the U.S. In 2009,
the U.K. pension plan was closed to future benefit accruals, resulting in a $32 million reduction in the related benefit
obligations.
59
TRW Automotive Holdings Corp.
Notes to Consolidated Financial Statements — (Continued)

8/3/2019 TRW 2010 Annual Report
http://slidepdf.com/reader/full/trw-2010-annual-report 66/116
The following table provides the amounts recognized in the consolidated balance sheets:
U.S. U.K. Rest of World U.S. U.K. Rest of World
2010 2009
As of December 31,
(Dollars in millions)
Non-current assets . . . . . . . . . . . . . . . . . . . . . . $ 2 $446 $ 6 $ 1 $173 $ 5
Current liabilities . . . . . . . . . . . . . . . . . . . . . . . — — (22) — — (23)
Long-term liabilities . . . . . . . . . . . . . . . . . . . . (234) — (447) (307) — (497)
Net amount recognized . . . . . . . . . . . . . . . . . . $(232) $446 $(463) $(306) $173 $(515)
The pre-tax amounts recognized in accumulated other comprehensive earnings (losses) consist of:
U.S. U.K.Rest of World U.S. U.K.
Rest of World
2010 2009
As of December 31,
(Dollars in millions)Prior service benefit (cost) . . . . . . . . . . . . . . . $ (4) $ — $ (4) $ 36 $ — $ (3)
Net gain (loss) . . . . . . . . . . . . . . . . . . . . . . . (204) (189) (80) (136) (305) (98)
Accumulated other comprehensive earnings(loss) . . . . . . . . . . . . . . . . . . . . . . . . . . . . $(208) $(189) $(84) $(100) $(305) $(101)
Information for pension plans with an accumulated benefit obligation in excess of plan assets is as follows:
U.S.Rest of World U.S.
Rest of World
2010 2009
As of December 31,
(Dollars in millions)
Projected benefit obligation . . . . . . . . . . . . . . . . . . . . . . . . . . $1,138 $726 $1,065 $755
Accumulated benefit obligation . . . . . . . . . . . . . . . . . . . . . . . 1,132 683 1,062 709
Fair value of assets . . . . . . . . . . . . . . . . . . . . . . . . . . . . . . . . 904 257 758 237
60
TRW Automotive Holdings Corp.
Notes to Consolidated Financial Statements — (Continued)

8/3/2019 TRW 2010 Annual Report
http://slidepdf.com/reader/full/trw-2010-annual-report 67/116
The following table provides the components of net pension cost (income) and other amounts recognized in
other comprehensive (earnings) loss for the Company’s defined benefit pension plans and defined contribution
plans:
U.S. U.K.Rest of World U.S. U.K.
Rest of World U.S. U.K.
Rest of World
2010 2009 2008Years Ended December 31,
(Dollars in millions)
Net pension cost (income)
Defined benefit plans:
Service cost . . . . . . . . . . . . . . . . . $ 6 $ — $ 18 $ 10 $ 12 $ 16 $ 18 $ 32 $ 20
Interest cost . . . . . . . . . . . . . . . . . 63 250 39 65 248 40 63 294 41
Expected return on plan assets . . . . (77) (327) (21) (81) (339) (18) (83) (387) (19)
Curtailment/Settlement (gain)loss . . . . . . . . . . . . . . . . . . . . . (26) 1 (1) 1 — — (1) — —
Amortization of prior service
(benefit) cost . . . . . . . . . . . . . . (5) — — (5) — — (9) — 1Amortization of net (gain) loss . . . — — 2 (2) (28) (1) (5) — —
Defined benefit plans . . . . . . . . (39) (76) 37 (12) (107) 37 (17) (61) 43
Defined contribution plans cost . . . 12 — 12 3 — 10 13 — 13
Net pension cost (income) . . . . . (27) (76) 49 (9) (107) 47 (4) (61) 56
Other changes in plan assets andbenefit obligations recognizedin other comprehensive(earnings) loss
Prior service (benefit) cost . . . . . . 35 — 1 4 — (4) 15 — 1
Net (gain) loss . . . . . . . . . . . . . . . 68 (116) (16) (10) 735 76 372 596 (1)
Amortization of prior service
benefit (cost) . . . . . . . . . . . . . . 5 — — 5 — — 9 — (1)Amortization of net gain (loss) . . . — — (2) 2 28 1 5 — —
Total recognized in othercomprehensive (earnings) loss . . 108 (116) (17) 1 763 73 401 596 (1)
Total recognized net pension(income) cost and othercomprehensive (earnings) loss . . $ 81 $(192) $ 32 $ (8) $ 656 $120 $397 $ 535 $ 55
During the year ended December 31, 2010, the Company recorded a gain of $35 million related to the
curtailment of the U.S. salaried pension plan, partially offset by a $9 million loss on settlement of certain
supplemental retirement plans in the U.S.
The amounts that will be amortized from accumulated other comprehensive earnings over the next fiscal year
are not material.
61
TRW Automotive Holdings Corp.
Notes to Consolidated Financial Statements — (Continued)

8/3/2019 TRW 2010 Annual Report
http://slidepdf.com/reader/full/trw-2010-annual-report 68/116
Plan Assumptions. The weighted-average assumptions used to determine net periodic benefit cost were:
U.S. U.K. Rest of World U.S. U.K. Rest of World U.S. U.K. Rest of World
2010 2009 2008
Years Ended December 31,
Discount rate . . . . . . . . . . . . . . . . . 6.00% 5.75% 5.27% 6.25% 6.50% 6.22% 6.00% 5.75% 5.35%
Expected long-term return on planassets . . . . . . . . . . . . . . . . . . . . . 8.36% 6.50% 6.69% 8.50% 6.75% 6.56% 8.50% 6.75% 6.73%
Rate of increase in compensationlevels . . . . . . . . . . . . . . . . . . . . . 4.00% N/A 2.84% 4.00% 3.75% 2.84% 4.00% 3.75% 2.90%
To develop the expected long-term rate of return on assets assumption, the Company considered the historical
returns and the future expectations for returns for each asset class, as well as the target asset allocation of the pension
portfolio. In 2009, the U.K. pension plan was closed to future benefits, therefore the rate of increase in
compensation was not applicable in determining the net period benefit cost for 2010 or in determining the benefit
obligation as of December 31, 2010 and 2009.
The weighted-average assumptions used to calculate the benefit obligations were:
U.S. U.K.Rest of World U.S. U.K.
Rest of World
2010 2009
As of December 31,
Discount rate . . . . . . . . . . . . . . . . . . . . . . . . . . . . . . . . . . . . 5.50% 5.50% 5.44% 6.00% 5.75% 5.27%
Rate of increase in compensation levels . . . . . . . . . . . . . . . . 4.78% N/A 2.89% 4.00% N/A 2.84%
Plan Assets. The U.S. and U.K. plan assets represent approximately 95% of the total plan assets of defined
benefit plans. All remaining assets are deemed immaterial and not reflected below.
In 2009, the U.K. pension plan became the beneficiary of certain assets of a separate and unrelated benefit
trust. Such assets approximated $63 million and are reflected above in the change in assets as a transfer in.
The Company and fiduciaries have set target investment allocations for its U.S. and U.K. plan assets. The
U.S. plan seeks a target allocation of 60% in equity investments and 40% in fixed income investments. The U.K.
plan fiduciaries set the asset allocation to achieve a rate of return in excess of the discount rate used for liability
valuation purposes. As of December 31, 2010, this resulted in an asset allocation of 15% in equity and structured
equity investments, 48% in fixed income investments, 6% in real estate, and 31% in cash and other investments.
Equity investments include investments in large-cap and mid-cap companies and mutual funds located throughout
the world. Structured equity investments include equity option “collar” structures which reduce the outright
exposure to falls in the levels of underlying equity markets. Fixed income securities include corporate bonds of
companies from diversified industries. Real estate includes investments in real estate and funds that invest in real
estate. Cash and other investments primarily include cash held by the plan, U.K. government treasuries and certain
types of derivative instruments including interest rate and inflation swaps that are utilized to manage risks
associated with the assets held by the plan.
The goals and investment objectives of the asset strategy are to ensure that there is an adequate level of assets to
meet benefit obligations to participants and retirees over the life of the participants and maintain liquidity in the
plan’s assets sufficient to cover current benefit obligations. Risk is managed by investing in a broad range of asset
classes and the use of liability matching derivative instruments. Within the asset classes, investments are made in a
broad range of individual securities. There are no equity securities of the Company in the equity asset category.
In 2009, the Trustees for the U.K. pension plan approved a realignment of the existing policy in order to reduce
the volatility and risk in the investment performance as well as to increase the investment allocation in a liability
62
TRW Automotive Holdings Corp.
Notes to Consolidated Financial Statements — (Continued)

8/3/2019 TRW 2010 Annual Report
http://slidepdf.com/reader/full/trw-2010-annual-report 69/116
driven cash-flow matching strategy. This realignment provides for an increase in the plan’s interest rate and inflation
hedging program as well as a reduction in the exposure to downside risk in equity markets. The realigned asset
portfolio is expected to yield a similar long-term return as compared to the previous asset portfolio but with a closer
matching of investment cash flows to expected future liability outflows.ASC 820, “Fair Value Measurements and Disclosures,” prioritizes the inputs to valuation techniques used to
measure fair value into a three-level hierarchy. This hierarchy gives the highest priority to quoted prices in active
markets for identical assets and liabilities and lowest priority to unobservable inputs, as follows:
Level 1. The Company utilizes the market approach to determine the fair value of its assets under
Level 1 of the fair value hierarchy. The market approach pertains to transactions in active markets involving
identical or comparable assets.
Level 2. The fair values determined through Level 2 of the fair value hierarchy are derived principally
from or corroborated by observable market data. Inputs include quoted prices for similar assets and market-
corroborated inputs, such as market comparables, interest rates, yield curves and other items that allow value to
be determined.
Level 3. The fair values determined through Level 3 of the fair value hierarchy are derived principallyfrom unobservable inputs provided by the trustee.
The fair value of the Company’s U.S. and U.K. pension plan assets, by asset category, is as follows:
Level 1 Level 2 Level 3 Level 1 Level 2 Level 3
2010 2009
As of December 31,
(Dollars in millions)
Cash and cash equivalents . . . . . . . . . . . . . . . . . . . $1,386 $ — $— $1,363 $ — $—
Corporate bonds . . . . . . . . . . . . . . . . . . . . . . . . . . 333 — — 324 — —
U.S. treasury notes . . . . . . . . . . . . . . . . . . . . . . . . — — — 19 — —
U.K. government guaranteed bonds . . . . . . . . . . . . 341 — — 364 — —
Interest rate and inflation swaps, net . . . . . . . . . . . — 298 — — 175 —
Equities: . . . . . . . . . . . . . . . . . . . . . . . . . . . . . . . .
Common stock . . . . . . . . . . . . . . . . . . . . . . . . . 695 — — 750 — —
Structured equity holdings . . . . . . . . . . . . . . . . . — 410 — — 294 —
Collateral assets for structured equity holdings . . 1,649 — — 1,564 — —
Common/collective trusts. . . . . . . . . . . . . . . . . . — 532 — — 422 —
Real estate . . . . . . . . . . . . . . . . . . . . . . . . . . . . . . — 278 — — 281 —
Other . . . . . . . . . . . . . . . . . . . . . . . . . . . . . . . . . . — (168) — 6 (8) —
Total assets at fair value . . . . . . . . . . . . . . . . . . $4,404 $1,350 $— $4,390 $1,164 $—
Contributions. In 2011, the Company’s minimum expected funding is approximately $1 million for
U.S. pension plans and approximately $41 million for pension plans in the rest of the world, however, the
Company may, at its discretion, make additional contributions.
63
TRW Automotive Holdings Corp.
Notes to Consolidated Financial Statements — (Continued)

8/3/2019 TRW 2010 Annual Report
http://slidepdf.com/reader/full/trw-2010-annual-report 70/116
Expected Future Pension Benefit Payments. The following pension benefit payments, which reflect current
obligations and expected future service, as appropriate, are expected to be paid from the underlying plans to the
participants:
Years Ending December 31, U.S. U.K. Rest of World(Dollars in millions)
2011 . . . . . . . . . . . . . . . . . . . . . . . . . . . . . . . . . . . . . . . . . . . . . . . $ 67 $ 252 $ 46
2012 . . . . . . . . . . . . . . . . . . . . . . . . . . . . . . . . . . . . . . . . . . . . . . . 67 256 43
2013 . . . . . . . . . . . . . . . . . . . . . . . . . . . . . . . . . . . . . . . . . . . . . . . 67 258 45
2014 . . . . . . . . . . . . . . . . . . . . . . . . . . . . . . . . . . . . . . . . . . . . . . . 68 259 46
2015 . . . . . . . . . . . . . . . . . . . . . . . . . . . . . . . . . . . . . . . . . . . . . . . 82 264 47
2016 — 2020 . . . . . . . . . . . . . . . . . . . . . . . . . . . . . . . . . . . . . . . . . 361 1,360 258
Other Benefits. The Company also sponsors qualified defined contribution pension plans covering employ-
ees at certain operations and an unfunded non-qualified defined contribution plan for a select group of highly
compensated employees. These plans allow participants to defer compensation, and generally provide employer
matching contributions. In 2009, the Company temporarily suspended employer matching contributions on certain
plans, which were reinstated in the first quarter of 2010.
Restructuring Curtailments. For the years ended 2010, 2009 and 2008, the Company recorded curtailment
gains as a result of the headcount reductions that were undertaken, and the corresponding reduction of pension
benefit obligations to those employees. Such curtailments are reflected in restructuring charges in the accompa-
nying consolidated statement of operations.
Postretirement Benefits Other Than Pensions (“OPEB”)
The Company provides health care and life insurance benefits for a substantial number of its retired employees
in the United States and Canada, and for certain future retirees. The health care plans provide for the sharing of
costs, in the form of retiree contributions, deductibles and coinsurance. Life insurance benefits are generally
noncontributory. The Company’s policy is to fund the cost of postretirement health care and life insurance benefits
as those benefits become payable.
64
TRW Automotive Holdings Corp.
Notes to Consolidated Financial Statements — (Continued)

8/3/2019 TRW 2010 Annual Report
http://slidepdf.com/reader/full/trw-2010-annual-report 71/116
The following table provides a reconciliation of the changes in the plans’ benefit obligation and fair value of
assets during the years ended December 31, 2010 and December 31, 2009, and a statement of the funded status of
the programs as of December 31, 2010 and 2009:
U.S.Rest of World U.S.
Rest of World
2010 2009
(Dollars in millions)
Change in benefit obligation:
Benefit obligations at beginning of period . . . . . . . . . . . . . . . . . . . . . . . . $ 411 $112 $ 420 $ 112
Service cost . . . . . . . . . . . . . . . . . . . . . . . . . . . . . . . . . . . . . . . . . . . . . 1 1 1 1
Interest cost . . . . . . . . . . . . . . . . . . . . . . . . . . . . . . . . . . . . . . . . . . . . . 23 6 24 7
Actuarial (gain) loss . . . . . . . . . . . . . . . . . . . . . . . . . . . . . . . . . . . . . . . 8 (5) 37 6
Foreign currency exchange rate changes . . . . . . . . . . . . . . . . . . . . . . . . — 4 — 16
Plan amendments . . . . . . . . . . . . . . . . . . . . . . . . . . . . . . . . . . . . . . . . . (6) — (19) (12)
Curtailment/settlement (gain) loss. . . . . . . . . . . . . . . . . . . . . . . . . . . . . (3) (10) (7) (10)
Plan participant contributions . . . . . . . . . . . . . . . . . . . . . . . . . . . . . . . . 4 — 5 —Benefits paid . . . . . . . . . . . . . . . . . . . . . . . . . . . . . . . . . . . . . . . . . . . . (42) (9) (50) (8)
Benefit obligations at December 31,. . . . . . . . . . . . . . . . . . . . . . . . . . . . . 396 99 411 112
Change in plan assets:
Fair value of plan assets at beginning of period . . . . . . . . . . . . . . . . . . . . — — — —
Company contributions . . . . . . . . . . . . . . . . . . . . . . . . . . . . . . . . . . . . 39 12 46 8
Plan participant contributions . . . . . . . . . . . . . . . . . . . . . . . . . . . . . . . . 4 — 5 —
Settlements . . . . . . . . . . . . . . . . . . . . . . . . . . . . . . . . . . . . . . . . . . . . . (1) (3) (1) —
Benefits paid . . . . . . . . . . . . . . . . . . . . . . . . . . . . . . . . . . . . . . . . . . . . (42) (9) (50) (8)
Fair value of plan assets at December 31, . . . . . . . . . . . . . . . . . . . . . . . . . — — — —
Funded status at December 31,. . . . . . . . . . . . . . . . . . . . . . . . . . . . . . . . . $(396) $ (99) $(411) $(112)
The following table provides the amounts recognized in the consolidated balance sheets:
U.S.Rest of World U.S.
Rest of World
2010 2009
As of December 31,
(Dollars in millions)
Current liabilities . . . . . . . . . . . . . . . . . . . . . . . . . . . . . . . . . . . $ (35) $ (7) $ (37) $ (7)
Long-term liabilities . . . . . . . . . . . . . . . . . . . . . . . . . . . . . . . . . (361) (92) (374) (105)
Total amount recognized . . . . . . . . . . . . . . . . . . . . . . . . . . . . . . $(396) $(99) $(411) $(112)
65
TRW Automotive Holdings Corp.
Notes to Consolidated Financial Statements — (Continued)
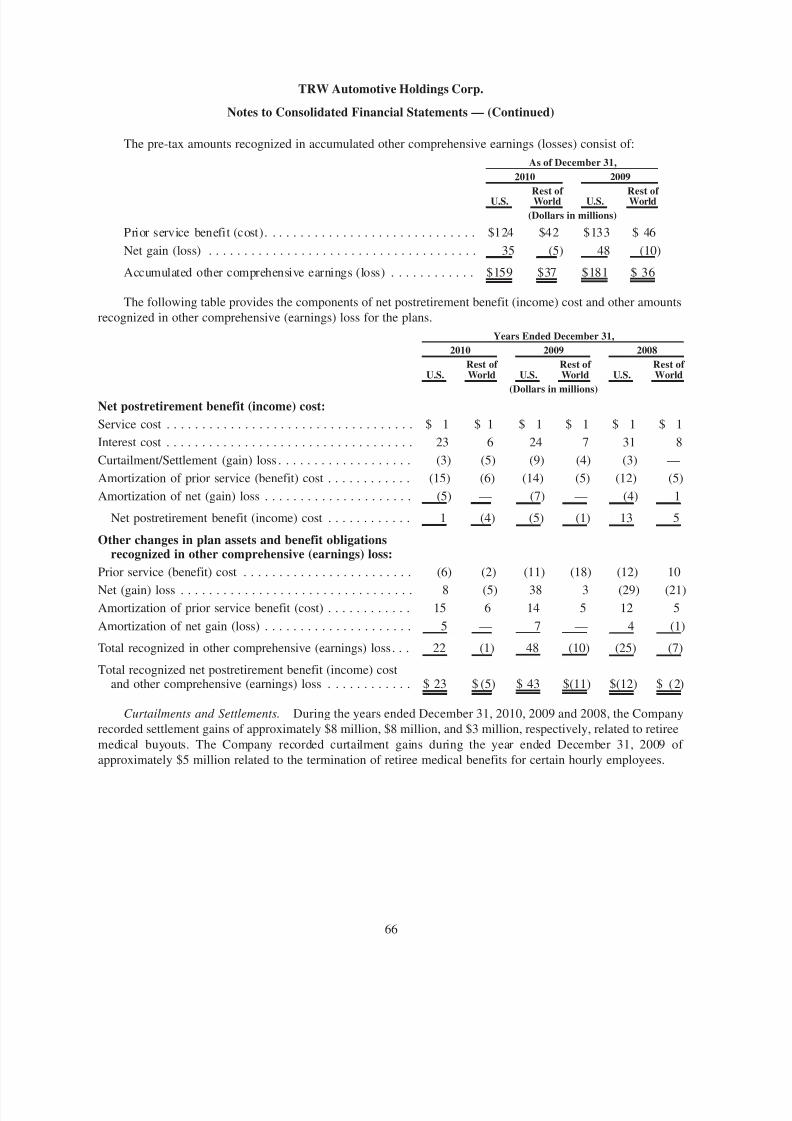
8/3/2019 TRW 2010 Annual Report
http://slidepdf.com/reader/full/trw-2010-annual-report 72/116
The pre-tax amounts recognized in accumulated other comprehensive earnings (losses) consist of:
U.S. Rest of World U.S. Rest of World
2010 2009
As of December 31,
(Dollars in millions)
Prior service benefit (cost). . . . . . . . . . . . . . . . . . . . . . . . . . . . . . $124 $42 $133 $ 46
Net gain (loss) . . . . . . . . . . . . . . . . . . . . . . . . . . . . . . . . . . . . . . 35 (5) 48 (10)
Accumulated other comprehensive earnings (loss) . . . . . . . . . . . . $159 $37 $181 $ 36
The following table provides the components of net postretirement benefit (income) cost and other amounts
recognized in other comprehensive (earnings) loss for the plans.
U.S.Rest of World U.S.
Rest of World U.S.
Rest of World
2010 2009 2008
Years Ended December 31,
(Dollars in millions)Net postretirement benefit (income) cost:
Service cost . . . . . . . . . . . . . . . . . . . . . . . . . . . . . . . . . . . $ 1 $ 1 $ 1 $ 1 $ 1 $ 1
Interest cost . . . . . . . . . . . . . . . . . . . . . . . . . . . . . . . . . . . 23 6 24 7 31 8
Curtailment/Settlement (gain) loss . . . . . . . . . . . . . . . . . . . (3) (5) (9) (4) (3) —
Amortization of prior service (benefit) cost . . . . . . . . . . . . (15) (6) (14) (5) (12) (5)
Amortization of net (gain) loss . . . . . . . . . . . . . . . . . . . . . (5) — (7) — (4) 1
Net postretirement benefit (income) cost . . . . . . . . . . . . 1 (4) (5) (1) 13 5
Other changes in plan assets and benefit obligationsrecognized in other comprehensive (earnings) loss:
Prior service (benefit) cost . . . . . . . . . . . . . . . . . . . . . . . . (6) (2) (11) (18) (12) 10
Net (gain) loss . . . . . . . . . . . . . . . . . . . . . . . . . . . . . . . . . 8 (5) 38 3 (29) (21)Amortization of prior service benefit (cost) . . . . . . . . . . . . 15 6 14 5 12 5
Amortization of net gain (loss) . . . . . . . . . . . . . . . . . . . . . 5 — 7 — 4 (1)
Total recognized in other comprehensive (earnings) loss . . . 22 (1) 48 (10) (25) (7)
Total recognized net postretirement benefit (income) costand other comprehensive (earnings) loss . . . . . . . . . . . . $ 23 $ (5) $ 43 $(11) $(12) $ (2)
Curtailments and Settlements. During the years ended December 31, 2010, 2009 and 2008, the Company
recorded settlement gains of approximately $8 million, $8 million, and $3 million, respectively, related to retiree
medical buyouts. The Company recorded curtailment gains during the year ended December 31, 2009 of
approximately $5 million related to the termination of retiree medical benefits for certain hourly employees.
66
TRW Automotive Holdings Corp.
Notes to Consolidated Financial Statements — (Continued)

8/3/2019 TRW 2010 Annual Report
http://slidepdf.com/reader/full/trw-2010-annual-report 73/116
The estimated amounts that will be amortized from accumulated other comprehensive earnings over the next
fiscal year are as follows:
U.S.Rest of World
Year Ending
December 31, 2011
(Dollars in millions)
Prior service (benefit) cost. . . . . . . . . . . . . . . . . . . . . . . . . . . . . . . . . . . . . . . . . . $(15) $ (7)
Net actuarial (gain) loss. . . . . . . . . . . . . . . . . . . . . . . . . . . . . . . . . . . . . . . . . . . . (4) —
Total . . . . . . . . . . . . . . . . . . . . . . . . . . . . . . . . . . . . . . . . . . . . . . . . . . . . . . . . . . $(19) $ (7)
Restructuring Curtailments. The Company recorded curtailment gains during the years ended December 31,
2009 and 2008 as a result of headcount reductions that were undertaken during 2009 and 2008, and the
corresponding reduction of retiree medical benefit obligations to those employees. Such curtailments are reflected
in restructuring charges in the accompanying consolidated statements of operations (see Note 12).
Plan Assumptions. The weighted-average assumptions used to determine net postretirement benefit(income) cost were:
U.S.Rest of World U.S.
Rest of World U.S.
Rest of World
2010 2009 2008
Years Ended December 31,
Discount rate . . . . . . . . . . . . . . . . . . . . . . . . . . . . . . . . . . . 6.00% 5.75% 6.25% 6.50% 6.00% 5.50%
The discount rate and assumed health care cost trend rates used in the measurement of the benefit obligation as
of the applicable measurement dates were:
U.S. Rest of World U.S. Rest of World
2010 2009
As of December 31,
Discount rate. . . . . . . . . . . . . . . . . . . . . . . . . . . . . . . . . . . . . . . . 5.50% 5.50% 6.00% 5.75%
Initial health care cost trend rate at end of year . . . . . . . . . . . . . . 7.63% 7.50% 8.00% 8.00%
Ultimate health care cost trend rate . . . . . . . . . . . . . . . . . . . . . . . 5.00% 5.00% 5.00% 5.00%
Year in which ultimate rate is reached . . . . . . . . . . . . . . . . . . . . . 2018 2015 2018 2015
A one-percentage-point change in the assumed health care cost trend rate would have had the following
effects:
U.S.Rest of World U.S.
Rest of World
Increase Decrease
One-Percentage-Point
(Dollars in millions)
Effect on total of service and interest cost components for the yearended December 31, 2010 . . . . . . . . . . . . . . . . . . . . . . . . . . . . . $ 2 $ 1 $ (2) $(1)
Effect on postretirement benefit obligation as of measurementdate . . . . . . . . . . . . . . . . . . . . . . . . . . . . . . . . . . . . . . . . . . . . . . $36 $10 $(31) $(9)
Contributions. The Company funds its OPEB obligations on a pay-as-you-go basis. In 2011, the Company
expects to contribute approximately $42 million to its OPEB plans.
67
TRW Automotive Holdings Corp.
Notes to Consolidated Financial Statements — (Continued)

8/3/2019 TRW 2010 Annual Report
http://slidepdf.com/reader/full/trw-2010-annual-report 74/116
Expected Future Postretirement Benefit Payments. The following postretirement benefit payments, which
reflect expected future service, as appropriate, are expected to be paid:
Years Ending December 31, U.S.Rest
of World
(Dollars in millions)
2011 . . . . . . . . . . . . . . . . . . . . . . . . . . . . . . . . . . . . . . . . . . . . . . . . . . . . . . . $ 35 $ 7
2012 . . . . . . . . . . . . . . . . . . . . . . . . . . . . . . . . . . . . . . . . . . . . . . . . . . . . . . . 34 7
2013 . . . . . . . . . . . . . . . . . . . . . . . . . . . . . . . . . . . . . . . . . . . . . . . . . . . . . . . 34 7
2014 . . . . . . . . . . . . . . . . . . . . . . . . . . . . . . . . . . . . . . . . . . . . . . . . . . . . . . . 33 7
2015 . . . . . . . . . . . . . . . . . . . . . . . . . . . . . . . . . . . . . . . . . . . . . . . . . . . . . . . 32 7
2016 — 2020 . . . . . . . . . . . . . . . . . . . . . . . . . . . . . . . . . . . . . . . . . . . . . . . . . 148 36
9. Fair Value Measurements
The inputs to valuation techniques used to measure fair value are prioritized into a three-level hierarchy. This
hierarchy gives the highest priority to quoted prices in active markets for identical assets and liabilities and lowest
priority to unobservable inputs, as follows:
Level 1. The Company utilizes the market approach to determine the fair value of its assets and
liabilities under Level 1 of the fair value hierarchy. The market approach pertains to transactions in active
markets involving identical or comparable assets or liabilities.
Level 2. The fair values determined through Level 2 of the fair value hierarchy are derived principally
from or corroborated by observable market data under the market approach. Inputs include quoted prices for
similar assets and liabilities (risk adjusted), and market-corroborated inputs, such as market comparables,
interest rates, yield curves and other items that allow value to be determined.
Level 3. The Company utilizes the income approach or the cost approach, as appropriate, to determine
the fair value of its assets and liabilities under Level 3 of the fair value hierarchy. The fair value is derived
principally from unobservable inputs from the Company’s own assumptions about market risk, developed
based on the best information available, subject to cost-benefit analysis, and may include the Company’s owndata. When there are no observable comparables, inputs used to determine value are derived from Company-
specific inputs, such as projected financial data and the Company’s own views about the assumptions that
market participants would use.
68
TRW Automotive Holdings Corp.
Notes to Consolidated Financial Statements — (Continued)
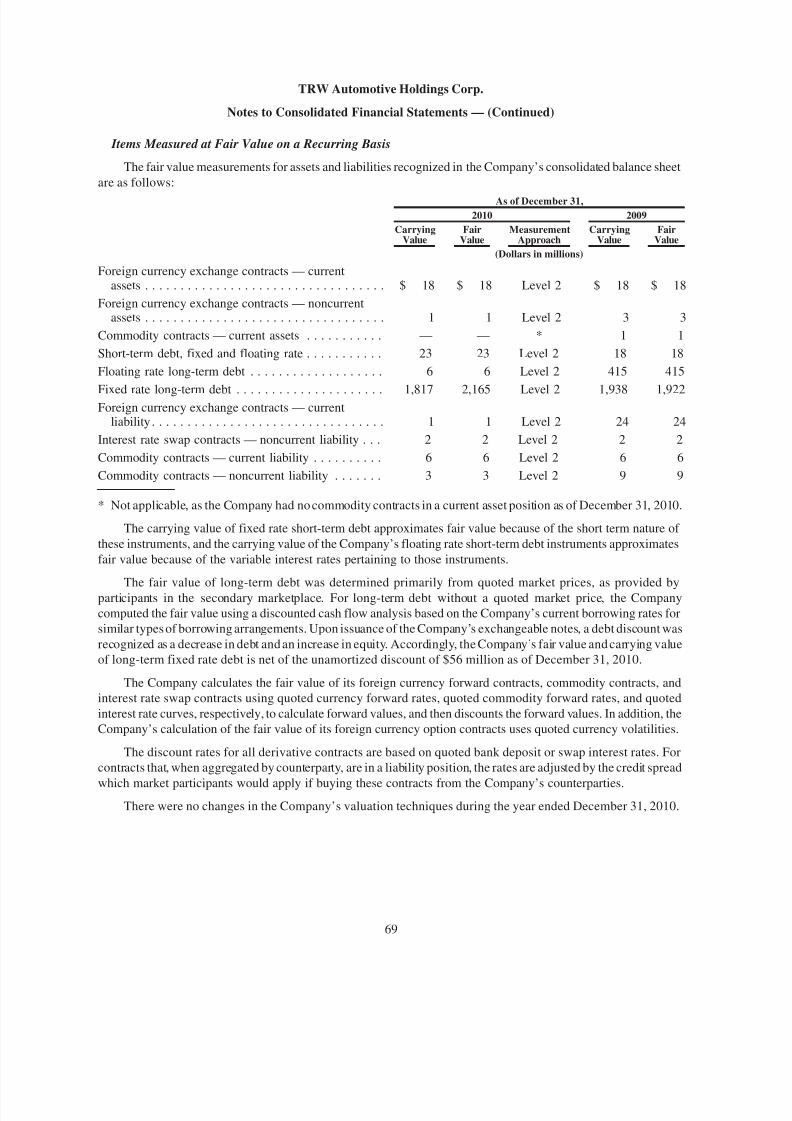
8/3/2019 TRW 2010 Annual Report
http://slidepdf.com/reader/full/trw-2010-annual-report 75/116
Items Measured at Fair Value on a Recurring Basis
The fair value measurements for assets and liabilities recognized in the Company’s consolidated balance sheet
are as follows:
CarryingValue
FairValue
MeasurementApproach
CarryingValue
FairValue
2010 2009
As of December 31,
(Dollars in millions)
Foreign currency exchange contracts — currentassets . . . . . . . . . . . . . . . . . . . . . . . . . . . . . . . . . . $ 18 $ 18 Level 2 $ 18 $ 18
Foreign currency exchange contracts — noncurrentassets . . . . . . . . . . . . . . . . . . . . . . . . . . . . . . . . . . 1 1 Level 2 3 3
Commodity contracts — current assets . . . . . . . . . . . — — * 1 1
Short-term debt, fixed and floating rate . . . . . . . . . . . 23 23 Level 2 18 18
Floating rate long-term debt . . . . . . . . . . . . . . . . . . . 6 6 Level 2 415 415
Fixed rate long-term debt . . . . . . . . . . . . . . . . . . . . . 1,817 2,165 Level 2 1,938 1,922Foreign currency exchange contracts — current
liability . . . . . . . . . . . . . . . . . . . . . . . . . . . . . . . . . 1 1 Level 2 24 24
Interest rate swap contracts — noncurrent liability . . . 2 2 Level 2 2 2
Commodity contracts — current liability . . . . . . . . . . 6 6 Level 2 6 6
Commodity contracts — noncurrent liability . . . . . . . 3 3 Level 2 9 9
* Not applicable, as the Company had no commodity contracts in a current asset position as of December 31, 2010.
The carrying value of fixed rate short-term debt approximates fair value because of the short term nature of
these instruments, and the carrying value of the Company’s floating rate short-term debt instruments approximates
fair value because of the variable interest rates pertaining to those instruments.
The fair value of long-term debt was determined primarily from quoted market prices, as provided by
participants in the secondary marketplace. For long-term debt without a quoted market price, the Company
computed the fair value using a discounted cash flow analysis based on the Company’s current borrowing rates for
similar types of borrowing arrangements. Upon issuance of the Company’s exchangeable notes, a debt discount was
recognized as a decrease in debt and an increase in equity. Accordingly, the Company’s fair value and carrying value
of long-term fixed rate debt is net of the unamortized discount of $56 million as of December 31, 2010.
The Company calculates the fair value of its foreign currency forward contracts, commodity contracts, and
interest rate swap contracts using quoted currency forward rates, quoted commodity forward rates, and quoted
interest rate curves, respectively, to calculate forward values, and then discounts the forward values. In addition, the
Company’s calculation of the fair value of its foreign currency option contracts uses quoted currency volatilities.
The discount rates for all derivative contracts are based on quoted bank deposit or swap interest rates. For
contracts that, when aggregated by counterparty, are in a liability position, the rates are adjusted by the credit spread
which market participants would apply if buying these contracts from the Company’s counterparties.There were no changes in the Company’s valuation techniques during the year ended December 31, 2010.
69
TRW Automotive Holdings Corp.
Notes to Consolidated Financial Statements — (Continued)

8/3/2019 TRW 2010 Annual Report
http://slidepdf.com/reader/full/trw-2010-annual-report 76/116
The following table represents the movement of amounts reported in accumulated other comprehensive
earnings (losses) from deferred cash flow hedges, net of tax.
2010 2009
Years Ended
December 31,
(Dollars in millions)
Balance at beginning of period. . . . . . . . . . . . . . . . . . . . . . . . . . . . . . . . . . . . . . $ 1 $(141)
Net change in derivative fair value and other movements during the year. . . . . . . 27 27
Net amounts reclassified to statement of operations during the year . . . . . . . . . . . (20) 115
Balance at end of period . . . . . . . . . . . . . . . . . . . . . . . . . . . . . . . . . . . . . . . . . . $ 8 $ 1
The gains and losses reclassified into earnings include the discontinuance of cash flow hedges which were
immaterial in 2010 and 2009.
Items Measured at Fair Value on a Nonrecurring Basis
In addition to items that are measured at fair value on a recurring basis, the Company also has assets and
liabilities in its balance sheet that are measured at fair value on a nonrecurring basis and therefore are not included in
the tables above. Assets and liabilities that are measured at fair value on a nonrecurring basis include long-lived
assets, including investments in affiliates, which are written down to fair value as a result of impairment (see Note 5
for impairments of intangible assets and Note 12 for impairments of long-lived assets), asset retirement obligations,
and restructuring liabilities (see Note 12).
The Company has determined that the fair value measurements related to each of these assets and liabilities
rely primarily on Company-specific inputs and the Company’s assumptions about the use of the assets and
settlement of liabilities, as observable inputs are not available, and as such, reside within Level 3 of the fair value
hierarchy. To determine the fair value of long-lived assets, the Company utilizes the projected cash flows expected
to be generated by the long-lived assets, then discounts the future cash flows over the useful life of the long-lived
assets. For asset retirement obligations, the Company determines the fair value of the expected expense to beincurred at the time the asset retirement obligation is settled, then determines the present value of the expense using
a risk-adjusted discount rate for the Company. For restructuring obligations, the amount recorded represents the fair
value of the payments expected to be made, and are discounted if the payments are expected to extend beyond one
year.
As of December 31, 2010, the Company had $21 million and $11 million of restructuring accruals and asset
retirement obligations, respectively, which were measured at fair value upon initial recognition of the associated
liability. For the year ended December 31, 2010, the Company recorded fixed asset impairments of $3 million,
associated with its determination of the fair value of its long-lived assets that exhibited indicators of impairment.
10. Financial Instruments
The Company is exposed to certain financial market risks related to its ongoing business operations. Theprimary risks managed through derivative financial instruments and hedging activities are foreign currency
exchange rate risk, interest rate risk and commodity price risk. Derivative financial instruments and hedging
activities are utilized to protect the Company’s cash flow from adverse movements in foreign currency exchange
rates and commodity prices as well as to manage interest costs. Although the Company is exposed to credit loss in
the event of nonperformance by the counterparty to the derivative financial instruments, the Company attempts to
limit this exposure by entering into agreements directly with a number of major financial institutions that meet the
Company’s credit standards and that are expected to fully satisfy their obligations under the contracts.
70
TRW Automotive Holdings Corp.
Notes to Consolidated Financial Statements — (Continued)

8/3/2019 TRW 2010 Annual Report
http://slidepdf.com/reader/full/trw-2010-annual-report 77/116
The Company manufactures and sells its products in countries throughout the world. As a result, it is exposed
to fluctuations in foreign currency exchange rates. The Company enters into foreign exchange contracts to hedge
portions of its foreign currency denominated forecasted revenues, purchases and the subsequent cash flows after
considering natural offsets within the consolidated group. The effective part of the gains or losses on theseinstruments, which mature at various dates through December 2012, are generally recorded in other comprehensive
earnings (losses) until the underlying transaction is recognized in net earnings. The earnings impact is reported
either in sales, cost of sales, or other expense (income) — net, to match the underlying transaction. The ineffective
portion of the gains or losses on these contracts, as well as all gains or losses on contracts which are held for
economic purposes but not designated for hedge accounting treatment (including contracts that do not qualify for
hedge accounting purposes), are reported in earnings immediately.
In addition, the Company enters into certain foreign exchange contracts that do not qualify for hedge
accounting under ASC 815 to hedge recognized foreign currency transactions. Gains and losses on these contracts
are recorded in net earnings and are substantially offset by the effect of the revaluation of the underlying foreign
currency denominated transaction.
As of December 31, 2010, the Company had a notional value of $1.6 billion in foreign exchange contracts
outstanding. These foreign exchange contracts mature at various dates through December 2012. Foreign currency
exposures are reviewed monthly and any natural offsets are considered prior to entering into a derivative financial
instrument.
As of December 31, 2010, the Company had two offsetting interest rate swap agreements outstanding, each
with a notional value of $25 million. The Company’s exposure to interest rate risk arises primarily from changes in
London Inter-Bank Offered Rates (“LIBOR”).
Derivative Instruments. The fair value of the Company’s derivative instruments as of December 31, 2010 and
2009 was $31 million and $27 million, respectively, in the asset position, and $24 million and $46 million,
respectively, in the liability position. These amounts consist of interest rate contracts, foreign exchange contracts,
and commodity contracts, none of which are individually significant.
Cash Flow Hedges. For any derivative instrument that is designated and qualifies as a cash flow hedge, theeffective portion of the gain or loss on the derivative is reported as a component of other comprehensive income
(“OCI”), and is subsequently reclassified into earnings in the same period, or periods, during which the hedged
transaction affects earnings. Gains and losses on the derivative representing either hedge ineffectiveness or hedge
components excluded from the assessment of effectiveness are recognized in earnings. Approximately $11 million
of gains, net of tax, which are included in OCI are expected to be reclassified into earnings in the next twelve
months.
For the years ended December 31, 2010 and 2009, the effective portion of gain (loss) on derivatives designated
as cash flow hedges that was recognized in OCI was $27 million and $47 million, respectively, of which $30 million
and $50 million, respectively, were related to foreign currency exchange contracts. The effective portion of gains on
cash flow hedges reclassified from OCI into the statement of operations for the year ended December 31, 2010 was
$13 million and was included in various line items on the statement of operations. For the year ended December 31,
2009, the amount of losses reclassified from OCI into the statement of operations was $115 million, of which$106 million was included in the sales line item and was related to foreign currency exchange contracts.
Gains or losses recognized in income related to hedge ineffectiveness for the years ended December 31, 2010
and 2009 were not significant.
Fair Value Hedges. For any derivative instrument that is designated and qualifies as a fair value hedge, the
gain or loss on the derivative as well as the offsetting loss or gain on the underlying hedged item is recognized in
current earnings. As of December 31, 2010 and 2009, the Company had no fair value hedges outstanding.
71
TRW Automotive Holdings Corp.
Notes to Consolidated Financial Statements — (Continued)

8/3/2019 TRW 2010 Annual Report
http://slidepdf.com/reader/full/trw-2010-annual-report 78/116
Undesignated Derivatives. For the years ended December 31, 2010 and 2009, the Company recognized an
$11 million gain and $13 million loss, respectively, in the other (income) expense — net, line item for derivative
instruments not designated as hedging instruments.
Credit-Risk-Related Contingent Features. The Company has entered into International Swaps and Deriv-atives Association (“ISDA”) agreements with each of its significant derivative counterparties. These agreements
provide bilateral netting and offsetting of accounts that are in a liability position with those that are in an asset
position. These agreements do not require the Company to maintain a minimum credit rating in order to be in
compliance and do not contain any margin call provisions or collateral requirements that could be triggered by
derivative instruments in a net liability position. As of December 31, 2010, the Company had not posted any
collateral to support its derivatives in a liability position.
11. Debt
Total outstanding debt of the Company consisted of the following:
2010 2009
As of December 31,
(Dollars in millions)
Short-term debt . . . . . . . . . . . . . . . . . . . . . . . . . . . . . . . . . . . . . . . . . . . . . . . . $ 23 $ 18
Long-term debt:
Senior notes, due 2014 and 2017. . . . . . . . . . . . . . . . . . . . . . . . . . . . . . . . . . . . . $1,502 $1,674
Exchangeable senior notes, due 2015 . . . . . . . . . . . . . . . . . . . . . . . . . . . . . . . . . 203 195
Term loan facilities. . . . . . . . . . . . . . . . . . . . . . . . . . . . . . . . . . . . . . . . . . . . . . . — 400
Revolving credit facility . . . . . . . . . . . . . . . . . . . . . . . . . . . . . . . . . . . . . . . . . . . — —
Capitalized leases . . . . . . . . . . . . . . . . . . . . . . . . . . . . . . . . . . . . . . . . . . . . . . . . 30 41
Other borrowings . . . . . . . . . . . . . . . . . . . . . . . . . . . . . . . . . . . . . . . . . . . . . . . . 88 43
Total long-term debt . . . . . . . . . . . . . . . . . . . . . . . . . . . . . . . . . . . . . . . . . . . . 1,823 2,353
Less current portion . . . . . . . . . . . . . . . . . . . . . . . . . . . . . . . . . . . . . . . . . . . . . . 20 28Long-term debt, net of current portion . . . . . . . . . . . . . . . . . . . . . . . . . . . . . . . $1,803 $2,325
The weighted average interest rates on the Company’s debt as of December 31, 2010 and 2009 were 7.4% and
7.0%, respectively, excluding the effect of interest rate swaps. The maturities of long-term debt outstanding as of
December 31, 2010 are:
Years Ended December 31, (Dollars in millions)
2011. . . . . . . . . . . . . . . . . . . . . . . . . . . . . . . . . . . . . . . . . . . . . . . . . . . . . . . . . . $ 20
2012 . . . . . . . . . . . . . . . . . . . . . . . . . . . . . . . . . . . . . . . . . . . . . . . . . . . . . . . . . . 45
2013 . . . . . . . . . . . . . . . . . . . . . . . . . . . . . . . . . . . . . . . . . . . . . . . . . . . . . . . . . . 33
2014. . . . . . . . . . . . . . . . . . . . . . . . . . . . . . . . . . . . . . . . . . . . . . . . . . . . . . . . . . 772
2015. . . . . . . . . . . . . . . . . . . . . . . . . . . . . . . . . . . . . . . . . . . . . . . . . . . . . . . . . . 207Thereafter. . . . . . . . . . . . . . . . . . . . . . . . . . . . . . . . . . . . . . . . . . . . . . . . . . . . . . 746
Total. . . . . . . . . . . . . . . . . . . . . . . . . . . . . . . . . . . . . . . . . . . . . . . . . . . . . . . . $1,823
Senior Notes
8.875% Senior Notes. In November 2009, the Company issued $250 million in aggregate principal amount
of 8.875% senior unsecured notes due 2017 (the “8.875% Senior Notes”) in a private placement. Interest is payable
72
TRW Automotive Holdings Corp.
Notes to Consolidated Financial Statements — (Continued)

8/3/2019 TRW 2010 Annual Report
http://slidepdf.com/reader/full/trw-2010-annual-report 79/116
semi-annually on June 1 and December 1 of each year. The 8.875% Senior Notes are unconditionally guaranteed on
a senior unsecured basis by substantially all existing and future wholly-owned domestic subsidiaries of the
Company and by TRW Automotive Finance (Luxemburg), S.a.r.l., a Luxemburg subsidiary. Net proceeds from the
offering were approximately $242 million after deducting debt issuance costs and estimated offering expenses.2007 Senior Notes. In March 2007, the Company issued 7% senior unsecured notes and 63 ⁄ 8% senior
unsecured notes, each due 2014, in principal amounts of $500 million and A 275 million, respectively, and
71 ⁄ 4% senior unsecured notes due 2017 in the principal amount of $600 million (collectively, the “2007 Senior
Notes”) in a private offering. Interest is payable semi-annually on March 15 and September 15 of each year. The
2007 Senior Notes are unconditionally guaranteed on a senior unsecured basis by substantially all existing and
future wholly-owned domestic subsidiaries of the Company and by TRW Automotive Finance (Luxembourg),
S.a.r.l., a Luxembourg subsidiary.
Senior Note Repurchases. During the year ended December 31, 2010, the Company repurchased portions of
its senior notes totaling approximately $152 million in principal amount and recorded a loss on retirement of debt of
$10 million, including the write-off of a portion of debt issuance costs, discounts and premiums.
During the year ended December 31, 2009, the Company repurchased portions of its senior unsecured notes
totaling approximately $57 million in principal amount and recorded a gain on retirement of debt of $41 million,
including the write-off of a portion of debt issuance costs and premiums.
In each case, the repurchased notes were retired upon settlement.
Exchangeable Senior Notes
In November 2009, the Company issued approximately $259 million in aggregate principal amount of 3.50%
exchangeable senior unsecured notes due 2015 (the “Exchangeable Senior Notes”) in a private placement. Prior to
September 1, 2015, the notes are exchangeable only upon specified events or conditions being met and, thereafter, at
any time. One condition, the sale price condition (described below), was met as of December 31, 2010, and as such,
the notes are exchangeable in the first quarter of 2011. They will remain exchangeable in subsequent quarters if the
sale price condition continues to be met, which occurs if the last reported sale price of the Company’s common stock
for at least 20 of the last 30 trading days of the immediately preceding quarter is greater than 130% of the applicableexchange price. The initial exchange rate is 33.8392 shares of the Company’s common stock per $1,000 principal
amount of notes (equivalent to an exchange price of approximately $29.55 per share of common stock), subject to
adjustment. Upon exchange, the Company’s exchange obligation may be settled, at its option, in shares of its stock,
cash or a combination of cash and shares of its stock. The Exchangeable Senior Notes are senior unsecured
obligations of the Company. Interest is payable on June 1 and December 1 of each year. The Exchangeable Senior
Notes will mature on December 1, 2015, unless earlier exchanged, repurchased by the Company at the holder’s
option upon a fundamental change, or redeemed by the Company after December 6, 2013, at the Company’s option
if certain conditions are met.
The Exchangeable Senior Notes were recorded with a debt discount which decreased debt and increased
paid-in-capital in order to separate the liability and embedded equity components of the Exchangeable Senior
Notes. The debt component will accrete up to the principal amount to effectively yield 9.0% over the term of the
debt. The debt discount as of December 31, 2010 and December 31, 2009 was $56 million and $64 million,respectively. The total interest expense on the Exchangeable Senior Notes recognized for the year ended
December 31, 2010, and December 31, 2009, was approximately $18 million and $2 million, respectively,
including $9 million and $1 million, respectively, relating to the stated coupon rate.
Senior Secured Credit Facilities
In December 2009, the Company entered into the Seventh Amended and Restated Credit Agreement, dated as
of December 21, 2009 (the “Seventh Credit Agreement”), with the lenders party thereto. The Seventh Credit
73
TRW Automotive Holdings Corp.
Notes to Consolidated Financial Statements — (Continued)

8/3/2019 TRW 2010 Annual Report
http://slidepdf.com/reader/full/trw-2010-annual-report 80/116
Agreement provides for senior secured credit facilities consisting of (i) a revolving credit facility in the amount of
$1,256 million, of which $411 million matures May 9, 2012 (the “2012 Portion of the Revolving Credit Facility”)
and $845 million matures November 30, 2014, subject to certain conditions described below (the “2014 Portion of
the Revolving Credit Facility” and, together with the 2012 Portion of the Revolving Credit Facility, the “RevolvingCredit Facility”), (ii) a $225 million Tranche A-2 Term Loan Facility (the “Term Loan A-2”), and (iii) a $175 million
Tranche B-3 Term Loan Facility (the “Term Loan B-3” and, together with the Revolving Credit Facility and the
Term Loan A-2, the “Senior Secured Credit Facilities”). In conjunction with the Seventh Credit Agreement, the
Company paid fees and expenses totaling approximately $9 million, including lender consent fees.
The 2014 Portion of the Revolving Credit Facility is subject to earlier maturity on December 13, 2013, if (i) the
Company has not refinanced its senior unsecured notes due 2014 with debt maturing after August 31, 2016, or
(ii) the Company does not then have liquidity available to repay the senior unsecured notes due 2014 plus at least
$500 million of additional liquidity.
The Seventh Credit Agreement provided for the Term Loan A-2 and the Term Loan B-3 to amortize 1% per
annum in equal quarterly installments, which began March 31, 2010, with the balance due at the maturity of the
respective term loan. During 2010, the Company repaid the full $225 million balance of its outstanding Term Loan
A-2 and the full $175 million balance of its outstanding Term Loan B-3 with cash on hand. In conjunction with the
Term Loan A-2 and Term Loan B-3 repayments, the Company recorded a loss on retirement of debt of $3 million for
the write-off of deferred financing fees relating to the term loans and $2 million related to the acceleration of interest
rate swap losses that had been included in other comprehensive income as a result of hedging the variability of
interest payments associated with its Term Loan A-2.
Borrowings under the Senior Secured Credit Facilities will bear interest at a rate equal to an applicable margin
plus, at the Company’s option, either (a) a base rate determined by reference to the highest of (1) the administrative
agent’s prime rate, (2) the federal funds rate plus 1/2 of 1%, or (3) the adjusted 1-month LIBOR plus 1%, or (b) a
LIBOR or a eurocurrency rate determined by reference to interest rates for deposits in the currency of such
borrowing for the interest period relevant to such borrowing adjusted for certain additional costs.
The commitment fee and the applicable margin for borrowing on the Senior Secured Credit Facilities are
subject to leverage-based grids. The applicable margin in effect at December 31, 2010 for the 2012 Portion of the
Revolving Credit Facility was 3.75% with respect to base rate borrowings and 4.75% with respect to eurocurrency
borrowings. The applicable margin in effect at December 31, 2010 for the 2014 Portion of the Revolving Credit
Facility was 2.75% with respect to base rate borrowings and 3.75% with respect to eurocurrency borrowings. The
commitment fee on the undrawn amounts under the Revolving Credit Facility is 0.50%.
The Senior Secured Credit Facilities are unconditionally guaranteed by substantially all existing and sub-
sequently acquired wholly-owned domestic subsidiaries. Obligations of the foreign subsidiary borrowers are
unconditionally guaranteed by the Company and certain foreign subsidiaries. The Senior Secured Credit Facilities
are secured by a perfected first priority security interest in, and mortgages on, substantially all tangible and
intangible assets of TRW Automotive Inc. (“TAI”), an indirect wholly owned subsidiary of TRW Automotive
Holdings Corp., and substantially all of its domestic subsidiaries, including a pledge of 100% of the stock of TAI
and substantially all of its domestic subsidiaries and 65% of the stock of foreign subsidiaries owned directly by
domestic entities. In addition, foreign borrowings under the Senior Secured Credit Facilities will be secured by
assets of the foreign borrowers.
Lehman Commercial Paper Inc. (“LCP”) has a $48 million unfunded commitment under the 2012 Portion of
the Revolving Credit Facility. LCP filed for bankruptcy in October 2008 and failed to fund their portion of
borrowings under the Revolving Credit Facility. The Company believes LCP will likely not perform in the future
under the terms of the facility and, therefore, has excluded LCP’s commitment from the description of the
Revolving Credit Facility and all references to availability contained in this Report.
74
TRW Automotive Holdings Corp.
Notes to Consolidated Financial Statements — (Continued)

8/3/2019 TRW 2010 Annual Report
http://slidepdf.com/reader/full/trw-2010-annual-report 81/116
Debt Repurchases
As market conditions warrant, the Company may from time to time repurchase debt securities issued by the
Company or its subsidiaries, in privately negotiated or open market transactions, by tender offer, exchange offer, or
by other means.
Debt Covenants
Senior Notes. The indentures governing the 2007 Senior Notes and the 8.875% Senior Notes contain
covenants that impose significant restrictions on the Company’s business. The covenants, among other things,
restrict, subject to a number of qualifications and limitations, the ability of TAI and its subsidiaries to pay certain
dividends and distributions, or repurchase equity interests of the Company and certain of its subsidiaries (unless
certain conditions are met), incur liens, engage in mergers or consolidations, and enter into sale and leaseback
transactions. The indentures for each of the Company’s outstanding notes also contain customary events of default.
Senior Secured Credit Facilities. The Seventh Credit Agreement contains a number of covenants that, among
other things, restrict, subject to certain exceptions, the ability of TAI and its subsidiaries to incur additional
indebtedness or issue preferred stock, repay other indebtedness, repurchase capital stock, create liens on assets,make investments, loans or advances, make certain acquisitions, engage in mergers or consolidations, enter into sale
and leaseback transactions, engage in certain transactions with affiliates, amend certain material agreements
governing TAI’s indebtedness, and change the business conducted by the Company. In addition, the Seventh Credit
Agreement contains financial covenants relating to a leverage ratio (through the third quarter of 2011, a senior
secured leverage ratio) and a minimum interest coverage ratio, which ratios are calculated on a trailing four quarter
basis, and require certain prepayments from excess cash flows, as defined. Other covenants restrict the payment of
(i) cash dividends on the common stock of TRWAutomotive Holdings Corp. (“TAHC”) pursuant to a formula based
on our consolidated net income and leverage ratio, and (ii) dividends or other distributions by TAI, subject to
specified exceptions. The exceptions include, among others, payments or distributions to enable the Company to
enter into certain derivative transactions in relation to TAI’s exchangeable bonds, or in respect of expenses required
for TAHC and its wholly-owned subsidiary, TRW Automotive Intermediate Holdings Corp., to maintain their
corporate existence, general corporate overhead expenses, tax liabilities and legal and accounting fees. Since TAHC
is a holding company without any independent operations, it does not have significant cash obligations and is able tomeet its limited cash obligations with payments or distributions from TAI under the exceptions to our debt
covenants. The Seventh Credit Agreement also includes customary events of default.
As of December 31, 2010, the Company was in compliance with all of its financial covenants.
Other Borrowings
The Company has borrowings under uncommitted credit agreements in many of the countries in which it
operates. The borrowings are from various domestic and international banks at quoted market interest rates.
In 2008, the Company entered into a series of interest rate swap agreements with a total notional value of
$350 million, of which $300 million matured in 2010. Since the interest rate swaps hedged the variability of interest
payments on variable rate debt with the same terms, these swaps qualified for cash flow hedge accounting treatment.During 2010, with the full repayment of the underlying term debt, an interest rate swap agreement with total
notional value of $25 million entered into during 2008 no longer qualified for cash flow hedge accounting. As
a result, $2 million of deferred swap losses included in other comprehensive income was recorded as loss on
retirement of debt. Subsequent changes in market value were recorded to other (income) expense — net. In
December 2010, the Company entered into an offsetting swap with a total notional value of $25 million. The result
of the two swaps was to fix the quarterly payments until maturity in 2013. As of December 31, 2010, the Company
recorded a net obligation of approximately $2 million related to its offsetting interest rate swap contracts.
75
TRW Automotive Holdings Corp.
Notes to Consolidated Financial Statements — (Continued)

8/3/2019 TRW 2010 Annual Report
http://slidepdf.com/reader/full/trw-2010-annual-report 82/116
In January and February 2010, the Company entered into interest rate swap agreements with a total notional
value of $350 million to effectively change a fixed rate debt obligation into a floating rate obligation. In the second
quarter of 2010, the Company terminated the agreements. These interest rate swaps had been designated as fair
value hedges and were settled for a gain of $9 million, which was recorded as a valuation adjustment of theunderlying debt.
12. Restructuring Charges and Fixed Asset Impairments
The Company’s restructuring charges consist of severance, retention and outplacement services and sever-
ance-related postemployment benefits (collectively, “severance and other charges”), curtailment gains related to
reductions of pension and retiree medical benefit obligations due to headcount reductions, and asset impairments
related to restructuring activities.
As a result of significant declines in general economic conditions and automotive industry production levels
during the second half of 2008, the Company undertook a number of restructuring initiatives in efforts to better align
its cost structure with lower production levels. Such initiatives included the closure of several facilities in addition to
a general reduction of the global workforce.
For the year ended December 31, 2010, restructuring charges and fixed asset impairments include the
following:
ChassisSystemsSegment
OccupantSafety
SystemsSegment
ElectronicsSegment
AutomotiveComponents
Segment Corporate Total
(Dollars in millions)
Severance and other charges . . . . . . . . . . $13 $23 $ (1) $11 $ 1 $47
Curtailment gains — net . . . . . . . . . . . . . (1) — — — — (1)
Asset impairments related to restructuringactivities . . . . . . . . . . . . . . . . . . . . . . . (4) — — — — (4)
Total restructuring charges . . . . . . . . . . 8 23 (1) 11 1 42
Other fixed asset impairments . . . . . . . . . 2 — — 1 — 3Total restructuring charges and fixed
asset impairments . . . . . . . . . . . . . . . $10 $23 $ (1) $12 $ 1 $45
During 2010, the Company incurred restructuring charges as part of the Company’s ongoing effort to better
align the Company’s cost structure with global automotive market conditions. The restructuring charges of
$42 million consists of $41 million related to global workforce reduction initiatives and $5 million related to
the closure or planned closure of various facilities, partially offset by a gain of $4 million on the sale of a property
related to a closed North American braking facility, which was previously impaired as part of a 2008 restructuring
action. Other fixed asset impairments of $3 million related to the write-down of certain machinery and equipment to
fair value based on estimated future cash flows.
76
TRW Automotive Holdings Corp.
Notes to Consolidated Financial Statements — (Continued)

8/3/2019 TRW 2010 Annual Report
http://slidepdf.com/reader/full/trw-2010-annual-report 83/116
For the year ended December 31, 2009, restructuring charges and fixed asset impairments include the
following:
ChassisSystemsSegment
OccupantSafety
SystemsSegment
ElectronicsSegment
AutomotiveComponents
Segment Corporate Total
(Dollars in millions)
Severance and other charges . . . . . . . . . . $50 $19 $ 5 $18 $— $ 92
Curtailment gains — net . . . . . . . . . . . . . (4) — (1) (1) (3) (9)
Asset impairments related torestructuring activities . . . . . . . . . . . . . 4 — — — — 4
Total restructuring charges. . . . . . . . . . 50 19 4 17 (3) 87
Other fixed asset impairments . . . . . . . . . 9 — — 4 — 13
Total restructuring charges and fixedasset impairments . . . . . . . . . . . . . . $59 $19 $ 4 $21 $ (3) $100
During 2009, the Company recorded restructuring charges of $87 million, of which $61 million primarilyrelated to the global workforce reduction initiative that began in 2008, as discussed above, and $26 million related to
the closure or planned closure of various facilities. Other fixed asset impairments of $13 million related to the write-
down of certain machinery and equipment to fair value based on estimated future cash flows.
For the year ended December 31, 2008, restructuring charges and fixed asset impairments include the
following:
ChassisSystemsSegment
OccupantSafety
SystemsSegment
ElectronicsSegment
AutomotiveComponents
Segment Corporate Total
(Dollars in millions)
Severance and other charges . . . . . . . . . . $27 $28 $ 4 $ 8 $ 2 $ 69
Curtailment gains — net . . . . . . . . . . . . . (6) (1) (1) (2) (1) (11)
Asset impairments related torestructuring activities . . . . . . . . . . . . . 20 1 — — — 21
Total restructuring charges. . . . . . . . . . 41 28 3 6 1 79
Other fixed asset impairments . . . . . . . . . 48 15 1 2 — 66
Total restructuring charges and fixedasset impairments . . . . . . . . . . . . . . $89 $43 $ 4 $ 8 $ 1 $145
During 2008, the Company recorded restructuring charges of $79 million, of which $42 million primarily
related to the global workforce reduction, and $37 million related to the closure or announced closure of various
facilities. Other fixed asset impairments of $66 million related to the write-down of certain internally used software,
the write-down of certain machinery and equipment to fair value based on estimated future cash flows and the write-
down of certain buildings and leasehold improvements based on real estate market conditions.
77
TRW Automotive Holdings Corp.
Notes to Consolidated Financial Statements — (Continued)

8/3/2019 TRW 2010 Annual Report
http://slidepdf.com/reader/full/trw-2010-annual-report 84/116
Restructuring Reserves
The following table illustrates the movement of the restructuring reserves for severance and other charges (but
excludes reserves related to severance-related postemployment benefits):
2010 2009
Years EndedDecember 31,
(Dollars in millions)
Beginning balance . . . . . . . . . . . . . . . . . . . . . . . . . . . . . . . . . . . . . . . . . . . . . . $ 23 $ 32
Current period accruals, net of changes in estimates . . . . . . . . . . . . . . . . . . . 10 39
Used for purposes intended. . . . . . . . . . . . . . . . . . . . . . . . . . . . . . . . . . . . . . (16) (55)
Effects of foreign currency translation and transfers. . . . . . . . . . . . . . . . . . . . 4 7
Ending balance . . . . . . . . . . . . . . . . . . . . . . . . . . . . . . . . . . . . . . . . . . . . . . . . $ 21 $ 23
Of the $21 million restructuring reserve accrued as of December 31, 2010, approximately $15 million is
expected to be paid in 2011. The balance is expected to be paid in 2012 through 2015 and is comprised primarily of
involuntary employee termination arrangements in the United States and Europe.
13. Lease Commitments
The Company leases certain offices, manufacturing and research buildings, machinery, automobiles and
computer and other equipment. Such leases, some of which are noncancelable and in many cases include renewals,
are set to expire at various dates. Rental expense for operating leases was $104 million, $117 million, and
$131 million for the years ended December 31, 2010, 2009, and 2008, respectively.
As of December 31, 2010, the future minimum lease payments for noncancelable capital and operating leases
with initial terms in excess of one year were as follows:
Years Ended December 31,CapitalLeases
OperatingLeases
(Dollars in millions)
2011 . . . . . . . . . . . . . . . . . . . . . . . . . . . . . . . . . . . . . . . . . . . . . . . . . . . . . . . . $ 9 $ 84
2012 . . . . . . . . . . . . . . . . . . . . . . . . . . . . . . . . . . . . . . . . . . . . . . . . . . . . . . . . 8 58
2013 . . . . . . . . . . . . . . . . . . . . . . . . . . . . . . . . . . . . . . . . . . . . . . . . . . . . . . . . 3 52
2014 . . . . . . . . . . . . . . . . . . . . . . . . . . . . . . . . . . . . . . . . . . . . . . . . . . . . . . . . 3 42
2015 . . . . . . . . . . . . . . . . . . . . . . . . . . . . . . . . . . . . . . . . . . . . . . . . . . . . . . . . 3 39
Thereafter . . . . . . . . . . . . . . . . . . . . . . . . . . . . . . . . . . . . . . . . . . . . . . . . . . . . 9 77
Total minimum payments required . . . . . . . . . . . . . . . . . . . . . . . . . . . . . . . . . . $35 $352
Less amounts representing interest. . . . . . . . . . . . . . . . . . . . . . . . . . . . . . . . . 5
Present value of net minimum capital lease payments . . . . . . . . . . . . . . . . . . . . 30
Less current installments . . . . . . . . . . . . . . . . . . . . . . . . . . . . . . . . . . . . . . . . 8
Obligations under capital leases, excluding current installments . . . . . . . . . . . . . $22
14. Capital Stock
The Company’s authorized capital stock consists of (i) 500 million shares of common stock, par value $.01 per
share (the “Common Stock”), of which 122,465,854 shares were issued and outstanding as of December 31, 2010,
net of 4,668 shares of treasury stock withheld at cost to satisfy tax obligations for a specific grant under the
Company’s stock-based compensation plan; and (ii) 250 million shares of preferred stock, par value $.01 per share,
78
TRW Automotive Holdings Corp.
Notes to Consolidated Financial Statements — (Continued)

8/3/2019 TRW 2010 Annual Report
http://slidepdf.com/reader/full/trw-2010-annual-report 85/116
including 500,000 shares of Series A junior participating preferred stock, of which no shares are currently issued or
outstanding.
From time to time, capital stock is issued in conjunction with the exercise of stock options (and, in the future,
stock-settled stock appreciation rights) and the vesting of restricted stock units issued as part of the Company’sstock incentive plan.
15. Share-Based Compensation
Equity Awards
Effective in February 2003, the Company established the TRW Automotive Holdings Corp. 2003 Stock
Incentive Plan (as amended, the “Plan”), which initially permitted the grant of up to 18,500,000 stock options, stock
appreciation rights, restricted stock and other stock-based awards to the employees, directors or consultants of the
Company or its affiliates. On May 19, 2009, the Company’s stockholders approved an amendment to the Plan to
increase the number of shares available for issuance under the Plan by 4,500,000.
As of December 31, 2010, the Company had 4,943,762 shares of Common Stock available for issuance under
the Plan. In addition, 3,510,902 stock options, 529,800 stock-settled stock appreciation rights (“SSARs”) and
1,154,518 nonvested restricted stock units were outstanding as of December 31, 2010. The SSARs issued in 2010
and more than one-half of the stock options, including those issued in 2009 and 2008, have an 8-year term and vest
ratably over three years, whereas the remaining stock options have a 10-year term and vest ratably over five years.
Substantially all of the restricted stock units vest ratably over three years.
Each SSAR entitles the grantee to receive the appreciation in value of one underlying share of the Company’s
stock from the grant date fair market value to the fair market value on the exercise date, although the stock price at
exercise is limited to a maximum value of $50.00 for the SSARs granted in 2010.
The significant equity award grants during 2010, 2009 and 2008 are as follows:
SSARs RSUs
Stock
Options RSUs
Stock
Options RSUs
Stock
Options RSUs
March 3, 2010 February 26, 2009 February 26, 2008August 26, 2009
Number Granted . . . . . 535,300 632,100 277,900 5,000 678,000 642,400 997,500 525,500
Exercise price . . . . . . . $ 26.91 $ 19.02 $ 2.70 $ 24.38
The exercise price of the SSARs and stock options is equal to the average of the high and low stock price of the
Company on the grant date.
The total share-based compensation expense recognized for the Plan was as follows:
2010 2009 2008
Years EndedDecember 31,
(Dollars in millions)
SSARs and stock options . . . . . . . . . . . . . . . . . . . . . . . . . . . . . . . . . . . . . . . . . $ 3 $ 6 $ 9
Restricted stock units. . . . . . . . . . . . . . . . . . . . . . . . . . . . . . . . . . . . . . . . . . . . 10 8 11Total share-based compensation expense. . . . . . . . . . . . . . . . . . . . . . . . . . . . $13 $14 $20
The Company uses historical data to estimate SSAR and option exercise and employee termination assump-
tions within the valuation model. The expected volatilities are primarily developed using historical data of the
Company as well as expected volatility of similar entities. The expected life of SSARs and options granted
represents the period of time that they are expected to be outstanding. The risk free rate is based on U.S. Treasury
zero-coupon yield curves with a remaining term equal to the expected SSAR and option life.
79
TRW Automotive Holdings Corp.
Notes to Consolidated Financial Statements — (Continued)

8/3/2019 TRW 2010 Annual Report
http://slidepdf.com/reader/full/trw-2010-annual-report 86/116
Fair value for SSARs and stock options was estimated at the date of grant using the Black-Scholes option
pricing model using the following weighted-average assumptions:
March 3,
2010
August 26,
2009
February 26,
2009
February 26,
2008
Expected volatility . . . . . . . . . . . . . . . . . . . . . . 75.8% 65.9% 47.3% 28.2%
Dividend yield . . . . . . . . . . . . . . . . . . . . . . . . . 0.00% 0.00% 0.00% 0.00%
Expected life . . . . . . . . . . . . . . . . . . . . . . . . . . 5.0 years 5.0 years 5.0 years 5.0 years
Risk-free rate . . . . . . . . . . . . . . . . . . . . . . . . . . 2.27% 2.44% 2.07% 2.88%
A summary of SSAR and stock option activity under the Plan and changes during the year then ended is
presented below:
Thousands of Options
and SSARs
Weighted-AverageExercise
Price
Weighted-Average
RemainingContractual
Term
AggregateIntrinsic
Value
(Dollars in millions)
Outstanding at January 1, 2010 . . . . . . . 7,819 $19.86
Granted . . . . . . . . . . . . . . . . . . . . . . . . . 537 26.93
Exercised . . . . . . . . . . . . . . . . . . . . . . . (4,248) 17.97
Forfeited or expired . . . . . . . . . . . . . . . . (67) 22.32
Outstanding at December 31, 2010 . . . . . 4,041 22.74 4.5 $120
Exercisable at December 31, 2010 . . . . . 2,637 $25.12 3.4 $ 73
The weighted-average grant-date fair value of SSARs and stock options granted during the years ended
December 31, 2010, 2009 and 2008 was $3.45, $3.97, and $7.38, respectively. The total intrinsic value of SSARs
and stock options exercised during the years ended December 31, 2010, 2009 and 2008 was $89 million, $2 million
and $3 million, respectively.
A summary of the status of the Company’s nonvested restricted stock units as of December 31, 2010, and
changes during the year ended December 31, 2010, is presented below:
Nonvested Units
Thousands of Restricted
Stock Units
Weighted-Average
Grant-DateFair Value
Nonvested at January 1, 2010 . . . . . . . . . . . . . . . . . . . . . . . . . . . . . . . . . 1,061 $12.64
Granted . . . . . . . . . . . . . . . . . . . . . . . . . . . . . . . . . . . . . . . . . . . . . . . . . . 634 26.95
Vested . . . . . . . . . . . . . . . . . . . . . . . . . . . . . . . . . . . . . . . . . . . . . . . . . . . (507) 16.53
Forfeited . . . . . . . . . . . . . . . . . . . . . . . . . . . . . . . . . . . . . . . . . . . . . . . . . (33) 15.87
Nonvested at December 31, 2010. . . . . . . . . . . . . . . . . . . . . . . . . . . . . . . 1,155 $18.70
The total fair value of restricted stock units vested during the years ended December 31, 2010, 2009 and 2008
were $14 million, $1 million and $11 million, respectively.
As of December 31, 2010, there was $16 million of total unrecognized compensation cost related to nonvested
share-based compensation arrangements granted under the Plan. Such cost is expected to be recognized over a
weighted-average period of approximately 2 years.
80
TRW Automotive Holdings Corp.
Notes to Consolidated Financial Statements — (Continued)

8/3/2019 TRW 2010 Annual Report
http://slidepdf.com/reader/full/trw-2010-annual-report 87/116
Cash Awards
2010 Cash Incentive Awards — Executives. Under the 2010 Awards, as of the grant date, the Company set a
target amount for each individual receiving such award. Each award is divided into three tranches of equal value
with a tranche vesting on each of the first, second and third anniversaries of the grant date, subject to certain earlyvesting provisions. The target value of each tranche will be adjusted based upon the average price of the Company’s
common stock during a 90 day determination period that follows the vesting date, and will be paid after such
determination period. The adjustment to the target value of each award ranges from 0% to 130% (for a payout range
of zero to $3.4 million).
2009 Cash Incentive Awards — Executives and Vice Presidents. In February 2009, the Company approved
cash incentive awards for named executive officers and vice presidents (the “2009 Executive and V.P. Cash
Incentive Awards”), effective February 26, 2009 (the “Effective Date”). Under the Executive and V.P. Cash
Incentive Awards, as of the Effective Date, the Company set a target amount for each individual receiving such
award. Subject to certain early vesting provisions, one-third of the target value will be adjusted on each of the first,
second and third anniversaries of the Effective Date, based upon the average price of the Company’s common stock
during the portion of the month of February preceding such anniversary as compared to the stock price on the
Effective Date. The adjustment to the target award ranges from 0% to 250%. The adjusted values will accumulatewithout interest until the third anniversary of the Effective Date, when they will vest and become payable, provided
that the employee remains employed by the Company.
2009 Cash Incentive Awards — Directors. In February 2009, the Company also approved cash incentive
awardsfor the independent directors of the Company (the “Director Cash IncentiveAwards”), effective February 26,
2009. The terms of the Director Cash Incentive Awards generally mirrored the terms of the Executive and V.P. Cash
Incentive Awards with the exception of the vesting period and early vesting circumstances. The Director Cash
Incentive Awards vested and were paid in February 2010.
Retention Awards — Executives and Vice Presidents. In February 2009, the Company also approved
retention awards for named executive officers and vice presidents (the “Retention Awards”), effective February 26,
2009. Under the Retention Awards, the Company will pay each individual a cash award in return for the individual
remaining employed with the Company for 36 months from the effective date. During the third quarter of 2010, one-
half of these awards vested, resulting in a payment of approximately $9 million. However, such amounts paid aresubject to recoupment in the event of certain terminations of employment prior to the 36 month anniversary. The
other half of each award will vest and become payable on the 36 month anniversary of the effective date, except that
the awards for the executive officers will vest only if the price of the Company’s common stock is greater than $10
on any day during the last six months of the vesting period.
Fair Value Determination of Cash Awards. The fair value of the 2010 Awards, the 2009 Executive and V.P.
Cash Incentive Awards, the Director Cash Incentive Awards and the Retention Awards (collectively, the “Cash
Awards”) are determined based on a lattice model (the Monte Carlo simulation) and is re-measured quarterly. The
pro-rata vested portion of the awards is recognized as a liability. The lattice model utilizes inputs on volatility
assumptions, risk free rates and the price of the Company’s common stock as of each valuation date. Volatility
assumptions are based on the Company’s historical volatility and risk free rates are interpolated from U.S. constant
maturity treasury rates.
During 2010, the Company recognized compensation expense associated with the Cash Awards of approx-
imately $19 million. The liability and fair value of the Cash Awards as of December 31, 2010 were approximately
$26 million and $43 million, respectively (with a maximum payout amount of approximately $45 million).
16. Related Party Transactions
Blackstone. Pursuant to the Company’s Transaction and Monitoring Fee Agreement with The Blackstone
Group L.P. (“Blackstone”), Blackstone provides the Company monitoring, advisory and consulting services,
81
TRW Automotive Holdings Corp.
Notes to Consolidated Financial Statements — (Continued)
8/3/2019 TRW 2010 Annual Report
http://slidepdf.com/reader/full/trw-2010-annual-report 88/116
including advice regarding (i) structure, terms and negotiation of debt and equity offerings; (ii) relationships with
the Company’s and its subsidiaries’ lenders and bankers; (iii) corporate strategy; (iv) acquisitions or disposals and
(v) other financial advisory services as more fully described in the agreement. Pursuant to this agreement, the
Company has agreed to pay an annual monitoring fee of $5 million for these services. Approximately $5 million isincluded in the consolidated statements of operations for each of the years ended December 31, 2010, 2009, and
2008.
Secondary Offerings. Pursuant to the Company’s Third Amended and Restated Stockholders Agreement (the
“Third Restated Agreement”) with Automotive Investors LLC (“AI LLC”), an affiliate of Blackstone, among other
things, the Company has certain obligations with respect to both demand and incidental (or “piggyback”)
registration rights held by AI LLC. Pursuant to the Company’s employee stockholders agreement among the
Company, our management group and AI LLC, among other things, the Company has certain continuing
obligations with respect to piggyback registration rights held by the employee stockholders who are affiliates.
In March, September and November of 2010, AI LLC and certain management stockholders sold 11 million,
8 million and 10 million shares, respectively, of the Company’s common stock in underwritten registered public
offerings (the “Offerings”) pursuant to the Company’s shelf registration statement on Form S-3 filed with the SEC
on August 10, 2009. The Company did not receive any proceeds from the Offerings, nor did its number of sharesoutstanding materially change. In accordance with the Third Restated Agreement and the employee stockholders
agreement described above, the Company incurred expenses totaling less than $1 million in connection with these
Offerings. As a result of the Offerings, AI LLC’s ownership interest in the Company decreased to 16%.
17. Contingencies
Various claims, lawsuits and administrative proceedings are pending or threatened against the Company or its
subsidiaries, covering a wide range of matters that arise in the ordinary course of the Company’s business activities
with respect to commercial, patent, product liability, environmental and occupational safety and health law matters.
In addition, the Company and its subsidiaries are conducting a number of environmental investigations and
remedial actions at current and former locations of certain of the Company’s subsidiaries. Along with other
companies, certain subsidiaries of the Company have been named potentially responsible parties for certain waste
management sites. Each of these matters is subject to various uncertainties, and some of these matters may be
resolved unfavorably with respect to the Company or the relevant subsidiary. A reserve estimate for each
environmental matter is established using standard engineering cost estimating techniques on an undiscounted
basis. In the determination of such costs, consideration is given to the professional judgment of Company
environmental engineers, in consultation with outside environmental specialists, when necessary. At multi-party
sites, the reserve estimate also reflects the expected allocation of total project costs among the various potentially
responsible parties. For Superfund sites where the Company or its subsidiaries and either Chrysler Corporation
(“Chrysler”) or General Motors Corporation (“GM”) are both potentially responsible parties, the Company’s costs
or liabilities have increased because of the discharge of certain claims in the Chapter 11 bankruptcy proceedings of
those companies.
As of December 31, 2010 and 2009, the Company had reserves for environmental matters of $61 million and
$52 million, respectively. In addition, the Company has established a receivable from Northrop for a portion of this
environmental liability as a result of indemnification provided for in the master purchase agreement betweenNorthrop and an affiliate of Blackstone under which Northrop has agreed to indemnify the Company for 50% of any
environmental liabilities associated with the operation or ownership of the Company’s automotive business existing
at or prior to the acquisition, subject to certain exceptions. The Company believes any liability that may result from
the resolution of environmental matters for which sufficient information is available to support these cost estimates
will not have a material adverse effect on the Company’s financial position, results of operations or cash flows.
However, the Company cannot predict the effect on the Company’s financial position, results of operations or cash
flows of expenditures for aspects of certain matters for which there is insufficient information. In addition, the
82
TRW Automotive Holdings Corp.
Notes to Consolidated Financial Statements — (Continued)

8/3/2019 TRW 2010 Annual Report
http://slidepdf.com/reader/full/trw-2010-annual-report 89/116
Company cannot predict the effect of compliance with environmental laws and regulations with respect to unknown
environmental matters on the Company’s financial position, results of operations or cash flows or the possible effect
of compliance with environmental requirements imposed in the future.
The Company faces an inherent business risk of exposure to product liability, recall and warranty claims in theevent that its products actually or allegedly fail to perform as expected or the use of its products results, or is alleged
to result, in bodily injury and/or property damage. Accordingly, the Company could experience material warranty,
recall or product liability losses in the future. For further information, including quantification, of our product
warranty liability see the description of “Warranties” under Summary of Significant Accounting Policies in Note 2.
While certain of the Company’s subsidiaries have been subject in recent years to asbestos-related claims,
management believes that such claims will not have a material adverse effect on the Company’s financial condition,
results of operations or cash flows. In general, these claims seek damages for illnesses alleged to have resulted from
exposure to asbestos used in certain components sold in the past by the Company’s subsidiaries. Management
believes that the majority of the claimants were vehicle mechanics. The vast majority of these claims name as
defendants numerous manufacturers and suppliers of a variety of products allegedly containing asbestos. Man-
agement believes that, to the extent any of the products sold by the Company’s subsidiaries and at issue in these
cases contained asbestos, the asbestos was encapsulated. Based upon several years of experience with such claims,management believes that only a small proportion of the claimants has or will ever develop any asbestos-related
illness.
Neither settlement costs in connection with asbestos claims nor annual legal fees to defend these claims have
been material in the past. These claims are strongly disputed by the Company and it has been its policy to defend
against them aggressively. Many of these cases have been dismissed without any payment whatsoever. Moreover,
there is significant insurance coverage with solvent carriers with respect to these claims. However, while costs to
defend and settle these claims in the past have not been material, there can be no assurances that this will remain so
in the future.
Management believes that the ultimate resolution of the foregoing matters will not have a material effect on the
Company’s financial condition, results of operations or cash flows or on the Company’s financial statements as a
whole.
18. Segment Information
The Company is a U.S.-based international business providing advanced technology products and services for
the automotive markets. The Company has four reportable segments: Chassis Systems, Occupant Safety Systems,
Electronics and Automotive Components.
The principal customers for the Company’s automotive products are the North American, European and Asian
vehicle manufacturers.
Segment Information. The Company designs, manufactures and sells a broad range of steering, suspension
and braking products, seat belts, airbags, steering wheels, safety electronics, engine valves, engineered fasteners,
body control systems, and other components and systems for passenger cars, light trucks and commercial vehicles.
A description of the products and services provided by each of the segments follows.Chassis Systems — Active safety systems and other systems and components in the area of foundation
brakes, anti-lock braking systems and other brake control (including electronic vehicle stability control),
steering gears and systems, linkage and suspension and modules.
Occupant Safety Systems — Passive safety systems and components in the areas of airbags, seat belts,
crash sensors and steering wheels.
Electronics — Safety, radio frequency, chassis, powertrain electronics and driver assistance systems.
83
TRW Automotive Holdings Corp.
Notes to Consolidated Financial Statements — (Continued)
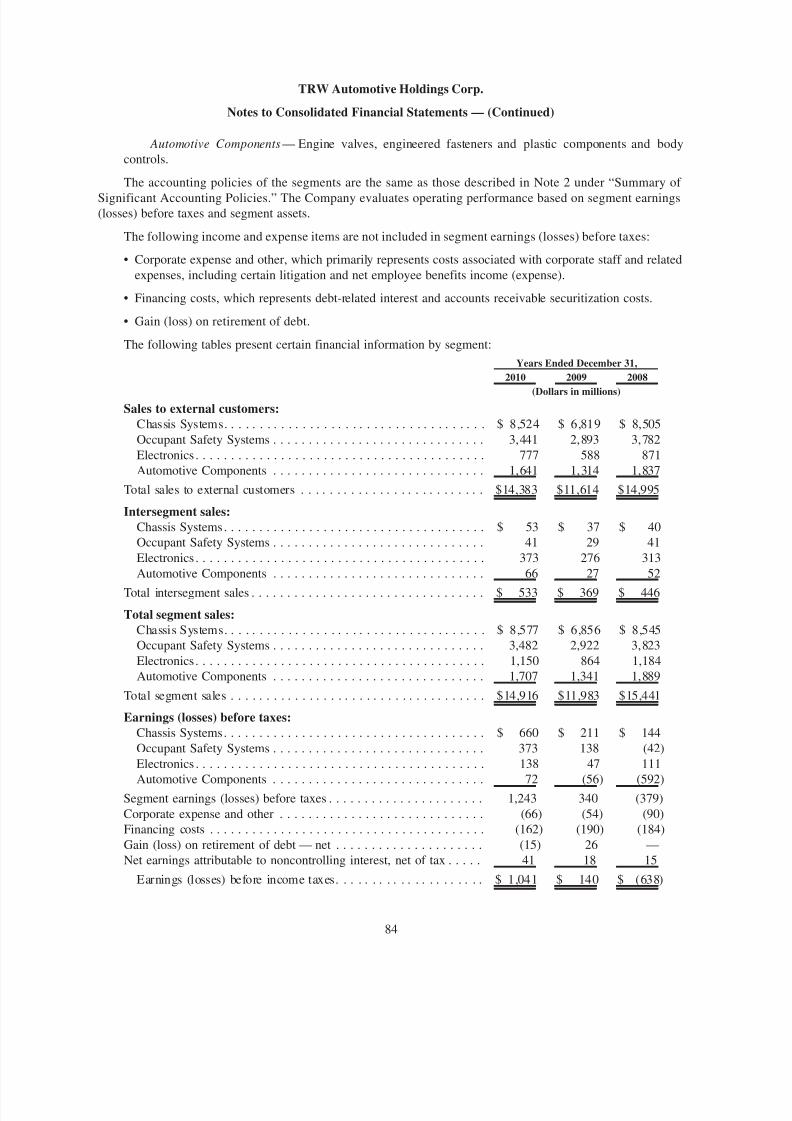
8/3/2019 TRW 2010 Annual Report
http://slidepdf.com/reader/full/trw-2010-annual-report 90/116
Automotive Components— Engine valves, engineered fasteners and plastic components and body
controls.
The accounting policies of the segments are the same as those described in Note 2 under “Summary of
Significant Accounting Policies.” The Company evaluates operating performance based on segment earnings(losses) before taxes and segment assets.
The following income and expense items are not included in segment earnings (losses) before taxes:
• Corporate expense and other, which primarily represents costs associated with corporate staff and related
expenses, including certain litigation and net employee benefits income (expense).
• Financing costs, which represents debt-related interest and accounts receivable securitization costs.
• Gain (loss) on retirement of debt.
The following tables present certain financial information by segment:
2010 2009 2008
Years Ended December 31,
(Dollars in millions)Sales to external customers:
Chassis Systems. . . . . . . . . . . . . . . . . . . . . . . . . . . . . . . . . . . . . $ 8,524 $ 6,819 $ 8,505
Occupant Safety Systems . . . . . . . . . . . . . . . . . . . . . . . . . . . . . . 3,441 2,893 3,782
Electronics . . . . . . . . . . . . . . . . . . . . . . . . . . . . . . . . . . . . . . . . . 777 588 871
Automotive Components . . . . . . . . . . . . . . . . . . . . . . . . . . . . . . 1,641 1,314 1,837
Total sales to external customers . . . . . . . . . . . . . . . . . . . . . . . . . . $14,383 $11,614 $14,995
Intersegment sales:Chassis Systems . . . . . . . . . . . . . . . . . . . . . . . . . . . . . . . . . . . . . $ 53 $ 37 $ 40
Occupant Safety Systems . . . . . . . . . . . . . . . . . . . . . . . . . . . . . . 41 29 41
Electronics . . . . . . . . . . . . . . . . . . . . . . . . . . . . . . . . . . . . . . . . . 373 276 313
Automotive Components . . . . . . . . . . . . . . . . . . . . . . . . . . . . . . 66 27 52
Total intersegment sales . . . . . . . . . . . . . . . . . . . . . . . . . . . . . . . . . $ 533 $ 369 $ 446
Total segment sales:Chassis Systems. . . . . . . . . . . . . . . . . . . . . . . . . . . . . . . . . . . . . $ 8,577 $ 6,856 $ 8,545
Occupant Safety Systems . . . . . . . . . . . . . . . . . . . . . . . . . . . . . . 3,482 2,922 3,823
Electronics . . . . . . . . . . . . . . . . . . . . . . . . . . . . . . . . . . . . . . . . . 1,150 864 1,184
Automotive Components . . . . . . . . . . . . . . . . . . . . . . . . . . . . . . 1,707 1,341 1,889
Total segment sales . . . . . . . . . . . . . . . . . . . . . . . . . . . . . . . . . . . . $14,916 $11,983 $15,441
Earnings (losses) before taxes:Chassis Systems . . . . . . . . . . . . . . . . . . . . . . . . . . . . . . . . . . . . . $ 660 $ 211 $ 144
Occupant Safety Systems . . . . . . . . . . . . . . . . . . . . . . . . . . . . . . 373 138 (42)
Electronics . . . . . . . . . . . . . . . . . . . . . . . . . . . . . . . . . . . . . . . . . 138 47 111
Automotive Components . . . . . . . . . . . . . . . . . . . . . . . . . . . . . . 72 (56) (592)Segment earnings (losses) before taxes . . . . . . . . . . . . . . . . . . . . . . 1,243 340 (379)
Corporate expense and other . . . . . . . . . . . . . . . . . . . . . . . . . . . . . (66) (54) (90)
Financing costs . . . . . . . . . . . . . . . . . . . . . . . . . . . . . . . . . . . . . . . (162) (190) (184)
Gain (loss) on retirement of debt — net . . . . . . . . . . . . . . . . . . . . . (15) 26 —
Net earnings attributable to noncontrolling interest, net of tax . . . . . 41 18 15
Earnings (losses) before income taxes. . . . . . . . . . . . . . . . . . . . . $ 1,041 $ 140 $ (638)
84
TRW Automotive Holdings Corp.
Notes to Consolidated Financial Statements — (Continued)
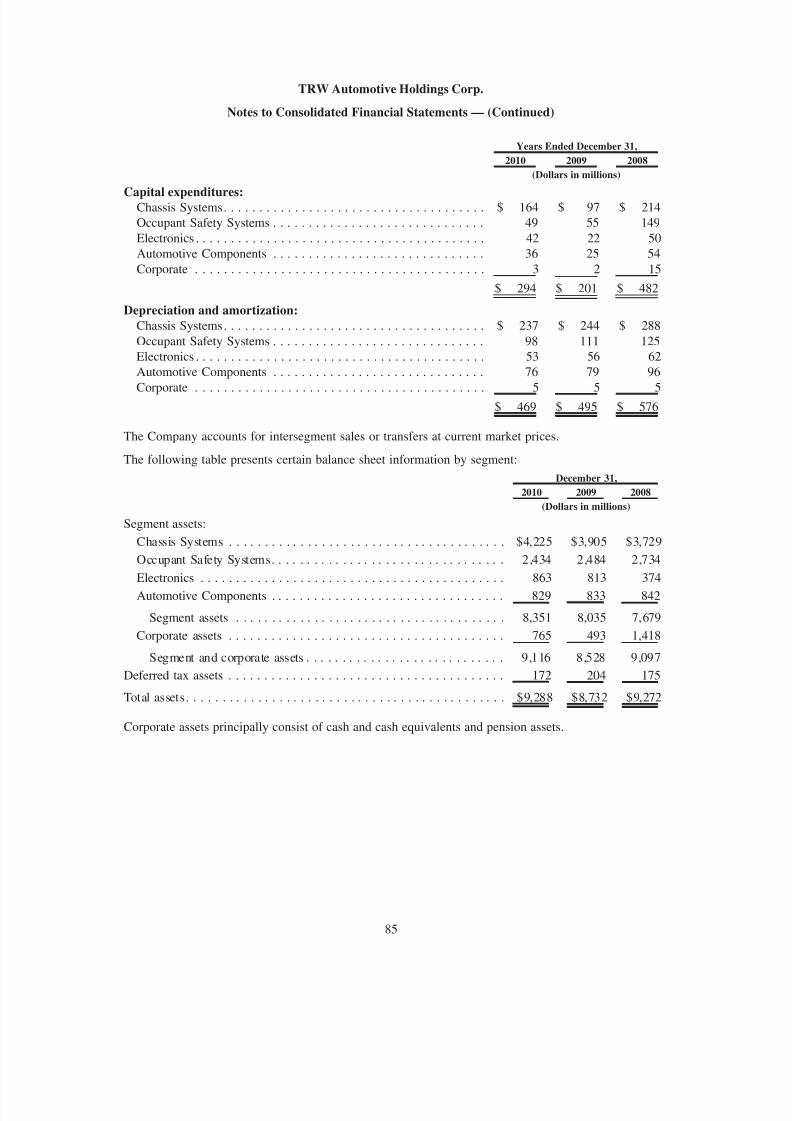
8/3/2019 TRW 2010 Annual Report
http://slidepdf.com/reader/full/trw-2010-annual-report 91/116
2010 2009 2008
Years Ended December 31,
(Dollars in millions)
Capital expenditures:Chassis Systems . . . . . . . . . . . . . . . . . . . . . . . . . . . . . . . . . . . . . $ 164 $ 97 $ 214
Occupant Safety Systems . . . . . . . . . . . . . . . . . . . . . . . . . . . . . . 49 55 149
Electronics . . . . . . . . . . . . . . . . . . . . . . . . . . . . . . . . . . . . . . . . . 42 22 50
Automotive Components . . . . . . . . . . . . . . . . . . . . . . . . . . . . . . 36 25 54
Corporate . . . . . . . . . . . . . . . . . . . . . . . . . . . . . . . . . . . . . . . . . 3 2 15
$ 294 $ 201 $ 482
Depreciation and amortization:Chassis Systems . . . . . . . . . . . . . . . . . . . . . . . . . . . . . . . . . . . . . $ 237 $ 244 $ 288
Occupant Safety Systems . . . . . . . . . . . . . . . . . . . . . . . . . . . . . . 98 111 125
Electronics . . . . . . . . . . . . . . . . . . . . . . . . . . . . . . . . . . . . . . . . . 53 56 62
Automotive Components . . . . . . . . . . . . . . . . . . . . . . . . . . . . . . 76 79 96
Corporate . . . . . . . . . . . . . . . . . . . . . . . . . . . . . . . . . . . . . . . . . 5 5 5$ 469 $ 495 $ 576
The Company accounts for intersegment sales or transfers at current market prices.
The following table presents certain balance sheet information by segment:
2010 2009 2008
December 31,
(Dollars in millions)
Segment assets:
Chassis Systems . . . . . . . . . . . . . . . . . . . . . . . . . . . . . . . . . . . . . . . $4,225 $3,905 $3,729
Occupant Safety Systems. . . . . . . . . . . . . . . . . . . . . . . . . . . . . . . . . 2,434 2,484 2,734
Electronics . . . . . . . . . . . . . . . . . . . . . . . . . . . . . . . . . . . . . . . . . . . 863 813 374
Automotive Components . . . . . . . . . . . . . . . . . . . . . . . . . . . . . . . . . 829 833 842
Segment assets . . . . . . . . . . . . . . . . . . . . . . . . . . . . . . . . . . . . . . 8,351 8,035 7,679
Corporate assets . . . . . . . . . . . . . . . . . . . . . . . . . . . . . . . . . . . . . . . 765 493 1,418
Segment and corporate assets . . . . . . . . . . . . . . . . . . . . . . . . . . . . 9,116 8,528 9,097
Deferred tax assets . . . . . . . . . . . . . . . . . . . . . . . . . . . . . . . . . . . . . . . 172 204 175
Total assets. . . . . . . . . . . . . . . . . . . . . . . . . . . . . . . . . . . . . . . . . . . . . $9,288 $8,732 $9,272
Corporate assets principally consist of cash and cash equivalents and pension assets.
85
TRW Automotive Holdings Corp.
Notes to Consolidated Financial Statements — (Continued)
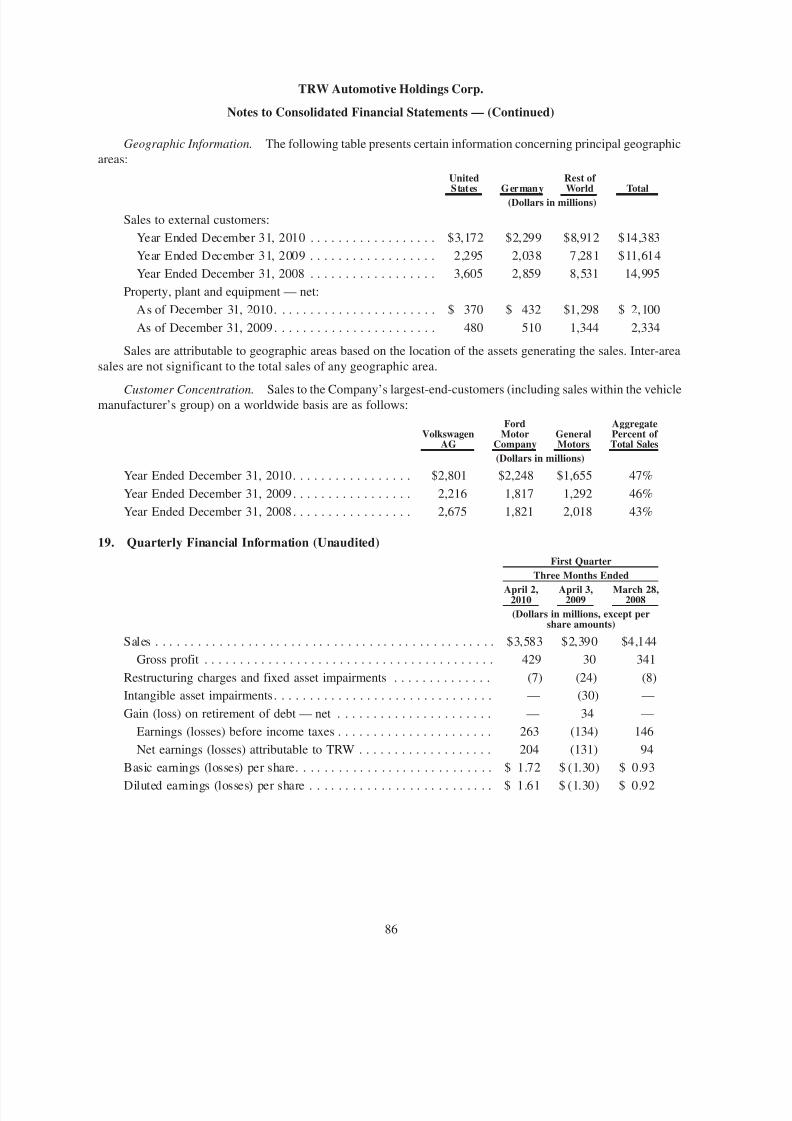
8/3/2019 TRW 2010 Annual Report
http://slidepdf.com/reader/full/trw-2010-annual-report 92/116
Geographic Information. The following table presents certain information concerning principal geographic
areas:
UnitedStates Germany
Rest of World Total
(Dollars in millions)
Sales to external customers:
Year Ended December 31, 2010 . . . . . . . . . . . . . . . . . . $3,172 $2,299 $8,912 $14,383
Year Ended December 31, 2009 . . . . . . . . . . . . . . . . . . 2,295 2,038 7,281 $11,614
Year Ended December 31, 2008 . . . . . . . . . . . . . . . . . . 3,605 2,859 8,531 14,995
Property, plant and equipment — net:
As of December 31, 2010. . . . . . . . . . . . . . . . . . . . . . . $ 370 $ 432 $1,298 $ 2,100
As of December 31, 2009 . . . . . . . . . . . . . . . . . . . . . . . 480 510 1,344 2,334
Sales are attributable to geographic areas based on the location of the assets generating the sales. Inter-area
sales are not significant to the total sales of any geographic area.
Customer Concentration. Sales to the Company’s largest-end-customers (including sales within the vehiclemanufacturer’s group) on a worldwide basis are as follows:
VolkswagenAG
FordMotor
CompanyGeneralMotors
AggregatePercent of Total Sales
(Dollars in millions)
Year Ended December 31, 2010. . . . . . . . . . . . . . . . . $2,801 $2,248 $1,655 47%
Year Ended December 31, 2009 . . . . . . . . . . . . . . . . . 2,216 1,817 1,292 46%
Year Ended December 31, 2008 . . . . . . . . . . . . . . . . . 2,675 1,821 2,018 43%
19. Quarterly Financial Information (Unaudited)
April 2,2010
April 3,2009
March 28,2008
Three Months Ended
First Quarter
(Dollars in millions, except pershare amounts)
Sales . . . . . . . . . . . . . . . . . . . . . . . . . . . . . . . . . . . . . . . . . . . . . . . . $3,583 $2,390 $4,144
Gross profit . . . . . . . . . . . . . . . . . . . . . . . . . . . . . . . . . . . . . . . . . 429 30 341
Restructuring charges and fixed asset impairments . . . . . . . . . . . . . . (7) (24) (8)
Intangible asset impairments . . . . . . . . . . . . . . . . . . . . . . . . . . . . . . . — (30) —
Gain (loss) on retirement of debt — net . . . . . . . . . . . . . . . . . . . . . . — 34 —
Earnings (losses) before income taxes . . . . . . . . . . . . . . . . . . . . . . 263 (134) 146
Net earnings (losses) attributable to TRW . . . . . . . . . . . . . . . . . . . 204 (131) 94
Basic earnings (losses) per share. . . . . . . . . . . . . . . . . . . . . . . . . . . . $ 1.72 $ (1.30) $ 0.93
Diluted earnings (losses) per share . . . . . . . . . . . . . . . . . . . . . . . . . . $ 1.61 $ (1.30) $ 0.92
86
TRW Automotive Holdings Corp.
Notes to Consolidated Financial Statements — (Continued)

8/3/2019 TRW 2010 Annual Report
http://slidepdf.com/reader/full/trw-2010-annual-report 93/116
July 2,2010
July 3,2009
June 27,2008
Three Months Ended
Second Quarter
(Dollars in millions, except pershare amounts)
Sales . . . . . . . . . . . . . . . . . . . . . . . . . . . . . . . . . . . . . . . . . . . . . . . . . $3,661 $2,732 $4,446
Gross profit . . . . . . . . . . . . . . . . . . . . . . . . . . . . . . . . . . . . . . . . . . 439 200 401
Restructuring charges and fixed asset impairments . . . . . . . . . . . . . . . . (3) (26) (24)
Gain (loss) on retirement of debt — net . . . . . . . . . . . . . . . . . . . . . . . . (1) 1 —
Earnings (losses) before income taxes . . . . . . . . . . . . . . . . . . . . . . . 289 8 188
Net earnings (losses) attributable to TRW . . . . . . . . . . . . . . . . . . . . 227 (11) 127
Basic earnings (losses) per share . . . . . . . . . . . . . . . . . . . . . . . . . . . . . $ 1.90 $ (0.11) $ 1.26
Diluted earnings (losses) per share . . . . . . . . . . . . . . . . . . . . . . . . . . . $ 1.78 $ (0.11) $ 1.24
October 1,2010
October 2,2009
September 26,2008
Three Months Ended
Third Quarter
(Dollars in millions, except per shareamounts)
Sales . . . . . . . . . . . . . . . . . . . . . . . . . . . . . . . . . . . . . . . . . . $3,426 $3,108 $3,592
Gross profit . . . . . . . . . . . . . . . . . . . . . . . . . . . . . . . . . . . 387 301 181
Restructuring charges and fixed asset impairments . . . . . . . . . — (24) (32)
Gain (loss) on retirement of debt — net . . . . . . . . . . . . . . . . . (1) (1) —
Earnings (losses) before income taxes . . . . . . . . . . . . . . . . 236 90 (29)
Net earnings (losses) attributable to TRW . . . . . . . . . . . . . 199 56 54
Basic earnings (losses) per share . . . . . . . . . . . . . . . . . . . . . . $ 1.66 $ 0.51 $ (0.53)
Diluted earnings (losses) per share . . . . . . . . . . . . . . . . . . . . $ 1.54 $ 0.50 $ (0.53)
2010 2009 2008
Three Months EndedDecember 31,
Fourth Quarter
(Dollars in millions, except pershare amounts)
Sales . . . . . . . . . . . . . . . . . . . . . . . . . . . . . . . . . . . . . . . . . . . . . . . . . $3,713 $3,384 $2,813
Gross profit . . . . . . . . . . . . . . . . . . . . . . . . . . . . . . . . . . . . . . . . . . . 467 375 95
Restructuring charges and fixed asset impairments . . . . . . . . . . . . . . . . (35) (26) (81)
Goodwill impairments . . . . . . . . . . . . . . . . . . . . . . . . . . . . . . . . . . . . . — — (458)
Intangible asset impairments . . . . . . . . . . . . . . . . . . . . . . . . . . . . . . . . — — (329)
Gain (loss) on retirement of debt — net . . . . . . . . . . . . . . . . . . . . . . . . (13) (8) —Earnings (losses) before income taxes . . . . . . . . . . . . . . . . . . . . . . . 253 176 (943)
Net earnings (losses) attributable to TRW. . . . . . . . . . . . . . . . . . . . . 204 141 (946)
Basic earnings (losses) per share . . . . . . . . . . . . . . . . . . . . . . . . . . . . . $ 1.68 $ 1.20 $ (9.35)
Diluted earnings (losses) per share. . . . . . . . . . . . . . . . . . . . . . . . . . . . $ 1.56 $ 1.18 $ (9.35)
87
TRW Automotive Holdings Corp.
Notes to Consolidated Financial Statements — (Continued)

8/3/2019 TRW 2010 Annual Report
http://slidepdf.com/reader/full/trw-2010-annual-report 94/116
20. Unconsolidated Affiliates
The Company’s beneficial ownership in affiliates accounted for under the equity method follows:
2010 2009 2008
December 31,
SM-Sistemas Modulares Ltda. (Brazil) . . . . . . . . . . . . . . . . . . . . . . . . . . . . . . . 50% 50% 50%
ABC Sistemas E Modulos Ltda. (Brazil) . . . . . . . . . . . . . . . . . . . . . . . . . . . . . 33% 33% 33%
CSG TRW Chassis Systems Co., Ltd. (China) . . . . . . . . . . . . . . . . . . . . . . . . . 50% 50% 50%
Shanghai TRW Automotive Safety Systems Co., Ltd (China) . . . . . . . . . . . . . . 50% 50% 50%
Shin Han Beijing Automobile Parts System Co., Ltd (China) . . . . . . . . . . . . . . 30% 30% 30%
Fuji Valve (Guangdong) Co., Ltd. (China) . . . . . . . . . . . . . . . . . . . . . . . . . . . . 25% 0% 0%
TH Braking Company S.A.S. (France) . . . . . . . . . . . . . . . . . . . . . . . . . . . . . . . 50% 50% 50%
Rane TRW Steering Systems Limited (India) . . . . . . . . . . . . . . . . . . . . . . . . . . 50% 50% 50%
Brakes India Limited (India) . . . . . . . . . . . . . . . . . . . . . . . . . . . . . . . . . . . . . . 49% 49% 49%
TRW Sun Steering Wheels Private Limited (India) . . . . . . . . . . . . . . . . . . . . . . 49% 49% 49%
Shin Han Valve Industrial Co., Ltd (Korea) . . . . . . . . . . . . . . . . . . . . . . . . . . . 25% 25% 25%
Mediterranea de Volants, S.L. (Spain). . . . . . . . . . . . . . . . . . . . . . . . . . . . . . . . 0% 49% 49%
Components Venezolanos de Direccion, S.A. (Venezuela) . . . . . . . . . . . . . . . . . 40% 40% 40%
Summarized aggregate financial information from the balance sheets and statements of operations of the
Company’s affiliates accounted for under the equity method follows:
2010 2009 2008
Years Ended andas of December 31,
(Dollars in millions)
Statements of Operations
Sales . . . . . . . . . . . . . . . . . . . . . . . . . . . . . . . . . . . . . . . . . . . . . . . . . . . . . . . . . . . $1,200 $783 $819
Gross profit . . . . . . . . . . . . . . . . . . . . . . . . . . . . . . . . . . . . . . . . . . . . . . . . . . . . . . 325 197 244Earnings from continuing operations . . . . . . . . . . . . . . . . . . . . . . . . . . . . . . . . . . . . 74 37 37
Net earnings . . . . . . . . . . . . . . . . . . . . . . . . . . . . . . . . . . . . . . . . . . . . . . . . . . . . . . $ 74 $ 37 $ 37
Balance Sheets
Current assets . . . . . . . . . . . . . . . . . . . . . . . . . . . . . . . . . . . . . . . . . . . . . . . . . . . . . $ 530 $390 $345
Noncurrent assets . . . . . . . . . . . . . . . . . . . . . . . . . . . . . . . . . . . . . . . . . . . . . . . . . . 265 243 232
Current liabilities . . . . . . . . . . . . . . . . . . . . . . . . . . . . . . . . . . . . . . . . . . . . . . . . . . $ 345 $262 $174
Noncurrent liabilities. . . . . . . . . . . . . . . . . . . . . . . . . . . . . . . . . . . . . . . . . . . . . . . . 287 133 182
88
TRW Automotive Holdings Corp.
Notes to Consolidated Financial Statements — (Continued)

8/3/2019 TRW 2010 Annual Report
http://slidepdf.com/reader/full/trw-2010-annual-report 95/116
REPORT OF ERNST & YOUNG LLP, INDEPENDENT REGISTERED
PUBLIC ACCOUNTING FIRM
To the Board of Directors and Shareholders of TRW Automotive Holdings Corp.
Livonia, Michigan
We have audited the accompanying consolidated balance sheets of TRW Automotive Holdings Corp. as of
December 31, 2010 and 2009, and the related consolidated statements of operations, cash flows and changes in
stockholders’ equity for each of the three years in the period ended December 31, 2010. Our audits also included the
financial statement schedule included as Item 15(a)(2). These financial statements and schedule are the respon-
sibility of the Company’s management. Our responsibility is to express an opinion on these financial statements and
schedule based on our audits.
We conducted our audits in accordance with the standards of the Public Company Accounting Oversight Board
(United States). Those standards require that we plan and perform the audit to obtain reasonable assurance about
whether the financial statements are free of material misstatement. An audit includes examining, on a test basis,
evidence supporting the amounts and disclosures in the financial statements. An audit also includes assessing the
accounting principles used and significant estimates made by management, as well as evaluating the overall
financial statement presentation. We believe that our audits provide a reasonable basis for our opinion.
In our opinion, the financial statements referred to above present fairly, in all material respects, the
consolidated financial position of TRW Automotive Holdings Corp. at December 31, 2010 and 2009, and theconsolidated results of its operations and its cash flows for each of the three years in the period ended December 31,
2010 in conformity with U.S. generally accepted accounting principles. Also, in our opinion, the related financial
statement schedule, when considered in relation to the basic financial statements taken as a whole, presents fairly in
all material respects the information set forth therein.
We also have audited, in accordance with the standards of the Public Company Accounting Oversight Board
(United States), TRW Automotive Holdings Corp.’s internal control over financial reporting as of December 31,
2010, based on criteria established in Internal Control — Integrated Framework issued by the Committee of
Sponsoring Organizations of the Treadway Commission and our report dated February 17, 2011 expressed an
unqualified opinion thereon.
/s/ Ernst & Young LLP
Detroit, Michigan
February 17, 2011
89

8/3/2019 TRW 2010 Annual Report
http://slidepdf.com/reader/full/trw-2010-annual-report 96/116
REPORT OF ERNST & YOUNG LLP, INDEPENDENT REGISTERED
PUBLIC ACCOUNTING FIRM
To the Board of Directors and Shareholders of TRW Automotive Holdings Corp.
Livonia, Michigan
We have audited TRW Automotive Holdings Corp.’s internal control over financial reporting as of Decem-
ber 31, 2010, based on criteria established in Internal Control — Integrated Framework issued by the Committee of Sponsoring Organizations of the Treadway Commission (the COSO criteria). TRW Automotive Holdings Corp.’s
management is responsible for maintaining effective internal control over financial reporting, and for its assessment
of the effectiveness of internal control over financial reporting included in the accompanying Management’s Report
on Internal Control over Financial Reporting. Our responsibility is to express an opinion on the Company’s internal
control over financial reporting based on our audit.
We conducted our audit in accordance with the standards of the Public Company Accounting Oversight Board
(United States). Those standards require that we plan and perform the audit to obtain reasonable assurance about
whether effective internal control over financial reporting was maintained in all material respects. Our audit
included obtaining an understanding of internal control over financial reporting, assessing the risk that a material
weakness exists, testing and evaluating the design and operating effectiveness of internal control based on the
assessed risk, and performing such other procedures as we considered necessary in the circumstances. We believe
that our audit provides a reasonable basis for our opinion.
A company’s internal control over financial reporting is a process designed to provide reasonable assurance
regarding the reliability of financial reporting and the preparation of financial statements for external purposes in
accordance with generally accepted accounting principles. A company’s internal control over financial reporting
includes those policies and procedures that (1) pertain to the maintenance of records that, in reasonable detail,
accurately and fairly reflect the transactions and dispositions of the assets of the company; (2) provide reasonable
assurance that transactions are recorded as necessary to permit preparation of financial statements in accordance
with generally accepted accounting principles, and that receipts and expenditures of the company are being made
only in accordance with authorizations of management and directors of the company; and (3) provide reasonable
assurance regarding prevention or timely detection of unauthorized acquisition, use, or disposition of the company’s
assets that could have a material effect on the financial statements.
Because of its inherent limitations, internal control over financial reporting may not prevent or detect
misstatements. Also, projections of any evaluation of effectiveness to future periods are subject to the risk that
controls may become inadequate because of changes in conditions, or that the degree of compliance with the
policies or procedures may deteriorate.
In our opinion, TRWAutomotive Holdings Corp. maintained, in all material respects, effective internal control
over financial reporting as of December 31, 2010, based on the COSO criteria.
We also have audited, in accordance with the standards of the Public Company Accounting Oversight Board
(United States), the consolidated balance sheets of the Company as of December 31, 2010 and 2009, and the related
consolidated statements of operations, cash flows and changes in stockholders’ equity for each of the three years inthe period ended December 31, 2010 and our report dated February 17, 2011 expressed an unqualified opinion
thereon.
/s/ Ernst & Young LLP
Detroit, Michigan
February 17, 2011
90
8/3/2019 TRW 2010 Annual Report
http://slidepdf.com/reader/full/trw-2010-annual-report 97/116
ITEM 9. CHANGES IN AND DISAGREEMENTS WITH ACCOUNTANTS ON ACCOUNTING AND
FINANCIAL DISCLOSURE
None.
ITEM 9A. CONTROLS AND PROCEDURES
Evaluation of Disclosure Controls and Procedures. Our Chief Executive Officer and Chief Financial Officer,
based on their evaluation of the effectiveness of the Company’s disclosure controls and procedures (as defined in
Rule 13a — 15(e) under the Securities Exchange Act of 1934) as of December 31, 2010, have concluded that the
Company’s disclosure controls and procedures are effective to ensure that information required to be disclosed by
the Company in the reports that it files and submits under the Securities Exchange Act of 1934 (the “Exchange Act”)
is accumulated and communicated to the Company’s management as appropriate to allow timely decisions
regarding required disclosure and is recorded, processed, summarized and reported within the specified time
periods.
Management’s Report on Internal Control over Financial Reporting. Management is responsible for
establishing and maintaining adequate internal control over financial reporting, as such term is defined in
Rule 13a-15(f) of the Exchange Act. The Company’s internal control over financial reporting is a process designed
to provide reasonable assurance regarding the reliability of financial reporting and the preparation of financial
statements for external purposes in accordance with United States generally accepted accounting principles.
Because of its inherent limitations, a system of internal control over financial reporting can provide only
reasonable assurance and may not prevent or detect misstatements. Further, because of changes in conditions,
effectiveness of internal controls over financial reporting may vary over time.
Under the supervision and with the participation of our management, including our Chief Executive Officer
and Chief Financial Officer, the Company conducted an assessment of the effectiveness of its internal control over
financial reporting as of December 31, 2010. The assessment was based on criteria established in the framework
entitled, Internal Control — Integrated Framework, issued by the Committee of Sponsoring Organizations (COSO)
of the Treadway Commission.
Based on this assessment, using the criteria referenced above, management concluded that our internal control
over financial reporting was effective as of December 31, 2010. The effectiveness of the Company’s internal control
over financial reporting as of December 31, 2010 has been audited by Ernst & Young, LLP, an independent
registered public accounting firm, as stated in their report included herein.
Changes in Internal Control over Financial Reporting. There was no change in the Company’s internal
controls over financial reporting that occurred during the fourth fiscal quarter of 2010 that has materially affected,
or is reasonably likely to materially affect, the Company’s internal control over financial reporting.
ITEM 9B. OTHER INFORMATION
None.
PART III
ITEM 10. DIRECTORS, EXECUTIVE OFFICERS AND CORPORATE GOVERNANCE
The information required by Item 10 regarding executive officers and directors is incorporated by reference
from the information under the captions “Executive Officers” and “The Board of Directors” in TRW’s definitive
Proxy Statement for the 2011 Annual Meeting of the Stockholders (the “Proxy Statement”), which will be filed
within 120 days after December 31, 2010. The information required by Item 10 regarding the audit committee, audit
committee financial expert disclosure and our code of ethics is incorporated by reference from the information
under the caption “Committees of the Board of Directors” in the Proxy Statement. Disclosure of delinquent
Section 16 filers, if any, pursuant to Item 405 of Regulation S-K will be contained in the Proxy Statement.
91

8/3/2019 TRW 2010 Annual Report
http://slidepdf.com/reader/full/trw-2010-annual-report 98/116
ITEM 11. EXECUTIVE COMPENSATION
The information required by Item 11 is incorporated by reference from the information under the following
captions in the Proxy Statement: “Compensation Committee Report,” “Compensation Discussion and Analysis,”
“Compensation of Executive Officers,” and “Director Compensation.”
ITEM 12. SECURITY OWNERSHIP OF CERTAIN BENEFICIAL OWNERS AND MANAGEMENT
AND RELATED STOCKHOLDER MATTERS
The information required by Item 12 relating to security ownership is incorporated by reference from the
information under the caption “Security Ownership of Certain Beneficial Owners and Management” in the Proxy
Statement.
The information required by Item 12 relating to securities authorized for issuance under equity compensation
plans is incorporated herein by reference from “Item 5. Market for Registrant’s Common Equity, Related
Stockholder Matters and Issuer Purchases of Equity Securities” in this Report.
ITEM 13. CERTAIN RELATIONSHIPS AND RELATED TRANSACTIONS, AND DIRECTOR
INDEPENDENCE
The information required by Item 13 regarding transactions with related persons is incorporated by reference
from the information under the caption “Transactions with Related Persons” in the Proxy Statement.
The information required by Item 13 regarding director independence is incorporated by reference from the
information under the caption “The Board of Directors” in the Proxy Statement.
ITEM 14. PRINCIPAL ACCOUNTING FEES AND SERVICES
The information required by Item 14 is incorporated by reference from the information under the caption
“Independent Registered Public Accounting Firm Fees” in the Proxy Statement.
92
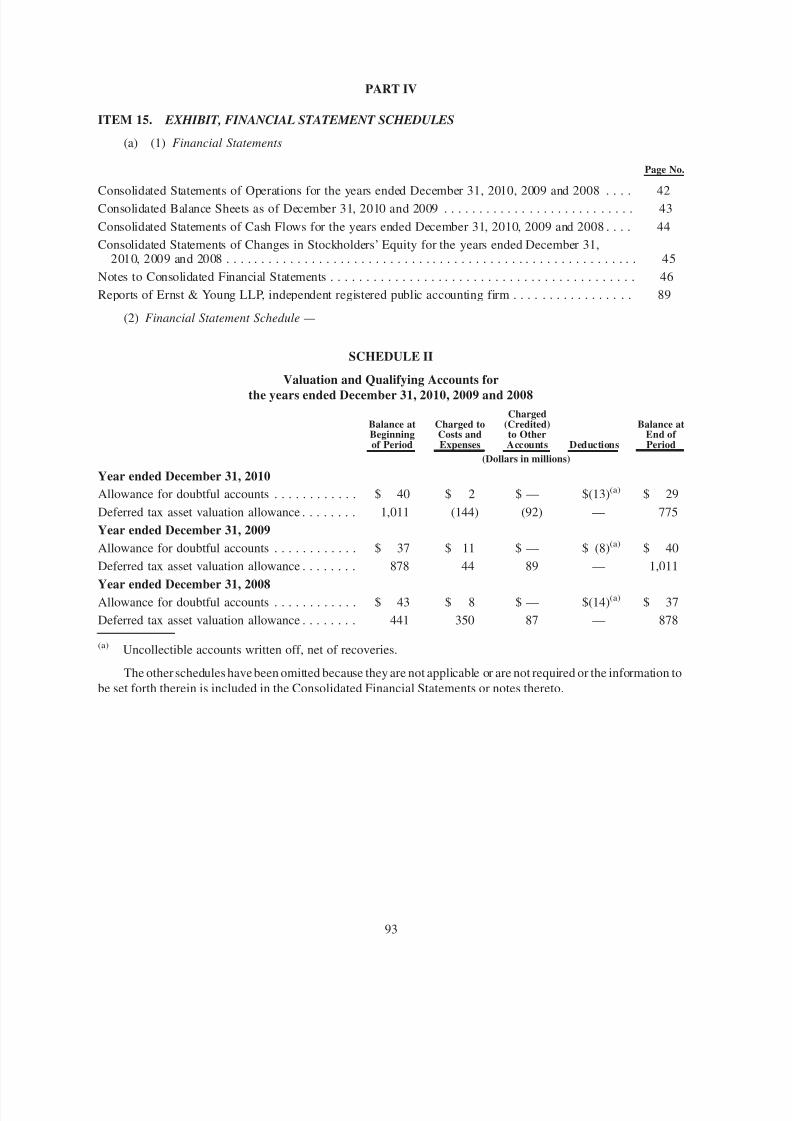
8/3/2019 TRW 2010 Annual Report
http://slidepdf.com/reader/full/trw-2010-annual-report 99/116
PART IV
ITEM 15. EXHIBIT, FINANCIAL STATEMENT SCHEDULES
(a) (1) Financial Statements
Page No.
Consolidated Statements of Operations for the years ended December 31, 2010, 2009 and 2008 . . . . 42Consolidated Balance Sheets as of December 31, 2010 and 2009 . . . . . . . . . . . . . . . . . . . . . . . . . . . 43
Consolidated Statements of Cash Flows for the years ended December 31, 2010, 2009 and 2008 . . . . 44
Consolidated Statements of Changes in Stockholders’ Equity for the years ended December 31,2010, 2009 and 2008 . . . . . . . . . . . . . . . . . . . . . . . . . . . . . . . . . . . . . . . . . . . . . . . . . . . . . . . . . . 45
Notes to Consolidated Financial Statements . . . . . . . . . . . . . . . . . . . . . . . . . . . . . . . . . . . . . . . . . . . 46
Reports of Ernst & Young LLP, independent registered public accounting firm . . . . . . . . . . . . . . . . . 89
(2) Financial Statement Schedule —
SCHEDULE II
Valuation and Qualifying Accounts for
the years ended December 31, 2010, 2009 and 2008
Balance atBeginningof Period
Charged toCosts andExpenses
Charged(Credited)to OtherAccounts Deductions
Balance atEnd of Period
(Dollars in millions)
Year ended December 31, 2010
Allowance for doubtful accounts . . . . . . . . . . . . $ 40 $ 2 $ — $(13)(a) $ 29
Deferred tax asset valuation allowance . . . . . . . . 1,011 (144) (92) — 775
Year ended December 31, 2009
Allowance for doubtful accounts . . . . . . . . . . . . $ 37 $ 11 $ — $ (8)(a) $ 40
Deferred tax asset valuation allowance . . . . . . . . 878 44 89 — 1,011
Year ended December 31, 2008Allowance for doubtful accounts . . . . . . . . . . . . $ 43 $ 8 $ — $(14)(a) $ 37
Deferred tax asset valuation allowance . . . . . . . . 441 350 87 — 878
(a) Uncollectible accounts written off, net of recoveries.
The other schedules have been omitted because they are not applicable or are not required or the information to
be set forth therein is included in the Consolidated Financial Statements or notes thereto.
93

8/3/2019 TRW 2010 Annual Report
http://slidepdf.com/reader/full/trw-2010-annual-report 100/116
(3) Exhibits (including those incorporated by reference). All references to “Registrant” below pertain to TRW
Automotive Holdings Corp. and all references to TAI pertain to TRW Automotive Inc. (f/k/a TRW Automotive
Acquisition Corp. and Roadster Acquisition Corp.)
ExhibitNumber Exhibit Description Form Exhibit
FilingDate
FiledHerewith
Incorporated By Reference
2.1 (a) The Master Purchase Agreement, dated as of
November 18, 2002 between BCP AcquisitionCompany L.L.C. (“BCP”) and NorthropGrumman Corporation (“Northrop”).
TAI S-4 2.1 07/01/2003
(b) Amendment No. 1, dated December 20, 2002,to the Master Purchase Agreement, dated as of November 18, 2002, among BCP, Northrop,TRW Inc. and TAI.
TAI S-4 2.2 07/01/2003
(c) Amendment No. 2, dated February 28, 2003, tothe Master Purchase Agreement, dated as of November 18, 2002, among BCP, Northrop,Northrop Grumman Space & Mission SystemsCorp. and TAI.
TAI S-4 2.3 07/01/2003
3.1 Second Amended and Restated Certificate of
Incorporation of Registrant.
10-K 3.1 03/29/2004
3.2 Third Amended and Restated By-Laws of Registrant.
8-K 3.2 11/17/2004
4.1 Form of Certificate of Common Stock of Registrant, as approved February 2010.
10-K 4.1 02/25/2010
4.2 (a) Form of Rights Agreement dated January 23,2004 between Registrant and National CityBank as Rights Agent.
S-1A 4.21 01/26/2004
(b) Letter Agreement, dated September 11, 2009,between Computershare Trust Company, N.A.and Registrant establishing Computershare asthe successor Rights Agent under theRegistrant’s Rights Agreement dated
January 23, 2004.
10-Q 4.1 11/4/2009
Registrant, in accordance with Item 601(b)(4)(iii)(A) of Regulation S-K has omitted filing instruments definingthe rights of holders of long-term debt of Registrant or any of its subsidiaries, which debt does not exceed 10% of the total assets of Registrant and its subsidiaries on a consolidated basis, and agrees to furnish to theSEC copies of such instruments upon request.
10.1 (a) Sixth Amended and Restated CreditAgreement, dated as of June 24, 2009,among the Registrant, TAI, TRW AutomotiveIntermediate Holdings Corp. (“Intermediate”),certain of TAI’s foreign subsidiaries, thelenders party thereto, JPMorgan Chase Bank,N.A., as administrative agent, Bank of America, N.A., as syndication agent, and
J.P. Morgan Securities Inc. and Banc of America Securities LLC, as lead arrangers.
8-K 10.1 06/26/2009
94

8/3/2019 TRW 2010 Annual Report
http://slidepdf.com/reader/full/trw-2010-annual-report 101/116
ExhibitNumber Exhibit Description Form Exhibit
FilingDate
FiledHerewith
Incorporated By Reference
(b) Seventh Amended and Restated CreditAgreement, dated as of December 21, 2009,among TAI, Registrant, Intermediate, certainof TAI’s foreign subsidiaries, the lenders party
thereto from time to time, JPMorgan ChaseBank, N.A., as administrative agent, Bank of America, N.A., as syndication agent, andJ.P. Morgan Securities Inc. and Banc of America Securities LLC, as lead arrangers.
8-K 10.1 12/22/2009
(c) Amendment, dated as of March 17, 2010, to theSeventh Amended and Restated CreditAgreement dated as of December 21, 2009,among TAI, the Registrant, Intermediate,certain of TAI’s foreign subsidiaries, thelenders party thereto from time to time,JPMorgan Chase Bank, N.A., asadministrative agent and as collateral agentfor the lenders, and Bank of America, N.A.,
as syndication agent.
10-Q 10.4 05/05/2010
10.2 (a) U.S. Guarantee and Collateral Agreement,dated and effective as of February 28, 2003,among Registrant, Intermediate, TAI, eachother subsidiary of Registrant party thereto,TRW Automotive Finance (Luxembourg),S.à.r.l. and JP Morgan Chase Bank, asCollateral Agent.
TAI S-4 10.2 07/01/2003
(b) Amendment, dated as of June 24, 2009, to theU.S. Guarantee and Collateral Agreement,dated as of February 28, 2003
10-Q 10-2 08/04/2009
10.3 Finco Guarantee Agreement, dated as of February 28, 2003, between TRW
Automotive Finance (Luxembourg), S.à.r.l.and JP Morgan Chase Bank, as CollateralAgent.
TAI S-4 10.3 07/01/2003
10.4 First-Tier Subsidiary Pledge Agreement, datedand effective as of February 28, 2003, amongTAI, each subsidiary of TAI party thereto andJP Morgan Chase Bank, as Collateral Agent
TAI S-4 10.4 07/01/2003
10.5 Intellectual Property License Agreement,dated as of February 28, 2003, between TAIand Northrop.
TAI S-4 10.11 07/01/2003
10.6 Intellectual Property License Agreement,dated as of February 28, 2003, betweenNorthrop and TAI.
TAI S-4 10.12 07/01/2003
10.7 Employee Matters Agreement, dated as of February 28, 2003, between TRW Inc. andTAI.
TAI S-4 10.14 07/01/2003
10.8 Insurance Allocation Agreement, dated as of February 28, 2003, between NorthropGrumman Space and Mission Systems Corp.and TAI.
TAI S-4 10.15 07/01/2003
95
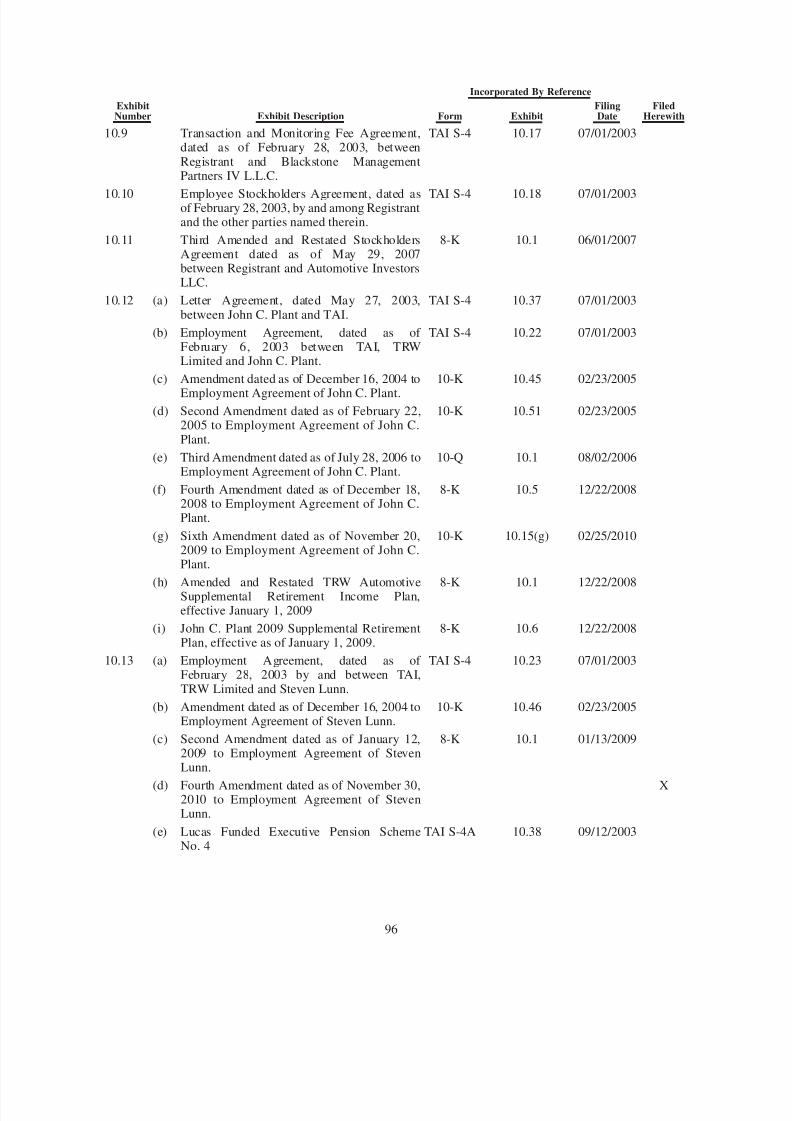
8/3/2019 TRW 2010 Annual Report
http://slidepdf.com/reader/full/trw-2010-annual-report 102/116
ExhibitNumber Exhibit Description Form Exhibit
FilingDate
FiledHerewith
Incorporated By Reference
10.9 Transaction and Monitoring Fee Agreement,dated as of February 28, 2003, betweenRegistrant and Blackstone ManagementPartners IV L.L.C.
TAI S-4 10.17 07/01/2003
10.10 Employee Stockholders Agreement, dated asof February 28, 2003, by and among Registrantand the other parties named therein.
TAI S-4 10.18 07/01/2003
10.11 Third Amended and Restated StockholdersAgreement dated as of May 29, 2007between Registrant and Automotive InvestorsLLC.
8-K 10.1 06/01/2007
10.12 (a) Letter Agreement, dated May 27, 2003,between John C. Plant and TAI.
TAI S-4 10.37 07/01/2003
(b) Employment Agreement, dated as of February 6, 2003 between TAI, TRWLimited and John C. Plant.
TAI S-4 10.22 07/01/2003
(c) Amendment dated as of December 16, 2004 to
Employment Agreement of John C. Plant.
10-K 10.45 02/23/2005
(d) Second Amendment dated as of February 22,2005 to Employment Agreement of John C.Plant.
10-K 10.51 02/23/2005
(e) Third Amendment dated as of July 28, 2006 toEmployment Agreement of John C. Plant.
10-Q 10.1 08/02/2006
(f) Fourth Amendment dated as of December 18,2008 to Employment Agreement of John C.Plant.
8-K 10.5 12/22/2008
(g) Sixth Amendment dated as of November 20,2009 to Employment Agreement of John C.Plant.
10-K 10.15(g) 02/25/2010
(h) Amended and Restated TRW AutomotiveSupplemental Retirement Income Plan,effective January 1, 2009
8-K 10.1 12/22/2008
(i) John C. Plant 2009 Supplemental RetirementPlan, effective as of January 1, 2009.
8-K 10.6 12/22/2008
10.13 (a) Employment Agreement, dated as of February 28, 2003 by and between TAI,TRW Limited and Steven Lunn.
TAI S-4 10.23 07/01/2003
(b) Amendment dated as of December 16, 2004 toEmployment Agreement of Steven Lunn.
10-K 10.46 02/23/2005
(c) Second Amendment dated as of January 12,2009 to Employment Agreement of StevenLunn.
8-K 10.1 01/13/2009
(d) Fourth Amendment dated as of November 30,2010 to Employment Agreement of StevenLunn.
X
(e) Lucas Funded Executive Pension SchemeNo. 4
TAI S-4A 10.38 09/12/2003
96

8/3/2019 TRW 2010 Annual Report
http://slidepdf.com/reader/full/trw-2010-annual-report 103/116
ExhibitNumber Exhibit Description Form Exhibit
FilingDate
FiledHerewith
Incorporated By Reference
(f) Lucas Group Funded Executive PensionScheme No. 4 Statement of Benefits forMr. S. Lunn — Plan document relating topreviously filed Trust Agreement.
10-Q 10.5 11/04/2004
(g) Declaration of Trust, the TRW RetirementBenefit Plan, dated November 1, 2010between TAI and Barclays Wealth Trustees(Guernsey) Limited.
X
10.14 (a) Employment Agreement, dated as of February 27, 2003 by and between TRWLimited and Peter J. Lake.
TAI S-4 10.24 07/01/2003
(b) Amendment dated as of April 30, 2004 toEmployment Agreement of Peter J. Lake.
10-Q 10.5 05/07/2004
(c) Second Amendment dated as of December 16,2004 to Employment Agreement of Peter J.Lake.
10-K 10.47 02/23/2005
(d) Third Amendment dated as of July 29, 2005 to
Employment Agreement of Peter J. Lake.
10-Q 10.1 08/02/2005
(e) Fourth Amendment dated as of November 12,2008 to Employment Agreement of Peter J.Lake.
8-K 10.4 11/13/2008
(f) Fifth Amendment dated as of December 18,2008 to Employment Agreement of Peter J.Lake.
8-K 10.4 12/22/2008
(g) Seventh Amendment to EmploymentAgreement, dated as of October 1, 2009,among TAI, TRW Limited and Peter J. Lake.
8-K 10.1 09/30/2009
10.15 (a) Employment Agreement, dated as of February 13, 2003 by and between TAI andJoseph S. Cantie.
TAI S-4 10.25 07/01/2003
(b) Amendment dated as of April 30, 2004 toEmployment Agreement of Joseph S. Cantie.
10-Q 10.4 05/07/2004
(c) Second Amendment dated as of December 16,2004 to Employment Agreement of Joseph S.Cantie.
10-K 10.49 02/23/2005
(d) Third Amendment dated as of July 29, 2005 toEmployment Agreement of Joseph S. Cantie.
10-Q 10.3 08/02/2005
10.16 (a) Employment Agreement dated as of August 16, 2004 by and between TAI andNeil E. Marchuk.
10-Q 10.1 11/04/2004
(b) Amendment dated as of December 16, 2004 toEmployment Agreement of Neil E. Marchuk.
10-K 10.50 02/23/2005
(c) Second Amendment dated as of July 29, 2005to Employment Agreement of Neil E.Marchuk.
10-Q 10.4 08/02/2005
(d) Sixth Amendment dated as of February 18,2009 to Employment Agreement of Neil E.Marchuk.
10-Q 10.1 05/06/2009
97

8/3/2019 TRW 2010 Annual Report
http://slidepdf.com/reader/full/trw-2010-annual-report 104/116
ExhibitNumber Exhibit Description Form Exhibit
FilingDate
FiledHerewith
Incorporated By Reference
10.17 Employment Agreement, dated as of February 1, 2010 by and between TAI andRobin A. Walker-Lee.
X
10.18 (a) Form of Fourth Amendment to Employment
Agreement, dated as of November 12, 2008,between TAI and each of Joseph S. Cantie andNeil E. Marchuk.
8-K 10.3 11/13/2008
(b) Form of Fifth Amendment to EmploymentAgreement, dated as of December 18, 2008,between TAI and each of Joseph S. Cantie andNeil E. Marchuk.
8-K 10.3 12/22/2008
(c) Form of Amendment to EmploymentAgreement, dated as of February 26, 2009,between TAI and/or TRW Limited, asapplicable, and each of the named executiveofficers.
8-K 10.1 02/24/2009
10.19 TRW Automotive Benefits Equalization Plan
effective January 1, 2009
X
10.20 (a) Form of TAI Executive Officer Cash IncentiveAward Agreement, dated as of February 26,2009 between TAI and each of the Registrant’sexecutive officers
8-K 10.2 02/24/2009
(b) Form of TAI Executive Officer Cash IncentiveAward Agreement between TAI and each of theRegistrant’s executive officers.
8-K 10.1 02/26/2010
10.21 Form of TAI Executive Officer RetentionAward Agreement, dated as of February 26,2009 between TAI and each of the Registrant’sexecutive officers.
8-K 10.3 02/24/2009
10.22 Form of Indemnification Agreement between
the Registrant and each of its directors andnamed executive officers.
8-K 10.5 11/13/2008
10.23 (a) Director Offer Letter to J. Michael Losh, datedNovember 7, 2003.
10-K 10.56 02/23/2005
(b) Director Offer Letter to Francois J. Castaing,dated March 31, 2004.
10-K 10.57 02/23/2005
(c) Director Offer Letter to Jody Miller, datedJanuary 7, 2005.
8-K 10.1 02/01/2005
(d) Director Offer Letter to James F. Albaugh,dated August 4, 2006.
8-K 10.1 09/18/2006
(e) Director Offer Letter to Michael R. Gambrelldated September 18, 2008.
8-K 10.2 11/13/2008
(f) Director Offer Letter to David S. Taylor datedAugust 25, 2010. 8-K 10.2 11/17/2010
(g) Form of TAI Director Cash Incentive AwardAgreement, dated as of February 26, 2009between TAI and each of the Registrant’sindependent directors.
8-K 10.4 02/24/2009
98

8/3/2019 TRW 2010 Annual Report
http://slidepdf.com/reader/full/trw-2010-annual-report 105/116
ExhibitNumber Exhibit Description Form Exhibit
FilingDate
FiledHerewith
Incorporated By Reference
10.24 (a) Amended and Restated TRW AutomotiveHoldings Corp. 2003 Stock Incentive Plan.
DEF 14A APPENDIX A 04/03/2009
(b) First Amendment to Amended & RestatedTRW Automotive Holdings Corp. 2003 Stock
Incentive Plan, dated as of February 18, 2009.
10-Q 10.2 05/06/2009
(c) Form of General Non-Qualified Stock OptionAgreement.
TAI S-4 10.21 07/01/2003
(d) Form of Chief Executive Officer Non-Qualified Stock Option Agreement.
8-K 10.1 02/25/2005
(e) Form of Executive Officer Non-QualifiedStock Option Agreement.
8-K 10.2 02/25/2005
(f) Form of General Restricted Stock UnitAgreement
X
(g) Form of Chief Executive Officer RestrictedStock Unit Agreement.
8-K 10.3 02/25/2005
(h) Form of Executive Officer Restricted Stock
Unit Agreement.
8-K 10.4 02/25/2005
(i) Form of Director Restricted Stock UnitAgreement.
8-K 10.5 02/25/2005
(j) Form of Chief Executive Officer Stock-SettledStock Appreciation Rights Agreement
8-K 10.3 02/26/2010
(k) Form of Executive Officer Stock-Settled Stock Appreciation Rights Agreement
8-K 10.2 02/26/2010
(l) Form of General Stock-Settled Stock Appreciation Rights Agreement
X
14.1 TRW Standards of Conduct 8-K 14.1 08/13/2010
21.1 List of Subsidiaries X
23.1 Consent of Ernst & Young LLP X
31 (a) Certification Pursuant to Rule 13a-14(a) underthe Securities Exchange Act of 1934, asadopted pursuant to §302 of the Sarbanes-Oxley Act of 2002.
X
(b) Certification Pursuant to Rule 13a-14(a) underthe Securities Exchange Act of 1934, asadopted pursuant to §302 of the Sarbanes-Oxley Act of 2002.
X
32 Certification Pursuant to 18 U.S.C. §1350, AsAdopted Pursuant to §906 of the Sarbanes-Oxley Act of 2002
X
101.INS* XBRL Instance Document
101.SCH* XBRL Taxonomy Extension Schema
Document101.CAL* XBRL Taxonomy Extension Calculation
Linkbase Document
101.LAB* XBRL Taxonomy Extension Label LinkbaseDocument
99

8/3/2019 TRW 2010 Annual Report
http://slidepdf.com/reader/full/trw-2010-annual-report 106/116
ExhibitNumber Exhibit Description Form Exhibit
FilingDate
FiledHerewith
Incorporated By Reference
101.PRE* XBRL Taxonomy Extension PresentationLinkbase Document
101.DEF* XBRL Taxonomy Extension DefinitionLinkbase Document
* Submitted electronically with this Report. Pursuant to Rule 406T of Regulation S-T, the Interactive Data Files
included as Exhibits 101 hereto (i) shall not be deemed “filed” or part of a registration statement or prospectus for
purposes of Section 11 or 12 of the Securities Act of 1933, as amended, (ii) shall not be deemed “filed” for
purposes of Section 18 of the Securities Exchange Act of 1934, as amended, and (iii) otherwise are not subject to
liability under those sections.
100

8/3/2019 TRW 2010 Annual Report
http://slidepdf.com/reader/full/trw-2010-annual-report 107/116
Signatures
Pursuant to the requirements of Section 13 or 15(d) of the Securities Exchange Act of 1934, the registrant has
duly caused this report to be signed on its behalf by the undersigned, thereunto duly authorized.
TRW Automotive Holdings Corp.
(Registrant)
By: /s/ Joseph S. Cantie
Joseph S. Cantie
Executive Vice President and Chief Financial Officer
(On behalf of the Registrant and as Principal
Financial Officer)
Date: February 17, 2011
Pursuant to the requirements of the Securities Exchange Act of 1934, this report has been signed below as of
February 17, 2011 by the following persons on behalf of the registrant and in the capacities indicated.Signature Title
/s/ JOHN C. PLANT
John C. Plant
Chairman of the Board,President and Chief Executive Officer
(Principal Executive Officer)
/s/ JOSEPH S. CANTIE
Joseph S. Cantie
Executive Vice President and Chief Financial Officer(Principal Financial Officer)
/s/ TAMMY S. MITCHELL
Tammy S. Mitchell
Controller(Principal Accounting Officer)
/s/ NEIL P. SIMPKINS
Neil P. Simpkins
Lead Director
/s/ JAMES F. ALBAUGH
James F. Albaugh
Director
/s/ FRANCOIS J. CASTAING
Francois J. Castaing
Director
/s/ ROBERT L. FRIEDMAN
Robert L. Friedman
Director
/s/ MICHAEL R. GAMBRELL
Michael R. Gambrell
Director
/s/ J. MICHAEL LOSH
J. Michael Losh
Director
/s/ JODY G. MILLER
Jody G. Miller
Director
/s/ PAUL H. O’NEILL
Paul H. O’Neill
Director
/s/ DAVID S. TAYLOR
David S. Taylor
Director
101
8/3/2019 TRW 2010 Annual Report
http://slidepdf.com/reader/full/trw-2010-annual-report 108/116
Exhibit 31(a)
CERTIFICATIONS
I, John C. Plant, certify that:
1. I have reviewed this annual report on Form 10-K (this “Report”) of TRW Automotive Holdings Corp. (the“Registrant”);
2. Based on my knowledge, this Report does not contain any untrue statement of a material fact or omit to state
a material fact necessary to make the statements made, in light of the circumstances under which such statements
were made, not misleading with respect to the period covered by this Report;
3. Based on my knowledge, the financial statements, and other financial information included in this Report,
fairly present in all material respects the financial condition, results of operations and cash flows of the Registrant as
of, and for, the periods presented in this Report;
4. The Registrant’s other certifying officer and I are responsible for establishing and maintaining disclosure
controls and procedures (as defined in Exchange Act Rules 13a-15(e) and 15d-15(e)) and internal control over
financial reporting (as defined in Exchange Act Rules 13a-15(f) and 15d-15(f)) for the Registrant and have:
a. Designed such disclosure controls and procedures, or caused such disclosure controls and procedures
to be designed under our supervision, to ensure that material information relating to the Registrant, including
its consolidated subsidiaries, is made known to us by others within those entities, particularly during the period
in which this Report is being prepared;
b. Designed such internal control over financial reporting, or caused such internal control over financial
reporting to be designed under our supervision, to provide reasonable assurance regarding the reliability of
financial reporting and the preparation of financial statements for external purposes in accordance with
generally accepted accounting principles;
c. Evaluated the effectiveness of the Registrant’s disclosure controls and procedures and presented in this
Report our conclusions about the effectiveness of the disclosure controls and procedures, as of the end of the
period covered by this Report based on such evaluation; and
d. Disclosed in this Report any change in the Registrant’s internal control over financial reporting that
occurred during the Registrant’s most recent fiscal quarter (the Registrant’s fourth fiscal quarter in the case of
an annual report) that has materially affected, or is reasonably likely to materially affect, the Registrant’s
internal control over financial reporting; and
5. The Registrant’s other certifying officer and I have disclosed, based on our most recent evaluation of
internal control over financial reporting, to the Registrant’s auditors and the audit committee of the Registrant’s
board of directors (or persons performing the equivalent functions):
a. All significant deficiencies and material weaknesses in the design or operation of internal control over
financial reporting which are reasonably likely to adversely affect the Registrant’s ability to record, process,
summarize and report financial information; and
b. Any fraud, whether or not material, that involves management or other employees who have asignificant role in the Registrant’s internal control over financial reporting.
/s/ JOHN C. PLANT
John C. Plant
Chairman of the Board, President and Chief
Executive Officer
(Principal Executive Officer)
Date: February 17, 2011
8/3/2019 TRW 2010 Annual Report
http://slidepdf.com/reader/full/trw-2010-annual-report 109/116
Exhibit 31(b)
CERTIFICATIONS
I, Joseph S. Cantie, certify that:
1. I have reviewed this annual report on Form 10-K (this “Report”) of TRW Automotive Holdings Corp. (the“Registrant”);
2. Based on my knowledge, this Report does not contain any untrue statement of a material fact or omit to state
a material fact necessary to make the statements made, in light of the circumstances under which such statements
were made, not misleading with respect to the period covered by this Report;
3. Based on my knowledge, the financial statements, and other financial information included in this Report,
fairly present in all material respects the financial condition, results of operations and cash flows of the Registrant as
of, and for, the periods presented in this Report;
4. The Registrant’s other certifying officer and I are responsible for establishing and maintaining disclosure
controls and procedures (as defined in Exchange Act Rules 13a-15(e) and 15d-15(e)) and internal control over
financial reporting (as defined in Exchange Act Rules 13a-15(f) and 15d-15(f)) for the Registrant and have:
a. Designed such disclosure controls and procedures, or caused such disclosure controls and procedures
to be designed under our supervision, to ensure that material information relating to the Registrant, including
its consolidated subsidiaries, is made known to us by others within those entities, particularly during the period
in which this Report is being prepared;
b. Designed such internal control over financial reporting, or caused such internal control over financial
reporting to be designed under our supervision, to provide reasonable assurance regarding the reliability of
financial reporting and the preparation of financial statements for external purposes in accordance with
generally accepted accounting principles;
c. Evaluated the effectiveness of the Registrant’s disclosure controls and procedures and presented in this
Report our conclusions about the effectiveness of the disclosure controls and procedures, as of the end of the
period covered by this Report based on such evaluation; and
d. Disclosed in this Report any change in the Registrant’s internal control over financial reporting that
occurred during the Registrant’s most recent fiscal quarter (the Registrant’s fourth fiscal quarter in the case of
an annual report) that has materially affected, or is reasonably likely to materially affect, the Registrant’s
internal control over financial reporting; and
5. The Registrant’s other certifying officer and I have disclosed, based on our most recent evaluation of
internal control over financial reporting, to the Registrant’s auditors and the audit committee of the Registrant’s
board of directors (or persons performing the equivalent functions):
a. All significant deficiencies and material weaknesses in the design or operation of internal control over
financial reporting which are reasonably likely to adversely affect the Registrant’s ability to record, process,
summarize and report financial information; and
b. Any fraud, whether or not material, that involves management or other employees who have asignificant role in the Registrant’s internal control over financial reporting.
/s/ JOSEPH S. CANTIE
Joseph S. Cantie
Executive Vice President and Chief Financial Officer
(Principal Financial Officer)
Date: February 17, 2011
8/3/2019 TRW 2010 Annual Report
http://slidepdf.com/reader/full/trw-2010-annual-report 110/116
Exhibit 32
CERTIFICATION PURSUANT TO 18 U.S.C. SECTION 1350, AS ADOPTED PURSUANT TO
SECTION 906 OF THE SARBANES-OXLEY ACT OF 2002
In connection with the filing of this annual report on Form 10-K of TRW Automotive Holdings Corp. (the
“Company”) for the period ended December 31, 2010, with the Securities and Exchange Commission on the date
hereof (the “Report”), each of the undersigned officers certifies, pursuant to 18 U.S.C. Section 1350, as adopted
pursuant to Section 906 of the Sarbanes-Oxley Act of 2002, that, to such officer’s knowledge:
1) The Report fully complies with the requirements of section 13(a) or 15(d) of the Securities Exchange
Act of 1934; and
2) The information contained in the Report fairly presents, in all material respects, the financial
condition and results of operations of the Company.
/s/ JOHN C. PLANT
John C. Plant
Chairman of the Board, President and Chief
Executive Officer
(Principal Executive Officer)
Date: February 17, 2011
/s/ JOSEPH S. CANTIE
Joseph S. Cantie
Executive Vice President and Chief Financial Officer
(Principal Financial Officer)

8/3/2019 TRW 2010 Annual Report
http://slidepdf.com/reader/full/trw-2010-annual-report 111/116
- End of Annual Report on Form 10-K -

8/3/2019 TRW 2010 Annual Report
http://slidepdf.com/reader/full/trw-2010-annual-report 112/116

8/3/2019 TRW 2010 Annual Report
http://slidepdf.com/reader/full/trw-2010-annual-report 113/116

8/3/2019 TRW 2010 Annual Report
http://slidepdf.com/reader/full/trw-2010-annual-report 114/116
This page intentionally left blank.
8/3/2019 TRW 2010 Annual Report
http://slidepdf.com/reader/full/trw-2010-annual-report 115/116
Board of Directors (as of March 21, 2011)
John C. PlantChairman of the Board;
President and Chief Executive Officer,
TRW Automotive Holdings Corp.
Neil P. SimpkinsLead Director; Senior Managing Director,
The Blackstone Group L.P.
James F. Albaugh 1
President and Chief Executive Officer,Boeing Commercial Airplanes business unit
Francois J. Castaing 1, 2
Consultant for Castaing & Associates;
former Technical Advisor to the Chairman,DaimlerChrysler Corporation; former
Executive Vice President, VehicleEngineering, Chrysler Corporation
Robert L. FriedmanSenior Managing Director
The Blackstone Group L.P.
Michael R. GambrellExecutive Vice President,Manufacturing and Engineering Operations,
The Dow Chemical Company
J. Michael Losh 1, 2
Former Interim Chief Financial Officer,Cardinal Health; former Executive Vice
President and Chief Financial Officer,General Motors Corporation
Jody G. Miller 3
CEO, The Business Talent Group LLC;
former Venture Partner with Maveron, LLC;
former Executive Vice Presidentand acting President and Chief Operating
Officer, Americast
Paul H. O’Neill 3
Special Advisor, The Blackstone Group L.P.;
former U.S. Secretary of the Treasury andformer Chairman and Chief ExecutiveOfficer, Alcoa
David S. TaylorGroup President, Global Home Care,The Procter & Gamble Company
Executive Officers
John C. PlantChairman of the Board,
President and Chief Executive Officer
Steven LunnExecutive Vice President andChief Operating Officer
Joseph S. CantieExecutive Vice President andChief Financial Officer
Peter J. LakeExecutive Vice President,
Sales and Business Development
Neil E. MarchukExecutive Vice President,
Human Resources
Robin A. Walker-LeeExecutive Vice President,
General Counsel and Secretary
Stockholder Information
Annual MeetingThe annual meeting of TRW Automotive
Holdings Corp. stockholders will be held at10:00 am (local time), Wednesday, May 18,
2011, at the TRW Vehicle Safety Systems Inc.facility located at 11202 East Germann Road,
Mesa, Arizona 85212. A formal notice of the
meeting will be sent and access to proxymaterials will be provided to stockholders
beforehand.
Investor InformationStockholders, security analysts andinvestors can access Company news and
events, periodic reports filed with theSecurities and Exchange Commission (“SEC”)
and other related Company information byvisiting our web site at www.trw.com.
For a printed copy of this annual reportor for current SEC filings such as the
Form 10-K, please send a writtenrequest to:
Investor Relations12001 Tech Center Drive
Livonia, Michigan 48150
Additionally, you can call (800) 219-7411
or send an e-mail to [email protected]
to request this information.
Stockholders Account ServicesStockholders who own TRW Automotive stock
through a brokerage firm should contact theirbroker for account-related requests.
Computershare Trust Company, N.A. actsas transfer agent and registrar for TRW
Automotive and can assist registeredstockholders with a variety of stockholder-
related services, including change ofaddress, lost stock certificates, transfer of
stock to another person and other related
administrative services. Please contactComputershare by writing or calling:
Computershare Investor ServicesPost Office Box 43078Providence, RI 02940-3078
www.computershare.com/investor
Telephone: (800) 622-6757
Stock ExchangeTRW Automotive Holdings Corp. common
stock is listed on the New York StockExchange under the symbol TRW.
AuditorsErnst & Young LLP
Detroit, Michigan
Committee Memberships1 Audit Committee2 Compensation Committee3 Corporate Governance and Nominating Committee

8/3/2019 TRW 2010 Annual Report
http://slidepdf.com/reader/full/trw-2010-annual-report 116/116