truck parking study - appendices - washington state … · · 2018-05-20thanh nguyen, wsdot june...
TRANSCRIPT

APPENDIX A
Data Collection Efforts Technical Memorandum

(Rev. 06/04)
M E M O R A N D U M Date: June 3, 2005
To: Thanh Nguyen, WSDOT
From: Shannon Patterson, Parametrix
Subject: Truck Parking Study – Data Collection Efforts
cc: John Perlic, Parametrix Carter Danne, Parametrix
Project Number: 214-1631-048 (02/102)
Project Name: WSDOT Truck Parking Study This memorandum summarizes the Parametrix data collection efforts for the Truck Parking Study. This discussion has been written in a question-and-answer format to be consistent with the reader-friendly format of the final report.
What activities were included in the data collection effort? The following activities identified in the project scope were included in the data collection effort:
• A literature review of relevant documents was conducted, including the Federal Highway Administration’s (FHWA) publication “A Study of Adequacy of Parking Facilities” (June 2002) and reports obtained from other states.
• Available truck traffic information from the Port of Seattle was collected and reviewed, including hours of operation, on-site truck parking facilities, truck parking issues, and truck volumes (arrival times, time on-site, departure times).
• Informational telephone interviews with Department of Transportation staff from other states were conducted, with a focus on California and Massachusetts, the two states identified as having the largest truck parking problem by FHWA. Interviews included collecting data on truck parking strategies and adopted policies.
• Telephone interviews with private truck stop owners and organizations were conducted to determine: utilization, available amenities (electrification, food, gas, showers, etc.), length and time of stay, and type of delivery (short versus long haul).
• Relevant trucking industry regulations were researched and summarized. This data has been collected and is summarized below.
What literature was reviewed? The following documents were obtained from the Washington State Department of Transportation (WSDOT), internet searches and other state transportation departments:
• Commercial Vehicle Parking (December 1999), Iowa Department of Transportation • Commercial Vehicle Service Plan: Final Report (June 2003), Office of Freight Transportation,
Maine Department of Transportation • Highway Special Investigation Report: Truck Parking Areas (May 2000), National Transportation
Safety Board

Thanh Nguyen, WSDOT June 3, 2005 Page 2 of 13
• Intelligent Transportation Systems and Truck Parking (February 2005), US Department of Transportation, Federal Motor Carrier Safety Administration
• NCHRP Synthesis 317, Dealing with Truck Parking Demands: A Synthesis of Highway Practice (2003), Transportation Research Board
• A Study of Adequacy of Parking Facilities (June 2002), FHWA • Washington: 2002, Vehicle Inventory and Use Survey, 2002 Economic Census, US Census
Bureau • Washington Transportation Plan Update: Freight Movement (Draft February 8, 2005),
Washington State Department of Transportation While all of these reports contained useful information for understanding the bigger picture of freight movement and the related issue of truck parking, there were a few documents that contained information that was especially relevant to the WSDOT Truck Parking Study. This information is summarized by document below. Additionally, other relevant information that was found through internet searches is also summarized below. A Study of Adequacy of Parking Facilities (June 2002), FHWA Upon review of this document, the following points summarize the information most relevant to the WSDOT Truck Parking Study efforts:
• The FHWA study provided truck parking demand forecasting information, which can be used as a reference point for determining a reasonable truck parking demand growth rate for the WSDOT Truck Parking study. According to the FHWA study, Washington’s 20-year forecasted annual increase in parking demand is 2.1 percent, while the national 20-year forecasted annual increase in parking demand is estimated to be 2.7 percent. The national estimated growth rate of truck parking spaces at public rest areas is estimated to be only 1 percent annually while the national estimated growth rate of truck parking spaces at private truck stops and travel plazas is expected to be 6.5 percent annually.
• Information from driver surveys indicates that truck parking at public rest areas and private truck stops are not interchangeable. Drivers indicated that they preferred public rest areas for short-term rests (less than 2 hours) because they are convenient and private truck stops for long-term rests (more than 2 hours) because of their amenities.
• Based on a driver survey, approximately 35 percent of truck parking for sleep purposes occurs at locations other than public rest areas and private truck stops, such as ramps, loading docks, home and “other”.
• The FHWA study recommendations should be considered when developing strategies and recommendations for addressing future truck parking needs in Washington. The study recommendations were:
o Expand or improve public rest areas. o Expand or improve private truck stops. o Investigate public-private partnerships for future truck parking development. o Improve the information and availability of truck parking space information for drivers. o Modify parking time limits and other rules. o These recommendations were generally consistent with the recommendations in the
other documents that were collected and reviewed as a part of this data collection effort. Many of the other studies included the additional recommendation of potentially allowing truck parking at other publicly-owned locations, such as weigh stations, visitor centers, and park-and-rides.
Commercial Vehicle Service Plan Final Report, June 2003, Office of Freight Transportation, Maine Department of Transportation Interestingly, this study did not recommend expanding existing or constructing new public rest areas. Instead, the study recommended that agencies should look to the private sector for meeting existing and future truck parking needs. The study recommended some improvements to a few existing rest areas in

Thanh Nguyen, WSDOT June 3, 2005 Page 3 of 13 order to accommodate additional trucks and suggested that truck parking could potentially be allowed at welcome or visitor information centers being built by the state. As in the other studies, this study included a list of potential factors as to how truck drivers decide when and where to park. This list was primarily included because of the final bullet point, which was unique to this study and highlights the myriad factors affecting truck parking demand along a corridor.
• Inability to find overnight rest areas • Hours of service mandatory rest periods may not coincide with a driver’s need for rest • Shipper and receiver policies that may require drivers to load or unload cargo when they should
be resting • Driver wages that are based upon miles driven rather than hours worked that may encourage
excessive driving hours This study also provided a wealth of information regarding service area planning, construction and operations. Particularly relevant was the presentation of the cost for developing additional parking spaces as presented in the FHWA study Commercial Driver Rest and Parking Requirements: Making Space for Safety Final Report (1996). These costs are shown in Table 1.
Table 1. Cost of Developing Additional Parking Spaces Average cost Per Space
Options Potential for
Additional Spaces Low Estimate High Estimate Truck Pull-Off 0-10 spaces $5,000 $7,000 Minor Renovation 11-35 spaces $10,000 $15,000 Major Renovation 36-50 spaces $20,000 $25,000 New Construction > 50 spaces $30,000 $35,000 Note: Costs include only development of parking spaces and excludes costs of services and facilities and are in 1995 dollars. This study also presented the implementation considerations suggested in the 1996 FHWA study. According to FHWA, implementation is strongly influenced by the following five factors:
• Adequacy: Will the additional truck parking address the truck parking issues in the area? • Ease: Will the administrative, legislative and contractual actions and changes required to
implement the solution be relatively achievable? • Impacts: How will this solution impact other stakeholders? Will the other stakeholders consider
the impacts as favorable or unfavorable? • Support: Given the impacts, what level of support will key stakeholders provide? • Flexibility: Can the solution accommodate project and regional changes?
Some or all of these factors could be considered when developing the evaluation matrix for strategies that are developed in the WSDOT Truck Parking Study. This study also provided a good overview of existing public and private sector practices and policies throughout the nation. Washington: 2002 Vehicle Inventory and Use Survey, 2002 Economic Census, US Census Bureau The Vehicle Inventory and Use Survey (VIUS) provided information on the physical and operational characteristics of the truck industry. The survey is conducted every five years as a part of the economic census. Information is available by state and some interesting data are available in the Comparative Summary for Trucks, Excluding Pickups, Minivans, Other Light Vans, and Sport Utilities: 2002 and 1997 table. Specifically, the range of operation for trucks in Washington State is 50 miles or less for approximately 62 percent of trucks, 51 to 200 miles for approximately 16 percent of trucks, and 201 miles or more for approximately 7 percent of trucks. The range of operation for the remaining 15 percent was categorized as “off-the-road, not reported or not applicable”. For all but the off-the-road category, these

Thanh Nguyen, WSDOT June 3, 2005 Page 4 of 13 percentages have all decreased since 1997. The data for trucks operating 201 miles or more is important when considering the future truck parking demand along Washington’s interstates since it is primarily the long-haul truckers that need truck parking. According to the VIUS data, not only is the percent of long-haul trucks relatively small when compared with other truck trip distances but it has also decreased over a five-year period (1997 to 2002). National Association of Truck Stop Operators (NATSO) website, www.travelplaza.org Headquartered just outside Washington, D.C., NATSO is a national trade association representing travel plaza and truck stop owners and operators. NATSO represents over 900 travel plazas and truck stops nationwide, owned by more than 330 corporate entities. NATSO sponsors and lobbies for legislation related to the trucking industry as it relates to their investments in truck stops and travel plazas around the country. Interstate Oasis Program Issue Brief This NATSO Issue Brief is included because of its implications for implementing public-private partnerships as a way to meet truck parking demand. As stated in the NATSO brief, Vermont and Utah have turned to private businesses to help meet the needs of highway users. NATSO refers to these businesses as “Interstate Oasis” facilities. When Vermont and Utah needed to close a rest area, they turned to nearby interchange businesses to see if any would be willing to allow non-customers equal access to their business in return for state-provided directional signs to their business along the highway. Conversations with Vermont staff revealed that this kind of partnership was established and has been very successful. NATSO supports this type of public-private partnership and wants to see the Federal Highway Administration play an active role in establishing “Interstate Oasis” facility guidelines, including the development of criteria that businesses must meet to become an oasis. NATSO believes that the criteria are especially important for ensuring that all businesses have an equal opportunity to be designated an “Interstate Oasis”. NATSO recommends that “Interstate Oasis” facilities have a similar “look and feel” through the creation of a uniform name and logo so that travelers will be able to recognize these facilities. This program or certain components of it could be useful when creating strategies for meeting truck parking demand as it would be an alternative to pursuing potential legislative changes aimed at allowing private businesses to operate within publicly owned right-of-way. The Interstate Oasis program creates the potential opportunity for public and private entities to work together without giving any business the distinct advantage of operating directly alongside the interstate (versus off an exit). Truck Parking Issue Brief This information from NATSO is included because it presents an opposing view regarding the status of national truck parking. While almost all of the other literature and research indicates some level of truck parking shortage, or at the very least a truck parking distribution problem, NATSO believes that there is no nationwide truck parking shortage. NATSO urges the government to reject legislation that would establish a pilot program to build additional truck parking on the National Highway System. NATSO contends that the federal government should not try to compete with the private truck stop/plaza industry. As stated in the 2002 FHWA Study of Adequacy of Parking Facilities, it is estimated that the private sector provides approximately 90 percent of all truck parking in the country and that the private sector increases the number of truck parking spaces by approximately 6 percent per year (20,000 spaces). The implication is that government programs will not be able to match this rate of development and that rest area development is not where the majority of drivers want to stop. Therefore, NATSO suggests that a better approach to ensuring truck parking supply is for state and local governments to modify their local zoning, environmental and other requirements so that the private sector can more easily and affordably expand their parking facilities. Additionally, NATSO also contends that those truck drivers that park illegally do so because it’s easy and convenient rather than because of a truck parking shortage. NATSO states that the 1996 American

Thanh Nguyen, WSDOT June 3, 2005 Page 5 of 13 Trucking Association (ATA) study and studies performed in Maryland, Iowa and Tennessee confirmed this finding. Therefore, building more truck parking would not solve this problem. Finally, NATSO also contends that it is not the government’s role to provide staging areas for private industry vehicles at their destinations. Instead, staging trucks is a cost of doing business that should be covered by the trucking industry. In June 2004, the ATA, Commercial Vehicle Safety Alliance and Truckload Carriers Association responded to the NATSO Issue Brief with their recommendation to pass the legislation required to establish the pilot project to build additional truck parking on the National Highway System. These organizations believe that this pilot program is critical for highway safety and that, as currently written, it has the flexibility that allows state and local governments, in partnership with the USDOT and private sector, to address each situation with the appropriate solution.
What data was collected from the Ports? Information was collected from both the Port of Seattle and the Port of Tacoma because they are the two largest ports in the area and are both located within close proximity to I-5 and the west end of I-90. Port of Seattle The Port of Seattle (POS) currently moves 2 million TEUs (twenty-foot equivalent units) annually through its terminals. In 2002, the average daily truck volume for the POS was approximately 2,165 truck trips (excluding trips to rail yards and other locations within the Duwamish area and trips along local arterials). Of the 2,165 average daily truck trips, approximately 36 percent (775) traveled to and from I-90, 21 percent (450) traveled to and from I-5 north of I-90, and 43 percent (940) traveled to and from I-5 south of Albro Street. The number of average daily truck trips is expected to increase 36 percent (2,950) when the POS reaches 3 million TEUs within the next decade. When the POS reaches 3 million TEUs, these average daily truck volumes are expected to increase by 30 percent (1,000) traveling to and from I-90, 40 percent (630) to and from I-5 north of I-90, and 40 percent (1,320) traveling to and from I-5 south of Albro Street (Figure 1). Currently, 45 percent of POS trucks are short-haul trips to nearby rail yards, 32 percent are local short-haul trips within 50 miles of the POS and 23 percent are regional trips. The majority of the local truck traffic travels on I-5 to and from distribution centers in the Green River Valley with less truck traffic traveling on I-90. When the POS reaches 3 million TEUs, it is expected that the number of regional truck trips will have decreased because it is anticipated that more and more cargo will be shipped by rail. Trucks currently serve terminals 5, 18, 46, and 115. All of the terminals have truck queuing lanes and a few provide scales; however, these facilities are only available when the terminal gates are open. The terminals generally operate between 7:00 AM and 5:00 PM. Therefore, outside of these times, there are no truck parking facilities or staging areas for trucks arriving at the POS terminals. The POS maintains that POS truck traffic does not affect truck parking demand along Washington interstates because they are short-haul trips that do not need to meet federal hours-of-service regulations. Additionally, according to the POS, both short-haul and long-haul truckers generally coordinate their schedules to arrive during POS business hours.

Thanh Nguyen, WSDOT June 3, 2005 Page 6 of 13
Figure 1. Average Daily Truck Traffic Distribution to and from the Port of Seattle
Source: Port of Seattle Note: Distribution percentages represent an average of import and export freight traffic.
Port of Tacoma The Port of Tacoma (POT) expects 2.26 TEUs to pass through its facility in the year 2005. This amount of freight would result in approximately 700,000 annual truck trips and nearly 2,700 daily truck trips in 2005. Table 2 shows future forecasts for annual and daily truck trips and TEU’s through 2020.
Table 2. Average Annual and Daily Truck Trips and Annual TEUs between 2005 and 2020 Year Annual Truck Trips Daily Truck Tripsa TEUs (in millions) 2005 700,000 2,695 2.26 2010 915,000 3,520 3.4 2015 1 million 3,850 4.2 2020 1.2 million 4,615 5.7
Source: Port of Tacoma
a Daily truck trips were derived using a 52-week year and 5-days of operation per week to account for the light weekend truck traffic and occasions when the truck gates are open at night or for extended hours (as directed by the Port of Tacoma).
Historically, approximately 70 percent of truck traffic traveled to and from the north and 30 percent to and from the south. This distribution pattern has changed recently because of freight distribution centers that have opened in Pierce County. In 2005, approximately 50 percent (1,348) of the truck trips are expected to travel to and from the north, 40 percent (1,078) to and from the south, and 10 percent (270) to and from eastern Washington primarily via I-90. Assuming the affects of the additional freight distribution centers in Pierce County are fully captured in 2005 estimates and distribution patterns remain similar through 2020, average daily truck trips are anticipated to increase to 2,307 truck trips to the north, 1,846 to the south, and 462 to and from I-90 (Figure 2).

Thanh Nguyen, WSDOT June 3, 2005 Page 7 of 13
Figure 2. Average Daily Truck Traffic Distribution to and from the Port of Tacoma
Source: Port of Tacoma Note: Distribution percentages represent an average of import and export freight traffic.
TEU growth has exceeded previous forecasts and if it continues to grow at the same rate, the POT could reach 6 million TEUs by the year 2012 instead of by the forecasted year 2020. Truck volumes and distribution patterns of both the POS and the POT are difficult to estimate since many unexpected factors have the potential to substantially affect operations, such as September 11th (2001), the SARS (2002) outbreak, and the Port of Los Angeles nearing capacity (7.4 million TEUs in 2004). Although the POT could reach 6 million TEUs before 2020, most of the growth is expected to occur in rail traffic, which accounts for 70 percent of the POT cargo and is intermodal (transported from ship directly to rail). Of the 30 percent of cargo transported by truck, 95 percent of the truck volumes come from within the Pacific Northwest (Washington, Oregon, Idaho). Truck traffic typically does not travel farther east than Montana due to the long-haul cost effectiveness of rail freight transport. Truck volumes are generally evenly distributed across the week with lower volumes typically occurring on Wednesdays. Incoming cargo generally arrives on Thursdays, Fridays and Saturdays and outgoing cargo generally departs on Mondays and Tuesdays. Similar to the POS, the POT terminals have truck queuing lanes and a few provide scales; however, these facilities are only available when the terminal gates are open. The terminals generally operate between 7:00 AM and 5:00 PM, however the POT terminals will occasionally operate after-hours or on Saturdays and Sundays. Outside of these POT operation hours, there are no truck parking facilities or staging areas for trucks arriving at the POT terminals.
What data was collected from other state Departments of Transportation? As identified in the project scope of work, both the California and Massachusetts Departments of Transportation were contacted. The California Department of Transportation (Caltrans) provided a copy of

Thanh Nguyen, WSDOT June 3, 2005 Page 8 of 13 their Partners for Adequate Parking Facilities Initiative: Final Status Report (January 2001). This report is California’s response to the Partners for Adequate Parking Facilities Initiative started in November 1999 as result of the FHWA Rest Area Forum in June 1999. This final report summarizes California’s effort to quantify truck parking at state-owned rest areas and private truck stops. Initially, Caltrans tried to develop growth rates by highway segment. Segments between 60 and 200 miles in length that consistently experience annual average daily traffic (AADT) over 1,000 for trucks with five or more axles were selected for study. However, upon comparing truck AADT’s for 1992 and 1998, the percent change varied so widely that this approach was abandoned. Instead, Caltrans used information from the “California Motor Vehicle Stock, Travel and Fuel Forecast”. These forecasts considered multiple factors, such as population, inflation, personal income, fuel prices, prime lending rates and fuel economy. Using this data, Caltrans determined a 2 percent annual growth rate, which, when compounded yearly for 20 years, resulted in a 48 percent increase in truck traffic over 20 years. Caltrans used the methodology outlined in the FHWA publication “Technical Guidance –TEA-21 Section 4027 Study of Adequacy of Commercial Truck Parking Facilities Serving the National Highway System”. This methodology was ultimately used in the FHWA Study of Adequacy of Parking Facilities in June 2002. The Caltrans data collection efforts also reported 198 locations where trucks were parking in unauthorized areas, such as on shoulders and along interchange ramps. Caltrans acknowledges that while unauthorized parking may occur because of a shortage of truck parking spaces, it has not been proven and other factors could lead drivers to park in these areas. These factors include convenience, maximizing trip distance, maximizing legal driving hours, privacy, and avoiding parking costs. A number of the other documents reported unauthorized truck parking in similar locations and for similar reasons. Another factor that was suggested as contributing to unauthorized parking was driver unfamiliarity with an area and not knowing where legally designated or private truck parking facilities were located. As a result of this study, Caltrans is expanding truck parking at existing rest areas and constructing new rest areas. However, Caltrans acknowledges that this will only accommodate short-term parking needs and is turning to the private sector for innovative ideas to meet long-term (6 hours or more) truck parking needs. Caltrans believes that some solutions can be met within existing program structures, such as signs, public information campaigns and on-line information can help guide truckers to private truck stops. In order to explore the feasibility of public-private partnerships, Caltrans surveyed private truck stop operators to determine what they perceived to be the biggest obstacles in expanding their truck parking facilities. The responses indicated that if the operator had available land, expansion is generally hindered by economic considerations (planning, environmental, financing, and construction costs). Based on survey information, Caltrans is considering public-private partnerships for “auxiliary parking lots”, which are intended to supplement rest area parking lots that are overcrowded with trucks. Caltrans has identified that the auxiliary parking lots should be for truck parking only, be located within five miles or three exits of the “partner” rest area, should not be more than a quarter mile from the freeway, and should include restrooms and lighting. The myriad of other public-private partnership details – leases, construction and maintenance responsibilities, security, enforcement – are still being determined. Repeated attempts to contact staff at the Massachusetts Department of Transportation (DOT) have been unsuccessful to date. According to the Maine DOT Commercial Vehicle Service Plan: Final Report (June 2003), Massachusetts is making a variety of rest area improvements, including increasing the number of visitor centers, adding restrooms, and increasing parking spaces (does not specify if car or truck). Maine DOT is completing these projects with state funds and is turning to area convention and visitor’s bureaus to operate the visitor centers. Consultation with Vermont DOT was conducted because of their involvement with the “Interstate Oasis” program identified in the NATSO Interstate Oasis Program Issue Brief. Staff at Vermont DOT confirmed that they have established one Interstate Oasis partnership with a private truck stop located on I-91 southbound and consider this partnership to be very successful. In exchange for signage on the

Thanh Nguyen, WSDOT June 3, 2005 Page 9 of 13 interstate, the truck stop agrees to provide restrooms to the traveling public, have staff available to answer questions and provide directions, and provide space for Vermont DOT brochures and information. Vermont DOT provides the brochures and brochure holders and DOT staff maintains them on a weekly basis, providing regular contact with the private operator. Vermont DOT staff states that Vermont DOT has strict interstate signing regulations, making interstate signing for a private operator a substantial economic benefit. Due to the success of this program, the Vermont DOT is considering a second Interstate Oasis partnership. Utah DOT is also involved with the “Interstate Oasis” program; however repeated attempts to contact staff at the Utah DOT have been unsuccessful to date.
What data was collected from the private truck stops? Data was collected along the WSDOT truck parking study corridors of I-5, I-90, and I-82 to evaluate the existing supply and demand at private truck parking facilities. Data was collected by telephone survey and the survey locations were determined using a list of locations identified by WSDOT supplemented with internet and telephone book searches. In addition to collecting truck parking space and demand information, facility attributes that could affect the driver’s decision to park overnight at these facilities (services/amenities and fees) were also collected. Truck stops that did not offer overnight truck parking on a regular basis were removed from this data set. A total of 18 truck stops were identified within the study corridors that offered overnight truck parking on a regular basis. A description of the truck stops is provided in Table 3 and their locations are shown on Figure 3 (attached). Washington State Rest Areas are also shown on Figure 3 to show the proximity of rest areas and private truck stops.
Table 3. Private Truck Stops Located Along I-5, I-82, and I-90 City Truck Stop Name Exit Interstate 5 Blaine Yorky's Truck Stop Exit 275 Bellingham Yorky's Exxon Exit 250 Arlington Arlington Fuel Stop Exit 208 Marysville Donna's Truck Stop Exit 202 Seattle Sea-Port Petroleum Truck Stop Exit 162 Tacoma Flying J Travel Plaza #05060 Exit 136 Olympia Restover Truck Stop Exit 99 Toledo Gee Cee's Truck Stop Exit 57 Kalama Rebel Truck Stop Exit 27 Interstate 82 Union Gap Gear Jammers Truck Plaza Exit 36 Prosser Horse Heaven Hills Travel Plaza Exit 80 Interstate 90 North Bend Seattle-East Auto/Truck Plaza Exit 34 Ellensburg Flying J Travel Plaza Exit 109 Ellensburg Pilot Travel Center #389 Exit 109 Moses Lake Ernie's Truck Stop # 9 Exit 179 Ritzville Jake's Exxon Exit 220 Spokane Broadway Truck Stop - Geiger Exit 276 Spokane Broadway Flying J Travel Plaza Exit 286

Thanh Nguyen, WSDOT June 3, 2005 Page 10 of 13 Private Truck Stop Survey Results The 18 private truck stops identified for the truck parking survey were contacted by telephone between May 5th and May 19th, 2005. The survey responses were qualitative and represent the employee’s best estimation of truck parking demand for an average day. The results of these surveys were not intended to be statistically significant. How full are the private truck stops? Truck parking utilization at private truck stops is a good indicator of whether existing supply meets demand because consistent complete utilization suggests insufficient capacity.
• 44 percent of the surveyed truck stops reported being 90 to 100 percent full • 28 percent of the surveyed truck stops reported being 70 to 90 percent full • 28 percent of the surveyed truck stops reported being 50 to 70 percent full
Is there a time of the day when the truck stops are the busiest? Accounting for the time of the day when private truck stops are busiest is important since truck parking could be in short supply during one period of the day and under-utilized during another. Focusing on the busiest time period could skew perceived demand since measures other than adding supply (e.g., additional facility signage, improved on-line information, public-private partnerships) could provide distribute demand more evenly. Conversely, a relatively even distribution of business throughout the day provides a better revelation of utilization and truck parking needs.
• 47 percent believe 6:00 PM to 12:00 AM is their busiest time of day • 23 percent believe 12:00 PM to 6:00 PM is their busiest time of day • 18 percent believe that business is consistent throughout the day • 12 percent believe 12:00 AM to 6:00 AM is their busiest time of day
Although the percentages described above were based on the employee’s best judgment, many truck stops indicated multiple, shorter time periods (e.g., 3:00 PM to 5:00 PM then 10:00 PM to midnight) that experience high business volumes. Since recording each individual time period would have produced scattered results without a noticeable trend, truck stop employees were asked to identify only one time period. Had these multiple, shorter time periods been quantified, the distribution of busy time periods would likely be more even. As such, the above method represents a conservative approach. How long do the trucks usually stay parked at the truck stops? Parking turnover is directly proportional to capacity since longer parking times reduce the amount of supply.
• 67 percent stated that parked trucks stay 8 or more hours (often overnight) • 22 percent stated that parked trucks stay between 6 and 8 hours • 11 percent stated that parked trucks stay between 0 and 3 hours
Do the truck stops separate their parking areas? Separated truck parking (by size, type, or other) affects the capacity of the truck stops since some parking spaces designated for a certain type of truck may need more supply while another parking area could be under-utilized, resulting in reduced overall use of the facility. None of the 18 surveyed private truck stops have separated truck parking areas.
Do the truck stops experience seasonal variation in business? Including the potential for seasonal variation is valuable because some seasons that experience higher demand than supply could be better balanced with other seasons that are under-utilized. For example, distributing demand throughout the year could be improved with the implementation of other measures (e.g. forecasted schedule coordination, reserved parking, restrictions on length of stay etc.) without increasing the parking supply.

Thanh Nguyen, WSDOT June 3, 2005 Page 11 of 13
• 59 percent reported that demand for their facility remains constant year-round • 41 percent reported that demand for their facility experiences seasonal variation • Of the 41 percent that reported season variation, 86 characterized summer as the busiest season • Of the 41 percent that reported season variation, 14 characterized winter as the busiest season
Some private truck stops noted that pass closures do result in more overnight stays, but not to the extent that parking demand is substantially affected by inclement weather conditions when compared to the rest of the year. What kind of services/amenities do the truck stops offer? Services/amenities offered at private truck stops influence the decision to park based on driver needs and/or desires. The majority of the truck stops offer similar services and amenities.
• 100 percent offer 24-hour service • 61 percent have a sit-down restaurant • 100 percent have a grocery store, convenience store, and/or delicatessen • 78 percent have showers • 61 percent have a trucker lounge • 67 percent have scales • 78 percent have lighted parking
Services/amenities that are less consistent between truck stops include:
• 44 percent have driver drop boxes • 22 percent have mechanics • 22 percent have tire repair • 11 percent have electrification
Services/amenities offered adjacent or proximate to the facility were not included in the results described above. Do the truck stops charge truckers a parking fee? Truck parking fees influence a driver’s decision to pass certain truck stops, prefer other truck stops, or avoid all truck stops completely and park in unauthorized areas.
• 83 percent of the truck stops do not charge a parking fee or require any purchases • 11 percent of the truck stops charges a parking fee, regardless of purchase • 6 percent of the truck stops waive the parking fee with purchase of fuel or other items/services
Are parking spaces rented by the month? The amount of rented parking spaces by the month could suggest a driver’s perception of limited supply and/or consistent truck routes and schedules. Conversely, a lack of monthly reservations could imply adequate parking capacity and/or irregular truck routes and schedules.
• 78 percent of the private truck facilities do not rent parking spaces by the month • 22 percent of the private truck facilities rent parking spaces by the month • Of the 22 percent that rent monthly parking, the number of rented spaces ranges from 1 to 60
spaces • Of the 22 percent that rent monthly parking, no facility has a wait list • Of the 22 percent that rent monthly parking, the fee ranges from $15/month to $75/month

Thanh Nguyen, WSDOT June 3, 2005 Page 12 of 13 Do the truck stops lease additional land to supplement parking supply? Leasing additional property to supplement the parking indicates a need for additional truck parking area and also provides an estimation of how much additional supply is needed.
• 89 percent do not lease additional property to supplement the facility’s parking supply • 11 percent lease additional property to supplement the facility’s parking supply • Of the 11 percent (two truck stops) that lease additional property, the amount of land lease
ranges from approximately 0.5 acres to 1.0 acres to provide 35 to 60 additional parking spaces
Are the truck stops interested in public-private partnerships? The implementation of a variety of public-private partnerships has the potential to increase truck parking capacity.
• 88 percent of surveyed truck stop employees were not interested in public-private partnerships • 12 percent of surveyed truck stop employees were interested in public-private partnerships
Details of potential public-private partnerships were not given. Many of the truck stop employees were unsure of the owner’s/company’s receptiveness to public-private partnerships, but provided the above answers based on best judgment.
What are the federal hours-of-service regulations? The federal hours-of-service (HOS) regulations are instituted by the US Department of Transportation Federal Motor Carrier Safety Administration (FMCSA) and are intended to reduce accidents as a result of driver fatigue. The first HOS regulations went into effect in 1939 and until recently had not changed since their initial implementation. In 1995, Congress became concerned about the effect of driver fatigue as a contributing factor in commercial vehicle accidents and directed the FMCSA to begin a “rulemaking” process to address driver fatigue. After eight years of study, the FMCSA issued revisions to the HOS regulations in April 2003 and required compliance as of January 4, 2004. HOS regulations affect truck parking demand by requiring long-haul truck drivers to stop and rest between 2 and 10 hours. The variation in rest time depends on the number of hours off-duty and if the truck has a sleeper berth.
What other data was collected? In order to determine truck volumes across the state on the study corridors, truck volumes were calculated using traffic count data from the WSDOT 2003 Annual Traffic Report. Using the annual average daily traffic (AADT) count data and truck percentages, truck volumes were estimated along each of the study corridors (I-5, I-82 and I-90). These volumes are shown in Figure 4 (attached). As shown on Figure 4, 2003 truck volumes are consistently higher along the I-5 corridor and the I-90 corridor west of Ellensburg. Annual daily truck volumes in these areas range from approximately 4,000 to 9,000 trips, with a few lower deviation north of Bellingham and between Seattle and North Bend. East of Ellensburg on I-90 and along I-82, truck volumes are substantially lower and generally range from 1,400 to 3,000.
What can we conclude from the data collection effort? • Consultation with the Washington Trucking Associations and results from the private truck stop
telephone survey suggest that truck parking is generally available except for in a few specific areas throughout the study corridors. These specific areas are:
o I-5: Federal Way, Toledo, Tacoma o I-82: Union Gap, Prosser o I-90: Issaquah, North Bend, Ellensburg, Spokane

Thanh Nguyen, WSDOT June 3, 2005 Page 13 of 13
• Truck parking demands are generally constant throughout the year in Washington State. • The current usage and possible future expansion of truck parking spaces at rest areas and
private truck stops are generally not interchangeable because they serve different purposes. • The majority of the truck traffic related to the Ports of Seattle and Tacoma are short-haul truck
trips to and from regional distribution centers. Neither facility provides truck staging areas outside of their terminal gates.
• In reviewing Washington State truck traffic volumes and distribution patterns it appears that truck parking demand is influence by factors other than meeting the federal hours-of-service regulations. Unlike some states, Washington is not a “through truck trip” state; the majority of truck trips originate and end within the state. Accordingly, trucks are generally able to travel the Washington State segments of I-5, I-82, or I-90 within a typical 8 to 10 hour workday.
• There is general “consensus” across the available literature on truck parking supply and demand that there are myriad factors that influence where truck drivers choose to park, including:
o Inability to find overnight rest areas – either too full or not sure where they are located o Hours of service mandatory rest periods may not coincide with a driver’s need for rest o Shipper and receiver policies that may require drivers to load or unload their cargo when
they should be resting o Driver wages that are based upon miles driven rather than hours worked that may
encourage excessive driving hours. • There is also general “consensus” across the available literature on truck parking supply and
demand that the following strategies are most likely the best available for managing truck parking demand:
o Expand or improve public rest areas o Expand or improve private truck stops o Investigate public-private partnerships for future truck parking development o Improve the information and availability of truck parking space information for drivers o Change parking time limits and other rules o Allow parking at other publicly owned facilities, such as weigh stations, visitor centers,
closed rest areas, and park-and-rides. • The private sector will likely be opposed to any proposals that could allow private businesses to
operate within the interstate right-of-way because it will be perceived as providing an unfair advantage to that business.
• Private truck stops have generally not expanded their facilities because for economic reasons, such planning, environmental, financing and construction costs.

214-1631-048/02/102 6/3/05 (B)
N
Figure 3Private Truck Stopsand Public Rest AreasAlong the Study Corridors
97
395
395
195
90
12
2
2
97
97
10
101
Seattle
Marysville
Everett
Arlington
Bellingham
North Bend
Ellensburg
5
Tacoma
Olympia
Kalama
Toledo
5
5
12
Prosser
Moses Lake
82
82
Union Gap
Blaine
Spokane
90
101
1
18
2
512
Interstate Symbol
US Highway Symbol
County Line
Major Roadways
Study Corridors (I-5, I-90, and I-82)
City
Private Truck Stop
Public Rest Area
3
4
5
6
7
8
9
17
1615
Ritzville14
1311
10
12
1
2
3
4
5
6
7
8
9
10
11
16
17
12 13
14
15
1
2
3
4
5
6
7
8
9
11
12
Ernie's Truck Stop # 9
Jake's Exxon
Broadway Flying J Travel Plaza
Broadway Truck Stop - Geiger
Gear Jammers Truck Plaza
Horse Heaven Hills Travel Plaza
Yorky's Truck Stop
Yorky's Exxon
Arlington Fuel Stop
Donna's Truck Stop
Sea-Port Petrolium Truck Stop
Flying J Travel Plaza #05060
Restover Truck Stop
Gee Cee's Truck Stop
Rebel Truck Stop
Seattle-East Auto/Truck Plaza
Flying J Travel Plaza
Pilot Travel Center #389
16
17
18
14
15
13 Custer
Bow Hill
Smokey Point
Silver Lake
SeaTac
Maytown
Scatter Creek
Toutle River
Gee Creek
Indian John Hill
Rye Grass
Winchester
1
2
3
4
5
6
7
8
9
10
11
12
1 7
8
9
10
11
12
Schrag
Sprague Lake
Spokane River
Selah Creek
Prosser
13
14
15
16
17
Vancouver
ADAMS
ASOTINBENTON
CHELANCLALLAM
COLUMBIA
COWLITZ
DOUGLAS
FERRY
FRANKLINGARFIELD
GRANT
GRAYSHARBOR
ISLAND
JEFFERSON
KING
KITSAP
KITTITAS
KLICKITAT
LEWIS
LINCOLN
MASON
OKANOGAN
PACIFIC
PENDOREILLE
PIERCE
SKAGIT
SKAMANIA
SNOHOMISH
SPOKANE
STEVENS
THURSTON
WAHKIAKUMWALLAWALLA
WHATCOM
WHITMAN
YAKIMA
Aberdeen
Port Angeles

214-1631-048/02/102 6/3/05 (B)
N
Figure 4Year 2003 Annual Daily Truck Volumes(Average - Based on Actual Counts)
97
395
395
195
90
12
2
2
97
97
101
Seattle
Marysville
Everett
Arlington
Bellingham
North Bend
Ellensburg
5
Tacoma
Olympia
Kalama
Toledo
5
5
12
Prosser
Moses Lake
82
82
Union Gap
Blaine
Spokane
90
101
512
Interstate Symbol
US Highway Symbol
County Line
Major Roadways
Study Corridors (I-5, I-90, and I-82)
City
Permanent Traffic Recorder
Not actual counts; estimates based onprevious counts and historical growth rates
Ritzville
Vancouver
ADAMS
ASOTINBENTON
CHELANCLALLAM
COLUMBIA
COWLITZ
DOUGLAS
FERRY
FRANKLINGARFIELD
GRANT
GRAYSHARBOR
ISLAND
JEFFERSON
KING
KITSAP
KITTITAS
KLICKITAT
LEWIS
LINCOLN
MASON
OKANOGAN
PACIFIC
PENDOREILLE
PIERCE
SKAGIT
SKAMANIA
SNOHOMISH
SPOKANE
STEVENS
THURSTON
WAHKIAKUMWALLAWALLA
WHATCOM
WHITMAN
YAKIMA
Aberdeen
Port Angeles
2260
3040
15701760
2400
22503080
2400
2720
2400
14002760
4050
41602220
2880
90007560
77008220
7670
7500
7680
6050
4860
3310
17502050
55903920
Source: From Annual Traffic Report (WSDOT) 2003

APPENDIX B
Truck Parking on I-5, I-90, and I-82 in Washington State Technical Memorandum

TECHNICAL MEMORANDUM
Date: September 20, 2005
To: Thanh Nguyen
From: Shannon Patterson, Parametrix
Subject: Truck Parking Study – Truck Parking on I-5, I-90, and I-82 in Washington State
cc: John Perlic, Parametrix Carter Danne, Parametrix
Project Number: 214-1631-048
Project Name: WSDOT Truck Parking Study
1 INTRODUCTION
1.1 Public rest areas
Public rest areas (PRAs), also called safety rest areas, are facilities that are owned and operated by the Washington State Department of Transportation (WSDOT) and designed to provide travelers a safe and convenient place to rest during their trip. Although a couple facilities may require temporary closure during extreme winter conditions, PRAs are open to the public 24 hours a day, seven days a week. These rest areas provide travelers with clean restrooms, drinking water, traveler information, picnic areas, and vending machines.
1.2 Weigh stations
Weigh stations are facilities that contain truck scales used to detect axle, tandem, and gross weight violations. Some weigh stations, called Ports of Entry, also check for compliance with state registration, fuel tax reporting, and other state regulations. Washington’s Port of Entry stations are located in Ridgefield, Bow Hill, Plymouth, Spokane, and Cle Elum. Ports of Entry operate 24 hours per day, seven days per week. Other weigh stations operate as truck traffic warrants.
1.3 Scope of this technical memorandum
This memorandum characterizes Washington’s existing commercial truck parking conditions, presents the forecast methodology used to determine Year 2030 truck parking demand, and provides an illustration of 2030 truck parking conditions if no action is taken along the Interstate (I)-5, I-90 and I-82 corridors (study corridors).
Washington’s existing truck parking conditions at public rest areas (PRAs) was evaluated using data collected by the Washington State Department of Transportation (WSDOT) at PRAs and other locations along the study corridors. The existing truck parking supply and demand was also evaluated at commercial truck stops (CTSs) along the study corridors in a previous study (see the Data Collection Efforts technical memorandum, June 3, 2005), and the results have been incorporated and summarized in this document.

TECHNICAL MEMORANDUM (CONTINUED)
WSDOT 214-1631-048(02) Truck Parking Study 2 September 2005
A forecasting methodology was developed using growth factors to portray Year 2030 truck parking demand along the study corridors. Growth factors were determined by comparing WSDOT historical growth rates, agency literature and databases, and communication with the Ports of Seattle and Tacoma.
Utilizing the growth factors determined by the forecast methodology, Year 2030 truck parking demand was estimated for PRAs and CTSs along the study corridors.
The existing and future truck parking demand analyses and review of similar studies were used to develop a list of potential improvements that could be implemented. The list of preliminary recommendations is suggested as a starting point for discussion in the next phase of this study and is not intended to be exhaustive.
The format of this discussion has been written as a hybrid of the traditional scientific and reader-friendly report styles.
2 EXISTING CONDITIONS AT PUBLIC REST AREAS
2.1 Public rest area data collection
Truck parking demand was recorded at 17 public rest areas (PRAs) and other observed locations to indicate whether current PRA capacity is sufficiently meeting existing demand.
Public rest areas provide legal parking for personal vehicles, recreational vehicles, and commercial trucks. Illegal truck parking at PRAs was noted where commercial trucks were parked in spaces designated for other vehicles (e.g. commercial trucks parked in RV parking), and other areas such as roadsides and on- and off-ramps. While parked trucks in queue (i.e. trucks waiting to use the scales) are allowed at weigh stations, long-term truck parking at weigh stations is technically not legal and have been counted as illegal truck parking occurrences for this study.
In addition to the PRA data described above, WSDOT also conducted a survey of PRA users that queried users as to why they selected that facility, how long they stayed, their destination, and what is the most significant influence on their decision where to stop for breaks.
2.2 Public rest area data analysis approach
Data were collected during the daytime and nighttime periods and summarized at the corridor, segment, and facility levels. The average and maximum demand were calculated to provide information on the observed peak and average usage. Each of the PRAs was surveyed numerous times throughout the data collection period and the average demand represents the average number of parked trucks observed over the data collection period. The maximum demand is the highest observed number of trucks parked (i.e. one data point) and is referred to as maximum demand or peak demand throughout the discussion.
2.2.1 Corridor
The study corridors included I-5, I-90, and I-82 within Washington. Within Washington State, I-5 is the primary north-south freeway that extends from the Oregon/Washington border to the U.S./Canadian border. I-90 is the primary east-west freeway that begins with its connection with I-5 in the west, goes over the Cascade Mountain range, and continues east to the Washington/Idaho border. I-82 connects with I-90 in Ellensburg in central Washington, and then continues southeast where it serves Yakima and the Tri-Cities area before entering Oregon. Truck parking demand was summarized separately for each travel direction.

TECHNICAL MEMORANDUM (CONTINUED)
WSDOT 214-1631-048(02) Truck Parking Study 3 September 2005
2.2.2 Segment
I-5 and I-90 were divided into segments since both corridors are relatively long, exhibit distinct geographical characteristics, and have multiple PRAs. I-5 was divided into the south segment (Oregon border to milepost [MP] 100 near Tumwater); central segment (MP 101 to MP 200 near Marysville) and the north segment (MP 201 to Canadian border). The south segment covers the southern portion of the state including the Port of Vancouver, Kalama, and Longview, the central segment captures the Ports of Tacoma and Seattle, and the north segment includes the Everett Naval Base, Paine Field, and Port of Everett. I-90 was divided into the west segment (from the I-5/I-90 interchange to MP 135 near Vantage) and the east segment (extends from MP 136 to the Idaho border). The west segment generally serves the Puget Sound region and central Washington. The east segment serves eastern Washington and is the primary route for travelers between Washington and Idaho. I-82 was not divided into segments since this corridor only has three PRAs and is relatively short compared to I-5 and I-90.
2.2.3 Facility
Truck parking surveys were conducted at every Washington State PRAs along the study corridors. In addition to these PRAs, WSDOT also noted other areas along these corridors where illegal truck parking was observed, which included roadsides, on- and off-ramps, weigh stations, chain up/chain down areas, scenic viewpoints and other various locations. These facilities were surveyed at different times of the day and on different days to provide a holistic generalization of existing truck parking conditions along the study corridors. Data collected at each facility included: facility capacity, total number of parked trucks, number of legally parked trucks, number of illegally parked trucks, and location of illegally parked trucks. Data collected at more discrete locations, such as weigh stations and chain up/chain down areas where illegal truck parking was repeatedly observed, were grouped together. Less localized illegal parking, such as along roadsides and on- and off-ramps, were grouped together based on geographical location relative to PRAs.
All data were recorded between March and July of 2005. Table 1 provides a list of the PRAs surveyed and Figure 1 shows their locations.

TECHNICAL MEMORANDUM (CONTINUED)
WSDOT 214-1631-048(02) Truck Parking Study 4 September 2005
Table 1. Public Rest Areas Located Along I-5, I-90, and I-82
Public Rest Area Name City* Milepost
Interstate 5 Gee Creek Ridgefield 11
Toutle River Castle Rock 54
Scatter Creek Tumwater 90
Maytown Tumwater 93
SeaTac SeaTac 140
Silver Lake Everett 188
Smokey Point Arlington 207
Bow Hill Burlington 238
Custer Ferndale 267
Interstate 90 Price Creek Snoqualmie 61
Indian John Hill Cle Elum 89
Rye Grass Ellensburg 125
Winchester George 161
Schrag Moses Lake 198
Sprague Lake Sprague 241
Interstate 82
Scenic View Kennewick 7
Selah Creek Selah 24
Prosser Prosser 80
*For reference only, several facilities are located in unincorporated areas

214-1631-048/02/103 8/10/05 (B)
N
Figure 1Commercial Truck Stopsand Public Rest AreasAlong the Study Corridors
97
395
395
195
90
12
2
2
97
97
10
101
Seattle
Marysville
Everett
Arlington
Bellingham
North Bend
Ellensburg
5
Tacoma
Olympia
Kalama
Toledo
5
5
12
Prosser
Moses Lake
82
82
Union Gap
Blaine
Spokane
90
101
1
18
2
512
Interstate Symbol
US Highway Symbol
County Line
Major Roadways
Study Corridors (I-5, I-90, and I-82)
City
Private Truck Stop
Public Rest Area
3
4
5
6
7
8
9
17
1615
Ritzville14
1311
10
12
1
2
3
4
5
6
7
8
9
11
12
17
18
13 14
15
1
2
3
4
5
6
7
8
9
11
12
Ernie's Truck Stop # 9
Jake's Exxon
Broadway Flying J Travel Plaza
Broadway Truck Stop - Geiger
Gear Jammers Truck Plaza
Horse Heaven Hills Travel Plaza
Yorky's Truck Stop
Yorky's Exxon
Arlington Fuel Stop
Donna's Truck Stop
Sea-Port Petrolium Truck Stop
Flying J Travel Plaza #05060
Restover Truck Stop
Gee Cee's Truck Stop
Rebel Truck Stop
Seattle-East Auto/Truck Plaza
Flying J Travel Plaza
Pilot Travel Center #389
16
17
18
14
15
13 Custer
Bow Hill
Smokey Point
Silver Lake
SeaTac
Maytown
Scatter Creek
Toutle River
Gee Creek
Price Creek
Indian John Hill
Rye Grass
1
2
3
4
5
6
7
8
9
10
11
12
1 7
8
9
10
11
12
Winchester
Schrag
Sprague Lake
MP 7 Scenic View
Selah Creek
Prosser
13
14
15
16
17
Vancouver
18
10
16
ADAMS
ASOTINBENTON
CHELANCLALLAM
COLUMBIA
COWLITZ
DOUGLAS
FERRY
FRANKLINGARFIELD
GRANT
GRAYSHARBOR
ISLAND
JEFFERSON
KING
KITSAP
KITTITAS
KLICKITAT
LEWIS
LINCOLN
MASON
OKANOGAN
PACIFIC
PENDOREILLE
PIERCE
SKAGIT
SKAMANIA
SNOHOMISH
SPOKANE
STEVENS
THURSTON
WAHKIAKUMWALLAWALLA
WHATCOM
WHITMAN
YAKIMA
Aberdeen
Port Angeles

TECHNICAL MEMORANDUM (CONTINUED)
WSDOT 214-1631-048(02) Truck Parking Study 6 September 2005
2.3 Existing public rest area daytime truck parking conditions
Data collected during the daytime period occurred between approximately 7:00 AM to 5:30 PM and was reviewed at the corridor, segment, and facility levels of analysis.
2.3.1 Corridor
As shown in Table 2, below, the average daytime truck parking utilization was below 100 percent for all study corridors and travel directions. Southbound I-5 had a maximum utilization rate of 104 percent and I-82 eastbound had a maximum utilization rate of 100 percent. All other corridors and directions of travel had a maximum utilization rate less than their legal capacity.
Table 2. Existing Daytime Corridor Truck Parking Demand and Utilization
Average Maximum
Demand Demand
Corridor Legal
Capacity
Legally Parked Trucks
Illegally Parked Trucks Utilization
Legally Parked Trucks
Illegally Parked Trucks Utilization
I-5 Northbound 103 36 28 62% 50 39 86%
I-5 Southbound 83 40 23 76% 51 35 104%
I-90 Eastbound 101 23 8 31% 35 12 47%
I-90 Westbound 72 18 7 35% 37 11 67%
I-82 Eastbound 23 8 3 48% 16 7 100%
I-82 Westbound 29 5 1 21% 10 1 38%
2.3.2 Segment
All corridor segments (for both travel directions) had daytime average and maximum utilization rates less than available capacity and generally ranged from 40 percent to 60 percent. The highest daytime maximum utilization rates occurred in the north segment of northbound I-5 (81 percent), the west segment of westbound I-90 (86 percent), and the south segment of southbound I-5 (90 percent).
The central segment of I-5 (northbound and southbound) does not include any PRAs with legal truck parking. Accordingly, utilization rates cannot be calculated for this segment. However, the daytime average truck parking demand for this segment was 15 trucks, and the maximum demand ranged from 18 (I-5 northbound) to 25 (I-5 southbound) trucks. Table 3 shows the daytime average and maximum truck parking demand and facility utilization rates.
I-82 was not divided into segments; therefore truck parking demand and utilization along I-82 are described only at the corridor and facility levels of analysis.

TECHNICAL MEMORANDUM (CONTINUED)
WSDOT 214-1631-048(02) Truck Parking Study 7 September 2005
Table 3. Existing Daytime Segment Truck Parking Demand and Utilization
Average Maximum
Demand Demand
Corridor Segment Legal
Capacity
Legally Parked Trucks
Illegally Parked Trucks Utilization
Legally Parked Trucks
Illegally Parked Trucks Utilization
I-5 Northbound South 61 22 5 44% 31 6 61%
I-5 Northbound Central 0 0 15 * 0 18 *
I-5 Northbound North 42 13 8 50% 19 15 81%
I-5 Southbound North 35 12 3 43% 14 4 51%
I-5 Southbound Central 0 0 15 * 0 25 *
I-5 Southbound South 48 29 5 71% 37 6 90%
I-90 Eastbound West 52 14 7 40% 22 11 63%
I-90 Eastbound East 49 8 1 18% 13 1 29%
I-90 Westbound East 44 11 1 27% 22 2 55%
I-90 Westbound West 28 7 6 46% 15 9 86%
* Utilization cannot be calculated due to zero legal capacity
2.3.3 Facility
Northbound Interstate 5
The Smokey Point (north segment) PRA had a daytime average (109 percent) and maximum (173 percent) truck parking demand that exceeded its legal capacity. All other facilities along northbound I-5 had sufficient capacity. Custer (north segment) had the lowest daytime truck parking demand with an average utilization rate of 12 percent and a maximum rate of 18 percent.
In addition to the PRAs, northbound I-5 had four areas where illegally parked trucks were regularly observed during the day. These four areas combined had between 21 (average demand) and 26 (maximum demand) illegally parked trucks. Three of these four areas are weigh stations, and account for 20 (average) to 25 (maximum) of the illegally parked trucks – 15 (average) to 18 (maximum) of them at the SeaTac weigh station (central segment). Table 4 shows the daytime average and maximum truck parking demand and utilization rates for northbound I-5.
TECHNICAL MEMORANDUM (CONTINUED)
WSDOT 214-1631-048(02) Truck Parking Study 8 September 2005
Table 4. Existing Interstate 5 Northbound Daytime Facility Truck Parking Demand and Utilization
Average Maximum
Demand Demand
Corridor Segment Public Rest Area /
Other Areas Legal
Capacity
Legally Parked Trucks
Illegally Parked Trucks Utilization
Legally Parked Trucks
Illegally Parked Trucks Utilization
I-5 Northbound South Gee Creek 22 6 1 32% 7 1 36%
I-5 Northbound South MP 15 Weigh Station 0 0 3 * 0 4 *
I-5 Northbound South MP 32-82 0 0 1 * 0 1 *
I-5 Northbound South Toutle River 22 7 0 32% 9 0 41%
I-5 Northbound South Scatter Creek 17 9 0 53% 15 0 88%
I-5 Northbound Central SeaTac 0 0 15 * 0 18 *
I-5 Northbound North Smokey Point 11 6 6 109% 8 11 173%
I-5 Northbound North MP 200, MP 214 Weigh Station
0 0 2 * 0 3 *
I-5 Northbound North Bow Hill 14 6 0 43% 8 1 64%
I-5 Northbound North Custer 17 2 0 12% 3 0 18%
* Utilization cannot be calculated due to zero legal capacity
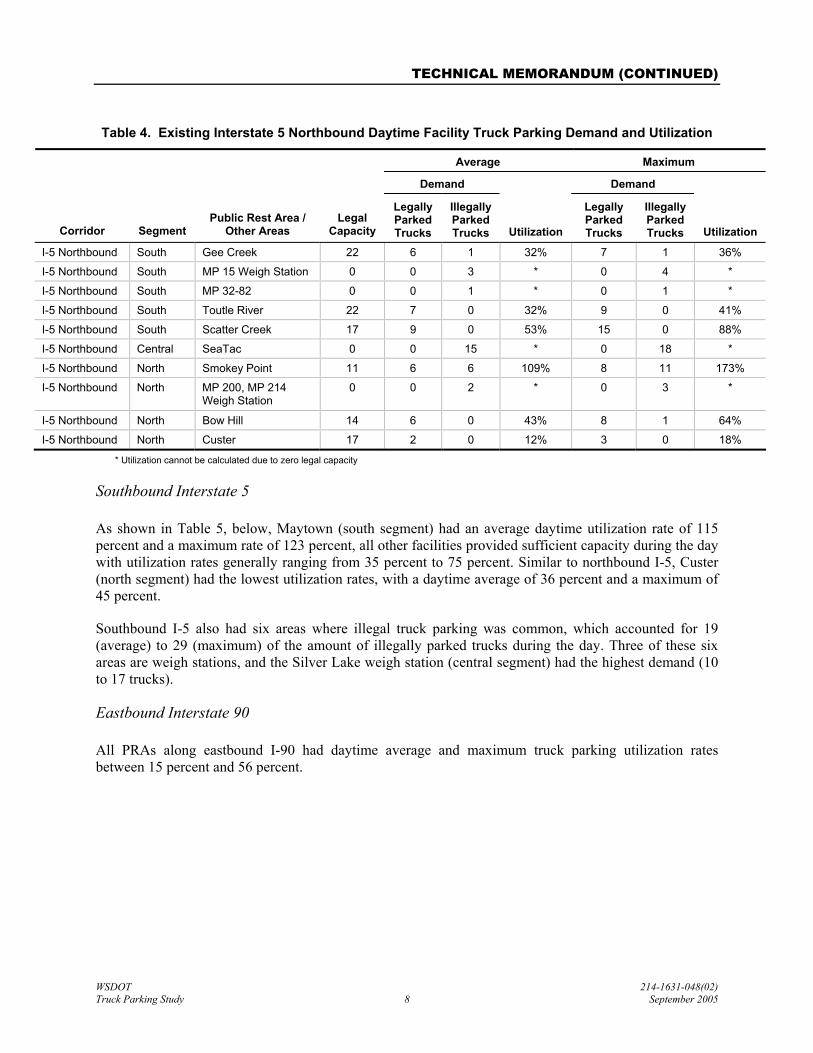
Southbound Interstate 5
As shown in Table 5, below, Maytown (south segment) had an average daytime utilization rate of 115 percent and a maximum rate of 123 percent, all other facilities provided sufficient capacity during the day with utilization rates generally ranging from 35 percent to 75 percent. Similar to northbound I-5, Custer (north segment) had the lowest utilization rates, with a daytime average of 36 percent and a maximum of 45 percent.
Southbound I-5 also had six areas where illegal truck parking was common, which accounted for 19 (average) to 29 (maximum) of the amount of illegally parked trucks during the day. Three of these six areas are weigh stations, and the Silver Lake weigh station (central segment) had the highest demand (10 to 17 trucks).
Eastbound Interstate 90
All PRAs along eastbound I-90 had daytime average and maximum truck parking utilization rates between 15 percent and 56 percent.

TECHNICAL MEMORANDUM (CONTINUED)
WSDOT 214-1631-048(02) Truck Parking Study 9 September 2005
Table 5. Existing Interstate 5 Southbound Daytime Facility Truck Parking Demand and Utilization
Average Maximum
Demand Demand
Corridor Segment Public Rest Area /
Other Areas Legal
Capacity
Legally Parked Trucks
Illegally Parked Trucks Utilization
Legally Parked Trucks
Illegally Parked Trucks Utilization
I-5 Southbound North Custer 11 4 0 36% 5 0 45%
I-5 Southbound North Bow Hill 13 5 0 38% 6 0 46%
I-5 Southbound North MP 235 Weigh Station 0 0 1 * 0 1 *
I-5 Southbound North Smokey Point 11 2 2 36% 3 3 55%
I-5 Southbound Central Silver Lake 0 0 10 * 0 17 *
I-5 Southbound Central MP 141 Weigh Station 0 0 3 * 0 5 *
I-5 Southbound Central MP 116 0 0 2 * 0 3 *
I-5 Southbound South MP 99 0 0 1 * 0 1 *
I-5 Southbound South Maytown 13 13 2 115% 13 3 123%
I-5 Southbound South MP 81 & 60 0 0 2 * 0 2 *
I-5 Southbound South Toutle River 24 10 0 42% 16 0 67%
I-5 Southbound South Gee Creek 11 6 0 55% 8 0 73%
* Utilization cannot be calculated due to zero legal capacity
A traveler’s rest area, a weigh station, and a few other on- and off-ramps added eight (average) to 12 (maximum) illegally parked trucks. The daytime average and maximum truck parking demand and facility utilization rates for eastbound I-90 are shown in Table 6.
Table 6. Existing Interstate 90 Eastbound Daytime Facility Truck Parking Demand and Utilization
Average Maximum
Demand Demand
Corridor Segment Public Rest Area /
Other Areas Legal
Capacity
Legally Parked Trucks
Illegally Parked Trucks Utilization
Legally Parked Trucks
Illegally Parked Trucks Utilization
I-90 Eastbound West Traveler's Rest 0 0 3 * 0 4 *
I-90 Eastbound West MP 56 & 115 0 0 3 * 0 6 *
I-90 Eastbound West MP 79 Weigh Station 0 0 1 * 0 1 *
I-90 Eastbound West Indian John Hill 23 9 0 39% 12 0 52%
I-90 Eastbound West Price Creek 20 3 0 15% 5 0 25%
I-90 Eastbound West Rye Grass 9 3 0 33% 5 0 56%
I-90 Eastbound East Winchester 12 2 0 17% 3 0 25%
I-90 Eastbound East Schrag 17 3 0 18% 5 0 29%
I-90 Eastbound East MP 231 0 0 1 * 0 1 *
I-90 Eastbound East Sprague Lake 20 3 0 15% 5 0 25%
* Utilization cannot be calculated due to zero legal capacity

TECHNICAL MEMORANDUM (CONTINUED)
WSDOT 214-1631-048(02) Truck Parking Study 10 September 2005
Westbound Interstate 90
Similar to eastbound I-90, the daytime westbound PRA utilization rates were all below 100 percent; however utilization rates were slightly higher and ranged from 22 percent to 80 percent.
Three other general areas (including one weigh station) along westbound I-90 had seven (average demand) to 11 (maximum demand) additional illegally parked trucks. Table 7 provides the daytime average and maximum demand and utilization rates for westbound I-90.
Table 7. Existing Interstate 90 Westbound Daytime Facility Truck Parking Demand and Utilization
Average Maximum
Demand Demand
Corridor Segment Public Rest Area /
Other Areas Legal
Capacity
Legally Parked Trucks
Illegally Parked Trucks Utilization
Legally Parked Trucks
Illegally Parked Trucks Utilization
I-90 Westbound East Sprague Lake 15 5 0 33% 12 0 80%
I-90 Westbound East Schrag 17 3 0 18% 4 0 24%
I-90 Westbound East Winchester 12 2 0 17% 6 0 50%
I-90 Westbound East MP 231, 143, 139 0 0 1 * 0 2 *
I-90 Westbound West Rye Grass 9 2 0 22% 5 0 56%
I-90 Westbound West Indian John Hill 19 6 0 32% 10 0 53%
I-90 Westbound West MP 80 Weigh Station 0 0 2 * 0 2 *
I-90 Westbound West MP 56 0 0 4 * 0 7 *
* Utilization cannot be calculated due to zero legal capacity
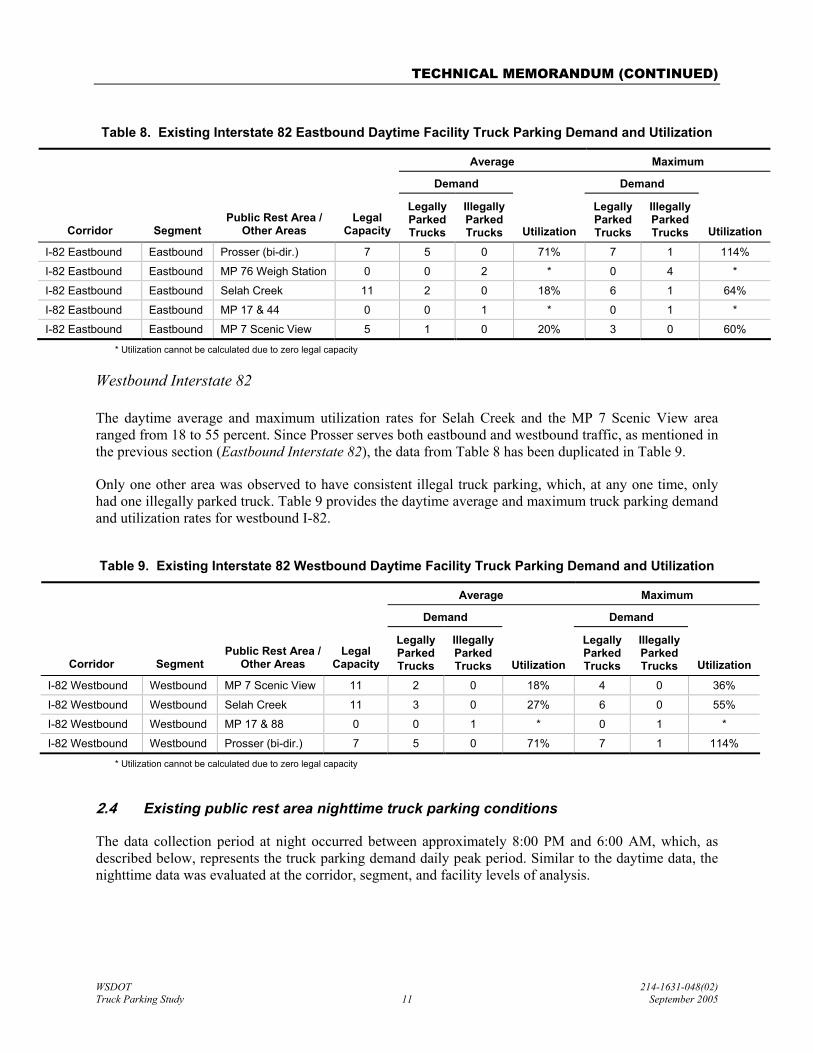
Eastbound Interstate 82
Prosser is a bi-directional facility, meaning that both eastbound and westbound traffic utilize one parking area. The Prosser PRA had the highest truck parking demand, with a daytime average utilization rate of 71 percent and maximum rate of 114 percent. Selah Creek and the MP 7 Scenic View area had similar truck parking demand – 18 to 20 percent daytime average utilization and 60 to 64 percent maximum utilization.
As shown in Table 8, two other areas, including one weigh station, with regular illegal truck parking had a combined average demand of three trucks, and maximum demand of five trucks.
TECHNICAL MEMORANDUM (CONTINUED)
WSDOT 214-1631-048(02) Truck Parking Study 11 September 2005
Table 8. Existing Interstate 82 Eastbound Daytime Facility Truck Parking Demand and Utilization
Average Maximum
Demand Demand
Corridor Segment Public Rest Area /
Other Areas Legal
Capacity
Legally Parked Trucks
Illegally Parked Trucks Utilization
Legally Parked Trucks
Illegally Parked Trucks Utilization
I-82 Eastbound Eastbound Prosser (bi-dir.) 7 5 0 71% 7 1 114%
I-82 Eastbound Eastbound MP 76 Weigh Station 0 0 2 * 0 4 *
I-82 Eastbound Eastbound Selah Creek 11 2 0 18% 6 1 64%
I-82 Eastbound Eastbound MP 17 & 44 0 0 1 * 0 1 *
I-82 Eastbound Eastbound MP 7 Scenic View 5 1 0 20% 3 0 60%
* Utilization cannot be calculated due to zero legal capacity
Westbound Interstate 82
The daytime average and maximum utilization rates for Selah Creek and the MP 7 Scenic View area ranged from 18 to 55 percent. Since Prosser serves both eastbound and westbound traffic, as mentioned in the previous section (Eastbound Interstate 82), the data from Table 8 has been duplicated in Table 9.
Only one other area was observed to have consistent illegal truck parking, which, at any one time, only had one illegally parked truck. Table 9 provides the daytime average and maximum truck parking demand and utilization rates for westbound I-82.
Table 9. Existing Interstate 82 Westbound Daytime Facility Truck Parking Demand and Utilization
Average Maximum
Demand Demand
Corridor Segment Public Rest Area /
Other Areas Legal
Capacity
Legally Parked Trucks
Illegally Parked Trucks Utilization
Legally Parked Trucks
Illegally Parked Trucks Utilization
I-82 Westbound Westbound MP 7 Scenic View 11 2 0 18% 4 0 36%
I-82 Westbound Westbound Selah Creek 11 3 0 27% 6 0 55%
I-82 Westbound Westbound MP 17 & 88 0 0 1 * 0 1 *
I-82 Westbound Westbound Prosser (bi-dir.) 7 5 0 71% 7 1 114%
* Utilization cannot be calculated due to zero legal capacity
2.4 Existing public rest area nighttime truck parking conditions
The data collection period at night occurred between approximately 8:00 PM and 6:00 AM, which, as described below, represents the truck parking demand daily peak period. Similar to the daytime data, the nighttime data was evaluated at the corridor, segment, and facility levels of analysis.

TECHNICAL MEMORANDUM (CONTINUED)
WSDOT 214-1631-048(02) Truck Parking Study 12 September 2005
2.4.1 Corridors
Nighttime data was collected along the same study corridors as the daytime collection effort; I-5, I-90, and I-82). Unlike daytime conditions, only I-90 eastbound (87 percent), I-82 eastbound (96 percent), and I-82 westbound (86 percent) had nighttime average utilization rates less than 100 percent. The truck parking demand for all other corridors and directions of travel exceeded the corridor capacity for both the average and maximum truck parking demand, which reached a nighttime average utilization rate of 127 percent (I-5 southbound) and 235 percent during the peak demand (I-5 southbound). See Table 10.
Table 10. Existing Nighttime Corridor Truck Parking Demand and Utilization
Average Maximum
Demand Demand
Corridor Legal
Capacity
Legally Parked Trucks
Illegally Parked Trucks Utilization
Legally Parked Trucks
Illegally Parked Trucks Utilization
I-5 Northbound 103 59 67 122% 84 148 225%
I-5 Southbound 83 48 57 127% 62 133 235%
I-90 Eastbound 101 58 30 87% 90 68 156%
I-90 Westbound 72 48 28 106% 72 72 200%
I-82 Eastbound 23 15 7 96% 23 23 200%
I-82 Westbound 29 20 5 86% 29 16 155%
2.4.2 Segment
The north segment of I-5 (both northbound and southbound), eastbound I-90 (east and west segments), and east segment of westbound I-90 had nighttime average utilization rates less than 100 percent. With the exception of these segments, all other corridor segments in both directions of travel experienced nighttime truck parking demand at or above their legal capacity. The highest truck parking demand occurred in the west segment of westbound I-90, where truck parking demand was nearly triple the legal capacity.
The central segment of I-5 lacks legal truck parking capacity and therefore utilization rates cannot be calculated. The average nighttime truck parking demand for this segment (northbound and southbound) is 53 trucks, and the maximum demand is 104 trucks.
I-82 was not divided into segments; therefore truck parking demand and utilization along I-82 are described only at the corridor and facility levels of analysis.

TECHNICAL MEMORANDUM (CONTINUED)
WSDOT 214-1631-048(02) Truck Parking Study 13 September 2005
Table 11. Existing Nighttime Segment Truck Parking Demand and Utilization
Average Maximum
Demand Demand
Corridor Segment Legal
Capacity
Legally Parked Trucks
Illegally Parked Trucks Utilization
Legally Parked Trucks
Illegally Parked Trucks Utilization
I-5 Northbound South 61 44 21 107% 61 54 189%
I-5 Northbound Central 0 0 30 * 0 54 *
I-5 Northbound North 42 15 16 74% 23 40 150%
I-5 Southbound South 48 35 13 100% 44 42 179%
I-5 Southbound Central 0 0 23 * 0 50 *
I-5 Southbound North 35 13 21 97% 18 41 169%
I-90 Eastbound West 52 28 18 88% 41 38 152%
I-90 Eastbound East 49 30 12 86% 49 30 161%
I-90 Westbound West 28 21 21 150% 28 52 286%
I-90 Westbound East 44 27 7 77% 44 20 145%
* Utilization cannot be calculated due to zero legal capacity
2.4.3 Facility
Northbound Interstate 5
Four of the eight PRAs had nighttime truck parking utilization rates less than 100 percent, however only Custer (north segment) was able to provide sufficient capacity during maximum demand. Scatter Creek (south segment) had the highest nighttime average truck parking demand (147 percent utilization), and Smokey Point (north segment) had the highest nighttime maximum truck parking demand (273 percent utilization).
Illegal truck parking was commonly observed at nine other areas outside of the PRAs. These other areas had a combined total average of 44 illegally parked trucks and a maximum total of 80 illegally parked trucks. Of these nine other areas, four are weigh stations, which had 37 (average) to 67 (maximum) illegally parked trucks. The SeaTac weigh station was the highest contributor to the number of illegally parked trucks in these nine areas with an average of 20 trucks and a maximum demand of 35 trucks. See Table 12 for the nighttime average truck parking demand and utilization rates for northbound I-5.

TECHNICAL MEMORANDUM (CONTINUED)
WSDOT 214-1631-048(02) Truck Parking Study 14 September 2005
Table 12. Existing Interstate 5 Northbound Nighttime Facility Truck Parking Demand and Utilization
Average Maximum
Demand Demand
Corridor Segment Public Rest Area /
Other Areas Legal
Capacity
Legally Parked Trucks
Illegally Parked Trucks Utilization
Legally Parked Trucks
Illegally Parked Trucks Utilization
I-5 Northbound South Gee Creek 22 12 1 59% 22 4 118%
I-5 Northbound South MP 15 Weigh Station 0 0 4 * 0 9 *
I-5 Northbound South MP 16-52 0 0 1 * 0 2 *
I-5 Northbound South Toutle River 22 17 2 86% 22 8 136%
I-5 Northbound South MP 57-68 0 0 2 * 0 5 *
I-5 Northbound South Scatter Creek 17 15 10 147% 17 23 235%
I-5 Northbound South MP 99 0 0 1 * 0 3 *
I-5 Northbound Central MP 117 Weigh Station 0 0 9 * 0 17 *
I-5 Northbound Central SeaTac 0 0 20 * 0 35 *
I-5 Northbound Central MP 123 & 188 0 0 1 * 0 2 *
I-5 Northbound North Smokey Point 11 5 9 127% 0 30 273%
I-5 Northbound North MP 213 Weigh Station 0 0 5 * 0 6 *
I-5 Northbound North Bow Hill 14 7 1 57% 14 3 121%
I-5 Northbound North MP 240 0 0 1 * 0 1 *
I-5 Northbound North Custer 17 3 0 18% 9 0 53%
* Utilization cannot be calculated due to zero legal capacity
Southbound Interstate 5
As shown in Table 13, below, the south segment had one PRA (Toutle River) and the north segment had three PRAs (Smokey Point, Bow Hill, and Custer) that provided sufficient nighttime truck parking capacity on average. Only Bow Hill and Custer had nighttime maximum truck parking utilization rates less than 100 percent.
Southbound I-5 also had eight areas where illegal truck parking was frequent, which accounted for a combined total of 41 (average) to 80 (maximum) illegally parked trucks at night. Four of these eight areas are weigh stations, and the Silver Lake weigh station (central segment) had the highest nighttime demand (13 to 26 trucks).

TECHNICAL MEMORANDUM (CONTINUED)
WSDOT 214-1631-048(02) Truck Parking Study 15 September 2005
Table 13. Existing Interstate 5 Southbound Nighttime Facility Truck Parking Demand and Utilization
Average Maximum
Demand Demand
Corridor Segment Public Rest Area /
Other Areas Legal
Capacity
Legally Parked Trucks
Illegally Parked Trucks Utilization
Legally Parked Trucks
Illegally Parked Trucks Utilization
I-5 Southbound South Gee Creek 11 10 2 109% 11 6 155%
I-5 Southbound South MP 16-48 0 0 2 * 0 6 *
I-5 Southbound South Toutle River 24 14 1 63% 20 4 100%
I-5 Southbound South MP 57-99 0 0 1 * 0 2 *
I-5 Southbound South Maytown 13 11 7 138% 13 24 285%
I-5 Southbound Central MP 116-122 0 0 3 * 0 7 *
I-5 Southbound Central MP 141 Weigh Station 0 0 7 * 0 17 *
I-5 Southbound Central Silver Lake 0 0 13 * 0 26 *
I-5 Southbound North MP 188-221 0 0 3 * 0 7 *
I-5 Southbound North Smokey Point 11 4 6 91% 0 18 164%
I-5 Southbound North MP 236 Weigh Station 0 0 2 * 0 3 *
I-5 Southbound North Bow Hill 13 6 0 46% 12 0 92%
I-5 Southbound North MP 242 Weigh Station 0 0 10 * 0 12 *
I-5 Southbound North Custer 11 3 0 27% 6 1 64%
* Utilization cannot be calculated due to zero legal capacity
Eastbound Interstate 90
During the nighttime period, five of the six PRAs along I-90 provided sufficient truck parking capacity on average with utilization rates from 25 percent to 85 percent. However, Price Creek (west segment) was the only facility to have utilization rates lower than 100 percent during maximum demand. Sprague Lake had the highest average (118 percent) and maximum (195 percent) utilization rates.
There were nine other areas along eastbound I-90 that repeatedly had illegal truck parking. These areas had a combined total average of 17 illegally parked trucks and a maximum demand of 31 trucks. Two of these nine illegal areas were weigh stations. The chain down area near MP 56 was the greatest contributor of illegally parked trucks; six trucks on average and 12 trucks at maximum. See Table 14 for the nighttime average and maximum truck parking demand for the PRAs and other illegal areas.

TECHNICAL MEMORANDUM (CONTINUED)
WSDOT 214-1631-048(02) Truck Parking Study 16 September 2005
Table 14. Existing Interstate 90 Eastbound Nighttime Facility Truck Parking Demand and Utilization
Average Maximum
Demand Demand
Corridor Segment Public Rest Area /
Other Areas Legal
Capacity
Legally Parked Trucks
Illegally Parked Trucks Utilization
Legally Parked Trucks
Illegally Parked Trucks Utilization
I-90 Eastbound West MP 33 Chain Up 0 0 2 * 0 2 *
I-90 Eastbound West MP 34-54 0 0 2 * 0 5 *
I-90 Eastbound West MP 56 Chain Down 0 0 6 * 0 12 *
I-90 Eastbound West Price Creek 20 5 0 25% 9 0 45%
I-90 Eastbound West MP 70-85 0 0 1 * 0 1 *
I-90 Eastbound West MP 79 Weigh Station 0 0 2 * 0 3 *
I-90 Eastbound West Indian John Hill 23 17 2 83% 23 7 130%
I-90 Eastbound West MP 101-115 0 0 1 * 0 2 *
I-90 Eastbound West Rye Grass 9 6 2 89% 9 6 167%
I-90 Eastbound East MP 139-188 0 0 1 * 0 1 *
I-90 Eastbound East Winchester 12 6 1 58% 12 1 108%
I-90 Eastbound East Schrag 17 7 0 41% 17 4 124%
I-90 Eastbound East MP 231 Weigh Station 0 0 2 * 0 3 *
I-90 Eastbound East Sprague Lake 20 17 7 120% 20 19 195%
I-90 Eastbound East MP 206-257 0 0 1 * 0 2 *
* Utilization cannot be calculated due to zero legal capacity
Westbound Interstate 90
All PRAs along westbound I-90 were able to provide sufficient nighttime truck parking capacity on average; however the maximum truck parking demand exceeded the capacity at every facility. Sprague Lake (east segment) had the highest nighttime average demand (full utilization), and Indian John Hill had the highest maximum demand (158 percent utilization).
Seven areas had illegally parked trucks on a regular basis. These seven areas combined had 23 illegally parked trucks on average, and a maximum demand of 45 trucks. Two of these seven areas were weigh stations and together added five illegally parked trucks on average and eight trucks during the peak demand. Unlike many other corridors, the trucks parked at these two weigh stations did not make up the majority of illegally parked trucks for these areas. Table 15 provides a breakdown of the nighttime average and maximum truck parking demand and facility utilization rates.

TECHNICAL MEMORANDUM (CONTINUED)
WSDOT 214-1631-048(02) Truck Parking Study 17 September 2005
Table 15. Existing Interstate 90 Westbound Nighttime Facility Truck Parking Demand and Utilization
Average Maximum
Demand Demand
Corridor Segment Public Rest Area /
Other Areas Legal
Capacity
Legally Parked Trucks
Illegally Parked Trucks Utilization
Legally Parked Trucks
Illegally Parked Trucks Utilization
I-90 Westbound West MP 25 0 0 6 * 0 12 *
I-90 Westbound West MP 11-47, 101 0 0 1 * 0 3 *
I-90 Westbound West MP 56 0 0 8 * 0 17 *
I-90 Westbound West MP 80 Weigh Station 0 0 3 * 0 5 *
I-90 Westbound West Indian John Hill 19 15 2 89% 19 11 158%
I-90 Westbound West Rye Grass 9 6 1 78% 9 4 144%
I-90 Westbound East MP 139 0 0 2 * 0 2 *
I-90 Westbound East Winchester 12 6 0 50% 12 1 108%
I-90 Westbound East Schrag 17 8 0 47% 17 3 118%
I-90 Westbound East MP 231 Weigh Station 0 0 2 * 0 3 *
I-90 Westbound East Sprague Lake 15 13 2 100% 15 8 153%
I-90 Westbound East MP 164-264 0 0 1 * 0 3 *
* Utilization cannot be calculated due to zero legal capacity
Eastbound Interstate 82
Eastbound I-82 has three PRAs: MP 7 Scenic View, Selah Creek, and Prosser (bi-directional). Both MP 7 Scenic View and Selah Creek had nighttime average utilization rates less than 100 percent, however all three facilities lacked adequate capacity during the maximum demand period. MP 7 Scenic View had the lowest average nighttime truck parking demand (62 percent utilization), but it also had the highest maximum utilization rate (200 percent).
One weigh station (near MP 76) accounted for the majority of illegally parked trucks outside of the PRAs; three of four trucks on average and 10 of 12 trucks at maximum. The nighttime average and maximum truck parking demand and utilization rates for eastbound I-82 is shown in Table 16, below.
Table 16. Existing Interstate 82 Eastbound Nighttime Facility Truck Parking Demand and Utilization
Average Maximum
Demand Demand
Corridor Segment Public Rest Area /
Other Areas Legal
Capacity
Legally Parked Trucks
Illegally Parked Trucks Utilization
Legally Parked Trucks
Illegally Parked Trucks Utilization
I-82 Eastbound Eastbound MP 7 Scenic View 5 2 1 60% 5 5 200%
I-82 Eastbound Eastbound Selah Creek 11 7 1 73% 11 3 127%
I-82 Eastbound Eastbound MP 76 Weigh Station 0 0 3 * 0 10 *
I-82 Eastbound Eastbound Prosser (bi-dir.) 7 6 1 100% 7 3 143%
I-82 Eastbound Eastbound MP 27-122 0 0 1 * 0 2 *
* Utilization cannot be calculated due to zero legal capacity

TECHNICAL MEMORANDUM (CONTINUED)
WSDOT 214-1631-048(02) Truck Parking Study 18 September 2005
Westbound Interstate 82
As shown in Table 17, all three PRAs provided sufficient truck parking at night on average. Selah Creek had the highest nighttime average (84 percent utilization) and maximum truck parking demand (155 percent utilization).
There were no specific areas where illegal truck parking was frequently observed along westbound I-82. However, illegal truck parking was recorded on a couple of isolated occasions between MP 17 and MP 122, which added a maximum of two illegally parked trucks.
Table 17. Existing Interstate 82 Westbound Nighttime Facility Truck Parking Demand and Utilization
Average Maximum
Demand Demand
Corridor Segment Public Rest Area /
Other Areas Legal
Capacity
Legally Parked Trucks
Illegally Parked Trucks Utilization
Legally Parked Trucks
Illegally Parked Trucks Utilization
I-82 Westbound Westbound MP 7 Scenic View 11 6 0 55% 11 3 127%
I-82 Westbound Westbound MP 17 0 0 2 * 0 2 *
I-82 Westbound Westbound Selah Creek 11 8 1 82% 11 6 155%
I-82 Westbound Westbound Prosser (bi-dir.) 7 6 1 100% 7 3 143%
I-82 Westbound Westbound MP 25-122 0 0 1 * 0 2 *
* Utilization cannot be calculated due to zero legal capacity
3 EXISTING CONDITIONS AT COMMERCIAL TRUCK STOPS
3.1 Commercial truck stop data collection
This section summarizes the Data Collection Efforts technical memorandum (June 3, 2005). Data was collected along the WSDOT truck parking study corridors of I-5, I-90, and I-82 to evaluate the existing supply and demand at commercial truck stops (CTSs). Data was collected by telephone survey and the survey locations were determined using a list of locations identified by WSDOT supplemented with internet and telephone book searches. In addition to collecting truck parking space and demand information, facility attributes that could affect the driver’s decision to park overnight at these facilities (services/amenities and fees) were also collected. Truck stops that did not offer overnight truck parking on a regular basis were removed from this data set. All CTS surveys were conducted between May 5th and May 19th of 2005.
A total of 18 truck stops were identified study corridors that offered overnight truck parking on a regular basis. A description of the truck stops is provided in Table 18 and their locations are shown on Figure 1. Washington State public rest areas (PRAs) are also shown on Figure 1 to show the proximity of PRAs and CTSs.

TECHNICAL MEMORANDUM (CONTINUED)
WSDOT 214-1631-048(02) Truck Parking Study 19 September 2005
Table 18. Commercial Truck Stops Located Along I-5, I-90, and I-82
City Truck Stop Name Exit Direction
Interstate 5 Blaine Yorky's Truck Stop 275 Northbound
Bellingham Yorky's Exxon 250 Southbound
Arlington Arlington Fuel Stop 208 Southbound
Marysville Donna's Truck Stop 202 Southbound
Tacoma Flying J Travel Plaza #05060 136 Southbound
Olympia Restover Truck Stop 99 Southbound
Toledo Gee Cee's Truck Stop 57 Southbound
Kalama Rebel Truck Stop 27 Northbound
Interstate 90 North Bend Seattle-East Auto/Truck Plaza 34 Westbound
Ellensburg Flying J Travel Plaza 109 Eastbound
Ellensburg Pilot Travel Center #389 109 Westbound
Moses Lake Ernie's Truck Stop # 9 179 Westbound
Ritzville Jake's Exxon 220 Westbound
Spokane Broadway Truck Stop - Geiger 276 Westbound
Spokane Broadway Flying J Travel Plaza 286 Westbound
Interstate 82 Union Gap Gear Jammers Truck Plaza 36 Eastbound
Prosser Horse Heaven Hills Travel Plaza 80 Eastbound
Note: The Sea-Port Petroleum Truck Stop is no longer included because it was determined to be too far from I-5 (it is located west of SR 99).
3.2 Commercial truck stop data analysis approach
The survey responses were qualitative and represent the employee’s best estimation of truck parking demand for an average day. The results of these surveys were not intended to be statistically significant. Survey responses collected for each facility were used to extrapolate average truck parking demand for the corridor segments and corridors. Segment cutpoints for the CTS data remained similar to the cutpoints identified for the public rest area analysis described in Section 2.2.2, above. Average and maximum demand and utilization was not calculated since the survey responses were representative of average conditions. The Direction classification in Table 18, above, was added in order to report the CTS data similarly to the PRA data. For example, on I-5, if the CTS was located on the west side of the freeway, its direction is shown as southbound. However, unlike most PRAs, CTSs are accessible to trucks traveling in both directions so this classification was made solely to allow comparisons with the PRA data.
3.3 Existing commercial truck stop truck parking conditions
The discussion below provides a summary of truck parking capacity and demand at CTSs along the study corridors. Additional detail is provided in the Data Collection Efforts technical memorandum (June 3, 2005).

TECHNICAL MEMORANDUM (CONTINUED)
WSDOT 214-1631-048(02) Truck Parking Study 20 September 2005
3.3.1 Corridor
Figure 2 summarizes CTS truck parking capacity and demand by corridor.
Figure 2. Year 2005 Truck Parking Demand at CTSs
555
521
187
470449
178
0
100
200
300
400
500
600
I-5 I-90 I-82
Freeway
No.
of T
ruck
Par
king
Spa
ces
CapacityDemand
As shown in Figure 2, nighttime truck parking is currently at approximately 85 percent of capacity on I-5, 86 percent of capacity on I-90, and 95 percent of capacity on I-82.
As mentioned in the PRA data discussion, direction of travel (northbound/southbound, eastbound/westbound) was recorded as a separate parameter because most PRAs are directly accessible only from one direction of travel. Commercial truck stops are slightly different in that they can be accessed from either direction but do require truckers to leave the freeway and travel on local streets with the associated inconveniences of traffic and signals. Truck drivers have consistently indicated that convenience is one of the primary factors for determining where they park and therefore it is assumed that truckers will generally not change direction to reach a facility.
Figure 3 shows truck parking capacity and demand at CTSs by direction, which illustrates that the truck parking supply is not evenly distributed by direction. There is considerably more truck parking available to truckers traveling southbound on I-5, westbound on I-90, and eastbound on I-82. There is no truck parking directly accessible to trucks traveling westbound on I-82, which requires trucks to travel on local streets to access the CTS on the opposite side of the freeway from their travel direction.

TECHNICAL MEMORANDUM (CONTINUED)
WSDOT 214-1631-048(02) Truck Parking Study 21 September 2005
Figure 3. Year 2005 Truck Parking Demand at CTSs (by direction)
441
373
187
80
450
105
178
76
391
79
0
50
100
150
200
250
300
350
400
450
500
I-5 Northbound I-5 Southbound I-90 Eastbound I-90 Westbound I-82 Eastbound
Freeway by Direction
No.
of T
ruck
Par
king
Spa
ces
CapacityDemand
3.3.2 Segment
As mentioned in the PRA data discussion, I-5 and I-90 were broken into segments since both corridors are relatively long and exhibit different truck travel patterns. The CTSs were assigned to the same segments for the I-5 and I-90 corridors and Figures 4 and 5 summarize year 2005 truck parking capacity and demand for each corridor. As with the PRA data, I-82 was not divided into segments and the capacity and demand are as shown above in Figure 3.
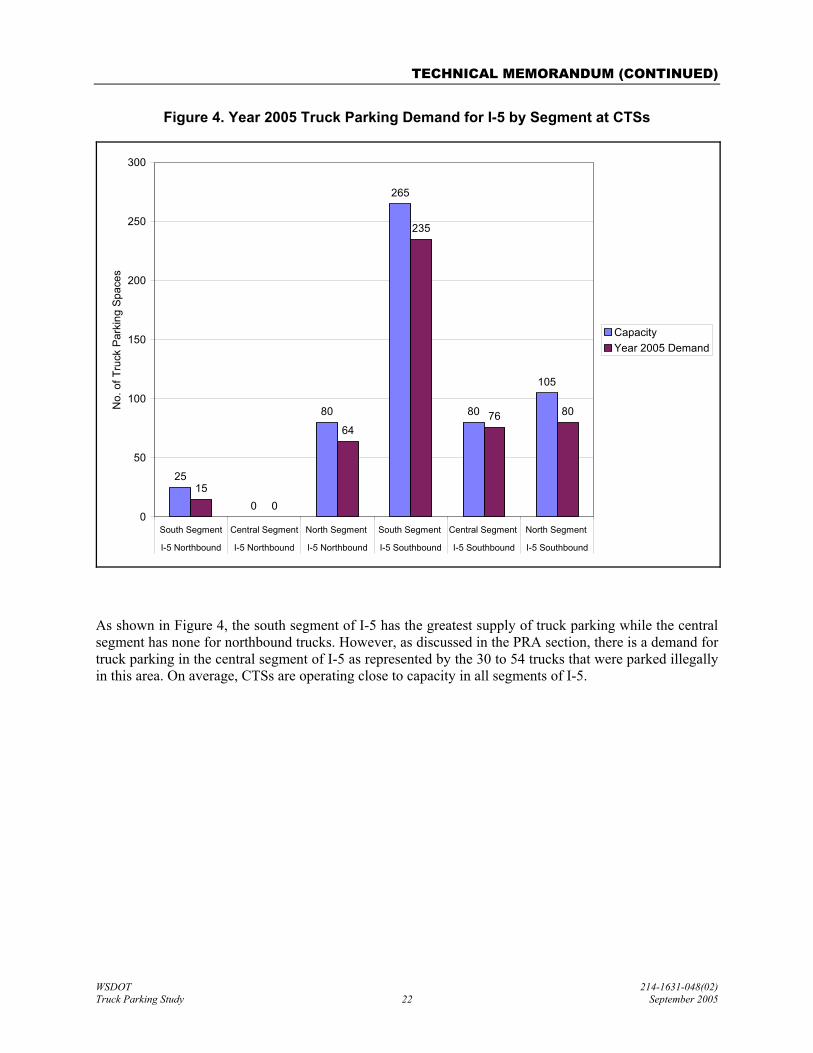
TECHNICAL MEMORANDUM (CONTINUED)
WSDOT 214-1631-048(02) Truck Parking Study 22 September 2005
Figure 4. Year 2005 Truck Parking Demand for I-5 by Segment at CTSs
25
0 0
105
80
265
80 8076
235
64
15
0
50
100
150
200
250
300
South Segment Central Segment North Segment South Segment Central Segment North Segment
I-5 Northbound I-5 Northbound I-5 Northbound I-5 Southbound I-5 Southbound I-5 Southbound
No.
of T
ruck
Par
king
Spa
ces
CapacityYear 2005 Demand
As shown in Figure 4, the south segment of I-5 has the greatest supply of truck parking while the central segment has none for northbound trucks. However, as discussed in the PRA section, there is a demand for truck parking in the central segment of I-5 as represented by the 30 to 54 trucks that were parked illegally in this area. On average, CTSs are operating close to capacity in all segments of I-5.

TECHNICAL MEMORANDUM (CONTINUED)
WSDOT 214-1631-048(02) Truck Parking Study 23 September 2005
Figure 5. Year 2005 Truck Parking Demand for I-90 by Segment for CTSs
0 0
80
175
266
76
166
207
0
50
100
150
200
250
300
West Segment East Segment West Segment East Segment
I-90 Eastbound I-90 Eastbound I-90 Westbound I-90 Westbound
No.
of T
ruck
Par
king
Spa
ces
CapacityYear 2005 Demand
As shown in Figure 5, the east segment of I-90 has the greatest supply of truck parking while the west segment has none for eastbound trucks. It is assumed that most trucks needing to stop in this segment use the CTS located on the north side of I-90. On average, CTSs are operating close to capacity in all segments of I-90.
3.3.3 Facility
As reported in the Data Collection Efforts technical memorandum (June 3, 2005), these truck stops were surveyed by telephone between May 5th and May 19th, 2005. The survey responses were qualitative and represent the employee’s best estimation of truck parking demand for an average night. For determining capacity, the employees were asked to quantify demand in terms of “percent full” and were given four response choices: 90 to 100 percent full, 70 to 90 percent full, 50 to 70 percent full and less than 50 percent full. These responses were used to determine the average truck parking demand by applying these percentages to the total number of truck parking stalls available at the facility. Because the response choices indicated a range, the following midpoint percentages were used to represent each range:
• 90 to 100 percent full = 95 percent
• 70 to 90 percent full = 80 percent
• 50 to 70 percent full = 60 percent
• <50 percent full = not applicable (no responses)

TECHNICAL MEMORANDUM (CONTINUED)
WSDOT 214-1631-048(02) Truck Parking Study 24 September 2005
Therefore, if a facility had 100 truck parking spaces and responded that they were 70 to 90 percent full on an average night, then the demand was determined to be 80 percent of 100, or 80 spaces occupied on an average night. Table 19 below shows Year 2005 truck parking capacity and estimated demand at the CTSs.
Table 19. Year 2005 Survey Results for Truck Parking Capacity and Demand at Commercial Truck Stops
City Truck Stop Name Capacity Average % Full Demand
Interstate 5 Blaine Yorky's Truck Stop 80 80 64
Bellingham Yorky's Exxon 17 80 14
Arlington Arlington Fuel Stop 8 80 6
Marysville Donna's Truck Stop 80 80 64
Tacoma Flying J Travel Plaza #05060 80 95 76
Olympia Restover Truck Stop 115 80 92
Toledo Gee Cee's Truck Stop 150 95 143
Kalama Rebel Truck Stop 25 60 15
Interstate 82 Union Gap Gear Jammers Truck Plaza 162 95 154
Prosser Horse Heaven Hills Travel Plaza 25 95 24
Interstate 90 North Bend Seattle-East Auto/Truck Plaza 175 95 166
Ellensburg Flying J Travel Plaza 80 95 76
Ellensburg Pilot Travel Center #389 89 95 85
Moses Lake Ernie's Truck Stop # 9 100 60 60
Ritzville Jake's Exxon 50 60 30
Spokane Broadway Truck Stop - Geiger 2 95 2
Spokane Broadway Flying J Travel Plaza 75 80 60
Totals 1,313 84% 1,131
As shown in Table 19, the survey results suggest that there is some available truck parking capacity. Again, utilization was estimated and it is likely that, during peak times, truck parking demand exceeds capacity at those CTSs that indicated that they were 90 to 100 percent full on an average day.
4 EXISTING CONDITIONS OF TOTAL TRUCK PARKING COMBINING PRA AND CTS FACILITIES
4.1 Combined PRA and CTS data collection
Data collected by WSDOT and used for the PRA analysis in Section 2, above, and data used for the Data Collection Efforts technical memorandum were used to evaluate the total truck parking demand for the study corridors.

TECHNICAL MEMORANDUM (CONTINUED)
WSDOT 214-1631-048(02) Truck Parking Study 25 September 2005
4.2 Combined PRA and CTS data analysis approach
As described in Section 3.3, CTSs were given a directional classification for the sole purpose of standardizing CTS data with PRA data. Data from the PRA and CTS analyses were combined to provide the total corridor and segment truck parking capacity and demand. Individual facility demand and utilization rates are described in their respective sections.
4.3 Existing combined PRA and CTS truck parking conditions
Total truck parking capacity and demand for PRAs and CTSs was calculated for each study corridor, segment, and facility.
4.3.1 Corridor
When combined with the WSDOT survey data for PRAs, the data indicate that there is currently available truck parking capacity on all of the study corridors. Figure 6 shows the combined total for nighttime truck parking capacity and demand along the study corridors. Two total demand numbers are shown, the average and the maximum. The average and maximum demand distinction is for the PRA data only (as described under Section 2.2 What approach was taken to analyze the public rest area data?, above) as averages are all that are available for the CTS data. The demand data also includes the number of illegally parked trucks that were observed during the PRA surveys in order to determine if they could be accommodated within the existing truck parking supply.
Figure 6. Year 2005 Total Truck Parking Capacity and Demand (PRAs and CTSs)
741694
239
699
612
220
897
751
260
0
100
200
300
400
500
600
700
800
900
1000
I-5 I-90 I-82
Freeway
No.
of T
ruck
Par
king
Spa
ces
Total CapacityTotal Demand (Ave)Total Demand (Max)
As shown in Figure 6, on average, nighttime truck parking is currently at approximately 94 percent of capacity on I-5, 92 percent of capacity on I-82 and 88 percent of capacity on I-90. Additionally, during peak times, truck parking demand can exceed capacity along all of the study corridors.

TECHNICAL MEMORANDUM (CONTINUED)
WSDOT 214-1631-048(02) Truck Parking Study 26 September 2005
Figure 7 shows the nighttime truck parking demand by direction for each of the study corridors.
Figure 7. Year 2005 Total Truck Parking Capacity and Demand by Direction (PRAs and CTSs)
450
586
29
513
208
533
181210205
494
162201
19
224
517
234
311
36
0
100
200
300
400
500
600
700
I-5 Northbound I-5 Southbound I-90 Eastbound I-90 Westbound I-82 Eastbound I-82 Westbound
Freeway by Direction
No.
of T
ruck
Par
king
Spa
ces
Total CapacityTotal Demand (Ave)Total Demand (Max)
As shown in Figure 7, even with PRAs, there is still a discrepancy in the amount of truck parking that is directly accessible from both directions. With the PRAs included, some truck parking (29 spaces) is provided for trucks traveling westbound on I-82. On a typical night, truck parking capacity meets or exceeds demand but during peak times, truck parking demand can exceed capacity on all of the study corridor in both directions.
4.3.2 Segment
Figure 8 shows the average and maximum total truck parking demand for both northbound and southbound I-5. As shown in Figure 8, the south segment of I-5 has the most truck parking spaces. Also, the central segment of I-5 does not have any truck parking spaces but there is demand for at least 30 spaces as there were 30 trucks parked illegally in this segment. It was observed that truck parking demand meets or exceeds capacity in all segments.

TECHNICAL MEMORANDUM (CONTINUED)
WSDOT 214-1631-048(02) Truck Parking Study 27 September 2005
Figure 8. Year 2005 Total Truck Parking Capacity and Demand for I-5 by Segment (PRAs and CTSs)
86
0
30
54
321
139140
80
313
122114
99
283
9580
130 127 126
0
50
100
150
200
250
300
350
South Segment Central Segment North Segment South Segment Central Segment North Segment
I-5 Northbound I-5 Northbound I-5 Northbound I-5 Southbound I-5 Southbound I-5 Southbound
No.
of T
ruck
Par
king
Spa
ces
CapacityDemand (Ave)Demand (Max)

TECHNICAL MEMORANDUM (CONTINUED)
WSDOT 214-1631-048(02) Truck Parking Study 28 September 2005
Figure 9 shows the average and maximum total truck parking demand for both eastbound and westbound I-90. As shown in Figure 9, the east segment of I-90 has the most truck parking spaces. It was observed that truck parking demand meets or exceeds capacity in all segments, except for I-90 eastbound in the east segment.
Figure 9. Year 2005 Total Truck Parking Capacity and Demand for I-90 by Segment (PRAs and CTSs)
52
203
310
46
118
208
241
155
246
271
129
79
0
50
100
150
200
250
300
350
West Segment East Segment West Segment East Segment
I-90 Eastbound I-90 Eastbound I-90 Westbound I-90 Westbound
No.
of T
ruck
Par
king
Spa
ces
CapacityDemand (Ave)Demand (Max)
4.3.3 Facility
Facility information for PRAs (Sections 2.3.3 and 2.4.3) and CTSs (Section 3.3.3) are discussed previously in their respective sections.
5 INTERVIEWS
5.1 Survey results
WSDOT composed a survey of five questions and presented them to users at the Smokey Point (northbound), SeaTac (northbound), Maytown (southbound), Scatter Creek (northbound), Toutle River (northbound and southbound), Indian John Hill (eastbound and westbound), Sprague Lake (eastbound and westbound), and Selah Creek (eastbound) PRAs. Table 20 provides a summary of the responses.

TECHNICAL MEMORANDUM (CONTINUED)
WSDOT 214-1631-048(02) Truck Parking Study 29 September 2005
Table 20. Commercial Trucker Survey and Responses
Total
Responded Percent
1) Why did you choose this rest area rather than a private truck stop? Convenience 397 89% Don't know where truck stop is 4 1% Truck stop full 44 10%
445
2) Why are you parked at this location rather than a rest area or a private truck stop? Convenience 6 11% Rest area full 37 70% Truck Stop full 8 15% Hours-of-service time up 0 0% Didn't know where else to park 2 4%
53
3) How long did you stay? Less than 1 hour 213 48% 1-4 hours 16 4% 4-6 hours 6 1% Overnight 210 47%
445
4) What is your destination? Port 8 2% Home 0 0% Commercial distribution center 437 98%
445
5) What is the biggest influence on your decision where to park for breaks? Exceeded allowable time on driving 27 6% Likelihood of next commercial truck stop or public rest area at/over capacity 85 19% Convenience 291 65% Services/amenities offered 42 9%
445
6 FORECASTING METHODOLOGY
6.1 Forecasted truck parking demand estimates
The future truck parking demand is estimated by multiplying existing truck parking demand by a growth factor developed from I-5, I-90, and I-82.
6.2 Development of growth factors
The growth factors for I-5, I-90, and I-82 have been determined from annual growth rates observed in historical data and future forecasts in related data, such as truck volumes or port freight activities. The sources of data used to estimate future growth in demand include:

TECHNICAL MEMORANDUM (CONTINUED)
WSDOT 214-1631-048(02) Truck Parking Study 30 September 2005
• Historical growth in total traffic on I-5, I-90, and I-82
• Historical truck volume data on I-5, I-90, and I-82 from the Strategic Freight Transportation Analysis (SFTA) and Eastern Washington Inter-modal Transportation Study (EWITS) databases
• Historical truck volume data on I-5, I-90, and I-82 from WSDOT’s Weigh-In-Motion (WIM) recorders
• Freight forecasts for the Port of Seattle and Port of Tacoma
• FHWA Study of Adequacy of Parking Facilities
• “Washington Transportation Plan Freight Systems” presentation given at the King County Freight Summit on June 30, 2005
6.3 Total traffic growth on I-5, I-90, and I-82
This data provides a general magnitude and historical reference of traffic growth occurring on the corridors (all less than 4 percent annually on average), a portion of which may be attributed to truck traffic. Corridor traffic volumes on I-5, I-90, and I-82 were obtained from the WSDOT. On I-5 between the Canadian border and Arlington in Snohomish County, historical growth rates have been averaging approximately 0.9 percent per year; between Arlington and the Oregon border, historical growth rates have been typically averaging 2.2 percent. I-90 has had the highest traffic growth, with an average of 3.8 percent between Seattle and SR 18, 3.1 percent between SR 18 and Ellensburg, and 2.7 percent from Ellensburg to Idaho. On I-82 between Ellensburg and Prosser, the historical growth rates have been approximately 2.4 percent, however, between Prosser and the Oregon border, the historical growth rates have typically been almost 1 percent higher, coming in at 3.2 percent for most of the corridor.
6.4 Historical truck volume data from the SFTA and EWITS databases
The EWITS database contains information collected in 1993/1994 and the SFTA database contains data collected 2003/2004, which allows for a 10-year comparison of truck traffic. These databases allow for separating growth from truck traffic making interstate trips (longer distance trips between Washington and other states) and intrastate trips (trips within Washington).
The growth in interstate trips, rather than that for intrastate trips was used in the growth rate estimates; this was done because interstate trips are the trip type most likely to require use of the PRA parking facilities. Intrastate trips may have more flexibility in timing their trips to avoid congestion at PRA facilities and may be making shorter duration incidental stops at the rest area parking facilities.
Comparing the truck data, truck traffic has grown the most on I-90 (6.3 percent), followed by I-5 (3.1 percent) and I-82 (1.8 percent).
6.5 Historical truck volume data from the WSDOT WIM database
Historical truck volume data on I-5, I-90, and I-82 from the WSDOT Weigh-In-Motion database was provided for various recorder locations. Double-unit (4-6 axle trucks) and triple-unit (5-7 or more axles) truck volumes were used for the growth rate comparisons and single-unit trucks (2-4 axle) were not included in the data set because that truck type is generally for more local trips not requiring the use of PRA facilities. In general, truck growth varied somewhat at different locations, but averaged approximately 5 percent annually when combined for the three interstate highways.

TECHNICAL MEMORANDUM (CONTINUED)
WSDOT 214-1631-048(02) Truck Parking Study 31 September 2005
6.6 Port of Seattle and Port of Tacoma freight forecasts
The Port of Seattle and Port of Tacoma are truck-generating land uses of a substantial size in the Puget Sound region, and can be used as indicators/samples of future freight growth regionally and statewide. The forecasted growth in Port truck traffic is assumed to have some relationship to truck parking demand growth.
The Port of Seattle currently moves 2 million TEUs (twenty-foot equivalents units) annually through its terminals and is expected to reach 3 million TEUs within the next decade. When the Port reaches 3 million TEUs, its average daily truck volumes are expected to increase to 1,000 trucks traveling to and from I-90 (a 30 percent increase), 630 trucks traveling to and from I-5 north of I-90 (a 40 percent increase), and 1,320 trucks traveling to and from I-5 south of Albro Street (a 40 percent increase). A portion of the I-90 increase would extend to I-82. This would result in an annual truck traffic increase of 3 to 4 percent per year.
The Port of Tacoma expects 2.26 TEUs to pass through its facility in the year 2005. This amount of freight would result in 700,000 annual truck trips and nearly 2,700 daily truck trips in 2005. Truck traffic is forecasted to increase by approximately 5 percent annually (linear growth rate) between 2005 and 2020. Recent TEU growth has exceeded the forecasts and if it continues to grow at the same rate, the Port of Tacoma would expect to reach 6 million TEUs by the year 2012 instead of by the year 2020. Ninety-five percent of the Port of Tacoma truck volumes come from within the Pacific Northwest (Washington, Oregon, Idaho). Truck traffic destined to the east typically does not go any farther than Montana.
6.7 FHWA Study of Adequacy of Parking Facilities
The national 20-year forecasted annual increase in parking demand is estimated to be 2.7 percent. The national estimated growth rate of truck parking spaces at PRAs is estimated to be only 1 percent annually while the national estimated growth rate of truck parking spaces at commercial truck stops and travel plazas is expected to be 6.5 percent annually. According to the FHWA study, Washington’s 20-year forecasted annual increase in parking demand is 2.1 percent. These growth rates provide additional information for determining a reasonable growth rate to be used in this study.
6.8 The “Washington Transportation Plan Freight Systems” presentation
The presentation did not provide specific information on I-82; however, data was presented for I-5 and I-90. The slide titled “Freight Volumes in Washington are Growing Twice as Fast as the State’s Population” showed that truck traffic is forecasted to grow approximately 3.1 percent annually on I-5 and 2.6 percent on I-90 annually between 2003 and 2020. A slide titled “Address Freight Constraints in the I-5 Corridor – What is the Problem?” provided additional information for I-5 that showed in 10 years of growth from 1993 to 2003, truck trips increased by 94 percent; thus, the resulting annual compounded growth rate would be approximately 3.5 percent per year.
6.9 Growth rates used in this analysis
After comparing the data, truck parking demand is estimated to grow annually at a compounded rate of 3.5 percent on I-5, 4.0 percent on I-90, and 3.5 percent on I-82. Table 21 below summarizes all of the data that was used to arrive at these estimates.

WSDOT 214-1631-048(02) Truck Parking Study 32 September 2005
Table 21. Forecasted Truck Growth Rates
Annual Growth Rate
Source Units I-5 I-90 I-82 EWITS (1993/1994) & SFTA (2003/2004) Data interstate trucks/day 3.1% 6.3% 1.8%
Freight Summit Slide - "Freight Volumes in Washington are Growing Twice as Fast as the State's Population" (truck trip increase forecast 2003-2020)
truck trips 3.1% 2.6% n/a
Freight Summit Slide "Address Freight Constraints in the I-5 Corridor What is the Problem?" (truck trip increase 1993-2003)
truck trips 3.5% n/a n/a
Port of Seattle forecasts (approximately 2005-2015) average daily truck volumes 2.7% 2.7% 2.7%
Port of Tacoma forecasts (2005-2020) annual truck trips 3.8% 3.8% 3.8%
FHWA Study of Adequacy of Parking Facilities WA 20-year forecasted increase in parking demand
2.1% 2.1% 2.1%
WSDOT Automated Data Collection Sites
I-5: Canada to Arlington, WA sampling of growth rates 0.9%
I-5: Arlington to Oregon State sampling of growth rates 2.2%
I-82: Ellensburg to Prosser sampling of growth rates 2.4%
I-82: Prosser to Oregon State sampling of growth rates 3.2%
I-90: Seattle to SR 18 sampling of growth rates 3.2%
I-90: SR 18 to Ellensburg sampling of growth rates 3.8%
I-90: Ellensburg to Idaho sampling of growth rates 2.7%
WIM Data
I-5 North of Kelso Weigh Station -- Kelso -- MP 44.30
Average day double unit & triple unit truck trips
4.2%
I-5 at Boulevard Rd Undercrossing -- Olympia/Boulevard -- MP 106.7
Average day double unit & triple unit truck trips
7.9%
I-5 at NE 185th St Undercrossing -- Seattle/185th -- MP 176.72
Average day double unit & triple unit truck trips
2.9%
I-5 North of 164th St Saw -- Everett -- MP 184.48
Average day double unit & triple unit truck trips
3.3%
I-82 North of SR 024 Interchange -- Yakima -- MP 34.02
Average day double unit & triple unit truck trips
3.6%
I-82 West of SR 022 -- MP 48.5
Average day double unit & triple unit truck trips
9.8%
I-82 West of Coffin Rd -- Plymouth -- MP 121.20
Average day double unit & triple unit truck trips
2.1%
I-90 West of Cle Elum Off Ramp MP 82.70
Average day double unit & triple unit truck trips
6.6%
I-90 West of SR 395 Interchange -- Ritzville #1 -- MP 18.83
Average day double unit & triple unit truck trips
3.9%
I-90 West of Idaho Rd Interchange -- Stateline -- MP 298.4
Average day double unit & triple unit truck trips
4.9%
average 3.3% 3.9% 3.5% Therefore, use: 3.5% 4.0% 3.5%

WSDOT 214-1631-048(02) Truck Parking Study 33 September 2005
6.10 Alternative methodologies
The Transportation & Mobility Planning Division of the Virginia Department of Transportation (VDOT) reviewed and updated a macroscopic corridor-level parking demand model for rest areas that was originally developed by the Minnesota DOT (MnDOT) and was based on data collected in Minnesota. The American Association of State Highway and Transportation Officials (AASHTO) recommended this model for use in estimating required truck parking spaces in developing plans for statewide rest areas. It requires the following inputs:
• Average daily traffic (ADT) with access to rest area
• Total percentage of mainline traffic stopping at rest area
• Design hour usage; design hour compares the design hourly volume, usually the 30th to 50th highest hourly volume, to the annual ADT, producing a factor that predicts a peak usage average-hour situation
• Percentage of truck parking spaces
• Peak factor; this is the ratio of average day of 5 summer months to average day of year
• Number of vehicles parked per hour per space (turnover).
The MnDOT/VDOT model considers only the impact of traffic flow along the mainline to estimate the truck parking demand. Many other non-traffic factors that may affect the demand, such as location, food facilities, lighting, and parking spaces available at nearby truck stops, are not considered. Additionally, use of this model would have still presented a need to estimate a volume growth rate and would require additional assumptions beyond a growth rate. Therefore, for this study, use of this model did not appear to be a better approach than estimating the parking demand growth based on trends in related data.
7 YEAR 2030 CONDITIONS AT PUBLIC REST AREAS
7.1 Year 2030 truck growth at PRAs
As described in the Forecasting Methodology, above, truck volumes, and therefore truck parking demand, were calculated to have a 3.5 percent compounding growth rate through 2030 along I-5 and I-82. The growth rate along I-90 is expected to be slightly higher; 4.0 percent.
7.2 Year 2030 PRA daytime truck parking conditions
Similar to the existing conditions analysis, Year 2030 truck parking demand was evaluated at the corridor, segment, and facility levels of analysis.
7.2.1 Corridor
Assuming no additional capacity is added, the forecasted average daytime truck parking utilization for eastbound and westbound I-90 and westbound I-82 are expected to remain below full capacity. Additionally, the westbound I-82 maximum daytime truck parking utilization will also be below 100 percent. Southbound I-5 (245 percent) and eastbound I-82 (230 percent) are expected to have the highest maximum utilization rates. Table 22 provides the existing and future corridor truck parking utilization rates.

TECHNICAL MEMORANDUM (CONTINUED)
WSDOT 214-1631-048(02) Truck Parking Study 34 September 2005
Table 22. Daytime Existing and Future Corridor Utilization
Average Maximum
Existing Future 2030 Existing Future 2030
Corridor Legal
Capacity Demand Utilization Demand Utilization Demand Utilization Demand Utilization I-5 Northbound 103 64 62% 150 146% 89 86% 209 203%
I-5 Southbound 83 63 76% 150 181% 86 104% 203 245%
I-90 Eastbound 101 31 31% 83 82% 47 47% 125 124%
I-90 Westbound 72 25 35% 66 92% 48 67% 128 178%
I-82 Eastbound 23 11 48% 26 113% 23 100% 53 230%
I-82 Westbound 29 11 38% 26 90% 19 66% 44 152%
7.2.2 Segment
As shown in Table 23, below, the north segment of southbound I-5, the east segment of eastbound I-90, and east segment of westbound I-90 are forecasted to have daytime average utilization rates less than 100 percent in Year 2030. The east segment of eastbound I-90 would have a maximum utilization rate of 76 percent, but all other segments would exceed available capacity and result in utilization rates between 120 percent (north segment of southbound I-5) and 229 percent (west segment of westbound I-90). The central segment of I-5, which does not have any legal truck parking capacity, would have a combined daytime average parking demand of 71 trucks and a maximum demand of 102 trucks in Year 2030.
Table 23. Daytime Existing and Future Segment Truck Parking Demand and Utilization
Average Maximum
Existing Future 2030 Existing Future 2030
Corridor Segment Legal
Capacity Demand Utilization Demand Utilization Demand Utilization Demand Utilization I-5 Northbound South 61 27 44% 63 103% 37 61% 86 141%
I-5 Northbound Central 0 15 * 35 * 18 * 43 *
I-5 Northbound North 42 22 52% 52 124% 34 81% 80 190%
I-5 Southbound North 35 14 40% 33 94% 18 51% 42 120%
I-5 Southbound Central 0 15 * 36 * 25 * 59 *
I-5 Southbound South 48 34 71% 81 169% 43 90% 102 213%
I-90 Eastbound West 52 22 42% 59 113% 33 63% 88 169%
I-90 Eastbound East 49 9 18% 24 49% 14 29% 37 76%
I-90 Westbound East 44 11 25% 29 66% 24 55% 64 145%
I-90 Westbound West 28 14 50% 37 132% 24 86% 64 229%
* Utilization cannot be calculated due to zero legal capacity
7.2.3 Facility
Northbound Interstate 5
Gee Creek (south segment), Toutle River (south segment), and Custer (north segment) are forecasted to provide adequate daytime capacity in 2030. Scatter Creek (south segment), Smokey Point (north
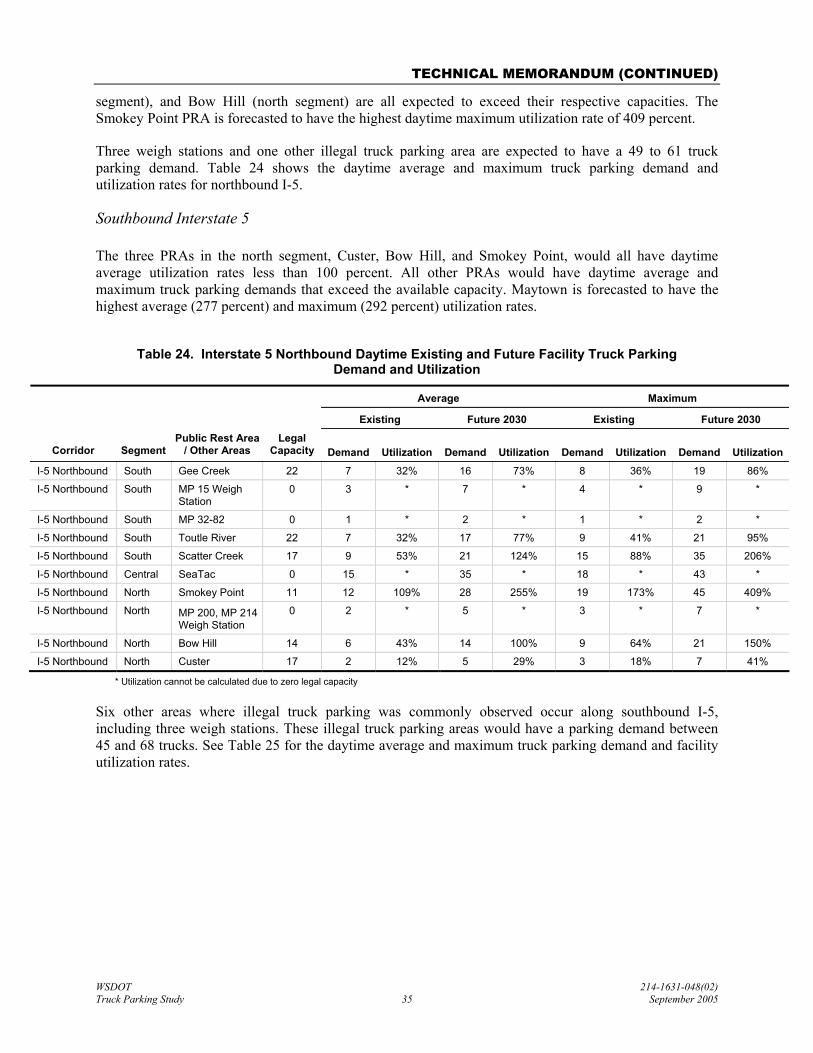
TECHNICAL MEMORANDUM (CONTINUED)
WSDOT 214-1631-048(02) Truck Parking Study 35 September 2005
segment), and Bow Hill (north segment) are all expected to exceed their respective capacities. The Smokey Point PRA is forecasted to have the highest daytime maximum utilization rate of 409 percent.
Three weigh stations and one other illegal truck parking area are expected to have a 49 to 61 truck parking demand. Table 24 shows the daytime average and maximum truck parking demand and utilization rates for northbound I-5.
Southbound Interstate 5
The three PRAs in the north segment, Custer, Bow Hill, and Smokey Point, would all have daytime average utilization rates less than 100 percent. All other PRAs would have daytime average and maximum truck parking demands that exceed the available capacity. Maytown is forecasted to have the highest average (277 percent) and maximum (292 percent) utilization rates.
Table 24. Interstate 5 Northbound Daytime Existing and Future Facility Truck Parking Demand and Utilization
Average Maximum
Existing Future 2030 Existing Future 2030
Corridor Segment Public Rest Area
/ Other Areas Legal
Capacity Demand Utilization Demand Utilization Demand Utilization Demand Utilization
I-5 Northbound South Gee Creek 22 7 32% 16 73% 8 36% 19 86%
I-5 Northbound South MP 15 Weigh Station
0 3 * 7 * 4 * 9 *
I-5 Northbound South MP 32-82 0 1 * 2 * 1 * 2 *
I-5 Northbound South Toutle River 22 7 32% 17 77% 9 41% 21 95%
I-5 Northbound South Scatter Creek 17 9 53% 21 124% 15 88% 35 206%
I-5 Northbound Central SeaTac 0 15 * 35 * 18 * 43 *
I-5 Northbound North Smokey Point 11 12 109% 28 255% 19 173% 45 409%
I-5 Northbound North MP 200, MP 214 Weigh Station
0 2 * 5 * 3 * 7 *
I-5 Northbound North Bow Hill 14 6 43% 14 100% 9 64% 21 150%
I-5 Northbound North Custer 17 2 12% 5 29% 3 18% 7 41%
* Utilization cannot be calculated due to zero legal capacity
Six other areas where illegal truck parking was commonly observed occur along southbound I-5, including three weigh stations. These illegal truck parking areas would have a parking demand between 45 and 68 trucks. See Table 25 for the daytime average and maximum truck parking demand and facility utilization rates.

TECHNICAL MEMORANDUM (CONTINUED)
WSDOT 214-1631-048(02) Truck Parking Study 36 September 2005
Table 25. Interstate 5 Southbound Daytime Existing and Future Facility Truck Parking Demand and Utilization
Average Maximum
Existing Future 2030 Existing Future 2030
Corridor Segment
Public Rest Area / Other
Areas Legal
Capacity Demand Utilization Demand Utilization Demand Utilization Demand Utilization
I-5 Southbound North Custer 11 4 36% 9 82% 5 45% 12 109%
I-5 Southbound North Bow Hill 13 5 38% 12 92% 6 46% 14 108%
I-5 Southbound North MP 235 Weigh Station 0 1 * 2 * 1 * 2 *
I-5 Southbound North Smokey Point 11 4 36% 10 91% 6 55% 14 127%
I-5 Southbound Central Silver Lake 0 10 * 24 * 17 * 40 *
I-5 Southbound Central MP 141 Weigh Station 0 3 * 7 * 5 * 12 *
I-5 Southbound Central MP 116 0 2 * 5 * 3 * 7 *
I-5 Southbound South MP 99 0 1 * 2 * 1 * 2 *
I-5 Southbound South Maytown 13 15 115% 36 277% 16 123% 38 292%
I-5 Southbound South MP 81 & 60 0 2 * 5 * 2 * 5 *
I-5 Southbound South Toutle River 24 10 42% 24 100% 16 67% 38 158%
I-5 Southbound South Gee Creek 11 6 55% 14 127% 8 73% 19 173%
* Utilization cannot be calculated due to zero legal capacity
Eastbound Interstate 90
As detailed in Table 26, below, Indian John Hill is the only PRA along eastbound I-90 expected to have an average parking demand higher than this corridor’s capacity. Both Indian John Hill, which has the highest maximum utilization rate of 139 percent, and Ryegrass (144 percent), would have maximum utilization rates above their capacities.
One weigh station, a traveler’s rest area, and two other areas that repeatedly had illegally parked trucks would realize increased daytime demand between 22 and 33 trucks.
Table 26. Interstate 90 Eastbound Daytime Existing and Future Facility Truck Parking Demand and Utilization
Average Maximum
Existing Future 2030 Existing Future 2030
Corridor Segment Public Rest Area /
Other Areas Legal
Capacity Demand Utilization Demand Utilization Demand Utilization Demand Utilization
I-90 Eastbound West Traveler's Rest 0 3 * 8 * 4 * 11 *
I-90 Eastbound West MP 56 & 115 0 3 * 8 * 6 * 16 *
I-90 Eastbound West MP 79 Weigh Station 0 1 * 3 * 1 * 3 *
I-90 Eastbound West Indian John Hill 23 9 39% 24 104% 12 52% 32 139%
I-90 Eastbound West Price Creek 20 3 15% 8 40% 5 25% 13 65%
I-90 Eastbound West Rye Grass 9 3 33% 8 89% 5 56% 13 144%
I-90 Eastbound East Winchester 12 2 17% 5 42% 3 25% 8 67%
I-90 Eastbound East Schrag 17 3 18% 8 47% 5 29% 13 76%
I-90 Eastbound East MP 231 0 1 * 3 * 1 * 3 *
I-90 Eastbound East Sprague Lake 20 3 15% 8 40% 5 25% 13 65%
* Utilization cannot be calculated due to zero legal capacity

TECHNICAL MEMORANDUM (CONTINUED)
WSDOT 214-1631-048(02) Truck Parking Study 37 September 2005
Westbound Interstate 90
All PRAs along westbound I-90 would have daytime average utilization rates less than 100 percent. With the exception of Schrag (65 percent), however, all of these PRAs would experience truck parking demand higher than their available capacities. Sprague Lake (east segment) is forecasted to have the highest utilization rate; 213 percent.
Two areas observed to have frequently parked trucks would add a truck parking demand between eight to 10 trucks to this corridor. Table 27 shows the daytime average and maximum truck parking demand and utilization rates for both the existing conditions and the forecasted year 2030.
Table 27. Interstate 90 Westbound Daytime Existing and Future Facility Truck Parking Demand and Utilization
Average Maximum
Existing Future 2030 Existing Future 2030
Corridor Segment Public Rest Area /
Other Areas Legal
Capacity Demand Utilization Demand Utilization Demand Utilization Demand Utilization
I-90 Westbound East Sprague Lake 15 5 33% 13 87% 12 80% 32 213%
I-90 Westbound East Schrag 17 3 18% 8 47% 4 24% 11 65%
I-90 Westbound East Winchester 12 2 17% 5 42% 6 50% 16 133%
I-90 Westbound East MP 231, 143, 139 0 1 * 3 * 2 * 5 *
I-90 Westbound West Rye Grass 9 2 22% 5 56% 5 56% 13 144%
I-90 Westbound West Indian John Hill 19 6 32% 16 84% 10 53% 27 142%
I-90 Westbound West MP 80 Weigh Station 0 2 * 5 * 2 * 5 *
I-90 Westbound West MP 56 0 4 * 11 * 7 * 19 *
* Utilization cannot be calculated due to zero legal capacity
Eastbound Interstate 82
Table 28 shows that Prosser (bi-directional) would have the highest daytime average (171 percent) and maximum (271 percent) and utilization rates. The other two PRAs, Selah Creek and MP 7 Scenic View, would provide sufficient capacity on average (between 40 and 45 percent utilization), but would experience above capacity demand during peak periods.
A weigh station and another illegal truck parking area would contribute between seven and 11 trucks to the demand of eastbound I-82.
Table 28. Interstate 82 Eastbound Daytime Existing and Future Facility Truck Parking Demand and Utilization
Average Maximum
Existing Future 2030 Existing Future 2030
Corridor Segment Public Rest Area /
Other Areas Legal
Capacity Demand Utilization Demand Utilization Demand Utilization Demand Utilization
I-82 Eastbound Eastbound Prosser (bi-dir.) 7 5 71% 12 171% 8 114% 19 271%
I-82 Eastbound Eastbound MP 76 Weigh Station 0 2 * 5 * 4 * 9 *
I-82 Eastbound Eastbound Selah Creek 11 2 18% 5 45% 7 64% 16 145%
I-82 Eastbound Eastbound MP 17 & 44 0 1 * 2 * 1 * 2 *
I-82 Eastbound Eastbound MP 7 Scenic View 5 1 20% 2 40% 3 60% 7 140%
* Utilization cannot be calculated due to zero legal capacity

TECHNICAL MEMORANDUM (CONTINUED)
WSDOT 214-1631-048(02) Truck Parking Study 38 September 2005
Westbound Interstate 82
With the exception of Prosser, which is bi-directional, the daytime maximum demand of Selah Creek is forecasted to be the only occurrence where truck parking demand would exceed capacity (127 percent) in Year 2030.
Approximately two illegally parked trucks are expected to occur outside of the PRAs for any given day.
Table 29 provides a breakdown of the daytime average and maximum truck parking demand and utilization rates.
Table 29. Interstate 82 Westbound Daytime Existing and Future Facility Truck Parking Demand and Utilization
Average Maximum
Existing Future 2030 Existing Future 2030
Corridor Segment Public Rest Area
/ Other Areas Legal
Capacity Demand Utilization Demand Utilization Demand Utilization Demand Utilization
I-82 Westbound Westbound MP 7 Scenic View 11 2 18% 5 45% 4 36% 9 82%
I-82 Westbound Westbound Selah Creek 11 3 27% 7 64% 6 55% 14 127%
I-82 Westbound Westbound MP 17 & 88 0 1 * 2 * 1 * 2 *
I-82 Westbound Westbound Prosser (bi-dir.) 7 5 71% 12 171% 8 114% 19 271%
* Utilization cannot be calculated due to zero legal capacity
7.3 Year 2030 PRA nighttime truck parking conditions
Year 2030 nighttime forecasts are markedly different than daytime truck parking demand and utilization rates.
7.3.1 Corridor
Year 2030 nighttime truck parking demands for the study corridors are forecasted to be substantially higher than existing capacities. The lowest average utilization rate (200 percent) is expected to occur along westbound I-82, and the highest maximum demand would be along southbound I-5 and produce a utilization rate of 554 percent. Table 30 shows the nighttime average and maximum truck parking demand and utilization rates.
Table 30. Nighttime Existing and Future Corridor Utilization
Average Maximum
Existing Future 2030 Existing Future 2030
Corridor Legal
Capacity Demand Utilization Demand Utilization Demand Utilization Demand Utilization I-5 Northbound 103 126 122% 295 286% 232 225% 547 531%
I-5 Southbound 83 105 127% 249 300% 195 235% 460 554%
I-90 Eastbound 101 88 87% 234 232% 158 156% 421 417%
I-90 Westbound 72 76 106% 202 281% 144 200% 383 532%
I-82 Eastbound 23 22 96% 51 222% 46 200% 110 478%
I-82 Westbound 29 25 86% 58 200% 45 155% 107 369%

TECHNICAL MEMORANDUM (CONTINUED)
WSDOT 214-1631-048(02) Truck Parking Study 39 September 2005
7.3.2 Segment
Truck parking demand is forecasted to exceed existing capacity for all segments of the study corridors at night. The north segment of northbound I-5 is expected to have the lowest nighttime average utilization rate (174 percent), and the west segment of westbound I-90 is projected to have the highest maximum utilization rate (761 percent). The central segment of I-5, which does not have any legal truck parking capacity, would have an average demand of 125 trucks, and a maximum demand of 246 trucks (north and southbound combined). The existing and future 2030 nighttime average and maximum utilization rates for each segment is summarized in Table 31.
Table 31. Nighttime Existing and Future 2030 Segment Truck Parking Demand and Utilization
Average Maximum
Existing Future 2030 Existing Future 2030
Corridor Segment Legal
Capacity Demand Utilization Demand Utilization Demand Utilization Demand UtilizationI-5 Northbound South 61 65 107% 152 249% 115 189% 271 444%
I-5 Northbound Central 0 30 * 70 * 54 * 128 *
I-5 Northbound North 42 31 74% 73 174% 63 150% 148 352%
I-5 Southbound North 35 34 97% 80 229% 59 169% 139 397%
I-5 Southbound Central 0 23 * 55 * 50 * 118 *
I-5 Southbound South 48 48 100% 114 238% 86 179% 203 423%
I-90 Eastbound West 52 46 88% 121 233% 79 152% 210 404%
I-90 Eastbound East 49 42 86% 113 231% 79 161% 211 431%
I-90 Westbound East 44 34 77% 90 205% 64 145% 170 386%
I-90 Westbound West 28 42 150% 112 400% 80 286% 213 761%
* Utilization cannot be calculated due to zero legal capacity
7.3.3 Facility
Northbound Interstate 5
The Custer PRA in the north segment of I-5 is expected to have a nighttime average utilization rate of 41 percent at night. The average utilization rates for the other PRAs are expected to be between 136 percent (Gee Creek and Bow Hill) and 347 percent (Scatter Creek). Smokey Point would have the highest maximum truck parking demand relative to capacity, and would have a utilization rate of approximately 645 percent.
Nine areas outside of the PRAs were observed to have regular illegal truck parking and would add 97 trucks to the average demand and 177 trucks to the maximum demand. Of these nine other areas, four were weigh stations and account for 89 of the 97 trucks for the average demand and 158 of the 177 trucks of the maximum demand. Refer to Table 32, below, for the 2030 nighttime average and maximum truck parking demand and utilization rates.

TECHNICAL MEMORANDUM (CONTINUED)
WSDOT 214-1631-048(02) Truck Parking Study 40 September 2005
Table 32. Interstate 5 Northbound Nighttime Existing and Future Facility Truck Parking Demand and Utilization
Average Maximum
Existing Future 2030 Existing Future 2030
Corridor Segment Public Rest Area /
Other Areas Legal
Capacity Demand Utilization Demand Utilization Demand Utilization Demand Utilization
I-5 Northbound South Gee Creek 22 13 59% 30 136% 26 118% 61 277%
I-5 Northbound South MP 15 Weigh Station 0 4 * 9 * 9 * 21 *
I-5 Northbound South MP 16-52 0 1 * 2 * 2 * 5 *
I-5 Northbound South Toutle River 22 19 86% 45 205% 30 136% 71 323%
I-5 Northbound South MP 57-68 0 2 * 5 * 5 * 12 *
I-5 Northbound South Scatter Creek 17 25 147% 59 347% 40 235% 94 553%
I-5 Northbound South MP 99 0 1 * 2 * 3 * 7 *
I-5 Northbound Central MP 117 Weigh Station 0 9 * 21 * 17 * 40 *
I-5 Northbound Central SeaTac 0 20 * 47 * 35 * 83 *
I-5 Northbound Central MP 123 & 188 0 1 * 2 * 2 * 5 *
I-5 Northbound North Smokey Point 11 14 127% 33 300% 30 273% 71 645%
I-5 Northbound North MP 213 Weigh Station 0 5 * 12 * 6 * 14 *
I-5 Northbound North Bow Hill 14 8 57% 19 136% 17 121% 40 286%
I-5 Northbound North MP 240 0 1 * 2 * 1 * 2 *
I-5 Northbound North Custer 17 3 18% 7 41% 9 53% 21 124%
* Utilization cannot be calculated due to zero legal capacity
Southbound Interstate 5
For southbound I-5, Custer (north segment) would be the only facility with a nighttime average utilization rate lower than 100 percent. All other PRAs are expected to have average utilization rates between 108 percent (Bow Hill, north segment) and 677 percent (Maytown).
Illegally parked trucks were regularly observed in eight other areas along southbound I-5, which would add 98 trucks to the average demand, and 189 trucks to the maximum demand. Of these trucks parked in illegal areas, 77 of the 98 average truck demand would be attributed to four weigh stations, as well as 136 of the 189 maximum truck demand. Table 33 provides a description of the 2030 nighttime average and maximum truck parking demand and utilization.

TECHNICAL MEMORANDUM (CONTINUED)
WSDOT 214-1631-048(02) Truck Parking Study 41 September 2005
Table 33. Interstate 5 Southbound Nighttime Existing and Future Facility Truck Parking Demand and Utilization
Average Maximum
Existing Future 2030 Existing Future 2030
Corridor Segment Public Rest Area /
Other Areas Legal
Capacity Demand Utilization Demand Utilization Demand Utilization Demand Utilization
I-5 Southbound South Gee Creek 11 12 109% 29 264% 17 155% 40 364%
I-5 Southbound South MP 16-48 0 2 * 5 * 6 * 14 *
I-5 Southbound South Toutle River 24 15 63% 35 146% 24 100% 56 233%
I-5 Southbound South MP 57-99 0 1 * 2 * 2 * 5 *
I-5 Southbound South Maytown 13 18 138% 43 331% 37 285% 88 677%
I-5 Southbound Central MP 116-122 0 3 * 7 * 7 * 17 *
I-5 Southbound Central MP 141 Weigh Station 0 7 * 17 * 17 * 40 *
I-5 Southbound Central Silver Lake 0 13 * 31 * 26 * 61 *
I-5 Southbound North MP 188-221 0 3 * 7 * 7 * 17 *
I-5 Southbound North Smokey Point 11 10 91% 23 209% 18 164% 43 391%
I-5 Southbound North MP 236 Weigh Station 0 2 * 5 * 3 * 7 *
I-5 Southbound North Bow Hill 13 6 46% 14 108% 12 92% 28 215%
I-5 Southbound North MP 242 Weigh Station 0 10 * 24 * 12 * 28 *
I-5 Southbound North Custer 11 3 27% 7 64% 7 64% 16 145%
* Utilization cannot be calculated due to zero legal capacity
Eastbound Interstate 90
As shown in Table 34, Price Creek (west segment) is expected to have a nighttime average utilization rate of 65 percent. All other average utilization rates would range from 112 percent (Schrag) to 320 percent (Sprague Lake). Maximum nighttime utilization rates would range from 120 percent (Price Creek) to 520 percent (Sprague Lake).
Eastbound I-90 has nine other areas identified where illegal truck parking was frequent. These areas account for 48 (average) to 82 (maximum) trucks of the nighttime demand. Of the 42 trucks, 31 are associated with weigh stations and a chain up/down area and 53 of the 82 trucks also stem from these same locations.

TECHNICAL MEMORANDUM (CONTINUED)
WSDOT 214-1631-048(02) Truck Parking Study 42 September 2005
Table 34. Interstate 90 Eastbound Nighttime Existing and Future Facility Truck Parking Demand and Utilization
Average Maximum
Existing Future 2030 Existing Future 2030
Corridor Segment Public Rest Area /
Other Areas Legal
Capacity Demand Utilization Demand Utilization Demand Utilization Demand Utilization
I-90 Eastbound West MP 33 Chain Up 0 2 * 5 * 2 * 5 *
I-90 Eastbound West MP 34-54 0 2 * 5 * 5 * 13 *
I-90 Eastbound West MP 56 Chain Down 0 6 * 16 * 12 * 32 *
I-90 Eastbound West Price Creek 20 5 25% 13 65% 9 45% 24 120%
I-90 Eastbound West MP 70-85 0 1 * 3 * 1 * 3 *
I-90 Eastbound West MP 79 Weigh Station 0 2 * 5 * 3 * 8 *
I-90 Eastbound West Indian John Hill 23 19 83% 50 217% 30 130% 80 348%
I-90 Eastbound West MP 101-115 0 1 * 3 * 2 * 5 *
I-90 Eastbound West Rye Grass 9 8 89% 21 233% 15 167% 40 444%
I-90 Eastbound East MP 139-188 0 1 * 3 * 1 * 3 *
I-90 Eastbound East Winchester 12 7 58% 19 158% 13 108% 35 292%
I-90 Eastbound East Schrag 17 7 41% 19 112% 21 124% 56 329%
I-90 Eastbound East MP 231 Weigh Station
0 2 * 5 * 3 * 8 *
I-90 Eastbound East Sprague Lake 20 24 120% 64 320% 39 195% 104 520%
I-90 Eastbound East MP 206-257 0 1 * 3 * 2 * 5 *
* Utilization cannot be calculated due to zero legal capacity
Westbound Interstate 90
All PRAs along westbound I-90 are forecasted to have nighttime average and maximum utilization rates greater than the existing capacity. Winchester (east segment) would have the lowest average utilization rate (133 percent), and Sprague Lake would have the highest (267 percent). Winchester would also have the lowest maximum utilization rate (292 percent) and Indian John Hill would have the highest (421 percent).
Weigh stations account for two of the seven areas where illegal truck parking was commonly observed. The proportion of added truck demand in these seven areas attributed to weigh stations is substantially lower along westbound I-90. Only 13 of 61 (average demand) and 21 of 119 (maximum demand) would be located at these two weigh stations. Table 35 shows the nighttime average and maximum truck parking demand and utilization rates for the existing conditions and year 2030.

TECHNICAL MEMORANDUM (CONTINUED)
WSDOT 214-1631-048(02) Truck Parking Study 43 September 2005
Table 35. Interstate 90 Westbound Nighttime Existing and Future Facility Truck Parking Demand and Utilization
Average Maximum
Existing Future 2030 Existing Future 2030
Corridor Segment Public Rest Area
/ Other Areas Legal
Capacity Demand Utilization Demand Utilization Demand Utilization Demand Utilization
I-90 Westbound West MP 25 0 6 * 16 * 12 * 32 *
I-90 Westbound West MP 11-47, 101 0 1 * 3 * 3 * 8 *
I-90 Westbound West MP 56 0 8 * 21 * 17 * 45 *
I-90 Westbound West MP 80 Weigh Station
0 3 * 8 * 5 * 13 *
I-90 Westbound West Indian John Hill 19 17 89% 45 237% 30 158% 80 421%
I-90 Westbound West Rye Grass 9 7 78% 19 211% 13 144% 35 389%
I-90 Westbound East MP 139 0 2 * 5 * 2 * 5 *
I-90 Westbound East Winchester 12 6 50% 16 133% 13 108% 35 292%
I-90 Westbound East Schrag 17 8 47% 21 124% 20 118% 53 312%
I-90 Westbound East MP 231 Weigh Station
0 2 * 5 * 3 * 8 *
I-90 Westbound East Sprague Lake 15 15 100% 40 267% 23 153% 61 407%
I-90 Westbound East MP 164-264 0 1 * 3 * 3 * 8 *
* Utilization cannot be calculated due to zero legal capacity
Eastbound Interstate 82
All PRAs along eastbound I-82 are forecasted to be deficient in capacity during the nighttime period. The MP 7 Scenic View is projected to have the lowest average utilization (140 percent), but also the highest maximum utilization (480 percent).
The weigh station near MP 76 would account for seven of the nine average number of trucks, and 24 of the 29 maximum number of trucks. Refer to Table 36 for a description of the nighttime average and maximum truck parking demand and utilization rates for this interstate.
Table 36. Interstate 82 Eastbound Nighttime Existing and Future Facility Truck Parking Demand and Utilization
Average Maximum
Existing Future 2030 Existing Future 2030
Corridor Segment Public Rest Area /
Other Areas Legal
Capacity Demand Utilization Demand Utilization Demand Utilization Demand Utilization
I-82 Eastbound Eastbound MP 7 Scenic View 5 3 60% 7 140% 10 200% 24 480%
I-82 Eastbound Eastbound Selah Creek 11 8 73% 19 173% 14 127% 33 300%
I-82 Eastbound Eastbound MP 76 Weigh Station 0 3 * 7 * 10 * 24 *
I-82 Eastbound Eastbound Prosser (bi-dir.) 7 7 100% 16 229% 10 143% 24 343%
I-82 Eastbound Eastbound MP 27-122 0 1 * 2 * 2 * 5 *
* Utilization cannot be calculated due to zero legal capacity

TECHNICAL MEMORANDUM (CONTINUED)
WSDOT 214-1631-048(02) Truck Parking Study 44 September 2005
Westbound Interstate 82
As shown in Table 37, all PRAs are forecasted to have nighttime average truck parking demands that exceed current facility capacity. The MP 7 Scenic View would have the lowest average utilization rate (127 percent), and Prosser (bi-directional) would have the highest nighttime average utilization rate (229 percent). Maximum utilization rates would range from 300 percent (MP 7 Scenic View) to 364 percent (Selah Creek).
Table 37. Interstate 82 Westbound Nighttime Existing and Future Facility Truck Parking Demand and Utilization
Average Maximum
Existing Future 2030 Existing Future 2030
Corridor Segment Public Rest Area /
Other Areas Legal
Capacity Demand Utilization Demand Utilization Demand Utilization Demand Utilization
I-82 Westbound Westbound MP 7 Scenic View 11 6 55% 14 127% 14 127% 33 300%
I-82 Westbound Westbound MP 17 0 2 * 5 * 2 * 5 *
I-82 Westbound Westbound Selah Creek 11 9 82% 21 191% 17 155% 40 364%
I-82 Westbound Westbound Prosser (bi-dir.) 7 7 100% 16 229% 10 143% 24 343%
I-82 Westbound Westbound MP 25-122 0 1 * 2 * 2 * 5 *
* Utilization cannot be calculated due to zero legal capacity
There were no distinct locations where illegal truck parking was repeatedly observed; however various roadsides and on- and off-ramps would add seven (average) to 10 (maximum) trucks to the parking demand.
8 YEAR 2030 CONDITIONS AT COMMERCIAL TRUCK STOPS
8.1 Year 2030 truck growth at CTSs
As described in Section 6 Forecasting Methodology, truck volumes, and therefore truck parking demand, were calculated to have a 3.5 percent compounding growth rate through 2030 along I-5 and I-82. The growth rate along I-90 is expected to be slightly higher; 4.0 percent.
8.2 Year 2030 CTS truck parking conditions
Future truck volumes are expected to increase by 3.5 percent per year along I-5 and I-82 and by 4.0 percent per year along I-90. These percentages were also applied to the current demand at CTSs to estimate year 2030 truck parking demand. The forecast results for year 2030 truck parking at CTSs are discussed and shown below by corridor, segment and facility. Blue cat
8.2.1 Corridor
Year 2030 truck parking demand is expected to exceed capacity for the CTSs along all of the study corridors and is shown in Figure 10.
Based on the data shown in Figure 10, I-90 is expected to exceed capacity by nearly 130 percent while truck parking demand on I-5 and I-82 is expected to exceed capacity by nearly 125 and 100 percent, respectively.

TECHNICAL MEMORANDUM (CONTINUED)
WSDOT 214-1631-048(02) Truck Parking Study 45 September 2005
Figure 10. Year 2030 Truck Parking Demand at CTSs by Corridor
555
187
1196
420
521449470
178
1110
0
200
400
600
800
1000
1200
1400
I-5 I-90 I-82
Freeway
No.
of T
ruck
Par
king
Spa
ces
CapacityYear 2005 DemandYear 2030 Demand
Figure 11 shows year 2030 truck parking demand by direction along each of the study corridors.
Based on the data shown in Figure 11, I-90 eastbound is expected to exceed capacity by 154 percent with a demand of 203 truck parking stalls. Truck parking demand on I-5 southbound is forecast to exceed capacity by 105 percent while I-5 northbound is forecast to exceed capacity by 77 percent. Truck parking demand on both I-90 westbound and I-82 eastbound is forecast to exceed capacity by 125 percent.

TECHNICAL MEMORANDUM (CONTINUED)
WSDOT 214-1631-048(02) Truck Parking Study 46 September 2005
Figure 11. Year 2030 Truck Parking Demand at CTSs (by direction)
178186 203
420
105
450
80
441
187
79
391
76
373
924
993
0
200
400
600
800
1000
1200
I-5 Northbound I-5 Southbound I-90 Eastbound I-90 Westbound I-82 Eastbound
Freeway by Direction
No.
of T
ruck
Par
king
Spa
ces
CapacityYear 2005 DemandYear 2030 Demand
8.2.2 Segment
Figure 12 shows the forecasted truck parking demand for the year 2030 at commercial truck stops on the I-5 corridor by segment.
As shown in Figure 12, year 2030 truck parking demand is forecast to exceed capacity in all segments of I-5. Based on the data shown in Figure 12, the greatest increase in truck parking demand is forecast for I-5 southbound in the central segment (between Everett and Olympia). Truck parking demand for this segment is forecast to exceed capacity by nearly 125 percent. The next greatest increase in truck parking demand is forecast for the south segment of I-5 for trucks traveling southbound. Truck parking demand for this segment is forecast to exceed capacity by nearly 109 percent.

TECHNICAL MEMORANDUM (CONTINUED)
WSDOT 214-1631-048(02) Truck Parking Study 47 September 2005
Figure 12. Year 2030 Truck Parking Demand for I-5 by Segment at CTSs
250 0
35
0
180 190
80
265
80105
15
64
235
76 80
151
554
0
100
200
300
400
500
600
South Segment Central Segment North Segment South Segment Central Segment North Segment
I-5 Northbound I-5 Northbound I-5 Northbound I-5 Southbound I-5 Southbound I-5 Southbound
No.
of T
ruck
Par
king
Spa
ces
CapacityYear 2005 DemandYear 2030 Demand
Figure 13 shows the forecasted truck parking demand for the year 2030 at commercial truck stops on the I-5 corridor by segment.
As shown in Figure 13, year 2030 truck parking demand is forecast to exceed capacity in all segments of I-90. Based on the data shown in Figure 13, the greatest increases in truck parking demand are forecast for I-90 eastbound in the eastern segment (between I-82 and state border) and I-90 westbound in the western segment. Truck parking demands for these segments are about the same, with truck parking demand exceeding capacity by approximately 154 percent.
Because I-82 was not broken into segments, its forecasted growth in truck parking demand is shown in Figure 11 in the Corridor section.

TECHNICAL MEMORANDUM (CONTINUED)
WSDOT 214-1631-048(02) Truck Parking Study 48 September 2005
Figure 13. Year 2030 Truck Parking Demand for I-90 by Segment for CTSs
0 0 0
203
266
175
80
207
166
76
443
550
0
100
200
300
400
500
600
West Segment East Segment West Segment East Segment
I-90 Eastbound I-90 Eastbound I-90 Westbound I-90 Westbound
No.
of T
ruck
Par
king
Spa
ces
CapacityYear 2005 DemandYear 2030 Demand
8.2.3 Facility
Table 38 shows the forecasted truck parking demand for each of the CTSs in Year 2030.
Table 38. Year 2030 Truck Parking Demand Estimates for CTSs
City Truck Stop Name Capacity Year 2005 Demand
Year 2030 Demand
No. Over Capacity
Interstate 5 Blaine Yorky's Truck Stop 80 64 151 71
Bellingham Yorky's Exxon 17 10 24 7
Arlington Arlington Fuel Stop 8 6 15 7
Marysville Donna's Truck Stop 80 64 151 71
Tacoma Flying J Travel Plaza #05060 80 76 180 100
Olympia Restover Truck Stop 115 92 217 102
Toledo Gee Cee's Truck Stop 150 143 337 187
Kalama Rebel Truck Stop 25 15 35 10

TECHNICAL MEMORANDUM (CONTINUED)
Table 38. Year 2030 Truck Parking Demand Estimates for CTSs (continued)
WSDOT 214-1631-048(02) Truck Parking Study 49 September 2005
City Truck Stop Name Capacity Year 2005 Demand
Year 2030 Demand
No. Over Capacity
Interstate 90 North Bend Seattle-East Auto/Truck Plaza 175 166 443 268
Ellensburg Flying J Travel Plaza 80 76 203 123
Ellensburg Pilot Travel Center #389 89 85 225 136
Moses Lake Ernie's Truck Stop # 9 100 60 160 60
Ritzville Jake's Exxon
Spokane Broadway Truck Stop - Geiger 2 2 5 3
Spokane Broadway Flying J Travel Plaza 75 60 160 85
Interstate 82 Union Gap Gear Jammers Truck Plaza 162 154 364 202
Prosser Horse Heaven Hills Travel Plaza 25 24 56 31
Totals 1,263 1,096 2,726 1,463
As shown in Table 38, year 2030 truck parking demand is forecast to exceed existing capacity at all of the commercial truck stops.
9 YEAR 2030 CONDITIONS FOR TOTAL TRUCK PARKING COMBINING PRA AND CTS FACILITIES
9.1 Year 2030 combined PRA and CTS truck growth
Forecasted Year 2030 truck parking demand at PRAs and CTSs were combined to estimate the total truck parking demand for each study corridor, segment, and facility.
9.1.1 Corridor
Figure 14 shows year 2030 truck parking demand forecasts for each of the study corridors.
As shown in Figure 14, Year 2030 truck parking demand will exceed the existing capacity along all of the study corridors. On average, truck parking demand will exceed capacity by 123 percent on I-5, 137 percent on I-90 and 115 percent on I-82. During peak demand times, truck parking demand will exceed capacity by 186 percent on I-5, 157 percent on I-82 and 188 percent on I-90.

TECHNICAL MEMORANDUM (CONTINUED)
WSDOT 214-1631-048(02) Truck Parking Study 50 September 2005
Figure 14. Year 2030 Total Truck Parking Capacity and Demand (PRAs and CTSs)
741 694
239
1654 1642
515
21172000
615
0
500
1000
1500
2000
2500
I-5 I-90 I-82
Freeway
No.
of T
ruck
Par
king
Spa
ces
Total CapacityTotal Demand (Ave)Total Demand (Max)
Figure 15 shows year 2030 truck parking demand forecasts for each of the study corridors by direction.
Based on the data in Figure 15, I-90 eastbound truck parking demand is forecast to experience the biggest percent increase in truck parking, exceeding capacity on average by 147 percent by the year 2030. During peak demand times, I-90 eastbound truck parking demand is forecast to exceed capacity by nearly 245 percent. With the exception of westbound I-82, truck parking demand is forecast to exceed capacity on average between 120 and 147 percent along the study corridors. During peak demand times, truck parking is forecast to exceed capacity between 152 and 252 percent along the study corridors. For westbound I-82, truck parking demand is forecast to exceed capacity by 52 percent.

TECHNICAL MEMORANDUM (CONTINUED)
WSDOT 214-1631-048(02) Truck Parking Study 51 September 2005
Figure 15. Year 2030 Total Truck Parking Demand by Direction (PRAs and CTSs)
733
624
1376
85
208
533
181
513
210
29
481
1173
447
1195
471
44
1384
530
0
200
400
600
800
1000
1200
1400
1600
I-5 Northbound I-5 Southbound I-90 Eastbound I-90 Westbound I-82 Eastbound I-82 Westbound
Freeway by Direction
No.
of T
ruck
Par
king
Spa
ces
Total CapacityTotal Demand (Ave)Total Demand (Max)
9.1.2 Segment
Figure 16 shows the average and maximum total truck parking demand for both northbound and southbound I-5.
Based on the data shown in Figure 16, the central segment for I-5 southbound will have the greatest percentage increase in average truck parking demand, exceeding capacity by 194 percent in the year 2030. During peak demand times in 2030, truck parking demand in the central segment for I-5 southbound will exceed capacity by 273 percent. Similarly, year 2030 peak truck parking demand in the south segment for I-5 northbound will exceed capacity by 256 percent (average demand would exceed capacity 117 percent). Even though there is no truck parking provided in the central segment of I-5 northbound, truck parking demand will continue to increase, resulting in a truck parking space shortage of 70 to128 spaces.

TECHNICAL MEMORANDUM (CONTINUED)
WSDOT 214-1631-048(02) Truck Parking Study 52 September 2005
Figure 16. Year 2030 Total Truck Parking Demand for I-5 by Segment (PRAs and CTSs)
86
0
70
128 140
80
313
122
270235
668
224187
306 299 298
757
329
0
100
200
300
400
500
600
700
800
South Segment Central Segment North Segment South Segment Central Segment North Segment
I-5 Northbound I-5 Northbound I-5 Northbound I-5 Southbound I-5 Southbound I-5 Southbound
No.
of T
ruck
Par
king
Spa
ces
CapacityDemand (Ave)Demand (Max)
Figure 17 shows the average and maximum total truck parking demand for both eastbound and westbound I-90.
Based on the data shown in Figure 17, the west segment of I-90 westbound will have the greatest percentage increase in average truck parking demand, exceeding capacity by 173 percent in the year 2030. During peak demand times in 2030, truck parking demand for this segment will exceed capacity by 223 percent. Similarly, year 2030 peak truck parking demand in the eastern segment of I-90 eastbound will exceed capacity by 221 percent (average demand would exceed capacity 145 percent). The greatest increase is peak truck parking demand is forecast for the western segment of I-90 eastbound, which will exceed capacity by 304 percent (average demand would exceed capacity 133 percent). For the east segment of I-90 westbound, truck parking demand is forecast exceed capacity by 106 percent on average and by 132 percent during peak times.

TECHNICAL MEMORANDUM (CONTINUED)
WSDOT 214-1631-048(02) Truck Parking Study 53 September 2005
Figure 17. Year 2030 Total Truck Parking Demand for I-90 by Segment (PRAs and CTSs)
52
203
310
121
316
555
640
414
656
720
129
210
0
100
200
300
400
500
600
700
800
West Segment East Segment West Segment East Segment
I-90 Eastbound I-90 Eastbound I-90 Westbound I-90 Westbound
No.
of T
ruck
Par
king
Spa
ces
CapacityDemand (Ave)Demand (Max)
9.1.3 Facility
Year 2030 facility information for PRAs (Sections 7.2.3 and 7.3.3) and CTSs (Section 8.2.3) are discussed previously in their respective sections.
10 SUMMARY OF FINDINGS
10.1 Conclusions on the existing truck parking conditions
• The central segment of Interstate 5 (northbound and southbound) lacks legal truck parking at PRAs and an insufficient amount of truck parking at CTSs.
• Illegal truck parking occurs at PRAs despite available legal capacity within the facility. This may occur if: legal parking is not available at the time of truck arrival, and then becomes available after the trucker has parked; truckers decide to park illegally based on their assumption that the facility will be full; or if truckers feel that parking along on-/off-ramps and roadsides is more convenient than parking in designated truck spaces.
• During the day, the majority of individual PRAs along the study corridors are underutilized. On average, PRAs and CTSs provide sufficient truck parking capacity at the segment and corridor levels.

TECHNICAL MEMORANDUM (CONTINUED)
WSDOT 214-1631-048(02) Truck Parking Study 54 September 2005
• During the night, several individual PRAs are over utilized and demand exceeds capacity at the segment and capacity level as well. This suggests, contrary to A Study of Parking Facilities (FHWA June 2002), that PRAs are being used for overnight stays.
• When considered together on the corridor level, PRAs and CTSs provide enough truck parking capacity on average night. However, during peak times, truck parking demand exceeds the combined capacity on all of the study corridors.
• Truck parking demand on the western segment of I-90 westbound was observed to exceed the combined capacity on an average night (PRAs and CTSs combined).
• Illegal truck parking occurs at a variety of different locations; however the majority of illegal truck parking occurs at localized areas such as weigh stations and chain up/down areas.
10.2 Conclusions on the Year 2030 truck parking conditions
• Forecasted Year 2030 daytime truck parking demand would exceed current capacity along the majority of the study corridors. Daytime corridor utilization rates would range from 48 percent (average demand of westbound I-82) to 245 percent (maximum demand for southbound I-5).
• Forecasted Year 2030 nighttime truck parking demand would exceed current capacity along all study corridors for PRAs. Nighttime corridor utilization rates would range from 152 percent (average demand of westbound I-82) to 554 percent (maximum demand for southbound I-5).
• Forecasted Year 2030 nighttime truck parking demand will exceed current capacity along all study corridors for CTSs. I-5 northbound (exceed capacity by 77 percent) will have the biggest shortage of truck parking spaces, followed by I-90 eastbound (exceed capacity by 154 percent).
• Year 2030 truck parking demand will exceed the combined (PRAs and CTSs) current truck parking capacity along all study corridors. The central segment of I-5 (both directions) will have the biggest shortage of truck parking spaces, followed by the southern segment of I-5 northbound.
11 PRELIMINARY RECOMMENDATIONS
The preliminary recommendations listed below are some of the potential ways to address future truck parking needs along the study corridors. These preliminary recommendations are suggested as a starting point for discussion in the next phase of this study and are not intended to be exhaustive.
• Provide trucking companies with additional information and resources that detail the locations and directions to all PRAs and commercial truck stops within the state of Washington.
• Implement a communication program that provides current parking conditions at PRAs and CTSs. Allow truck drivers to query specific facilities. Encourage trucking companies to increase communication among drivers to learn where legal truck parking is or is not available.
• Cleary designate truck parking from recreational vehicle (RV) parking at all PRAs. This action would not necessarily address the truck parking capacity deficit.
• Conduct a 24-hour study of truck parking at the highest use PRAs to determine the facility’s peak-hour and learn the typical duration of stay. This would provide evidence of whether or not truckers are typically using PRAs for overnight stays. A 24-hour study would also provide the basis for implementing time restrictions.

TECHNICAL MEMORANDUM (CONTINUED)
WSDOT 214-1631-048(02) Truck Parking Study 55 September 2005
• If extended breaks or overnight stays at PRAs are frequent, implementation of time restrictions would discourage this activity at PRAs and increase the truck parking turnover rate, which would increase the functional capacity of a facility. However, shortened time restrictions could become problematic because it could encourage trucks to park along roadsides and ramps.
• Conduct a similar study during winter months when I-90 pass closures could affect a driver’s ability to reach their destination and determine whether additional capacity at specific PRAs or CTSs could be needed.
• Coordinate with local and state patrol to enforce current laws on illegal truck parking. Penalty enforcement should be more frequent along roadsides and ramps (as opposed to weigh stations and trucks parked illegally within the PRA facility) and/or receive a higher monetary penalty.
• Legalize truck parking at some or all weigh stations. Adding capacity at weigh station would increase the corridor’s overall legal capacity; however it may not reduce the amount/frequency of truck parking along roadsides and ramps.
• Provide legal truck parking within the central segment of I-5 in the form of adding a PRA or legalizing truck parking at weigh stations.
• Implement public-private partnerships that would encourage development of additional CTSs in close proximity to areas where PRAs and/or CTSs are significantly overcapacity.
• Implement public-private partnerships that would provide financial aid for increasing CTS capacity and/or subsidize operating costs.

APPENDIX C
Improvement Strategy Evaluation Matrices

WSDOT Truck Parking StudyRecommended Strategies Qualitative Evaluation Matrix
Strategy/Option Improvement Description
Potential Added Capacity Safety Cost
Wetlands / Critical Areas Air Quality Water Quality
Additional Right of Way Required
Implementation Issues
Policy/Regulation Changes
Other Advantages
Other Disadvantages
1 Create new legal truck parking within the north (southbound), central (northbound and southbound), and south (northbound) segments of I-5 and west segment of westbound I-90
60-470 spaces Improve High; additional right of way and construction
More likely west of Cascade mountains
Could slightly increase localized emissions due to truck idling, construction dust
Added PGIS, construction sediment transport
Yes for new facilities
Construction traffic, potentially inconsistent land use
None/unlikely Would make more efficient use of parking areas
Expensive land where needed, reduced aesthetics, temporary decrease in capacity during construction
1a Construct new PRA(s) 60-150 spaces Improve High; additional right of way and construction
More likely west of Cascade mountains
Could slightly increase localized emissions due to truck idling, construction dust
Added PGIS, construction sediment transport
Yes Construction traffic, potentially inconsistent land use
None/unlikely Would make more efficient use of parking areas
Expensive land where needed, reduced aesthetics
1b Reconfigure / expand existing PRA(s)
240-470 spaces Improve Moderate; re-construction
Limited to open space areas within existing sites
Could slightly increase localized emissions due to truck idling, construction dust
Added PGIS, construction sediment transport
Potential Construction traffic
Could require changes to standard PRA design
Would make more efficient use of parking areas
Aesthethics could be reduced, temporary reduction in capacity during construction
1c Construct new limited feature truck parking areas (variation of"Ohio Solution")
70-140 spaces Improve High; additional right of way and construction
More likely west of Cascade mountains
Could slightly increase localized emissions due to truck idling, construction dust
Added PGIS, construction sediment transport
Yes Construction traffic, potentially inconsistent land use
May require on-/off-ramp design deviations
Provide truck facilities with very low maintenance
1d PRA nighttime cross utilization 60-110 spaces Shared-use areas could be less safe
Moderate; re-construction
None/unlikely None/unlikely None/unlikely None/unlikely Would require WSP support to enforce time of day restrictions
Would formalize shared-use, truck/car parking areas
Could discourage recreational patrons
2 Legalize truck parking at non-Port of Entry weigh stations andexpand the facility
150-280 spaces Improve Moderate; re-construction
Limited to open space areas within existing sites
Could slightly increase localized emissions due to truck idling
Water quality runoff may slightly degrade
Potential Would require WSP support; cannot interfere with operations
Yes, limit to non-Ports of Entry PRAs
Limited new construction
Would require restroom facilities
3 Implement public-private partnerships that would encourage new development of CTSs where PRAs are significantly over capacity
30-180 spaces Improve Moderate; planning and CTS subsidies
More likely west of Cascade mountains
Could slightly increase localized emissions due to truck idling, construction dust
PGIS could increase if undeveloped land is used, construction sediment transport
Yes Would require planning and guidelines to develop the program, potentiallly inconsistent land use
Would require internal WSDOT allocation of funds, potential legislative revisions regarding public-private partnerships at PRAs
Would shift some of the truck parking burden to the private sector
Lack of available and cost-efficient property
3a Provide free signage along Interstate highways
30-180 spaces Neutral Low; signage None/unlikely Could slightly increase localized emissions due to truck idling, construction dust
PGIS could increase if undeveloped land is used, construction sediment transport
None/unlikely Creation of CTSs could have potentially inconsistent land use
Could require changes to highwaysignage policies
Potential Impacts
October 2005 │ 214-1631-048 (02) C-1

WSDOT Truck Parking StudyRecommended Strategies Qualitative Evaluation Matrix
Strategy/Option Improvement Description
Potential Added Capacity Safety Cost
Wetlands / Critical Areas Air Quality Water Quality
Additional Right of Way Required
Implementation Issues
Policy/Regulation Changes
Other Advantages
Other Disadvantages
Potential Impacts
3b Lease WSDOT right of way/property at low rates with contingency to provide CTS services/amenities
30-180 spaces Improve Moderate; program planning and guidelines
More likely west of Cascade mountains
Could slightly increase localized emissions due to truck idling, construction dust
PGIS could increase if undeveloped land is used, construction sediment transport
Potential Would require planning and guidelines to develop the program, potentiallly inconsistent land use
Would require internal WSDOT allocation of funds
Previously unused land would generate income
Lack of available and cost-efficient property
3c Provide low-interest loans for development
30-180 spaces Improve Moderate; program planning, guidelines, and subsidies
None/unlikely Could slightly increase localized emissions due to truck idling, construction dust
PGIS could increase if undeveloped land is used, construction sediment transport
Potential Would require planning and guidelines to develop the program, potentiallly inconsistent land use
Would require internal WSDOT allocation of funds
Would receive interest from loans
4 Implement public-private partnerships that would provide financial aid for increasing capacity at existing CTSs
0-100 spaces Improve Moderate; program planning, guidelines, and subsidies
More likely west of Cascade mountains
Could slightly increase localized emissions due to truck idling, construction dust
PGIS could increase if undeveloped land is used, construction sediment transport
Yes Would require planning and guidelines to develop the program, potentiallly inconsistent land use
Would require internal WSDOT allocation of funds, potential legislative revisions regarding public-private partnerships at PRAs
Would shift some of the truck parking burden to the private sector
Lack of available and cost-efficient property
4a Subsidize operational costs 0-60 spaces Improve Moderate; program planning, guidelines, and subsidies
More likely west of Cascade mountains
Could slightly increase localized emissions due to truck idling, construction dust
PGIS could increase if undeveloped land is used, construction sediment transport
None/unlikely Would require planning and guidelines to develop the program
Would require internal WSDOT allocation of funds
Would shift some of the truck parking burden to the private sector
4b Provide low-interest loans for expansion-related costs
50-100 spaces Improve Moderate; program planning, guidelines, and subsidies
More likely west of Cascade mountains
Could slightly increase localized emissions due to truck idling, construction dust
PGIS could increase if undeveloped land is used, construction sediment transport
None/unlikely Would require planning and guidelines to develop the program
Would require internal WSDOT allocation of funds
Would receive interest from loans
Lack of available and cost-efficient property
5 Develop shared-use parking agreements with existing parking lot owners
200+ Improve Low; existing facilities
None/unlikely Could slightly increase localized emissions due to truck idling
Water quality runoff may degrade
None/unlikely Potentially inconsistent land use, shared-use agreements, coordination with transit agencies, potential local traffic impact
None/unlikely Would utilize unused land at night, no new construction
Could require restroom facilities, strongerpavement, potential noise impacts
October 2005 │ 214-1631-048 (02) C-2

WSDOT Truck Parking StudyRecommended Strategies Qualitative Evaluation Matrix
Strategy/Option Improvement Description
Potential Added Capacity Safety Cost
Wetlands / Critical Areas Air Quality Water Quality
Additional Right of Way Required
Implementation Issues
Policy/Regulation Changes
Other Advantages
Other Disadvantages
Potential Impacts
5a Provide nighttime-only parking at commercial parking lots (e.g. Northgate/Tacoma Malls, Issaquah/Gilman shopping area)
200+ Improve Low; existing facilities
None/unlikely Could slightly increase localized emissions due to truck idling
Water quality runoff may degrade
None/unlikely Potential local traffic impact
None/unlikely Could benefit stores during late evening and/or early morning hours
Could require restroom facilities, strongerpavement, potential noise impacts
5b Provide nighttime-only parking at public park and ride lots
200+ Improve Low; existing facilities
None/unlikely Could slightly increase localized emissions due to truck idling
Water quality runoff may degrade
None/unlikely Coordination with transit agencies, potential local traffic impact
None/unlikely Would utilize unused land at night, no new construction
Could require restroom facilities, strongerpavement, potential noise impacts
6 Implement an information and communication program that provides current parking conditions at PRAs and CTSs; allow truck drivers to query specific facilities
None/unlikely Improve Moderate; currently used or new technologies
None/unlikely None/unlikely None/unlikely None/unlikely Would require additional planning to start program
None/unlikely Could increase distribution of truck parking demand
6a Encourage CB/cell phone use to learn where legal truck parking is or is not available
None/unlikely Improve Low cost --marketing campaign
None/unlikely None/unlikely None/unlikely None/unlikely Would require trucker usage
None/unlikely Could more evenly distribute truck parking demand
6b ITS solutions: new highway signs, advisory radio broadcasts (periodic news on existing station or dedicated station), real-time parking inventories, real-time communication systems (511 Traveler Information)
None/unlikely Improve High; new technology, installation at PRAs, and O&M costs
None/unlikely None/unlikely None/unlikely None/unlikely Potentially long implementation time
None/unlikely Could more evenly distribute truck parking demand
Could require other systems
6c Produce and distribute a trucker guide
None/unlikely Neutral Low; existing information
None/unlikely None/unlikely None/unlikely None/unlikely Would require driver familiarity and use
None/unlikely Could more evenly distribute truck parking demand
7 Clearly designate truck parking from recreational parking at all PRAs
None/unlikely Improve Low; improved signage and striping
None/unlikely None/unlikely None/unlikely None/unlikely None/unlikely None/unlikely Reduce trucker frustration
8 Coordinate with local and state patrol to enforce current truck parking laws
None/unlikely Improve Low; coordination costs only
None/unlikely None/unlikely None/unlikely None/unlikely Officer availability None/unlikely
October 2005 │ 214-1631-048 (02) C-3

WSDOT Truck Parking StudyRecommended Strategies Qualitative Evaluation Matrix
1 = Max added capacity > 150 spaces
1 = Improve 1 = Low 1 = None/unlikely
1 = None/unlikely
1 = None/unlikely
1 = None/unlikely 1 = None/unlikely 1 = None/unlikely 1 = Most advantageous
1 = Least disadvantageous
2 = Max added capacity 100-150 spaces
2 = Same 2 = Moderate 2 = Potential 2 = Moderate 2 = Moderate 2 = Potential 2 = Moderate 2 = Moderate 2 = Moderate 2 = Moderate
3 = Max added capacity < 100 spaces
3 = Worsen 3 = High 3 = Substantial 3 = Substantial 3 = Substantial 3 = Substantial 3 = Substantial 3 = Substantial 3 = Least advantageous
3 = Most disadvantageous
Strategy/Option Improvement Description
Potential Added Capacity Safety Cost
Wetlands / Critical Areas Air Quality Water Quality
Additional Right of Way Required
Implementation Issues
Policy/Regulation Changes
Other Advantages
Other Disadvantages
1 Create new legal truck parking within the north (southbound), central (northbound and southbound), and south (northbound) segments of I-5 and west segment of westbound I-90
1 1 3 2 2 2 2 2 1 2 3
1a Construct new PRA(s) 2 1 3 2 2 2 3 2 1 2 31b Reconfigure / expand existing
PRA(s)1 1 2 1 2 2 2 1 2 2 2
1c Construct new limited feature truck parking areas (variation of"Ohio Solution")
2 1 3 2 2 2 2 2 2 1
1d PRA nighttime cross utilization 2 3 1 1 1 1 1 2 1 1
2 Legalize truck parking at non-Port of Entry weigh stations andexpand the facility
1 1 1 1 1 1 2 1 2 1 1
3 Implement public-private partnerships that would encourage new development of CTSs where PRAs are significantly over capacity
1 1 2 2 2 2 3 3 3 1 3
3a Provide free signage along Interstate highways
1 2 1 1 2 2 1 2 2 1
3b Lease WSDOT right of way/property at low rates with contingency to provide CTS services/amenities
1 1 2 2 2 2 2 3 3 1 3
3c Provide low-interest loans for development
1 1 2 1 2 2 2 3 3 1
4 Implement public-private partnerships that would provide financial aid for increasing capacity at existing CTSs
2 1 2 2 2 2 1 3 3 1 3
4a Subsidize operational costs 3 1 2 2 2 2 1 2 3 1
4b Provide low-interest loans for expansion-related costs
2 1 2 2 2 2 1 2 3 2
5 Develop shared-use parking agreements with existing parking lot owners
1 1 1 1 1 2 1 3 1 1 1
Potential Impacts
October 2005 │ 214-1631-048 (02/104) C-4

1 = Max added capacity > 150 spaces
1 = Improve 1 = Low 1 = None/unlikely
1 = None/unlikely
1 = None/unlikely
1 = None/unlikely 1 = None/unlikely 1 = None/unlikely 1 = Most advantageous
1 = Least disadvantageous
2 = Max added capacity 100-150 spaces
2 = Same 2 = Moderate 2 = Potential 2 = Moderate 2 = Moderate 2 = Potential 2 = Moderate 2 = Moderate 2 = Moderate 2 = Moderate
3 = Max added capacity < 100 spaces
3 = Worsen 3 = High 3 = Substantial 3 = Substantial 3 = Substantial 3 = Substantial 3 = Substantial 3 = Substantial 3 = Least advantageous
3 = Most disadvantageous
Strategy/Option Improvement Description
Potential Added Capacity Safety Cost
Wetlands / Critical Areas Air Quality Water Quality
Additional Right of Way Required
Implementation Issues
Policy/Regulation Changes
Other Advantages
Other Disadvantages
Potential Impacts
5a Provide nighttime-only parking at commercial parking lots (e.g. Northgate/Tacoma Malls, Issaquah/Gilman shopping area)
1 1 1 1 1 2 1 3 1 1 1
5b Provide nighttime-only parking at public park and ride lots
1 1 1 1 1 2 1 3 1 1 1
6 Implement an information and communication program that provides current parking conditions at PRAs and CTSs; allow truck drivers to query specific facilities
3 1 2 1 1 1 1 2 1 3
6a Encourage CB/cell phone use to learn where legal truck parking is or is not available
3 1 1 1 1 1 1 1 1 3
6b ITS solutions: new highway signs, advisory radio broadcasts (periodic news on existing station or dedicated station), real-time parking inventories, real-time communication systems (511 Traveler Information)
3 1 3 1 1 1 1 3 1 3 3
6c Produce and distribute a trucker guide
3 2 1 1 1 1 1 1 1 3
7 Clearly designate truck parking from recreational parking at all PRAs
3 1 1 1 1 1 1 1 1 3
8 Coordinate with local and state patrol to enforce current truck parking laws
3 1 1 1 1 1 1 2 1
October 2005 │ 214-1631-048 (02/104) C-5

APPENDIX D
Assumptions for Added Capacity

October 2005 │ 214-1631-048 (02) D-1
Improvement Strategies and Options Matrix – Added Capacity Assumptions This discussion describes the assumptions used to estimate the amount of truck parking capacity that would be added to the study corridors (I-5, I-90, and I-82) as a result of the improvement options described in the WSDOT Truck Parking Study Final Report (Sections 6.2 and 6.3.2). These assumptions were based on existing truck parking capacities at commercial truck stop (CTS) and public rest area (PRA), observed parking conditions, shared-use parking areas within existing PRAs, typical sizes of facilities in other states, and conceptual design drawings of feasible reconfiguration options. These estimates were calculated at a planning level of analysis based on conceptual drawings that are not site specific. As improvement options are selected for implementation, these conceptual estimates will be further refined for specific sites during the preliminary engineering design phase of each project. Also see Figures 8, 9, 10 and 11 in Section 6.1 of the WSDOT Truck Parking Study Final Report, which provides potential reconfiguration options at public rest areas and weigh stations. Because these estimates are conceptual, the estimated number of truck parking spaces calculated below have been rounded to the nearest multiple of 10 in Table 4 (in Section 6.3.2) of the WSDOT Truck Parking Study Final Report. Option 1a – Construct three new PRAs; one PRA in the north segment of I-5, one in the central segment of I-5, and one in the west segment of I-90. Each PRA is assumed to have a capacity of 20-50 truck spaces each (10-25 per direction), for a total of 60-150 truck spaces. Option 1b – There are currently three PRAs in the north segment of I-5 and two PRAs in the west segment of I-90 that have truck parking areas potentially available for reconfiguration. Assuming each of these PRAs could be reconfigured/expanded to increase its capacity by 25-50 spaces per direction (except Price Creek, which only serves eastbound traffic), reconfiguration/expansion of these PRAs would produce a total of 225-450 new truck spaces. The central segment has two PRAs (SeaTac and Silver Lake) that serve a single direction and do not currently have legal truck parking. Assuming that the recreational/personal vehicle parking areas could be reconfigured to add 5-10 truck parking spaces at each facility, this would add an additional 10-20 truck parking spaces. The total amount of additional truck parking spaces under this option would be 235-470 truck parking spaces. Option 1c – Construct three truck-only facilities (variation of the “Ohio Solution”); one facility in the north segment of I-5, one in the central segment of I-5, and one in the west segment of I-90. The capacity of this facility could vary greatly depending on the amount of right of way acquired. For this analysis, we assumed this facility would have a capacity of 12-24 truck parking spaces per direction, which is a range that is similar to the amount of truck parking spaces available at the truck-only facility in Ohio. Construction of these three truck only facilities would produce an additional 72-144 truck spaces.

October 2005 │ 214-1631-048 (02) D-2
Option 1d – There are five PRAs in the north and central segments of I-5 and two PRAs in the west segment of I-5 that could allow cross utilization of PRA parking areas during nighttime hours. Assuming shared-use at each facility could add 5-10 additional truck parking spaces per direction, except three PRAs that serve a single direction, this option could result in an additional 55-110 truck parking spaces. Option 2 – The low end of the added capacity estimate was based on the combined total of the maximum number of trucks observed at weigh stations. The high end of the added capacity estimate was partially based on Figure 7 (Section 6.1.3) in the WSDOT Truck Parking Study Final Report. Figure 7 shows that an existing weigh station could be expanded to accommodate 50 truck parking spaces. However, this design drawing is for a Port of Entry weigh station, which likely has more available right of way than most weigh stations. Accounting for the likely reduced size of most weigh stations and considering that two weigh stations were observed to have 26-35 trucks parked during the peak time, it was assumed that the average weigh station would be able to accommodate 25 legal truck parking spaces. Given that there are 11 non-Port of Entry weigh stations along the corridors, an additional 275 truck parking spaces could be added. Therefore this option could add 149-275 truck parking spaces. Option 3a – This option assumes that free interstate highway signage would promote development of CTSs on private land. Assuming one CTS would be built in the each of the north and central segments of I-5 and one CTS in the west segment of I-90, and that each CTS would have a capacity of 10-60 truck parking spaces, this option could add 30-180 truck parking spaces. Option 3b – This option functions under the same set of assumptions as described under Option 3a, however CTSs would be developed on WSDOT property. In addition, this option also assumes that there is sufficient WSDOT property available for leasing that would allow development of these CTSs. The amount of added truck parking could be the same as Option 3a; 30-180 truck parking spaces. Option 3c – This option also includes the same set of assumptions as Option 3a, however low interest loans would be provided to encourage development of CTSs as opposed to free interstate highway signage. The amount of added truck parking would be the same as Option 3a; 30-180 truck parking spaces. Option 4a – This improvement option provides subsidies for operational costs to ensure continued operation of existing CTSs, but would not necessarily result in facility expansion. However, if operational costs are subsidized, the CTS could allocate funds for expansion. This option assumes that the 10 CTSs within the north and central segments of I-5 and the west segment of I-90 would be able to redistribute revenues and expand their facility. Assuming that Option 4a would allow each CTS to increase its capacity by an average of 0-6 truck parking spaces, the amount of added capacity would be 0-60 truck parking spaces.

October 2005 │ 214-1631-048 (02) D-3
Option 4b – Unlike Option 4a, which provides subsidies for operational costs, Option 4b would provide financial aid for expansion-related costs. Assuming each of the 10 CTS within the north and central segments of I-5 and the west segment of I-90 would be able to increase truck parking capacity by 5-10 spaces, this option would result in a total of 50-100 truck parking spaces. Option 5a – The amount of truck parking spaces that could be added from shared-use parking lot agreements with existing commercial parking lot owners ranges greatly and would depend on the number of participating lots and the area allotted for truck parking. Potential areas within the central segment of I-5 and west segment of I-90 include: Northgate and Tacoma Malls, the Issaquah/Gilman shopping area, and several others. These agreements would provide only nighttime truck parking. A conservative conceptual estimate for this option is 200+ additional truck parking spaces. Option 5b – Similar to Option 7a, the amount of added truck parking capacity resulting from public park and ride (P&R) shared-use parking lots would depend largely on the number of participating lots and the area allotted for truck parking. Potential park and ride lots within the central segment of I-5 include: Aurora Village Transit Center, Shoreline P&R, North Jackson P&R, Northgate Transit Center, and several others. These agreements would provide only nighttime truck parking. A conservative conceptual estimate for this option is 200+ additional truck parking spaces. Options 6 – All improvement subcategories described under Option 5 would not add truck parking capacity to the study corridors. However, increased communication and knowledge of truck parking conditions at specific facilities could distribute the truck parking demand more evenly and reduce the amount of illegal truck parking. Option 7 – Recreational vehicles and vehicles with trailers/boats/campers sometimes park in commercial truck-designated parking spaces. While clearly designating and re-striping truck parking would not add parking capacity to the study corridors, this improvement option may reduce the occurrence of truck parking spaces being occupied by non-commercial trucks. Option 8 – Coordinating with local and Washington State Patrol to enforce current truck and general parking regulations would not increase the truck parking capacity along the study corridors. However, consistent enforcement could reduce the amount and frequency of illegal truck parking along roadsides and ramps.

APPENDIX E
Conceptual Cost Estimates and Assumptions

Cost Estimate Assumptions
Item Assumptions1. GRADING/DRAINAGE
Clear & Grub, DemolitionClear and grub Area for new construction
Removal of structures and obstructionsIncludes removal of guardrail/barrier, fencing, pavement marking, signing, foundations, walls, etc.
Pavement removal Includes removal of sidewalk Roadway Ex/Embankment/Borrow
Roadway Excavation Assumed new pavement area times 3' depth Gravel Borrow/Embankment Compaction Assumed 1/2 of Roadway Excavation quantity
DrainageRemove drainage structures Assumed probable need. (each site different)Catch Basin Type 1 Assumed probable need. Includes excavation and backfill Catch Basin Type 2 - 48" Assumed probable need. Includes excavation, shoring and backfill
Collection Pipe: 12" PCSSP Assumed probable need. Includes excavation, shoring, backfill and testing
Ditch Excavation Assumed probable need. 2' flat bottom @ 6:1 sideslopes 3' deep @ $15/cyStormwater Detention and Treatment
Detention Ponds (per SF of impervious)Composite price…...Unit Pond for 2 AC impervious: .75 CF of storage per SF of impervious
Water Quality Ponds (per SF of impervious)Composite price……Unit Pond for 2 AC impervious: .12 CF of storage per SF of impervious
2. STRUCTURES Miscellaneous (Restroom building/septic system) Assumed 350k for Restrooms and septic system Miscellaneous (Picnic Table and Concrete Pad) Assumed 2.5k for all work associated to the picnic table
3. SURFACING/PAVING
Asphalt Concrete PavementComposite price includes paving (0.6' depth), surfacing (1.0' depth), price adjustments, tack coat
4. ROADSIDE DEVELOPMENT
Fencing Assume Chain Link Type 1 @$10/ft. with $5/ft for end/corner posts and gates Seeding, Mulching, and Fertilizing Assumed probable need.
5. TRAFFIC SERVICES AND SAFETY Illumination Assumed probable need. per each luminaire Signing Assumed probable need.
Curb, gutter and sidewalk $30/SY for sidewalk, assume 6' wide 6. MISCELLANEOUS ITEMS
Temporary Water Pollution Control Traffic Control
Utility Relocation Utility relocations and additional costs to roadway design to accommodate utilities
Misc. ItemsItems not accounted for at this level of design. Anticipated to be greater for complex urban projects.
Mobilization
Construction Contingency Changes during constructionConstruction Administration Managing the Project during construction
Preliminary Engineering Design/Permitting
DOES NOT INCLUDEEnvironmental Mitigation Not accounted forRight-of-Way Not accounted for
October 2005 │ 214-1631-048 (02) E-1

WSDOT Truck Parking StudyOption 1b (PRA Reconfiguration) - Area A
Estimated EstimatedItem Unit Unit Price Units Cost
1. GRADING/DRAINAGE Clear & Grub, Demolition Clear and grub AC $5,000 0.65 $3,250 Removal of structures and obstructions EST $10,000 1.00 $10,000 Pavement removal SY $10 140 $1,400 Roadway Ex/Embankment/Borrow Roadway Excavation CY $10 2965 $29,650 Gravel Borrow/Embankment Compaction Ton $12 1483 $17,790 Drainage Remove drainage structures EA $400 8 $3,200 Catch Basin Type 1 EA $800 6 $4,800 Catch Basin Type 2 - 48" EA $3,500 1 $3,500 Collection Pipe: 12" PCSSP LF $50 1000 $50,000 Ditch Excavation LF $15 300 $4,500 Stormwater Detention and Treatment Detention Ponds (per SF of impervious) SF $1.13 16450 $18,589 Water Quality Ponds (per SF of impervious) SF $0.45 16450 $7,403
3. SURFACING/PAVINGAsphalt Concrete Pavement SF $4.05 16450 $66,568
4. ROADSIDE DEVELOPMENT Seeding, Mulching, and Fertilizing AC $5,000 0.20 $975
5. TRAFFIC SERVICES AND SAFETY Illumination EA $8,000 4.00 $32,000 Signing EST $10,000 1.00 $10,000
Curb, gutter and sidewalk LF $39 300.00 $11,700Sub total $275,324
6. MISCELLANEOUS ITEMS
Temporary Water Pollution Control % 4% $11,013 Traffic Control % 4% $11,013
Utility Relocation % 5% $13,766Misc. Items % 8% $22,026
Sub total $333,142Mobilization % 10% $33,314
Sub total $366,456Construction Contingency % 5% $18,323Construction Administration % 18% $65,962
Total Construction Cost $450,741Preliminary Engineering % 20% $90,148
18 Truck Parking Stalls $540,890Price Per Stall $30,049Design Vehicle - WB-40DOES NOT INCLUDEEnvironmental MitigationRight-of-Way
October 2005 │ 214-1631-048 (02) E-2

WSDOT Truck Parking StudyOption 1b (PRA Reconfiguration) - Area B
Estimated EstimatedItem Unit Unit Price Units Cost
1. GRADING/DRAINAGE Clear & Grub, Demolition Clear and grub AC $5,000 0.44 $2,200 Removal of structures and obstructions EST $10,000 1 $10,000 Pavement removal SY $10 300 $3,000 Roadway Ex/Embankment/Borrow Roadway Excavation CY $10 2140 $21,400 Gravel Borrow/Embankment Compaction Ton $12 1070 $12,840 Drainage Remove drainage structures EA $400 6 $2,400 Catch Basin Type 1 EA $800 6 $4,800 Catch Basin Type 2 - 48" EA $3,500 1 $3,500 Collection Pipe: 12" PCSSP LF $50 1200 $60,000 Ditch Excavation LF $15 300 $4,500 Stormwater Detention and Treatment Detention Ponds (per SF of impervious) SF $1.13 19225 $21,724 Water Quality Ponds (per SF of impervious) SF $0.45 19225 $8,651
3. SURFACING/PAVING Asphalt Concrete Pavement SF $4.05 19225 $77,798
4. ROADSIDE DEVELOPMENT Seeding, Mulching, and Fertilizing AC $5,000 0.05 $250 Roadside Restoration EST $2,000 1.00 $2,000
5. TRAFFIC SERVICES AND SAFETY Illumination EA $8,000 8 $64,000 Signing EST $10,000 1 $10,000
Sub total $309,0636. MISCELLANEOUS ITEMS
Temporary Water Pollution Control % 4% $12,363 Traffic Control % 4% $12,363 Utility Relocation % 5% $15,453 Misc. Items % 8% $24,725
Sub total $373,967Mobilization % 10% $37,397
Sub total $411,363Construction Contingency % 5% $20,568Construction Administration % 18% $74,045
Total Construction Cost $505,977Preliminary Engineering % 20% $101,195
18 Truck Parking Stalls $607,172Price Per Stall $33,732Design Vehicle - WB-40DOES NOT INCLUDEEnvironmental MitigationRight-of-Way
October 2005 │ 214-1631-048 (02) E-3
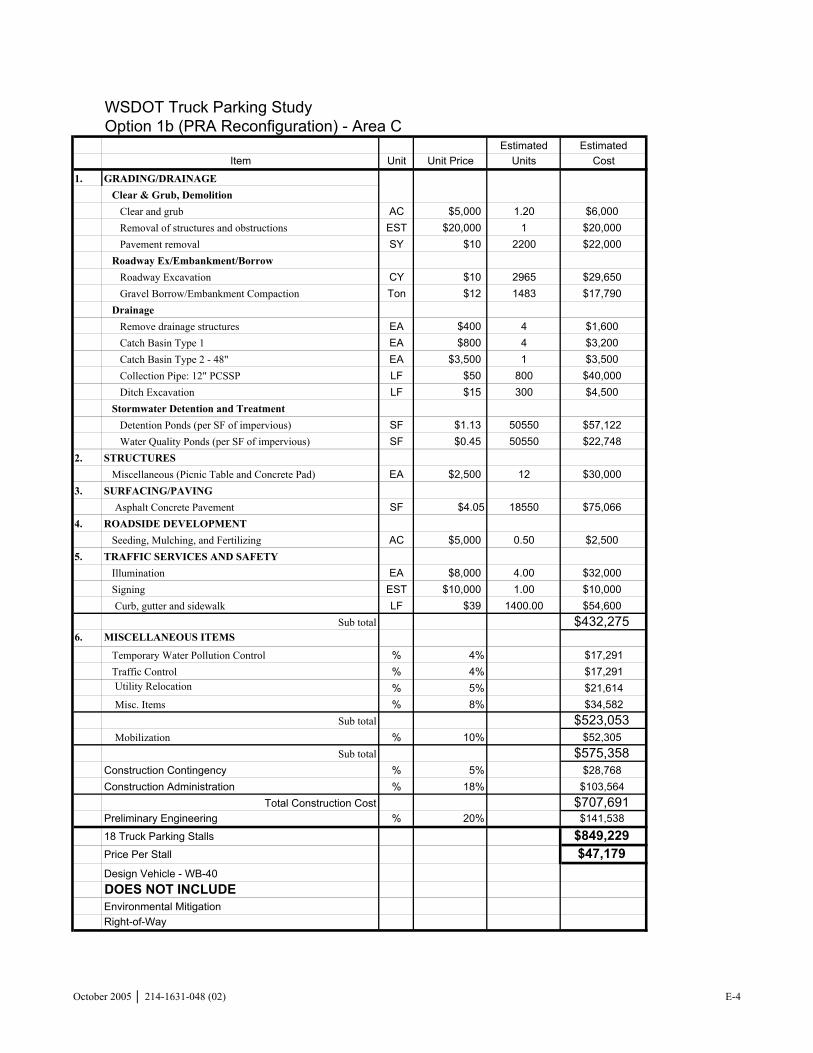
WSDOT Truck Parking StudyOption 1b (PRA Reconfiguration) - Area C
Estimated EstimatedItem Unit Unit Price Units Cost
1. GRADING/DRAINAGE Clear & Grub, Demolition Clear and grub AC $5,000 1.20 $6,000 Removal of structures and obstructions EST $20,000 1 $20,000 Pavement removal SY $10 2200 $22,000 Roadway Ex/Embankment/Borrow Roadway Excavation CY $10 2965 $29,650 Gravel Borrow/Embankment Compaction Ton $12 1483 $17,790 Drainage Remove drainage structures EA $400 4 $1,600 Catch Basin Type 1 EA $800 4 $3,200 Catch Basin Type 2 - 48" EA $3,500 1 $3,500 Collection Pipe: 12" PCSSP LF $50 800 $40,000 Ditch Excavation LF $15 300 $4,500 Stormwater Detention and Treatment Detention Ponds (per SF of impervious) SF $1.13 50550 $57,122 Water Quality Ponds (per SF of impervious) SF $0.45 50550 $22,748
2. STRUCTURES Miscellaneous (Picnic Table and Concrete Pad) EA $2,500 12 $30,000
3. SURFACING/PAVINGAsphalt Concrete Pavement SF $4.05 18550 $75,066
4. ROADSIDE DEVELOPMENT Seeding, Mulching, and Fertilizing AC $5,000 0.50 $2,500
5. TRAFFIC SERVICES AND SAFETY Illumination EA $8,000 4.00 $32,000 Signing EST $10,000 1.00 $10,000
Curb, gutter and sidewalk LF $39 1400.00 $54,600Sub total $432,275
6. MISCELLANEOUS ITEMS
Temporary Water Pollution Control % 4% $17,291 Traffic Control % 4% $17,291
Utility Relocation % 5% $21,614Misc. Items % 8% $34,582
Sub total $523,053Mobilization % 10% $52,305
Sub total $575,358Construction Contingency % 5% $28,768Construction Administration % 18% $103,564
Total Construction Cost $707,691Preliminary Engineering % 20% $141,538
18 Truck Parking Stalls $849,229Price Per Stall $47,179Design Vehicle - WB-40DOES NOT INCLUDEEnvironmental MitigationRight-of-Way
October 2005 │ 214-1631-048 (02) E-4

WSDOT Truck Parking StudyOption 1b (PRA Reconfiguration) - Area D
Estimated EstimatedItem Unit Unit Price Units Cost
1. GRADING/DRAINAGE Clear & Grub, Demolition Clear and grub AC $5,000 1.43 $7,150 Removal of structures and obstructions EST $20,000 1 $20,000 Pavement removal SY $10 925 $9,250 Roadway Ex/Embankment/Borrow Roadway Excavation CY $10 7640 $76,400 Gravel Borrow/Embankment Compaction Ton $12 3820 $45,840 Drainage Remove drainage structures EA $400 10 $4,000 Catch Basin Type 1 EA $800 8 $6,400 Catch Basin Type 2 - 48" EA $3,500 1 $3,500 Collection Pipe: 12" PCSSP LF $50 1800 $90,000 Ditch Excavation LF $15 300 $4,500 Stormwater Detention and Treatment Detention Ponds (per SF of impervious) SF $1.13 68730 $77,665 Water Quality Ponds (per SF of impervious) SF $0.45 68730 $30,929
2. STRUCTURES Miscellaneous (Picnic Table and Concrete Pad) EA $2,500 6 $15,000
3. SURFACING/PAVINGAsphalt Concrete Pavement SF $4.05 68730 $278,129
4. ROADSIDE DEVELOPMENT Seeding, Mulching, and Fertilizing AC $5,000 0.50 $2,500
5. TRAFFIC SERVICES AND SAFETY Illumination EA $8,000 8.00 $64,000 Signing EST $10,000 1.00 $10,000
Curb, gutter and sidewalk LF $39 635.00 $24,765$770,028
6. MISCELLANEOUS ITEMS
Temporary Water Pollution Control % 4% $30,801 Traffic Control % 4% $30,801
Utility Relocation % 5% $38,501Misc. Items % 8% $61,602
$931,734Mobilization % 10% $93,173
Sub total $1,024,907Construction Contingency % 5% $51,245Construction Administration % 18% $184,483
Total Construction Cost $1,260,636Preliminary Engineering % 20% $252,127
26 Truck Parking Stalls $1,512,763Price Per Stall $58,183Design Vehicle - WB-40DOES NOT INCLUDEEnvironmental MitigationRight-of-Way
October 2005 │ 214-1631-048 (02) E-5

WSDOT Truck Parking StudyOption 1b (PRA Reconfiguration) - Area E
Estimated EstimatedItem Unit Unit Price Units Cost
1. GRADING/DRAINAGE Clear & Grub, Demolition Clear and grub AC $5,000 1.27 $6,350 Removal of structures and obstructions EST $10,000 1 $10,000 Pavement removal SY $10 125 $1,250 Roadway Ex/Embankment/Borrow Roadway Excavation CY $10 6185 $61,850 Gravel Borrow/Embankment Compaction Ton $12 3093 $37,110 Drainage Catch Basin Type 1 EA $800 4 $3,200 Catch Basin Type 2 - 48" EA $3,500 1 $3,500 Collection Pipe: 12" PCSSP LF $50 1000 $50,000 Ditch Excavation LF $15 300 $4,500 Stormwater Detention and Treatment Detention Ponds (per SF of impervious) SF $1.13 55640 $62,873 Water Quality Ponds (per SF of impervious) SF $0.45 55640 $25,038
3. SURFACING/PAVINGAsphalt Concrete Pavement SF $4.05 55640 $225,158
4. ROADSIDE DEVELOPMENT Seeding, Mulching, and Fertilizing AC $5,000 0.20 $1,000
5. TRAFFIC SERVICES AND SAFETY Illumination EA $8,000 4.00 $32,000 Signing EST $10,000 1.00 $10,000
Sub total $533,8296. MISCELLANEOUS ITEMS
Temporary Water Pollution Control % 4% $21,353 Traffic Control % 4% $21,353
Utility Relocation % 5% $26,691Misc. Items % 8% $42,706
Sub total $645,934Mobilization % 10% $64,593
Sub total $710,527Construction Contingency % 5% $35,526Construction Administration % 18% $127,895
Total Construction Cost $873,948Preliminary Engineering % 20% $174,790
14 Truck Parking Stalls $1,048,738Price Per Stall $74,910Design Vehicle - WB-50 and WB-67DOES NOT INCLUDEEnvironmental MitigationRight-of-Way
October 2005 │ 214-1631-048 (02) E-6

WSDOT Truck Parking StudyOption 1c (Truck-Only Facility; variation of "Ohio Solution")
Estimated EstimatedItem Unit Unit Price Units Cost
1. GRADING/DRAINAGE Clear & Grub, Demolition Clear and grub AC $5,000 4.50 $22,500 Removal of structures and obstructions EST $20,000 1 $20,000 Roadway Ex/Embankment/Borrow Roadway Excavation CY $10 19422 $194,220 Gravel Borrow/Embankment Compaction Ton $12 9711 $116,532 Drainage Catch Basin Type 1 EA $800 10 $8,000 Catch Basin Type 2 - 48" EA $3,500 3 $10,500 Collection Pipe: 12" PCSSP LF $50 2000 $100,000 Ditch Excavation LF $15 500 $7,500 Stormwater Detention and Treatment Detention Ponds (per SF of impervious) SF $1.13 174800 $197,524 Water Quality Ponds (per SF of impervious) SF $0.45 174800 $78,660
2. STRUCTURES Miscellaneous (Restroom building/septic system) EA $350,000 1 $350,000
3. SURFACING/PAVINGAsphalt Concrete Pavement SF $4.05 174800 $707,363
4. ROADSIDE DEVELOPMENT Fencing LF $15 2750.00 $41,250 Seeding, Mulching, and Fertilizing AC $5,000 1.00 $5,000
5. TRAFFIC SERVICES AND SAFETY Illumination EA $8,000 8.00 $64,000 Signing EST $20,000 1.00 $20,000
Sub total $1,943,0496. MISCELLANEOUS ITEMS
Temporary Water Pollution Control % 4% $77,722 Traffic Control % 4% $77,722
Utility Relocation % 5% $97,152Misc. Items % 8% $155,444
Sub total $2,351,089Mobilization % 10% $235,109
Sub total $2,586,198Construction Contingency % 5% $129,310Construction Administration % 18% $465,516
Total Construction Cost $3,181,023Preliminary Engineering % 20% $636,205
16 Truck Parking Stalls $3,817,228Design Vehicle - WB-67DOES NOT INCLUDEEnvironmental MitigationRight-of-Way AC 5.2 Needed
October 2005 │ 214-1631-048 (02) E-7

WSDOT Truck Parking StudyOption 1c Per Additional Stall
Estimated EstimatedItem Unit Unit Price Units Cost
1. GRADING/DRAINAGE Clear & Grub, Demolition Clear and grub AC $5,000 0.08 $400 Removal of structures and obstructions EST $20,000 0 $0 Roadway Ex/Embankment/Borrow Roadway Excavation CY $10 370 $3,700 Gravel Borrow/Embankment Compaction Ton $12 185 $2,220 Drainage Catch Basin Type 1 EA $800 0 $0 Catch Basin Type 2 - 48" EA $3,500 0 $0 Collection Pipe: 12" PCSSP LF $50 20 $1,000 Ditch Excavation LF $15 0 $0 Stormwater Detention and Treatment Detention Ponds (per SF of impervious) SF $1.13 3300 $3,729 Water Quality Ponds (per SF of impervious) SF $0.45 3300 $1,485
2. STRUCTURES Miscellaneous (Restroom building/septic system) EA $350,000 0 $0
3. SURFACING/PAVINGAsphalt Concrete Pavement SF $4.05 3300 $13,354
4. ROADSIDE DEVELOPMENT Fencing LF $15 20.00 $300 Seeding, Mulching, and Fertilizing AC $5,000 0.00 $0
5. TRAFFIC SERVICES AND SAFETY Illumination EA $8,000 0.00 $0 Signing EST $20,000 0.00 $0
Sub total $26,1886. MISCELLANEOUS ITEMS
Temporary Water Pollution Control % 4% $1,048 Traffic Control % 4% $1,048
Utility Relocation % 5% $1,309Misc. Items % 8% $2,095
Sub total $31,688Mobilization % 10% $3,169
Sub total $34,856Construction Contingency % 5% $1,743Construction Administration % 18% $6,274
Total Construction Cost $42,873Preliminary Engineering % 20% $8,575
Price Per Stall $51,448DOES NOT INCLUDEEnvironmental MitigationRight-of-Way AC 0.02 Needed per stall
October 2005 │ 214-1631-048 (02) E-8

WSDOT Truck Parking StudyStrategy 2 (Legalize Truck Parking at Weigh Stations and Expand)
Estimated EstimatedItem Unit Unit Price Units Cost
1. GRADING/DRAINAGE Clear & Grub, Demolition Clear and grub AC $5,000 4.75 $23,750 Removal of structures and obstructions EST $20,000 1 $20,000 Pavement removal SY $10 100 $1,000 Roadway Ex/Embankment/Borrow Roadway Excavation CY $10 22916 $229,160 Gravel Borrow/Embankment Compaction Ton $12 11458 $137,496 Drainage Catch Basin Type 1 EA $800 12 $9,600 Catch Basin Type 2 - 48" EA $3,500 2 $7,000 Collection Pipe: 12" PCSSP LF $50 1600 $80,000 Ditch Excavation LF $15 500 $7,500 Stormwater Detention and Treatment Detention Ponds (per SF of impervious) SF $1.13 207250 $234,193 Water Quality Ponds (per SF of impervious) SF $0.45 207250 $93,263
3. SURFACING/PAVINGAsphalt Concrete Pavement SF $4.05 207250 $838,678
4. ROADSIDE DEVELOPMENT Fencing LF $15 1755 $26,325 Seeding, Mulching, and Fertilizing AC $5,000 0.75 $3,750
5. TRAFFIC SERVICES AND SAFETY Illumination EA $8,000 8.00 $64,000 Signing EST $15,000 1.00 $15,000
Sub total $1,790,7146. MISCELLANEOUS ITEMS
Temporary Water Pollution Control % 4% $71,629 Traffic Control % 4% $71,629
Utility Relocation % 5% $89,536Misc. Items % 8% $143,257
Sub total $2,166,764Mobilization % 10% $216,676
Sub total $2,383,440Construction Contingency % 5% $119,172Construction Administration % 18% $429,019
Total Construction Cost $2,931,632Preliminary Engineering % 20% $586,326
52 Truck Parking Stalls $3,517,958Design Vehicle - WB-67DOES NOT INCLUDEEnvironmental MitigationRight-of-Way AC 8.8 to 13.1 Needed
October 2005 │ 214-1631-048 (02) E-9

WSDOT Truck Parking StudyStrategy 2 Per Additional Stall
Estimated EstimatedItem Unit Unit Price Units Cost
1. GRADING/DRAINAGE Clear & Grub, Demolition Clear and grub AC $5,000 0.10 $500 Removal of structures and obstructions EST $20,000 0 $0 Pavement removal SY $10 0 $0 Roadway Ex/Embankment/Borrow Roadway Excavation CY $10 485 $4,850 Gravel Borrow/Embankment Compaction Ton $12 243 $2,910 Drainage Catch Basin Type 1 EA $800 0 $0 Catch Basin Type 2 - 48" EA $3,500 0 $0 Collection Pipe: 12" PCSSP LF $50 20 $1,000 Ditch Excavation LF $15 0 $0 Stormwater Detention and Treatment Detention Ponds (per SF of impervious) SF $1.13 4360 $4,927 Water Quality Ponds (per SF of impervious) SF $0.45 4360 $1,962
3. SURFACING/PAVINGAsphalt Concrete Pavement SF $4.05 4360 $17,644
4. ROADSIDE DEVELOPMENT Fencing LF $15 20 $300 Seeding, Mulching, and Fertilizing AC $5,000 0.00 $0
5. TRAFFIC SERVICES AND SAFETY Illumination EA $8,000 0.00 $0 Signing EST $15,000 0.00 $0
Sub total $34,0926. MISCELLANEOUS ITEMS
Temporary Water Pollution Control % 4% $1,364 Traffic Control % 4% $1,364
Utility Relocation % 5% $1,705Misc. Items % 8% $2,727
Sub total $41,252Mobilization % 10% $4,125
Sub total $45,377Construction Contingency % 5% $2,269Construction Administration % 18% $8,168
Total Construction Cost $55,814Preliminary Engineering % 20% $11,163
Price Per Stall $66,976DOES NOT INCLUDEEnvironmental MitigationRight-of-Way AC 0.02 Needed per stall
October 2005 │ 214-1631-048 (02) E-10

APPENDIX F
Air Quality

October 2005 │ 214-1631-048 (02) F-1
Air Quality and Idle Reduction BACKGROUND According to the West Coast Diesel Emissions Reduction Collaborative (Collaborative)1, idling commercial long-haul trucks consume nearly a billion gallons of diesel fuel each year in the United States2. The U.S. EPA3 and Oak Ridge National Laboratory4 (ORNL) estimated that an average of 536 pounds of NOx, 15 pounds of particulate matter, and 37,600 pounds of CO2 are emitted annually by the typical long-haul truck from idling alone. These emissions reduce local air quality and add to green house gas effects. Due to the environmental implications associated with commercial truck idling, the Collaborative is studying several projects that would reduce truck idling. One of these projects looks toward truck electrified parking (TEP) technology as a solution for reducing emissions from truck idling. TEP technology allows truckers to shut off their engine and maintain power to generate cab amenities (heating, ventilation, air conditioning, refrigeration, television) through an outside power source. While TEP technology would substantially reduce idling emissions, implementation would require changes to truck stop infrastructure, commercial truck retrofitting, and education and outreach to the trucking industry. WSDOT as part of the Truck Parking Study has investigated some of the options to reduce truck idling diesel emissions. TRUCK IDLING REDUCTION TECHNOLOGIES TABLE 1 Technology Function Benefits Drawbacks Technology
Status Direct-fired Heater Heating for
cabs/sleeper and/or engine.
Can be used at any stop for heating. Small and lightweight.
Cannot provide cooling. Requires battery power and may be unreliable when not equipped with automatic engine starting.
Commercial
Auxiliary power unit Heating and air conditioning of cab/sleeper, heat for engine, and power for auxiliaries.
Can be used at any stop for heating, cooling, and auxiliaries. Recovers waste heat for space heating. Serves as survival system.
Heavier and larger than direct-fired heater. May require separate sleeper air conditioner.
Commercial
1 The West Coast Diesel Emissions Reduction Collaborative consists of federal government agencies (U.S., Canada, and Mexico), state and local governments, and non-profit and private sector partners from California, Oregon, Washington, Alaska and British Columbia. 2 Idle Reduction Projects Plan for Long-Haul Trucks in WA, OR and CA. Last consulted: September 2005. http://www.westcoastdiesel.org/files/projects/trucking/WCDERC_Truck%20Idle%20Reduction_The%20Big%20Picture%202.pdf 3 Guidance for Quantifying and Using Long Duration Truck Idling Emission Reductions in State Implementation Plans and Transportation Conformity – U.S. EPA, January 2004. 4 Particulate Matter and Aldehyde Emissions from Idling Heavy Duty Diesel Trucks. ORNL, 2003.

October 2005 │ 214-1631-048 (02) F-2
Thermal Storage Heating and air-conditioning for cab/sleeper only.
Driver comfort. Does not heat engine. Requires relatively large space for storage medium. Performance dependent on truck use.
At or near-commercial. Commercial in other applications
Direct heat with thermal storage cooling
Heating and air-conditioning of cab/sleeper and heat for engine.
Can be used at any stop for heating and cooling.
Requires battery power.
Commercial
Truck electrified parking (TEP)
Provides electricity for heating, air-conditioning, and auxiliaries.
Provides power for heating and cooling and auxiliaries.
Limited choice of over-night location. Requires separate sleeper air conditioner and electrically powered heater. Requires infrastructure at the truck stop.
At or near commercial
Automatic Start/Stop systems
Automatically starts or stops the main tractor engine based on engine computer module settings.
Reduces engine idle time while maintaining engine oil temperature and battery voltage. May also be set to monitor and maintain cab temperature.
Limited use in extreme temperatures. May need additional deep cycle batteries.
Commercial
Battery Packs Provides power from battery packs to directly operate HVAC system or to circulate engine coolant for heating cab.
Provides cab heating and cooling and may run other amenities for short periods of time.
Limited amount of time it can be run before batteries need recharging. Added space and weight.
Commercial
Note: This table was taken from the Analysis of Technology Options to Reduce the fuel Consumption of Idling Trucks – U.S. Dept of Energy, June 2000, and supplemented with information from the EPA SmartWay Transport Partnership idling reduction web page (http://www.epa.gov/otaq/smartway/idling.htm) NON-TECHNOLOGY OPTIONS FOR REDUCING IDLING Behavioral Change Behavioral Change is the simplest route to reduce idling. Education and driver incentives play an important role in behavioral change. Informing the driver or operator about the fuel consumption, emissions, and the potential health risks plays an important part in changing behavior. Another powerful tool in changing driver behavior is offering financial incentives to reduce idling. Many large trucking companies already offer these incentives and they have reported success in reducing idling times below national averages. Simply instituting a company policy to not idle has not proven effective in changing behavior and no company policy is going to deter a driver or operator from idling in extreme weather conditions. Education and incentives provide a partial solution to deter idling. Often, the need for climate control requires implementing an idle reduction technology. State and Local Anti-idling Laws

October 2005 │ 214-1631-048 (02) F-3
In about half the country, state and local jurisdictions have passed laws or ordinances limiting a vehicle's idling time. Many of these laws, however, differ from one state to another in terms of the engine idle time limit and exemptions (e.g., temperature). This patchwork of anti-idling laws creates confusion and a general lack of understanding among the nation's truck drivers. The USEPA is committed to working with states and the trucking industry to establish guidelines for improved anti-idling laws.
In February 2003, EPA developed a list of state and local anti-idling laws (http://www.epa.gov/otaq/smartway/documents/statelaws.pdf) (EPA420-S-03-002, February 2003). Since the publication of this document, new state and local anti-idling laws may have been passed and existing laws may have been modified. American Transportation Research Institute's (ATRI) provides a more current list of laws (http://atri-online.org/research/results/idling_chart.pdf)
In an effort to create consistent laws across the country, EPA hosted a series of state/industry workshops around the country. The purpose of the workshops was to develop a model state or local idling law for states or counties that wish to regulate idling. EPA convened representatives from state air pollution control agencies and trucking associations, as well as truck drivers. The goal was to develop a consensus approach to idle control policies and eliminate inconsistencies that are confusing to the trucking industry. The model law should be completed and available early next year.
EPA is not planning any Federal laws with respect to idling times and is not encouraging states to adopt or to not adopt idling laws. Rather, EPA is developing this model law at the request of both states and trucking companies to bring more consistency to the patchwork of existing laws and to ensure that laws are reasonable for feasible industry compliance.
CURRENT PLANS
Ecology is currently working on several truck idling reduction projects in Washington State at commercial truck stops that will run for the next several years5. The outcome of these studies and pilot programs will verify the benefits and costs of TEP technology. The Washington State Department of Transportation (WSDOT) is also working with the Department of Ecology on diesel reduction alternatives that WSDOT can implement. Once Ecology finalizes the alternative priority list, WSDOT will work with Ecology on the most practical alternative(s) for WSDOT to implement.
5 Reducing Engine Idling at Truck Stops. WSDOE Focus Report October 2005.