tropospheric o 3 and co seasonal variability over south...

1
Tropospheric O 3 and CO seasonal variability over South Asia: IASI observations and GEOS-Chem simulations B. Barret, B. Sauvage, E. Le Flochmoën, M. Yamasoe, A. Gressent Laboratoire d’Aérologie, Université de Toulouse, CNRS, France contact: [email protected] ; [email protected] References 5- Conclusions IASI enables the characterization of the seasonal variations of O 3 and CO in the troposphere over South Asia, with however a low sensitivity to O 3 in the lowermost troposphere leading to an underestimation of the winter-spring O 3 pollution-related near the surface compared to MOZAIC. The main features of the seasonal variations of O 3 and CO, i.e. a broad winter-spring maximum and a summer minimum, are captured by the GEOS-Chem model. O 3 is slightly underestimated by the model while the low bias is larger for CO. A large fraction of tropospheric O 3 is driven by lightning NOx emissions. Regional sources have a low impact on the regional O 3 budget. Anthropogenic emissions have the largest influence over the Bay of Bengal. The springtime O 3 maximum is likely to be related with stratospheric intrusions. [1] B. Barret, et al., The detection of post-monsoon tropospheric ozone variability over south Asia using IASI data, Atmos. Chem. Phys., 11, 9533-9548, 2011. [2] E. De Wachter et al., Retrieval of MetOp-A/IASI CO profiles and validation with MOZAIC data, Atmos. Meas. Tech., 5, 2843-2857, 2012. [3] S. Srivastava et al., Influence of regional pollution and long range transport over western India: analysis of ozonesonde data, Atmos. Env., 47, 174-182, 2012. [4] M. Lawrence and J. Lelieveld, Atmospheric pollutant outflow from southern Asia: a review , Atmos. Chem. Phys. Discuss., 10, 9463-9646, 2010. [5] S. Srivastana et al., Vertical distribution of ozone in the lower troposphere over the Bay of Bengal and the Arabian Sea during ICARB 2006: Effects of continental outflow, J. Geophys., Res., 116, D13301, 2011. Motivation and Objectives Rationale and Objectives South-Asia is one of the most heavily populated and polluted region. Tropospheric pollution over there is controlled by both large scale transport and local sources. During most of the year, stable and dry conditions promote high pollution levels. During summer, the monsoon flux brings clean oceanic air over the region and precipitations that clean the troposphere. Changing weather conditions also drive large intra-seasonal variability of the O 3 concentrations [1]. Many studies based on local ozonesonde observations [3] and large scale observation campaigns [4] have allowed to better understand the seasonal variations of the O 3 distribution over this region. Nevertheless, global observations are necessary to document the O 3 and CO distributions and to validate models over the whole region. Since 2006 the Infrared Atmospheric Sounding Interferometer (IASI) measures tropospheric O 3 [1] and CO [2] from space with an unprecedented spatio-temporal coverage (overpass twice daily). Here we use the IASI data to document the seasonal variations of these species over the whole South-Asian region. MOZAIC airborne observations are used to validate IASI over central India at Hyderabad. Chemistry transport simulations are performed to understand the sources driving O 3 over South Asia at the seasonal scale. Here we show preliminary results of comparisons between the O 3 and CO distributions observed by IASI and modeled by the GEOS-Chem model. 1-Observations and modeling The GEOS GEOS-Chem Chem global chemistry transport model is used with full chemistry and through sensitivity studies by reducing NO x sources (at global and local scale). -0.25 0.00 0.25 0.50 0.75 1.00 Averaging Kernels 50 100 200 300 400 500 700 900 Pressure (hPa) -0.05 0.00 0.05 0.10 0.15 0.20 5.0 10.0 15.0 20.0 O 3 and CO and CO profiles were retrieved from IASI with the Software for a Fast Retrieval of IASI Data (SOFRID) [1,2], based on the RTTOV radiative transfer code and on a 1D-Var retrieval scheme. The retrieved profiles contain about 2 independent pieces of information in the tropical troposphere corresponding roughly to the 565 hPa (750 hPa for CO) and 170 hPa levels. The estimated random errors are below 20% [1,2]. Fig. 1: IASI O 3 averaging kernels over the Arabian Sea. Color lines for individual levels. Solid line for lower tropospheric column and dashed line for UTLS column. 3-Distributions of tropospheric O 3 and CO over South Asia during the monsoon period GC smoothed with AK IASI July (monsoon max.) Sept. (monsoon withdrawal) May (monsoon onset) Low and middle tropospheric CO and O 3 distributions are mostly impacted by the monsoon flow between April/May and September/October: In May, most of the Indian region (Western India & the Arabian Sea) is characterized by high tropospheric O 3 (at 565hPa) resulting from long range transport from Europe and the Middle East as documented in [3]. Over the Bay of Bengal high ozone is mostly influenced by the pollution outflow from the Indo Gangetic Plain [5]. CO anomaly seems to be locally- related and located mainly over central India at 750hPa. In July, O 3 and CO are lower over most of the south Asian region. The south-western monsoon flux is bringing clean marine air over this region decreasing pollutant concentrations. In September, high O 3 related to regional pollution is observed and modeled over the Northern Arabian Sea and Northern India while the monsoon flux is withdrawing southwards, [3]. High CO is located over North-East India and Nepal downwind of regional pollution from South East Asia. GEOS-Chem and IASI are in good agreement in the localization of the O 3 and CO extrema over South Asia. Some biases appear in the distributions of these species (see part.4) Fig. 2: monthly distributions of tropospheric (565 hPa) O 3 and (750hPa) CO mixing ratios simulated by GEOS-Chem (smoothed with averaging kernels) and observed by IASI from May to September 2009. monsoon flow GC smoothed with AK IASI Lower tropospheric pollution associated with stable anticyclonic circulation is observed in winter and spring. •Between March and May the upper troposphere is characterized by high/low O 3 /CO associated with strong undulation of the subtropical westerly jet. 2-MOZAIC and IASI O 3 and CO profiles over Hyderabad, India •During the monsoon season O 3 and CO reach their minima in the lower troposphere. -0.25 0.00 0.25 0.50 0.75 1.00 Averaging Kernels 50 100 200 300 400 500 700 900 Pressure (hPa) -0.05 0.00 0.05 0.10 0.15 0.20 5.0 10.0 15.0 20.0 Fig. 1: IASI O 3 averaging kernels over the Arabian Sea. Color lines for individual levels. Solid line for lower tropospheric column and dashed line for UTLS column. 1 monsoon flow O 3 (ppb) CO (ppb) IASI captures the variations of CO and O 3 observed by MOZAIC. Below 700 hPa IASI underestimates the O 3 variations because of a lower sensitivity. Model vs IASI O 3 and CO comparison for 3 different regions of South Asia shows a good agreement in the seasonal variations, with lower values during the monsoon season and higher values in winter and spring. •GEOS-Chem O 3 smoothed with the averaging kernels is lower than IASI by 5 to 10ppbv. Simulated CO presents larger discrepancies, with 20 to 40 ppb low bias relative to IASI. 4-Anthropogenic and lightning NOx influence over South Asia •Sensitivity tests on lightning and anthropogenic NO x sources have been realized at global scale and for regional sources. Anthropogenic NO x sources have low influence on O 3 for the 3 regions with 5 ppb maximum for global sources. Bay of Bengal is the most affected region. Lightning NO x sources seem to drive O 3 in South Asia, mostly with sources located outside of the region with 5 to 20 ppb of O 3 related to global lightnings. Without Lightning NOx, the spring O 3 max remains, indicating a likely stratospheric influence.

Upload: others

Post on 14-Mar-2020

6 views

Category:

Documents


0 download

TRANSCRIPT

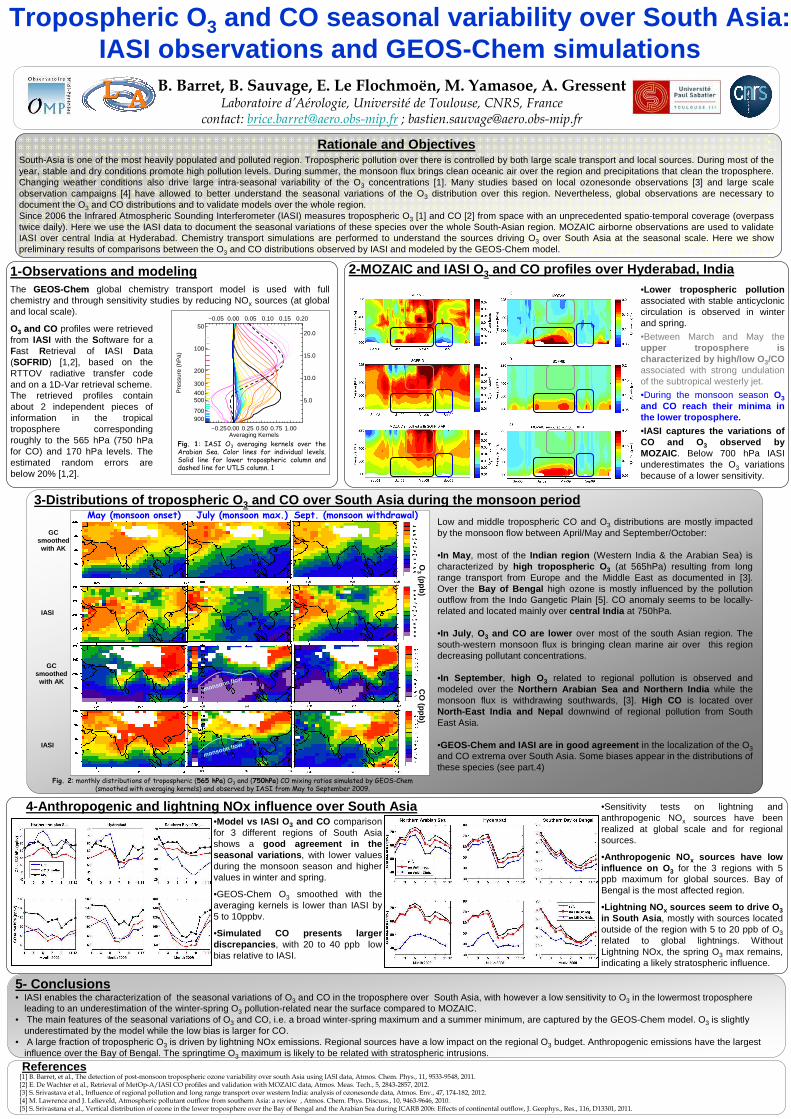
Tropospheric O3 and CO seasonal variability over South Asia: IASI observations and GEOS-Chem simulations

B. Barret, B. Sauvage, E. Le Flochmoën, M. Yamasoe, A. GressentLaboratoire d’Aérologie, Université de Toulouse, CNRS, France

contact: [email protected] ; [email protected]

References

5- Conclusions • IASI enables the characterization of the seasonal variations of O3 and CO in the troposphere over South Asia, with however a low sensitivity to O3 in the lowermost troposphere

leading to an underestimation of the winter-spring O3 pollution-related near the surface compared to MOZAIC.• The main features of the seasonal variations of O3 and CO, i.e. a broad winter-spring maximum and a summer minimum, are captured by the GEOS-Chem model. O3 is slightly

underestimated by the model while the low bias is larger for CO.• A large fraction of tropospheric O3 is driven by lightning NOx emissions. Regional sources have a low impact on the regional O3 budget. Anthropogenic emissions have the largest

influence over the Bay of Bengal. The springtime O3 maximum is likely to be related with stratospheric intrusions.

[1] B. Barret, et al., The detection of post-monsoon tropospheric ozone variability over south Asia using IASI data, Atmos. Chem. Phys., 11, 9533-9548, 2011.[2] E. De Wachter et al., Retrieval of MetOp-A/IASI CO profiles and validation with MOZAIC data, Atmos. Meas. Tech., 5, 2843-2857, 2012.[3] S. Srivastava et al., Influence of regional pollution and long range transport over western India: analysis of ozonesonde data, Atmos. Env., 47, 174-182, 2012.[4] M. Lawrence and J. Lelieveld, Atmospheric pollutant outflow from southern Asia: a review , Atmos. Chem. Phys. Discuss., 10, 9463-9646, 2010. [5] S. Srivastana et al., Vertical distribution of ozone in the lower troposphere over the Bay of Bengal and the Arabian Sea during ICARB 2006: Effects of continental outflow, J. Geophys., Res., 116, D13301, 2011.

Motivation and Objectives Rationale and ObjectivesSouth-Asia is one of the most heavily populated and polluted region. Tropospheric pollution over there is controlled by both large scale transport and local sources. During most of the year, stable and dry conditions promote high pollution levels. During summer, the monsoon flux brings clean oceanic air over the region and precipitations that clean the troposphere. Changing weather conditions also drive large intra-seasonal variability of the O3 concentrations [1]. Many studies based on local ozonesonde observations [3] and large scale observation campaigns [4] have allowed to better understand the seasonal variations of the O3 distribution over this region. Nevertheless, global observations are necessary to document the O3 and CO distributions and to validate models over the whole region. Since 2006 the Infrared Atmospheric Sounding Interferometer (IASI) measures tropospheric O3 [1] and CO [2] from space with an unprecedented spatio-temporal coverage (overpass twice daily). Here we use the IASI data to document the seasonal variations of these species over the whole South-Asian region. MOZAIC airborne observations are used to validate IASI over central India at Hyderabad. Chemistry transport simulations are performed to understand the sources driving O3 over South Asia at the seasonal scale. Here we show preliminary results of comparisons between the O3 and CO distributions observed by IASI and modeled by the GEOS-Chem model.

1-Observations and modelingThe GEOSGEOS--ChemChem global chemistry transport model is used with full chemistry and through sensitivity studies by reducing NOx sources (at global and local scale).

−0.250.00 0.25 0.50 0.75 1.00Averaging Kernels

50

100

200

300

400 500

700 900

Pre

ssur

e (h

Pa)

(a)−0.05 0.00 0.05 0.10 0.15 0.20

5.0

10.0

15.0

20.0 50

100

200

300

400 500

700 900

OO33 and COand CO profiles were retrieved from IASI with the Software for aFast Retrieval of IASI Data (SOFRID) [1,2], based on the RTTOV radiative transfer code and on a 1D-Var retrieval scheme.The retrieved profiles contain about 2 independent pieces of information in the tropical troposphere corresponding roughly to the 565 hPa (750 hPafor CO) and 170 hPa levels. The estimated random errors are below 20% [1,2].

Fig. 1: IASI O3 averaging kernels over the Arabian Sea. Color lines for individual levels. Solid line for lower tropospheric column and dashed line for UTLS column.

3-Distributions of tropospheric O3 and CO over South Asia during the monsoon period

GC smoothedwith AK

IASI

July (monsoon max.) Sept. (monsoon withdrawal)May (monsoon onset)Low and middle tropospheric CO and O3 distributions are mostly impacted by the monsoon flow between April/May and September/October:

•In May, most of the Indian region (Western India & the Arabian Sea) is characterized by high tropospheric O3 (at 565hPa) resulting from long range transport from Europe and the Middle East as documented in [3]. Over the Bay of Bengal high ozone is mostly influenced by the pollution outflow from the Indo Gangetic Plain [5]. CO anomaly seems to be locally-related and located mainly over central India at 750hPa.

•In July, O3 and CO are lower over most of the south Asian region. The south-western monsoon flux is bringing clean marine air over this region decreasing pollutant concentrations.

•In September, high O3 related to regional pollution is observed and modeled over the Northern Arabian Sea and Northern India while the monsoon flux is withdrawing southwards, [3]. High CO is located over North-East India and Nepal downwind of regional pollution from South East Asia.

•GEOS-Chem and IASI are in good agreement in the localization of the O3and CO extrema over South Asia. Some biases appear in the distributions of these species (see part.4)

Fig. 2: monthly distributions of tropospheric (565 hPa) O3 and (750hPa) CO mixing ratios simulated by GEOS-Chem(smoothed with averaging kernels) and observed by IASI from May to September 2009.

monsoon flow

GC smoothedwith AK

IASI

•Lower tropospheric pollutionassociated with stable anticycloniccirculation is observed in winter and spring.

•Between March and May the upper troposphere is characterized by high/low O3/COassociated with strong undulation of the subtropical westerly jet.

2-MOZAIC and IASI O3 and CO profiles over Hyderabad, India

•During the monsoon season O3and CO reach their minima in the lower troposphere.

−0.250.00 0.25 0.50 0.75 1.00Averaging Kernels

50

100

200

300

400 500

700 900

Pre

ssur

e (h

Pa)

(a)−0.05 0.00 0.05 0.10 0.15 0.20

5.0

10.0

15.0

20.0 50

100

200

300

400 500

700 900

Fig. 1: IASI O3 averaging kernels over the Arabian Sea. Color lines for individual levels. Solid line for lower tropospheric column and dashed line for UTLS column. 1

monsoon flow

O3

(pp

b)

CO

(pp

b)

•IASI captures the variations of CO and O3 observed by MOZAIC. Below 700 hPa IASI underestimates the O3 variations because of a lower sensitivity.

•Model vs IASI O3 and CO comparisonfor 3 different regions of South Asiashows a good agreement in theseasonal variations, with lower values during the monsoon season and highervalues in winter and spring.

•GEOS-Chem O3 smoothed with theaveraging kernels is lower than IASI by 5 to 10ppbv.

•Simulated CO presents largerdiscrepancies, with 20 to 40 ppb lowbias relative to IASI.

4-Anthropogenic and lightning NOx influence over South Asia •Sensitivity tests on lightning andanthropogenic NOx sources have beenrealized at global scale and for regionalsources.

•Anthropogenic NOx sources have lowinfluence on O3 for the 3 regions with 5 ppb maximum for global sources. Bay ofBengal is the most affected region.

•Lightning NOx sources seem to drive O3in South Asia, mostly with sources locatedoutside of the region with 5 to 20 ppb of O3related to global lightnings. WithoutLightning NOx, the spring O3 max remains, indicating a likely stratospheric influence.