triple therapy in type 2 diabetes; a systematic … 2 inhibitors (sglt2-i). the outcomes of interest...
TRANSCRIPT

Submitted 23 October 2015Accepted 11 November 2015Published 7 December 2015
Corresponding authorMartin J. Downes,[email protected],[email protected]
Academic editorSusanne la Fleur
Additional Information andDeclarations can be found onpage 16
DOI 10.7717/peerj.1461
Copyright2015 Downes et al.
Distributed underCreative Commons CC-BY 4.0
OPEN ACCESS
Triple therapy in type 2 diabetes; asystematic review and networkmeta-analysisMartin J. Downes1, Emilie K. Bettington1, Jenny E. Gunton2 andErika Turkstra1
1 Centre for Applied Health Economics, Menzies Health Institute Queensland, Griffith University,Queensland, Australia
2 Chair of Medicine, Westmead Hospital, University of Sydney, Westmead, New South Wales,Australia
ABSTRACTAims. The purpose was to evaluate the evidence for triple therapy regimen usingmedicines available in Australia for type 2 diabetes.Methods. A systematic literature review was performed to update therelevant evidence from 2002 to 2014 on triple therapy for type 2 diabetes. Amultiple-treatments network meta-analysis was undertaken to summarise thecomparative efficacy and harms of different triple therapies.Results. Twenty seven trials were identified, most were six months of duration. Thefollowing combinations were included in the network meta-analysis: metformin(MET) + sulfonylureas (SU) (used as reference combination); MET + SU+
dipeptidyl peptidase 4 inhibitors (DPP-4-i); MET + SU+ thiazolidinediones (TZD);MET + SU+ glucagon-like peptide-1 receptor agonists (GLP-1-RA); MET + SU+
insulins; MET + TZD + DPP-4-i; and MET + SU+ sodium/glucose cotransporter2 inhibitors (SGLT2-i). For HbA1c reduction, all triple therapies were statisticallysuperior to MET+SU dual therapy, except for MET + TZD + DPP-4-i. None ofthe triple therapy combinations demonstrated differences in HbA1c compared withother triple therapies. MET + SU + SGLT2-i and MET + SU + GLP-1-RA resultedin significantly lower body weight than MET + SU + DPP-4-i, MET+SU+insulinand MET + SU + TZDs; MET + SU + DPP-4-i resulted in significantly lower bodyweight than MET + SU + insulin and MET + SU + TZD. MET + SU + insulin,MET + SU + TZD and MET + SU + DPP-4-i increased the odds of hypoglycaemiawhen compared to MET + SU. MET + SU + GLP-1-RA reduced the odds ofhypoglycaemia compared to MET + SU + insulin.Conclusion. Care when choosing a triple therapy combination is needed as there isoften a risk of increased hypoglycaemia events associated with this regimen and thereare very limited data surrounding the long-term effectiveness and safety of combinedtherapies.
Subjects Diabetes and Endocrinology, Evidence Based MedicineKeywords Oral antidiabetic drugs, Anti-diabetic medication, Network meta-analysis,Type 2 diabetes, Glycated haemoglobin
How to cite this article Downes et al. (2015), Triple therapy in type 2 diabetes; a systematic review and network meta-analysis. PeerJ3:e1461; DOI 10.7717/peerj.1461

INTRODUCTIONType 2 diabetes is a major health concern worldwide and has an increasing prevalence and
impact on health services with an estimated worldwide change in prevalence from 153
million in 1980 to 347 million in 2008 (Danaei et al., 2011) and 1.5 million deaths due to
type 2 diabetes in 2012 (WHO, 2013).
Type 2 diabetes is a relatively difficult disease to manage with most international
clinical guidelines recommending an individualised approach to the management of type 2
diabetes and an optimal HbA1c target with regards to each patient (American Diabetes As-
sociation, 2014; Inzucchi et al., 2015; Canadian Agency for Drugs and Technologies in Health
, 2013; Gunton et al., 2014; National Institute for Health and Clinical Excellence, 2011; New
Zealand Guidelines Group, 2011). The balance for treatment is between optimal manage-
ment of the disease and the prevention of microvascular events, and severe hypoglycaemia.
Other important considerations are cost, efficacy, potential side effects, effects on body
weight, comorbidities, and patient preferences and abilities which are critical for compli-
ance and management of therapeutic strategies (e.g., oral or injectable medications).
The consensus between the different guidelines is that metformin is considered the
first line of pharmacotherapy unless there are contraindications or patient intolerance
(American Diabetes Association, 2014; Gunton et al., 2014; National Institute for Health and
Clinical Excellence, 2011; New Zealand Guidelines Group, 2011). If either of these is present,
sulfonylureas (SU) are often considered the most appropriate alternative to metformin
(MET) (Gunton et al., 2014; National Institute for Health and Clinical Excellence, 2011; New
Zealand Guidelines Group, 2011). International guidelines advise that if treatment with
monotherapy does not result in optimal blood glucose levels then dual therapy should be
initiated (American Diabetes Association, 2014; Inzucchi et al., 2015; Canadian Agency for
Drugs and Technologies in Health , 2013; Gunton et al., 2014; National Institute for Health
and Clinical Excellence, 2011; New Zealand Guidelines Group, 2011). NICE, Canada, Aus-
tralia and New Zealand consider that MET and SU is the recommended dual therapy com-
bination, unless contraindicated for the individual patient (American Diabetes Association,
2014; Inzucchi et al., 2015; Canadian Agency for Drugs and Technologies in Health , 2013;
Gunton et al., 2014; National Institute for Health and Clinical Excellence, 2011; New Zealand
Guidelines Group, 2011). A consensus from the American Diabetes Association (ADA) and
the European Association for the Study of Diabetes (EASD) recommends trying a different
first line to metformin and then a combination of drug for add on therapy (Inzucchi et al.,
2015). In this scenario, other oral medications such as dipeptidyl peptidase-4 inhibitors
(DPP-4-i) and thiazoldinediones (TZD) are generally recommended. If dual therapy is
ineffective in controlling blood glucose, a third agent can be used to assist treatment.
Given the number of medications available for type 2 diabetes; clinicians and patients need
information about their effectiveness and safety to make informed choices.
The objective of this review was to summarize the benefits and harms of medications in
triple therapy combination, for the treatment of adults with type 2 diabetes. This review
includes those medications available in Australia in 2014, i.e., MET, SU, TZD, DPP-4-i,
glucagon-like peptide-1 receptor agonists (GLP-1-RA), insulins, and sodium glucose
Downes et al. (2015), PeerJ, DOI 10.7717/peerj.1461 2/21

co-transporter 2 inhibitors (SGLT2-i). The outcomes of interest were change in glycated
haemoglobin, change in body weight and odds of hypoglycaemia events.
Our hypotheses are:
(1) Triple therapies for type 2 diabetes patients who are insufficiently managed with dual
therapies have superior efficacy and inferior safety compared to dual therapy after six
months of treatment and
(2) Triple therapies for type 2 diabetes have equal glycaemic efficacy and differing safety
profiles.
METHODSSystematic literature reviewThe Cochrane Handbook for Systematic Reviews of Interventions (Higgins & Green, 2011)
and the Preferred Reporting Items for Systematic Reviews and Meta-Analyses (PRISMA)
reporting guidelines (Moher et al., 2009) were used in the development, execution and
reporting of this review. A review protocol was not registered; however, the review was an
update to a predetermined report on the Comparative Safety and Effectiveness of Type 2
Diabetes Medicines (Australian Government DoH, 2013).
The PICO for the systematic review was as follows:
Population: All patients with type 2 diabetes
Intervention: Any triple therapy combination for treatment of type 2 diabetes
Comparator: metformin plus sulphonylurea dual therapy, and other triple therapy
combinations.
Outcome: HbA1c, body weight, hypoglycaemia and adverse events
The systematic literature review was performed in three stages: (1) identify the most
relevant systematic literature reviews on the efficacy and safety of medications for
glycaemic control; (2) update the literature search using the relevant systematic literature
reviews as identified in step 1 as a starting point; and (3) identify the relevant randomized
controlled trials (RCTs) from steps 1 and 2. Ovid MEDLINE and The Cochrane Library
Database were used for searching the literature.
Stage 1: identifying systematic reviewsEach bibliographic database was systematically searched using search terms for type 2
diabetes medications included in Table 1 on 5th March 2014. The key inclusion criteria
were systematic reviews, English language publications, patients with type 2 diabetes,
reviews published since 2010, reviews that include relevant outcomes, i.e., change in
body weight, frequency of hypoglycaemic events, and/or total number severe adverse
events. The key exclusion criteria was reviews that reported only on short-term treatment
outcomes (<24 weeks). Supplementary Document—Stage 1, contains full details of the
searches and terms used in each database. The searches were carried out by MJD and the
results extracted and imported into the bibliographical software Endnote X7 (Thomson
Reuters, New York, NY, USA). Duplicates were removed, articles that did not meet the
Downes et al. (2015), PeerJ, DOI 10.7717/peerj.1461 3/21

Table 1 List of medicine name and medicine groups listed used for identifying systematic reviews and RCTs of diabetes medication in November2014.
Medicine group Medicine names
Biguanide Metformin
Sulfonylureas Gliclazide, Glimepiride, Glipizide, Glibenclamide
Thiazolidinedione Pioglitazone, Rosiglitazone
Alpha-glucosidase inhibitors Acarbose
Dipeptidyl peptidase-4 inhibitors Alogliptin, Sitagliptin, Saxagliptin, Linagliptin, Vildagliptin
Glucagon-like peptide-1 receptor agonists Exenatide, Liraglutide
Insulins Aspart, Lispro, Glulisine, Neutral, Detemir, Glargine, Isophane
Sodium glucose co-transporter 2 inhibitors Canagliflozin, Dapagliflozin
inclusion criteria or met the exclusion criteria were also removed. The remaining articles
were checked independently by two staff members for inclusion. If two systematic reviews
were published based on the same data, the most comprehensive version of the paper was
included. The review which was the most recent, included most therapeutic groups and
outcomes was preferred.
Bennett et al. (2011) was considered the most relevant systematic literature review.
Bennett et al. (2011) did not include SGLT2-i, DPP-4-i or insulin. Therefore for the SGLT2-
i and DPP-4-i two further systematic reviews were included; Berhan & Barker (2013)
(SGLT2-i), and Monami et al. (2010) (DPP-4-i). We did not identify a systematic review
on insulin in triple therapy that matched the inclusion and exclusion criteria. The clinical
trials from the systematic literature reviews were extracted for further consideration.
Stage 2: updating identified systematic reviewsDatabase searches were carried out to update the three identified systematic reviews in
November 2014. Each bibliographic database was systematically searched using different
search terms for each search strategy. Supplementary Document—Stage 2 contains full
details of each search and the terms used in each database. The flow chart of the selection
process is presented in Fig. S1.
Stage 3: identifying relevant RCTsThe articles identified through Stage 1 (included in relevant systematic literature reviews)
and 2 (updated searches) were title checked by one author MJD and then independently
by two authors (MJD and ET) and included in the final analysis if they met all of
the following inclusion criteria: randomised controlled trial (RCT), English language
publication, patients with type 2 diabetes, at least 100 participants in the trial, duration of
treatment at least 24 weeks, published after 2002, trials that include any of the following
relevant outcomes: HbA1c, body weight change, frequency of hypoglycaemic events, or
frequency of other (serious) adverse events. Publications were excluded if they were not
randomised control trials or if they were post hoc analysis of randomised control trials.
If two publications used the same data, the most comprehensive version of the paper was
included. The flow chart of the selection process is presented in Fig. 1.
Downes et al. (2015), PeerJ, DOI 10.7717/peerj.1461 4/21
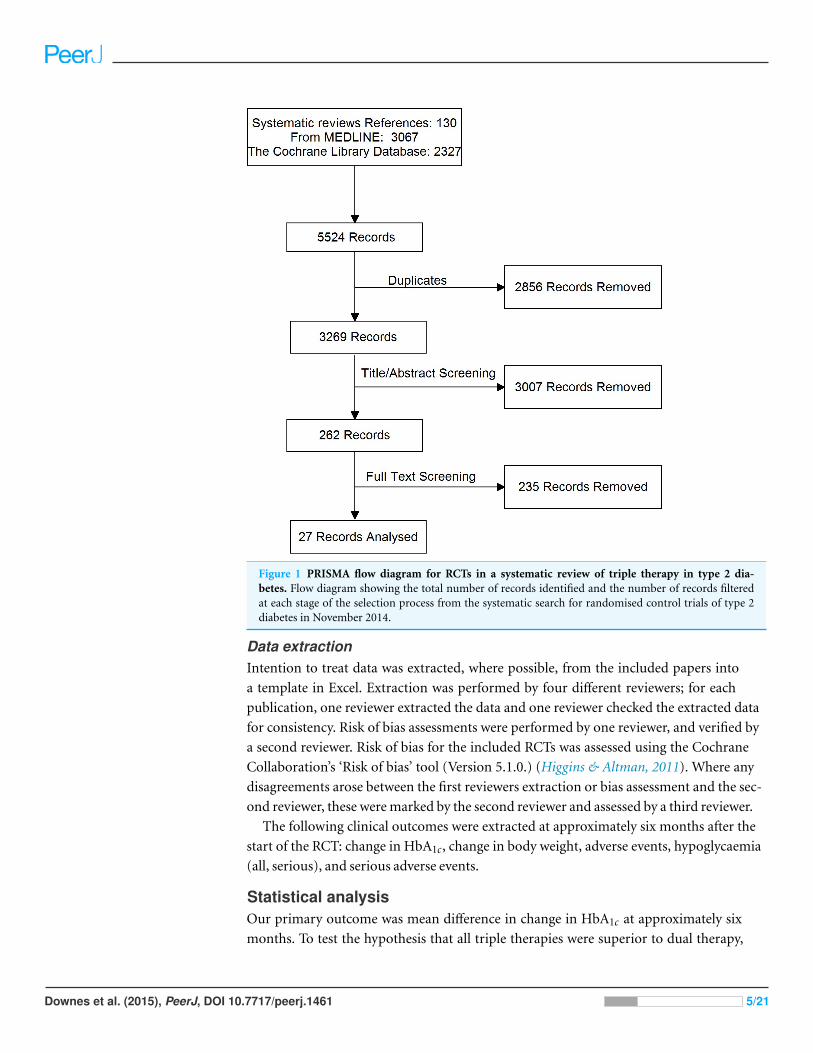
Figure 1 PRISMA flow diagram for RCTs in a systematic review of triple therapy in type 2 dia-betes. Flow diagram showing the total number of records identified and the number of records filteredat each stage of the selection process from the systematic search for randomised control trials of type 2diabetes in November 2014.
Data extractionIntention to treat data was extracted, where possible, from the included papers into
a template in Excel. Extraction was performed by four different reviewers; for each
publication, one reviewer extracted the data and one reviewer checked the extracted data
for consistency. Risk of bias assessments were performed by one reviewer, and verified by
a second reviewer. Risk of bias for the included RCTs was assessed using the Cochrane
Collaboration’s ‘Risk of bias’ tool (Version 5.1.0.) (Higgins & Altman, 2011). Where any
disagreements arose between the first reviewers extraction or bias assessment and the sec-
ond reviewer, these were marked by the second reviewer and assessed by a third reviewer.
The following clinical outcomes were extracted at approximately six months after the
start of the RCT: change in HbA1c, change in body weight, adverse events, hypoglycaemia
(all, serious), and serious adverse events.
Statistical analysisOur primary outcome was mean difference in change in HbA1c at approximately six
months. To test the hypothesis that all triple therapies were superior to dual therapy,
Downes et al. (2015), PeerJ, DOI 10.7717/peerj.1461 5/21

we considered the minimal clinically important difference (MCID) to be −0.3%
(3.3 mmol/mol) as used by the Federal Drug Agency (FDA) (CDER, 2008) and the
European Medicines Association (CHMP, 2011) and also quoted in Australia (Australian
Government DoH, 2010). HbA1c assays suffer from some variability, and a smaller MCID
would be within that variability in an individual (Cohen, Haggerty & Herman, 2010). To
demonstrate that triple therapies had similar efficacy the lower and the upper boundary of
the confidence intervals needed to be within 0.3% (3.3 mmol/mol) using the FDA and the
European Medicines Agency’s guidelines (CDER, 2008; CHMP, 2011).
Secondary outcomes were the difference in mean change in body weight (Kg) and
difference in the hypoglycaemia odds ratio within six months. For those outcomes, we did
not identify any MCIDs. Other outcomes investigated but not reported included adverse
events, serious adverse events, severe hypoglycaemia and mortality.
Excel was used to consolidate and standardise the outcome measures and measures
of variability; standard deviations, standard errors and 95% confidence intervals were
imputed where necessary (Follmann et al., 1992). The data was then imported into
STATA for meta-analysis and network meta-analysis. Where multiple trials were available
head-to-head meta-analyses were performed using a random effects model.
A multiple-treatments network meta-analysis was undertaken to summarise the
results of triple therapy for each of the outcomes where common treatment arms existed
(HbA1c, body weight, and hypoglycaemia) using the trial data in the clinical evidence
base. Different medications from the same class combinations were pooled, using the
assumption that all these medications would have similar efficacy and safety. The network
meta-analysis was conducted using STATA network package and mvmeta (Higgins et
al., 2012; White, 2011) (The STATA .do file for HbA1c is presented in Supplementary
Document—Statistical Analyses). The network meta-analysis allowed for heterogeneity
between studies during calculation (random effects). An inconsistency model was also
applied to test for disagreement between direct and indirect evidence (Higgins et al.,
2012). Possible covariates (Baseline HbA1c, age and Body Mass Index) were examined
prior to carrying out the network analysis to ensure similarities in baseline characteristics.
The measurements of treatment effect calculated were mean differences and their 95%
confidence intervals (CI) for continuous data, and odds ratios and their 95% CI for
dichotomous outcomes. Differences between treatments were considered statistically
significant if there were no overlap in 95% CI. Some trials only compared treatments from
the same combination group (e.g., MET+ SU+ INS vs MET+ SU+ INS). These trials were
excluded from the network meta-analyses as they were considered to compare the same
treatment and there did not randomise two different treatment regimens.
RESULTSSystematic literature reviewThe literature search identified 27 publications covering 26 trials with triple therapy;
Fig. S2 provides a network for the direct comparisons identified in the search. Nine trials
(10 publications) were excluded from the network meta-analyses as they were comparisons
Downes et al. (2015), PeerJ, DOI 10.7717/peerj.1461 6/21

of the different drugs from the same treatment group e.g.,: MET+ SU+ INS vs. MET+
SU+ INS. One trial was excluded as it did not have a common comparator arm (Table S1).
The majority of the remaining trials were of 24–26 weeks (11/17 trials) (Bergenstal et al.,
2009; Dailey et al., 2004; DeFronzo et al., 2012; Heine et al., 2005; Hermansen et al., 2007; Liu
et al., 2013; Lukashevich et al., 2014; Moses et al., 2014; Owens et al., 2011; Rosenstock et al.,
2006; Russell-Jones et al., 2009), with only five trials longer than or equal to one year (Bosi
et al., 2011; Derosa et al., 2013; Nauck et al., 2007; Schernthaner et al., 2013; Wilding et al.,
2013). The included trials and comparisons are presented in Table 2.
Of the 17 trials included in the network analysis, three trials were identified as having
a high risk of bias (Dailey et al., 2004; Rosenstock et al., 2006; Kendall et al., 2005), nine
trials as having an unclear risk of bias (Bergenstal et al., 2009; DeFronzo et al., 2012;
Heine et al., 2005; Liu et al., 2013; Lukashevich et al., 2014; Owens et al., 2011; Nauck et
al., 2007; Schernthaner et al., 2013; Wilding et al., 2013), and five trials as having a low risk
of bias (Hermansen et al., 2007; Moses et al., 2014; Russell-Jones et al., 2009; Derosa et al.,
2013) (Table S2). Only two of the studies were not funded by industry (Liu et al., 2013;
Derosa et al., 2013).
Overall, the key features of the triple therapy trials varied (see Tables S3 and S4), which
may limit the comparability of these trials. When reported, the trials recruited patients
between 2002 and 2011 and most of the trials were performed in an international setting.
The key features were that patients were adult patients with HbA1c of 7% (53 mmol/mol)
or higher. The primary outcome of interest for each study was mean difference in HbA1C
from the control group and the trials were powered to assess this outcome, although
Rosenstock et al. (2006) did not provide a power calculation.
Baseline characteristicsOverall the baseline characteristics across the triple therapy trials were similar; however,
there was some variation that may lead to heterogeneity between the trials and treatments
within the network meta-analyses. Of those, the following potential effect modifiers varied
between trial arms; baseline HbA1c varied from 8.1% to 10.3%, duration of diabetes varied
from 5 to 10 years and body mass index varied from 27 to 35 kg/m2 (Table S4).
The definition of hypoglycaemia, a secondary outcome in most of the trials, was variable
and the differing definitions are presented in Table 2.
Efficacy resultsTwo efficacy results were reported in the majority of the trials, change in HbA1c and change
in body weight. Seventeen RCTs were identified for inclusion in the network analysis
for HbA1c at six months (N = 9,144) (Bergenstal et al., 2009; Bosi et al., 2011; Derosa et
al., 2013; Nauck et al., 2007; Schernthaner et al., 2013; Wilding et al., 2013; Kendall et al.,
2005) (Fig. S2). Sixteen RCTs were identified for inclusion in the network analysis for
body weight change at six months (N = 8,341) (Bergenstal et al., 2009; Dailey et al., 2004;
DeFronzo et al., 2012; Heine et al., 2005; Hermansen et al., 2007; Liu et al., 2013; Lukashevich
et al., 2014; Moses et al., 2014; Owens et al., 2011; Rosenstock et al., 2006; Russell-Jones et
al., 2009; Derosa et al., 2013; Nauck et al., 2007; Schernthaner et al., 2013; Wilding et al.,
Downes et al. (2015), PeerJ, DOI 10.7717/peerj.1461 7/21

Table 2 Comparisons included in trials with triple therapy.
Intervention Trials Durationc N HbA1c BW AE SAE HypoG Definition of hypoglycaemia
MET+ SU vs
MET+ SU+ DPP-4-i
Hermansen et al. (2007)a 24 441 x x x x x ND
Owens et al. (2011) 24 1,055 x x x x x ND
Lukashevich et al. (2014) 24 318 x x x x x Symptoms suggestive of hypoglycaemia
and a self-monitored plasma glucose
measurement <3.1 mmol/l
MET + SU + TZD Moses et al. (2014) 24 257 x x x x x Symptomatic hypoglycaemia ± glucose
measurement
Dailey et al. (2004) 24 365 x x x x Symptomatic episodes with an
associated fingerstick blood glucose
≤ 50 mg/dL
MET + SU + GLP-1-RA Kendall et al. (2005) 30 733 x x x x x Symptoms consistent with hypogly-
caemia ± a documented plasma glucose
concentration of <3.33 mmol/l
MET+ SU+ SGLT2-i Russell-Jones et al. (2009)b 26 581 x x x x x Plasma glucose of
<56 mg/dL (3.1 mmol/l)
Wilding et al. (2013) 52 469 x x x x x Symptomatic episodes with an
associated fingerstick or plasma glucose
≤ 3.9 mmol/l
MET+ SU+ INS Russell-Jones et al. (2009)b 26 581 x x x x x Plasma glucose of
<56 mg/dL (3.1 mmol/l)
SU+ DPP-4-i aHermansen et al. (2007) 24 441 x x x x x ND
MET+ SU+ INS vs
MET+ SU+ GLP-1-RA
Russell-Jones et al. (2009)b 26 581 x x x x x Plasma glucose of
<56 mg/dL (3.1 mmol/L)
Bergenstal et al. (2009) 24 372 x x x x x Plasma glucose of
<56 mg/dL (3.1 mmol/L)
Heine et al. (2005) 26 549 x x x x Plasma glucose of
<56 mg/dL (3.1 mmol/L)
Nauck et al. (2007) 52 501 x x x x x Any time a patient experienced a sign
or symptom of hypoglycaemia or
noted a blood glucose level <60 mg/dL
(3.4 mmol/L).
MET+ SU+ TZD Rosenstock et al. (2006) 24 216 x x x x x Event with clinical symptoms consistent
with hypoglycaemia, confirmed with a
meter reading.
(continued on next page)
Do
wn
eset
al.(2015),PeerJ,D
OI10.7717/p
eerj.14618/21

Table 2 (continued)
Intervention Trials Durationc N HbA1c BW AE SAE HypoG Definition of hypoglycaemia
MET+ TZD+ DPP-4-i vs
MET+ TZD Bosi et al. (2011) 52 803 x x x x x Blood glucose of
<3.33 mmol/L with symptoms, or
<2.78 mmol/L regardless of symptoms
DeFronzo et al. (2012) 26 1,554 x x x x
MET+ SU+ TZD Derosa et al. (2013) 52 453 x x NR
MET+ SU+ DPP-4-i vs
MET+ SU+ SGLT2-i
Schernthaner et al. (2013) 52 755 x x x x x Symptomatic episodes
with fingerstick glucose
≤ 3.9 mmol/l
MET+ SU+ TZD Liu et al. (2013) 24 119 x x x x x ND
Notes.
AE, adverse event; BW, body weight; DPP-4-i, dipeptidyl peptidase-4 inhibitor; GLP-1-RA, glucagon-like peptide-1 receptor agonist; HbA1c , glycated haemoglobin; HypoG, hypoglycaemic
event; INS, insulin; MET, metformin; ND, not defined; NR, not reported; SAE, serious adverse event; SGLT2-i, sodium glucose co-transporter 2 inhibitor; SU, sulfonylurea; TZD,
thiazolidinedione.a One trial included three treatment arms (MET+ SU+ DPP4-i, MET+ SU and SU+ DPP4-i) and provided information for those comparisons.b One trial included three treatment arms (MET+ SU+ GLP-1-RA, MET+ SU and MET+ SU+ INS) and provided information for those comparisons.c Duration in months.
Do
wn
eset
al.(2015),PeerJ,D
OI10.7717/p
eerj.14619/21

2013; Kendall et al., 2005). Table S5 summarizes the raw data from the included trials. The
network models were tested for consistency and the direct comparison results were similar
to the indirect comparison for both HbA1c (p = 0.996) and body weight (p = 0.431).
Triple therapy vs. dual therapyAll classes of medicines, in combination with MET+ SU, included in the network analysis
provided a significantly better and clinically relevant (>0.3%, >3.3 mmol/mol) reduction
in HbA1c when compared to MET+ SU dual therapy, with the exception of MET+ TZD+
DPP-4-i triple therapy, which did not provide a significant difference over MET+ SU
(Table 3, Fig. 2A). There are no statistically significant differences with regards to change
in HbA1c for any of the comparisons with MET+ TZD or SU+ DPP-4-i (Table 3).
Only SGLT2-i and GLP-1-RA (added to MET+ SU) showed a significant reduction in
body weight compared to MET+ SU dual therapy (mean difference (MD): −1.76 kg; 95%
CI: −2.74 to −0.78 kg and MD: −1.55 kg; 95% CI: −2.34 to −0.74 kg respectively) (Fig.
2B); SU+ DPP-4-i dual therapy (MD: −2.89 kg; 95% CI: −4.20 to −1.59 kg and MD:
−2.60 kg; 95% CI: −3.79 to −1.42 kg respectively); and MET+ TZD dual therapy (MD:
−1.833 kg; 95% CI: −3.36 to −0.30 kg and MD: −1.59 kg; 95% CI: −2.95 to −0.22 kg
respectively) (Table 3). Compared to MET+ SU dual therapy, triple therapy with MET+
SU+ TZD (MD: 3.5 kg; 95% CI: 2.3 to 4.6 kg) and MET+ SU+ insulin (MD: 2.5 kg; 95%
CI: 1.5 to 3.4 kg) showed significant increases in body weight.
Triple therapy vs. triple therapyWhen triple therapies are compared with each other, there are no statistically significant
differences with regards to change in HbA1c for any of the comparisons (Table 4). The
only comparison which met the criteria of similar efficacy was MET+ SU+ insulin versus
MET+ SU+ GLP-1-RA (MD: −0.01% (0.1 mmol/mol), 95% CI: −0.32 to 0.30% (−3.5 to
3.3 mmol/mol)).
Most triple therapies were statistically significantly different when compared to each
other with respect to body weight changes (Table 4). Combined with MET+ SU, DPP-4-i,
TZD, or insulin therapy produced statistically more weight gain than MET+ SU+ SGL2-i
and MET+ SU+ GLP-1-RA therapy (Table 4). MET+ SU+ TZD provided significant
weight gain compared to MET+ TZD+ DPP-4-i or MET+ SU+ DPP-4-i. (Table 4).
Adverse events resultsHypoglycaemia was the only adverse event reported in the majority of the trials. Ten RCTs
were identified for inclusion in the network analysis for hypoglycaemia (N = 4, 458)
(Bergenstal et al., 2009; Dailey et al., 2004; Hermansen et al., 2007; Liu et al., 2013; Lukashe-
vich et al., 2014; Moses et al., 2014; Owens et al., 2011; Rosenstock et al., 2006; Russell-Jones
et al., 2009; Kendall et al., 2005). Data for MET+ SU+ SGLT2-i were only available for the
12 month time point (Schernthaner et al., 2013; Wilding et al., 2013) and not available at six
months; therefore, this triple therapy was not included in the network analysis.
All adverse events, serious adverse events and serious hypoglycaemia were not
systematically reported in the trials, and therefore no further network analyses are able
to be presented.
Downes et al. (2015), PeerJ, DOI 10.7717/peerj.1461 10/21
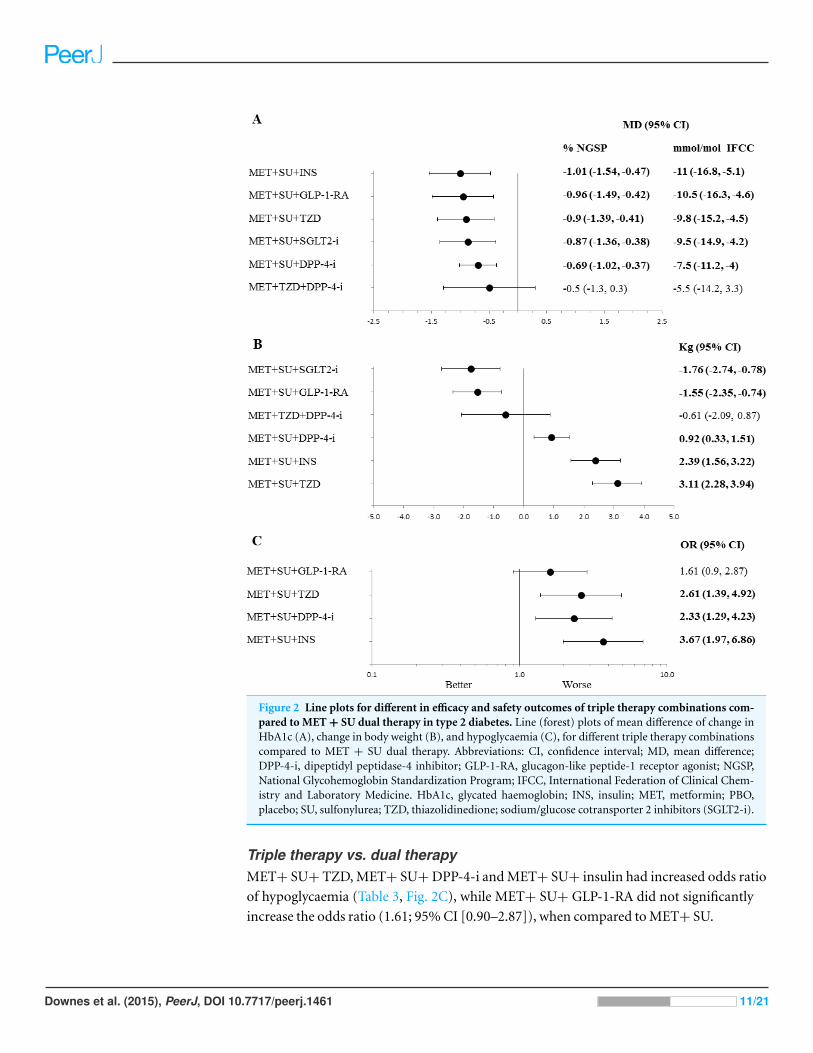
Figure 2 Line plots for different in efficacy and safety outcomes of triple therapy combinations com-pared to MET + SU dual therapy in type 2 diabetes. Line (forest) plots of mean difference of change inHbA1c (A), change in body weight (B), and hypoglycaemia (C), for different triple therapy combinationscompared to MET + SU dual therapy. Abbreviations: CI, confidence interval; MD, mean difference;DPP-4-i, dipeptidyl peptidase-4 inhibitor; GLP-1-RA, glucagon-like peptide-1 receptor agonist; NGSP,National Glycohemoglobin Standardization Program; IFCC, International Federation of Clinical Chem-istry and Laboratory Medicine. HbA1c, glycated haemoglobin; INS, insulin; MET, metformin; PBO,placebo; SU, sulfonylurea; TZD, thiazolidinedione; sodium/glucose cotransporter 2 inhibitors (SGLT2-i).
Triple therapy vs. dual therapyMET+ SU+ TZD, MET+ SU+ DPP-4-i and MET+ SU+ insulin had increased odds ratio
of hypoglycaemia (Table 3, Fig. 2C), while MET+ SU+ GLP-1-RA did not significantly
increase the odds ratio (1.61; 95% CI [0.90–2.87]), when compared to MET+ SU.
Downes et al. (2015), PeerJ, DOI 10.7717/peerj.1461 11/21

Table 3 Mean difference for change in HbA1c, weight and odds ratio of hypoglycaemia for dual therapy compared to triple therapy combinations in the networkmeta-analyses.
HbA1c% NGSP (95% CI) Weight Kg (95% CI) Hypoglycaemia OR (95% CI)
Direct comparisona Network Direct comparisona Network Direct comparisona Network
vs MET+SU
MET+ SU+ SGLT2-i −0.82 (−0.83, −0.81) (Wilding
et al., 2013)
−0.87 (−1.36, −0.38) −1.4 (−1.45, −1.36) (Wilding
et al., 2013)
−1.76 (−2.74, −0.78) –
MET+ SU+ GLP-1-RA −0.96 (−1.15, −0.77)
(Russell-Jones et al., 2009;
Kendall et al., 2005)
−0.96 (−1.49, −0.42) −1.04 (−1.71, −0.37)
(Russell-Jones et al., 2009;
Kendall et al., 2005)
−1.55 (−2.35, −0.74) 1.7 (1.01, 2.86)
(Russell-Jones et al., 2009;
Kendall et al., 2005)
1.61 (0.9, 2.87)
MET+ TZD+ DPP-4-i −0.5 (−1.3, 0.3) −0.61 (−2.09, 0.87) –
MET+ SU+ DPP-4-i −0.71 (−0.79, −0.63)
(Hermansen et al., 2007;
Lukashevich et al., 2014;
Moses et al., 2014;
Owens et al., 2011)
0.69 (−1.02, −0.37) 0.71 (0.4, 1.01)
(Hermansen et al., 2007;
Lukashevich et al., 2014;
Moses et al., 2014;
Owens et al., 2011)
0.92 (0.33, 1.51) 2.39 (1.17, 4.88)
(Hermansen et al., 2007;
Lukashevich et al., 2014;
Moses et al., 2014;
Owens et al., 2011)
2.33 (1.29, 4.23)
MET+ SU+ INS −0.85 (−1.13, −0.57)
(Russell-Jones et al., 2009)
−1.01 (−1.54, −0.47) 2.02 (1.94, 2.1)
(Russell-Jones et al., 2009)
2.39 (1.56, 3.22) 2.07 (1.17, 3.65)
(Russell-Jones et al., 2009)
3.67 (1.97, 6.86)
MET+ SU+ TZD −1 (−1.28, −0.72)
(Dailey et al., 2004)
−0.9 (−1.39, −0.41) 2.97 (2.92, 3.02)
(Dailey et al., 2004)
3.11 (2.28, 3.94) 3.41 (2.19, 5.32)
(Dailey et al., 2004)
2.61 (1.39, 4.92)
vs SU+DPP-4-i
MET+ SU+ SGLT2-i −0.31 (−1.1, 0.49) −2.89 (−4.20, −1.59)
MET+ SU+ GLP-1-RA −0.4 (−1.18, 0.39) −2.60 (−3.79, −1.42) 1.29 (0.31, 5.32)
MET+ TZD+ DPP-4-i 0.04 (−0.93, 1) −1.59 (−3.32, 0.13)
MET+ SU+ DPP-4-i −0.29(−0.31, −0.27)
(Hermansen et al., 2007)
−0.14 (−0.84, 0.57) −0.1(−0.11, −0.09)
(Hermansen et al., 2007)
−0.25 (−1.25, 0.75) 2.42 (1.01, 5.8)
(Hermansen et al., 2007)
1.88 (0.61, 5.81)
MET+ SU+ INS −0.43 (−1.22, 0.36) 1.34 (0.14, 2.54) 2.96 (0.71,
12.26)
MET+ SU+ TZD −0.36 (−1.13, 0.41) 2.03 (0.84, 3.23) 2.1 (0.52, 8.56)
MET+ TZD 0.53 (−0.52, 1.58) −1.81 (−3.94, 0.32)
vs MET+TZD
MET+ SU+ SGLT2-i −0.62 (−1.48, 0.23) −1.83 (−3.36, −0.30)
MET+ SU+ GLP-1-RA −0.72 (−1.53, 0.09) −1.59 (−2.95, −0.22)
MET+ TZD+ DPP-4-i −0.50 (−0.58, −0.41)
(DeFronzo et al., 2012;
Bosi et al., 2011)
−0.41 (−0.92, 0.1) 0.35 (0.33, 0.37)
(DeFronzo et al., 2012)
−0.2 (−1.33, 0.94)
MET+ SU+ DPP-4-i −0.46 (−1.24, 0.31) 0.86 (−0.44, 2.16)
MET+ SU+ INS −0.76 (−1.56, 0.05) 2.36 (1.01, 3.72)
MET+ SU+ TZD −0.71 (−1.42, −0.01) 3.17 (1.92, 4.42)
Notes.
CI, confidence interval; DPP-4-i, dipeptidyl peptidase-4 inhibitor; GLP-1-RA, glucagon-like peptide-1 receptor agonist; HbA1c , glycated haemoglobin; IFCC, International Federation of Clinical Chemistry and
Laboratory Medicine; INS, insulin; MET, metformin; NGSP, National Glycohemoglobin Standardization Program; OR, odds ratio; SGLT2-i, sodium glucose cotransporter 2 inhibitor; SU, sulfonylurea; TZD,
thiazolidinedione; Bold, statistically significant.a Where multiple references were available a meta-analysis is presented.
Do
wn
eset
al.(2015),PeerJ,D
OI10.7717/p
eerj.146112/21

Table 4 Mean difference for change in HbA1c, weight and odds ratio of hypoglycaemia for different triple medicine combinations compared to each other in thenetwork meta-analyses.
HbA1c % NGSP (95% CI) Weight Kg (95% CI) Hypoglycaemia OR (95% CI)
Direct comparisona Network Direct comparisona Network Direct comparisona Network
MET+SU+SGLT2-i vs
MET+ SU+ GLP-1-RA 0.1 (−0.5, 0.7) −0.66 (−1.88, 0.56) –
MET+ TZD+ DPP-4-i −0.3 (−1.1, 0.5) −1.84 (−3.3, -0.38) –
MET+ SU+ DPP-4-i −0.23 (−0.31, −0.15)
(Schernthaner et al., 2013)
−0.2 (−0.7, 0.3) −3 (−3.03, −2.97)
(Schernthaner et al., 2013)
−2.63 (−3.6, −1.66) –
MET+ SU+ INS 0.1 (−0.5, 0.7) −3.68 (−4.95, −2.4) –
MET+ SU+ TZD 0.1 (−0.5, 0.6) −4.17 (−5.52, −2.82) –
MET+SU+GLP-1-RA vs
MET+ TZD+ DPP-4-i −0.4 (−1.1, 0.4) −1.6 (−2.89, −0.31) –
MET+ SU+ DPP-4-i −0.3 (−0.7, 0.2) −2.34 (−3.25, −1.43) 0.69 (0.3, 1.58)
MET+ SU+ INS 0 (−0.48, 0.48)
(Bergenstal et al., 2009;
Heine et al., 2005;
Russell-Jones et al., 2009;
Nauck et al., 2007)
0 (−0.3, 0.3) −4.11 (−4.76, −3.47)
(Bergenstal et al., 2009;
Heine et al., 2005
Russell-Jones et al., 2009;
Nauck et al., 2007)
−3.78 (−4.43, −3.13) 0.42 (0.21, 0.86)
(Bergenstal et al., 2009;
Russell-Jones et al., 2009)
0.44 (0.25, 0.76)
MET+ SU+ TZD 0 (−0.6, 0.6) −3.95 (−5.06, −2.85) 0.62 (0.29, 1.31)
MET+TZD+DPP-4-i vs
MET+ SU+ DPP-4-i 0.1 (−0.6, 0.8) −1.34 (−2.85, 0.17) -
MET+ SU+ INS 0.4 (−0.3, 1.2) −2.46 (−4.13, −0.79) -
MET+ SU+ TZD 0.4 (0.33, 0.47)
(Derosa et al., 2013)
0.4 (−0.3, 1) −3.9 (−4.36, −3.44)
(Derosa et al., 2013)
−3.22 (−4.88, −1.56) -
MET+SU+DPP-4-i vs
MET+ SU+ INS 0.3 (−0.2, 0.8) −1.02 (−2, −0.04) 0.63 (0.27, 1.48)
MET+ SU+ TZD 0.23 (0.16, 0.31)
(Liu et al., 2013)
0.2 (−0.2, 0.7) −1.6 (−1.72, −1.49)
(Liu et al., 2013)
−1.58 (−2.57, −0.6) 0.82 (0.24, 2.84)
(Liu et al., 2013)
0.89 (0.4, 2.01)
MET+SU+INS vs
MET+ SU+ TZD −0.15 (−0.55, 0.25)
(Rosenstock et al., 2006)
−0.1 (−0.7, 0.5) −1.3 (−1.41, −1.19)
(Rosenstock et al., 2006)
−0.08 (−1.13, 0.97) 1.68 (0.98, 2.87)
(Rosenstock et al., 2006)
1.41 (0.71, 2.8)
Notes.
CI, confidence interval; DPP-4-i, dipeptidyl peptidase-4 inhibitor; GLP-1-RA, glucagon-like peptide-1 receptor agonist; HbA1c , glycated haemoglobin; IFCC, International Federation of Clinical Chemistry
and Laboratory Medicine; INS, insulin; MET, metformin; NGSP, National Glycohemoglobin Standardization Program; OR, odds ratio; SGLT2-i, sodium glucose cotransporter 2 inhibitor; SU, sulfonylurea;
TZD, thiazolidinedione; Bold, statistically significant.a Where multiple references were available a meta-analysis is presented.
Do
wn
eset
al.(2015),PeerJ,D
OI10.7717/p
eerj.146113/21

Triple therapy vs. triple therapyThere were no statistically significant differences in the odds of hypoglycaemia between
most triple therapies; however, MET+ SU+ GLP-1-RA had reduced odds ratio for
hypoglycaemia compared to MET+ SU+ insulin (odds ratio 0.44; 95% CI [0.25–0.76])
(Table 4).
The network model was tested for consistency and there were some differences between
the direct comparison and the indirect comparison for hypoglycaemia (p = 0.004).
The majority of inconsistency can be accounted for by Hermansen et al. (2007) (test for
consistency; p = 0.144 with Hermansen et al. (2007) removed).
DISCUSSIONThe results of the review and network analyses demonstrated that the addition of a third
pharmaceutical class to MET+ SU therapy was statistically and clinically more effective
(upper CI greater than the MCID of 0.30%, 3.3 mmol/mol) at reducing HbA1c than
dual therapy with MET+ SU. Only MET+ TZD+ DPP-4-i showed no improvement in
HbA1c when compared to MET+ SU. When comparing the different triple therapies it was
difficult to identify any differences between them with regards to HbA1c, all therapies had
overlapping 95% confidence intervals comparing each other. Only one comparison met
the similarity criteria of confidence intervals within 0.3% (3.3 mmol/mol) of each other
(MET+ SU+ GLP-1-RA vs MET+ SU+ insulin) as the statistical uncertainties were too
great to draw similarity conclusions.
Most clinical guidelines advocate an individualised approach to setting patient HbA1c
targets which should be achieved for optimal treatment of type 2 diabetes (American Di-
abetes Association, 2014; Inzucchi et al., 2015; Canadian Agency for Drugs and Technologies
in Health , 2013; Gunton et al., 2014; National Institute for Health and Clinical Excellence,
2011; New Zealand Guidelines Group, 2011). For triple therapy, guidelines commonly
recommend insulin as the preferred option in combination with metformin and sulfony-
lurea (American Diabetes Association, 2014; Canadian Agency for Drugs and Technologies
in Health , 2013; National Institute for Health and Clinical Excellence, 2011; New Zealand
Guidelines Group, 2011); however, other treatments can be used if the preferred option is
not suitable for the patient due to contraindications or intolerances or individual circum-
stances (American Diabetes Association, 2014; Canadian Agency for Drugs and Technologies
in Health , 2013; Gunton et al., 2014; National Institute for Health and Clinical Excellence,
2011; New Zealand Guidelines Group, 2011), with some guidelines expanding the goal of
therapy beyond the control of hyperglycemia and suggesting a more composite target to
incorperate HbA1c, body weight reduction as well as cardiovascular outcomes (Inzucchi et
al., 2015; Rodbard et al., 2009). When assessing composite endpoints of HbA1c and body
weight MET+ SU+ SGLT2-i and MET+ SU+ GLP-1-RA were more efficient at reducing
HbA1c levels and bodyweight than other treatments when compared to MET+ SU. While
other combinations tended to be effective at reducing HbA1c they were either no different
than MET+ SU at reducing weight (MET+ SU+ TZD) or increased weight when com-
pared to MET+ SU (MET+ SU+ DPP-4-i, MET+ SU+ insulin and MET+ SU+ TZD).
Downes et al. (2015), PeerJ, DOI 10.7717/peerj.1461 14/21

MET+ SU+ insulin had higher hypoglycaemia events than MET+ SU+ GLP-1-RA.
Overall, the systematic literature review could identify only limited evidence on the
long-term safety of type 2 diabetes medicines when used in triple therapy because the
longest trial was 1 year. While there are longer term dual therapy studies for some of
the combinations, this is of concern considering that these medicines are intended for
long-term use.
It is important to note that different drugs of the same therapy class were pooled in the
analysis. The assumptions were made that treatments within therapy classes had similar
mechanisms of action and hence efficacy. For example; the insulin group contained
long-acting basal insulin analogue (glargine) (Heine et al., 2005; Rosenstock et al., 2006;
Russell-Jones et al., 2009) and fast-acting insulin analogue (aspart) (Bergenstal et al., 2009;
Nauck et al., 2007), and these were grouped together in the analysis. However, this would
have limited effect on the overall outcomes as comparative studies between these groups
have shown that glargine and aspart are non-inferior and have similar safety margins
(Strojek et al., 2009; Yang et al., 2013). There are also numerous studies that suggest that
the different drugs within each therapy class included in the network meta-analysis have
similar efficacy and safety outcomes; DPP-4-i (Deacon, 2011), GLP-1-RA (Rigato & Fadini,
2014), and TZD (Norris, Carson & Roberts, 2007). There was only one SGLT2-i triple
therapy drug combination available, so data for other SGLT2-i triple therapy was not
assessed.
There were some limitations to the analysis of these trials and these should be taken
into consideration when assessing the outcomes of the network analyses. The majority of
trials were powered only to assess HbA1c and had a short duration of 24–30 weeks and
the network meta-analyses were done for this time point. The number of participants was
generally low and the adverse event rates were also low, for this reason it is difficult to
draw conclusions on the long-term effect that these therapies will have on the incidences
of adverse events. Also it was not always clear which outcomes occurred but were not
reported, or whether they did not occur in the trial period.
Performing a network meta-analysis, which uses indirect comparison analyses, may
introduce statistical uncertainty; therefore we applied a random effect model to allow for
heterogeneity between studies to be incorporated into the estimates of effect. We also tested
the network for consistency to evaluate disagreement between direct and indirect evidence,
to ensure that the interpretation of the network model was consistent with the original
trials.
There are limitations with the available data as there were only three trials that do not
include MET + SU as the baseline dual therapy. The network model for hypoglycaemia
demonstrated some inconsistency between the direct comparisons and the indirect
comparison. There could be a number of reasons for this including differences in the
definitions of a hypoglycaemic event and some trials allowing dose titration when an event
occurred. In the network, the majority of difference could be accounted for by one trial
Hermansen et al. (2007). The definitions for hypoglycaemia were different between trials,
and Hermansen et al. (2007) did not report any definition. This could eventuate in the
Downes et al. (2015), PeerJ, DOI 10.7717/peerj.1461 15/21

Hermansen et al. (2007) trial measuring different hypoglycaemic severity than the other
trials. There were fewer trials providing data on hypoglycaemia and this could lead also to
an increase in the statistical uncertainty.
CONCLUSIONSThe network meta-analysis highlights areas where the individualised approach can be
used. As examples MET+ SU+ GLP-1-RA or MET+ SU+ SGLT2-i may be a good choice
for patients that require weight loss and MET+ SU+ GLP-1-RA for patients at risk for
hypoglycaemia, whereas MET+ SU+ insulin may provide good blood glucose control in
patients where hypoglycaemia and weight gain is not a concern. Care when choosing a
triple therapy combination is needed as there is often a risk of increased hypoglycaemia
events associated with this regimen, and there are very limited data surrounding the
long-term effectiveness and safety of combined therapies.
Abbreviations
DPP-4-i Dipeptidyl peptidase 4 inhibitors (also known as ‘gliptins’)
FDA Federal Drug Agency
GLP-1-RA Glucagon-like peptide-1 agonist (also known as incretin analogues)
MCID Minimum clinically important difference
MD Mean difference
MET Metformin
OR Odds ratio
PRISMA Preferred Reporting Items for Systematic Reviews and Meta-Analyses
RCT Randomised Control Trial
SGLT2-i Sodium-glucose linked transporter protein 2 inhibitor
SU Sulfonylurea
TZD Thiazolidinedione
ACKNOWLEDGEMENTSThe assistance of Sanjeewa Kularatna with the data extraction and Gabor Mihala with the
statistical analyses is appreciated.
ADDITIONAL INFORMATION AND DECLARATIONS
FundingThe Australian Government Department of Health provided funding and assistance in the
development of this manuscript. The funders had no role in study design, data collection
and analysis, decision to publish, or preparation of the manuscript.
Grant DisclosuresThe following grant information was disclosed by the authors:
The Australian Government Department of Health.
Downes et al. (2015), PeerJ, DOI 10.7717/peerj.1461 16/21
Competing InterestsThe authors declare there are no competing interests.
Author Contributions• Martin J. Downes and Erika Turkstra conceived and designed the experiments,
performed the experiments, analyzed the data, wrote the paper, prepared figures and/or
tables, reviewed drafts of the paper.
• Emilie K. Bettington performed the experiments, analyzed the data, wrote the paper,
reviewed drafts of the paper.
• Jenny E. Gunton conceived and designed the experiments, wrote the paper, reviewed
drafts of the paper.
Data AvailabilityThe following information was supplied regarding data availability:
The research in this article did not generate any raw data. The data used in this review
was extracted from published articles, and an excel file with this data is included as
Supplemental Information 1.
Supplemental InformationSupplemental information for this article can be found online at http://dx.doi.org/
10.7717/peerj.1461#supplemental-information.
REFERENCESAmerican Diabetes Association. 2014. Standards of medical care in diabetes—2014. Diabetes Care
37(Suppl 1):S14–S80 DOI 10.2337/dc14-S014.
Australian Government DoH. 2010. Public Summary Document for Vildagliptin, tablet, 50 mg,Galvus®—March 2010. Canberra: Pharmaceutical Evaluation Branch, Department of Health.Available at http://www.pbs.gov.au/info/industry/listing/elements/pbac-meetings/psd/2010-03/pbac-psd-Vildagliptin-mar10 (accessed 30 April 2015).
Australian Government DoH. 2013. Request for quotation for the provision of a report on thecomparative safety and effectiveness of type 2 diabetes medicines. Canberra: PharmaceuticalEvaluation Branch, Department of Health. (04/30/2015). RFQ No. 067/1314.
Bennett WL, Wilson LM, Bolen S, Maruthur N, Singh S, Chatterjee R, Marinopoulos SS,Puhan MA, Ranasinghe P, Nicholson WK, Block L, Odelola O, Dalal DS, Ogbeche GE,Chandrasekhar A, Hutfless S, Bass EB, Segal JB. 2011. Oral diabetes medications for adultswith type 2 diabetes: an update. Comparative effectiveness review No. 27. (Prepared by JohnsHopkins University Evidence-based Practice Center under Contract No. 290-02-0018.) AHRQPublication No. 11-EHC038-EF. Agency for Healthcare Research and Quality, Rockville.Available at www.effectivehealthcare.ahrq.gov/reports/final.cfm.
Bergenstal R, Lewin A, Bailey T, Chang D, Gylvin T, Roberts V, NovoLog Mix-vs.-ExenatideStudy G. 2009. Efficacy and safety of biphasic insulin aspart 70/30 versus exenatide in subjectswith type 2 diabetes failing to achieve glycemic control with metformin and a sulfonylurea.Current Medical Research and Opinion 25(1):65–75 DOI 10.1185/03007990802597951.
Downes et al. (2015), PeerJ, DOI 10.7717/peerj.1461 17/21

Berhan A, Barker A. 2013. Sodium glucose co-transport 2 inhibitors in the treatment of type 2diabetes mellitus: a meta-analysis of randomized double-blind controlled trials. BMC EndocrineDisorders 13(1):58 DOI 10.1186/1472-6823-13-58.
Bosi E, Ellis GC, Wilson CA, Fleck PR. 2011. Alogliptin as a third oral antidiabetic drug in patientswith type 2 diabetes and inadequate glycaemic control on metformin and pioglitazone: a52-week, randomized, double-blind, active-controlled, parallel-group study. Diabetes, Obesityand Metabolism 13(12):1088–1096 DOI 10.1111/j.1463-1326.2011.01463.x.
Canadian Agency for Drugs and Technologies in Health. 2013. Optimal use recommendationsfor second and third-line therapy for patients with type 2 diabetes. CADTH optimal use report;vol.3, no. 1d. Canadian Agency for Drugs and Technologies in Health, Ottawa. Available athttps://www.cadth.ca/media/pdf/OP0512 Diabetes RecsReport 2nd 3rd-line e.pdf (accessed 29November 2015).
CDER (Center for Drug Evaluation and Research). 2008. Guidance for industry diabetes mellitus:developing drugs and therapeutic biologics for treatment and prevention. Available at http://www.fda.gov/downloads/Drugs/Guidances/ucm071624.pdf (accessed 30 April 2015).
CHMP (Committee for Medicinal Products for Human Use). 2011. Guideline on clinicalinvestigation of medicinal products in the treatment of diabetes mellitus. Available at http://www.ema.europa.eu/docs/en GB/document library/Scientific guideline/2012/06/WC500129256.pdf (accessed 30 April 2015).
Cohen RM, Haggerty S, Herman WH. 2010. HbA1c for the diagnosis of diabetes and prediabetes:is it time for a mid-course correction? Journal of Clinical Endocrinology and Metabolism95(12):5203–5206 DOI 10.1210/jc.2010-2352.
Dailey 3rd GE, Noor MA, Park JS, Bruce S, Fiedorek FT. 2004. Glycemic control withglyburide/metformin tablets in combination with rosiglitazone in patients with type 2diabetes: a randomized, double-blind trial. The American Journal of Medicine 116(4):223–229DOI 10.1016/j.amjmed.2003.07.022.
Danaei G, Finucane MM, Lu Y, Singh GM, Cowan MJ, Paciorek CJ, Lin JK, Farzadfar F,Khang Y-H, Stevens GA, Rao M, Ali MK, Riley LM, Robinson CA, Ezzati M. 2011.National, regional, and global trends in fasting plasma glucose and diabetes prevalencesince 1980: systematic analysis of health examination surveys and epidemiologicalstudies with 370 country-years and 2.7 million participants. Lancet 378(9785):31–40DOI 10.1016/S0140-6736(11)60679-X.
Deacon CF. 2011. Dipeptidyl peptidase-4 inhibitors in the treatment of type 2 diabetes: acomparative review. Diabetes, Obesity and Metabolism 13(1):7–18 DOI 10.1111/j.1463-1326.2010.01306.x.
DeFronzo RA, Burant CF, Fleck P, Wilson C, Mekki Q, Pratley RE. 2012. Efficacy and tolerabilityof the DPP-4 inhibitor alogliptin combined with pioglitazone, in metformin-treated patientswith type 2 diabetes. Journal of Clinical Endocrinology and Metabolism 97(5):1615–1622DOI 10.1210/jc.2011-2243.
Derosa G, Cicero AF, Franzetti IG, Querci F, Carbone A, Piccinni MN, D’Angelo A, Fogari E,Maffioli P. 2013. A comparison between sitagliptin or glibenclamide in addition to metformin+ pioglitazone on glycaemic control and beta-cell function: the triple oral therapy. DiabeticMedicine 30(7):846–854 DOI 10.1111/dme.12158.
Follmann D, Elliott P, Suh I, Cutler J. 1992. Variance imputation for overviews of clinicaltrials with continuous response. Journal of Clinical Epidemiology 45(7):769–773DOI 10.1016/0895-4356(92)90054-Q.
Downes et al. (2015), PeerJ, DOI 10.7717/peerj.1461 18/21
Gunton JE, Cheung NW, Davis TME, Zoungas S, Colagiuri S. 2014. A new blood glucosemanagement algorithm for type 2 diabetes: a position statement of the Australian DiabetesSociety. Medical Journal of Australia 201(11):650–653 DOI 10.5694/mja14.01187.
Heine RJ, Van Gaal LF, Johns D, Mihm MJ, Widel MH, Brodows RG, GWAA Study Group.2005. Exenatide versus insulin glargine in patients with suboptimally controlledtype 2 diabetes: a randomized trial. Annals of Internal Medicine 143(8):559–569DOI 10.7326/0003-4819-143-8-200510180-00006.
Hermansen K, Kipnes M, Luo E, Fanurik D, Khatami H, Stein P, Sitagliptin Study 035Group. 2007. Efficacy and safety of the dipeptidyl peptidase-4 inhibitor, sitagliptin,in patients with type 2 diabetes mellitus inadequately controlled on glimepiridealone or on glimepiride and metformin. Diabetes, Obesity and Metabolism 9:733–745DOI 10.1111/j.1463-1326.2007.00744.x.
Higgins J, Altman D. 2011. Chapter 8: assessing risk of bias in included studies. In: Higgins J,Green S, eds. Cochrane handbook for systematic reviews of interventions. Version 510. Oxford:Cochrane Collaboration. (updated March 2011).
Higgins J, Green S. 2011. Cochrane handbook for systematic reviews of interventions. Version 5.1.0.Oxford: Cochrane Collaboration.
Higgins JPT, Jackson D, Barrett JK, Lu G, Ades AE, White IR. 2012. Consistency andinconsistency in network meta-analysis: concepts and models for multi-arm studies. ResearchSynthesis Methods 3(2):98–110 DOI 10.1002/jrsm.1044.
Inzucchi SE, Bergenstal RM, Buse JB, Diamant M, Ferrannini E, Nauck M, Peters AL, Tsapas A,Wender R, Matthews DR. 2015. Management of hyperglycemia in type 2 diabetes, 2015: apatient-centered approach: update to a position statement of the American Diabetes Associationand the European Association for the Study of Diabetes. Diabetes Care 38(1):140–149DOI 10.2337/dc14-2441.
Kendall DM, Riddle MC, Rosenstock J, Zhuang D, Kim DD, Fineman MS, Baron AD. 2005.Effects of exenatide (exendin-4) on glycemic control over 30 weeks in patients with type2 diabetes treated with metformin and a sulfonylurea. Diabetes Care 28(5):1083–1091DOI 10.2337/diacare.28.5.1083.
Liu SC, Chien KL, Wang CH, Chen WC, Leung CH. 2013. Efficacy and safety of addingpioglitazone or sitagliptin to patients with type 2 diabetes insufficiently controlled withmetformin and a sulfonylurea. Endocrine Practice 19(6):980–988 DOI 10.4158/EP13148.OR.
Lukashevich V, Prato SD, Araga M, Kothny W. 2014. Efficacy and safety of vildagliptin in patientswith type 2 diabetes mellitus inadequately controlled with dual combination of metformin andsulphonylurea. Diabetes, Obesity and Metabolism 16(5):403–409 DOI 10.1111/dom.12229.
Moher D, Liberati A, Tetzlaff J, Altman DG. 2009. Preferred reporting items for systematicreviews and meta-analyses: the PRISMA statement. Annals of Internal Medicine 151(4):264–269DOI 10.7326/0003-4819-151-4-200908180-00135.
Monami M, Iacomelli I, Marchionni N, Mannucci E. 2010. Dipeptydil peptidase-4 inhibitorsin type 2 diabetes: a meta-analysis of randomized clinical trials. Nutrition, Metabolism andCardiovascular Diseases 20(4):224–235 DOI 10.1016/j.numecd.2009.03.015.
Moses RG, Kalra S, Brook D, Sockler J, Monyak J, Visvanathan J, Montanaro M, Fisher SA.2014. A randomized controlled trial of the efficacy and safety of saxagliptin as add-on therapyin patients with type 2 diabetes and inadequate glycaemic control on metformin plus asulphonylurea. Diabetes, Obesity and Metabolism 16(5):443–450 DOI 10.1111/dom.12234.
Downes et al. (2015), PeerJ, DOI 10.7717/peerj.1461 19/21

National Institute for Health and Clinical Excellence. 2011. Type 2 diabetes: newer agents.In: Type 2 diabetes: newer agents for blood glucose control in type 2 diabetes. NICE short clinicalguideline 87. London: National Institute for Health and Clinical Excellence. Available at https://www.nice.org.uk/guidance/cg87 (accessed 29 November 2015).
Nauck MA, Duran S, Kim D, Johns D, Northrup J, Festa A, Brodows R, Trautmann M. 2007. Acomparison of twice-daily exenatide and biphasic insulin aspart in patients with type 2 diabeteswho were suboptimally controlled with sulfonylurea and metformin: a non-inferiority study.Diabetologia 50(2):259–267 DOI 10.1007/s00125-006-0510-2.
New Zealand Guidelines Group. 2011. Guidance on the Management of type 2 diabetes 2011.Wellington: New Zealand Guidelines Group. Available at https://www1.accu-chek.co.nz/documents/AccuChekExtra/NZGG-management-of-type-2-diabetes-web-v2.pdf (accessed 29November 2015).
Norris SL, Carson S, Roberts C. 2007. Comparative effectiveness of pioglitazone and rosiglitazonein type 2 diabetes, prediabetes, and the metabolic syndrome: a meta-analysis. Current DiabetesReviews 3(2):127–140 DOI 10.2174/157339907780598216.
Owens DR, Swallow R, Dugi KA, Woerle HJ. 2011. Efficacy and safety of linagliptin in personswith type 2 diabetes inadequately controlled by a combination of metformin and sulphonylurea:a 24-week randomized study. Diabetic Medicine 28(11):1352–1361 [Erratum appears in DiabetMed. 2012 Jan;29(1):158] DOI 10.1111/j.1464-5491.2011.03387.x.
Rigato M, Fadini GP. 2014. Comparative effectiveness of liraglutide in the treatment oftype 2 diabetes. Diabetes, Metabolic Syndrome and Obesity: Targets and Therapy 7:107–120DOI 10.2147/DMSO.S37644.
Rodbard H, Jellinger P, Davidson J, Einhorn D, Garber A, Grunberger G, Handelsman Y,Horton E, Lebovitz H, Levy P, Moghissi E, Schwartz S. 2009. Statement by an AmericanAssociation of Clinical Endocrinologists/American College of Endocrinology Consensus Panelon type 2 diabetes mellitus: an algorithm for glycemic control. Endocrine Practice 15(6):540–559DOI 10.4158/EP.15.6.540.
Rosenstock J, Sugimoto D, Strange P, Stewart JA, Soltes-Rak E, Dailey G. 2006. Triple therapyin type 2 diabetes: insulin glargine or rosiglitazone added to combination therapy ofsulfonylurea plus metformin in insulin-naive patients. Diabetes Care 29(3):554–559DOI 10.2337/diacare.29.03.06.dc05-0695.
Russell-Jones D, Vaag A, Schmitz O, Sethi BK, Lalic N, Antic S, Zdravkovic M, Ravn GM,Simo R, Liraglutide E. 2009. Action in diabetes 5 met SUSG. Liraglutide vs. insulin glargineand placebo in combination with metformin and sulfonylurea therapy in type 2 diabetesmellitus (LEAD-5 met + SU): a randomised controlled trial. Diabetologia 52(10):2046–2055DOI 10.1007/s00125-009-1472-y.
Schernthaner G, Gross JL, Rosenstock J, Guarisco M, Fu M, Yee J, Kawaguchi M,Canovatchel W, Meininger G. 2013. Canagliflozin compared with sitagliptin for patients withtype 2 diabetes who do not have adequate glycemic control with metformin plus sulfonylurea:a 52-week randomized trial. Diabetes Care 36(9):2508–2515 DOI 10.2337/dc12-2491.
Strojek K, Bebakar WM, Khutsoane DT, Pesic M, Smahelova A, Thomsen HF, Kalra S. 2009.Once-daily initiation with biphasic insulin aspart 30 versus insulin glargine in patients withtype 2 diabetes inadequately controlled with oral drugs: an open-label, multinational RCT.Current Medical Research and Opinion 25(12):2887–2894 DOI 10.1185/03007990903354674.
White IR. 2011. Multivariate random-effects meta-regression: updates to mvmeta. Stata Journal11(2):255–270.
Downes et al. (2015), PeerJ, DOI 10.7717/peerj.1461 20/21
WHO. 2013. Mortality and global health estimates. Geneva: World Health Organization. Availableat http://www.who.int/gho/mortality burden disease/en/ (accessed 20 January 2015).
Wilding JP, Charpentier G, Hollander P, Gonzalez-Galvez G, Mathieu C, Vercruysse F,Usiskin K, Law G, Black S, Canovatchel W, Meininger G. 2013. Efficacy and safety ofcanagliflozin in patients with type 2 diabetes mellitus inadequately controlled withmetformin and sulphonylurea: a randomised trial. International Journal of Clinical Practice67(12):1267–1282 DOI 10.1111/ijcp.12322.
Yang W, Xu X, Liu X, Yang G, Seino Y, Andersen H, Jinnouchi H. 2013. Treat-to-targetcomparison between once daily biphasic insulin aspart 30 and insulin glargine in Chineseand Japanese insulin-naive subjects with type 2 diabetes. Current Medical Research and Opinion29(12):1599–1608 DOI 10.1185/03007995.2013.838155.
Downes et al. (2015), PeerJ, DOI 10.7717/peerj.1461 21/21