disposable amperometric glycated hemoglobin sensor for the
TRANSCRIPT
Disposable Amperometric Glycated Hemoglobin Sensor for theFinger Prick Blood TestDong-Min Kim and Yoon-Bo Shim*
Department of Chemistry and Institute of Biophysio Sensor Technology (IBST), Pusan National University, Busan 609-735, SouthKorea
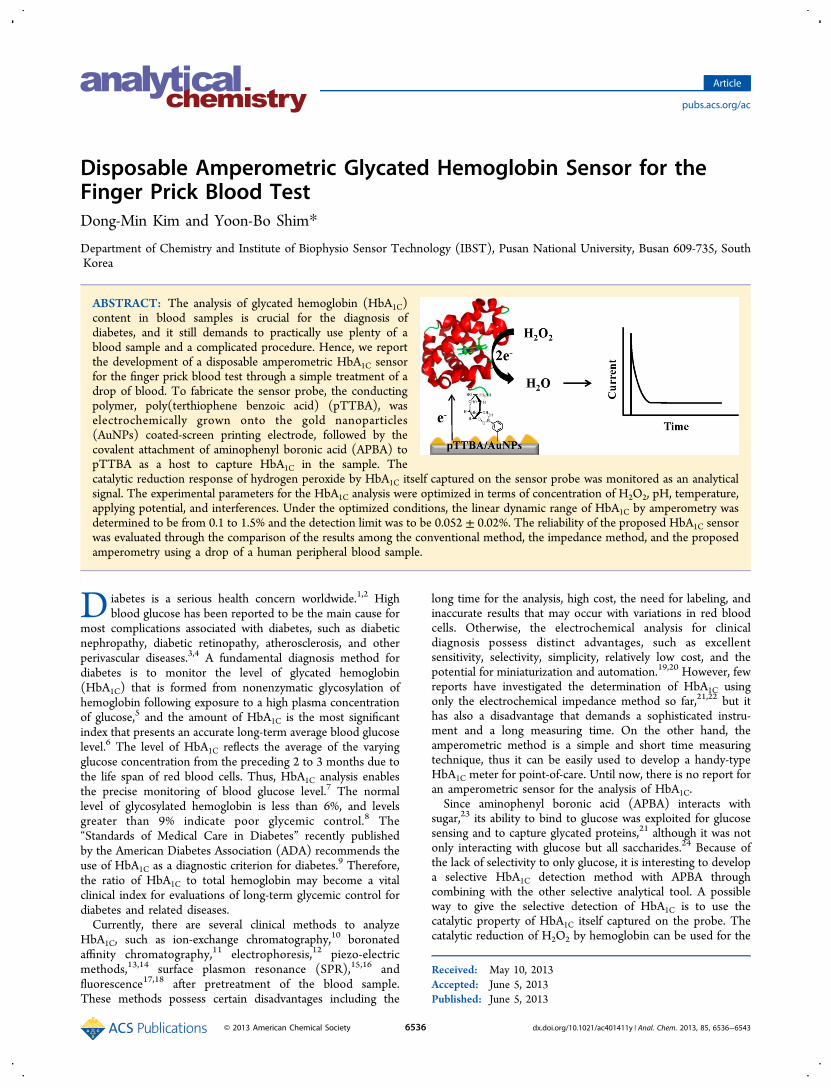
ABSTRACT: The analysis of glycated hemoglobin (HbA1C)content in blood samples is crucial for the diagnosis ofdiabetes, and it still demands to practically use plenty of ablood sample and a complicated procedure. Hence, we reportthe development of a disposable amperometric HbA1C sensorfor the finger prick blood test through a simple treatment of adrop of blood. To fabricate the sensor probe, the conductingpolymer, poly(terthiophene benzoic acid) (pTTBA), waselectrochemically grown onto the gold nanoparticles(AuNPs) coated-screen printing electrode, followed by thecovalent attachment of aminophenyl boronic acid (APBA) topTTBA as a host to capture HbA1C in the sample. Thecatalytic reduction response of hydrogen peroxide by HbA1C itself captured on the sensor probe was monitored as an analyticalsignal. The experimental parameters for the HbA1C analysis were optimized in terms of concentration of H2O2, pH, temperature,applying potential, and interferences. Under the optimized conditions, the linear dynamic range of HbA1C by amperometry wasdetermined to be from 0.1 to 1.5% and the detection limit was to be 0.052 ± 0.02%. The reliability of the proposed HbA1C sensorwas evaluated through the comparison of the results among the conventional method, the impedance method, and the proposedamperometry using a drop of a human peripheral blood sample.
Diabetes is a serious health concern worldwide.1,2 Highblood glucose has been reported to be the main cause for
most complications associated with diabetes, such as diabeticnephropathy, diabetic retinopathy, atherosclerosis, and otherperivascular diseases.3,4 A fundamental diagnosis method fordiabetes is to monitor the level of glycated hemoglobin(HbA1C) that is formed from nonenzymatic glycosylation ofhemoglobin following exposure to a high plasma concentrationof glucose,5 and the amount of HbA1C is the most significantindex that presents an accurate long-term average blood glucoselevel.6 The level of HbA1C reflects the average of the varyingglucose concentration from the preceding 2 to 3 months due tothe life span of red blood cells. Thus, HbA1C analysis enablesthe precise monitoring of blood glucose level.7 The normallevel of glycosylated hemoglobin is less than 6%, and levelsgreater than 9% indicate poor glycemic control.8 The“Standards of Medical Care in Diabetes” recently publishedby the American Diabetes Association (ADA) recommends theuse of HbA1C as a diagnostic criterion for diabetes.9 Therefore,the ratio of HbA1C to total hemoglobin may become a vitalclinical index for evaluations of long-term glycemic control fordiabetes and related diseases.Currently, there are several clinical methods to analyze
HbA1C, such as ion-exchange chromatography,10 boronatedaffinity chromatography,11 electrophoresis,12 piezo-electricmethods,13,14 surface plasmon resonance (SPR),15,16 andfluorescence17,18 after pretreatment of the blood sample.These methods possess certain disadvantages including the
long time for the analysis, high cost, the need for labeling, andinaccurate results that may occur with variations in red bloodcells. Otherwise, the electrochemical analysis for clinicaldiagnosis possess distinct advantages, such as excellentsensitivity, selectivity, simplicity, relatively low cost, and thepotential for miniaturization and automation.19,20 However, fewreports have investigated the determination of HbA1C usingonly the electrochemical impedance method so far,21,22 but ithas also a disadvantage that demands a sophisticated instru-ment and a long measuring time. On the other hand, theamperometric method is a simple and short time measuringtechnique, thus it can be easily used to develop a handy-typeHbA1C meter for point-of-care. Until now, there is no report foran amperometric sensor for the analysis of HbA1C.Since aminophenyl boronic acid (APBA) interacts with
sugar,23 its ability to bind to glucose was exploited for glucosesensing and to capture glycated proteins,21 although it was notonly interacting with glucose but all saccharides.24 Because ofthe lack of selectivity to only glucose, it is interesting to developa selective HbA1C detection method with APBA throughcombining with the other selective analytical tool. A possibleway to give the selective detection of HbA1C is to use thecatalytic property of HbA1C itself captured on the probe. Thecatalytic reduction of H2O2 by hemoglobin can be used for the
Received: May 10, 2013Accepted: June 5, 2013Published: June 5, 2013
Article
pubs.acs.org/ac
© 2013 American Chemical Society 6536 dx.doi.org/10.1021/ac401411y | Anal. Chem. 2013, 85, 6536−6543
specific response of HbA1C in amperometry, becausehemoglobin (Hb) contains four iron heme groups that catalyzethe reduction reaction of H2O2.
25 To develop a simple devicefor the selective amperometric HbA1C detection, we propose anew biosensing protocol based on the interaction with APBAand the catalytic activity of HbA1C itself toward H2O2reduction. Thus, the selectivity of the proposed method canbe achieved with both the construction of sensor probe and anadequate pretreatment of sample with removing plasma.In the present study, a disposable biosensor for HbA1C
detection was fabricated using the APBA chemically bondedon the conductive polymer layer (pTTBA/AuNPs/SPCE),where AuNPs were electrodeposited on the screen print carbonelectrode (SPCE) to enhance the stability and the sensitivity ofsensor probe. AuNPs have been widely used in biosensors toenhance the sensitivity, due to their high electrocatalyticactivities, high active surface area-to-volume ratios, and ease ofchemical modification as well as structural and functionalcompatibility with biomolecules on the electrode.26,27 Theformation of each layer was characterized using cyclicvoltammetry (CV), quartz crystal microbalance (QCM), X-ray photoelectron spectroscopy (XPS), electrochemical im-pedance spectroscopy (EIS), and chronoamperometry. Variousexperimental parameters, such as temperature, pH, H2O2concentration, and applied potential were optimized, and theinterference effect and detection limit of HbA1C wassubsequently discussed. In addition, the biosensor was appliedto the analysis of HbA1C in a finger prick blood sample througha simple filtration process with hemolysis of blood cells. Thevalidity of the proposed method was evaluated through thecomparison of results from conventional high-performanceliquid chromatography (HPLC) with the treatment of bloodsamples by centrifugation.
■ EXPERIMENTAL SECTION
Materials. A terthiophene monomer containing a benzoicacid group, 2,2′:5′,5′′-terthiophene-3′-p-benzoic acid (TTBA),was synthesized using the Paal-Knorr pyrrole condensationreaction.28 A lyophilized glycated hemoglobin (HbA1C)reference, RM 405 was purchased from Fluka. A volume of 1mL of deionized water was added to the lyophilized HbA1Cfollowed by gentle mixing for 15 min and then stored at 4 °C.The final concentration of HbA1C was obtained to be 6.29(±0.04) % in a 0.23 mM hemoglobin (Hb). Hemoglobin was
purchased from Sigma Co. This HbA1C solution was diluted toappropriate concentrations just before every measurement.Tetrabutylammonium perchlorate (TBAP, electrochemicalgrade) was purchased from Fluka. It was purified accordingto a general method and dried under vacuum at 1.33 × 10⁻³ Pa.Dichloromethane (99.8%, anhydrous, sealed under N2 gas),di(propylene glycol) methyl ether, tri(propylene glycol) methylether, 1-ethyl-3-(3-(dimethylamino)-propyl) carbodiimide(EDC), N-hydroxy succinimide (NHS), HAuCl4·3H2O, and3-aminophenylboronic acid (APBA) were purchased fromSigma Co. Aqueous solutions were prepared in doubly distilledwater that was obtained from a Milli-Q water purificationsystem (18 MΩ cm).
Instruments. The electrochemical experiments wereperformed in a three-electrode cell using an all-in-one screenprinted carbon electrode. The SPCE and GCE were composedof modified working electrodes (area = 0.07 cm2), Ag/AgCl (insaturated KCl) as a reference, and carbon as the counterelectrode. Carbon and silver inks (Jujo Chemical, Japan) wereused in the screen printing process. The SPCEs were printedon the polystyrene-based film using the screen printer(BANDO Industrial, Korea). The performance of modifiedSPCEs was confirmed with the same modified glassy carbonelectrodes. Cyclic voltammograms (CVs), linear sweepvoltammograms (LSVs), and amperograms were recordedusing a potentiostat/galvanostat, Kosentech model PT-1 andEG & G PAR model PAR 273A. A quartz crystal microbalance(QCM) experiment was conducted using a SEIKO EG&Gmodel QCA 917 and a PAR model 263A potentiostat/galvanostat. An Au-coated working electrode (area, 0.196 cm2;9 MHz; AT-cut quartz crystal) was used for the QCMexperiment. The impedance spectra were measured with theEG&G Princeton Applied Research PARSTAT 2263 at anopen circuit voltage from 100 kHz to 50 mHz at a sampling rateof five points per decade (ac amplitude, 10 mV). X-rayphotoelectron spectroscopy (XPS) experiments were per-formed using a VG Scientific ESCALAB 250 XPS spectrometerwith a monochromated Al Kα source with charge compensa-tion.
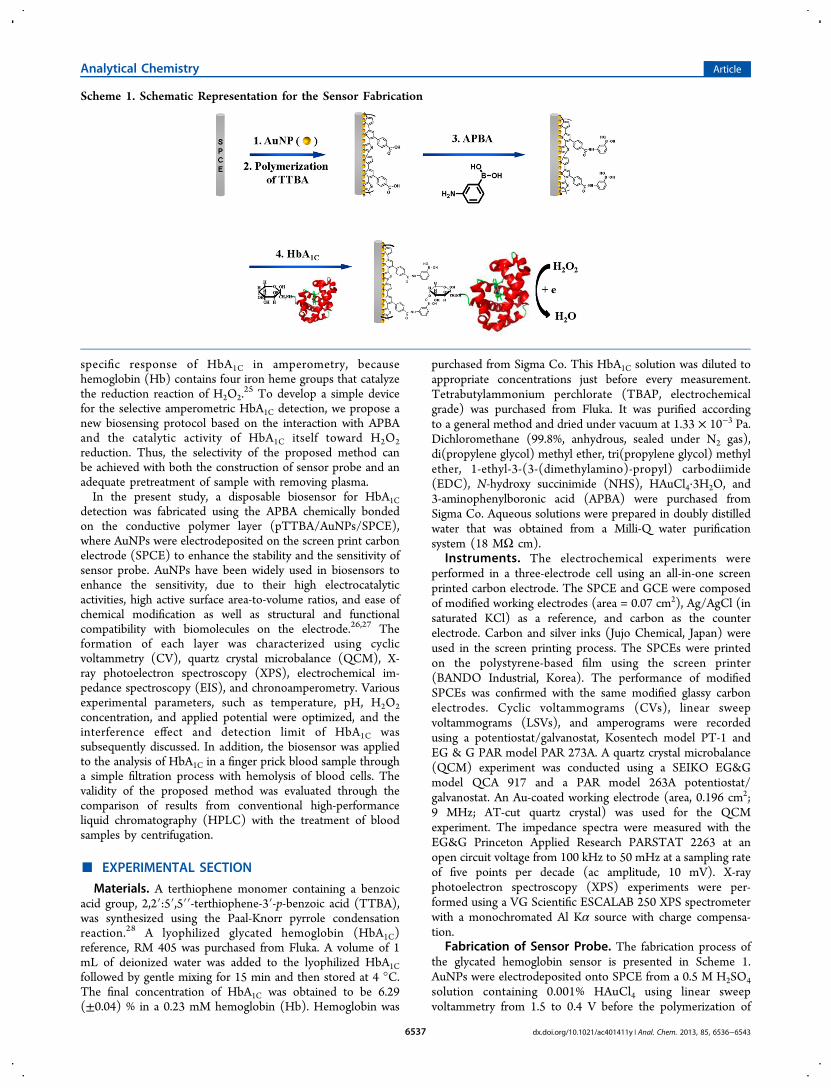
Fabrication of Sensor Probe. The fabrication process ofthe glycated hemoglobin sensor is presented in Scheme 1.AuNPs were electrodeposited onto SPCE from a 0.5 M H2SO4solution containing 0.001% HAuCl4 using linear sweepvoltammetry from 1.5 to 0.4 V before the polymerization of
Scheme 1. Schematic Representation for the Sensor Fabrication
Analytical Chemistry Article
dx.doi.org/10.1021/ac401411y | Anal. Chem. 2013, 85, 6536−65436537
TTBA. The electrodeposition conditions were as follows:deposition time, 60 s; scan rate, 0.1 V/s; deposition potential, −0.6 V; and three-times potential cycling. The pTTBA layer wasformed on AuNPs/SPCE according to our previously publishedmethod.29,30 The polymer coated AuNPs/GC electrode wasalso fabricated for the control experiments of AuNPs/SPCE.The AuNPs/SPCE was dipped in a 1.0 mM TTBA containingsolution at first, which was prepared in 1:1 of di(propyleneglycol) methyl ether and tri(propylene glycol) methyl ether.After that, the polymer film was formed on the electrodethrough potential cycling twice from 0.0 to 1.4 V (Ag/AgCl) ata scan rate of 0.1 V/s in a 0.1 M PBS (pH 7.4). Afterpolymerization, the pTTBA/AuNPs/SPCE was immersed for12 h in a 0.1 M PBS (pH 7.4) containing 10.0 mM EDC andNHS to activate the carboxylic acid groups of the pTTBA layer.After that, the electrode was washed with a buffer solution andsubsequently incubated in 10.0 mM 3-aminophenyl boronicacid (APBA) in 0.1 M PBS (pH 7.4) for 12 h at 40 °C. Finally,amine-terminated APBA was immobilized onto the pTTBAlayer by amide bond formation, followed by the EDC activationstep (APBA-pTTBA/AuNPs/SPCE).Pretreatment of Human Whole Blood. The human
whole blood was pretreated by centrifugation or syringefiltration. In the centrifugation method, the plasma wasseparated from 2 mL of the whole blood by centrifugation at3000 rpm for 10 min at 4 °C. The supernatant (plasma) wasdiscarded to remove glucose and other glycated proteins andmolecules. The remaining red blood cells were washed threetimes with a physiological saline (0.9% NaCl solution) to
remove the plasma completely. The washed red blood cells (0.5mL) were lysed by addition of 0.5 mL of hemolyzing buffersolution (26 mM NaH2PO4, 7.4 mM Na2HPO4, and 13.5 mMKCN). The samples were diluted 10-fold with 0.1 M PBS (pH7.4) for the amperometric measurement. In the filtrationmethod, 2 μL of whole blood from a finger prick collected onthe syringe filter (pore size, 0.45 μm) and then removed theplasma, after that the collected red blood cells on the filter werewashed three times with a 0.9% NaCl solution. Hemoglobinwas eluted from red blood cells on filter paper by addition of 18μL of hemolyzing buffer solution, and impedance andamperometric measurements were performed after 15 min,respectively.
■ RESULTS AND DISCUSSION
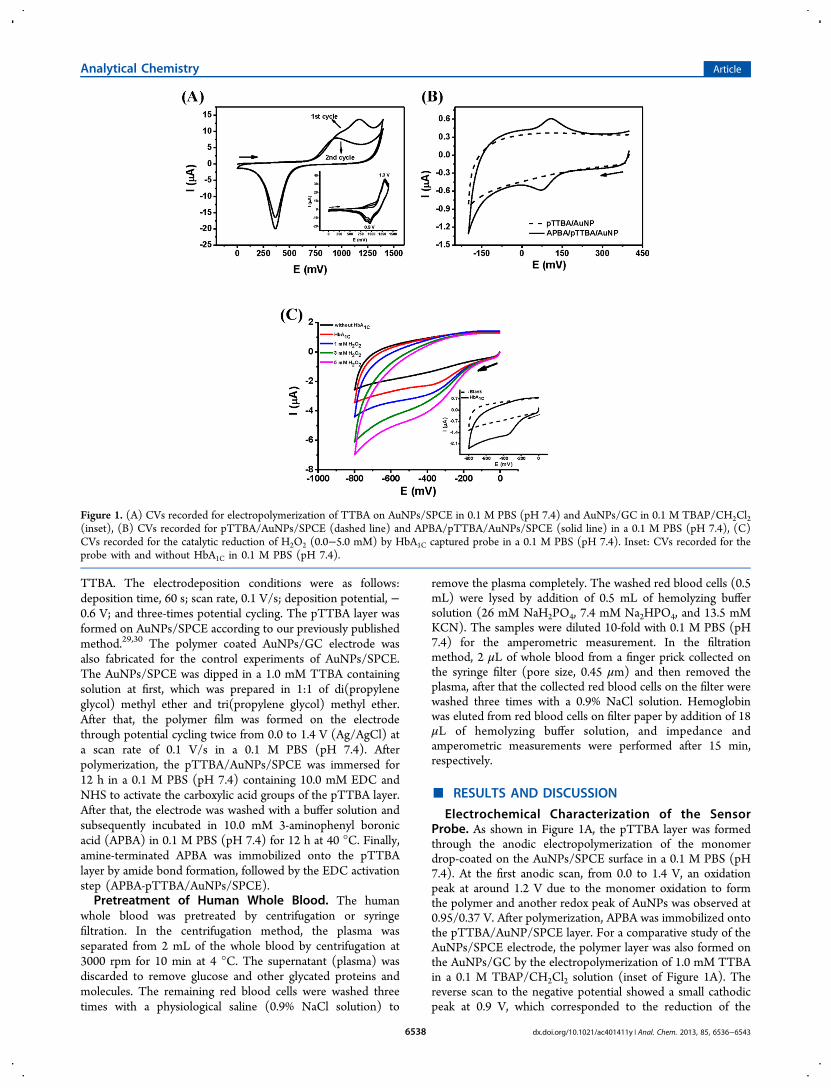
Electrochemical Characterization of the SensorProbe. As shown in Figure 1A, the pTTBA layer was formedthrough the anodic electropolymerization of the monomerdrop-coated on the AuNPs/SPCE surface in a 0.1 M PBS (pH7.4). At the first anodic scan, from 0.0 to 1.4 V, an oxidationpeak at around 1.2 V due to the monomer oxidation to formthe polymer and another redox peak of AuNPs was observed at0.95/0.37 V. After polymerization, APBA was immobilized ontothe pTTBA/AuNP/SPCE layer. For a comparative study of theAuNPs/SPCE electrode, the polymer layer was also formed onthe AuNPs/GC by the electropolymerization of 1.0 mM TTBAin a 0.1 M TBAP/CH2Cl2 solution (inset of Figure 1A). Thereverse scan to the negative potential showed a small cathodicpeak at 0.9 V, which corresponded to the reduction of the
Figure 1. (A) CVs recorded for electropolymerization of TTBA on AuNPs/SPCE in 0.1 M PBS (pH 7.4) and AuNPs/GC in 0.1 M TBAP/CH2Cl2(inset), (B) CVs recorded for pTTBA/AuNPs/SPCE (dashed line) and APBA/pTTBA/AuNPs/SPCE (solid line) in a 0.1 M PBS (pH 7.4), (C)CVs recorded for the catalytic reduction of H2O2 (0.0−5.0 mM) by HbA1C captured probe in a 0.1 M PBS (pH 7.4). Inset: CVs recorded for theprobe with and without HbA1C in 0.1 M PBS (pH 7.4).
Analytical Chemistry Article
dx.doi.org/10.1021/ac401411y | Anal. Chem. 2013, 85, 6536−65436538

polymer film that had immediately formed on the electrode.The electrochemical behavior of the APBA-immobilized on thepTTBA/AuNPs/SPCE was examined using CV as shown inFigure 1B. No redox peak was observed when the CV wasrecorded for the pTTBA/AuNP/SPCE (dashed line) withoutAPBA. However, a pair of redox peaks was observed at 0.076/0.107 V, which resulted from the redox process of the APBAbonded to the pTTBA, where the peak separation wasdetermined to be approximately 0.031 V. These resultsindicated that the APBA monomer was successfully immobi-lized onto the pTTBA/AuNP/SPCE layer.In the next step, HbA1C was captured onto the APBA-
pTTBA/AuNP/SPCE layer through cis-diol interactionsbetween the diol group of glucose of HbA1C and the boronicacid group. The inset of Figure 1C shows the CVs recorded forthe HbA1C captured on APBA modified electrode in 0.1 M PBS(pH 7.4) without H2O2. In this case, a pair of redox peaks ofHbA1C appeared at −0.34/− 0.16 V, which resulted from theredox process of the heme groups of HbA1C captured on APBA.Otherwise, no redox peaks were observed when the CV wasrecorded for the APBA-pTTBA/AuNP/SPCE (dashed line)without HbA1C. Figure 1C shows the catalytic reduction peakof H2O2 by the captured HbA1C appeared at −0.37 V on theHbA1C/APBA-pTTBA/AuNPs probe in 0.1 M PBS (pH 7.4)containing H2O2 (0.0−5.0 mM). In this catalytic process, thereduction current of H2O2 increases as the concentration ofH2O2 increases, which is used as an analytical signal for theHbA1C determination by amperometry.
XPS and QCM Analysis for APBA Modification. Toelucidate the chemical bonding of APBA onto the pTTBAlayer, the XPS spectra were analyzed in terms of Au4f, C1s,S2p, N1s (Figure 2A) and B1s (Figure 2B) peaks for AuNP,pTTBA/AuNP, and APBA-pTTBA/AuNP surfaces. The Au4f,C1s, and S2p spectra of AuNP and pTTBA/AuNP surfacesdisplayed the same result as they have been previouslyreported.28 The N1s spectrum exhibits a distinct peak at399.4 eV after APBA immobilization, while no peak appears forthe pTTBA layer due to the absence of the nitrogen atom inthe molecule. The B1s spectrum also exhibits a peak at 191.2eV, corresponding to the C−B bond. These results indicatedthat APBA is successfully immobilized onto the pTTBA layer.The amount of APBA immobilized onto the pTTBA-
modified electrode was determined by the QCM experiment.Figure 2C shows the frequency change during the immobiliza-tion using 10.0 mM of APBA in a 0.1 M PBS (pH 7.4). Thefrequency decreased as the reaction progressed, indicatingimmobilization of APBA onto the pTTBA-modified electrodesurface. In this case, the decrease in frequency did not reach acomplete steady state before 2 h, due to the slowimmobilization of APBA. At 2 h, the overall frequency change(Δf) was found to be 78.4 Hz, which corresponded to anincrease in mass of 86.17 ng. In this case, the surface coverageof APBA was calculated to be 2.86 × 10⁻⁹ mol/cm2. However,the change in frequency using the APBA attached probe wasrapid in a solution containing 1.0% HbA1C, indicating theHbA1C−APBA interaction. The steady-state frequency change
Figure 2. ESCA spectra of (A) N1s and (B) B1s peaks for pTTBA/AuNPs and APBA/pTTBA/AuNPs. (C) Frequency changes duringimmobilization of APBA onto the pTTBA/Au-coated electrode (solid line) and one of HbA1C onto the APBA/pTTBA/Au-coated electrode (dashedline).
Analytical Chemistry Article
dx.doi.org/10.1021/ac401411y | Anal. Chem. 2013, 85, 6536−65436539
was reached after approximately 20 min with a frequencychange of 103.11 Hz. In this reaction, the mass changeobserved after the HbA1C-APBA reaction was 113.34 ng, wherethe surface coverage of HbA1C was calculated to be 1.03 ×10⁻¹⁰ mol/cm2. Figure 2C shows that the time for HbA1C−APBA interaction is clearly short, and it can, therefore, be usedas the general detection method for HbA1C.Amperometric Analysis of HbA1C. To optimize analytical
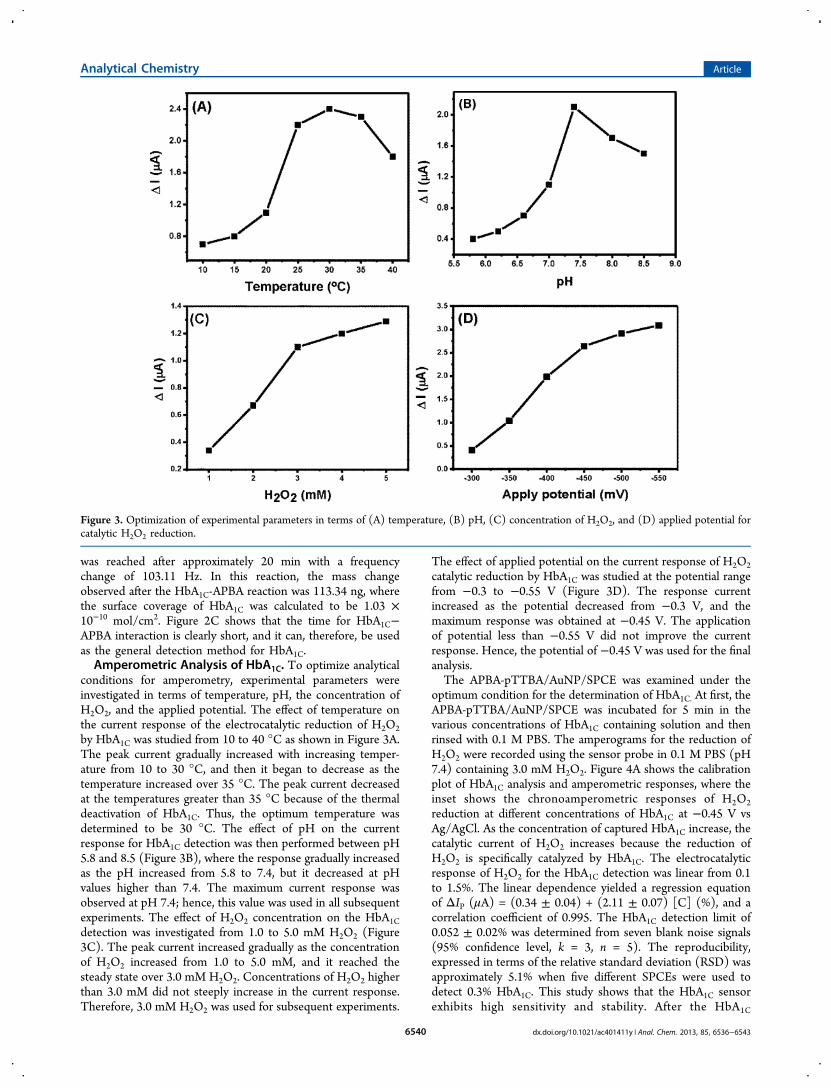
conditions for amperometry, experimental parameters wereinvestigated in terms of temperature, pH, the concentration ofH2O2, and the applied potential. The effect of temperature onthe current response of the electrocatalytic reduction of H2O2by HbA1C was studied from 10 to 40 °C as shown in Figure 3A.The peak current gradually increased with increasing temper-ature from 10 to 30 °C, and then it began to decrease as thetemperature increased over 35 °C. The peak current decreasedat the temperatures greater than 35 °C because of the thermaldeactivation of HbA1C. Thus, the optimum temperature wasdetermined to be 30 °C. The effect of pH on the currentresponse for HbA1C detection was then performed between pH5.8 and 8.5 (Figure 3B), where the response gradually increasedas the pH increased from 5.8 to 7.4, but it decreased at pHvalues higher than 7.4. The maximum current response wasobserved at pH 7.4; hence, this value was used in all subsequentexperiments. The effect of H2O2 concentration on the HbA1Cdetection was investigated from 1.0 to 5.0 mM H2O2 (Figure3C). The peak current increased gradually as the concentrationof H2O2 increased from 1.0 to 5.0 mM, and it reached thesteady state over 3.0 mM H2O2. Concentrations of H2O2 higherthan 3.0 mM did not steeply increase in the current response.Therefore, 3.0 mM H2O2 was used for subsequent experiments.
The effect of applied potential on the current response of H2O2catalytic reduction by HbA1C was studied at the potential rangefrom −0.3 to −0.55 V (Figure 3D). The response currentincreased as the potential decreased from −0.3 V, and themaximum response was obtained at −0.45 V. The applicationof potential less than −0.55 V did not improve the currentresponse. Hence, the potential of −0.45 V was used for the finalanalysis.The APBA-pTTBA/AuNP/SPCE was examined under the
optimum condition for the determination of HbA1C. At first, theAPBA-pTTBA/AuNP/SPCE was incubated for 5 min in thevarious concentrations of HbA1C containing solution and thenrinsed with 0.1 M PBS. The amperograms for the reduction ofH2O2 were recorded using the sensor probe in 0.1 M PBS (pH7.4) containing 3.0 mM H2O2. Figure 4A shows the calibrationplot of HbA1C analysis and amperometric responses, where theinset shows the chronoamperometric responses of H2O2reduction at different concentrations of HbA1C at −0.45 V vsAg/AgCl. As the concentration of captured HbA1C increase, thecatalytic current of H2O2 increases because the reduction ofH2O2 is specifically catalyzed by HbA1C. The electrocatalyticresponse of H2O2 for the HbA1C detection was linear from 0.1to 1.5%. The linear dependence yielded a regression equationof ΔIP (μA) = (0.34 ± 0.04) + (2.11 ± 0.07) [C] (%), and acorrelation coefficient of 0.995. The HbA1C detection limit of0.052 ± 0.02% was determined from seven blank noise signals(95% confidence level, k = 3, n = 5). The reproducibility,expressed in terms of the relative standard deviation (RSD) wasapproximately 5.1% when five different SPCEs were used todetect 0.3% HbA1C. This study shows that the HbA1C sensorexhibits high sensitivity and stability. After the HbA1C
Figure 3. Optimization of experimental parameters in terms of (A) temperature, (B) pH, (C) concentration of H2O2, and (D) applied potential forcatalytic H2O2 reduction.
Analytical Chemistry Article
dx.doi.org/10.1021/ac401411y | Anal. Chem. 2013, 85, 6536−65436540

measurements, the sensor activity was restored by dipping theelectrode in a sodium acetate buffer (pH 4.0). When it wasstored at 4 °C, the sensor retained more than 92% of itsresponse to HbA1C after 1 month.Impedance Analysis of HbA1C. Impedance spectroscopic
experiment was performed for the characterization of APBA-pTTBA/AuNP/SPCE at an open circuit voltage and also forthe analysis of HbA1C to compare with the amperometric result.Before the impedance measurements, the APBA-pTTBA/AuNP/SPCE was incubated for 5 min in the variousconcentrations of HbA1C solution and then rinsed with 0.1 MPBS. The HbA1C−APBA interaction occurred on the sensorsurface and can provide the changes in the interfacialproperties, which could produce the impedance response.The impedance increased with increasing concentrations ofHbA1C in 0.1 M PBS (pH 7.4). The Rp (Rp1 + Rp2) valueswere obtained by fitting the experimental data to the equivalentcircuit using the Zview2 impedance software. Figure 4B showsthe calibration plot for HbA1C detection using Rp (Rp1 + Rp2)values. The Nyquist plot obtained for various concentrations ofHbA1C as shown in the inset of Figure 4B. The linear dynamicrange of HbA1C was determined to be from 0.5 to 6.0%, and thedetection limit was to be 0.27% (k = 3, n = 5). The linearregression equation is expressed as Rp (kΩ) = (− 11.4 ± 4.2) +(49.5 ± 1.2) [C] (%), with a correlation coefficient of 0.997.
The concentration level of dynamic range in amperometry islower than that of the impedance method, and the sensitivity ofamperometry is five times higher than that of the impedancemethod. Thus, it is possible to use a very small quantity ofblood sample (<2 μL) in this proposed amperometry.
Interference Studies. The selectivity for the determinationof HbA1C was evaluated amperometrically and impedimetricallywith untreated whole blood and pretreated blood samplesobtained from healthy volunteers. In order to removeinterfering species in the whole blood, such as glucose, glycatedalbumin, and other glycated protein, the samples werepretreated with centrifugation or cell lysis in a syringe filter.Until now, the HbA1C concentration in the whole blood samplecould not be determined by using the amperometric method,because it exhibited no selective amperometric response byHbA1C due to the strong and fast interaction by otherinterfering species including glucose molecules. However, bya simple pretreatment of whole blood with syringe filtration, theHbA1C was amperometrically determined to be 4.72 ± 0.12% asshown in Figure 5A. The Nyquist plots obtained for wholeblood and pretreated blood samples were as shown in Figure5B, where the ΔRp values for whole blood and pretreated bloodsamples were 430.6 and 230.7 kΩ, respectively. The ΔRp valueof whole blood sample without pretreatment was 1.87 timeshigher than that of the pretreated blood sample, indicating thatthere were interferences by other glycated molecules or glucoseexisting in the blood matrix. As shown in Figure 5C, the resultsfrom the impedance method with pretreatment are coincidentto that of the amperometric method, where the HbA1Cconcentration by the impedance method was determined tobe 4.89 ± 0.19%. These results confirm that the amperometricmethod can very precisely determine HbA1C in blood sampleswith simple filtration, indicating the utilization of the presentmethod to diagnose the diabetes in a handy type sensor device.
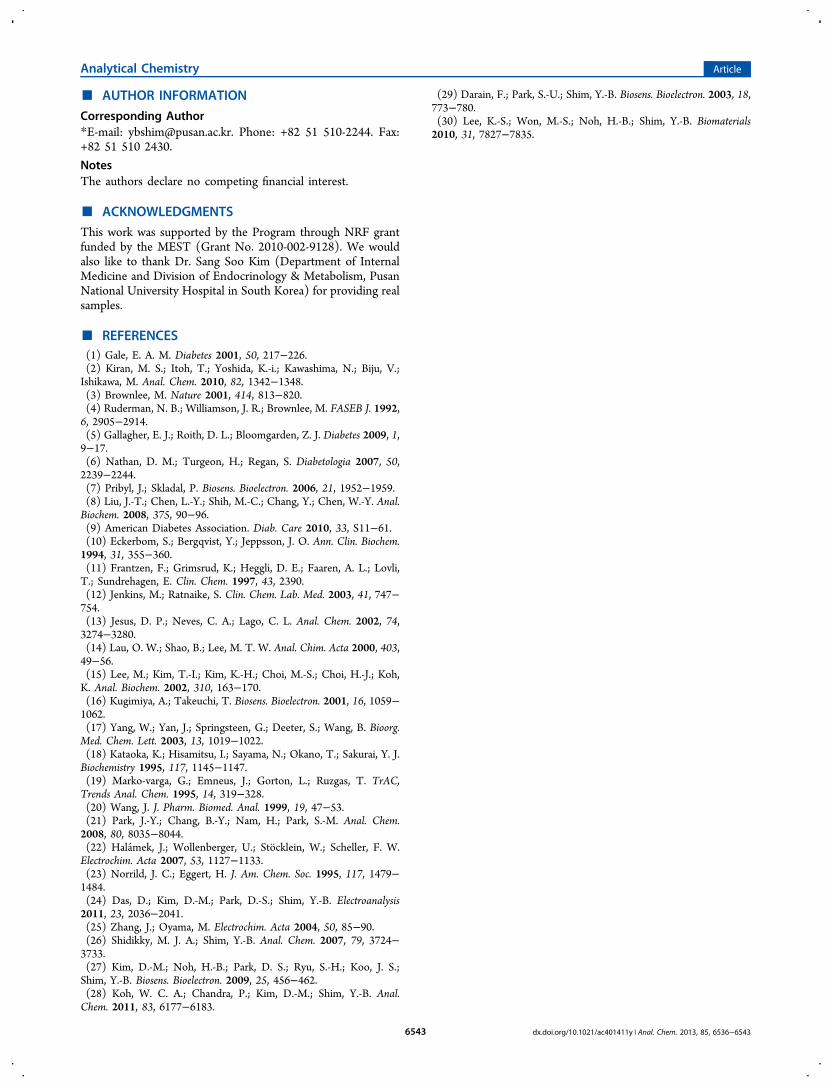
Real Sample Analysis. The reliability of the proposedsensor was also examined through the determination of HbA1Cconcentrations in the blood samples of healthy volunteers(samples 3, 4, and 5) and diabetic patients (samples 1 and 2),which were obtained from Pusan National University Hospitalin South Korea. The HbA1C concentration in the blood sampleswere determined using two different pretreatment methods ofthe filtration and the centrifugation followed by the standardaddition method. At first, the HbA1C concentration in a drop ofblood through simple filtration was determined from thecalibration plot as shown in Figure 6. The pretreated of bloodsamples with filtration were diluted 10-fold. The HbA1Cconcentrations of samples 1, 2, 3, 4, and 5, which were diluted10-fold, were found to be 0.564 ± 0.009%, 0.776 ± 0.004%,0.518 ± 0.002%, 0.538 ± 0.005, and 0.472 ± 0.012%,respectively. Therefore, the actual HbA1C concentrations inthe blood samples were 5.64 ± 0.09%, 7.76 ± 0.04%, 5.18 ±0.02%, 5.38 ± 0.05%, and 4.72 ± 0.12% for samples 1, 2, 3, 4,and 5, respectively. The comparison of the HbA1C concen-trations in healthy volunteers (samples 3, 4, and 5) wasperformed through further analysis using the centrifugationmethod for 2 mL blood samples. The HbA1C concentrationsusing the centrifugation method were 5.26 ± 0.03%, 5.41 ±0.09%, and 4.92 ± 0.08%, respectively. The agreement betweenthe two results provided by amperometry with filtration of 2 μLand centrifugation of 2 mL blood samples separately wasevaluated through the paired t-test, in which the calculated tvalue (2.05) was less than the critical t value (2.31) at a 95%confidence level (n = 9). In addition, the results from the
Figure 4. (A) Linear calibration plot and chronoamperometricresponse (inset) for HbA1C (reference, RM 405) detection at −0.45V vs Ag/AgCl in a 0.1 M PBS (pH 7.4) containing 3.0 mM H2O2. (B)Linear calibration plot for HbA1C (reference, RM 405) detection.Inset: Nyquist plots and equivalent circuit of impedance measure-ments with various concentrations of HbA1C.
Analytical Chemistry Article
dx.doi.org/10.1021/ac401411y | Anal. Chem. 2013, 85, 6536−65436541
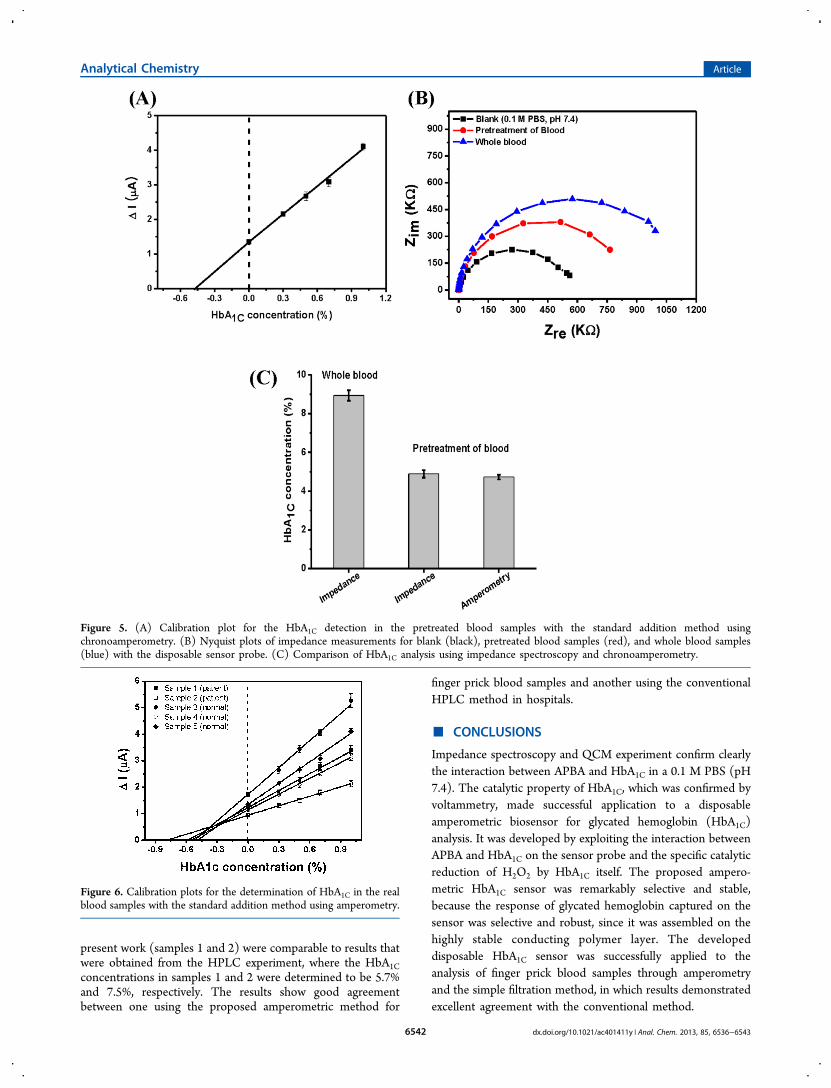
present work (samples 1 and 2) were comparable to results thatwere obtained from the HPLC experiment, where the HbA1Cconcentrations in samples 1 and 2 were determined to be 5.7%and 7.5%, respectively. The results show good agreementbetween one using the proposed amperometric method for
finger prick blood samples and another using the conventionalHPLC method in hospitals.
■ CONCLUSIONS
Impedance spectroscopy and QCM experiment confirm clearlythe interaction between APBA and HbA1C in a 0.1 M PBS (pH7.4). The catalytic property of HbA1C, which was confirmed byvoltammetry, made successful application to a disposableamperometric biosensor for glycated hemoglobin (HbA1C)analysis. It was developed by exploiting the interaction betweenAPBA and HbA1C on the sensor probe and the specific catalyticreduction of H2O2 by HbA1C itself. The proposed ampero-metric HbA1C sensor was remarkably selective and stable,because the response of glycated hemoglobin captured on thesensor was selective and robust, since it was assembled on thehighly stable conducting polymer layer. The developeddisposable HbA1C sensor was successfully applied to theanalysis of finger prick blood samples through amperometryand the simple filtration method, in which results demonstratedexcellent agreement with the conventional method.
Figure 5. (A) Calibration plot for the HbA1C detection in the pretreated blood samples with the standard addition method usingchronoamperometry. (B) Nyquist plots of impedance measurements for blank (black), pretreated blood samples (red), and whole blood samples(blue) with the disposable sensor probe. (C) Comparison of HbA1C analysis using impedance spectroscopy and chronoamperometry.
Figure 6. Calibration plots for the determination of HbA1C in the realblood samples with the standard addition method using amperometry.
Analytical Chemistry Article
dx.doi.org/10.1021/ac401411y | Anal. Chem. 2013, 85, 6536−65436542
■ AUTHOR INFORMATION
Corresponding Author*E-mail: [email protected]. Phone: +82 51 510-2244. Fax:+82 51 510 2430.
NotesThe authors declare no competing financial interest.
■ ACKNOWLEDGMENTS
This work was supported by the Program through NRF grantfunded by the MEST (Grant No. 2010-002-9128). We wouldalso like to thank Dr. Sang Soo Kim (Department of InternalMedicine and Division of Endocrinology & Metabolism, PusanNational University Hospital in South Korea) for providing realsamples.
■ REFERENCES(1) Gale, E. A. M. Diabetes 2001, 50, 217−226.(2) Kiran, M. S.; Itoh, T.; Yoshida, K.-i.; Kawashima, N.; Biju, V.;Ishikawa, M. Anal. Chem. 2010, 82, 1342−1348.(3) Brownlee, M. Nature 2001, 414, 813−820.(4) Ruderman, N. B.; Williamson, J. R.; Brownlee, M. FASEB J. 1992,6, 2905−2914.(5) Gallagher, E. J.; Roith, D. L.; Bloomgarden, Z. J. Diabetes 2009, 1,9−17.(6) Nathan, D. M.; Turgeon, H.; Regan, S. Diabetologia 2007, 50,2239−2244.(7) Pribyl, J.; Skladal, P. Biosens. Bioelectron. 2006, 21, 1952−1959.(8) Liu, J.-T.; Chen, L.-Y.; Shih, M.-C.; Chang, Y.; Chen, W.-Y. Anal.Biochem. 2008, 375, 90−96.(9) American Diabetes Association. Diab. Care 2010, 33, S11−61.(10) Eckerbom, S.; Bergqvist, Y.; Jeppsson, J. O. Ann. Clin. Biochem.1994, 31, 355−360.(11) Frantzen, F.; Grimsrud, K.; Heggli, D. E.; Faaren, A. L.; Lovli,T.; Sundrehagen, E. Clin. Chem. 1997, 43, 2390.(12) Jenkins, M.; Ratnaike, S. Clin. Chem. Lab. Med. 2003, 41, 747−754.(13) Jesus, D. P.; Neves, C. A.; Lago, C. L. Anal. Chem. 2002, 74,3274−3280.(14) Lau, O. W.; Shao, B.; Lee, M. T. W. Anal. Chim. Acta 2000, 403,49−56.(15) Lee, M.; Kim, T.-I.; Kim, K.-H.; Choi, M.-S.; Choi, H.-J.; Koh,K. Anal. Biochem. 2002, 310, 163−170.(16) Kugimiya, A.; Takeuchi, T. Biosens. Bioelectron. 2001, 16, 1059−1062.(17) Yang, W.; Yan, J.; Springsteen, G.; Deeter, S.; Wang, B. Bioorg.Med. Chem. Lett. 2003, 13, 1019−1022.(18) Kataoka, K.; Hisamitsu, I.; Sayama, N.; Okano, T.; Sakurai, Y. J.Biochemistry 1995, 117, 1145−1147.(19) Marko-varga, G.; Emneus, J.; Gorton, L.; Ruzgas, T. TrAC,Trends Anal. Chem. 1995, 14, 319−328.(20) Wang, J. J. Pharm. Biomed. Anal. 1999, 19, 47−53.(21) Park, J.-Y.; Chang, B.-Y.; Nam, H.; Park, S.-M. Anal. Chem.2008, 80, 8035−8044.(22) Halamek, J.; Wollenberger, U.; Stocklein, W.; Scheller, F. W.Electrochim. Acta 2007, 53, 1127−1133.(23) Norrild, J. C.; Eggert, H. J. Am. Chem. Soc. 1995, 117, 1479−1484.(24) Das, D.; Kim, D.-M.; Park, D.-S.; Shim, Y.-B. Electroanalysis2011, 23, 2036−2041.(25) Zhang, J.; Oyama, M. Electrochim. Acta 2004, 50, 85−90.(26) Shidikky, M. J. A.; Shim, Y.-B. Anal. Chem. 2007, 79, 3724−3733.(27) Kim, D.-M.; Noh, H.-B.; Park, D. S.; Ryu, S.-H.; Koo, J. S.;Shim, Y.-B. Biosens. Bioelectron. 2009, 25, 456−462.(28) Koh, W. C. A.; Chandra, P.; Kim, D.-M.; Shim, Y.-B. Anal.Chem. 2011, 83, 6177−6183.
(29) Darain, F.; Park, S.-U.; Shim, Y.-B. Biosens. Bioelectron. 2003, 18,773−780.(30) Lee, K.-S.; Won, M.-S.; Noh, H.-B.; Shim, Y.-B. Biomaterials2010, 31, 7827−7835.
Analytical Chemistry Article
dx.doi.org/10.1021/ac401411y | Anal. Chem. 2013, 85, 6536−65436543