trip generation comparison
TRANSCRIPT


CUBES SELF-STORAGE MILL CREEK TRIP GENERATION COMPARISON
1. INTRODUCTION
This report summarizes traffic impacts of the proposed CUBES Self-Storage Mill Creek project in comparison to the traffic currently emanating from the site as part of the retail nursery. The findings of this study is to provide a review of the traffic impacts created by the change of use for review by the city of Mill Creek and the WSDOT.
2. PROJECT DESCRIPTION
The CUBES Self-Storage Mill Creek project proposes to construct an 90,425 square foot mini-warehouse in the City of Mill Creek. The project is located at 17414 Bothell Everett Highway. Access to the site is proposed to remain via two existing entrances onto the Bothell Everett Highway. The current use is a nursery with over 20,000 square feet of enclosed space and occupying 2.46 acres of the approximate 3.6 acre parcel. The area surrounding the project is a mix of residential and commercial land uses. The buildout year of the site is expected to be around 2019. Figure 1 on the following page shows the vicinity of the area along with the street network servicing the site. The general configuration of the project is shown on the site plan on Figure 2.
3. EXISTING CONDITIONS
3.1 Surrounding Roadway System
The site will primarily be served by the Bothell Everett Highway (SR-527) , which is a north-south, multilane State Route that borders the east side of the property. The speed limit is posted at 45 mph in the vicinity of the site. Typically, the cross section of the roadway is two lanes of travel in either direction along with a center two-way left turn lane. Paving is asphalt and lane widths are around 11 feet. Shoulders are curb, gutter, and sidewalk or paved in some areas. Bike lanes are provided in the vicinity of the mini-warehouse site. Grades are level.
2

3

4

3.2 Public Transit
A review of the Community Transit regional bus schedule transit service is provided in the vicinity of the site. Route 105 serves from the Mariner Park & Ride to Bothell between the hours of 4:42 AM and 10:45 PM. Stops are provided along SR 527. Route 435 runs from Mill Creek to Seattle. Service is available from 5:34 AM to 6:55 PM. Stops are provided along SR-527.
3.3 Sight Distance at Access Driveways
Assessments of the proposed access driveways were made to determine whether or not adequate entering sight distance (ESD) can be provided for project traffic. Sight distance requirements were obtained from the American Association of State Highway and Transportation Officials (AASHTO) standards for outbound movements. Based on preliminary examinations of the proposed access location, sight distance requirements are met. Measurements at the proposed entrances are summarized in Table 1 below.
The sight distance for the site access will be reviewed at the time of civil plan review.
Table 1 Entering Sight Distance (ESD)
Measurements given in feet
Roadway Posted Speed Limit
Direction Recommended Available
Bothell Everett Hwy And Both Entr. 45 mph
North 500 >600
South 500 >600
4. TRIP GENERATION COMPARISON
Trip generation is used to determine the magnitude of project impacts on the surrounding street system. Data presented in this report was taken from the Institute of Transportation Engineer's publication Trip Generation, 10th Edition. The designated land uses studied for the site are defined as Nursery (Garden Center - LUC 817) for the existing use and Mini-Warehouse (LUC 151) for the proposed use. Volumes for the peak hours are shown on the following page in Table 2. Given, are average daily trips (ADT), AM peak hour and PM peak hour trip generation volumes for each of the uses. The independent variable for the Nursery use was assumed to be the 2.46 occupied acres for the property versus the 20,000 square feet of enclosed space which is beyond the data limits in the ITE manual.
5

Table 2 Project Trip Generation - Difference
Time Period Exist Nursery
New Mini WH
Difference
ADT 266 vpd 150 vpd -116 vpdAM Peak Inbound 4 vph 6 vph 2 vph AM Peak Outbound 3 vph 4 vph 1 vph AM Peak Total 7 vph 10 vph 3 vph PM Peak Inbound 10 vph 8 vph -2 vphPM Peak Outbound 10 vph 9 vph -1 vphPM Peak Total 20 vpf 17 vph -3 vph
(vpd: vehicles per day; vph: vehicles per hour)
5. CONCLUSIONS AND MITIGATION
The CUBES Self-Storage Mill Creek project proposes to remove an existing 2.46-acre nursery-garden center and replace it with a 90,425 square foot mini-warehouse. The site location is at 17414 Bothell Everett Highway in the City of Mill Creek. Access to the site will be provided by the existing two entrances currently serving the nursery which shall be coordinated with WSDOT. Two points of access will better serve the proposed use for increased truck maneuverability and site circulation. No safety issues are identified with the continued use of two entrances on Bothell Everett Highway.
On a daily basis, an estimated 116 trips would be removed from the site. The AM peak hour would see an increase of 3 trips and the critical PM peak hour would see a reduction of 3 trips.
6

CUBES SELF-STORAGE MILL CREEK TRIP GENERATION COMPARISON
APPENDIX
7
8/10/2018 https://itetripgen.org/PrintGraph.htm?code=151&ivlabel=QFQAF&timeperiod=AWDVTE&x=99.4&edition=385&locationCode=General Ur…
https://itetripgen.org/PrintGraph.htm?code=151&ivlabel=QFQAF&timeperiod=AWDVTE&x=99.4&edition=385&locationCode=General%20Urban/Subur… 1/1
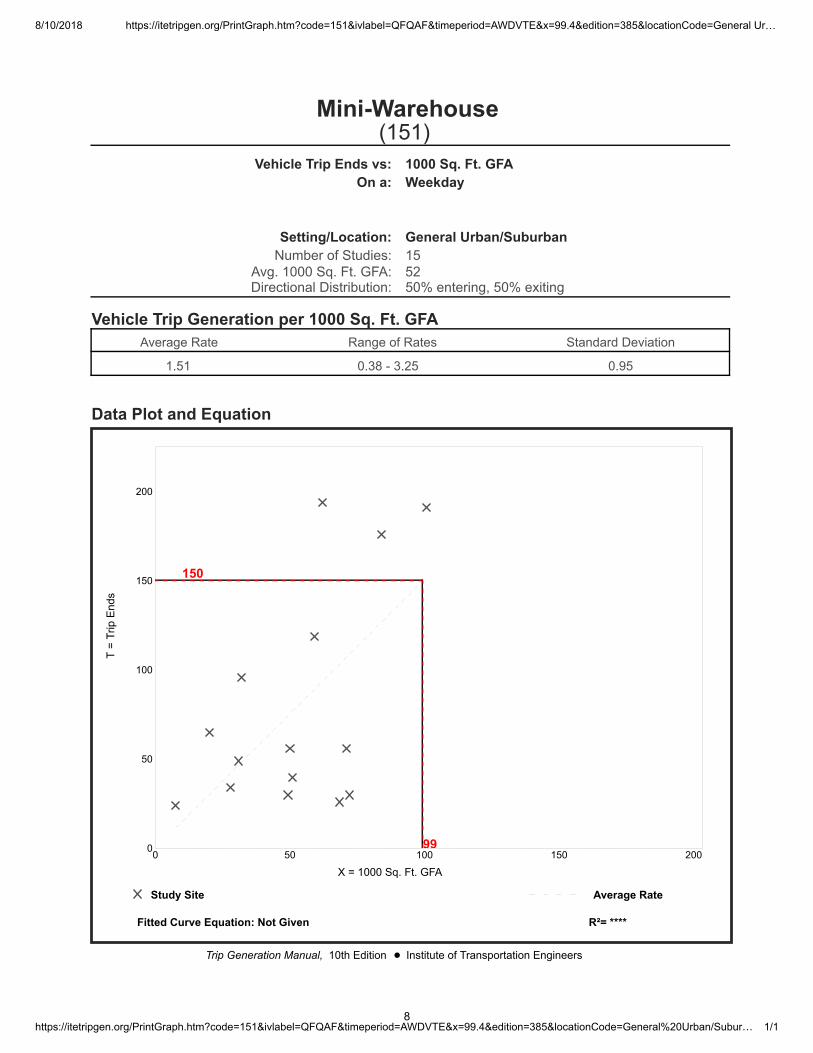
Mini-Warehouse(151)
Vehicle Trip Ends vs: 1000 Sq. Ft. GFAOn a: Weekday
Setting/Location: General Urban/SuburbanNumber of Studies: 15
Avg. 1000 Sq. Ft. GFA: 52Directional Distribution: 50% entering, 50% exiting
Vehicle Trip Generation per 1000 Sq. Ft. GFAAverage Rate Range of Rates Standard Deviation
1.51 0.38 - 3.25 0.95
Data Plot and Equation
T =
Trip
End
s
X = 1000 Sq. Ft. GFA
Study Site Average Rate
Fitted Curve Equation: Not Given R²= ****
Trip Generation Manual, 10th Edition Institute of Transportation Engineers
0 50 100 150 2000
50
100
150
200
99
150
8

8/10/2018 https://itetripgen.org/PrintGraph.htm?code=151&ivlabel=QFQAF&timeperiod=TASIDE&x=99.4&edition=385&locationCode=General Urba…
https://itetripgen.org/PrintGraph.htm?code=151&ivlabel=QFQAF&timeperiod=TASIDE&x=99.4&edition=385&locationCode=General%20Urban/Suburb… 1/1
Mini-Warehouse(151)
Vehicle Trip Ends vs: 1000 Sq. Ft. GFAOn a: Weekday,
Peak Hour of Adjacent Street Traffic,One Hour Between 7 and 9 a.m.
Setting/Location: General Urban/SuburbanNumber of Studies: 11
Avg. 1000 Sq. Ft. GFA: 65Directional Distribution: 60% entering, 40% exiting
Vehicle Trip Generation per 1000 Sq. Ft. GFAAverage Rate Range of Rates Standard Deviation
0.10 0.04 - 0.17 0.05
Data Plot and Equation
T =
Trip
End
s
X = 1000 Sq. Ft. GFA
Study Site Average Rate
Fitted Curve Equation: Not Given R²= ****
Trip Generation Manual, 10th Edition Institute of Transportation Engineers
0 50 100 150 2000
5
10
15
20
99
10
9

8/10/2018 https://itetripgen.org/PrintGraph.htm?code=151&ivlabel=QFQAF&timeperiod=TPSIDE&x=99.4&edition=385&locationCode=General Urba…
https://itetripgen.org/PrintGraph.htm?code=151&ivlabel=QFQAF&timeperiod=TPSIDE&x=99.4&edition=385&locationCode=General%20Urban/Suburb… 1/1
Mini-Warehouse(151)
Vehicle Trip Ends vs: 1000 Sq. Ft. GFAOn a: Weekday,
Peak Hour of Adjacent Street Traffic,One Hour Between 4 and 6 p.m.
Setting/Location: General Urban/SuburbanNumber of Studies: 16
Avg. 1000 Sq. Ft. GFA: 54Directional Distribution: 47% entering, 53% exiting
Vehicle Trip Generation per 1000 Sq. Ft. GFAAverage Rate Range of Rates Standard Deviation
0.17 0.04 - 0.64 0.14
Data Plot and Equation
T =
Trip
End
s
X = 1000 Sq. Ft. GFA
Study Site Average Rate
Fitted Curve Equation: Not Given R²= ****
Trip Generation Manual, 10th Edition Institute of Transportation Engineers
0 50 100 150 2000
5
10
15
20
25
30
99
17
10

8/10/2018 https://itetripgen.org/PrintGraph.htm?code=817&ivlabel=ACRES&timeperiod=AWDVTE&x=2.46&edition=385&locationCode=General Ur…
https://itetripgen.org/PrintGraph.htm?code=817&ivlabel=ACRES&timeperiod=AWDVTE&x=2.46&edition=385&locationCode=General%20Urban/Subur… 1/1
Nursery (Garden Center)(817)
Vehicle Trip Ends vs: AcresOn a: Weekday
Setting/Location: General Urban/SuburbanNumber of Studies: 10
Avg. Num. of Acres: 3Directional Distribution: 50% entering, 50% exiting
Vehicle Trip Generation per AcreAverage Rate Range of Rates Standard Deviation
108.10 25.00 - 335.00 94.91
Data Plot and Equation
T =
Trip
End
s
X = Number of Acres
Study Site Average Rate
Fitted Curve Equation: Not Given R²= ****
Trip Generation Manual, 10th Edition Institute of Transportation Engineers
0 2 4 6 80
200
400
600
800
1,000
2
266
11
8/10/2018 https://itetripgen.org/PrintGraph.htm?code=817&ivlabel=ACRES&timeperiod=TASIDE&x=2.46&edition=385&locationCode=General Urba…
https://itetripgen.org/PrintGraph.htm?code=817&ivlabel=ACRES&timeperiod=TASIDE&x=2.46&edition=385&locationCode=General%20Urban/Suburb… 1/1
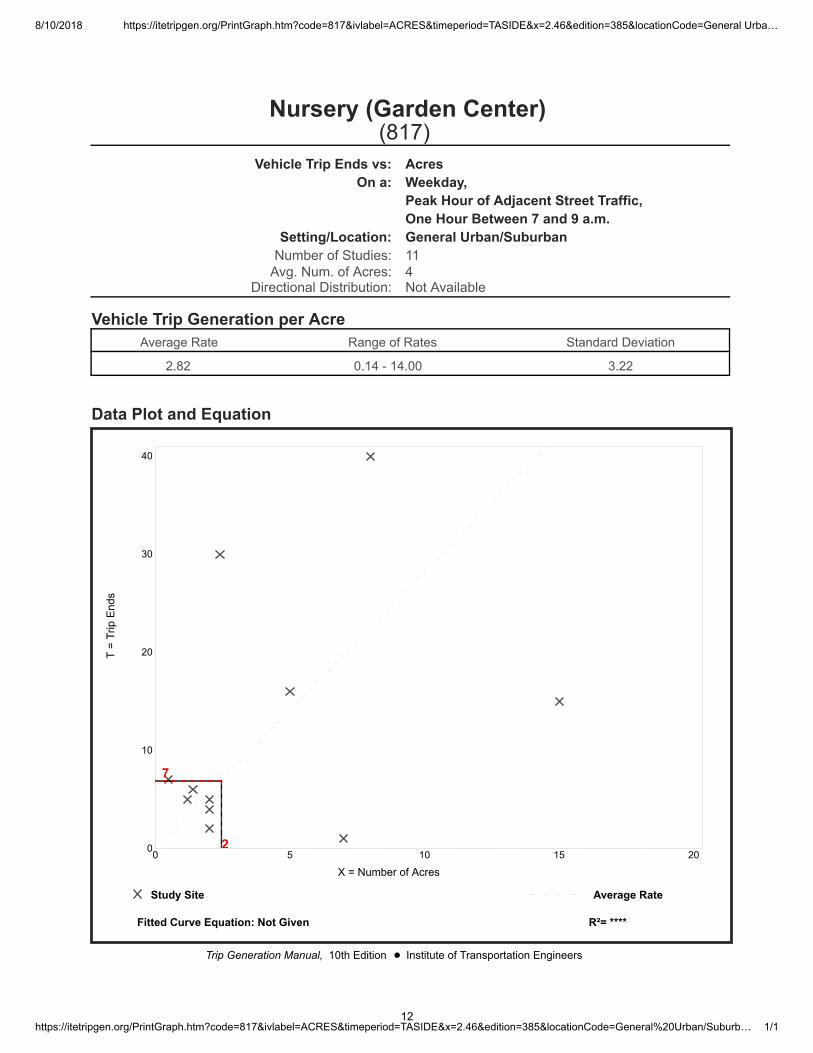
Nursery (Garden Center)(817)
Vehicle Trip Ends vs: AcresOn a: Weekday,
Peak Hour of Adjacent Street Traffic,One Hour Between 7 and 9 a.m.
Setting/Location: General Urban/SuburbanNumber of Studies: 11
Avg. Num. of Acres: 4Directional Distribution: Not Available
Vehicle Trip Generation per AcreAverage Rate Range of Rates Standard Deviation
2.82 0.14 - 14.00 3.22
Data Plot and Equation
T =
Trip
End
s
X = Number of Acres
Study Site Average Rate
Fitted Curve Equation: Not Given R²= ****
Trip Generation Manual, 10th Edition Institute of Transportation Engineers
0 5 10 15 200
10
20
30
40
2
7
12

8/10/2018 https://itetripgen.org/PrintGraph.htm?code=817&ivlabel=ACRES&timeperiod=TPSIDE&x=2.46&edition=385&locationCode=General Urba…
https://itetripgen.org/PrintGraph.htm?code=817&ivlabel=ACRES&timeperiod=TPSIDE&x=2.46&edition=385&locationCode=General%20Urban/Suburb… 1/1
Nursery (Garden Center)(817)
Vehicle Trip Ends vs: AcresOn a: Weekday,
Peak Hour of Adjacent Street Traffic,One Hour Between 4 and 6 p.m.
Setting/Location: General Urban/SuburbanNumber of Studies: 11
Avg. Num. of Acres: 4Directional Distribution: Not Available
Vehicle Trip Generation per AcreAverage Rate Range of Rates Standard Deviation
8.06 0.13 - 37.14 10.45
Data Plot and Equation
T =
Trip
End
s
X = Number of Acres
Study Site Average Rate
Fitted Curve Equation: Not Given R²= ****
Trip Generation Manual, 10th Edition Institute of Transportation Engineers
0 5 10 15 200
20
40
60
80
2
20
13