trends in young people’s religiosity and cohort religiosity trends marion burkimsher affiliated...
TRANSCRIPT

Trends in young people’s religiosityand cohort religiosity trends
Marion Burkimsher
Affiliated researcher, ISSRC
0
10
20
30
40
50
60
70
18-21 22-26 27-31 32-36 37-41 42-46 47-51 52-56 57-61 62-66 67-71 72-76 77-80
Age group
%
Women Men
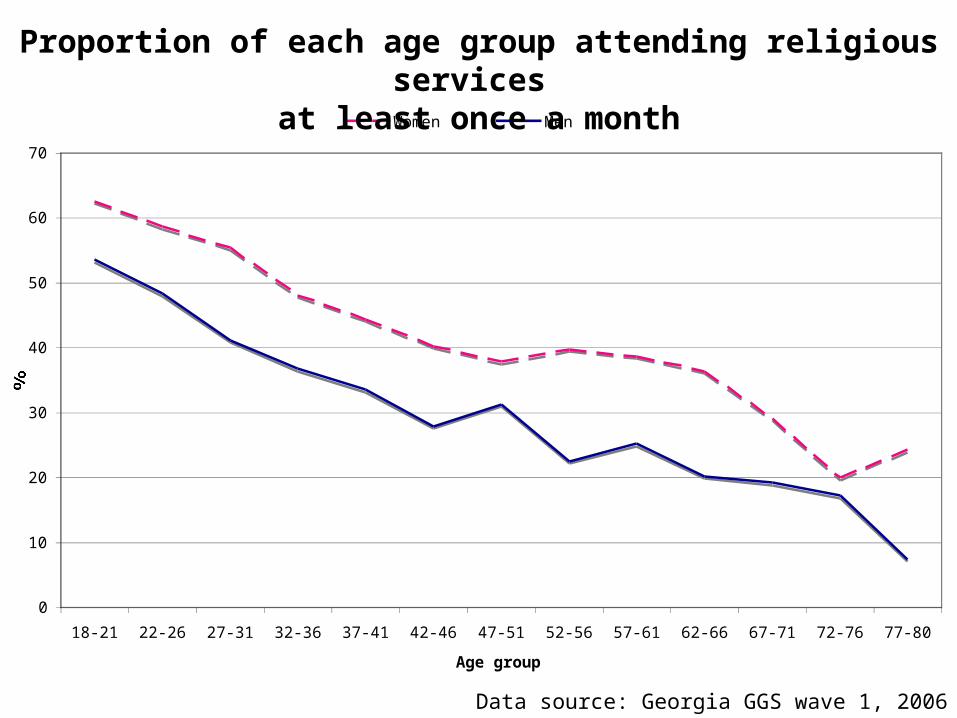
Proportion of each age group attending religious services at least once a month
Data source: Georgia GGS wave 1, 2006
Secularisation and revival seen in different ways
1. Introductory comments
2. Trends in young people’s religiosity
3. Cohort trends in religiosity
4. Change in individual religiosity over time
5. Proposed interpretation of the different trends

Secularisation and revival seen in different ways
1. Introductory comments
2. Trends in young people’s religiosity
3. Cohort trends in religiosity
4. Change in individual religiosity over time
5. Proposed interpretation of the different trends

Limitations of study
Looking mainly at Europe (as it has the best data!): 38 countries from Spain to Russia
Looking at religious attendance: the proportion of people who attend religious services at least once per month
• Note this is self-reported attendance
• Attendance at any religion is considered
Results mostly presented as graphs, generally with time on the x-axis

Are people in different countries becoming more secular, more religious or staying about the same?
Problem of the changing structure of the population:
older people die, children become adults
Lack of generational replacement is a common reason for
declining religious attendance (Voas)
We want to look at past trends but also see pointers to future
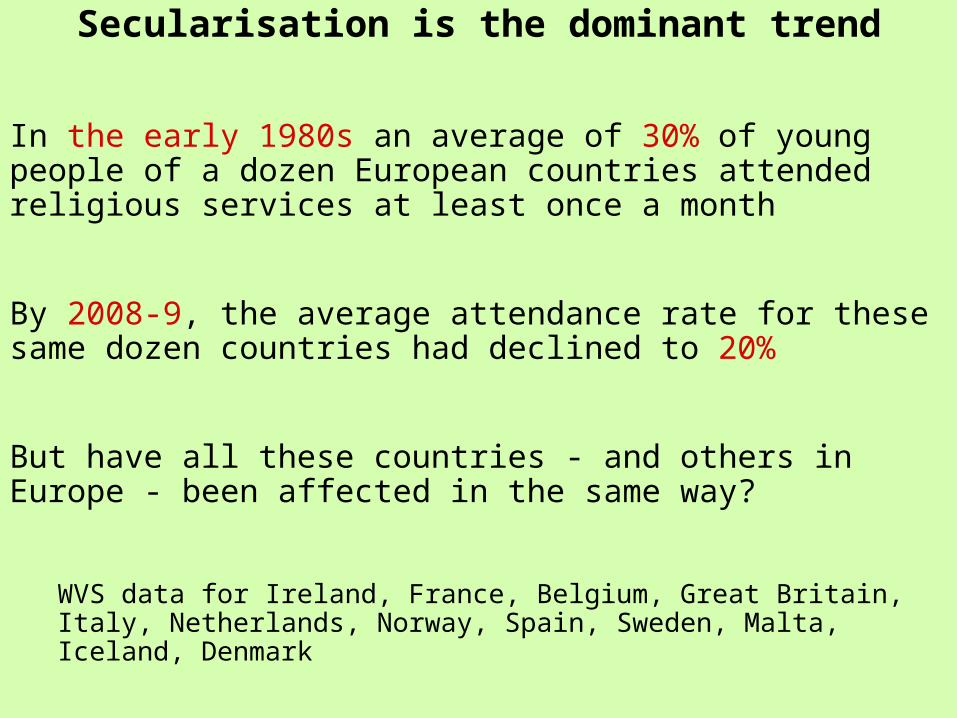
Secularisation is the dominant trend
In the early 1980s an average of 30% of young people of a dozen European countries attended religious services at least once a month
By 2008-9, the average attendance rate for these same dozen countries had declined to 20%
But have all these countries - and others in Europe - been affected in the same way?
WVS data for Ireland, France, Belgium, Great Britain, Italy, Netherlands, Norway, Spain, Sweden, Malta, Iceland, Denmark

Definitions
Level of religiosity is measured by a single variable: “How often do you attend religious services?”(Not belief or affiliation or a composite measure)
Attender is someone who says they attend a religious service at least once a month
Secularisation - if level of attendance is declining
Revival - if attendance rates are rising

Age, cohort, period variations
• An age effect is caused by a person’s age (and associated point in their life course). Population trends are caused because of the changing structure of the population (demographic ageing).
• Cohort effects are caused by the influences of living through similar experiences of everyone born in eg. the 1950s, 1970s…
• Period effects affect everyone in a country in a fairly similar manner.
We want to see if there are period trends independent of age and cohort trends
Voas and others have found that cohort differentials are the most important drivers of secularisation
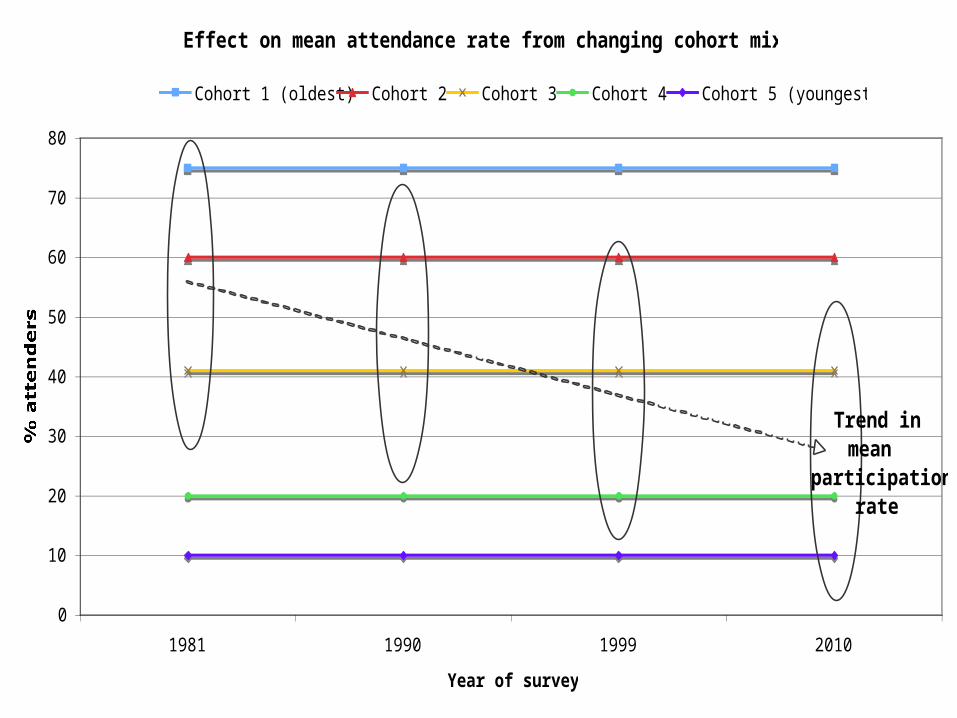
Effect on mean attendance rate from changing cohort mix
0
10
20
30
40
50
60
70
80
1981 1990 1999 2010
Year of survey
% attenders
Cohort 1 (oldest) Cohort 2 Cohort 3 Cohort 4 Cohort 5 (youngest)
Trend in mean
participation rate

Several solutions to determine current trends
How to filter out the age-cohort-period interactions?
Look only at ‘young’ people (<30): they react quickest to ‘fashions’
Look at the trends of different cohort bands over time,
and compare cohorts for post-war generations
Compare the religiosity of individuals at 2 (or more) points in life

Data sources World Values Survey, European Values Study,
European Social Survey
These are cross-sectional sample surveys, designed to be representative of the population (including age structure) of each country studied. Weights are assigned to individuals.
WVS 5 main waves (more to come)1981-2; 1990; (1995);1999-2001; 2005-8 Total sample sizes are generally over 1000, so 200-400 respondents in under-30 (young) category
EVS Has diverged from the WVS to be own entity with survey in 2008-9. Sample sizes mostly around 1500, so 200-400 under-30s
ESS 5 waves to date - 2002, 2004, 2006, 2008, 2010Total sample sizes around 2000, so under-30s number 300-500
What do you think?
Which countries are experiencing the most marked trends(within Europe)?
Of secularisation?
Religious revival?
Stability in attendance rates?

Secularisation and revival seen in different ways
1. Introductory comments
2. Trends in young people’s religiosity
3. Cohort trends in religiosity
4. Change in individual religiosity over time
5. Proposed interpretation of the different trends
Why study young people?
• They often react quickest to new fads and fashions
• They are the future of the church: attenders often stay as
attenders and vice versa
• Young people (18-29) are often at their lowest ebb of religious
participation (in most western countries)
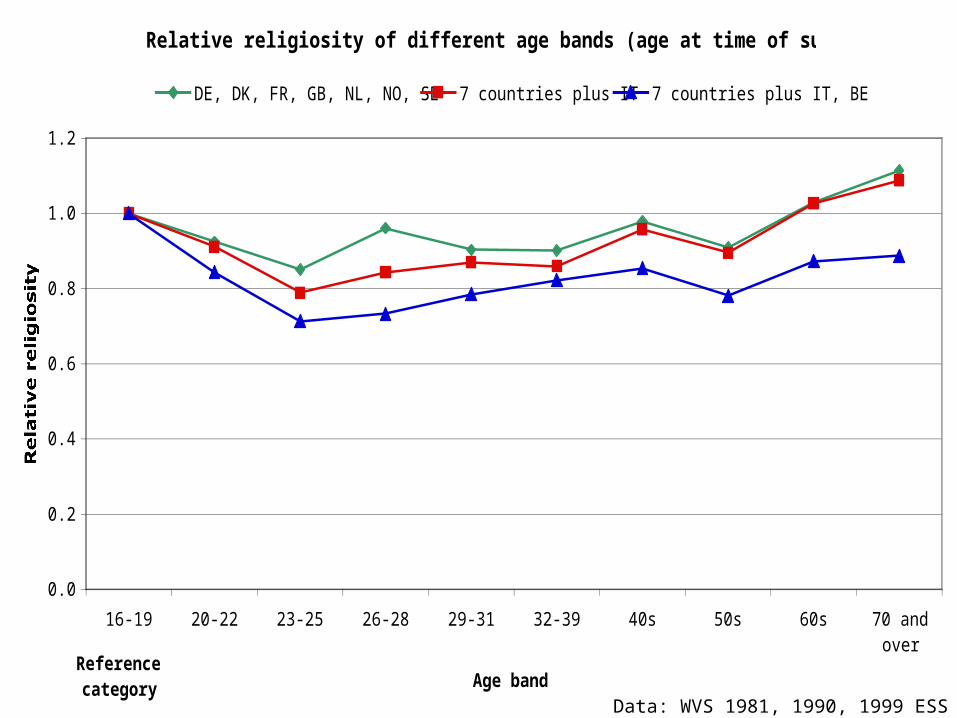
Relative religiosity of different age bands (age at time of survey)
0.0
0.2
0.4
0.6
0.8
1.0
1.2
16-19 20-22 23-25 26-28 29-31 32-39 40s 50s 60s 70 andover
Age band
Relative religiosity
DE, DK, FR, GB, NL, NO, SE 7 countries plus IT 7 countries plus IT, BE & ES
Reference category
Data: WVS 1981, 1990, 1999 ESS 2006
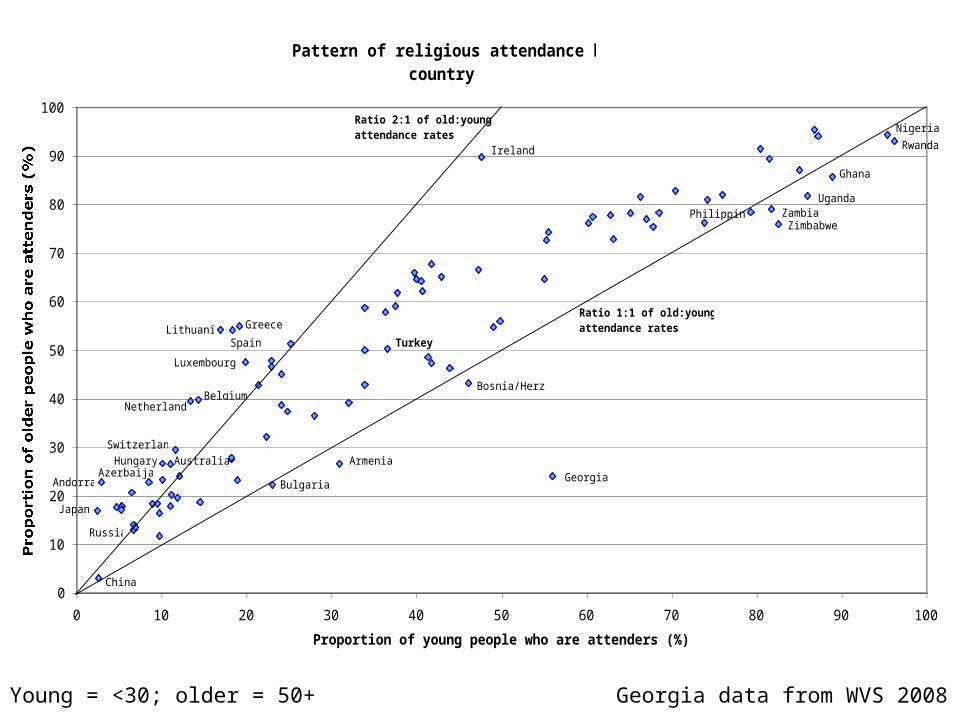
Georgia data from WVS 2008Young = <30; older = 50+
Pattern of religious attendance by country
0
10
20
30
40
50
60
70
80
90
100
0 10 20 30 40 50 60 70 80 90 100
Proportion of young people who are attenders (%)
Proportion of older people who are attenders (%)
Ratio 2:1 of old:young attendance rates
Ratio 1:1 of old:young attendance rates
Georgia
Armenia
Bulgaria
Bosnia/Herz
PhilippinesZimbabwe
Uganda
Nigeria
Ireland
Switzerland
Spain
Greece
Japan
China
Andorra
Lithuania
Luxembourg
Hungary
NetherlandsBelgium
Zambia
Ghana
Rwanda
AustraliaAzerbaijan
Russia
Turkey
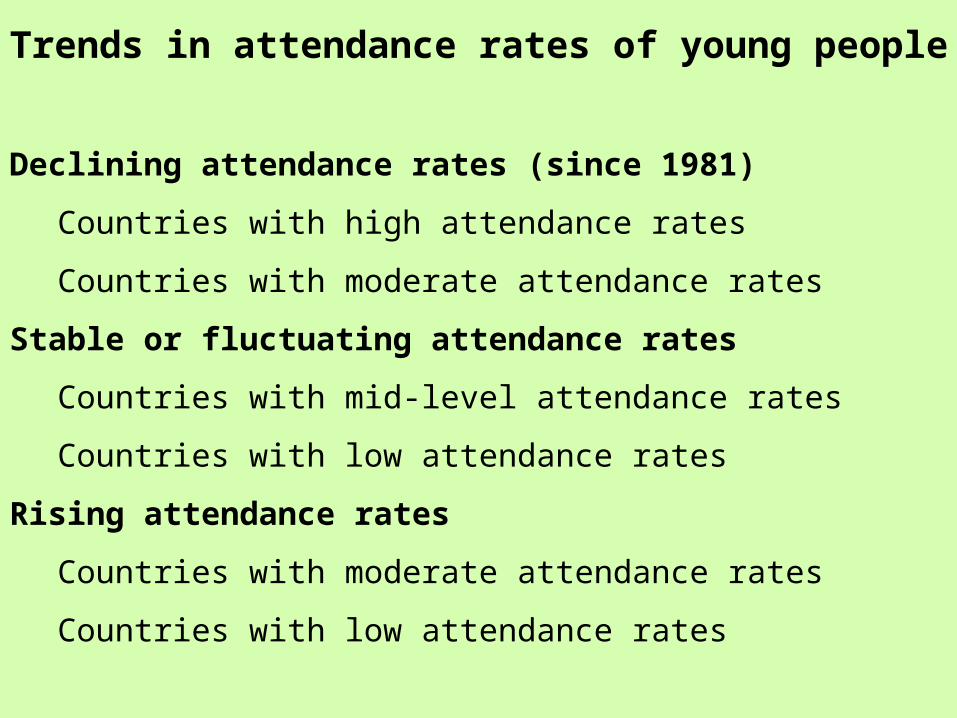
Trends in attendance rates of young people
Declining attendance rates (since 1981)
Countries with high attendance rates
Countries with moderate attendance rates
Stable or fluctuating attendance rates
Countries with mid-level attendance rates
Countries with low attendance rates
Rising attendance rates
Countries with moderate attendance rates
Countries with low attendance rates

Definition of growth or decline
2 criteria for defining growth/decline:
• If there was a difference of >5 % in attendance rates between the earliest and latest data point
AND
• There was a sustained trend upwards or downwards over the full time period of survey observations
Generally included only countries with 4 or more data points: Croatia, Albania, Macedonia, Cyprus and Israel had only 3 surveys so were not included and their trends were unclear. However, Bosnia-Herzegovina and Serbia were included as their trends were consistent.
Georgia with only 2 data surveys was included
Note: different vertical scales used
Data sources WVS, EVS, ESS
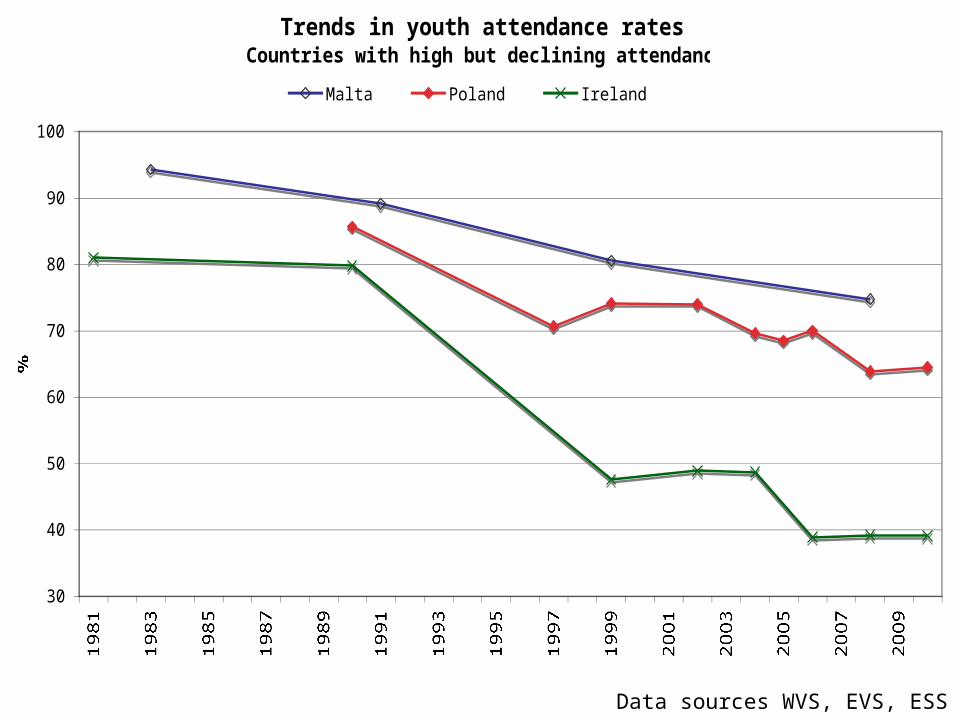
Trends in youth attendance ratesCountries with high but declining attendance
30
40
50
60
70
80
90
100
1981 1983 1985 1987 1989 1991 1993 1995 1997 1999 2001 2003 2005 2007 2009
%
Malta Poland Ireland

Data sources WVS, EVS, ESS
Trends in youth attendance ratesCountries with moderate and declining attendance
0
5
10
15
20
25
30
35
40
198119821983198419851986198719881989199019911992199319941995199619971998199920002001200220032004200520062007200820092010
%
Austria Slovenia Luxembourg Switzerland
Netherlands Spain Belgium Lithuania
Observations
Ireland has seen the biggest falls, especially during the 1990s
Many of these countries are predominantly Catholic
For the group with moderate attendance, they seem to be
converging towards a stable level of 8 - 16%
The Netherlands reached a minimum first and has seen modest
growth since 1999. Belgium has followed a similar trajectory, but
delayed by a few years

Data sources WVS, EVS, ESS
Trends in youth attendanceCountries with moderate attendance and no clear trends
0
5
10
15
20
25
30
35
40
45
50
1981 1983 1985 1987 1989 1991 1993 1995 1997 1999 2001 2003 2005 2007 2009
%
Turkey Slovakia Portugal Italy Ukraine Greece Bulgaria

Data sources WVS, EVS, ESS
Trends in youth attendanceCountries with low but stable attendance rates
0
5
10
15
20
1981 1983 1985 1987 1989 1991 1993 1995 1997 1999 2001 2003 2005 2007 2009
%
Germany Great Britain Hungary Finland Norway France
Sweden Czech Rep Latvia Estonia Iceland

Observations
Many of the low but stable group are Protestant countries
Some are in western Europe, especially Scandinavia, others in
eastern Europe
Many (12) countries are in the 5 - 16% band for youth attendance
rates
The United States would be at the upper end of this group

Data sources WVS, EVS, ESS
Trends in youth attendanceCountries with moderate and growing attendance rates
0
10
20
30
40
50
60
1981 1983 1985 1987 1989 1991 1993 1995 1997 1999 2001 2003 2005 2007 2009
%
Georgia Bosnia/Herz Romania Rep Moldova Serbia

Data sources WVS, EVS, ESS
Trends in youth attendanceCountries with low but increasing attendance rates
0
5
10
15
20
198119821983198419851986198719881989199019911992199319941995199619971998199920002001200220032004200520062007200820092010
%
Montenegro Russian Fed Belarus Denmark

Observations
Georgia has seen the largest increase in youth attendance rates
Denmark saw the lowest attendance rates (2.6% in 1990), but
modest growth has happened since then
All the other countries experiencing growth are in ex-communist
states, especially ex-Yugoslavia
China would be in the low but increasing group
Conclusions
• Some countries show clear indications of secularisation: these
are generally Catholic countries
• Some countries show clear indications of revival: these are
generally ex-communist countries
• There appears to be convergence towards attendance rates of
between 5 and 16%

Secularisation and revival seen in different ways
1. Introductory comments
2. Trends in young people’s religiosity
3. Cohort trends in religiosity
4. Change in individual religiosity over time
5. Proposed interpretation of the different trends

Why study cohorts?
• Cohort trends are usually stable: individuals may come and go,
but general attendance rates for a cohort tend remain similar over
the medium to long term
• If cohort attendance rates decline, this shows that secularisation
is particularly strong
• If cohort rates are rising, then revival is happening
• Differences between cohorts indicate the failure (or success) of
intergenerational transmission
• Cohorts have gone through the same external life experiences
together - war / peace…

Data sources: WVS and ESS
Cohort differentials in attendance rates, older cohorts
0
10
20
30
40
50
60
70
80
90
100
1930s 1940s 1950s
Cohort bands
Average attendance rates, %
Austria
Belgium
Denmark
Spain
Finland
France
Great Britain
Ireland
Italy
Netherlands
Norway
Portugal
Sweden
Switzerland
Bulgaria
Czech Rep
Estonia
Georgia
Hungary
Latvia
Poland
Romania
Russia
Slovakia
Slovenia

Observations
In (almost) all countries in both western and eastern Europe the cohorts born in the 1940s are less religious than those born in the 1930s AND those born in the 1950s are less religious than those born in the 1940s.
In Georgia, the attendance pattern is reversed, with each younger cohort being more religious than the next older one.
In Bulgaria, the 1940s cohorts are slightly more religious than the 1930s, but the 1950s cohorts are less religious.
It would seem that there was a sea change in the post-war generations compared those born before or during the 2nd World War.

Problem of age effects and ‘censoring’ in cohort studies
If we look at a a 10 year cohort band, eg people born in the 1960s, then at the 1981 WVS survey, they were aged 12-21. But surveys only include those over 16 or 18 - this varies between survey and between country. So for the example above, only the 16/18-21 year olds were surveyed.
As age effects may be quite important at the “young” and “old” ends of the spectrum, then the effects of censoring can be important when the time trend graphs include these extremities.
Data sources
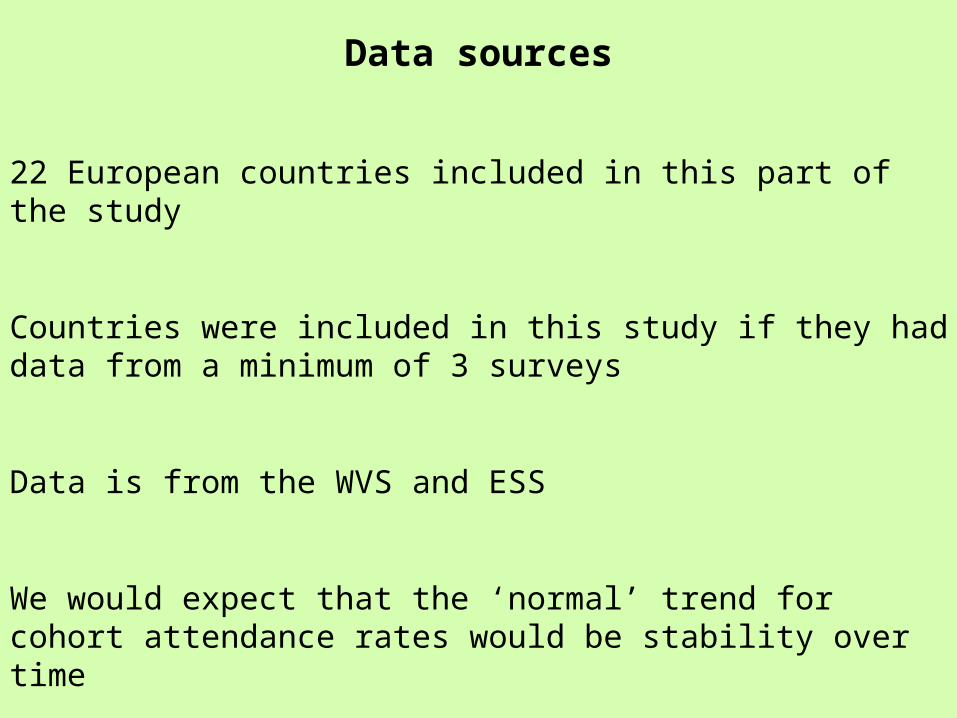
22 European countries included in this part of the study
Countries were included in this study if they had data from a minimum of 3 surveys
Data is from the WVS and ESS
We would expect that the ‘normal’ trend for cohort attendance rates would be stability over time

About the graphs
The cohorts born in the 1950s, 1960s and 1970s are plotted, ie these are all the post-war generation
The 1950s cohorts are plotted with solid lines
The 1960s cohorts are plotted with dashed lines
The 1970s cohorts are plotted with dotted lines
The confidence limits of most data points (in the 10-40% range) with typical sample sizes, are +/- 4%

Cohort trends, secularising countries
0
10
20
30
40
50
60
70
80
90
1980 1985 1990 1995 2000 2005 2010Year of survey
Attendance rates, %
Poland 1950s Poland 1960s Poland 1970sIreland 1950s Ireland 1960s Ireland 1970sSpain 1950s Spain 1960s Spain 1970sBelgium 1950s Belgium 1960s Belgium 1970sSwitzerland1950s Switzerland 1960s Switzerland 1970s
In 1981:
1950s cohort were 22-31
1960s cohort were 16-21
in 2010:1950s cohort were 51-601960s cohort were 41-501970s cohort were 31-40

Observations
Ireland shows greatest secularisation: affects all cohorts; biggest
differentials between cohorts
Modest falls across time period for Switzerland; small inter-cohort
differentials
These are predominantly Catholic countries

Cohort trends of other Catholic countries
0
10
20
30
40
50
60
1980 1985 1990 1995 2000 2005 2010Year of survey
Attendance rates, %
Portugal 1950s Portugal 1960s Portugal 1970sItaly 1950s Italy 1960s Italy 1970sAustria 1950s Austria 1960s Austria 1970s

Cohort trends, countries with no clear trends
0
5
10
15
20
25
1980 1985 1990 1995 2000 2005 2010Year of survey
Attendance rates, %
Norway 1950s Norway 1960s Norway 1970s Sweden 1950s Sweden 1960s Sweden 1970s
France1950s France 1960s France 1970s Estonia 1950s Estonia 1960s Estonia 1970s
Great Britain 1950s Great Britain 1960s Great Britain 1970s Finland 1950s Finland 1960s Finland 1970s
Hungary 1950s Hungary 1960s Hungary 1970s Bulgaria 1950s Bulgaria 1960s Bulgaria 1970s
In 1981:1950s cohort were 22-311960s cohort were 16-21
In 2010:1950s cohort were 51-601960s cohort were 41-501970s cohort were 31-40

Observations
Scandinavian countries have lowest attendance rates, but these
seem quite stable over time (Norway, Sweden, Estonia)
Great Britain, Bulgaria and Finland have slightly higher rates than
the other countries in this group
Estonia is the most secular country, but religious observance is
not (yet) extinct there
5-8% seems to be the minimum attendance rate to be sustained

Cohorts trends, countries experiencing revival
0
5
10
15
20
25
30
35
40
45
50
1980 1985 1990 1995 2000 2005 2010
Year of survey
Attendance rates, %
Romania 1950s Romania 1960s Romania 1970s Latvia 1950s Latvia 1960s Latvia 1970s
Russia 1950s Russia 1960s Russia 1970s Georgia 1950s Georgia 1960s Georgia 1970s
Denmark 1950s Denmark 1960s Denmark 1970s Czech Rep 1950s Czech Rep 1960s Czech Rep 1970s
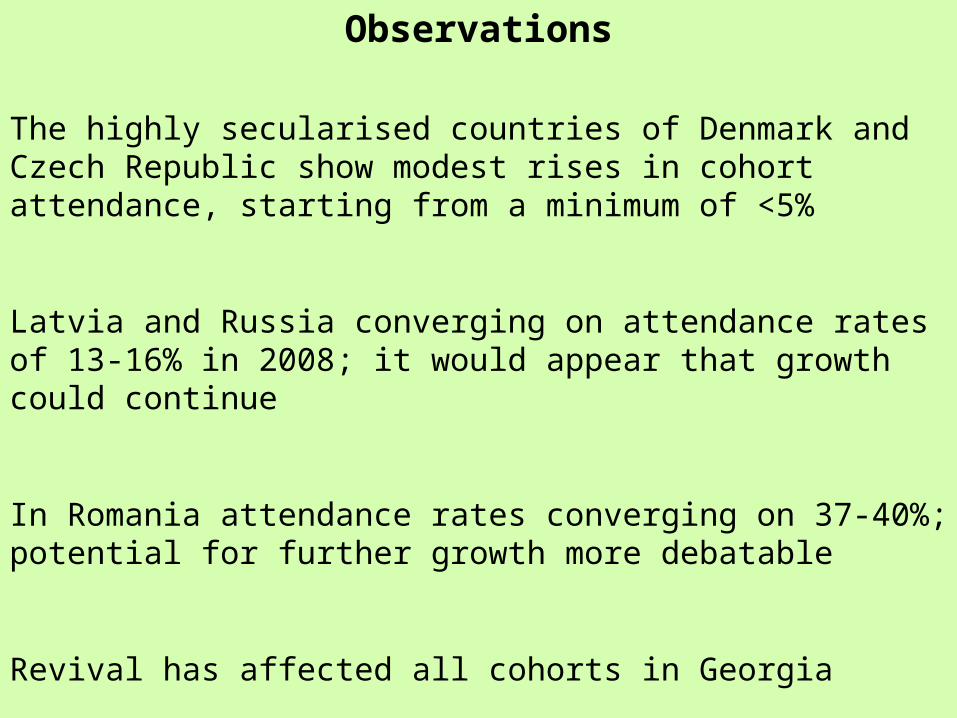
Observations
The highly secularised countries of Denmark and Czech Republic show modest rises in cohort attendance, starting from a minimum of <5%
Latvia and Russia converging on attendance rates of 13-16% in 2008; it would appear that growth could continue
In Romania attendance rates converging on 37-40%; potential for further growth more debatable
Revival has affected all cohorts in Georgia

Inter-cohort comparisons of post-war cohorts
These may or may not confirm the trends presented already
These are not time trends but a comparison of cohorts
The cohort values were average values from WVS and ESS
Differentials between cohorts do not define secularisation / revival
trends, especially if differentials are small

Cohort differentials of post-war cohorts, secularising countries
0
10
20
30
40
50
60
70
80
1950s 1960s 1970s 1980s
Cohort bands
Average attendance rates, %
Austria
Belgium
Spain
Ireland
Italy
Portugal
Switzerland
Poland
Netherlands

Countries with small cohort differentials
0
5
10
15
20
25
30
35
40
45
1950s 1960s 1970s 1980s
Cohort bands
Average attendance rates, %
Denmark
Finland
France
Great Britain
Norway
Sweden
Bulgaria
Czech Rep
Estonia
Hungary
Latvia
Russia
Slovakia
Slovenia

Cohort differentials of post-war cohorts, countries experiencing revival
0
10
20
30
40
50
60
70
1950s 1960s 1970s 1980s
Cohort bands
Average attendance rates, %
Georgia
Romania
Secularisation and revival seen in different ways
1. Introductory comments
2. Trends in young people’s religiosity
3. Cohort trends in religiosity
4. Change in individual religiosity over time
5. Proposed interpretation of the different trends

Why look at changing individual religiosity?
• Most people keep similar habits of religious attendance through their life - but some change, to either start or stop attending
• We can categorise people into 4 groups, comparing attendance at age 12 and attendance now (when EVS survey conducted in 2008) - look only at young people (<30)
1. Non-attender > non-attender (the biggest group in most countries)
2. Non-attender > attender
3. Attender > non-attender
4. Attender > attender
The relative balance of groups 2 and 3 may determine if revival or secularisation predominates

Problem with use of this indicator
It depends on the culture of religious training for children: this is common in Catholic countries (catechism) and also some Protestant countries
In ex-communist countries there was not usually a culture of early teenage religious socialisation
Countries ordered by difference in size of group 2 and group 3
Note: in most of the countries studied, the majority of 12-year-olds were not regularly attending religious services (in the period 1990-2002)
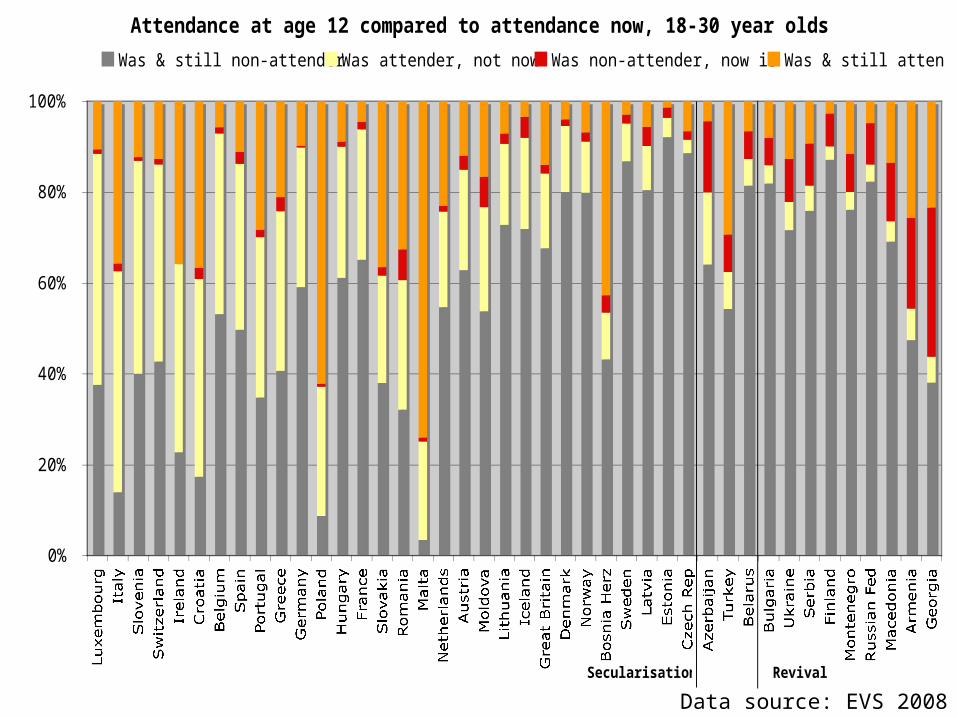
Data source: EVS 2008
Attendance at age 12 compared to attendance now, 18-30 year olds
0%
20%
40%
60%
80%
100%
Luxembourg
Italy
Slovenia
Switzerland
IrelandCroatiaBelgiumSpain
PortugalGreece
GermanyPoland
HungaryFrance
SlovakiaRomania
Malta
Netherlands
AustriaMoldovaLithuania
Iceland
Great Britain
DenmarkNorway
Bosnia Herz
SwedenLatvia
Estonia
Czech RepAzerbaijan
TurkeyBelarusBulgariaUkraineSerbiaFinland
MontenegroRussian FedMacedonia
ArmeniaGeorgia
Was & still non-attender Was attender, not now Was non-attender, now is Was & still attender
RevivalSecularisation
So which countries are displaying what trends?
Let’s compare all countries studied using all 4 indicators
They do not always give the same conclusion!

Trends in youth
attendance
Trends in cohort
attendance
Inter-cohort differentials
Child-adult attendance
Ireland Secularising Secularising Secularising Secularising
Poland Secularising Secularising Secularising Secularising
Malta Secularising Secularising
Luxembourg Secularising Secularising
Switzerland Secularising Secularising Secularising Secularising
Netherlands Secularising Secularising Secularising
Spain Secularising Secularising Secularising Secularising
Belgium Secularising Secularising Secularising Secularising
Austria Secularising Stable Secularising Secularising
Slovenia Secularising Stable Secularising
Lithuania Secularising Stable
Slovakia Stable Stable Secularising
Portugal Stable Stable Secularising Secularising
Italy Stable Stable Secularising Secularising
Greece Stable Secularising
Germany Stable Secularising
Great Britain Stable Stable Stable Secularising
Hungary Stable Stable Stable Secularising
Norway Stable Stable Stable Secularising
France Stable Stable Stable Secularising
Sweden Stable Stable Stable Secularising
Estonia Stable Stable Stable Secularising
Iceland Stable Secularising
Turkey Stable Stable
Czech Rep Stable Revival Stable Secularising
Latvia Stable Revival Stable Secularising
Denmark Revival Revival Stable Secularising
Moldova Revival Secularising
Bosnia/Herz Revival Secularising
Romania Revival Revival Revival Secularising
Ukraine Stable Revival
Bulgaria Stable Stable Stable Revival
Finland Stable Stable Stable Revival
Montenegro Revival Revival
Belarus Revival Stable
Russia Revival Revival Stable Revival
Serbia Revival Revival
Georgia Revival Revival Revival Revival
Summary of 4 indicators of secularisation / revival for 38 European countries

Looking at inter-cohort differentials gives the most ‘negative’ outlook (only 2 countries with ‘revival’)
Comparing attendance at age 12 with attendance rates of young adults also gives a negative impression for many countries, except for the case of some ex-communist states
Looking at youth attendance trends and cohort trends give a fairer impression of whether secularisation or revival may be happening - but do not always give the same conclusion
There are some interesting anomalies that would be worth investigating

Overall conclusions
In countries where young people are at least as religious as older people, then growth is commonly happening. This is most marked in Georgia, but it is also seen in Russia.
In countries where most secularisation is happening, then period effects are causing a decline in religiosity across many cohorts - AND there are large inter-cohort differentials. This is seen mainly in the predominantly Catholic countries (which often had higher attendance rates at the start of the period). However, not all Catholic countries are being affected as strongly.
In many countries there appears to be convergence to a certain level of religious observance; in the most secular countries this band is generally 6-16% of the younger cohorts. In other countries, there is convergence at a higher level.
The two major events that have affected religious observance were the Second World War and the fall of communism.

Secularisation and revival seen in different ways
1. Introductory comments
2. Trends in young people’s religiosity
3. Cohort trends in religiosity
4. Change in individual religiosity over time
5. Proposed interpretation of the different trends

Does modernisation lead to secularisation?
Measure of modernisation: Human Development Index
Composite measure combining:
1. health (life expectancy at birth)
2. wealth (GDP per capita at PPP)
3. education (school enrollment and adult literacy)
HDI has been increasing over time in almost all countries for which we also have religiosity survey data
For this part of the presentation, the attendance rates relate to the full population of each country, not just youth

Religiosity-Human Development Index
0
10
20
30
40
50
60
70
80
90
100
44 46 48 50 52 54 56 58 60 62 64 66 68 70 72 74 76 78 80 82 84 86 88 90 92 94 96HDI
% attenders
Nigeria
India
Philippines
Indonesia
Malta
Ireland
United States
Poland
Brazil
S Korea
Mexico
Italy
RomaniaTurkey
IranPortugal
Hungary Great Britain
Czech RepRussia
Latvia
BelarusChina
Viet Nam
Ukraine
Moldova
Bulgaria
Canada
Austria
Spain
Argentina
South AfricaPeru
Georgia-lowHDI Georgia-highHDI
Data source: WVS

Religiosity-Human Development Index
0
10
20
30
40
50
60
70
80
90
100
44 46 48 50 52 54 56 58 60 62 64 66 68 70 72 74 76 78 80 82 84 86 88 90 92 94 96HDI
% attenders
Nigeria
India
Philippines
Indonesia
Malta
Ireland
United States
Poland
Brazil
S Korea
Mexico
Italy
RomaniaTurkey
IranPortugal
Hungary Great Britain
Czech RepRussia
Latvia
BelarusChina
Viet Nam
Ukraine
Moldova
Bulgaria
Canada
Austria
Spain
Argentina
South AfricaPeru

• The area between the black dashed lines can be considered the The area between the black dashed lines can be considered the ‘natural level’ of religiosity of a population given its level of ‘natural level’ of religiosity of a population given its level of development. development.
This ‘This ‘normal bandnormal band’ is roughly the trendline +/- 10%’ is roughly the trendline +/- 10%
• These countries have been in the ‘These countries have been in the ‘normal bandnormal band’ at some point:’ at some point:
India, Turkey, Brazil, Iran, Romania, South Korea, Hungary, India, Turkey, Brazil, Iran, Romania, South Korea, Hungary, Slovenia, Great Britain, Belgium, Australia, Netherlands, Slovenia, Great Britain, Belgium, Australia, Netherlands, Switzerland, Spain, France, Finland, Norway, Japan, Sweden, Switzerland, Spain, France, Finland, Norway, Japan, Sweden, Denmark, Iceland (21 countries)Denmark, Iceland (21 countries)

Religiosity-Human Development Index
0
10
20
30
40
50
60
70
80
90
100
44 46 48 50 52 54 56 58 60 62 64 66 68 70 72 74 76 78 80 82 84 86 88 90 92 94 96HDI
% attenders
Nigeria
India
Philippines
Indonesia
Malta
Ireland
United States
Poland
Brazil
S Korea
Mexico
Italy
RomaniaTurkey
IranPortugal
Hungary Great Britain
Czech RepRussia
Latvia
BelarusChina
Viet Nam
Ukraine
Moldova
Bulgaria
Canada
Austria
Spain
Argentina
South AfricaPeru

• These countries have been above the ‘normal band’ and their
most recent trend is downwards:
• Philippines, Indonesia, Brazil, Peru, Argentina, Chile, Malta,
Poland, Iceland, Austria, Belgium, Netherlands, Spain, Canada,
United States, Australia (16 countries)
• However, these countries are above the “normal band” but have
not seen recent falls:
South Africa, Nigeria, Italy, Portugal
(4 countries)
Exceptions to prove the rule?

Religiosity-Human Development Index
0
10
20
30
40
50
60
70
80
90
100
44 46 48 50 52 54 56 58 60 62 64 66 68 70 72 74 76 78 80 82 84 86 88 90 92 94 96HDI
% attenders
Nigeria
India
Philippines
Indonesia
Malta
Ireland
United States
Poland
Brazil
S Korea
Mexico
Italy
RomaniaTurkey
IranPortugal
Hungary Great Britain
Czech RepRussia
Latvia
BelarusChina
Viet Nam
Ukraine
Moldova
Bulgaria
Canada
Austria
Spain
Argentina
South AfricaPeru

• These countries were initially below the ‘normal band’ but are
now closer to it or have moved within it (most have seen rises in
attendance rates):
• Georgia, Moldova, Viet Nam, China, Ukraine, Belarus, Russia,
Latvia, Czech Republic, Denmark, Iceland, Finland
(12 countries)
• Only Bulgaria is the exception to this pattern, having moved a
little further away from the ‘normal band

Religiosity-Human Development Index
0
10
20
30
40
50
60
70
80
90
100
44 46 48 50 52 54 56 58 60 62 64 66 68 70 72 74 76 78 80 82 84 86 88 90 92 94 96HDI
% attenders
Nigeria
India
Philippines
Indonesia
Malta
Ireland
United States
Poland
Brazil
S Korea
Mexico
Italy
RomaniaTurkey
IranPortugal
Hungary Great Britain
Czech RepRussia
Latvia
BelarusChina
Viet Nam
Ukraine
Moldova
Bulgaria
Canada
Austria
Spain
Argentina
South AfricaPeru

• Some countries have had a period of revival, which has then
been followed by renewed secularisation if that revival took them
above the ‘normal band’, eg. South Korea, Brazil, Mexico,
Romania

Religiosity-Human Development Index
0
10
20
30
40
50
60
70
80
90
100
44 46 48 50 52 54 56 58 60 62 64 66 68 70 72 74 76 78 80 82 84 86 88 90 92 94 96HDI
% attenders
Nigeria
India
Philippines
Indonesia
Malta
Ireland
United States
Poland
Brazil
S Korea
Mexico
Italy
RomaniaTurkey
IranPortugal
Hungary Great Britain
Czech RepRussia
Latvia
BelarusChina
Viet Nam
Ukraine
Moldova
Bulgaria
Canada
Austria
Spain
Argentina
South AfricaPeru
Georgia-lowHDI Georgia-highHDI
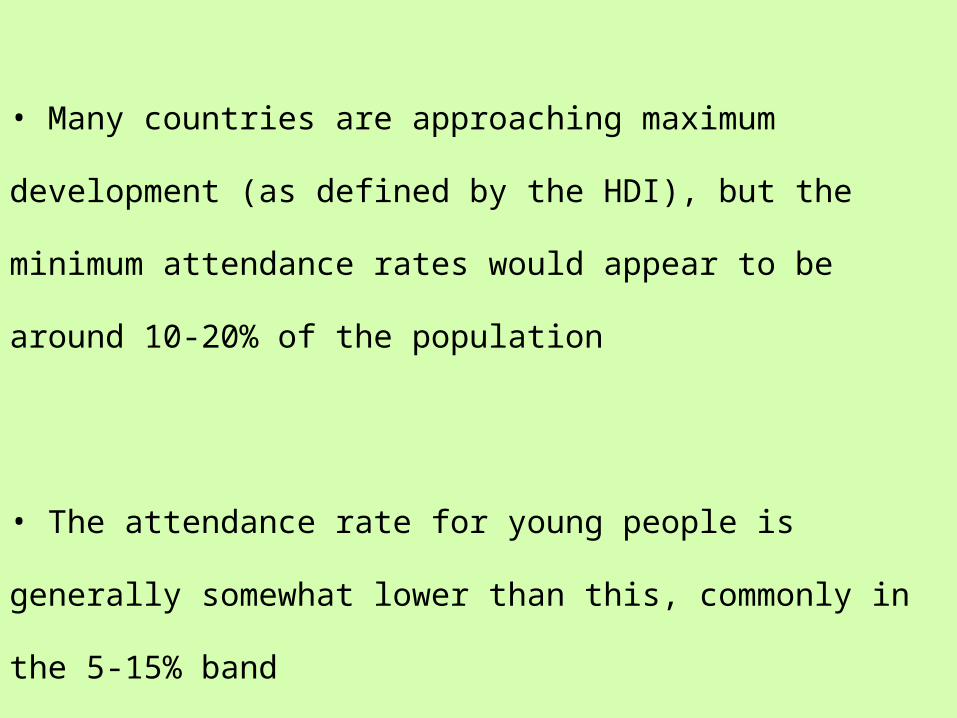
• Many countries are approaching maximum development (as
defined by the HDI), but the minimum attendance rates would
appear to be around 10-20% of the population
• The attendance rate for young people is generally somewhat
lower than this, commonly in the 5-15% band

What do you think?
Which countries are experiencing the most marked trends?
Of secularisation?
Religious revival?
Stability in attendance rates?
Any surprises?
This study only looked at attendance: might there be a better measure of religiosity?

Thank you!