trends in water market activity and price in the western ... in water market activity and price in...
TRANSCRIPT
Trends in water market activity and price
in the western United States
Thomas C. Brown1
Received 12 April 2005; revised 5 May 2006; accepted 7 June 2006; published 8 September 2006.
[ 1 ] Over 2000 water market transactions that occurred in the western United States from1990 to 2003 were examined to learn who sold to whom and for what purpose, howmuch water was involved, and how much it sold for. The transactions show that muchmore water changes hands via leases than via sales of water rights. Public agencies andirrigators are the most common lessors, with lessees being fairly evenly distributedacross types of buyers. However, with water rights sales, irrigators are by far the mostcommon sellers and municipalities the most common buyers. Across the West ingeneral, the number of leases has been rising in recent years, as have their prices. Theprices of water right sales have also been rising, but the number of sales has not. The priceof water is highly variable both within and between western states, reflecting thelocalized nature of the factors that affect water prices.
Citation: Brown, T. C. (2006), Trends in water market activity and price in the western United States, Water Resour. Res., 42,
W09402, doi:10.1029/2005WR004180.
1. Introduction
[ 2 ] Water in the western Unit ed States has becomesca r cer a s pop ulation, eco nomic g r owth, a nd c han gingvalues ha ve increased demand for water [Gil lilan a ndBrown, 1997]. Where institutions allowed it and tra nsactioncosts were not excessive, the growing scarcity often broughtwilling buyers and sellers together in what is called a wate rmarket. The term ‘‘water market’’ lacks a precise definition,bu t on c e a f ew v ol un t a r y t r ad es o f w at er of r e l at i ve l ycommon physical and legal characteristics occur, it is saidthat a water market exists.[ 3] When water trades in the western United States, either
a wate r right is sold or use of the right is essentially leasedfor a period of time. Ownership of a wate r right conveysaccess to a specified quantity of wate r in perpetuity, subjectto parti culars such as priori ty, timing, and location. With awater ‘‘le ase’’ as used herein, the holder of the right agree sto deliver, or allow the buyer access to, a certain quantity ofwater over a stated time period, subject to conditions suchas timing and location of access. One-time tra nsfers of wate r(essentially short-t erm leases) are someti mes called ‘‘spotmarket’’ trades or ‘‘rental’’ transactions. This paper reportson both sales and leases of water rights.[ 4] Water markets require a well-ad ministered system of
transferable or leaseable water rights. As is well known, thedoctrine of prior appropriation that underlies most waterlaws across the western United States allows for clearlydefin ed and tr ansfe rable wat er rig hts [ Hirsh leife r et al. ,19 60 ] , an d st a t e a ge nc i es or t h e co u r t s ad m i ni st e r a ndenforce those rig hts, although the states differ in how they
i mp le me nt the do ct r ine an d ad mi nis t er t he w at er r igh t ssystems [ National Research Council , 1992].[ 5 ] If water in a water short area were freely traded in an
efficient market, water would be reallocated via trades to thepoint where each user was consu ming at the point where themarginal value in all uses was identical (e.g., the marginalvalue i n i rrigation would equal t he marginal value inm un i c i pa l us e or i n i n - st r ea m r e cr e at i on ) . I n t hi s i de a lw or ld, a si ng le mar ke t pr ic e w ou ld eme rge tha t wou l dindicate the marginal value of raw water in that marketarea. However, in the real world, even in those locationswhere water markets exist , wate r rarely trades so easil y orcompletely. Two reasons for this are lack of a homog eneousprodu ct and lack of market competitiveness .[ 6 ] Lack of homog eneity is a natural consequence of how
the prior appropriation doctrine accommodates the stochasticnature of streamflow. The doctrine deals with shortage byassigning priorities to water rights and temporarily cancelingpermissi on to divert based on those priorities, beginn ingwith the most junior right and moving as far up the list ofpriori ties as needed to assure delivery to more senior rights.E ach ind ivi dua l r igh t ma y ha ve a uni qu e pr ior i ty dat e.Senior rights are worth more than junior rights becausesenior rights face less risk of shortage. If each right isuproduct is compromised. How ever,within the overall structure of prior appropriation thereexists a quite different approach known variously asproportional, fractional flow, or correlative rights [Eheartand Lyon, 1983]. With such rights, all users have equalpriority, and shortage is accommodated in a given timeperiod by lowering the allowable diversion for all users. Theuse of proportional rights is common in mutual ditchcompanies and water conservancy districts, wherein wateris owned as ‘‘shares’’ or ‘‘allotments’’ (referred to generallyas shares herein) of the total amount available [Hartmanand Seastone, 1970]. Such organizations manage nearly half
1Rocky Mountain Research Station, U.S. Forest Service, Fort Collins,Colorado, USA.
This paper is not subject to U.S. copyright.Published in 2006 by the American Geophysical Union.
W09402
WATER RESOURCES RESEARCH, VOL. 42, W09402, doi:10.1029/2005WR004180, 2006
1 of 14

of the irrigation water in the West [Thompson, 1993].Within these organizations all members essentially havethe same priority, and the effect of a flow increase ordecrease affecting the organization is distributed to themembers in proportion to the number of shares each owns,thus providing homogeneity of product. The most activewater markets deal in shares of such a company or district.[7] A fundamental tenet of neoclassical economic theory
is that competitive markets yield prices that reflect the truemarginal economic value of the good being traded. Com-petitive markets have many buyers and sellers, do notartificially restrict price or ability to trade, have low trans-action costs, allow an easy flow of information about pricesand potential trades, and internalize all relevant costs andbenefits of the transaction. Water markets typically fall shorton one or more of these requirements. Many markets areasare so small that sellers and buyers are few. In others, laws,regulations, or customs limit price. In many water marketstransaction costs are substantial, involving administrativeand legal requirements [Howe et al., 1990]. In manymarkets information is not readily available. Also, external-ities commonly exist, especially in the form of changes inwater quality and in-stream flow [Howe et al., 1986; Saliba,1987]. Some of these restrictions on the competitiveness ofthe market (e.g., a limited number of sellers) may elevate theprice relative to the price that would be established in apurely competitive market, whereas others tend to depressthe price (e.g., government subsidies, transaction costs,regulations or customs). Many of the restrictions, such astransaction costs, will also tend to limit the number of trades.[8] Despite these limitations, water markets offer useful
indications of the value of water, and have receivedconsiderable study. Studies of water markets have usuallyfocused in detail on one or a few specific markets [e.g.,Hartman and Seastone, 1970; Colby et al., 1993;Michelsen, 1994; Howe and Goemans, 2003]. Only with adetailed examination can the numerous characteristics of theindividual markets be given their due consideration. Thisstudy, to the contrary, takes a broad look across the westernUnited States, emphasizing geographical scope rather thanin-depth focus. This ‘‘big picture’’ approach offers a look athow prices in general have changed over the past few yearsand at how they differ across locations and across thepurposes for which the water was purchased.
2. Methods
[9] The broad-scale examination of water prices de-scribed here is made possible by the Water Strategist andits predecessor the Water Intelligence Monthly, published byStratecon, Inc., of Claremont, California, which have sum-marized many of the available western water market trans-actions in reports released on a monthly or quarterly basis.Fourteen years of transactions reported by these publica-tions (1990–2003) were tabulated to provide the estimatespresented herein of quantities of water traded and the priceat which it trades. Other studies using the Stratecon datainclude those of Brookshire et al. [2004], who examinedthree market areas over 12 years, Gollehon [1999] andHowitt and Hansen [2005], who summarized 2- and 4-yearsequences, respectively, and Loomis et al. [2003], whoexamined purchases for environmental purposes over5 years.
[10] It is important to note that the Stratecon Inc. pub-lications did not report on all transactions that occurred.Especially in the case of water leases, many trades were notsummarized. First of all, the entries generally do not includethe leases that occur within organizations such as mutualwater companies and conservancy districts (however, within-organization sales are often included). A great deal of wateris leased among share holders within organizations. Forexample, between 1993 and 1997 an average of 2153 leasetransactions occurred each year, involving an average of454,046 megaliters (ML) per year, within the WestlandsWater District in California [Carey et al., 2002] (1 ML =1 million liters = 1000 m3 = 0.81074 acre-feet). Similarly,the city of Fort Collins, Colorado, owns shares in severalditch companies as well as shares of a conservancy district;during the period 1990–2003 the city ‘‘rented’’ an averageof 23,519 ML per year of that water, mostly to other shareholders of the respective organizations. Within-organizationleases, sometimes called ‘‘institutional market’’ leases[Thompson, 1993], are largely among irrigators, and therules for transfer are often specified by the organization.Although doing much to improve the efficiency of water use,such leases are so common and numerous that they were notconsidered of primary interest by Stratecon Inc.[11] Aside from within-organization leases, the publica-
tions missed some transactions. For example, most of thelease transactions along the Rio Grande in Texas reportedby Yoskowitz [2002], and many of the non-CBT sales alongthe Colorado Front Range reported by Howe and Goemans[2003], were not listed. Neither are the included transactionsa random sample. Nevertheless, the Stratecon publicationscontain the most comprehensive set of information availableabout water market trades in the western United States,information sufficient to roughly characterize the nature andextent of western water trades. It must be stressed, however,that the analysis described herein characterizes the Stratecondata, and thus largely fails to reflect within-organizationleases and may fail to accurately represent the full popula-tion of other trades.[12] Each water transaction entry in the Water Strategist
or Water Intelligence Monthly briefly summarizes one ormore actual trades. The entries typically include buyer,seller, purpose for which the water was purchased, type oftransaction (whether sale or lease of a water right), and thesource of the water (raw surface water, raw groundwater,effluent, or potable water).[13] Buyers and sellers are categorized herein as one
of the following: (1) municipality, (2) irrigator (farmeror rancher), (3) environmental protection entity (e.g.,public trust concern, private entity such as the NatureConservancy), (4) nonmunicipal water management organi-zation (labeled ‘‘WMO’’), including federal or stategovernment agencies, conservancy districts, and waterdistricts, associations and companies, (5) other entity (e.g.,power company, mining company, developer, investor,country club, feedlot, individual homeowner), or (6) severalentities (several buyers or sellers of different types, such thatthe transaction could not be neatly assigned to one of theother categories). Transactions involving water banks are aspecial case; when the original seller and eventual buyerwere reported they were tabulated as such, but when onlya water bank was reported as the buyer or seller the bankwas tabulated as a WMO.
2 of 14
W09402 BROWN: WESTERN U.S. WATER MARKET TRENDS W09402
[14] The purpose for which the water was purchased wascharacterized herein as one of the following: (1) municipalor domestic (including commercial and industrial if servicedby a municipality, and including golf courses and otherlandscape irrigation), (2) agricultural irrigation, (3) environ-mental (e.g., in-stream flow augmentation), (4) other(including thermoelectric cooling, recreation, mining, aquiferrecharge, augmentation of flows leaving the state per courtorder, supply to an individual business such as a feedlot ormanufacturing plant, an investment of undefined character-istics, and unspecified uses), or (5) several (several purposes,such that the transaction could not be neatly assigned to oneof the other categories).[15] Some entries covered several related transactions.
For example, several sellers or several buyers, or both, mayhave been included in the entry. Or several transactionswithin the same market may have been listed together inthe same entry. Such entries were broken down intoseparate transactions for analysis if distinct prices werelisted and different categories of buyers, sellers, or pur-poses were involved. After this disaggregation process, atotal of 2450 transactions were available for the 1990–2003 period.[16] The Colorado–Big Thompson (CBT) market is the
most active market for water rights in the West, with up to30 or more sales per quarter to municipalities alone (seeHartman and Seastone [1970], Howe et al. [1986], andMichelsen [1994] for descriptions of the market for CBTshares). It is also a market about which market informationis readily available. The entries listed 949 CBT trades overthe 14 years. Because the sale price for CBT shares differedlittle among trades completed during a given month, andbecause the volumes traded were typically small (averaging49 ML), all CBT transactions of a single purpose within agiven month were tabulated as one case for analysis in orderto avoid having CBT transactions overwhelm the summarystatistics. This aggregation process left a total of 228 CBTcases for the 14-year period, and thus a total of 1729 cases(2450–721) for analysis.[17] Of these 1729 cases, 349 were omitted from further
analysis because key information was missing (such as priceor amount of water transferred), something other than rawwater (i.e., effluent or treated water) was involved, the priceincluded payment for things other than water and itsmanagement (e.g., land), or the transaction was not a market
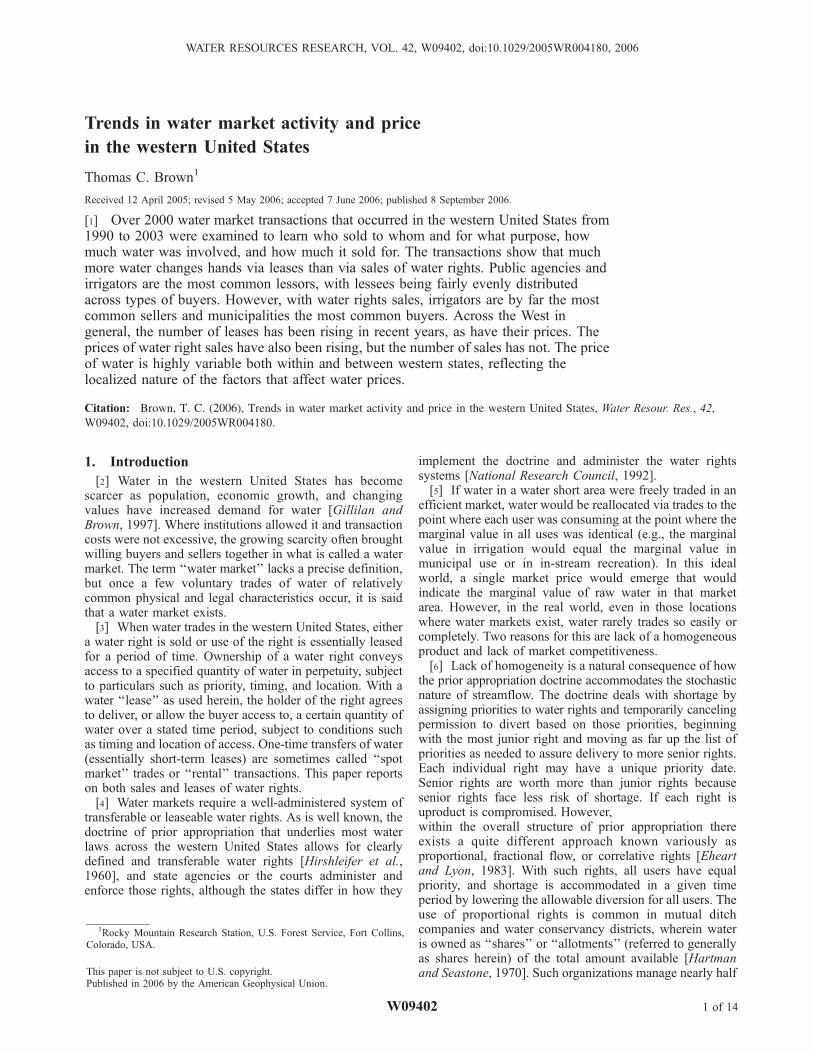
sale (e.g., it was an exchange or a donation). Thus 1380qualifying cases (1729–349) were left for analysis. Figure 1shows the total water volume by year of the qualifying casesand the full set of cases.[18] Prices, reported by Stratecon Inc. on a per acre-foot
basis, were converted to a per megaliter basis as required bythe journal. Prices were adjusted to year 2003 dollars usingthe consumer price index. Lease prices are listed per year;sale prices are listed in total. Although mean prices aresometimes presented, this analysis emphasizes median pri-ces, which more accurately indicate the price of a typicalwater trade when the price distributions are skewed.[19] Prices paid for untreated water often include consid-
eration for water management, including such services asstorage and conveyance, in addition to the cost of raw waterin the stream. The full value of water management may ormay not be captured in annual assessment or conveyancecharges. (Such charges were listed for 18% of the leasecases and 59% of the sale cases; the median charge whenlisted was $13 per ML.) These charges were not included inthe tabulated prices because the focus here is on the value ofwater per se; however, we cannot be sure that the value ofmanagement is not still to some extent reflected in thetabulated prices.
3. Results
[20] All results presented herein are based on the 1380cases meeting the criteria for further analysis explainedabove. Figure 2 shows the number of cases by a convenientgeographic breakdown, climatic division (www.cdc.noaa.gov). Fourteen states have qualifying cases (all states inFigure 2 except North Dakota, South Dakota, andNebraska). Three climatic divisions within these states haveover 75 cases: division 4 in northeast Colorado, includingDenver, Fort Collins, and other cities along the northernFront Range; division 5 in California, capturing the southern(San Joaquin River) portion of the Central Valley and ondown to the Bakersfield area; and division 10 at the southerntip of Texas, along the Rio Grande as it enters the Gulf nearBrownsville. Nine climatic divisions have between 26 and75 cases: three in California, two in Texas, and one eachin Arizona, Colorado, Idaho, and Nevada. Thirteen cli-matic divisions have between 11 and 25 cases, and 43have from 1 to 10 cases. Another 45 climatic divisions inthe 14 states have no cases.
Figure 1. Trend in total volume of water transferred (1 ML = 0.81 acre-feet).
W09402 BROWN: WESTERN U.S. WATER MARKET TRENDS
3 of 14
W09402

3.1. Market Activity
[21] The 1380 cases involve a total of roughly 29 millionML (Table 1), or about 2.1 million ML per year on average.Ten percent (141) of the cases involve groundwater, withthe remainder (1239) being of surface water. However, only4% of the water transferred in these trades is groundwater,as indicated by the average water volumes per case, of8238 ML for groundwater and 22,687 ML for surface water.[22] The 14 states of Table 1 vary greatly in number
cases. Three states (California, Colorado, and Texas) haveover 200 cases each and together account for two thirds ofthe full set of cases, whereas seven states have fewer than50 cases each and together account for only 12% of thecases. As seen in Figure 2, there is also great variation innumber of cases across regions with a state. The mostimportant factors affecting variation in frequency of tradesamong the western states and their climatic divisions areprobably water scarcity in response to expanding demand,institutional and legal differences, and the existence (orabsence) of water management organizations and associatedinfrastructure.
[23] Given the relative ease with which leases can bearranged, one would expect the incidence of leases toexceed the incidence of sales. This is indeed the case in10 of the 14 states (Table 1, occurrence ratio column). Thebiggest exceptions are Colorado and Nevada, where saleswere much more common than leases (although we mustremember that within-organization leases are not includedhere). The prevalence of sales in these states reflects therelative ease with which sales can be consummated, espe-cially for transmountain diversion water in Colorado thatavoids return flow concerns on transfer, and the strongdemand for secure water supplies by the fast growing citiesalong the Colorado Front Range and in Nevada’s Las Vegasand Reno. In California, Washington, and Wyoming, and toa lesser extent Idaho, Oregon, and Texas, leases predomi-nate. The reasons for the varying prevalence of leasesundoubtedly are different across these states, but theyprobably have much to do with legal impediments to salesand the extent to which administrative requirements raisetransaction costs. A full explanation of the reasons for thevarying ratios of leases to sales across the states is beyond
Figure 2. Number of cases meeting criteria for analysis of market prices, 1990–2003, by climaticdivision (divisions are numbered independently within each state).
4 of 14
W09402 BROWN: WESTERN U.S. WATER MARKET TRENDS W09402

the scope of this study and is an important avenue forfurther research.[24] Over half (739) of the purchases were for municipal
purposes, another 23% (322) were for agricultural irrigation,and 11% (150) were for environmental purposes (notcounting where these purposes were included in the‘‘several’’ category) (Table 2). The abundance of purchasesfor municipal purposes reflects the urban and suburbanpopulation growth in the western United States. Municipalwater tended to be purchased as rights, whereas water forother uses, and especially for environmental purposes,tended to transfer as leases. All users probably value thesecurity that owning water rights provides; municipal andindustrial users are more likely than most other users to alsohave the ability to pay for water rights.3.1.1. Amount of Water Traded[25] Although the number of lease cases is only slightly
larger than the number of sale cases (718 versus 662), 95%of the water transferred as leases, and this does not includethe within-organization leases mentioned above. The medianlease size is 7308 ML per case, compared with 136 ML forwater right sales (the means are 38,763 and 2170 ML,respectively). Eighty-one percent of sales and 23% of leasesinvolve fewer than 1000 ML, whereas 4% of sales and 47%of leases involve more than 10,000 ML. The largest leasestend to involve water associated with government-fundedprojects. For example, of the 37 cases (all leases) involvingmore than 150,000 ML, 14 involve Central Arizona Projectwater, five involve State Water Project (California) water,and seven involve Snake River (Idaho) water. The most
important reasons for the large difference in volume trans-ferred per case are that leases, because they are temporary,cost much less per unit of volume and are easier to arrangethan purchases of rights. Leases are less expensive becauseof the obvious fact that they are usually for only one year,but also because they provide no security beyond the datesof the lease arrangement. Leases are easier to arrangebecause they face fewer outright prohibitions, incur lowertransaction costs, and encounter fewer environmental regu-lations than do sales.3.1.2. Who Sold to Whom?[26] Water leases are common vehicles for most categories
of buyers and sellers (Table 3). The most active categoriesof lessors were WMOs (water management organizations)and irrigators. The most common lessors among the WMOswere public agencies including the State Water Project andCentral Valley Project in California, agencies managingCentral Arizona Project water, and the U.S. Bureau ofReclamation in many states. Municipalities, irrigators, andWMOs are all common lessees.[27] Sales of water rights were less dispersed across user
class than leases (Table 4), with municipalities being themost common buyers (accounting for 37% of the pur-chases, not including their participation in the ‘‘several’’category) and irrigators being the most common sellers(55% of all sales, not counting their participation in the‘‘several’’ category). The only other large category ofsellers, ‘‘other’’ (with 25% of the sales), includes mostimportantly developers, brokers, investors, individual land-owners, and banks.
Table 2. Western Water Market Activity by Purpose of Purchase, 1990–2003
Purpose
Leases Sales
Occurrence Ratio(Leases/Sales)
Numberof Cases
Total Volume,103 ML
MedianVolume, ML
Numberof Cases
Total Volume,103 ML
MedianVolume, ML
Municipal uses 286 6447 6167 453 938 204 0.63Irrigation 199 5984 7578 123 107 52 1.62Environment 113 4785 20691 37 234 416 3.05Other 69 1349 2249 36 56 99 1.92Several 51 9267 17811 13 101 48 3.92All 718 27832 7308 662 1437 136 1.08
Table 1. Western Water Market Activity by State, 1990–2003a
State
Leases Sales
Occurrence Ratio(Leases/Sales)
Numberof Cases
Total Volume,103 ML
MedianVolume, ML
Numberof Cases
Total Volume,103 ML
MedianVolume, ML
Arizona 48 9581 24669 38 175 595 1.26California 250 9638 18033 44 358 2362 5.68Colorado 58 433 2261 369 111 73 0.16Idaho 49 3418 21812 15 38 197 3.27Kansas 11 11 322 5 3 493 2.20Montana 5 19 4458 0 0 – –New Mexico 29 623 15442 30 24 125 0.97Nevada 4 1516 17607 65 85 281 0.06Oklahoma 2 1 463 1 99 98676 2.00Oregon 34 263 2823 9 58 520 3.78Texas 159 1366 3676 48 331 1019 3.31Utah 11 111 11964 32 40 205 0.34Washington 21 593 1744 4 102 2186 5.25Wyoming 37 258 705 2 12 6202 18.50All 718 27832 7308 662 1437 136 1.08
aNote 1 ML = 0.81 acre-feet.
W09402 BROWN: WESTERN U.S. WATER MARKET TRENDS
5 of 14
W09402
[28] The most common water right sale is from farmer(or rancher) to municipality. The principal reason thatfarmers more commonly sell water rights is probably thatthey claimed most of the early water rights, and thuscontrol much of the water in the West. Sales by farmersto municipal uses are common for several reasons. First, itis often irrigated farmland that is converted to municipaluse, and farmers usually sell their water along with theirland. Second, farmers are susceptible to crop price fluctua-tions and occasionally find themselves in tenuous economiccircumstances and in need of cash, and cities, which value thesecurity of owning water rights, are ready buyers. Also,farmers can, except in exceptionally dry years, often leaseback the water they sold to cities.[29] Knowing the type of buyer does not necessarily
indicate the purpose for which the water was purchased,especially when the buyer was a WMO. Most importantly,Tables 3 and 4 underplay the importance of irrigators are asa source of water for municipal use. Looking at the purposefor which the water was purchased, we find that 63 of theleases from irrigators were for municipal uses althoughonly 36 of the leases were from irrigators to municipalities(Table 3), and that 229 of the purchases of rights fromirrigators were for municipal uses although only 141 ofthe sales were directly from irrigators to municipalities(Table 4). Also note that there were 312 leases from WMOs(Table 3) and much of that leased water previously had beenused by irrigators. The importance of irrigation as a sourceof water for trade is suggested by the fact that in 1995 over3=4 of the total water withdrawals in the 14 states at issuewere for irrigation [Solley et al., 1998].3.1.3. Is Market Activity Increasing?[30] Young [1986, p. 1143] wrote, ‘‘Economists have
been warning for years that increasing scarcity and costsof unappropriated water supplies together with limitedpublic budgets and the environmental costs of new projects
would shift attention to nonstructural approaches, particu-larly to the market mechanism, to meet emerging needs.Change, however, appears to be slow.’’ During the inter-vening 20 years the constraints on new water projects(scarcity of good sites, environmental concerns, lack ofpublic funds) have remained, and the population of the 14western states of interest here has continued to increase(e.g., by 20% from 1990 to 2000), so the incentives forwater market activity have only intensified. Has this led tomore market activity?[31] Combining across all states and water uses (Figure 3),
the number of leases per year has increased significantlyover the past 14 years (the Mann-Kendall test for timetrends yields a test statistic, k, of 3.23, substantially above the1.96 cutoff for the 0.95 probability level), whereas thenumbers of sales of rights show no trend (k = �0.44).Looking separately at the major water uses, among leases(Figure 4), the number of purchases for environmentalpurposes increased significantly (k = 3.23), but the increasesformunicipal and irrigation purposeswere not significant (k=1.81 and 1.42, respectively). Finally, among sales (Figure 5)the number of purchases for environmental purposesincreased significantly (k = 2.35), but the increase formunicipal uses is not significant (k = 0.99) and the numberpurchases for irrigation declined significantly (k = �2.79).[32] Note the spikes in purchases for municipal use in
1991 and 1999 (Figures 4 and 5). The 1991 increase inleases for municipal uses occurred mainly in California,spurred by a 5-year drought and the beginning of operationof the California Water Bank [Loomis, 1992]. The 1999increase in leases occurred largely in California, Kansas,and Texas, and the increase in sales occurred mostly inNevada and Utah. The reasons for these increases are notclear; 1999 was not an exceptionally dry year in thoselocations. A more thorough investigation of these spikesthan was attempted in this study would examine weather
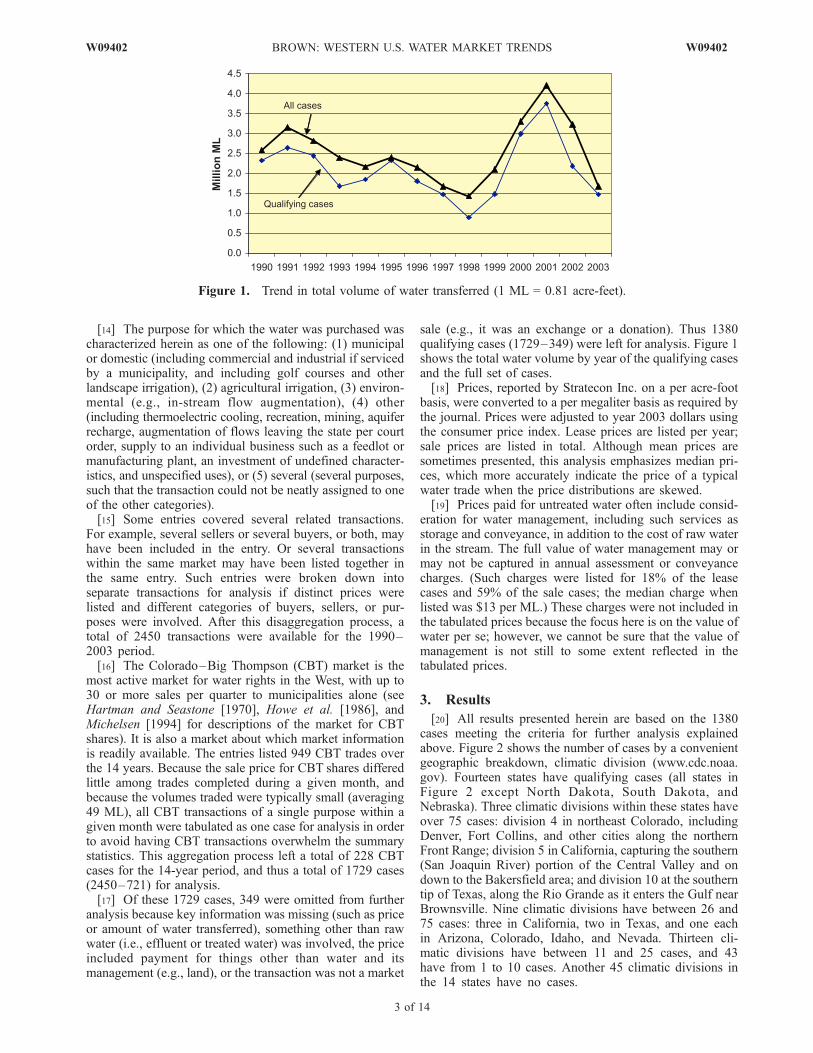
Table 3. Number of Western Water Leases From Seller to Buyer, 1990–2003
Seller
Buyer
TotalMunicipality IrrigatorEnvironmentalOrganization WMO Other Several
Municipality 21 7 0 23 3 4 58Irrigator 36 22 2 95 12 4 171Environmental organization 0 0 0 1 0 0 1WMO 43 64 1 126 23 55 312Other 4 1 0 6 14 0 25Several 25 20 0 27 20 59 151Total 129 114 3 278 72 122 718
Table 4. Number of Western Water Right Sales From Seller to Buyer, 1990–2003
Seller
Buyer
TotalMunicipality IrrigatorEnvironmentalOrganization WMO Other Several
Municipality 5 1 0 2 3 0 11Irrigator 141 75 8 62 27 52 365Environmental organization 1 0 1 0 0 0 2WMO 17 3 1 24 5 4 54Other 54 10 1 39 53 2 159Several 28 1 0 13 1 28 71Total 246 90 11 140 89 86 662
6 of 14
W09402 BROWN: WESTERN U.S. WATER MARKET TRENDS W09402

and reservoir storage levels in water source areas that maybe far from the use locations. For example, the lower RioGrande in Texas receives its water largely from upstreamstates and Mexico, and southern California diverts a sub-stantial amount of water from the Colorado River.[33] Assuming that Stratecon Inc. did not change its
methods from 1990 to 2003, we conclude that the numberof leases has indeed increased, roughly doubling over the14-year period (Figure 3), but that the number of sales hasnot increased. Four sets of reasons for a lack of watermarket activity are commonly cited [see, e.g., Young, 1986;Getches, 1987; Thompson, 1993]. First, the local/regionalnature of rivers and groundwater aquifers, along with thecosts of storing and transporting water, often limit the sizeof the market, sometimes to few buyers and sellers. Second,moving water from one location to another incurs opposi-tion because of impacts on downstream junior right holders,in-stream flow concerns [Gillilan and Brown, 1997], andthird-party financial impacts [Howe and Goemans, 2003;Hanak, 2005]. Third, even in the absence of opposition,transaction costs can be substantial for some kinds of trades[Howe et al., 1990]. Fourth, many larger water projectswere publicly financed, and with that financing often cameconstraints on water transfers [Wahl, 1989]. The first ofthese reasons applies equally to leases and sales, but theother three reasons are all more salient when moving wateracross space has long-term, as opposed to only short-term,
consequences, and probably go a long way toward explain-ing the lack of growth in numbers of sales.
3.2. Price of Water
[34] The Stratecon Inc. data allow consideration ofseveral interesting questions regarding water market prices.Following a general description of variation in price acrossstates and water uses, this section compares aggregate leaseand sale prices, examines aggregate price trends, tests forthe influence of several factors on individual transactionprice, and finally takes a closer look at a few selectedmarkets.3.2.1. Variation in Price Across States and Water Uses[35] The price distributions for individual states and water
uses are wide and skewed. For leases most minimums arenear $0 per ML and most maximums are in the $100s, andfor sales nearly all minimums are below $500 and mostmaximums are in the $1000s. For most states and wateruses, a few cases with unusually high prices skew the pricedistribution. Across the full set of leases the mean price is$69 per ML per year versus a median of $38, and for salesthe overall mean is $2948 versus a median of $1955. Asmentioned above, we will focus on medians.[36] Median lease prices vary substantially among the
states, ranging from below $10 per ML in Idaho, Oregon,Utah, and Wyoming to at least $45 per ML in Arizona,California, and New Mexico (ignoring Montana, Nevada
Figure 3. Trend in water market activity, all water uses.
Figure 4. Trend in number of leases for municipal, irrigation and environmental purposes.
W09402 BROWN: WESTERN U.S. WATER MARKET TRENDS
7 of 14
W09402

and Oklahoma because of the small numbers of cases,Table 5). Median sale prices also vary substantially acrossstates, ranging from below $100 per ML in Idaho to over$2000 in Colorado, New Mexico, and Nevada (ignoringKansas, Oregon, Washington, and Wyoming because of thesmall numbers of cases). Prices of both leases and sales arerelatively low in Idaho, Oregon and Utah. There is noapparent relation between number of cases and medianlease price, but median sale price is positively related tonumber of cases (R2 = 0.26). The variance in price acrossstates undoubtedly reflects a variety of factors includingrelative scarcity, the availability of publicly managed water,and state and local institutional differences. Further researchis needed to more precisely understand the reasons for theinterstate differences.[37] Median lease prices also vary substantially among
purposes for which the water was acquired, with municipaluses tending to pay more than irrigation and environmentaluses (Table 6). For leases the median price paid formunicipal uses ($56 per ML) was 4.6 times that paid forirrigation water ($12) and 1.5 times that paid for environ-mental purposes ($38). For sales the median price formunicipal uses ($2120 per ML) was only slightly largerthan that paid for irrigation water ($1917) but 3 times thatpaid for environmental purposes ($706). The reasons for thehigher prices for municipal water are of two types. First, asdiscussed below, prices of water for irrigation and environ-mental uses are sometimes artificially low. Second, it is thenature of cities that they value and have a relatively highability to pay for a secure water supply, and that expandingurban water demand tends to raise prices.[38] The relatively low lease price paid by irrigators
reflects the existence of many, typically long-standingarrangements whereby farmers lease excess water at com-paratively low prices from cities, WMOs, or other irrigators.Often the lease price is set equal to the annual assessmentfee charged by the ditch company or other WMO, a fee thatmay itself reflect a publicly subsidized storage and deliveryinfrastructure. Such trades may also enjoy relatively lowtransaction costs. However, to obtain water rights farmersnowadays usually must compete with other buyers on theopen market.[39] Nearly all (105) of the 113 leases for environmental
purposes were purchased by governmental entities (including
federal agencies such as the Bureau of Reclamation andvarious state and county entities) that were typically buyingthe water for aquatic species protection pursuant to theEndangered Species Act. In general, these leases wereemergency measures to augment flows during dry times.Prices of water rights obtained for environmental purposes(most of which were purchased by government agencies andenvironmental organizations) were less likely than wereleases to have been affected by extreme weather conditions.In addition, the transaction summaries indicate that prices ofwater rights sold for environmental purposes were some-times discounted, apparently reflecting either tax benefits ofsuch sales or perhaps sellers’ appreciation of the publicbenefits of environmental protection.3.2.2. Comparison of Lease and Sale Prices[40] Tables 5 and 6 list the implicit capitalization rate
(ICR), which is the rate at which perpetual annual paymentsat the lease price must be discounted to yield a present valueequal to the sale price, and was computed in percentageterms as 100 times the median lease price divided by themedian sale price [see also Howitt and Hansen, 2005]. Overall cases the ICR is 1.94%, much below the commercialcapitalization rate of roughly 8%. Such a low ICR indicatesthat purchasers of water rights are paying a substantial
Figure 5. Trend in number of rights purchased for municipal, irrigation, and environmental purposes.
Table 5. Western Water Market Prices by State, 1990–2003
State
Median Pricea
ICR, %Leasesb Sales
Arizona 47 1080 4.35California 55 991 5.59Colorado 15 2278 0.66Idaho 6 78 7.75Kansas 40New Mexico 45 2055 2.18Nevada 2946 0.00Oregon 7Texas 24 656 3.63Utah 6 470 1.23Washington 30Wyoming 6All 38 1955 1.94
aYear 2003 dollars per ML. Median prices are listed only if at least10 cases are available.
bDollars per year.
8 of 14
W09402 BROWN: WESTERN U.S. WATER MARKET TRENDS W09402

premium. For example, at an 8% capitalization rate, a leaseprice of $38 per ML implies a sale price of $475, far lowerthan the $1955 found for the median price among the 622sale cases. The premium is most likely incurred to avoid thepossibility of rising lease prices or the uncertainty of findingwater for lease, but also may reflect expectation on the partof water right buyers that real prices of water rights willincrease.[41] It should be noted, however, that the overall ICR is
influenced by the relatively low lease rate for irrigationwater mentioned above. Also, the overall sale price isheavily weighted by data from Colorado; over half of thesales are from Colorado, a state where the median sale priceis relatively high; fully 94% of the sale cases for Coloradoare for markets along or east (downstream) of the northernFront Range (i.e., in climate division 4, Figure 2). WithoutColorado the overall ICR is 4.01%.[42] The ICRs vary substantially across the states, from
0.66% for Colorado to 7.75% for Idaho. The variance acrossstates is probably a reflection of differences among states inthe purposes for which water rights tend to be leased or soldand in legal or institutional constraints on different kinds ofwater transfers. For example, in Colorado and Californiapurchases for municipal purposes are most common(Table 7). In Colorado 90% of the municipal use cases aresales, whereas in California 78% of such cases are leases.
Because municipal buyers tend to pay relatively high prices,we would expect Colorado’s ICR to be below California’s.[43] The ICRs also vary among the water uses, from
0.65% for irrigation water to 5.37% for environmental water(Table 6). As with variance across states, variance in ICRacross water uses probably reflects a variety of specialcircumstances. Prices of leases for irrigation water, asmentioned above, are often kept low by custom or institu-tional constraint, whereas sales of rights to irrigators aregenerally unconstrained; and for environmental purposesleases have tended to be emergency purchases by publicagencies whereas sales have often been at unusually lowprices. The ICR of water purchased for municipal use(2.64%) is probably relatively free of special influenceson price, and thus is a truer measure of the risk premium andeffect of speculation.3.2.3. Are Prices Rising?[44] The lack of increase in the number of water right
sales, in light of the West’s population increase, suggests anincreasing price trend, at least for rights purchased formunicipal use. Expectations about trends in lease price arenot so obvious, as the number of leases has been increasing.In this section we first look at trends in overall lease andsale prices and then at trends in prices of water purchasedfor specific purposes.[45] Trends in median prices paid for leases and sales
(across all states and purposes) are shown in Figure 6. Theunusually high median lease prices in 1991 and 1992 reflecta threefold increase in the number of lease entries inCalifornia, where lease prices were relatively high in theearly 1990s, spurred by a 5-year drought and the prepon-derance of leases for municipal use [Loomis, 1992]. TheMann-Kendall test does not find a significant increase inmedian lease price (k = 1.00), although since 1994 priceshave obviously been rising. However, as expected, mediansale prices have risen significantly over the 1990–2003period (k = 2.08).[46] Looking at the three major uses for which water was
purchased, median prices of leases for municipal use show anonsignificant downward trend (k = �1.75); this trend isheavily influenced by the California leases in the early1990s mentioned above. Median prices of sales for muni-
Table 7. Number of Cases by Purpose of Purchase by State, 1990–2003
State
Leases Sales
Municipality IrrigatorEnvironmentalOrganization Municipality Irrigator
EnvironmentalOrganization
Arizona 16 11 5 31 1 0California 116 61 48 33 5 3Colorado 24 13 7 226 97 12Idaho 3 21 17 2 10 2Kansas 9 2 0 5 0 0Montana 0 1 3 0 0 0New Mexico 2 2 10 24 2 0Nevada 2 0 0 57 0 7Oklahoma 2 0 0 1 0 0Oregon 0 19 11 0 1 8Texas 95 38 0 46 2 0Utah 2 9 0 26 4 2Washington 2 5 12 1 0 3Wyoming 13 17 0 1 1 0All 286 199 113 453 123 37
Table 6. Western Water Market Prices by Purpose of Purchase,
1990–2003
Purpose
Median Pricea
ICR, %Leasesb Sales
Municipal uses 56 2120 2.64Irrigation 12 1917 0.65Environment 38 706 5.37Other 53 1519 3.47Several 43 1664 2.57All 38 1955 1.94
aYear 2003 dollars per ML.bDollars per year.
W09402 BROWN: WESTERN U.S. WATER MARKET TRENDS
9 of 14
W09402

cipal uses have increased significantly (k = 2.19). Forirrigation water, median prices of leases have fallen (k =�2.63) and median prices of sales do not show a significanttrend (k = 1.09). For environmental purposes, prices ofleases have risen significantly (k = 2.52) but prices of saleshave not (k = 0.48) (though for sales there are so few casesthat the trend test is of little interest).3.2.4. What Affects Transaction Price?[47] The price at which water changes hands in a given
trade may be influenced by a large number of factors,including number of buyers and sellers in the market, exis-tence of available storage and delivery infrastructure, trans-action costs, institutional arrangements, climate, amount ofwater transferred, and, to the extent that laws, administrativerequirements, or customs differ across uses, the use for whichthe water is purchased. The first four of these variables arevery difficult to measure, especially across so many marketareas as are covered by the current data. The analysispresented below is modest in comparison with what mightbe accomplished with more effort, but it is neverthelessinstructive.[48] For this analysis seven independent variables were
regressed on price using OLS. This was done separately forleases and sales, and included only those cases for which thepurpose of the purchase was municipal, irrigation, orenvironmental use. The seven independent variables areyear of the transaction (YEAR), a measure of drought(PDSI), megaliters transferred (ML), year 2000 populationof the county of the buyer (or, if the buyer’s location couldnot be identified, of the seller) (POP), a dummy variable forgroundwater (GW) with the alternative being surface water,and dummy variables for municipal use (MUN) and envi-ronmental use (ENV) with the alternative being irrigationuse. Ideally the population variable would focus on popu-lation of the market area of each transaction rather than onthe county, but, as mentioned earlier, delineating thehundreds of market areas involved would be a formidabletask. The climate variable (PDSI) was constructed from themonthly Palmer Drought Severity Index numbers for theperiod 1990–2003 for the climatic divisions with qualifyingcases (see Figure 2). This index measures the deviation fromclimatic norms [Alley, 1984]. The monthly index numbersfor the relevant climatic division for the six months prior tothe transaction were averaged to compute PDSI for eachcase. PDSIs vary from about 4 for extremely wet conditionsto about �4 for extreme drought. Because this measurereflects only data from the surrounding climatic division, it
may fail to capture the effect of weather changes on wateravailability in those cases where the water originatesupstream of the climatic division. Also, because themeasure uses data for only the past 6 months, it will beless sensitive in situations with ample reservoir storage.[49] In the regressions we would expect, all else equal,
the price per unit of volume to be larger (1) during times ofdrought for leases (because leases are generally short-termarrangements and thus able to respond to temporal climaticvariation); (2) for small sales (because transaction costs canbe substantial for sales and are likely, as reported by Howeet al. [1990], to decrease per unit of water as amount ofwater sold increases); (3) in areas with greater population(because demand for water increases as population grows);and (4) for surface water versus groundwater for sales(because of dropping water tables over the long term).Given the examination of trends in median price presentedabove, we also expect to find (5) that sale prices haveincreased over the 14-year period but that lease prices havenot. Also, given the prior examination of median prices fordifferent water uses we expect to find (6) for leases thatprices of water purchased for irrigation are lower than thoseof water purchased for municipal and environmental usesand for sales that prices of water purchased for irrigation arelower than those of water purchased for municipal uses buthigher than those of water purchased for environmentaluses.[50] Tables 8 and 9 list the results of the two regressions.
Both regressions are significant, although they explain amodest amount of the variation in market price (adjusted R2
values are 0.21 for leases and 0.24 for sales). For leases,higher prices are associated with drier climates and largercounty populations. Lease price is greater for municipal andenvironmental uses than for irrigation. The influences ofYEAR, ML, and GW are not significant. For sales, higherprices are associated with more recent sales, smallervolumes of water transferred, smaller county populations,and with surface water as opposed to groundwater. Saleprice is also greater for municipal uses and less forenvironmental uses than for irrigation. The influence ofPDSI is not significant.[51] The regression results are discussed in turn. (1) For
drought the results are in line with expectations, in that leaseprice is greater in times of drought. The lack of significanceof PDSI for sales is reasonable given that sales are inperpetuity and generally take considerable time to arrange.(2) The results for transaction size, that sale price drops with
Figure 6. Trend in median price of water, all water uses (year 2003 dollars).
10 of 14
W09402 BROWN: WESTERN U.S. WATER MARKET TRENDS W09402

size, is also expected. The lack of significance of ML forleases suggests that transaction costs are not as important aninfluence on lease price as they are on sale price. (3) Theresults for county population are in line with expectationsfor leases (i.e., price increases with population) but not forsales. The negative POP coefficient for sales may in partreflect the particular locations of the counties with thelargest populations, which were Los Angeles, San Berna-dino, Alameda, and San Diego counties in California,Maricopa and Pima Counties in Arizona, Bexar County inTexas, and Salt Lake County in Utah. Sales in most of thesecounties typically involved water managed under adminis-trative constraints. This unexpected finding highlights theneed to understand and account for the institutionalcharacteristics of each market, a task that was beyond thescope of this broad-scale assessment, and may also suggestthat counties are not the best geographical units for charac-terizing population. (4) The results for water source, thatsale prices are lower for ground than for surface water, arein line with expectations. The lack of significance of GWfor leases is reasonable in that leases are typically for aspecific amount of water. (5 and 6) The remaining results,regarding time trend and water use, are consistent with priordiscussions.3.2.5. Price Differences Across Selected Markets[52] For most markets the number of qualifying cases
is small, usually below ten, but for some there areenough cases to examine market-specific trends and tocompare water uses or types of transfer (leases versus sales).Here we examine a few of the markets for which severalcases are available, allowing discussion of some key marketinfluences.[53] Figure 7 shows median lease prices for two markets,
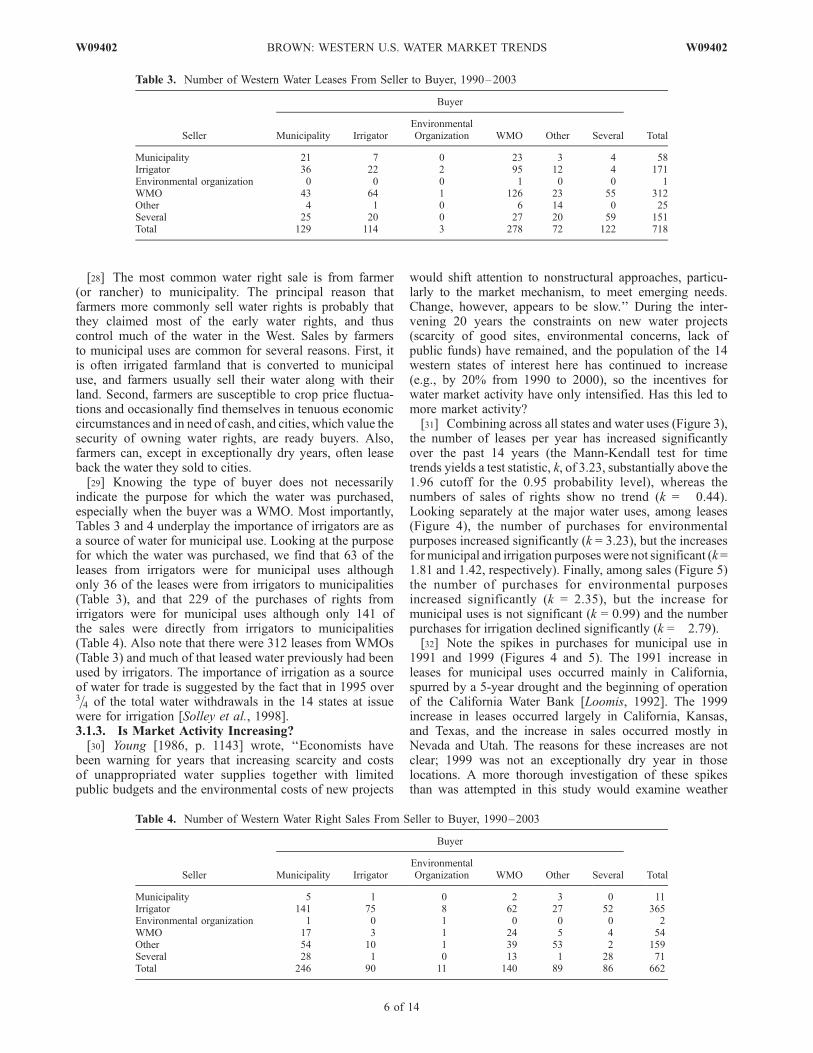
one along the North Platte River in Wyoming and the other
along the Rio Grande in Texas. For each market, Figure 7distinguishes between the two most common uses for whichwater was purchased, irrigation and municipal use. Alongthe North Platte, the Bureau of Reclamation supplied thewater, which was stored in Glendo Reservoir, at nominalprices of $4 per ML for irrigators and $61 per ML for M&Iuses. These administratively set fees remained constant overthe 10-year period (1994–2003) for which leases wererecorded; the median prices of Figure 7 are updated to year2003 dollars. Many of the lease prices for other locations inthe database were apparently also administratively set,although constant prices enduring over several years wereunusual.[54] The Rio Grande market in Texas is an example of
competitive lease prices. The Rio Grande Watermaster’soffice facilitates the market by bringing buyers and sellerstogether, with the price being determined by negotiationbetween buyer and seller [Yoskowitz, 1999]. As seen inFigure 7, prices for irrigation and municipal water aresimilar in all years; overall medians, which represent 37trades for irrigation and 64 trades for municipal use, areboth $19 per ML. Yoskowitz [2002] reports on a much largerset of lease transactions that occurred along the Rio Grandein Texas between 1993 and 2000, a few of which were formining. Mean prices paid for irrigation and municipal wateramong the full set of leases were both $18 per ML innominal dollars. Interestingly, the mean price paid bymining firms was $350, demonstrating that even in acompetitive market anomalies can occur (see Yoskowitz[2002] for details).[55] Figure 8 shows median prices for sale of water
rights, specifically, shares of WMOs, from three watermarkets along the Colorado Front Range and in easternColorado. Water from Twin Lakes Reservoir (174,000 ML
Table 9. Regression Analysis of Influences on Sale Pricea
Variable B Standard Error Beta t Significance
(Constant) �719961.257 64642.228 �11.138 <0.001YEAR 362.029 32.403 0.422 11.173 <0.001PDSI �39.207 47.229 �0.031 �0.830 0.407ML �5.488E-02 0.015 �0.131 �3.635 <0.001POP �3.713E-04 0.000 �0.145 �3.909 <0.001GW �1904.010 420.292 �0.173 �4.530 <0.001MUN 1118.370 328.737 0.138 3.402 0.001ENV �2066.933 605.172 �0.138 �3.415 0.001
aSale price in $/ML for 2003 dollars. N = 613, adjusted R2 = 0.239, F = 28.450, and significance <0.001.
Table 8. Regression Analysis of Influences on Lease Pricea
Variable B Standard Error Beta t Significance
(Constant) 1796.847 1325.350 1.356 0.176YEAR �0.891 0.664 �0.050 �1.342 0.180PDSI �3.459 1.129 �0.113 �3.063 0.002ML �1.088E-05 0.000 �0.010 �0.281 0.779POP 7.538E-06 0.000 0.277 6.820 <0.001GW 12.353 9.443 0.051 1.308 0.191MUN 44.156 6.163 0.309 7.165 <0.001ENV 28.995 7.654 0.158 3.788 <0.001
aLease price $/ML/year for 2003 dollars. N = 593, adjusted R2 = 0.214, F = 24.027, and significance <0.001.
W09402 BROWN: WESTERN U.S. WATER MARKET TRENDS
11 of 14
W09402
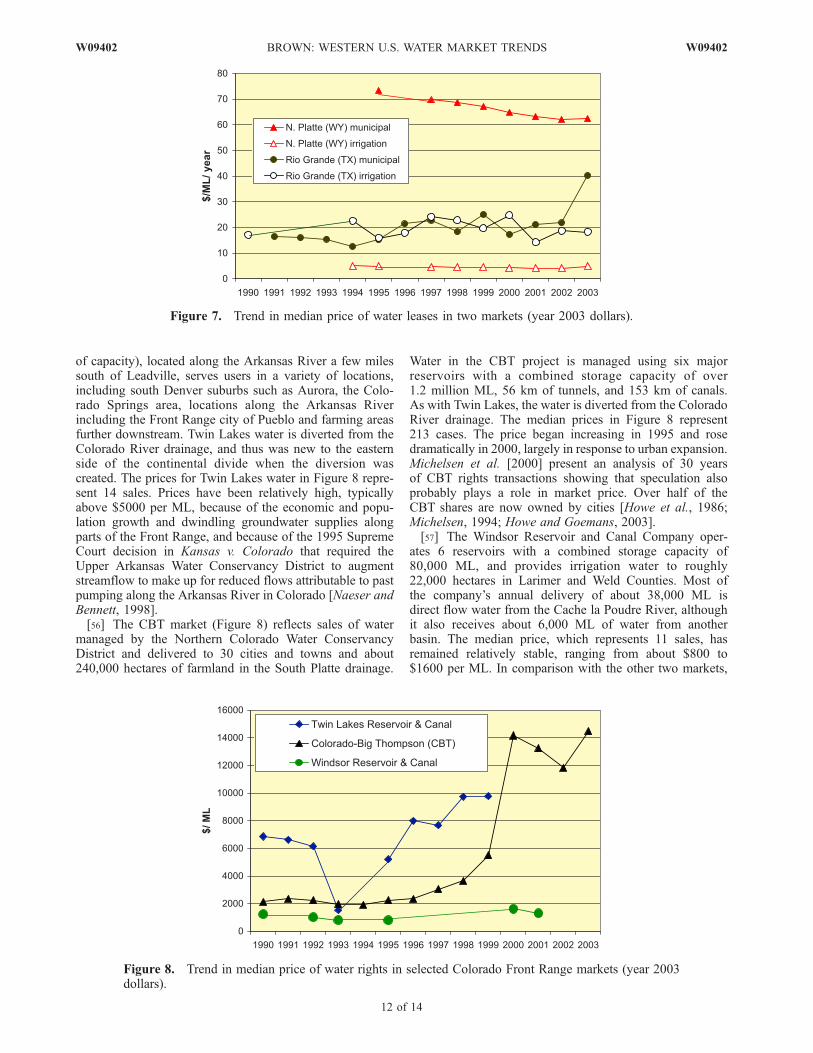
of capacity), located along the Arkansas River a few milessouth of Leadville, serves users in a variety of locations,including south Denver suburbs such as Aurora, the Colo-rado Springs area, locations along the Arkansas Riverincluding the Front Range city of Pueblo and farming areasfurther downstream. Twin Lakes water is diverted from theColorado River drainage, and thus was new to the easternside of the continental divide when the diversion wascreated. The prices for Twin Lakes water in Figure 8 repre-sent 14 sales. Prices have been relatively high, typicallyabove $5000 per ML, because of the economic and popu-lation growth and dwindling groundwater supplies alongparts of the Front Range, and because of the 1995 SupremeCourt decision in Kansas v. Colorado that required theUpper Arkansas Water Conservancy District to augmentstreamflow to make up for reduced flows attributable to pastpumping along the Arkansas River in Colorado [Naeser andBennett, 1998].[56] The CBT market (Figure 8) reflects sales of water
managed by the Northern Colorado Water ConservancyDistrict and delivered to 30 cities and towns and about240,000 hectares of farmland in the South Platte drainage.
Water in the CBT project is managed using six majorreservoirs with a combined storage capacity of over1.2 million ML, 56 km of tunnels, and 153 km of canals.As with Twin Lakes, the water is diverted from the ColoradoRiver drainage. The median prices in Figure 8 represent213 cases. The price began increasing in 1995 and rosedramatically in 2000, largely in response to urban expansion.Michelsen et al. [2000] present an analysis of 30 yearsof CBT rights transactions showing that speculation alsoprobably plays a role in market price. Over half of theCBT shares are now owned by cities [Howe et al., 1986;Michelsen, 1994; Howe and Goemans, 2003].[57] The Windsor Reservoir and Canal Company oper-
ates 6 reservoirs with a combined storage capacity of80,000 ML, and provides irrigation water to roughly22,000 hectares in Larimer and Weld Counties. Most ofthe company’s annual delivery of about 38,000 ML isdirect flow water from the Cache la Poudre River, althoughit also receives about 6,000 ML of water from anotherbasin. The median price, which represents 11 sales, hasremained relatively stable, ranging from about $800 to$1600 per ML. In comparison with the other two markets,
Figure 8. Trend in median price of water rights in selected Colorado Front Range markets (year 2003dollars).
Figure 7. Trend in median price of water leases in two markets (year 2003 dollars).
12 of 14
W09402 BROWN: WESTERN U.S. WATER MARKET TRENDS W09402

the storage capacity and delivery area are small and thewater users are more heavily concentrated in agriculture,which in part accounts for the relatively low price.[58] Two main points are evident from this comparison of
Colorado Front Range water rights markets. First, prices canvary substantially even among markets located quite closeto each other. Such markets are distinguished by localeconomic conditions, availability of alternative supplies(such as groundwater as a supplement for surface water),extent of their water distribution infrastructure, past deci-sions to obtain secure surface water rights, and return flowconsiderations. Second, prices in competitive markets canchange dramatically over time in response to developmentpressures.
4. Conclusions
[59] At least six conclusions can be drawn from theanalysis of the trades reported by Stratecon Inc. First, muchmore water changes hands each year via leases than viasales of water rights, in part because the median size ofleases is over 50 times that of sales. Being relatively short-term, leases generally incur lower transaction costs andfewer legal and administrative constraints than permanentsales. Of course, leases of a water right can occur repeat-edly, whereas a sale is in perpetuity, so the comparison ofleases to sales is in a sense an unfair one.[60] Second, water market activity and price are geo-
graphically variable. Markets are very active in a few areasof the West, but other areas appear to have had relativelyfew trades over the past 14 years. The median price of wateris highly variable both within and across states, reflectingthe particular physical, legal, administrative, and economiccharacteristics of individual water markets. In addition,lease price varies over time in response to weather cycles,and both lease and sale prices respond to developmentpressures. Such variability complicates the process of ben-efit transfer.[61] Third, except for within-organization leases, which
were generally not included in the transaction data analyzedhere, WMOs (especially public agencies) and irrigators arethe most common lessors, but lessees are fairly welldistributed across the various categories of buyers. Withsales, irrigators are by far the most common sellers andmunicipalities are the most common buyers. Purchases formunicipal purposes have tended to be of water rights,whereas purchases for irrigation, environmental, or otherpurposes have tended to be of leases.[62] Fourth, across the complete set of cases, prices paid
for municipal water tend to be higher than prices paid forwater to be used for irrigation or environmental purposes.However, numerous exceptions to this general findingexist, such as the lower Rio Grande lease market and theCBT water rights market, where competition tends toequalize prices (although even in these markets exceptionsoccur). Fifth, market leasing activity appears to be increas-ing, although sale activity is not. Sixth, real sale priceshave been increasing, and in recent years so have leaseprices.[63] The first two of these conclusions can be said with
confidence to apply to the full population of western watertrades. Because of the sampling procedure employed byStratecon Inc., the other conclusions are best characterized
as hypotheses. In addition to future testing of thesehypotheses, useful areas for future research include(1) adding comprehensive data on within-organizationleases and (2) achieving a more complete analysis ofthe factors affecting variance in incidence and priceacross market areas and water uses. The latter effortwould require including variables describing the differentlaws and administrative arrangements affecting marketactivity and price.[64] Finally, it bears repeating that although water market
activity offers important information about the value ofwater, water values are highly variable both geographicallyand over time, and are commonly affected by factors thatinterfere with competitive pricing, so care must be used inapplying water market prices to analyze policies affectingwater supply.
[65] Acknowledgment. The author thanks Alex Bujak, researchassistant with Colorado State University, who ably helped summarize thetransactions and maintain the database, and the journal’s reviewers forinsightful and helpful comments.
ReferencesAlley, W. M. (1984), The Palmer drought severity index: Limitations andassumptions, J. Clim. Appl. Meteorol., 23, 1100–1109.
Brookshire, D. S., B. Colby, M. Ewers, and P. T. Ganderton (2004), Marketprices for water in the semiarid west of the United States, Water Resour.Res., 40(9), W09S04, doi:10.1029/2003WR002846.
Carey, J., D. L. Sunding, and D. Zilberman (2002), Transaction costs andtrading behavior in an immature water market, Environ. Dev. Econ., 7,733–750.
Colby, B. G., K. Crandall, and D. B. Bush (1993), Water right transactions:Market values and price dispersion, Water Resour. Res., 29(6), 1565–1572.
Eheart, J. W., and R. M. Lyon (1983), Alternative structures for water rightsmarkets, Water Resour. Res., 19(4), 887–894.
Getches, D. H. (1987), Water use efficiency: The value of water in the West,Public Land Law Rev., 8, 1–32.
Gillilan, D. M., and T. C. Brown (1997), Instream Flow Protection: Seekinga Balance in Western Water Use, Island, Washington, D. C.
Gollehon, N. R. (1999), Water markets: Implications for rural areas of theWest, Rural Dev. Perspect., 14(2), 57–63.
Hanak, E. (2005), Stopping the drain: Third-party responses to California’swater market, Contemporary Econ. Policy, 23(1), 59–77.
Hartman, L. M., and D. Seastone (1970), Water Transfers: Economic Effi-ciency and Alternative Institutions, Johns Hopkins Univ. Press, Balti-more, Md.
Hirshleifer, J., J. C. DeHaven, and J. W. Millman (1960), Water Supply:Economics, Technology, and Policy, Univ. of Chicago Press, Chicago, Ill.
Howe, C. W., and C. Goemans (2003), Water transfers and their impacts:Lessons from three Colorado water markets, J. Am. Water Resour. Assoc.,39(5), 1055–1065.
Howe, C. W., D. R. Schurmeier, and W. D. Shaw Jr. (1986), Innovations inwater management: Lessons from the Colorado-Big Thompson Projectand Northern Colorado Water Conservancy District, in Scarce Water andInstitutional Change, edited by K. D. Frederick, pp. 171–200, Resour.for the Future, Washington, D. C.
Howe, C. W., C. S. Boggs, and P. Butler (1990), Transaction costs asdeterminants of water transfers, U. Colo. Law Rev., 61, 393–405.
Howitt, R., and K. Hansen (2005), The evolving western water markets,Choices, 20(1), 59–63.
Loomis, J. B. (1992), The 1991 State of California Water Bank: Watermarketing takes a quantum leap, Rivers, 3(2), 129–134.
Loomis, J. B., K. Quattlebaum, T. C. Brown, and S. J. Alexander (2003),Expanding institutional arrangements for acquiring water for environ-mental purposes: Transactions evidence for the western United States,Water Resour. Dev., 19(1), 21–28.
Michelsen, A. M. (1994), Administrative, institutional, and structural char-acteristics of an active water market, Water Resour. Bull., 30(6), 971–982.
Michelsen, A. M., J. F. Booker, and P. Person (2000), Expectations inwater-right prices, Water Resour. Dev., 16(2), 209–219.
W09402 BROWN: WESTERN U.S. WATER MARKET TRENDS
13 of 14
W09402

Naeser, R. B., and L. L. Bennett (1998), The cost of noncompliance: Theeconomic value of water in the Middle Arkansas River Valley, Nat.Resour. J., 38(3), 445–463.
National Research Council (1992), Water Transfers in the West: Efficiency,Equity, and the Environment, Natl. Acad. Press, Washington, D. C.
Saliba, B. C. (1987), Do water markets ‘‘work’’? Market transfers andtrade-offs in the southwestern states, Water Resour. Res., 23(7), 1113–1122.
Solley, W. B., R. R. Pierce, and H. A. Perlman (1998), Estimated use ofwater in the United States in 1995, U.S. Geol. Surv. Circ., 1200.
Thompson, B. H., Jr. (1993), Institutional perspectives on water policy andmarkets, Calif. Law Rev., 81(2), 673–764.
Wahl, R. W. (1989), Markets for Federal Water: Subsidies, PropertyRights, and the Bureau of Reclamation, Resour. for the Future,Washington, D. C.
Yoskowitz, D. W. (1999), Spot market for water along the Texas RioGrande: Opportunities for water management, Nat. Resour. J., 39(2),345–355.
Yoskowitz, D. W. (2002), Price dispersion and price discrimination: Em-pirical evidence from a spot market for water, Rev. Ind. Organ., 20(3),283–289.
Young, R. A. (1986), Why are there so few transactions among waterusers?, Am. J. Agric. Econ., 68(5), 1143–1151.
����������������������������T. C. Brown, Rocky Mountain Research Station, U.S. Forest Service,
2150-A Centre Avenue, Fort Collins, CO 80526, USA. ([email protected])
14 of 14
W09402 BROWN: WESTERN U.S. WATER MARKET TRENDS W09402