western information office consumer price index, los
TRANSCRIPT

7/18/2018 Consumer Price Index, Los Angeles area — June 2018 : Western Information Office : U.S. Bureau of Labor Statistics
Abou* B, Contact Us Subscribe to E-mail Updates
-ollow Us ' | What’s Nsw | Release Calendar
blJoRANSM I7TAL NCXjjgiSearch
SubjectsHome Economic Releaseilicat
Western Information OfficeSHARE ON: share on facebook share on twitter ' share on linkedin Search Western Region G
Western Home
Geographic Information > Western > News Release
Consumer Price Index, Los Angeles area — June 2018News Release Information18-1161-SAN
Thursday, July 12, 2018
Area prices were down 0.2 percent over the past month, up 4.0 percent from a year ago
Prices in the Los Angeles area, as measured by the Consumer Price Index for All Urban Consumers (CPI-U), edged down 0.2 percent in June, the U.S. Bureau of Labor Statistics reported today. (See table A.1 Assistant Commissioner for Regional Operations Richard Holden noted that the June decrease was influenced by lower prices for apparel, food, and gasoline. (Data in this report are not seasonally adjusted. Accordingly, month-to- month changes may reflect seasonal influences.)
ContactsTechnical information: (415)625-2270 [email protected] www.bls.aov/reaions/west
Media contact:(415) 625-2270
Over the last 12 months, the CPI-U advanced 4.0 percent. (See chart 1 and table A.) Energy prices jumped 16.3 percent, largely the result of an increase in the price of gasoline. The index for all items less food and energy increased 3.5 percent over the year. (See table 1.)
Chart 1. Over-the-year percent change in CPI-U, Los Angeles-Long Beach-An a helm, CAS June 2&15-June 2018Percent change
PDF version
■■ All itemsAil items less feed and energy
5.0
Related Links4,0
Historical data/
3.0
X/X
' v* ’ I......
vw
2.0
//V / Xf \
/■1.0 X
0.0 I I 1-1-1 1 \- 1 I \ I 1—) I i I I I ISep Dec Mar Jun Sep Dec Mar
I I i I I I I I I I■4—I—I—I—I— Sep D ec M arJun Jun Jun
'15 '16 '17 1SSource: U.S. Bureau of Labor Statistics.
FoodFood prices declined 0.4 percent for the month of June. (See table 1.) Prices for food at home decreased 1.3 percent, but prices for food away from home rose 0.4 percent for the same period.
Over the year, food prices advanced 1.3 percent. Prices for food away from home increased 3.8 percent since a year ago, but prices for food at home decreased 0.9 percent.
EnergyThe energy index decreased 0.8 percent over the month. The decrease was mainly due to lower prices for gasoline (-1.2 percent). Prices for electricity declined 1.1 percent, but prices for natural gas service advanced 3.3 percent for the same period.
Energy prices jumped 16.3 percent over the year, largely due to higher prices for gasoline (23.9 percent). Prices paid for electricity rose 6.7 percent, but prices for natural gas service declined 4.0 percent during the past year.
All items less food and energy
https://www.bls.gov/regions/west/news-reiease/consumerpriceindex_losangeles.htm 1/4

The index for all items less food and energy edged down 0.2 percent in June. Lower prices for apparel (-2.5 percent) and other goods and services (-0.5 percent) were partially offset by higher prices for education and communication (0.5 percent) and recreation (0.2 percent).
Consumer Price Index, Los Angeles area — June 2018 : Western Information Office : U.S. Bureau of Labor Statistics7/18/2018
Over the year, the index for all items less food and energy increased 3.5 percent. Components contributing to the increase included shelter (5.6 percent), other goods and services (3.5 percent), and medical care (2.2 percent). Partly offsetting the increases were price declines in household furnishings and operations (-1.0 percent), apparel (-0.8 percent), and recreation (-0.6 percent).
Table A. Los Angeles-Long Beach-Anaheim CPI-U monthly and annual percent changes (not seasonally adjusted)2014 2016 2017
Monthly ! Annual | Monthly | Annual
20182015
Monthly { Annual I Monthly I Annual | Monthly I Annual
2013
Monthly j Annuali
Month0.8 3.52.0 0.7 0.ST 2.10.5 0.8 -0.3 -0.1 3.10.8January
February March
| April
2.7 0.7 3.60.7 0.1 0.0 2.4 0.6:0.5 0.50.7 2.22.7 0.4 3.81.0 1.0 0.5 0.3 1.7 0.30.1 1.3 0.6
0-4 [2.7;-0.1 0.2 2.0 0.2 4.0o.o; 1.4 0.5-0.4 0.9
2.50.4; 1.7 1.0 1.1 0.5 1.4 0.3 0.4 [ 4.10.1;' 1.0; May4.0-0.1 1.4 0.1 1.8 -0.3 0.8 0.1 1.8 ■0.2 2.2; -0.2 SJune
! July August September
| October November
] December
1.1 2.5-0.1 ■ 1.3; 0.1 2.0 0.7 1.4 0.0 0.3
-0.1 1.8 -0.3 1.1 0.0 1.4 0.3 2.8'0.1: 0.80.2; 0.6 0.0 1.7 -0.4 0.7 0.2 1.9! 0.4 i 3.1;
-0.1 1.4 0.2 1.0 0.4 2.2 0.4 3.1;0.1 -0.10.4 ■0.7; 1.3 0.0 1.6 ■0.4; 1.8 0.1 3.6 j-0.5
o.o; 1.1 ■ ■0.5; 0.7 -0.1; 2.0 0.0' 2.0 0.0 3.6;
The July 2018 Consumer Price Index for the Los Angeles-Long Beach-Anaheim area is scheduled to be released on August 10, 2018.
Consumer Price Index Geographic Revision for 2018In January 2018, BLS introduced a new geographic area sample for the Consumer Price Index (CPI). As part of the new sample, Los Angeles and Riverside have separate indexes. Additional information on the geographic revision is available at: www.bls.aov/cpi/aeorevision2018.htm.
Technical NoteThe Consumer Price Index (CPI) is a measure of the average change in prices over time in a fixed market basket of goods and services. The Bureau of Labor Statistics publishes CPIs for two population groups: (1) a CPI for All Urban Consumers (CPI-U) which covers approximately 93 percent of the total population and (2) a CPI for Urban Wage Earners and Clerical Workers (CPI-W) which covers 29 percent of the total population. The CPI-U includes, in addition to wage earners and clerical workers, groups such as professional, managerial, and technical workers, the self-employed, shortterm workers, the unemployed, and retirees and others not in the labor force.
The CPI is based on prices of food, clothing, shelter, and fuels, transportation fares, charges for doctors' and dentists' services, drugs, and the other goods and services that people buy for day-to-day living. Each month, prices are collected in 75 urban areas across the country from about 5,000 housing units and approximately 22,000 retail establishments—department stores, supermarkets, hospitals, filling stations, and other types of stores and service establishments. All taxes directly associated with the purchase and use of items are included in the index.
The index measures price changes from a designated reference date (1982-84) that equals 100.0. An increase of 16.5 percent, for example, is shown as 116.5. This change can also be expressed in dollars as follows: the price of a base period "market basket" of goods and services in the CPI has risen from $10 in 1982-84 to $11.65. For further details see the CPI home page on the Internet at www.bls.aov/cDi and the BLS Handbook of Methods, Chapter 17, The Consumer Price Index, available on the Internet at www.bls.aov/oDub/hom/homchl7 a.htm.
In calculating the index, price changes for the various items in each location are averaged together with weights that represent their importance in the spending of the appropriate population group. Local data are then combined to obtain a U.S. city average. Because the sample size of a local area is smaller, the local area index is subject to substantially more sampling and other measurement error than the national index. In addition, local indexes are not adjusted for seasonal influences. As a result, local area indexes show greater volatility than the national index, although their long-term trends are quite similar. NOTE: Area indexes do not measure differences in the level of prices between cities; they only measure the average change in prices for each area since the base period.
The Los Angeles-Long Beach-Anaheim. metropolitan area covered in this release is comprised of Los Angeles and Orange Counties in the State of California.
Information in this release will be made available to sensory impaired individuals upon request. Voice phone: (202) 691-5200; Federal Relay Service: (800) 877-8339.
Table 1. Consumer Price Index for All Urban Consumers (CPI-U): Indexes and percent changes for selected periods
https://www.bls.gov/regions/west/news-release/consumerpriceindex_losangeles.htm 2/4

7/18/2018
Los Angeles-Long Beach-Anaheim (1982-84=100 unless otherwise noted)
Consumer Price Index, Los Angeles area — June 2018: Western Information Office : U.S, Bureau of Labor Statistics
Indexes Percent change from-
Jun. Apr. May2017 2018 2018
rItem and Group Apr. May Jun.20182018 2018
j Expenditure category
265.095
783.207
260.079
260623
257.249
262.157
280.771'
243.081
266.148
786.319
259.252
259.611
255.115258.547
All itemsAll items (1967=100)
Food and beverages Food
Food at homeCereals and bakery products Meals, poultry, fish, and eggs Dairy and related products Fruits and vegetables
Nonalcoholic beverages and beverage materials*!) Other food at home
265.522
784.470
258 121
258.493,
251.908
265.089
4.0 0.2 -0.2
h1.2 -0.8 -0.4
1.3 -0.8 -0.4
-0.9 -2.1 -1.31
1.1 2.5
276.998:
243.136
276.874
230.080
334.496
254.932’
200.450
261.902
261.902
237.407
300.801
346.681
-1.4 0.0-5.3 I -5.4
-2.8’344.170;
259.957
205.510
342.775,
260.211
202.990
260.832
260.832
238.649
-2.4
-1.9 -2.0
-2.5 -1.3t260.662 [
260.662
236.947
299.048;
344.663:
361.853
Food away from home Food away from home
Alcoholic beverages
3.8 0.5 0.4
L 3.8 0.5 0.4
-0.50.1 0.2I- Housing
Shelter300.896:
346.704
4.9 0.6 0.00 65.6 0.0■
Rent of primary residence®Owners' equiv. rent of residences®©
Owners' equiv. rent of primary residence©® Fuels and utilities
Household energy
Energy services©
Electricity*?)
Utility (piped) gas service©Household furnishings and operations
Apparel
362.688
358.741 [
363.460 4.7 0.4 0.2;
357.725 360.277 0.75.6 0.4
357.704
309.868
358.720
320.397:
360.256
320.494
274 645
273.373
309.886
234.695|
115.769
105.173
215.564
211.801
5.6 0.7 0.4I4.4 3.4 0.0
261.504
260.036
274.524;
273.095
313.199:
4.0 5.0 0.05.14.0 0.1
313.199;
186.105
117.630
114.195
6.7 -1.1 -1.1
227.144,
116.160107.820;
216:802?212498!
92.071
-4.0 26.1 3.3
-1.6-1.0 -0.3L .-0.8 -7.9! -2.5
TT!TransportationPrivate transportation
New and used motor vehicles©
213.267
209.653
8.5 -0.69.2 1.0j -0.3
-0.192.077 92.013!
169.414
268.557
284.872,
-0.1
New vehicles©
Used cars and trucks©Motor fuel
Gasoline (all types)
Gasoline, unleaded regular©
Gasoline, unleaded midgrade©©
Gasoline, unleaded premium©
Motor vehicle insurance©Medical care
Recreation©
Education and communication©
Tuition, other school fees, and child care© Other goods and services
169.728. 169.306! -0.2 0.1
268.930
277.701
271.328
271.996:
267.205
288.201
281.580
282.335
-0.1 0.5
2.624.1 -1.2278.310 23.9
279.017 24.1
2.6 -1.22.6 -1.2
260.162!
258.276
\~~ 748.204
' 478(342;’
' ' 04X97
143.872
1,7757946
428.541
269.950 267.048 23.6 2.6 -1.1:
267.712 264.768 22.9 2.5 -1.1:
1.4758.909
480.668
105.700
144.240
758.909
' 479.922
’ 105.881
144.897
1.780.097
426.226
0.0T 2.2 0.3 -0.2
-0.6 1.7: 0.2
1.7 0.7 0.5
1,775.946
428.442
0.2 0.2
3.5 -0.5 -0.5j
j Commodity and service group
4.0All items Commodities
Commodities less food & beverages Nondurables less food & beverages Durables
265.095
183480
142.349
194.773
91.917
338.034
266.148 265.522!
”180.949]
140.158.
191.320
90.882
340 805
0.2 -0.22.8182.353
141.575!
193.946
-1.2 -0.84.0 -1.5j -1.08.3 -1.8 -1.4
91.224;
340.747
-3.1 -1.1 ■0.4
Services 4.6 0.8 0.0
ISpecial aggregate indexes
Footnotes(1) Indexes on a December 1977=100 base.(2) This index series was calculated using a Laspeyres estimator. All other item stratum index series were calculated using a geometric means estimator.
: (3) Indexes on a December 1982=100 base.(4) Special index based on a substantially smaller sample.(5) Indexes on a December 1993=100 base.(6) Indexes on a December 1997=100 base.
- Data not available’ NOTE: Index applies to a month as a whole, not to any specific date.
https://www.bls.gov/regions/west/news-release/consumerpriceindex_losangeles.htm 3/4
7/18/2018 Consumer Price Index, Los Angeles area — June 2018 : Western Information Office : U.S. Bureau of Labor Statistics
Indexes Percent change from-
Apr. May2018 2018
Item and Group Apr. May Jun.2018
Jun.20172018 2018
_L
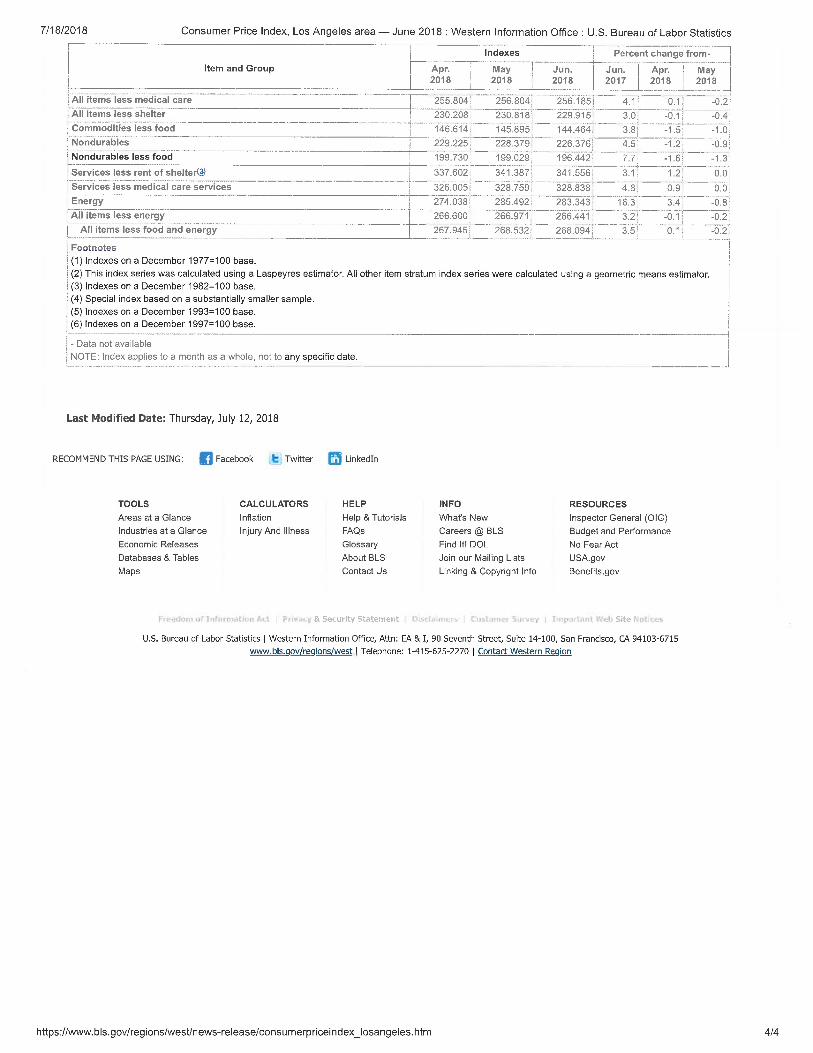
i All items less medical care All items less shelter
; Commodities less food Nondurables Nondurables less food
Services less rent of shelter!J) Services less medical care services
255.804 256.804
23a¥iF
145.895'
256.185
229.915
144.464.
4.1 •0.2!0.1230.208
146.6143.0 -0.1 -0.4
3.8| -1.5 -1.0)
229.225
199.730
228.379
199.029
341.387
328.759
226.376
196.442
341.556
328.838
-0.9;4.5 -1.27.7 -1.6 -1.3
337.602
326.005
3.1 1-2; 0.0
0.9;4.8 0.0Energy 274.038
266.600
267.945
285.492 283.343
266.44?
268.094
16.3 3.41 -0.8j All items less energy j All items less food and energy
Footnotes) (1) Indexes on a December 1977=100 base.! (2) This index series was calculated using a Laspeyres estimator. All other item stratum index series were calculated using a geometric means estimator. ! (3) Indexes on a December 1982=100 base.' (4) Special index based on a substantially smaller sample.(5) Indexes on a December 1993=100 base.(6) Indexes on a December 1997=100 base.
-o.i r266.971
268.532'
3.2* -0.23.5 0.1 -0.2
j - Data not available! NOTE: Index applies to a month as a whole, not to any specific date. J
Last Modified Date: Thursday, July 12, 2018
f] Facebook t Twitter IS LinkedlnRECOMMEND THIS PAGE USING:
TOOLSAreas at a Glance Industries at a Glance Economic Releases Databases & Tables Maps
CALCULATORSInflationInjury And Illness
HELPHelp & Tutorials FAQs Glossary About BLS Contact Us
INFOWhat’s New Careers @ BLS Find It! DOL Join our Mailing Lists
Linking & Copyright Info
RESOURCESInspector General (OIG) Budget and Performance No Fear Act USA.gov Benefits.gov
cy & Security Statement ;t> site Noi
U.S. Bureau of Labor Statistics | Western Information Office, Attn: EA & I, 90 Seventh Street, Suite 14-100, San Francisco, CA 94103-6715 www.hls.aov/reaions/west | Telephone: 1-415-625-2270 | Contact Western Region
https://www.bls.gov/regions/west/news-release/consumerpriceindex_losangeles.htm 4/4