trends in u.s. trade in information and communications technology
TRANSCRIPT
May 2016 1
Trends in U.S. Trade in Information and Communications Technology (ICT) Services and in ICT-Enabled ServicesBy Alexis N. Grimm
NFORMATION AND COMMUNICATIONS tech-nologies (ICT) play a vital role in the facilitation of
trade in many types of services. Technological ad-vances and reductions in costs for ICT over time haveled to a greater opportunity for the remote provisionand procurement of services across international bor-ders. The desire to understand how these technologicalchanges may affect international trade in ICT servicesand of the services trade taking place over ICT net-works has led to increased interest in measuring suchtrade. This article builds on the international statisticalcommunity’s recent progress toward more preciselydefining the types of services that fall into these catego-ries. It presents statistics for 1999–2014 of U.S. trade inICT and potentially ICT-enabled services using statis-tics published by the Bureau of Economic Analysis(BEA) on international trade in services. In keepingwith the Bureau of Economic Analysis’s mission, thesestatistics promote a better understanding how U.S.companies engaged in services trade are reachingglobal markets. They also shed light on whether andhow companies have reconfigured their global valuechains over time in response to improvements in ICT.
This article updates and extends an earlier paper,“Trends in Digitally Enabled Trade in Services,1998–2010,” which featured estimates of ICT-enabledservices trade (referred in that article as “digitally en-abled” services trade) compiled from statistics pub-lished by BEA.1 This article refines the definition ofICT-enabled services used in the earlier article with theexpanded detail in trade in services resulting from thecomprehensive restructuring of the international eco-nomic accounts in 2014.2 It also introduces statisticson trade in ICT services and country-level statistics ontrade in potentially ICT-enabled services.
ICT services are those services that are used to facil-itate information processing and communication. ICTservices presented in this article include three catego-ries of services from BEA’s published statistics on inter-national trade in services: telecommunicationsservices, computer services, and charges for the use ofintellectual property associated with computer soft-ware (table A). ICT-enabled services are “services with
1. Maria Borga and Jennifer Koncz-Bruner. “Trends in Digitally EnabledTrade in Services, 1998–2010” (June 2012).
2. For more information, see Maria Borga and Kristy L. Howell, “TheComprehensive Restructuring of the International Economic Accounts:Changes in Definitions, Classifications, and Presentations,” SURVEY OF CUR-RENT BUSINESS 90 (March 2014).
outputs delivered remotely over ICT networks.”3 This
3. Timothy J. Sturgeon, Torbjörn Fredriksson, Scarlett Fondeur, andDiana Korka, International Trade in ICT Services and ICT-Enabled Ser-vices: Proposed Indicators from the Partnership on Measuring ICT forDevelopment (Geneva, Switzerland: United Nations Conference on Tradeand Development (UNCTAD) Division on Technology and Logistics, Sci-ence, Technology and ICT Branch, ICT Analysis Section, October 2015).
I
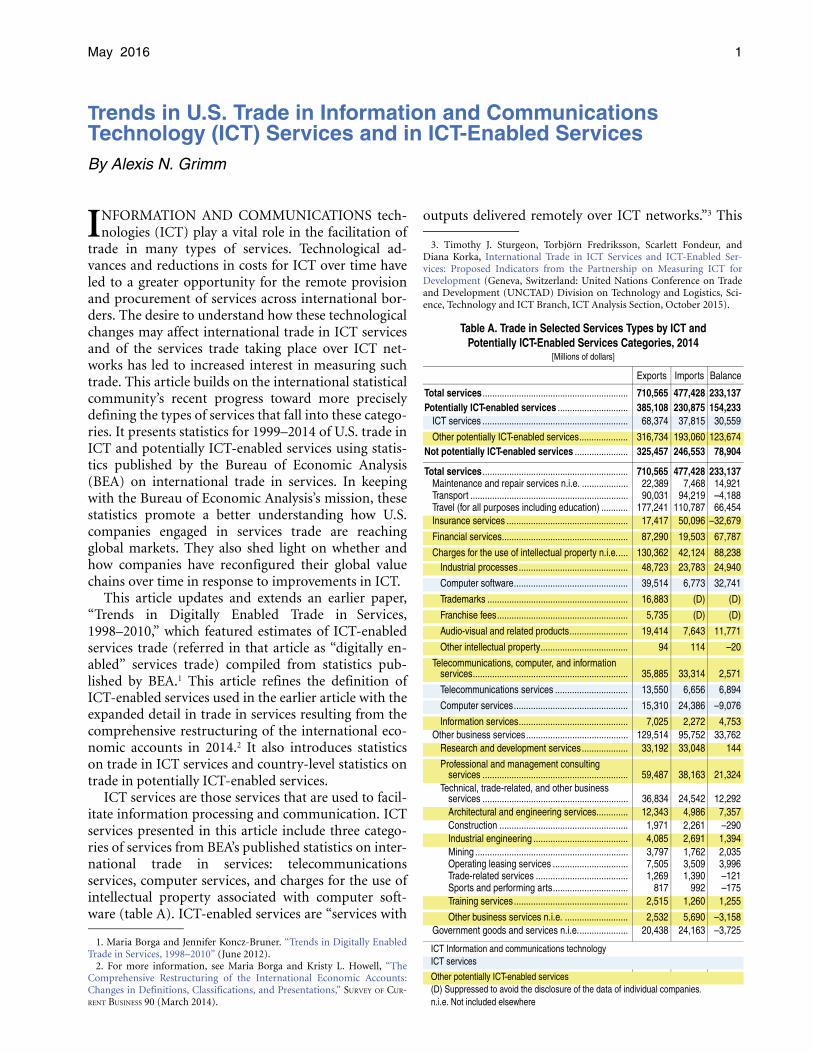
Table A. Trade in Selected Services Types by ICT andPotentially ICT-Enabled Services Categories, 2014
[Millions of dollars]
Exports Imports Balance
Total services ............................................................ 710,565 477,428 233,137Potentially ICT-enabled services ............................. 385,108 230,875 154,233
ICT services ............................................................ 68,374 37,815 30,559
Other potentially ICT-enabled services.................... 316,734 193,060 123,674Not potentially ICT-enabled services ...................... 325,457 246,553 78,904
Total services ............................................................ 710,565 477,428 233,137Maintenance and repair services n.i.e. ................... 22,389 7,468 14,921Transport ................................................................. 90,031 94,219 –4,188Travel (for all purposes including education) ........... 177,241 110,787 66,454Insurance services .................................................. 17,417 50,096 –32,679
Financial services.................................................... 87,290 19,503 67,787
Charges for the use of intellectual property n.i.e..... 130,362 42,124 88,238Industrial processes............................................. 48,723 23,783 24,940
Computer software............................................... 39,514 6,773 32,741
Trademarks .......................................................... 16,883 (D) (D)
Franchise fees...................................................... 5,735 (D) (D)
Audio-visual and related products........................ 19,414 7,643 11,771
Other intellectual property.................................... 94 114 –20
Telecommunications, computer, and information services................................................................ 35,885 33,314 2,571
Telecommunications services .............................. 13,550 6,656 6,894
Computer services............................................... 15,310 24,386 –9,076
Information services............................................. 7,025 2,272 4,753Other business services.......................................... 129,514 95,752 33,762
Research and development services................... 33,192 33,048 144
Professional and management consulting services ............................................................ 59,487 38,163 21,324
Technical, trade-related, and other business services ............................................................ 36,834 24,542 12,292Architectural and engineering services............. 12,343 4,986 7,357Construction ..................................................... 1,971 2,261 –290Industrial engineering ....................................... 4,085 2,691 1,394Mining ............................................................... 3,797 1,762 2,035Operating leasing services ............................... 7,505 3,509 3,996Trade-related services ...................................... 1,269 1,390 –121Sports and performing arts............................... 817 992 –175Training services............................................... 2,515 1,260 1,255
Other business services n.i.e. .......................... 2,532 5,690 –3,158Government goods and services n.i.e..................... 20,438 24,163 –3,725
ICT Information and communications technologyICT services
Other potentially ICT-enabled services(D) Suppressed to avoid the disclosure of the data of individual companies.n.i.e. Not included elsewhere
2 Trends in U.S. Trade in ICT Services May 2016
article also features a more broadly defined concept,potentially ICT-enabled services. For many types ofservices, the actual mode of delivery is unknown. Po-tentially ICT-enabled services include services typesthat can predominantly be delivered remotely over ICTnetworks without identifying the services that are de-livered over ICT networks. See the box, “Defining ICTand Potentially ICT-Enabled Trade in Services.” Statis-tics on potentially ICT-enabled services are composedof BEA’s published statistics on international trade ininsurance services; financial services; charges for theuse of intellectual property n.i.e.; telecommunications,computer, and information services; and certain otherservices included in other business services (table A).Potentially ICT-enabled services include ICT services.Before 2006, limited detail is available for statistics oncertain types of services trade. Consequently, ICT andpotentially ICT-enabled statistics for 1999–2005 arepartly based on estimates of subcomponents withinservices categories.4
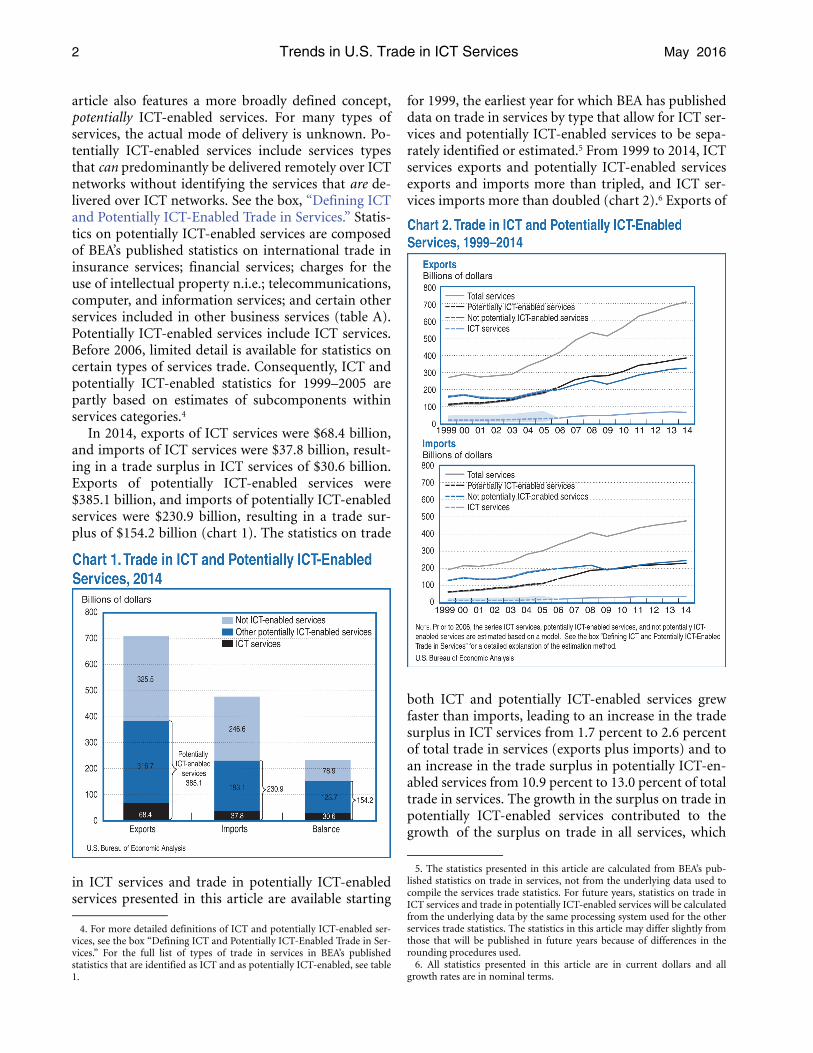
In 2014, exports of ICT services were $68.4 billion,and imports of ICT services were $37.8 billion, result-ing in a trade surplus in ICT services of $30.6 billion.Exports of potentially ICT-enabled services were$385.1 billion, and imports of potentially ICT-enabledservices were $230.9 billion, resulting in a trade sur-plus of $154.2 billion (chart 1). The statistics on trade
in ICT services and trade in potentially ICT-enabledservices presented in this article are available starting
4. For more detailed definitions of ICT and potentially ICT-enabled ser-vices, see the box “Defining ICT and Potentially ICT-Enabled Trade in Ser-vices.” For the full list of types of trade in services in BEA’s publishedstatistics that are identified as ICT and as potentially ICT-enabled, see table1.
for 1999, the earliest year for which BEA has publisheddata on trade in services by type that allow for ICT ser-vices and potentially ICT-enabled services to be sepa-rately identified or estimated.5 From 1999 to 2014, ICTservices exports and potentially ICT-enabled servicesexports and imports more than tripled, and ICT ser-vices imports more than doubled (chart 2).6 Exports of
both ICT and potentially ICT-enabled services grewfaster than imports, leading to an increase in the tradesurplus in ICT services from 1.7 percent to 2.6 percentof total trade in services (exports plus imports) and toan increase in the trade surplus in potentially ICT-en-abled services from 10.9 percent to 13.0 percent of totaltrade in services. The growth in the surplus on trade inpotentially ICT-enabled services contributed to thegrowth of the surplus on trade in all services, which
5. The statistics presented in this article are calculated from BEA’s pub-lished statistics on trade in services, not from the underlying data used tocompile the services trade statistics. For future years, statistics on trade inICT services and trade in potentially ICT-enabled services will be calculatedfrom the underlying data by the same processing system used for the otherservices trade statistics. The statistics in this article may differ slightly fromthose that will be published in future years because of differences in therounding procedures used.
6. All statistics presented in this article are in current dollars and allgrowth rates are in nominal terms.
May 2016 SURVEY OF CURRENT BUSINESS 3
increased from 16.9 percent to 19.6 percent of totaltrade in services over the same period.
This article describes trade in ICT services and inpotentially ICT-enabled services in 2014 and examinestrends in these series from 1999. First, overall trade isdiscussed, followed by a discussion of U.S. trade in ICTand potentially ICT-enabled services by partner coun-try. Summary statistics are provided in each section.For additional statistics, see tables 1–8 that follow thisarticle. The following are key findings identified in thisarticle:
● From the early 2000s to 2008, trade in ICT andpotentially ICT-enabled services grew most rapidly.Growth slowed considerably in 2009, reflecting thebroader economic slowdown and then resumed in2010 for exports and in 2011 for imports beforestarting to slow again in 2012. Exports and importsof ICT services contracted in 2014.
● In 2014, the majority of trade in ICT services wasbetween affiliated trading partners, and the major-ity of trade in potentially ICT-enabled services wasbetween unaffiliated trading partners.
● In 2014, Europe accounted for the most exports ofICT services, exports of potentially ICT-enabledservices, and imports of potentially ICT-enabledservices by region. Asia and Pacific accounted forthe most imports of ICT services.
● In 2014, the United States had trade surpluses inICT services with every region except the MiddleEast and with all regions in potentially ICT-enabledservices. The largest trade surpluses in ICT serviceswere with Europe and Latin America and OtherWestern Hemisphere. The largest surpluses inpotentially ICT-enabled services were with Europeand Asia and Pacific.
U.S. Exports
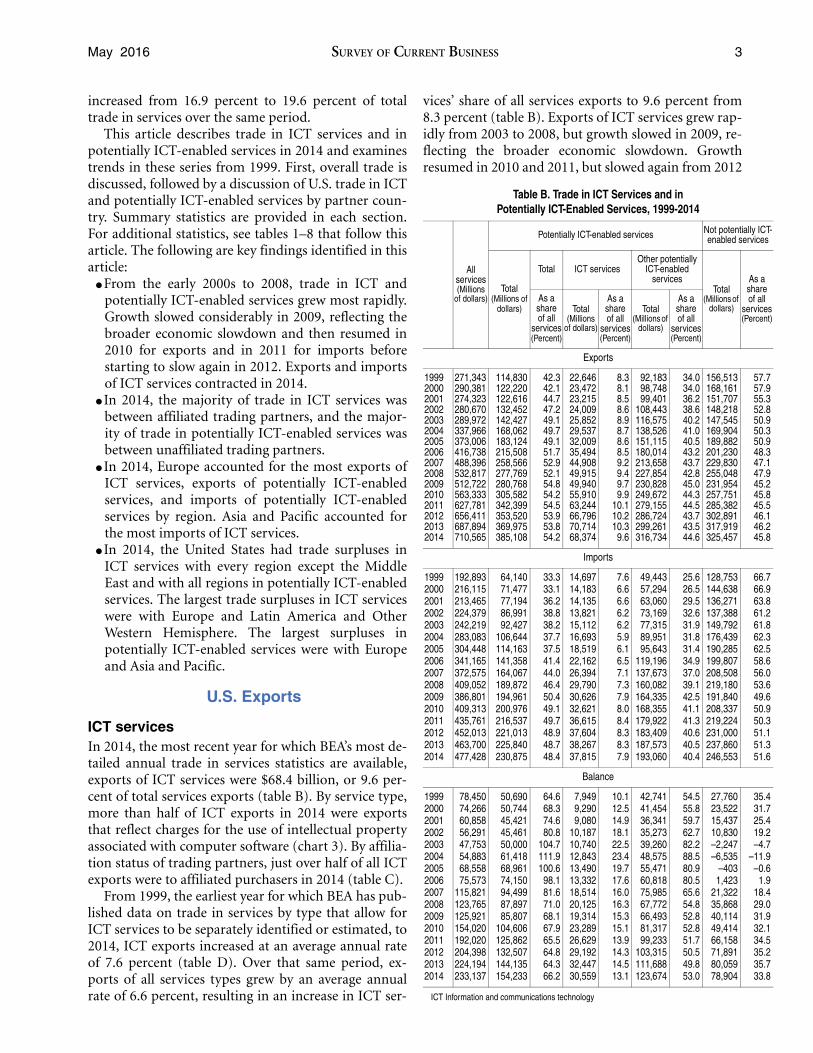
ICT servicesIn 2014, the most recent year for which BEA’s most de-tailed annual trade in services statistics are available,exports of ICT services were $68.4 billion, or 9.6 per-cent of total services exports (table B). By service type,more than half of ICT exports in 2014 were exportsthat reflect charges for the use of intellectual propertyassociated with computer software (chart 3). By affilia-tion status of trading partners, just over half of all ICTexports were to affiliated purchasers in 2014 (table C).
From 1999, the earliest year for which BEA has pub-lished data on trade in services by type that allow forICT services to be separately identified or estimated, to2014, ICT exports increased at an average annual rateof 7.6 percent (table D). Over that same period, ex-ports of all services types grew by an average annualrate of 6.6 percent, resulting in an increase in ICT ser-
vices’ share of all services exports to 9.6 percent from8.3 percent (table B). Exports of ICT services grew rap-idly from 2003 to 2008, but growth slowed in 2009, re-flecting the broader economic slowdown. Growthresumed in 2010 and 2011, but slowed again from 2012
Table B. Trade in ICT Services and inPotentially ICT-Enabled Services, 1999-2014
All services(Millions
of dollars)
Potentially ICT-enabled services Not potentially ICT-enabled services
Total(Millions of
dollars)
Total ICT servicesOther potentially
ICT-enabled services
Total(Millions of
dollars)
As a shareof all
services(Percent)
As a shareof all
services (Percent)
Total(Millions
of dollars)
As a shareof all
services(Percent)
Total(Millions of
dollars)
As a shareof all
services(Percent)
Exports
1999 271,343 114,830 42.3 22,646 8.3 92,183 34.0 156,513 57.72000 290,381 122,220 42.1 23,472 8.1 98,748 34.0 168,161 57.92001 274,323 122,616 44.7 23,215 8.5 99,401 36.2 151,707 55.32002 280,670 132,452 47.2 24,009 8.6 108,443 38.6 148,218 52.82003 289,972 142,427 49.1 25,852 8.9 116,575 40.2 147,545 50.92004 337,966 168,062 49.7 29,537 8.7 138,526 41.0 169,904 50.32005 373,006 183,124 49.1 32,009 8.6 151,115 40.5 189,882 50.92006 416,738 215,508 51.7 35,494 8.5 180,014 43.2 201,230 48.32007 488,396 258,566 52.9 44,908 9.2 213,658 43.7 229,830 47.12008 532,817 277,769 52.1 49,915 9.4 227,854 42.8 255,048 47.92009 512,722 280,768 54.8 49,940 9.7 230,828 45.0 231,954 45.22010 563,333 305,582 54.2 55,910 9.9 249,672 44.3 257,751 45.82011 627,781 342,399 54.5 63,244 10.1 279,155 44.5 285,382 45.52012 656,411 353,520 53.9 66,796 10.2 286,724 43.7 302,891 46.12013 687,894 369,975 53.8 70,714 10.3 299,261 43.5 317,919 46.22014 710,565 385,108 54.2 68,374 9.6 316,734 44.6 325,457 45.8
Imports
1999 192,893 64,140 33.3 14,697 7.6 49,443 25.6 128,753 66.72000 216,115 71,477 33.1 14,183 6.6 57,294 26.5 144,638 66.92001 213,465 77,194 36.2 14,135 6.6 63,060 29.5 136,271 63.82002 224,379 86,991 38.8 13,821 6.2 73,169 32.6 137,388 61.22003 242,219 92,427 38.2 15,112 6.2 77,315 31.9 149,792 61.82004 283,083 106,644 37.7 16,693 5.9 89,951 31.8 176,439 62.32005 304,448 114,163 37.5 18,519 6.1 95,643 31.4 190,285 62.52006 341,165 141,358 41.4 22,162 6.5 119,196 34.9 199,807 58.62007 372,575 164,067 44.0 26,394 7.1 137,673 37.0 208,508 56.02008 409,052 189,872 46.4 29,790 7.3 160,082 39.1 219,180 53.62009 386,801 194,961 50.4 30,626 7.9 164,335 42.5 191,840 49.62010 409,313 200,976 49.1 32,621 8.0 168,355 41.1 208,337 50.92011 435,761 216,537 49.7 36,615 8.4 179,922 41.3 219,224 50.32012 452,013 221,013 48.9 37,604 8.3 183,409 40.6 231,000 51.12013 463,700 225,840 48.7 38,267 8.3 187,573 40.5 237,860 51.32014 477,428 230,875 48.4 37,815 7.9 193,060 40.4 246,553 51.6
Balance
1999 78,450 50,690 64.6 7,949 10.1 42,741 54.5 27,760 35.42000 74,266 50,744 68.3 9,290 12.5 41,454 55.8 23,522 31.72001 60,858 45,421 74.6 9,080 14.9 36,341 59.7 15,437 25.42002 56,291 45,461 80.8 10,187 18.1 35,273 62.7 10,830 19.22003 47,753 50,000 104.7 10,740 22.5 39,260 82.2 –2,247 –4.72004 54,883 61,418 111.9 12,843 23.4 48,575 88.5 –6,535 –11.92005 68,558 68,961 100.6 13,490 19.7 55,471 80.9 –403 –0.62006 75,573 74,150 98.1 13,332 17.6 60,818 80.5 1,423 1.92007 115,821 94,499 81.6 18,514 16.0 75,985 65.6 21,322 18.42008 123,765 87,897 71.0 20,125 16.3 67,772 54.8 35,868 29.02009 125,921 85,807 68.1 19,314 15.3 66,493 52.8 40,114 31.92010 154,020 104,606 67.9 23,289 15.1 81,317 52.8 49,414 32.12011 192,020 125,862 65.5 26,629 13.9 99,233 51.7 66,158 34.52012 204,398 132,507 64.8 29,192 14.3 103,315 50.5 71,891 35.22013 224,194 144,135 64.3 32,447 14.5 111,688 49.8 80,059 35.72014 233,137 154,233 66.2 30,559 13.1 123,674 53.0 78,904 33.8
ICT Information and communications technology

4 Trends in U.S. Trade in ICT Services May 2016
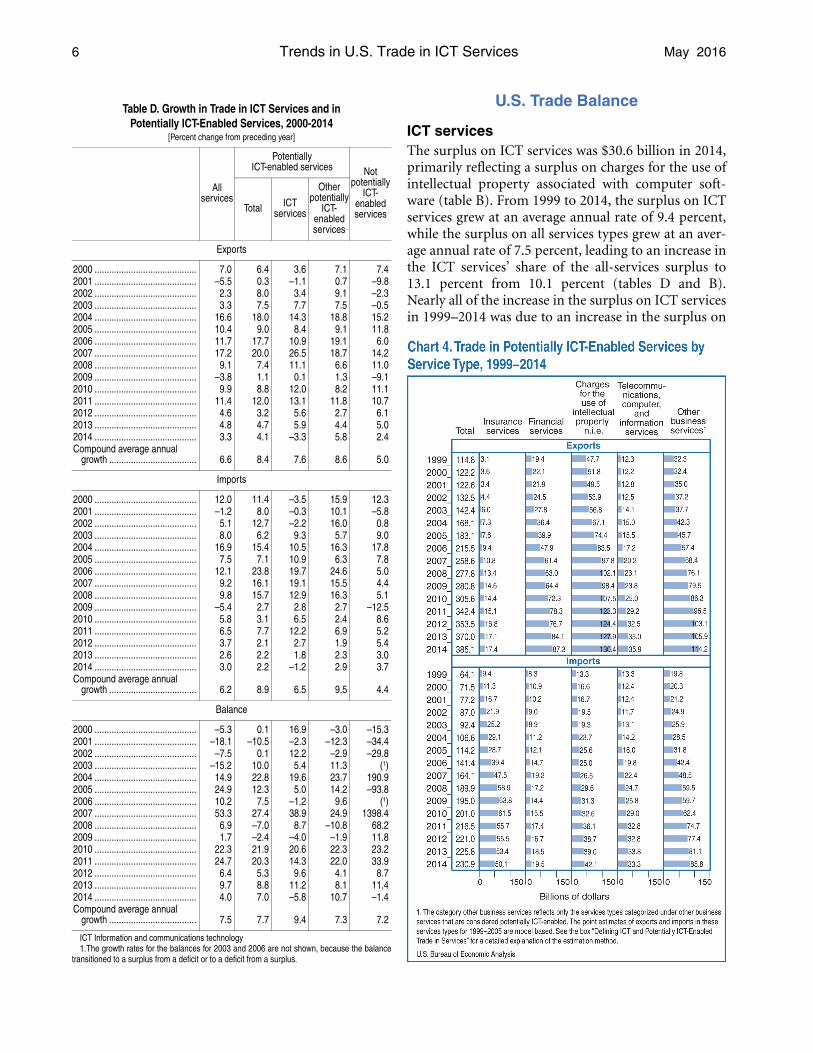
to 2013. ICT exports contracted in 2014. More thanhalf of the increase in ICT exports from 1999–2014was in exports that reflect charges for the use of intel-lectual property associated with computer software,which more than tripled over that period (chart 3).
Potentially ICT-enabled servicesExports of potentially ICT-enabled services were$385.1 billion in 2014, accounting for 54.2 percent oftotal services exports (table B). The services categories
with the largest potentially ICT-enabled exports in2014 were exports that reflect charges for the use of in-tellectual property n.i.e. and the potentially ICT-en-abled services types categorized under other businessservices (chart 4). In 2014, 50.5 percent of potentiallyICT-enabled exports were to affiliated trading partners(table C).7
From 1999 to 2014, potentially ICT-enabled exportsgrew at an average annual rate of 8.4 percent (table D).Exports of not potentially ICT-enabled services, whichmainly consist of travel (for all purposes including ed-ucation), transport, maintenance and repair servicesn.i.e., and government goods and services n.i.e., grewat an average annual rate of 5.0 percent over the sameperiod, resulting in an increase in potentially ICT-en-abled services’ share of all services exports to 54.2 per-cent from 42.3 percent. Most of this growth was in thefirst half of the period; growth slowed in 2009 but re-sumed in 2010 and 2011, before slowing again from2012 to 2014.
Among the major categories of services, the largestincreases in potentially ICT-enabled services exportsfor 1999–2014 were in charges for the use of intellec-tual property n.i.e., the potentially ICT-enabled por-tion of other business services, and in financial services(chart 4). The major categories with the fastest averageannual rates of growth over the same period were in-surance services (12.3 percent) and financial services(10.5 percent) (table 1).
7. In addition to the services types included in potentially ICT-enabledservices for the trade by all affiliation types, the statistics by affiliation alsoinclude trade-related services, sports and performing arts, and mining,which cannot be disaggregated from the potentially ICT-enabled services inthe category “other” technical, trade-related, and other business services(lines 58 and 117 of international services table 2.3). In 2014, the total ofthese three categories for all countries accounted for 53.8 percent of the cat-egory “other” technical, trade-related, and other business services exportsand 1.5 percent of potentially ICT-enabled services exports; for imports,these shares were 37.4 percent and 1.8 percent, respectively.
Data AvailabilityTables A–E and 1–8 presented in this article are avail-able in an Excel file on BEA’s Web site. Statistics onICT services and potentially ICT-enabled services for2015 will be released in October 2016 when BEA pub-lishes its most detailed annual statistics for U.S. inter-national services. The statistics presented in thisarticle for 2013 and 2014 will also be revised at thattime.

May 2016 SURVEY OF CURRENT BUSINESS 5
U.S. Imports
ICT servicesImports of ICT services were $37.8 billion, accountingfor 7.9 percent of total services imports in 2014 (tableB). Nearly two-thirds of ICT imports were in com-puter services (chart 3). Seventy percent of all ICT im-ports were from affiliated trading partners (table C).
From 1999 to 2014, ICT imports grew at an averageannual rate of 6.5 percent, while imports of all servicestypes grew at an average annual rate of 6.2 percent,leading to a slight increase in the share of ICT servicesimports of all services imports to 7.9 percent from 7.6percent (tables D and B). ICT imports more than dou-bled from 2002 to 2008, but their growth slowed in2009. As with growth in ICT exports, after increasingfrom 2010 to 2011, growth in ICT imports againslowed from 2012 to 2013 and ICT imports contractedin 2014. More than 80 percent of the increase in ICTimports over the period 1999–2014 was due to an in-crease in imports of computer services, and the re-mainder was more than accounted for by an increasein imports that reflected charges for the use of com-puter software. Imports of telecommunications ser-vices contracted between 1999 and 2014 (chart 3).
Potentially ICT-enabled servicesIn 2014, imports of potentially ICT-enabled serviceswere $230.9 billion, accounting for 48.4 percent of to-
tal services imports (table B). The potentially ICT-en-abled services in other business services and insuranceservices combined for more than half of total poten-tially ICT-enabled services imports (chart 4). In 2014,52.9 percent of potentially ICT-enabled imports werefrom unaffiliated trading partners (table C).
From 1999 to 2014, potentially ICT-enabled im-ports grew at an average annual rate of 8.9 percent,while imports of not potentially ICT-enabled servicesgrew at an average annual rate of 4.4 percent, resultingin an increase in potentially ICT-enabled services’share of all services imports to 48.4 percent from 33.3percent (tables D and B). Growth was most rapid in2004–2008, then slowed in 2009–2010, reflecting thebroader economic slowdown. Growth resumed in2011, but again slowed from 2012 to 2014.
Other business services and insurance servicestogether accounted for nearly two-thirds of the in-crease in potentially ICT-enabled services imports in1999–2014 (chart 4). They also were the categorieswith the most rapid growth over the same period; in-surance grew at an average annual rate of 11.8 percent,and the potentially ICT-enabled services in other busi-ness services—research and development services,professional and management consulting services, ar-chitectural and engineering services, industrial engi-neering, training services, and other business servicesn.i.e.—collectively grew at an average annual rate of10.4 percent (table 2).
Table C. Trade in ICT Services and in Potentially ICT-Enabled Services by Affiliation, 2006-2014
Total services Unaffiliated Affiliated
Level(Millions of dollars)
Average annual growth
(Percent)
Level(Millions of dollars)
Average annual growth
(Percent)
Level(Millions of dollars)
Average annual growth
(Percent)
2006 2014 2006–2014 2006 2014 2006–
2014 2006 2014 2006–2014
Total services exports .......................................................................................... 416,738 710,565 6.9 307,679 512,848 6.6 109,058 197,718 7.7ICT services............................................................................................................ 35,494 68,374 8.5 17,487 31,693 7.7 18,009 36,681 9.3Potentially ICT-enabled services ............................................................................. 215,508 385,108 7.5 n.a. n.a. n.a. n.a. n.a. n.a.
Insurance services 1............................................................................................ 9,445 17,417 7.9 9,445 17,417 7.9 ............. ............. ...........Financial services................................................................................................ 47,882 87,290 7.8 37,283 69,649 8.1 10,599 17,641 6.6Charges for the use of intellectual property n.i.e. ................................................ 83,549 130,362 5.7 28,276 47,962 6.8 55,273 82,400 5.1Telecommunications, computer, and information services 2................................ 17,184 35,885 9.6 12,451 20,233 6.3 4,733 15,652 16.1Potentially ICT-enabled services in other business services ............................... 57,448 114,154 9.0 n.a. n.a. n.a. n.a. n.a. n.a.
Total services imports.......................................................................................... 341,165 477,428 4.3 272,413 345,917 3.0 68,751 131,510 8.4ICT services............................................................................................................ 22,162 37,815 6.9 8,200 11,345 4.1 13,963 26,471 8.3Potentially ICT-enabled services ............................................................................. 141,358 230,875 6.3 n.a. n.a. n.a. n.a. n.a. n.a.
Insurance services 1............................................................................................ 39,382 50,096 3.1 39,382 50,096 3.1 ............. ............. ...........Financial services................................................................................................ 14,733 19,503 3.6 8,139 11,230 4.1 6,594 8,272 2.9Charges for the use of intellectual property n.i.e. ................................................ 25,038 42,124 6.7 7,175 13,816 8.5 17,863 28,309 5.9Telecommunications, computer, and information services 2................................ 19,776 33,314 6.7 7,754 10,985 4.5 12,023 22,328 8.0Potentially ICT-enabled services in other business services ............................... 42,429 85,838 9.2 n.a. n.a. n.a. n.a. n.a. n.a.
n.a. not available..... Not applicableICT Information and communications technologyn.i.e. Not included elsewhere1. Insurance services transactions are considered to be unaffiliated even when they are
between affiliated companies because the services are considered to be provided to the policy-holders who pay the insurance premiums and who are unaffiliated with either company. Theonly insurance services considered to be affiliated are primary insurance transactions between
a U.S. company that is not an insurance company and an affiliated foreign insurance company,such as a captive foreign insurance affiliate. Data on these affiliated insurance services are notseparately available.
2.Transactions in basic telecommunications services are considered to be unaffiliated, evenwhen the services flow through affiliated channels, because they represent the distribution ofrevenues collected from unaffiliated customers. Other types of telecommunications services,such as value-added services, may flow through either affiliated or unaffiliated channels, andare recorded accordingly.
6 Trends in U.S. Trade in ICT Services May 2016
U.S. Trade Balance
ICT servicesThe surplus on ICT services was $30.6 billion in 2014,primarily reflecting a surplus on charges for the use ofintellectual property associated with computer soft-ware (table B). From 1999 to 2014, the surplus on ICTservices grew at an average annual rate of 9.4 percent,while the surplus on all services types grew at an aver-age annual rate of 7.5 percent, leading to an increase inthe ICT services’ share of the all-services surplus to13.1 percent from 10.1 percent (tables D and B).Nearly all of the increase in the surplus on ICT servicesin 1999–2014 was due to an increase in the surplus on
Table D. Growth in Trade in ICT Services and in Potentially ICT-Enabled Services, 2000-2014
[Percent change from preceding year]
All services
PotentiallyICT-enabled services Not
potentially ICT-
enabled servicesTotal ICT
services
Other potentially
ICT-enabled services
Exports
2000 .......................................... 7.0 6.4 3.6 7.1 7.42001 .......................................... –5.5 0.3 –1.1 0.7 –9.82002 .......................................... 2.3 8.0 3.4 9.1 –2.32003 .......................................... 3.3 7.5 7.7 7.5 –0.52004 .......................................... 16.6 18.0 14.3 18.8 15.22005 .......................................... 10.4 9.0 8.4 9.1 11.82006 .......................................... 11.7 17.7 10.9 19.1 6.02007 .......................................... 17.2 20.0 26.5 18.7 14.22008 .......................................... 9.1 7.4 11.1 6.6 11.02009 .......................................... –3.8 1.1 0.1 1.3 –9.12010 .......................................... 9.9 8.8 12.0 8.2 11.12011 .......................................... 11.4 12.0 13.1 11.8 10.72012 .......................................... 4.6 3.2 5.6 2.7 6.12013 .......................................... 4.8 4.7 5.9 4.4 5.02014 .......................................... 3.3 4.1 –3.3 5.8 2.4Compound average annual
growth .................................... 6.6 8.4 7.6 8.6 5.0
Imports
2000 .......................................... 12.0 11.4 –3.5 15.9 12.32001 .......................................... –1.2 8.0 –0.3 10.1 –5.82002 .......................................... 5.1 12.7 –2.2 16.0 0.82003 .......................................... 8.0 6.2 9.3 5.7 9.02004 .......................................... 16.9 15.4 10.5 16.3 17.82005 .......................................... 7.5 7.1 10.9 6.3 7.82006 .......................................... 12.1 23.8 19.7 24.6 5.02007 .......................................... 9.2 16.1 19.1 15.5 4.42008 .......................................... 9.8 15.7 12.9 16.3 5.12009 .......................................... –5.4 2.7 2.8 2.7 –12.52010 .......................................... 5.8 3.1 6.5 2.4 8.62011 .......................................... 6.5 7.7 12.2 6.9 5.22012 .......................................... 3.7 2.1 2.7 1.9 5.42013 .......................................... 2.6 2.2 1.8 2.3 3.02014 .......................................... 3.0 2.2 –1.2 2.9 3.7Compound average annual
growth .................................... 6.2 8.9 6.5 9.5 4.4
Balance
2000 .......................................... –5.3 0.1 16.9 –3.0 –15.32001 .......................................... –18.1 –10.5 –2.3 –12.3 –34.42002 .......................................... –7.5 0.1 12.2 –2.9 –29.82003 .......................................... –15.2 10.0 5.4 11.3 (1)2004 .......................................... 14.9 22.8 19.6 23.7 190.92005 .......................................... 24.9 12.3 5.0 14.2 –93.82006 .......................................... 10.2 7.5 –1.2 9.6 (1)2007 .......................................... 53.3 27.4 38.9 24.9 1398.42008 .......................................... 6.9 –7.0 8.7 –10.8 68.22009 .......................................... 1.7 –2.4 –4.0 –1.9 11.82010 .......................................... 22.3 21.9 20.6 22.3 23.22011 .......................................... 24.7 20.3 14.3 22.0 33.92012 .......................................... 6.4 5.3 9.6 4.1 8.72013 .......................................... 9.7 8.8 11.2 8.1 11.42014 .......................................... 4.0 7.0 –5.8 10.7 –1.4Compound average annual
growth .................................... 7.5 7.7 9.4 7.3 7.2
ICT Information and communications technology1.The growth rates for the balances for 2003 and 2006 are not shown, because the balance
transitioned to a surplus from a deficit or to a deficit from a surplus.
May 2016 SURVEY OF CURRENT BUSINESS 7
charges for the use of intellectual property associatedwith computer software. Over the same period, thebalance of trade in telecommunications servicesshifted from a deficit to a surplus, and the deficit oncomputer services grew.
Potentially ICT-enabled servicesIn 2014, the surplus on potentially ICT-enabled ser-vices was $154.2 billion, primarily reflecting surpluseson charges for the use of intellectual property n.i.e., fi-nancial services, and the potentially ICT-enabled com-ponents in other business services (table B). A deficiton insurance services was partly offsetting. From 1999to 2014, the surplus on potentially ICT-enabled ser-vices grew at an average annual rate of 7.7 percent,while the surplus on imports of not potentially ICT-enabled services grew at an average annual rate of 7.2percent, resulting in a slight increase in the potentiallyICT-enabled services’ share of the surplus on total ser-vices to 66.2 percent from 64.6 percent (tables D andB). An increase in the surpluses on financial servicesand on charges for the use of intellectual property n.i.e.more than accounted for the increase in the surplus onpotentially ICT-enabled services.
ICT and ICT-Enabled Services by Partner Country
The share of total services trade in ICT and potentiallyICT-enabled services exports and imports varies by re-gion and by country. BEA’s statistics on potentiallyICT-enabled services by country use a slightly differentdefinition of potentially ICT-enabled services than for
the all-country totals in the previous section becauseless detail is available by service type in BEA’s pub-lished statistics of trade in services by country.8 Forcountries for which one or more of the components ofICT or potentially ICT-enabled services exports or im-ports was suppressed to avoid the disclosure of data ofindividual companies, a range of possible values wascalculated to rank the value of ICT and potentially ICTservices exports and imports for all countries whoseU.S. exports and imports of services are separatelypublished by BEA.9
8. In addition to those services types included in potentially ICT-enabledservices for the trade with all countries statistics, the statistics by partnercountry also include trade-related services, sports and performing arts, andmining, which cannot be disaggregated from the potentially ICT-enabledservices in the category “other” technical, trade-related, and other businessservices (lines 58 and 117 of international services table 2.3). In 2014, thetotal of these three categories for all countries accounted for 53.8 percent ofthe category “other” technical, trade-related, and other business servicesexports and 1.5 percent of potentially ICT-enabled services exports. Forimports these shares were 37.4 percent and 1.8 percent, respectively.
9. ICT and potentially ICT-enabled statistics have more suppressions thansome other BEA datasets because the suppression procedures applied to thecomponents did not account for the eventuality that the ICT and poten-tially ICT-enabled totals would be published. In most cases the categoriesthat are suppressed are relatively small parts of the total. For countrieswhere one or more components are suppressed, charts 6, 9, 12, and 14–16include an upper bound and lower bound that establish a range of possiblevalues. The lower bound is equal to the sum of the unsuppressed servicestypes included in ICT or potentially ICT-enabled services that appear incharts 6, 9, 12, and 14–16. The upper bound is calculated as the sum of theparent category of the suppressed component less any unsuppressed sub-categories of that parent that are not considered ICT or potentially ICT-enabled services trade in charts 6, 9, 12, and 14–16. The lower bound isused to rank each country’s total ICT services and potentially ICT-enabledservices trade in charts 6–14. More sophisticated methods for determiningthe lower and upper bounds exist and may have served to tighten the rangeof the bounds, but these were not used to compile these charts.
Many countries do not compile statistics at the level ofdetail needed to calculate ICT services or potentially ICT-enabled services trade statistics. In addition, in recentyears, many countries have restructured their trade inservices statistics to conform more closely with the“Extended Balance of Payments Services Classification”presented in the updated Manual on Statistics of Interna-tional Trade in Services 2010, thus limiting the compara-bility of statistics for recent years with those for olderyears. Despite these limitations, data on trade in servicescollected by the Organisation for Economic Co-opera-tion and Development (OECD) from its member coun-tries were used to calculate comparable estimates of ICTand potentially ICT-enabled trade for 2010-2014 for a setof countries that accounted for 67 percent of worldexports and 58 percent of world imports in 2014.1 Forthese countries, 50 percent of exports and 46 percent ofimports were potentially ICT-enabled in 2014, anincrease in both shares from 47 percent of exports and 43
percent of imports in 2010. These figures suggest that theshare of global trade in services accounted for by poten-tially ICT-enabled trade has increased over this period.The shares for other countries are lower than the sharesfor the United States, which remained at 54 percent forexports in 2014 and 2010,and decreased slightly to 48percent in 2014 from 49 percent in 2010 for imports.
1. The countries included in this comparison are Australia, Canada,the European Union (28 member countries), Hong Kong, Israel, theRepublic of Korea, New Zealand, Russia, and the United States. Theshares of world exports and imports for this set of countries were calcu-lated using the World Trade Organization’s 2015 international trade inservices statistics. Potentially ICT-enabled services exports and importswere calculated for these countries using statistics available in theOECD.stat database on trade in services by partner country as the sumof the following services type categories: insurance and pension ser-vices; financial services; charges for the use of intellectual propertyn.i.e.; telecommunications, computer, and information services;research and development services; professional and management con-sulting services; architectural, engineering, scientific and other techni-cal services; and other business services n.i.e.
Worldwide Trends in ICT-Enabled Trade in Services
8 Trends in U.S. Trade in ICT Services May 2016
U.S. exports
ICT services
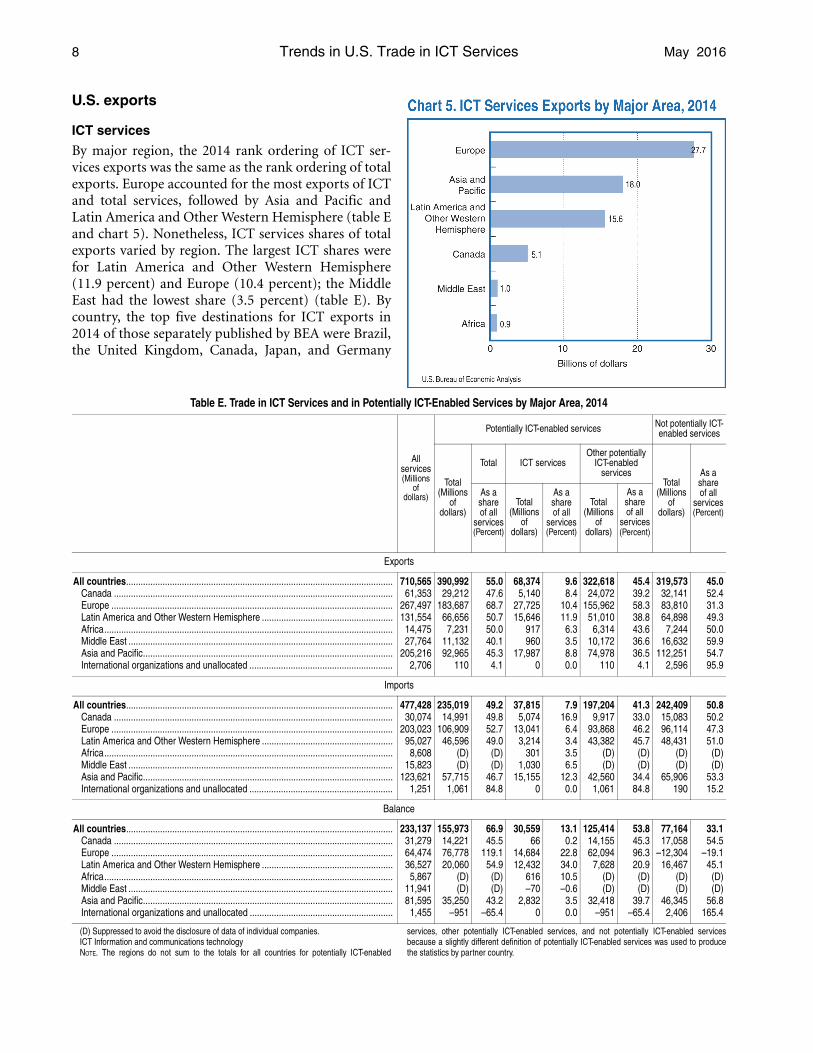
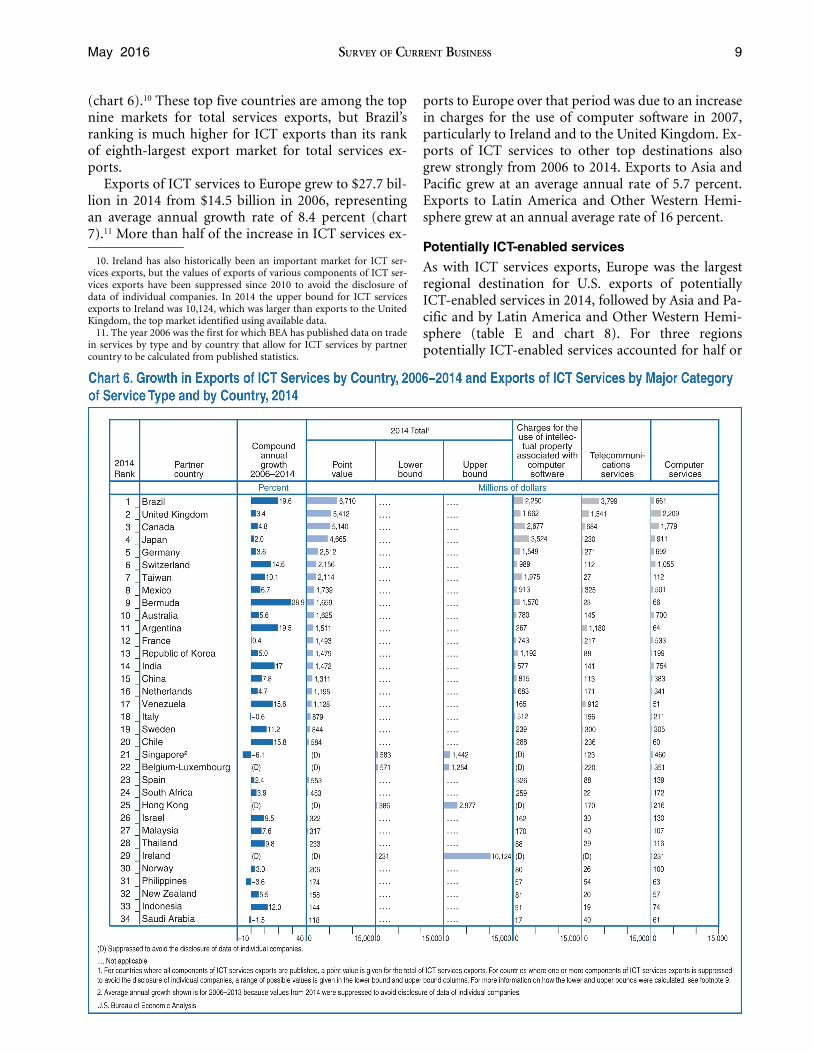
By major region, the 2014 rank ordering of ICT ser-vices exports was the same as the rank ordering of totalexports. Europe accounted for the most exports of ICTand total services, followed by Asia and Pacific andLatin America and Other Western Hemisphere (table Eand chart 5). Nonetheless, ICT services shares of totalexports varied by region. The largest ICT shares werefor Latin America and Other Western Hemisphere(11.9 percent) and Europe (10.4 percent); the MiddleEast had the lowest share (3.5 percent) (table E). Bycountry, the top five destinations for ICT exports in2014 of those separately published by BEA were Brazil,the United Kingdom, Canada, Japan, and Germany
Table E. Trade in ICT Services and in Potentially ICT-Enabled Services by Major Area, 2014
All services(Millions
ofdollars)
Potentially ICT-enabled services Not potentially ICT-enabled services
Total(Millions
ofdollars)
Total ICT servicesOther potentially
ICT-enabled services
Total(Millions
ofdollars)
As a share of all
services(Percent)
As a share of all
services(Percent)
Total(Millions
ofdollars)
As a share of all
services(Percent)
Total(Millions
of dollars)
As a share of all
services(Percent)
Exports
All countries.............................................................................................................. 710,565 390,992 55.0 68,374 9.6 322,618 45.4 319,573 45.0Canada ................................................................................................................... 61,353 29,212 47.6 5,140 8.4 24,072 39.2 32,141 52.4Europe .................................................................................................................... 267,497 183,687 68.7 27,725 10.4 155,962 58.3 83,810 31.3Latin America and Other Western Hemisphere ...................................................... 131,554 66,656 50.7 15,646 11.9 51,010 38.8 64,898 49.3Africa....................................................................................................................... 14,475 7,231 50.0 917 6.3 6,314 43.6 7,244 50.0Middle East ............................................................................................................. 27,764 11,132 40.1 960 3.5 10,172 36.6 16,632 59.9Asia and Pacific....................................................................................................... 205,216 92,965 45.3 17,987 8.8 74,978 36.5 112,251 54.7International organizations and unallocated ........................................................... 2,706 110 4.1 0 0.0 110 4.1 2,596 95.9
Imports
All countries.............................................................................................................. 477,428 235,019 49.2 37,815 7.9 197,204 41.3 242,409 50.8Canada ................................................................................................................... 30,074 14,991 49.8 5,074 16.9 9,917 33.0 15,083 50.2Europe .................................................................................................................... 203,023 106,909 52.7 13,041 6.4 93,868 46.2 96,114 47.3Latin America and Other Western Hemisphere ...................................................... 95,027 46,596 49.0 3,214 3.4 43,382 45.7 48,431 51.0Africa....................................................................................................................... 8,608 (D) (D) 301 3.5 (D) (D) (D) (D)Middle East ............................................................................................................. 15,823 (D) (D) 1,030 6.5 (D) (D) (D) (D)Asia and Pacific....................................................................................................... 123,621 57,715 46.7 15,155 12.3 42,560 34.4 65,906 53.3International organizations and unallocated ........................................................... 1,251 1,061 84.8 0 0.0 1,061 84.8 190 15.2
Balance
All countries.............................................................................................................. 233,137 155,973 66.9 30,559 13.1 125,414 53.8 77,164 33.1Canada ................................................................................................................... 31,279 14,221 45.5 66 0.2 14,155 45.3 17,058 54.5Europe .................................................................................................................... 64,474 76,778 119.1 14,684 22.8 62,094 96.3 –12,304 –19.1Latin America and Other Western Hemisphere ...................................................... 36,527 20,060 54.9 12,432 34.0 7,628 20.9 16,467 45.1Africa....................................................................................................................... 5,867 (D) (D) 616 10.5 (D) (D) (D) (D)Middle East ............................................................................................................. 11,941 (D) (D) –70 –0.6 (D) (D) (D) (D)Asia and Pacific....................................................................................................... 81,595 35,250 43.2 2,832 3.5 32,418 39.7 46,345 56.8International organizations and unallocated ........................................................... 1,455 –951 –65.4 0 0.0 –951 –65.4 2,406 165.4
(D) Suppressed to avoid the disclosure of data of individual companies.ICT Information and communications technologyNOTE. The regions do not sum to the totals for all countries for potentially ICT-enabled
services, other potentially ICT-enabled services, and not potentially ICT-enabled servicesbecause a slightly different definition of potentially ICT-enabled services was used to producethe statistics by partner country.
May 2016 SURVEY OF CURRENT BUSINESS 9
(chart 6).10 These top five countries are among the topnine markets for total services exports, but Brazil’sranking is much higher for ICT exports than its rankof eighth-largest export market for total services ex-ports.
Exports of ICT services to Europe grew to $27.7 bil-lion in 2014 from $14.5 billion in 2006, representingan average annual growth rate of 8.4 percent (chart7).11 More than half of the increase in ICT services ex-
10. Ireland has also historically been an important market for ICT ser-vices exports, but the values of exports of various components of ICT ser-vices exports have been suppressed since 2010 to avoid the disclosure ofdata of individual companies. In 2014 the upper bound for ICT servicesexports to Ireland was 10,124, which was larger than exports to the UnitedKingdom, the top market identified using available data.
11. The year 2006 was the first for which BEA has published data on tradein services by type and by country that allow for ICT services by partnercountry to be calculated from published statistics.
ports to Europe over that period was due to an increasein charges for the use of computer software in 2007,particularly to Ireland and to the United Kingdom. Ex-ports of ICT services to other top destinations alsogrew strongly from 2006 to 2014. Exports to Asia andPacific grew at an average annual rate of 5.7 percent.Exports to Latin America and Other Western Hemi-sphere grew at an annual average rate of 16 percent.
Potentially ICT-enabled services
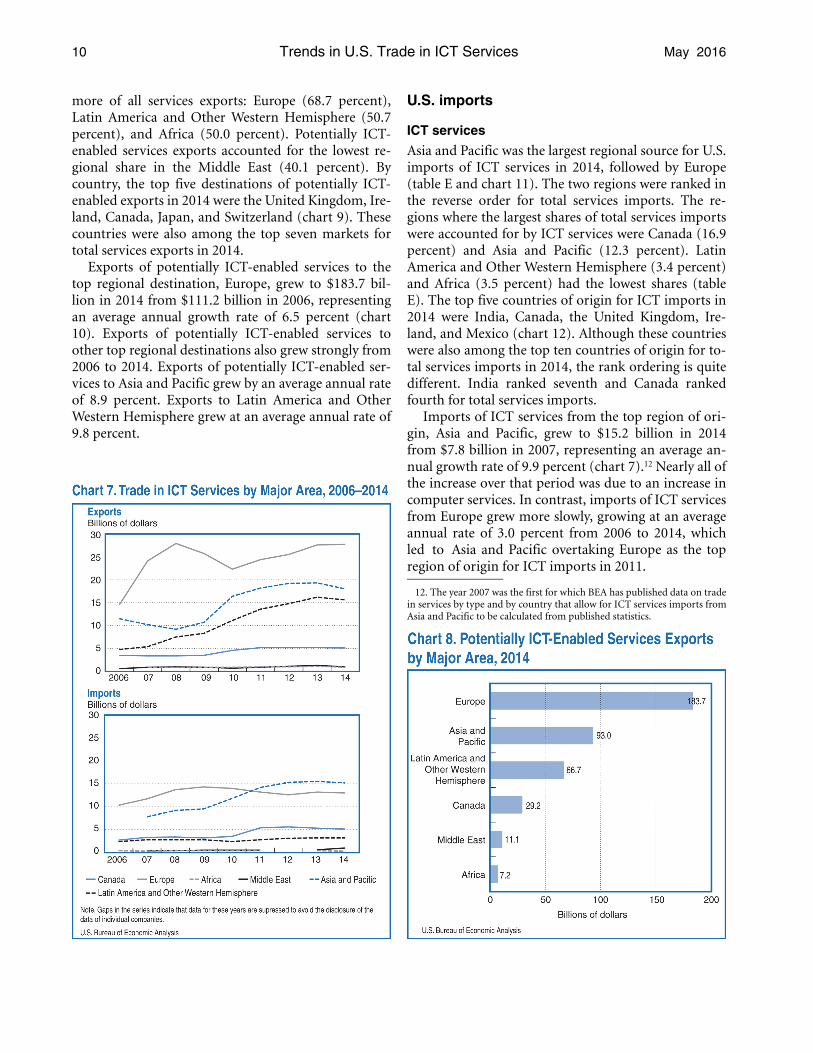
As with ICT services exports, Europe was the largestregional destination for U.S. exports of potentiallyICT-enabled services in 2014, followed by Asia and Pa-cific and by Latin America and Other Western Hemi-sphere (table E and chart 8). For three regionspotentially ICT-enabled services accounted for half or
10 Trends in U.S. Trade in ICT Services May 2016
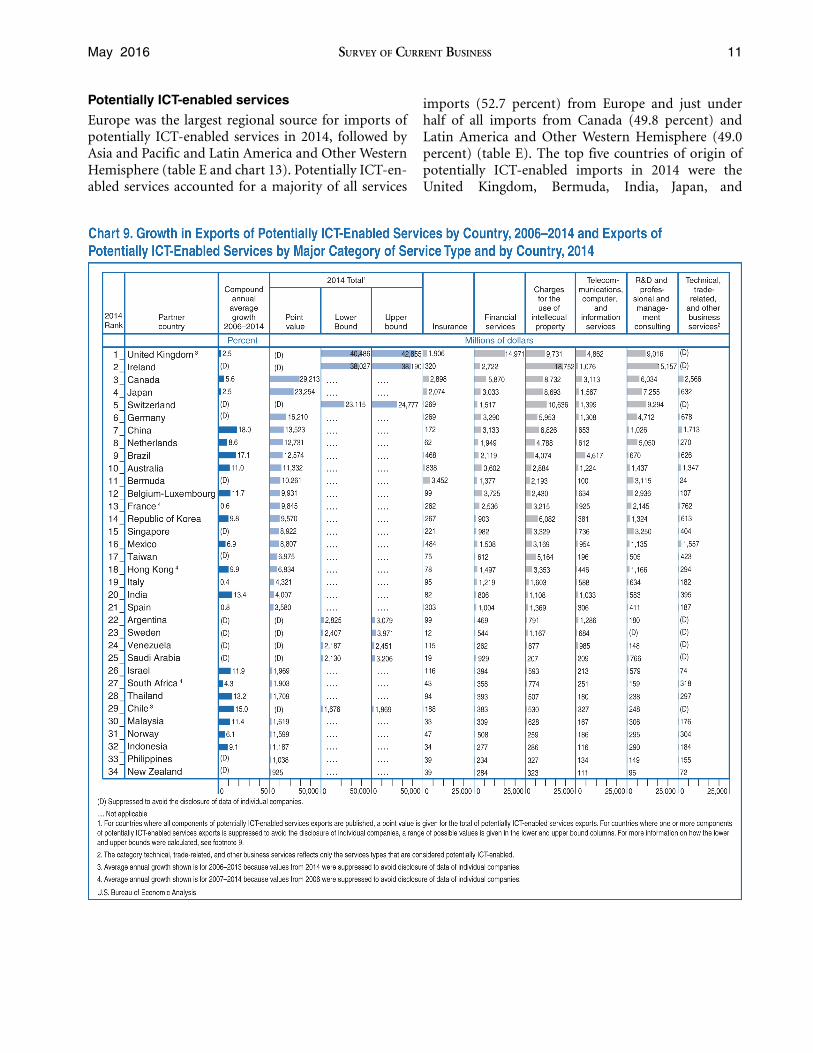
more of all services exports: Europe (68.7 percent),Latin America and Other Western Hemisphere (50.7percent), and Africa (50.0 percent). Potentially ICT-enabled services exports accounted for the lowest re-gional share in the Middle East (40.1 percent). Bycountry, the top five destinations of potentially ICT-enabled exports in 2014 were the United Kingdom, Ire-land, Canada, Japan, and Switzerland (chart 9). Thesecountries were also among the top seven markets fortotal services exports in 2014.
Exports of potentially ICT-enabled services to thetop regional destination, Europe, grew to $183.7 bil-lion in 2014 from $111.2 billion in 2006, representingan average annual growth rate of 6.5 percent (chart10). Exports of potentially ICT-enabled services toother top regional destinations also grew strongly from2006 to 2014. Exports of potentially ICT-enabled ser-vices to Asia and Pacific grew by an average annual rateof 8.9 percent. Exports to Latin America and OtherWestern Hemisphere grew at an average annual rate of9.8 percent.
U.S. imports
ICT services
Asia and Pacific was the largest regional source for U.S.imports of ICT services in 2014, followed by Europe(table E and chart 11). The two regions were ranked inthe reverse order for total services imports. The re-gions where the largest shares of total services importswere accounted for by ICT services were Canada (16.9percent) and Asia and Pacific (12.3 percent). LatinAmerica and Other Western Hemisphere (3.4 percent)and Africa (3.5 percent) had the lowest shares (tableE). The top five countries of origin for ICT imports in2014 were India, Canada, the United Kingdom, Ire-land, and Mexico (chart 12). Although these countrieswere also among the top ten countries of origin for to-tal services imports in 2014, the rank ordering is quitedifferent. India ranked seventh and Canada rankedfourth for total services imports.
Imports of ICT services from the top region of ori-gin, Asia and Pacific, grew to $15.2 billion in 2014from $7.8 billion in 2007, representing an average an-nual growth rate of 9.9 percent (chart 7).12 Nearly all ofthe increase over that period was due to an increase incomputer services. In contrast, imports of ICT servicesfrom Europe grew more slowly, growing at an averageannual rate of 3.0 percent from 2006 to 2014, whichled to Asia and Pacific overtaking Europe as the topregion of origin for ICT imports in 2011.
12. The year 2007 was the first for which BEA has published data on tradein services by type and by country that allow for ICT services imports fromAsia and Pacific to be calculated from published statistics.
May 2016 SURVEY OF CURRENT BUSINESS 11
Potentially ICT-enabled services
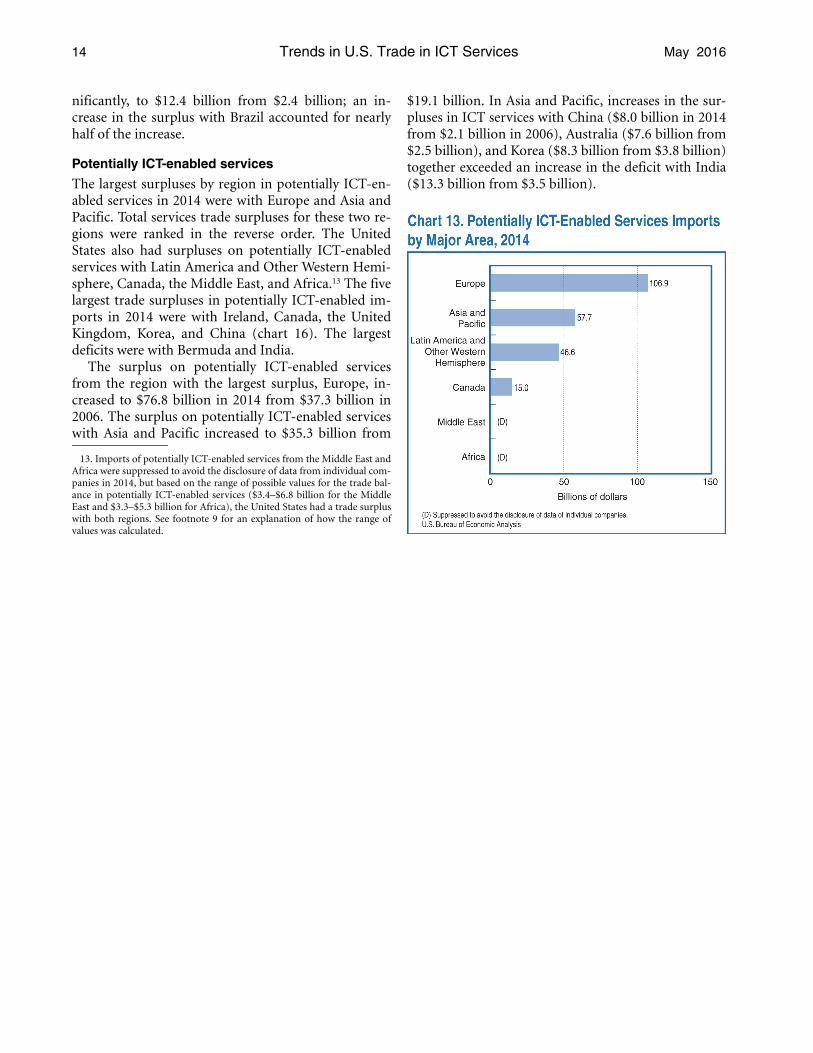
Europe was the largest regional source for imports ofpotentially ICT-enabled services in 2014, followed byAsia and Pacific and Latin America and Other WesternHemisphere (table E and chart 13). Potentially ICT-en-abled services accounted for a majority of all services
imports (52.7 percent) from Europe and just underhalf of all imports from Canada (49.8 percent) andLatin America and Other Western Hemisphere (49.0percent) (table E). The top five countries of origin ofpotentially ICT-enabled imports in 2014 were theUnited Kingdom, Bermuda, India, Japan, and

12 Trends in U.S. Trade in ICT Services May 2016
Switzerland. These countries were all in the top sevencountries of origin for total services imports in 2014.
Imports of potentially ICT-enabled services fromthe top region of origin, Europe, increased to $106.9billion in 2014 from $73.9 billion in 2006, representingan average annual growth rate of 4.7 percent (chart10). Imports of potentially ICT-enabled services fromother top regions of origin also grew strongly over thisperiod. Imports from Asia and Pacific grew at an aver-
age annual rate of 9.5 percent. Imports from LatinAmerica and Other Western Hemisphere grew at anaverage annual rate of 7.4 percent.
U.S. trade balance
ICT services
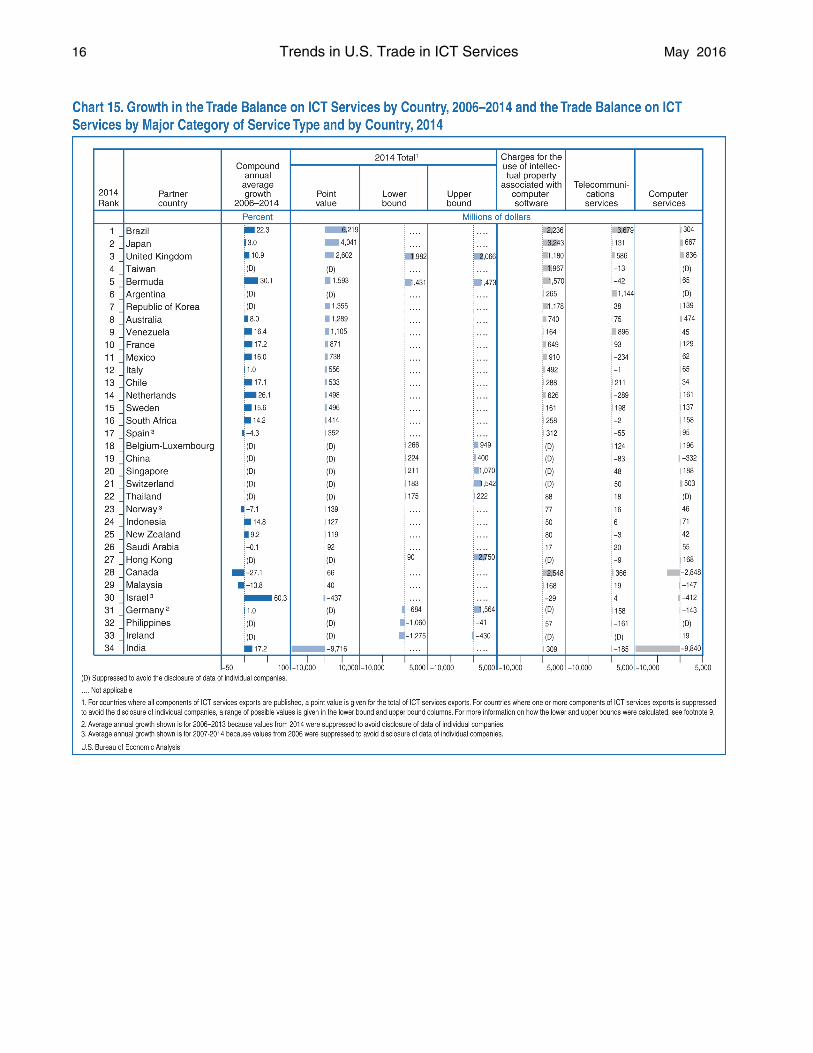
In 2014, the largest surpluses by region in ICT serviceswere with Europe and with Latin America and OtherWestern Hemisphere (table E). The United States alsohad surpluses in ICT services with Asia and Pacific, Af-rica, and Canada and a deficit with the Middle East. Incontrast, the largest surplus for total services was withAsia and Pacific. The five largest surpluses in ICT ser-vices were with Brazil, Japan, the United Kingdom,Taiwan, and Bermuda (chart 15). The largest deficitwas with India, which was more than accounted for bya deficit in computer services.

May 2016 SURVEY OF CURRENT BUSINESS 13
The surplus on ICT services from Europe grew to$14.7 billion in 2014 from $4.2 billion in 2007. Most ofthe increase over that period was in charges for the use
of intellectual property associated with computer soft-ware and in computer services. The surplus in LatinAmerica and Other Western Hemisphere also grew sig-
14 Trends in U.S. Trade in ICT Services May 2016
nificantly, to $12.4 billion from $2.4 billion; an in-crease in the surplus with Brazil accounted for nearlyhalf of the increase.
Potentially ICT-enabled services
The largest surpluses by region in potentially ICT-en-abled services in 2014 were with Europe and Asia andPacific. Total services trade surpluses for these two re-gions were ranked in the reverse order. The UnitedStates also had surpluses on potentially ICT-enabledservices with Latin America and Other Western Hemi-sphere, Canada, the Middle East, and Africa.13 The fivelargest trade surpluses in potentially ICT-enabled im-ports in 2014 were with Ireland, Canada, the UnitedKingdom, Korea, and China (chart 16). The largestdeficits were with Bermuda and India.
The surplus on potentially ICT-enabled servicesfrom the region with the largest surplus, Europe, in-creased to $76.8 billion in 2014 from $37.3 billion in2006. The surplus on potentially ICT-enabled serviceswith Asia and Pacific increased to $35.3 billion from
13. Imports of potentially ICT-enabled services from the Middle East andAfrica were suppressed to avoid the disclosure of data from individual com-panies in 2014, but based on the range of possible values for the trade bal-ance in potentially ICT-enabled services ($3.4–$6.8 billion for the MiddleEast and $3.3–$5.3 billion for Africa), the United States had a trade surpluswith both regions. See footnote 9 for an explanation of how the range ofvalues was calculated.
$19.1 billion. In Asia and Pacific, increases in the sur-pluses in ICT services with China ($8.0 billion in 2014from $2.1 billion in 2006), Australia ($7.6 billion from$2.5 billion), and Korea ($8.3 billion from $3.8 billion)together exceeded an increase in the deficit with India($13.3 billion from $3.5 billion).

May 2016 SURVEY OF CURRENT BUSINESS 15
16 Trends in U.S. Trade in ICT Services May 2016

May 2016 SURVEY OF CURRENT BUSINESS 17
18 Trends in U.S. Trade in ICT Services May 2016
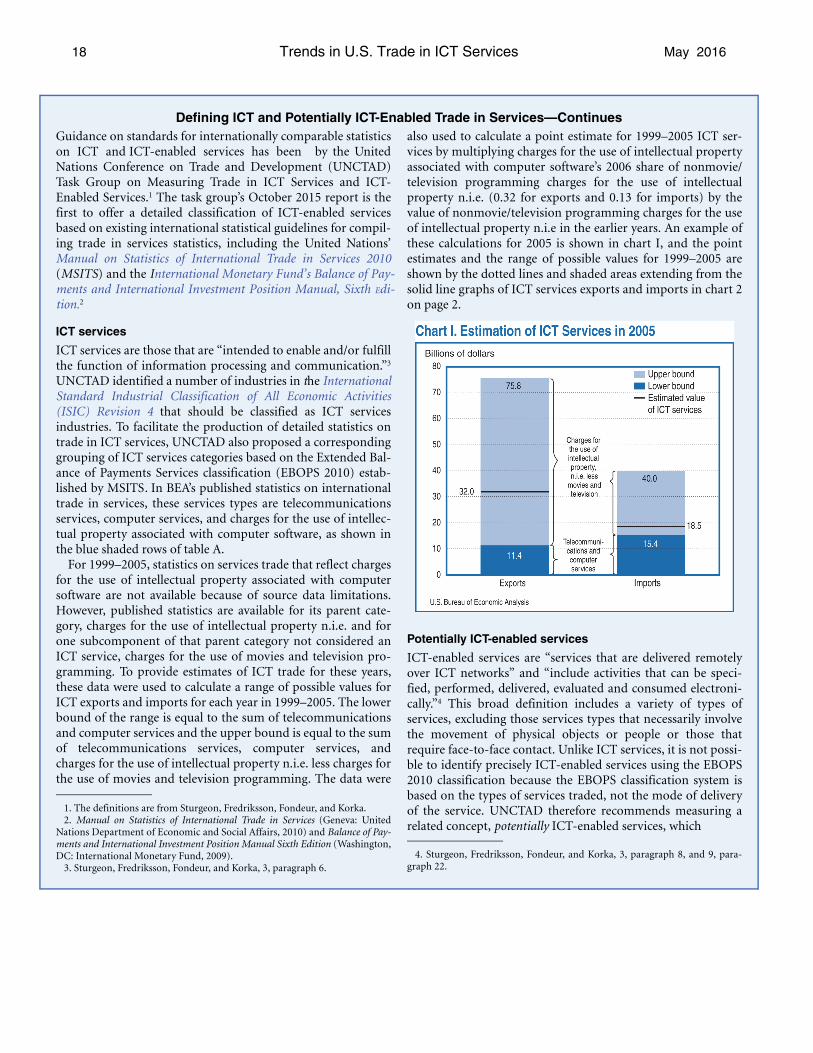
Guidance on standards for internationally comparable statistics on ICT and ICT-enabled services has been by the United Nations Conference on Trade and Development (UNCTAD) Task Group on Measuring Trade in ICT Services and ICT-Enabled Services.1 The task group’s October 2015 report is the first to offer a detailed classification of ICT-enabled services based on existing international statistical guidelines for compil-ing trade in services statistics, including the United Nations’ Manual on Statistics of International Trade in Services 2010 (MSITS) and the International Monetary Fund’s Balance of Pay-ments and International Investment Position Manual, Sixth Edi-tion.2
ICT services
ICT services are those that are “intended to enable and/or fulfill the function of information processing and communication.”3
UNCTAD identified a number of industries in the International Standard Industrial Classification of All Economic Activities (ISIC) Revision 4 that should be classified as ICT services industries. To facilitate the production of detailed statistics on trade in ICT services, UNCTAD also proposed a corresponding grouping of ICT services categories based on the Extended Bal-ance of Payments Services classification (EBOPS 2010) estab-lished by MSITS. In BEA’s published statistics on international trade in services, these services types are telecommunications services, computer services, and charges for the use of intellec-tual property associated with computer software, as shown in the blue shaded rows of table A.
For 1999–2005, statistics on services trade that reflect charges for the use of intellectual property associated with computer software are not available because of source data limitations. However, published statistics are available for its parent cate-gory, charges for the use of intellectual property n.i.e. and for one subcomponent of that parent category not considered an ICT service, charges for the use of movies and television pro-gramming. To provide estimates of ICT trade for these years, these data were used to calculate a range of possible values for ICT exports and imports for each year in 1999–2005. The lower bound of the range is equal to the sum of telecommunications and computer services and the upper bound is equal to the sum of telecommunications services, computer services, and charges for the use of intellectual property n.i.e. less charges for the use of movies and television programming. The data were
1. The definitions are from Sturgeon, Fredriksson, Fondeur, and Korka.2. Manual on Statistics of International Trade in Services (Geneva: United
Nations Department of Economic and Social Affairs, 2010) and Balance of Pay-ments and International Investment Position Manual Sixth Edition (Washington,DC: International Monetary Fund, 2009).
3. Sturgeon, Fredriksson, Fondeur, and Korka, 3, paragraph 6.
also used to calculate a point estimate for 1999–2005 ICT ser-vices by multiplying charges for the use of intellectual propertyassociated with computer software’s 2006 share of nonmovie/television programming charges for the use of intellectualproperty n.i.e. (0.32 for exports and 0.13 for imports) by thevalue of nonmovie/television programming charges for the useof intellectual property n.i.e in the earlier years. An example ofthese calculations for 2005 is shown in chart I, and the pointestimates and the range of possible values for 1999–2005 areshown by the dotted lines and shaded areas extending from thesolid line graphs of ICT services exports and imports in chart 2on page 2.
Potentially ICT-enabled services
ICT-enabled services are “services that are delivered remotelyover ICT networks” and “include activities that can be speci-fied, performed, delivered, evaluated and consumed electroni-cally.”4 This broad definition includes a variety of types ofservices, excluding those services types that necessarily involvethe movement of physical objects or people or those thatrequire face-to-face contact. Unlike ICT services, it is not possi-ble to identify precisely ICT-enabled services using the EBOPS2010 classification because the EBOPS classification system isbased on the types of services traded, not the mode of deliveryof the service. UNCTAD therefore recommends measuring arelated concept, potentially ICT-enabled services, which
4. Sturgeon, Fredriksson, Fondeur, and Korka, 3, paragraph 8, and 9, para-graph 22.
Defining ICT and Potentially ICT-Enabled Trade in Services—Continues

May 2016 SURVEY OF CURRENT BUSINESS 19
includes service types that can predominantly be deliveredremotely over ICT networks, a subset of which are actuallydelivered via that method. Potentially ICT-enabled servicesinclude ICT services as well as other potentially ICT-enabledservices and correspond to the following services types in BEA’spublished statistics on international trade in services: insuranceservices; financial services; charges for the use of intellectualproperty n.i.e.; telecommunications, computer, and informa-tion services; and certain services included in other businessservices, including professional and management consultingservices and research and development. Potentially ICT-enabled services include ICT services. The full list of servicestypes identified as being potentially ICT-enabled is shown bythe shaded (yellow and blue) rows in table A.
For 1999–2005, statistics on services trade for the servicetypes within technical, trade-related, and other business ser-vices are not available because of source data limitations. How-ever, published statistics are available for technical, trade-related, and other business services as a whole and for a sepa-rate subcomponent of that parent category not consideredpotentially ICT-enabled, operating leasing services. These twoseries were used to calculate a range of possible values forpotentially ICT-enabled exports and imports, with the lowerbound equal to the sum of insurance services, financial ser-vices, charges for the use of intellectual property n.i.e., telecom-munications, computer, and information services, professionaland management consulting services, and research and devel-opment services and the upper bound equal to the sum of thosecategories as well as technical, trade-related, and other businessservices less operating leasing services. A point estimate forpotentially ICT-enabled services was also calculated for1999–2005 by identifying the share of technical, trade-related,
and other business services less operating leasing services con-sidered potentially ICT-enabled in 2006 (0.73 for exports and0.68 for imports), and multiplying that share by the value oftechnical, trade-related, and other business services less operat-ing leasing in 1999–2005. An example of these calculations for2005 is shown in chart II, and the point estimates and range ofpossible values for 1999–2005 are shown by the dotted linesand shaded areas extending from the solid line graphs of poten-tially ICT-enabled services exports and imports in chart 2 onpage 2.
Defining ICT and Potentially ICT-Enabled Trade in Services—Ends
Tables 1 through 8 accompany this article.