trends in the accountancy market
TRANSCRIPT

Trends in the Accountancy and Allied Services Market July 2016
60 Eastern Green Road Coventry, CV5 7LH [email protected]

The Accountancy and Allied Services Market
1
© IRN Research 2016 IRN Research 60 Eastern Green Road Coventry CV5 7LH UK E-mail: [email protected] URL: www.irn-research.com ___________________________________________________________________________ About IRN Research IRN Research (trading name of IRN Consultants Ltd) was formed in 1991 and has a strong track record in providing market research services to the professional services sectors. IRN is a full-service research agency with research capabilities from small-scale research requests to large-scale international projects. We utilise a range of research techniques, e.g. desk research, telephone/online surveys, face-to-face interviews, focus groups, and can provide a full results analysis. We undertake a wide range of research for professional services firms including:
Customer Experience Research: We use a range of research techniques and questions to understand what your customer thinks of your company and brand and what drives such perceptions. Customer Segmentation: We identify and assess how to target customer sub-groups, using a variety of data including attitudinal and usage information plus consumer demographic and business structure data. Market Understanding: We seek to understand the market you operate in by running usage and attitude (U&A) surveys and undertaking desk research to come to a clear understanding of your customer’s needs and potential growth opportunities.

The Accountancy and Allied Services Market
2
Table of Contents ABOUT IRN RESEARCH ................................................................................................................................... 1 INTRODUCTION ............................................................................................................................................... 3
AIMS OF THIS REPORT......................................................................................................................................................................... 3 EXECUTIVE SUMMARY .................................................................... ERROR! BOOKMARK NOT DEFINED.
SUMMARY INFOGRAPHIC ................................................................................................. ERROR! BOOKMARK NOT DEFINED. KEY FINDINGS ..................................................................................................................................................................................... 3 THE LONG VIEW .............................................................................................................................................. 4
MARKET GROWS BY AROUND £6 MILLION PER MONTH .............................................................................................................. 4 WITH VALUE ADDED RISING £39 MILLION PER QUARTER .......................................................................................................... 4 IT’S A MARKET WHERE PRICES INCREASES HAVE FALLEN IN RECENT QUARTERS . ERROR! BOOKMARK NOT DEFINED. A HIGHLY SEASONAL MARKET ..................................................................................................................... 6
THE TREND CYCLE POINTS TO A SLOWDOWN IN THE MARKET ................................................................................................. 8 APPENDIX ......................................................................................................................................................... 10
The Accountancy and Allied Services Market
3 | P A G E
INTRODUCTION Aims of this report This is the second free report on the accountancy market released by IRN Research as part of our wider review of the UK professional services market. Our report The Accountancy and Allied Services Market (available on our website) looked at the structure of the market and considered how the market is changing and would progressive in a post-Brexit world. This brief looks more closely at the long-run and short run trends in the accountancy market in terms of the revenues generated and its output. In particular, it shows the degree of seasonal influences on the market. For the purposes of this report, the accountancy and allied services market is taken to consist of firms engaged in three types of activities:
Accounting and auditing activities – representing the bulk of the market Bookkeeping activities Tax consultancy
Key findings The accountancy market exhibits a very strong seasonal pattern to its turnover. Firms in the market need to bear this in mind when considering their short-run business performance. The market is subject to strong peaks of business around March, June and Sept/Oct followed by troughs in April/May, August and November. There are strong underlying trends in evidence in the market that drive the long-term performance of firms. These long-term trends are strongly influenced the performance of the UK economy as a whole. The underlying trend data points to the market experiencing a significant slowdown in business prior to the Brexit vote.
The Accountancy and Allied Services Market
4 | P A G E
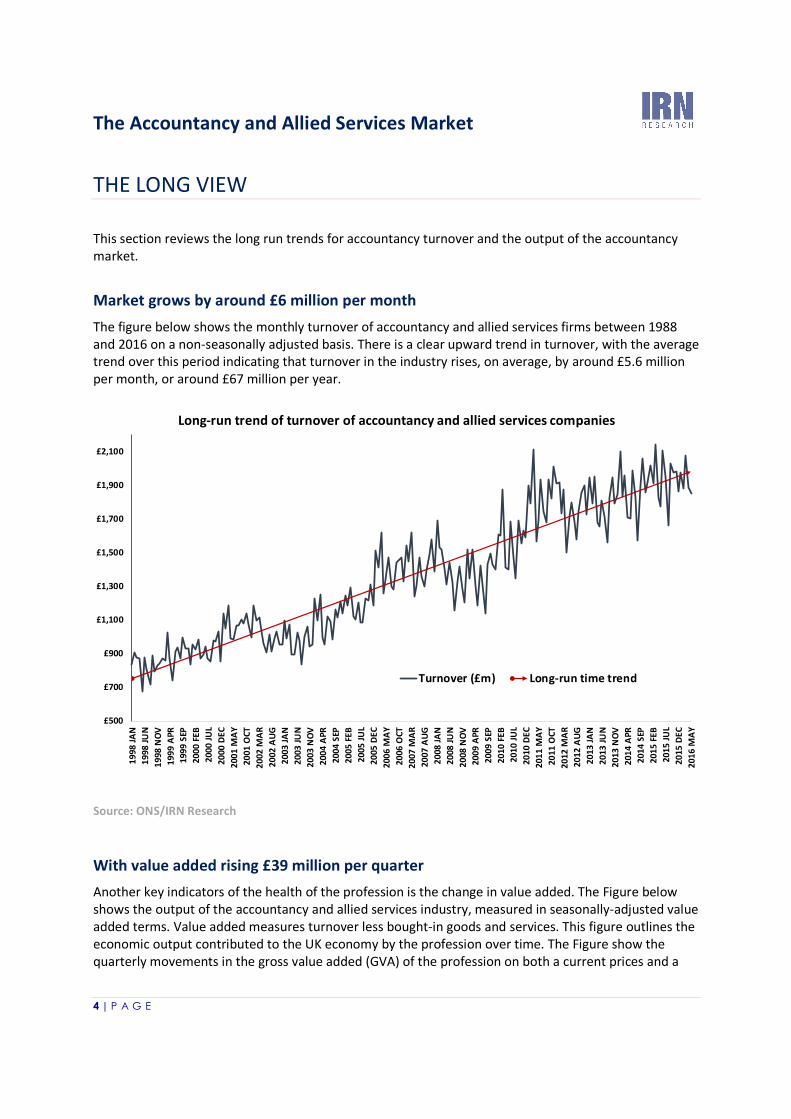
THE LONG VIEW This section reviews the long run trends for accountancy turnover and the output of the accountancy market. Market grows by around £6 million per month The figure below shows the monthly turnover of accountancy and allied services firms between 1988 and 2016 on a non-seasonally adjusted basis. There is a clear upward trend in turnover, with the average trend over this period indicating that turnover in the industry rises, on average, by around £5.6 million per month, or around £67 million per year.
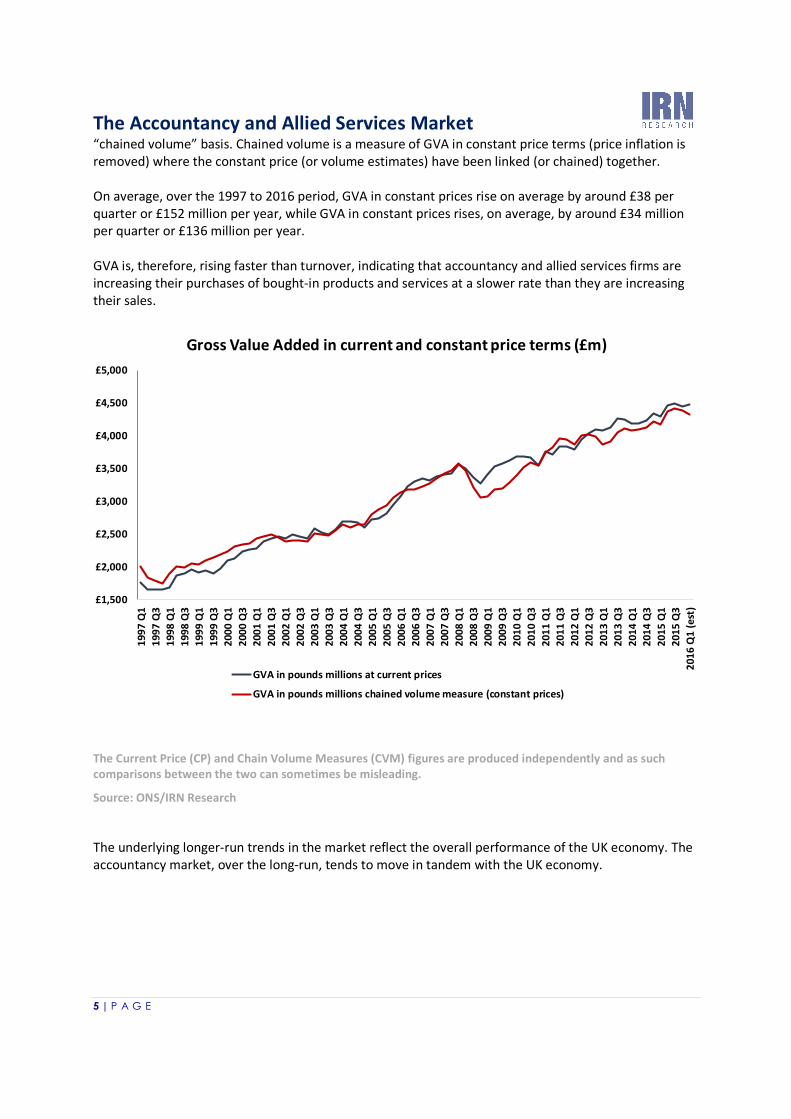
Source: ONS/IRN Research With value added rising £39 million per quarter Another key indicators of the health of the profession is the change in value added. The Figure below shows the output of the accountancy and allied services industry, measured in seasonally-adjusted value added terms. Value added measures turnover less bought-in goods and services. This figure outlines the economic output contributed to the UK economy by the profession over time. The Figure show the quarterly movements in the gross value added (GVA) of the profession on both a current prices and a
£500
£700
£900
£1,100
£1,300
£1,500
£1,700
£1,900
£2,100
1998 JA
N199
8 JUN
1998 N
OV199
9 APR
1999 S
EP200
0 FEB
2000 JU
L200
0 DEC
2001 M
AY200
1 OCT
2002 M
AR200
2 AUG
2003 JA
N200
3 JUN
2003 N
OV200
4 APR
2004 S
EP200
5 FEB
2005 JU
L200
5 DEC
2006 M
AY200
6 OCT
2007 M
AR200
7 AUG
2008 JA
N200
8 JUN
2008 N
OV200
9 APR
2009 S
EP201
0 FEB
2010 JU
L201
0 DEC
2011 M
AY201
1 OCT
2012 M
AR201
2 AUG
2013 JA
N201
3 JUN
2013 N
OV201
4 APR
2014 S
EP201
5 FEB
2015 JU
L201
5 DEC
2016 M
AY
Long-run trend of turnover of accountancy and allied services companies
Turnover (£m) Long-run time trend
The Accountancy and Allied Services Market
5 | P A G E
“chained volume” basis. Chained volume is a measure of GVA in constant price terms (price inflation is removed) where the constant price (or volume estimates) have been linked (or chained) together. On average, over the 1997 to 2016 period, GVA in constant prices rise on average by around £38 per quarter or £152 million per year, while GVA in constant prices rises, on average, by around £34 million per quarter or £136 million per year. GVA is, therefore, rising faster than turnover, indicating that accountancy and allied services firms are increasing their purchases of bought-in products and services at a slower rate than they are increasing their sales.
The Current Price (CP) and Chain Volume Measures (CVM) figures are produced independently and as such comparisons between the two can sometimes be misleading. Source: ONS/IRN Research The underlying longer-run trends in the market reflect the overall performance of the UK economy. The accountancy market, over the long-run, tends to move in tandem with the UK economy.
£1,500£2,000£2,500£3,000£3,500£4,000£4,500£5,000
1997 Q
1199
7 Q3
1998 Q
1199
8 Q3
1999 Q
1199
9 Q3
2000 Q
1200
0 Q3
2001 Q
1200
1 Q3
2002 Q
1200
2 Q3
2003 Q
1200
3 Q3
2004 Q
1200
4 Q3
2005 Q
1200
5 Q3
2006 Q
1200
6 Q3
2007 Q
1200
7 Q3
2008 Q
1200
8 Q3
2009 Q
1200
9 Q3
2010 Q
1201
0 Q3
2011 Q
1201
1 Q3
2012 Q
1201
2 Q3
2013 Q
1201
3 Q3
2014 Q
1201
4 Q3
2015 Q
1201
5 Q3
2016 Q
1 (est)
Gross Value Added in current and constant price terms (£m)
GVA in pounds millions at current pricesGVA in pounds millions chained volume measure (constant prices)
The Accountancy and Allied Services Market
6 | P A G E
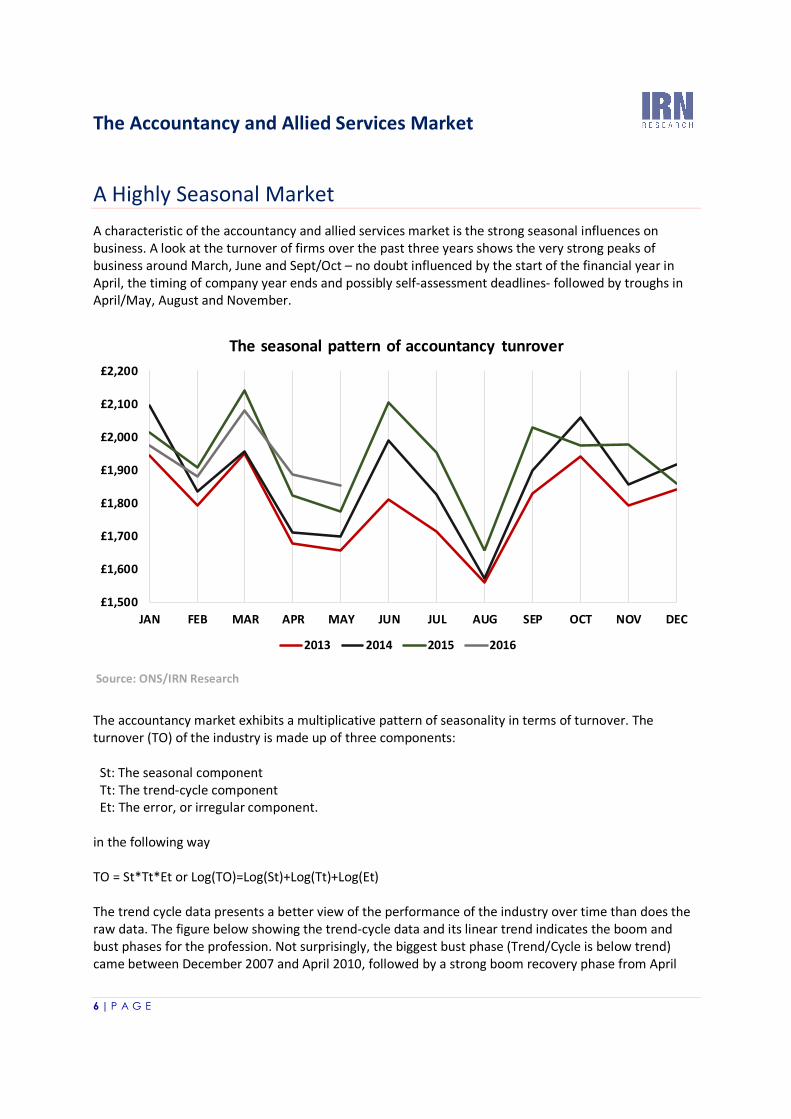
A Highly Seasonal Market A characteristic of the accountancy and allied services market is the strong seasonal influences on business. A look at the turnover of firms over the past three years shows the very strong peaks of business around March, June and Sept/Oct – no doubt influenced by the start of the financial year in April, the timing of company year ends and possibly self-assessment deadlines- followed by troughs in April/May, August and November.
Source: ONS/IRN Research The accountancy market exhibits a multiplicative pattern of seasonality in terms of turnover. The turnover (TO) of the industry is made up of three components: St: The seasonal component Tt: The trend-cycle component Et: The error, or irregular component. in the following way TO = St*Tt*Et or Log(TO)=Log(St)+Log(Tt)+Log(Et) The trend cycle data presents a better view of the performance of the industry over time than does the raw data. The figure below showing the trend-cycle data and its linear trend indicates the boom and bust phases for the profession. Not surprisingly, the biggest bust phase (Trend/Cycle is below trend) came between December 2007 and April 2010, followed by a strong boom recovery phase from April
£1,500£1,600£1,700£1,800£1,900£2,000£2,100£2,200
JAN FEB MAR APR MAY JUN JUL AUG SEP OCT NOV DEC
The seasonal pattern of accountancy tunrover
2013 2014 2015 2016

The Accountancy and Allied Services Market
7 | P A G E
2010 to January 2012. Since then the profession has seen its cyclical activity die down somewhat and it has been close to its trend, although the start of 2016 was below trend.
Source: IRN Research A similar pattern is in evidence comparing actual turnover with the seasonal pattern of sales
£500£700£900
£1,100£1,300£1,500£1,700£1,900£2,100£2,300
1998 JA
N199
8 AUG
1999 M
AR199
9 OCT
2000 M
AY200
0 DEC
2001 JU
L200
2 FEB
2002 SE
P200
3 APR
2003 N
OV200
4 JUN
2005 JA
N200
5 AUG
2006 M
AR200
6 OCT
2007 M
AY200
7 DEC
2008 JU
L200
9 FEB
2009 SE
P201
0 APR
2010 N
OV201
1 JUN
2012 JA
N201
2 AUG
2013 M
AR201
3 OCT
2014 M
AY201
4 DEC
2015 JU
L201
6 FEB
Actual Turnover vs Trend/Cycle
Actual Trend/Cycle Linear trend of trend/cycle
ABOVE BELOW ABOVE BELOW ON TRENDABOVE

The Accountancy and Allied Services Market
8 | P A G E
Note: the seasonal data includes the trend/cycle and irregular component Source: IRN Research The trend cycle points to a slowdown in the market Looking at the recent pattern of sales indicates that the accountancy market is undergoing a slowdown in its business. Since the start of 2016, the rate of growth in turnover compared with the same period of 2015 has been negative or zero for the trend/cycle, although the worst of the downturn seemed to take place in January and February 2016. However, it is worrying that trend turnover was slowing even before the Brexit vote threw the UK’s economic situation into some doubt.
£500£700£900
£1,100£1,300£1,500£1,700£1,900£2,100£2,300
1998 JA
N199
8 AUG
1999 M
AR199
9 OCT
2000 M
AY200
0 DEC
2001 JU
L200
2 FEB
2002 S
EP200
3 APR
2003 N
OV200
4 JUN
2005 JA
N200
5 AUG
2006 M
AR200
6 OCT
2007 M
AY200
7 DEC
2008 JU
L200
9 FEB
2009 S
EP201
0 APR
2010 N
OV201
1 JUN
2012 JA
N201
2 AUG
2013 M
AR201
3 OCT
2014 M
AY201
4 DEC
2015 JU
L201
6 FEB
Actual Turnover vs Seasonally Adjusted Turnover
Actual Seasonally Adjusted

The Accountancy and Allied Services Market
9 | P A G E
Source: IRN Research
4.6%
5.6%6.9%
5.4%6.8%
-4.0%
6.6%
-3.0%-1.9% -1.4%
-2.8%
3.3%4.3%6.0% 5.8% 5.4% 4.8%
3.7%2.4%
0.9%-0.4% -1.4% -1.6% -1.3% -0.7% 0.0%
-6.0%
-4.0%
-2.0%
0.0%
2.0%
4.0%
6.0%
8.0%
2015MAY 2015JUN 2015JUL 2015AUG 2015SEP 2015OCT 2015NOV 2015DEC 2016JAN 2016FEB 2016MAR 2016APR 2016MAY
Annual growth in turnover (% change on same month of preceding year)
Actual Trend/Cycle

The Accountancy and Allied Services Market
10 | P A G E
One of the factors that may have led to a slowdown in sales recently is a decline in inflation within the market. This in itself could point to growing pressure on firms to attached business, leading to pressure to lower prices or not increase them significantly. The Services Producer Price (SPP) Inflation for accountancy and allied services provides a measure of inflation for the market. It is constructed from a statutory quarterly survey which measures changes in the price received for accountancy services provided by UK businesses to other UK businesses and government. The inflation index is calculated on a “business to business” basis. This means that only transactions between UK businesses and other UK businesses or government are included. Sales made to customers outside of the UK or to members of the public are excluded. Given that most UK accountancy services are supplied to the domestic market and businesses are the prime purchases of accountancy services, this presents a good view of price inflation in the market. The SPP index numbers exclude VAT and are not seasonally adjusted. Between Q1 2010 and Q1 2016, producer prices rose by 15%. There were especially large rises in prices between Q3 2014 and Q2 2015, since when inflation has dropped back. The rate of inflation peaked around 4% at the start of 2015 but has fallen back to around 2% in early 2016.
* Inflation is measured on an annual basis – i.e. the percentage change in the SPP index in one quarter compared with the same quarter of the previous year. Source: ONS/IRN Research
0.0%0.5%1.0%1.5%2.0%2.5%3.0%3.5%4.0%4.5%
95
100
105
110
115
120
2010 Q
1201
0 Q2
2010 Q
3201
0 Q4
2011 Q
1201
1 Q2
2011 Q
3201
1 Q4
2012 Q
1201
2 Q2
2012 Q
3201
2 Q4
2013 Q
1201
3 Q2
2013 Q
3201
3 Q4
2014 Q
1201
4 Q2
2014 Q
3201
4 Q4
2015 Q
1201
5 Q2
2015 Q
3201
5 Q4
2016 Q
1
% inflat
ion
Index
Index number of producer prices and annual inflation*
Price Index, 2013=100 Annual price inflation

The Accountancy and Allied Services Market
11 | P A G E
Appendix To calculate the trend cycle and seasonally adjusted series, IRN Research used the 13ARIMA-SEATS (X-13A-S) seasonal adjustment software developed by the U. S. Census Bureau in collaboration with the Bank of Spain. This is the seasonal adjustment software currently used by the US Census Bureau and the Office for National Statistics.