june 2016 key facts and trends in the accountancy profession · financial reporting council key...
TRANSCRIPT
Financial Reporting Council
ReportProfessional discipline
June 2016
Key Facts and Trends in the Accountancy Profession
Financial Reporting Council
The FRC is responsible for promoting high quality corporate governance and reporting to foster investment. We set the UK Corporate Governance and Stewardship Codes as well as UK standards for accounting, auditing and actuarial work. We represent UK interests in international standard-setting. We also monitor and take action to promote the quality of corporate reporting and auditing. We operate independent disciplinary arrangements for accountants and actuaries, and oversee the regulatory activities of the accountancy and actuarial professional bodies.
The content in this publication is provided for general information purposes only. Although the Financial Reporting Council (FRC) endeavours to ensure the accuracy of the information provided by the accountancy firms and bodies listed in the publication, we undertake no detailed checking of the data and therefore cannot guarantee that the content will be current, consistently provided year on year, accurate or complete. The FRC accepts no responsibility for any reliance others may place upon the information provided herein. We shall not be liable for any loss or damage arising from the use of the information contained within this publication nor from any action or decision taken as a result of using such information.
© The Financial Reporting Council Limited 2016The Financial Reporting Council Limited is a company limited by guarantee. Registered in England number 2486368. Registered Office: 8th Floor, 125 London Wall, London EC2Y 5AS
Financial Reporting CouncilKey Facts and Trends in the Accountancy Profession
Contents
Foreword 5
One Main Highlights 7
Two Members and Students of Accountancy Bodies 9
Three Resource Information on Accountancy Bodies 25
Four Oversight of Audit Regulation 29
Five Audit Firms 42
Six Annex – Data tables of the charts 54
Seven Annex – Glossary of acronyms and abbreviations 60

4 Key Facts and Trends in the Accountancy Profession (June 2016)
Foreword
Financial Reporting Council 5
Foreword
This is the fourteenth edition of ‘Key Facts and Trends in the Accountancy Profession’.The FRC is the UK’s independent regulator responsible for promoting high quality corporate governance and reporting to foster investment. It has specific responsibilities for overseeing the regulation of statutory auditors and, more widely, the regulation of the accountancy and actuarial professions in the UK by agreement with their professional bodies.
This document provides statistical information on the accountancy profession as part of the context to the FRC’s work. It collates information provided by six chartered accountancy bodies1 and one other accountancy body that offers an audit qualification in statutory audit recognised by the FRC2. The information in Sections One to Three relates principally to membership, students, income, costs and staffing of these accountancy bodies. For the first time this year, Section Two also includes information provided by the Association of Accounting Technicians (AAT); data and trends regarding AAT are presented separately on pages 23 and 24. Section Four contains information related to the oversight of statutory auditors.
Section Five provides information on the audit firms which perform the audits of Public Interest Entities (PIEs). This is a change from previous editions where we reported on the largest registered audit firms.
Where appropriate we highlight significant trends and explain possible limitations on the data. However, we do not comment on the possible reasons for particular trends. We would also stress that it is often difficult to make comparisons between the accountancy bodies or between audit firms. This can be for a number of reasons, such as differences in the way data is classified or in the differing regulatory arrangements.
In Section Two, the tables on members and students of the accountancy bodies show data for the UK and ROI, and separately worldwide data. We include the UK and ROI figures together, partly because members and firms are entitled to practise in both jurisdictions and partly because in some cases it is difficult for the bodies to separate the data. However, the Irish Auditing and Accounting Supervisory Authority (IAASA) publishes certain information relating specifically to the ROI, which is available at http://www.iaasa.ie.
Overall, the data suggests that the profession continues to remain attractive. The overall number of members continues to increase, both in the UK and worldwide. Student numbers which have declined in the UK and ROI in UK in 2015 and have grown worldwide. The total fee income of the PIE audit firms has also grown in 2014/15.
The FRC, in its role as the UK’s competent authority for audit, will publish in July 2016 its first “Developments in Audit” report. The report will set out an overview of developments in UK audit quality and confidence in audit, with reference to our assessment of quality through our work on professional oversight, audit quality review and enforcement.
We are grateful to those that took the time to complete our questionnaire on how we could improve this publication. We would again welcome your comments on Key Facts and Trends in the Accountancy Profession and should be grateful if you would complete our short questionnaire (see link below):
https://www.surveymonkey.co.uk/r/KeyFactsandTrends2016
Further information about the FRC is available at www.frc.org.uk
1 ACCA, CAI, CIMA, CIPFA, ICAEW and ICAS. Of these accountancy bodies, ACCA, CAI, ICAEW and ICAS offer an audit qualification in statutory audit recognised by the FRC.
2 AIA

6 Key Facts and Trends in the Accountancy Profession (June 2016)
Main Highlights
Financial Reporting Council 7
Section One Main Highlights
The Accountancy Bodies 2011 – 2015
Total membership of the accountancy bodies continues to grow steadily. As at 31 December 2015, the seven accountancy bodies had over 342,000 members in the UK and ROI and over 497,000 members worldwide. The compound annual growth rates for the 2011-15 period are 2.4% in the UK and ROI and 3.2% worldwide. (Figures 2 to 3)
There were over 163,000 students in the UK and ROI and over 559,000 worldwide as at 31 December 2015. There has been a decline in the number of students in the UK and ROI, falling by 1.8% since 31 December 2014 and by a compound annual rate of 1.1% for the 2011-15 period. However, the number of students worldwide has increased by 2.6% since 31 December 2014 and by an annual compound rate of 3.1% for the 2011-15 period. (Figures 2 and 3)
There are significant differences between the bodies in terms of geographical distribution of membership and student populations and in size, growth rate and age profile.
The number of registered audit firms continues to decline gradually. The overall number of registered audit firms was 6,331 as at 31 December 2015, a fall of 304 firms (4.6%) since 31 December 2014. (Figure 19)
The Audit Firms 2011 – 2015
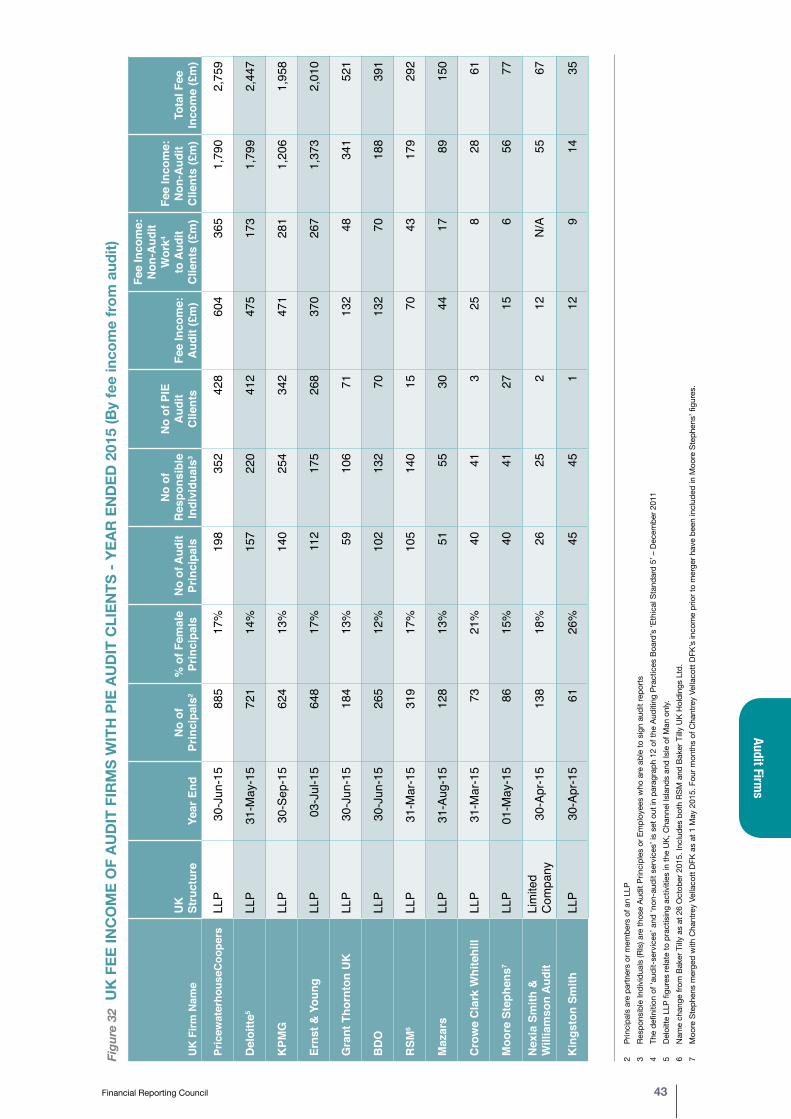
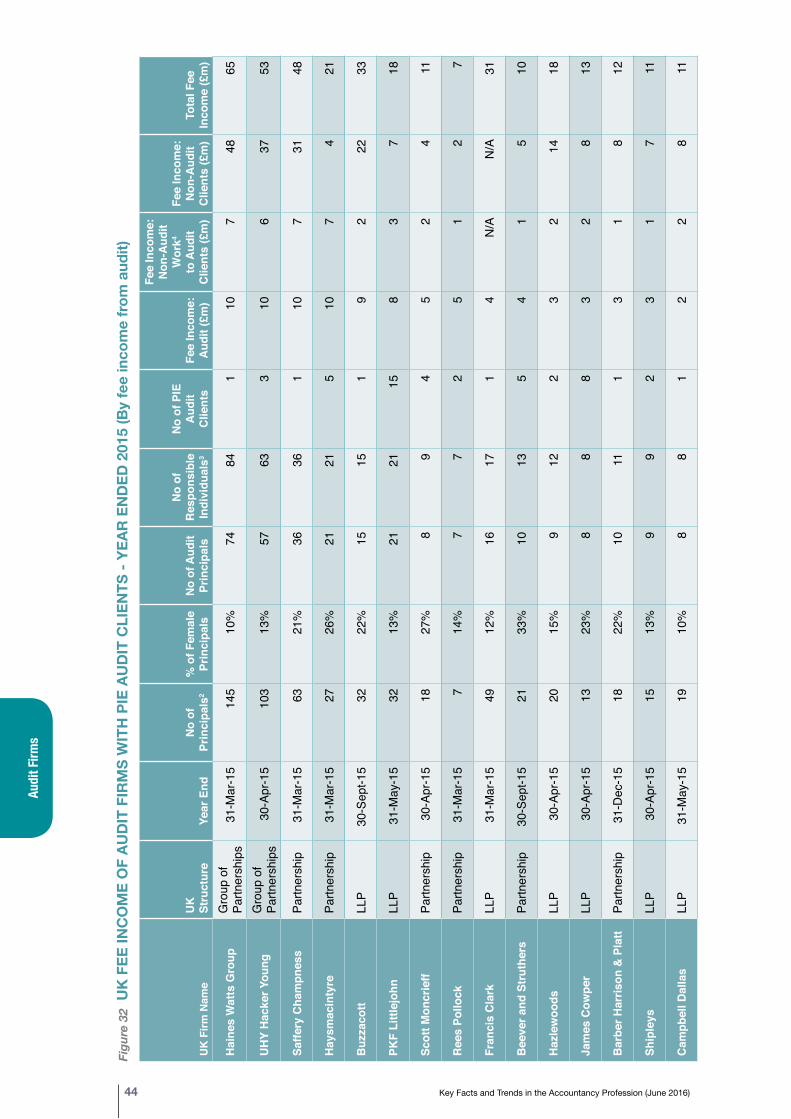
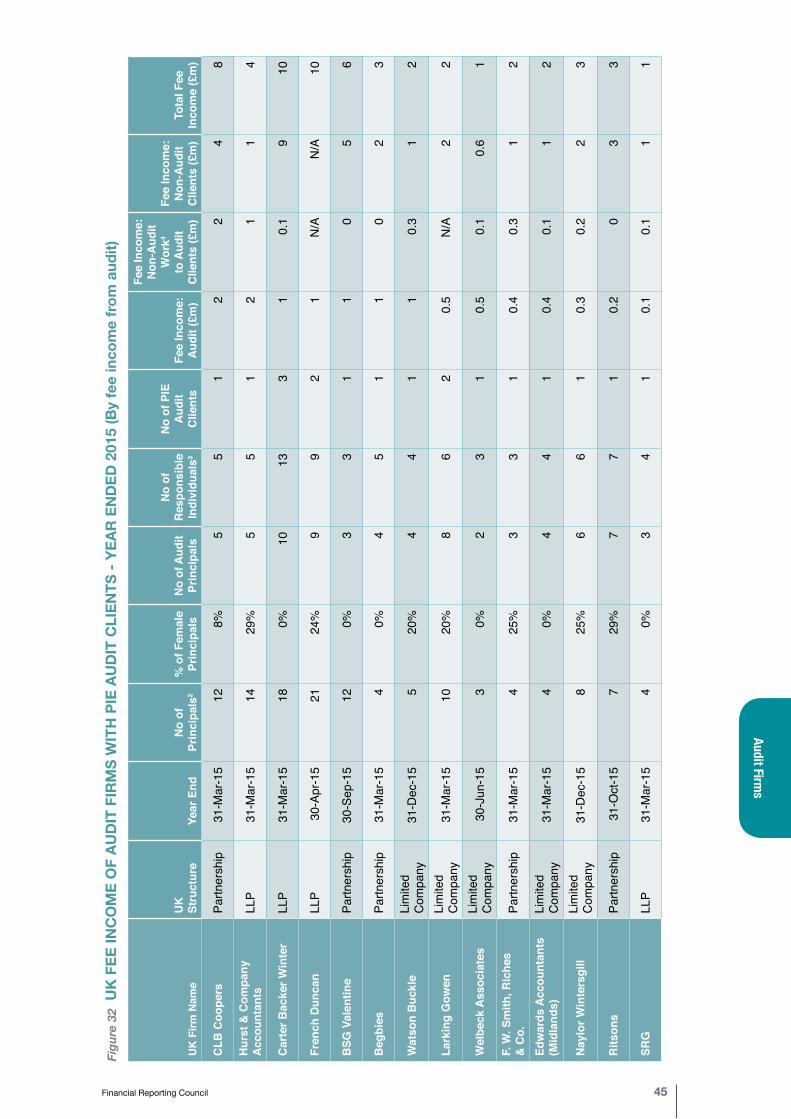
Figure 32 shows the fee income for audit and non-audit services for the 41 audit firms with Public Interest Entity (PIE) clients1 for the year ended 2015. Firms are listed in order of fee income from audit, rather than total fee income.
In comparison to 2014, the Big Four have collectively experienced increases in growth across all categories of fee income, in contrast to those PIE audit firms outside of the Big Four, which collectively experienced declines in the rate of growth across nearly all categories of fee income over the same period.
The collective fee income for all PIE audit firms increased in 2014-15. The aggregate increase for the Big Four was 6.7% compared with an aggregate increase of 4.7% for the PIE audit firms outside of the Big Four. (Figure 35)
Aggregate audit fee income for the Big Four increased by 4.6% in 2014-2015, compared with an aggregate increase of 2.7% for the PIE audit firms outside of the Big Four. (Figure 35)
Average audit fee income per Responsible Individual (RI) increased by 8.8% compared to 2014 across all PIE audit firms. (Figure 36)
More listed companies outside of the FTSE 350 were being audited by the Big Four in 2015 than in previous years. (Figure 38)
The proportion of fee income from non-audit clients, fee income from non-audit work to audit clients and audit fee income, across audit firms with PIE clients has been stable between 2013 and 2015. (Figure 33)
1 Article 2 of the EU Directive defines PIEs as: entities governed by the law of a member state whose transferable securities (equity and debt) are admitted to trading on a regulated market in the EEA, credit institutions or insurance undertakings.
Mai
n Hi
ghlig
hts
8 Key Facts and Trends in the Accountancy Profession (June 2016)
Mem
bers and Students of Accountancy Bodies
Financial Reporting Council 9
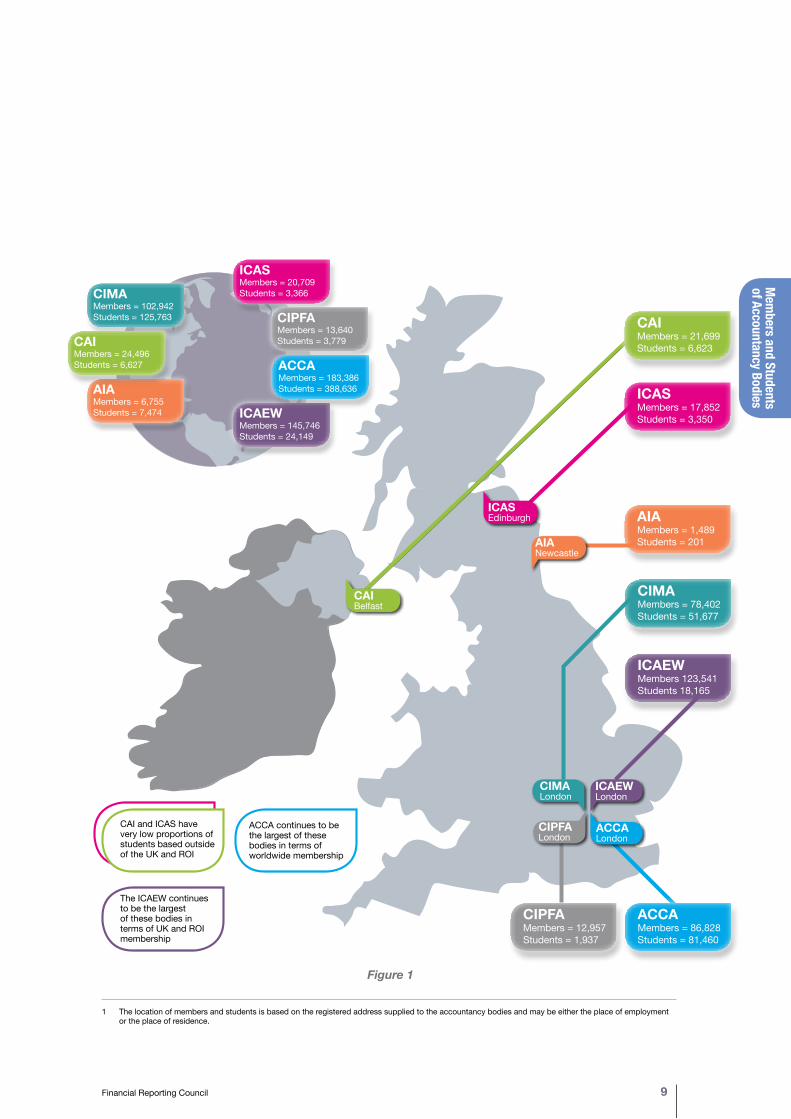
CAI and ICAS have very low proportions of students based outside of the UK and ROI
The ICAEW continues to be the largest of these bodies in terms of UK and ROI membership
Figure 1
ICAEWMembers 123,541Students 18,165
ICAEWMembers = 145,746Students = 24,149
CIMAMembers = 102,942Students = 125,763
AIAMembers = 6,755Students = 7,474
ICASMembers = 20,709Students = 3,366
CAIMembers = 24,496Students = 6,627
CIPFA Members = 13,640Students = 3,779
ACCAMembers = 183,386Students = 388,636
AIAMembers = 1,489Students = 201
ICASMembers = 17,852Students = 3,350
CIPFA Members = 12,957Students = 1,937
CIMAMembers = 78,402Students = 51,677
ACCAMembers = 86,828Students = 81,460
ICASEdinburgh
CAIBelfast
CIMALondon
AIANewcastle
CIPFALondon
ICAEWLondon
ACCALondon
ACCA continues to be the largest of these bodies in terms of worldwide membership
1 The location of members and students is based on the registered address supplied to the accountancy bodies and may be either the place of employment or the place of residence.
CAIMembers = 21,699Students = 6,623
Mem
bers
and
Stu
dent
s of
Acc
ount
ancy
Bod
ies
10 Key Facts and Trends in the Accountancy Profession (June 2016)
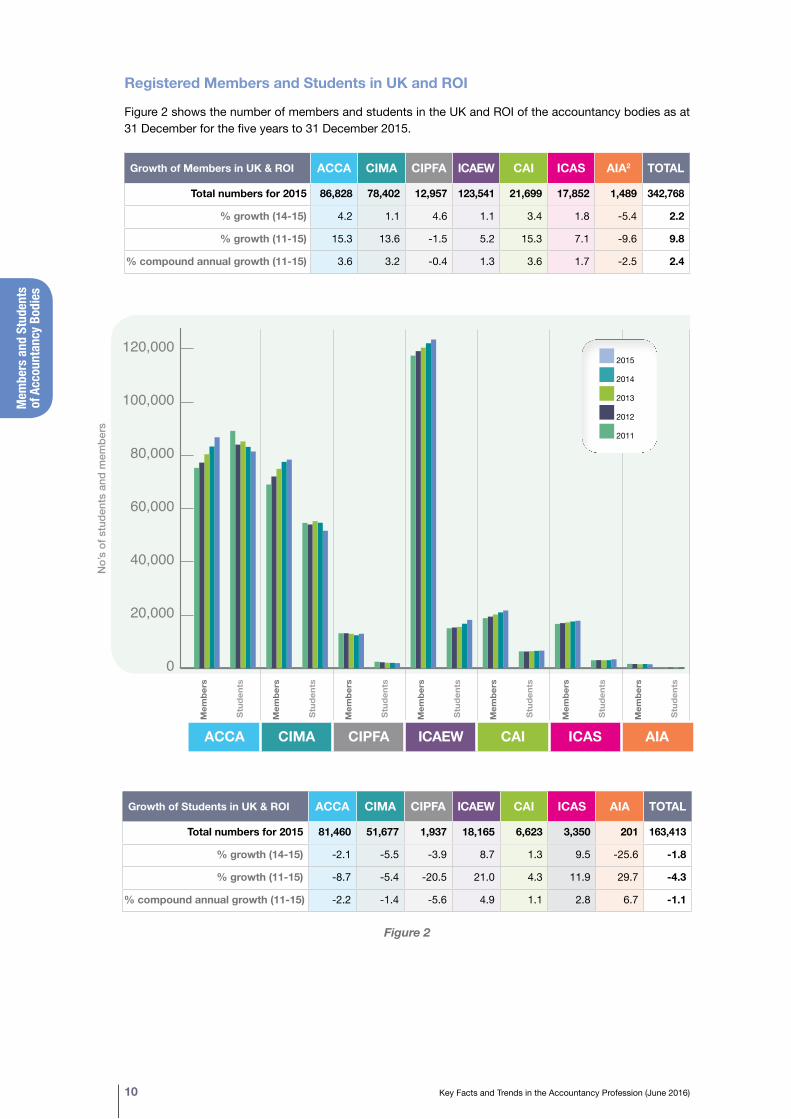
Registered Members and Students in UK and ROI
Figure 2 shows the number of members and students in the UK and ROI of the accountancy bodies as at 31 December for the five years to 31 December 2015.
Growth of Members in UK & ROI ACCA CIMA CIPFA ICAEW CAI ICAS AIA2 TOTAL
Total numbers for 2015 86,828 78,402 12,957 123,541 21,699 17,852 1,489 342,768
% growth (14-15) 4.2 1.1 4.6 1.1 3.4 1.8 -5.4 2.2
% growth (11-15) 15.3 13.6 -1.5 5.2 15.3 7.1 -9.6 9.8
% compound annual growth (11-15) 3.6 3.2 -0.4 1.3 3.6 1.7 -2.5 2.4
0
20,000
40,000
60,000
80,000
100,000
120,000
140,000e
d
c
b
a
AIAICASCAI ICAEWCIPFA CIMAACCA
Mem
bers
Stud
ents
Mem
bers
Stud
ents
Mem
bers
Stud
ents
Mem
bers
Stud
ents
Mem
bers
Stud
ents
Mem
bers
Stud
ents
Mem
bers
Stud
ents
ACCA CIMA CIPFA ICAEW CAI ICAS AIA
No’
s of
stu
dent
s an
d m
embe
rs
2015
2014
2013
2012
2011
Growth of Students in UK & ROI ACCA CIMA CIPFA ICAEW CAI ICAS AIA TOTAL
Total numbers for 2015 81,460 51,677 1,937 18,165 6,623 3,350 201 163,413
% growth (14-15) -2.1 -5.5 -3.9 8.7 1.3 9.5 -25.6 -1.8
% growth (11-15) -8.7 -5.4 -20.5 21.0 4.3 11.9 29.7 -4.3
% compound annual growth (11-15) -2.2 -1.4 -5.6 4.9 1.1 2.8 6.7 -1.1
Figure 2
Mem
bers and Students of Accountancy Bodies
Financial Reporting Council 11
Growth of Students Worldwide ACCA CIMA CIPFA ICAEW CAI ICAS AIA TOTAL
Total numbers for 2015 388,636 125,763 3,779 24,149 6,627 3,366 7,474 559,794
% growth (14-15) 4.0 -1.6 12.4 9.8 1.2 9.6 -17.5 2.6
% growth (11-15) 11.3 18.0 48.2 26.6 4.2 11.3 -11.4 13.0
% compound annual growth (11-15) 2.7 4.2 10.3 6.1 1.0 2.7 -3.0 3.1
Figure 3
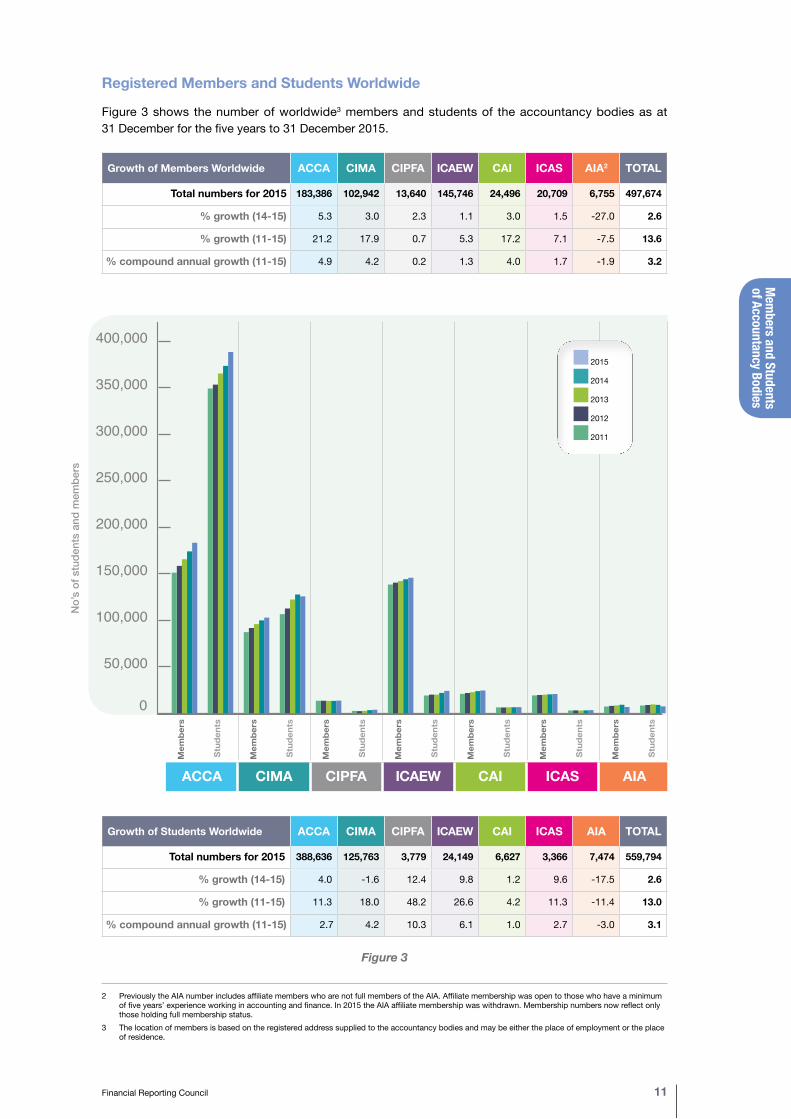
Registered Members and Students Worldwide
Figure 3 shows the number of worldwide3 members and students of the accountancy bodies as at 31 December for the five years to 31 December 2015.
Growth of Members Worldwide ACCA CIMA CIPFA ICAEW CAI ICAS AIA2 TOTAL
Total numbers for 2015 183,386 102,942 13,640 145,746 24,496 20,709 6,755 497,674
% growth (14-15) 5.3 3.0 2.3 1.1 3.0 1.5 -27.0 2.6
% growth (11-15) 21.2 17.9 0.7 5.3 17.2 7.1 -7.5 13.6
% compound annual growth (11-15) 4.9 4.2 0.2 1.3 4.0 1.7 -1.9 3.2
2 Previously the AIA number includes affiliate members who are not full members of the AIA. Affiliate membership was open to those who have a minimum of five years’ experience working in accounting and finance. In 2015 the AIA affiliate membership was withdrawn. Membership numbers now reflect only those holding full membership status.
3 The location of members is based on the registered address supplied to the accountancy bodies and may be either the place of employment or the place of residence.
0
50,000
100,000
150,000
200,000
250,000
300,000
350,000
400,000
e
d
c
b
a
AIAICASCAI ICAEWCIPFA CIMAACCA
Mem
bers
Stud
ents
Mem
bers
Stud
ents
Mem
bers
Stud
ents
Mem
bers
Stud
ents
Mem
bers
Stud
ents
Mem
bers
Stud
ents
Mem
bers
Stud
ents
ACCA CIMA CIPFA ICAEW CAI ICAS AIA
No’
s of
stu
dent
s an
d m
embe
rs
2015
2014
2013
2012
2011
Mem
bers
and
Stu
dent
s of
Acc
ount
ancy
Bod
ies
12 Key Facts and Trends in the Accountancy Profession (June 2016)
The total number of members of the accountancy bodies in the UK and ROI has continued to grow steadily at a compound annual growth rate of 2.4% for the period 2011 to 2015. Total membership in the UK and ROI increased by 2.2% from 2014 to 2015 compared with 2.4% from 2013 to 2014.
There are significant differences in growth rates of the accountancy bodies in the UK and ROI. ACCA, CIMA and CAI show the strongest membership growth between 2011 and 2015, with compound annual growth rates of 3.6%, 3.2% and 3.6%, respectively. UK and ROI membership of AIA and CIPFA has declined during this period.
The total number of students of the accountancy bodies in the UK and ROI has further declined by 1.8% from 2014 to 2015 compared with a decrease of 0.8% between 2013 to 2014.
Although the total student numbers of the accountancy bodies in the UK and ROI have declined, ICAEW, CAI and ICAS have seen an increase in student numbers between 2014 and 2015.
Worldwide membership of the accountancy bodies continues to grow at a faster rate than UK and ROI membership (worldwide membership has increased by a compound annual growth rate of 3.2% for the 2011-15 period, compared to 2.4% for UK and ROI membership).
There continues to be wide differences between the accountancy bodies in terms of the numbers and rates of growth in worldwide student membership.
Total worldwide student numbers increased by 2.6% from 2014 to 2015 with an overall compound annual growth rate of 3.1% between 2011 to 2015.
All of the accountancy bodies, apart from AIA, experienced growth in worldwide student numbers between 2011 and 2015.
Mem
bers and Students of Accountancy Bodies
Financial Reporting Council 13
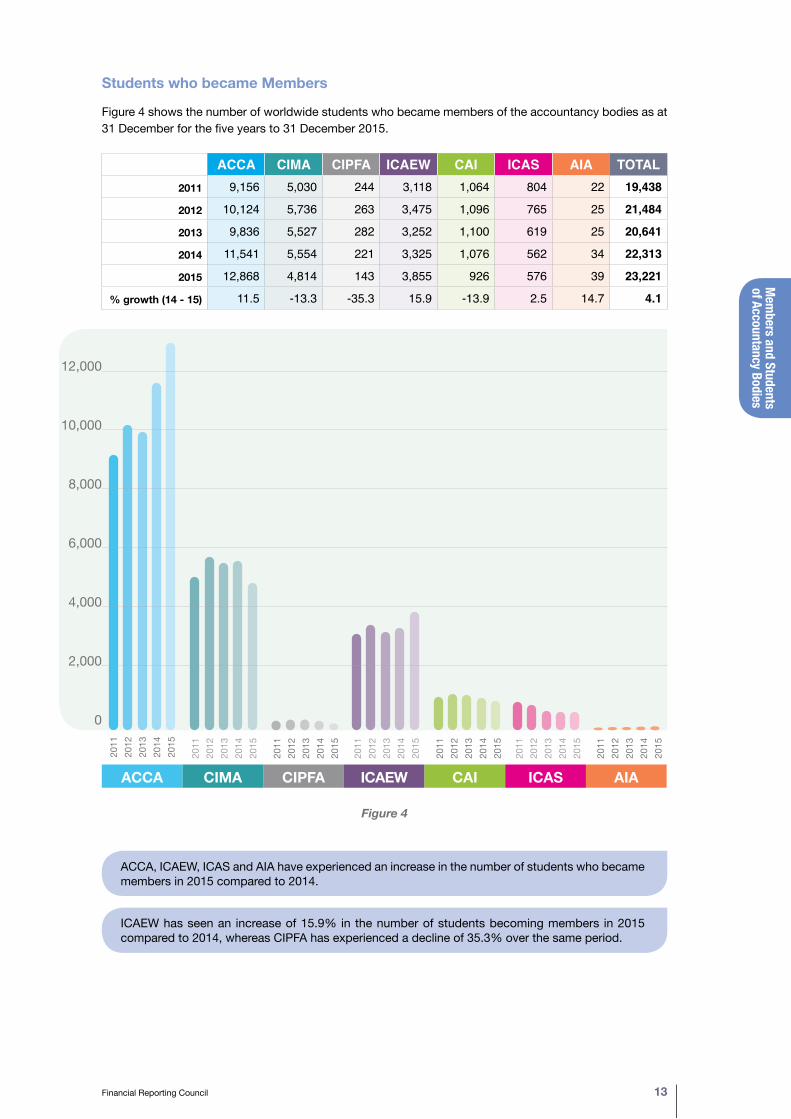
Students who became Members
Figure 4 shows the number of worldwide students who became members of the accountancy bodies as at 31 December for the five years to 31 December 2015.
ACCA CIMA CIPFA ICAEW CAI ICAS AIA TOTAL2011 9,156 5,030 244 3,118 1,064 804 22 19,438
2012 10,124 5,736 263 3,475 1,096 765 25 21,484
2013 9,836 5,527 282 3,252 1,100 619 25 20,641
2014 11,541 5,554 221 3,325 1,076 562 34 22,313
2015 12,868 4,814 143 3,855 926 576 39 23,221
% growth (14 - 15) 11.5 -13.3 -35.3 15.9 -13.9 2.5 14.7 4.1
Figure 4
ACCA, ICAEW, ICAS and AIA have experienced an increase in the number of students who became members in 2015 compared to 2014.
ICAEW has seen an increase of 15.9% in the number of students becoming members in 2015 compared to 2014, whereas CIPFA has experienced a decline of 35.3% over the same period.
2011
2012
2013
2014
2015
2011
2012
2013
2014
2015
2011
2012
2013
2014
2015
2011
2012
2013
2014
2015
2011
2012
2013
2014
2015
2011
2012
2013
2014
2015
2011
2012
2013
2014
2015
ACCA CIMA CIPFA ICAEW CAI ICAS AIA
12,000
10,000
8,000
6,000
4,000
2,000
0
Mem
bers
and
Stu
dent
s of
Acc
ount
ancy
Bod
ies
14 Key Facts and Trends in the Accountancy Profession (June 2016)
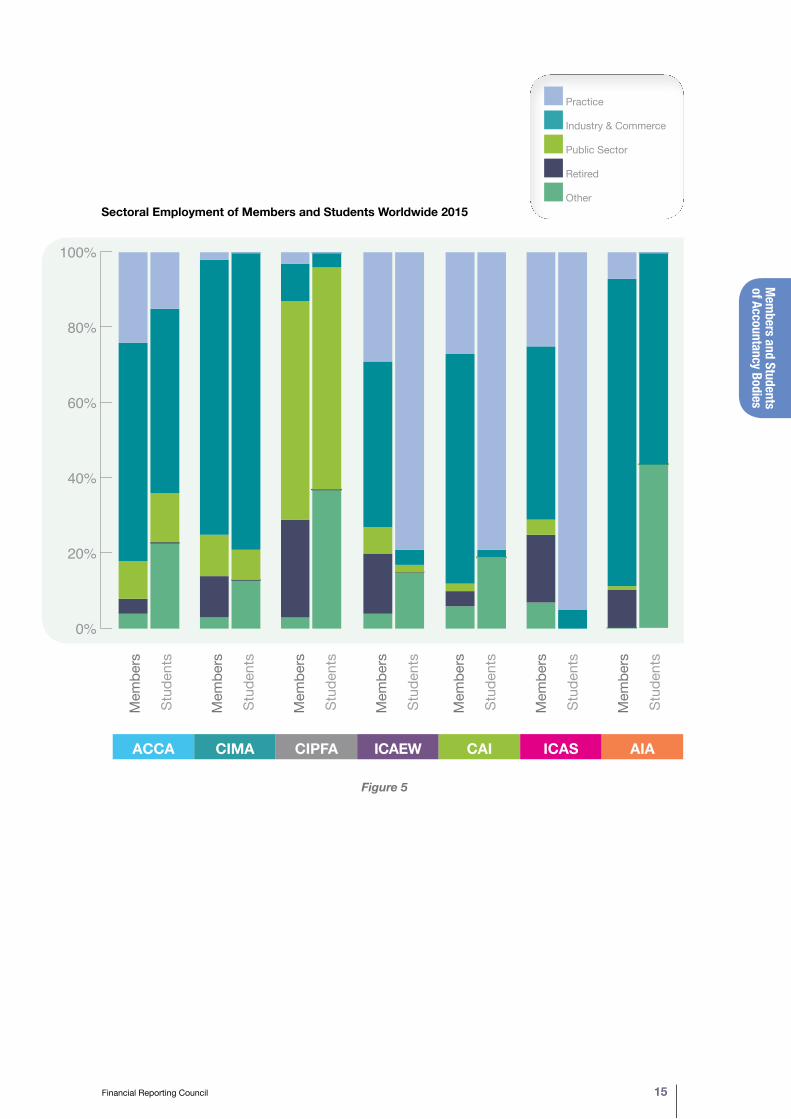
Sectoral Employment of Members and Students Worldwide
Figure 5 shows the percentages of worldwide members and students of the accountancy bodies, according to their sectoral employment4 at the end of 2015.
4 (i) The ICAS figure for industry and commerce includes students working within the public sector. (ii) ‘Other’ for members includes those members who are unemployed, taking a career break, undertaking full time study, on maternity leave, and any
members who are unclassified, for example, because they have not provided the information. In the case of CAI, all such members are included in their most recent employment category where available. ICAEW includes members working within the charity sector under ‘Public Sector’.
(iii) ACCA define ‘other’ for students not in employment, employed in other sectors, those in full time education, independent students for whom no information on their employment is available and those individuals who have passed their final examinations and are entitled to membership but have yet to be admitted.
There are few CIMA, CIPFA and AIA members employed in practice, at 2%, 3% and 7% respectively.
CIPFA is the only accountancy body with the majority of its members (58%) employed in the public sector.
Over 95% of ICAS students are in practice. In contrast 15% of ACCA students, and 1% or less of CIPFA, CIMA and AIA students, are employed in practice.
CIMA has the highest percentage of students in industry and commerce (79%). Collectively, 54% of students are in industry and commerce across the accountancy bodies.
Across the accountancy bodies, 18% of students are employed in practice and 10% in the public sector.
ACCA students are the most evenly dispersed across the different employment sectors.
Mem
bers and Students of Accountancy Bodies
Financial Reporting Council 15
0%
20%
40%
60%
80%
100%
1.2
Other
Retired
Public Sector
Industry & Commerce
Public Practice
AIAICASCAI ICAEWCIPFACIMAACCA
0%
20%
40%
60%
80%
100%
1.2
Other
Retired
Public Sector
Industry & Commerce
Public Practice
AIAICASCAI ICAEWCIPFACIMAACCA
0%
20%
40%
60%
80%
100%
1.2
Other
Retired
Public Sector
Industry & Commerce
Public Practice
AIAICASCAI ICAEWCIPFACIMAACCA
0%
20%
40%
60%
80%
100%
1.2
Other
Retired
Public Sector
Industry & Commerce
Public Practice
AIAICASCAI ICAEWCIPFACIMAACCA
0%
20%
40%
60%
80%
100%
1.2
Other
Retired
Public Sector
Industry & Commerce
Public Practice
AIAICASCAI ICAEWCIPFACIMAACCA
0%
20%
40%
60%
80%
100%
1.2
Other
Retired
Public Sector
Industry & Commerce
Public Practice
AIAICASCAI ICAEWCIPFACIMAACCA
0%
20%
40%
60%
80%
100%
1.2
Other
Retired
Public Sector
Industry & Commerce
Public Practice
AIAICASCAI ICAEWCIPFACIMAACCA
0%
20%
40%
60%
80%
100%
1.2
Other
Retired
Public Sector
Industry & Commerce
Public Practice
AIAICASCAI ICAEWCIPFACIMAACCA
Mem
bers
Stud
ents
Mem
bers
Stud
ents
Mem
bers
Stud
ents
Mem
bers
Stud
ents
Mem
bers
Stud
ents
Mem
bers
Stud
ents
Mem
bers
Stud
ents
Practice
Industry & Commerce
Public Sector
Retired
Other Sectoral Employment of Members and Students Worldwide 2015
ACCA CIMA CIPFA ICAEW CAI ICAS AIA
Figure 5
Mem
bers
and
Stu
dent
s of
Acc
ount
ancy
Bod
ies
16 Key Facts and Trends in the Accountancy Profession (June 2016)
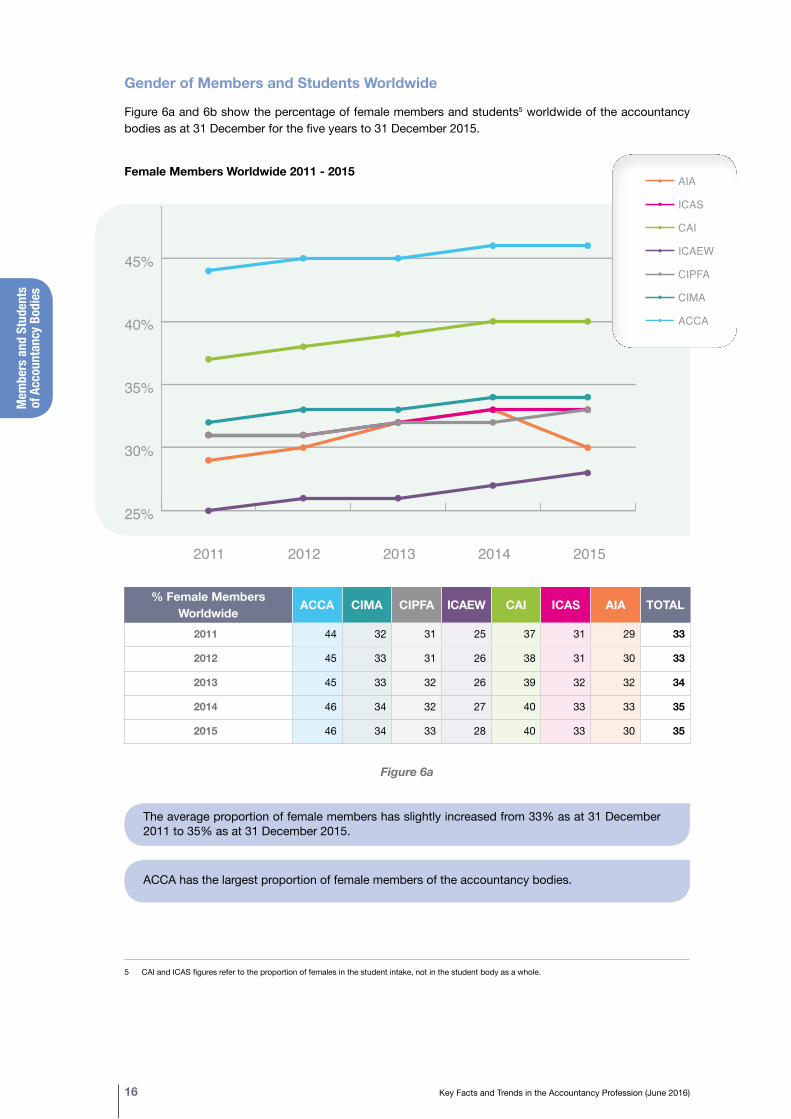
% Female Members Worldwide ACCA CIMA CIPFA ICAEW CAI ICAS AIA TOTAL
2011 44 32 31 25 37 31 29 33
2012 45 33 31 26 38 31 30 33
2013 45 33 32 26 39 32 32 34
2014 46 34 32 27 40 33 33 35
2015 46 34 33 28 40 33 30 35
Figure 6a
The average proportion of female members has slightly increased from 33% as at 31 December 2011 to 35% as at 31 December 2015.
ACCA has the largest proportion of female members of the accountancy bodies.
Gender of Members and Students Worldwide
Figure 6a and 6b show the percentage of female members and students5 worldwide of the accountancy bodies as at 31 December for the five years to 31 December 2015.
Female Members Worldwide 2011 - 2015
5 CAI and ICAS figures refer to the proportion of females in the student intake, not in the student body as a whole.
25%
30%
35%
40%
45%
50% AIA
ICAS
CAI
ICAEW
CIPFA
CIMA
ACCA20152014201320122011
25%
30%
35%
40%
45%
50% AIA
ICAS
CAI
ICAEW
CIPFA
CIMA
ACCA20152014201320122011
35%
40%
45%
50%
55%
60%
65% AIA
ICAS
CAI
ICAEW
CIPFA
CIMA
ACCA20152014201320122011
Mem
bers and Students of Accountancy Bodies
Financial Reporting Council 17
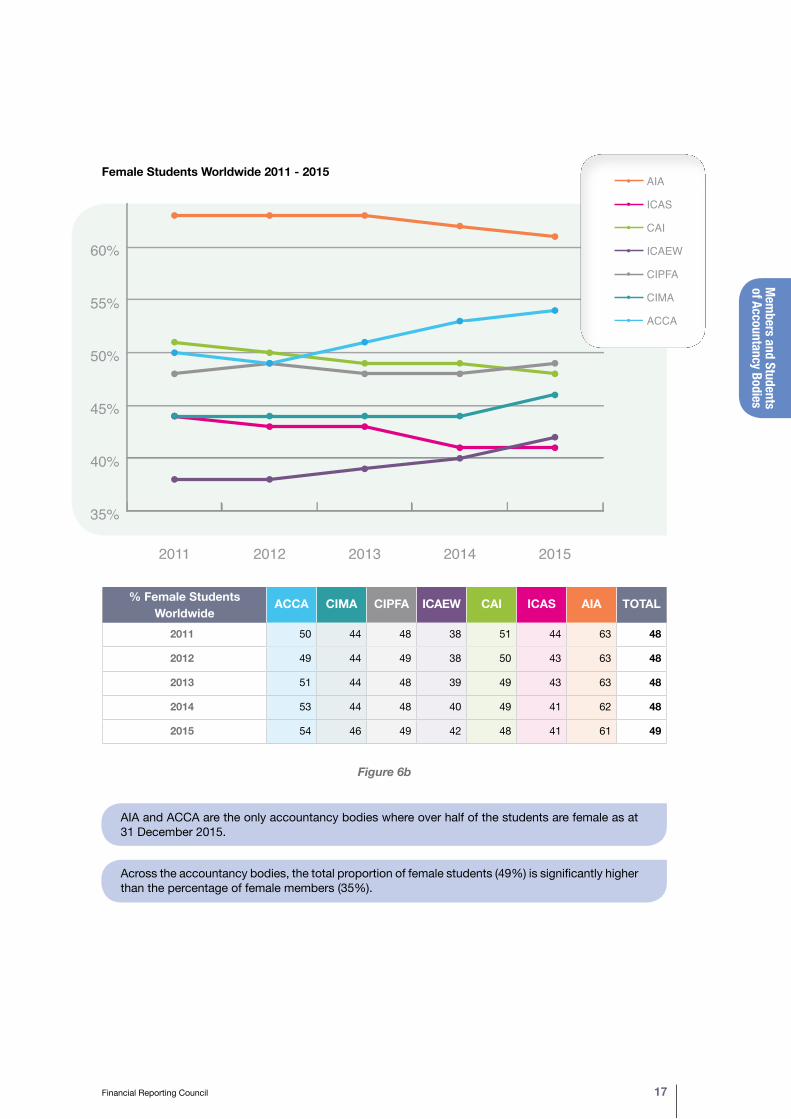
Female Students Worldwide 2011 - 2015
35%
40%
45%
50%
55%
60%
65% AIA
ICAS
CAI
ICAEW
CIPFA
CIMA
ACCA2015201420132012201135%
40%
45%
50%
55%
60%
65% AIA
ICAS
CAI
ICAEW
CIPFA
CIMA
ACCA20152014201320122011
% Female Students Worldwide
ACCA CIMA CIPFA ICAEW CAI ICAS AIA TOTAL
2011 50 44 48 38 51 44 63 48
2012 49 44 49 38 50 43 63 48
2013 51 44 48 39 49 43 63 48
2014 53 44 48 40 49 41 62 48
2015 54 46 49 42 48 41 61 49
Figure 6b
AIA and ACCA are the only accountancy bodies where over half of the students are female as at 31 December 2015.
Across the accountancy bodies, the total proportion of female students (49%) is significantly higher than the percentage of female members (35%).
25%
30%
35%
40%
45%
50% AIA
ICAS
CAI
ICAEW
CIPFA
CIMA
ACCA20152014201320122011
Mem
bers
and
Stu
dent
s of
Acc
ount
ancy
Bod
ies
18 Key Facts and Trends in the Accountancy Profession (June 2016)
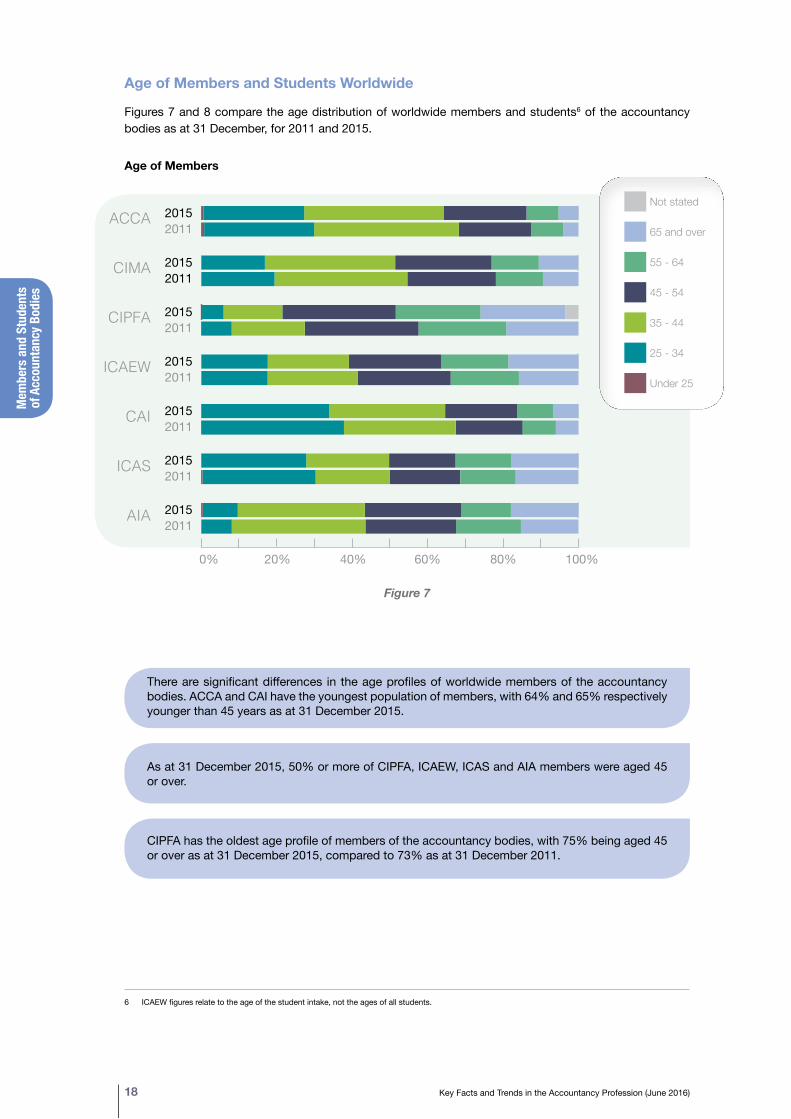
6 ICAEW figures relate to the age of the student intake, not the ages of all students.
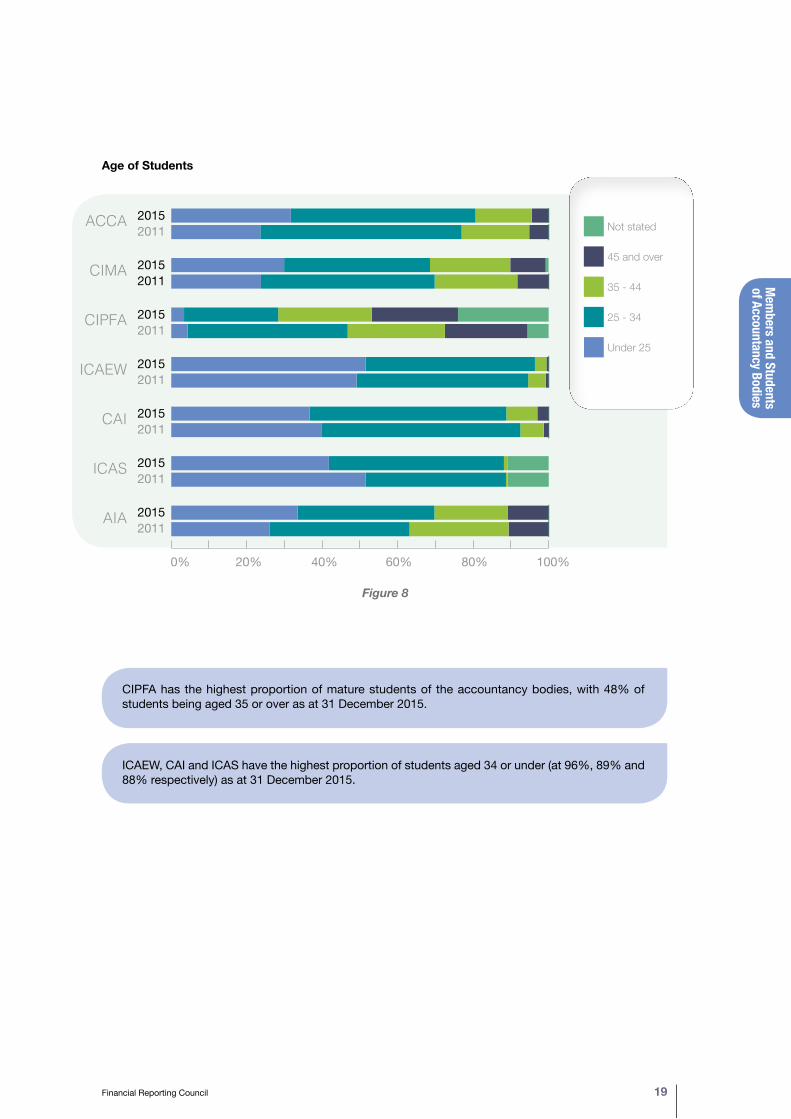
Age of Members and Students Worldwide
Figures 7 and 8 compare the age distribution of worldwide members and students6 of the accountancy bodies as at 31 December, for 2011 and 2015.
Age of Members
0 10 20 30 40 50 60 70 80 90 100
Not stated
65 and over
55 - 64
45 - 54
35 - 44
25 - 34
Under 25AIA
ICAS
CAI
ICAEW
CIPFA
CIMA
ACCA 20152011
20152011
20152011
20152011
20152011
20152011
20152011
0% 20% 40% 60% 80% 100%
Figure 7
There are significant differences in the age profiles of worldwide members of the accountancy bodies. ACCA and CAI have the youngest population of members, with 64% and 65% respectively younger than 45 years as at 31 December 2015.
As at 31 December 2015, 50% or more of CIPFA, ICAEW, ICAS and AIA members were aged 45 or over.
CIPFA has the oldest age profile of members of the accountancy bodies, with 75% being aged 45 or over as at 31 December 2015, compared to 73% as at 31 December 2011.
0 10 20 30 40 50 60 70 80 90 100
Not stated
65 and over
55 - 64
45 - 54
35 - 44
25 - 34
Under 25AIA
ICAS
CAI
ICAEW
CIPFA
CIMA
ACCA
0 10 20 30 40 50 60 70 80 90 100
Not stated
65 and over
55 - 64
45 - 54
35 - 44
25 - 34
Under 25AIA
ICAS
CAI
ICAEW
CIPFA
CIMA
ACCA
20152011
20152011
20152011
20152011
20152011
20152011
20152011
Mem
bers and Students of Accountancy Bodies
Financial Reporting Council 19
Age of Students
0 1020
30 40 50 60 70 80 90 100
Not stated
45 and over
35 - 44
25 - 34
Under 25
AIA
ICAS
CAI
ICAEW
CIPFA
CIMA
ACCA
0 1020
30 40 50 60 70 80 90 100
Not stated
45 and over
35 - 44
25 - 34
Under 25
AIA
ICAS
CAI
ICAEW
CIPFA
CIMA
ACCA
0% 20% 40% 60% 80% 100%
0 1020
30 40 50 60 70 80 90 100
Not stated
45 and over
35 - 44
25 - 34
Under 25
AIA
ICAS
CAI
ICAEW
CIPFA
CIMA
ACCA
Figure 8
CIPFA has the highest proportion of mature students of the accountancy bodies, with 48% of students being aged 35 or over as at 31 December 2015.
ICAEW, CAI and ICAS have the highest proportion of students aged 34 or under (at 96%, 89% and 88% respectively) as at 31 December 2015.
Mem
bers
and
Stu
dent
s of
Acc
ount
ancy
Bod
ies
20 Key Facts and Trends in the Accountancy Profession (June 2016)
7 The location of students is based on the registered address supplied to the accountancy body and may be either their place of employment or their place or residence.
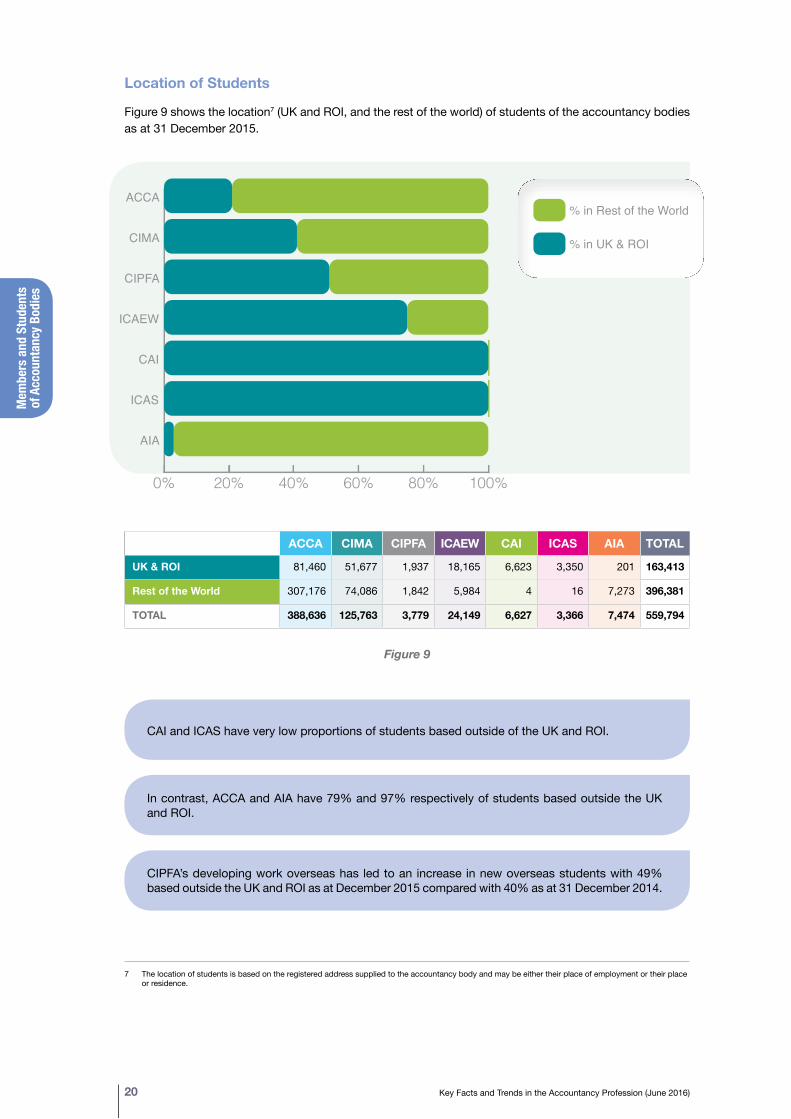
Location of Students
Figure 9 shows the location7 (UK and ROI, and the rest of the world) of students of the accountancy bodies as at 31 December 2015.
ACCA CIMA CIPFA ICAEW CAI ICAS AIA TOTAL
UK & ROI 81,460 51,677 1,937 18,165 6,623 3,350 201 163,413
Rest of the World 307,176 74,086 1,842 5,984 4 16 7,273 396,381
TOTAL 388,636 125,763 3,779 24,149 6,627 3,366 7,474 559,794
Figure 9
CAI and ICAS have very low proportions of students based outside of the UK and ROI.
In contrast, ACCA and AIA have 79% and 97% respectively of students based outside the UK and ROI.
CIPFA’s developing work overseas has led to an increase in new overseas students with 49% based outside the UK and ROI as at December 2015 compared with 40% as at 31 December 2014.
0% 20% 40% 60% 80% 100%
% in Rest of the World
% in UK & ROI
AIA
ICAS
CAI
ICAEW
CIPFA
CIMA
ACCA
0% 20% 40% 60% 80% 100%
% in Rest of the World
% in UK & ROI
AIA
ICAS
CAI
ICAEW
CIPFA
CIMA
ACCA

Mem
bers and Students of Accountancy Bodies
Financial Reporting Council 21
8 The information from CIPFA is only available since their move to a new business system in late 2009. The number of students shown in the > 4 - 5 years category includes information on students transferred from their previous system and data for the ≥ 5 years category is not available.
9 Individuals at CIMA who are entitled to membership but have not yet been admitted (passed finalists) are included in the figures according to the length of time they have been either a student or a passed finalist.
Profile of Students Worldwide of Seven Accountancy Bodies
Figure 10 sets out, on a worldwide basis, the length of time that individuals have been registered as students with the accountancy bodies8.
0%
20%
40%
60%
80%
100% ≥ 5 Years
> 4 - 5 Years
> 3 - 4 Years
> 2 - 3 Years
>1 - 2 Years
≤ 1 Year
AIAICASCAIICAEWCIPFACIMAACCA0%
20%
40%
60%
80%
100% ≥ 5 Years
> 4 - 5 Years
> 3 - 4 Years
> 2 - 3 Years
>1 - 2 Years
≤ 1 Year
AIAICASCAIICAEWCIPFACIMAACCA
0
20
40
60
80
100 ≥ 5 Years
> 4 - 5 Years
> 3 - 4 Years
> 2 - 3 Years
>1 - 2 Years
≤ 1 Year
AIAICASCAIICAEWCIPFACIMAACCA
Figure 10
Figure 10 must be read with caution as there is not a common basis for determining the length of time between registering as a student and achieving the requirements for membership9.
Students at ACCA, CIMA, and AIA do not typically undertake intensive study and generally take longer to complete the requirements for membership, compared to students of the other accountancy bodies.
A high percentage of ICAEW and ICAS students complete their training in 4 years or less, with only 6% and 10% of students respectively being registered for more than 4 years, as at 31 December 2015.
Mem
bers
and
Stu
dent
s of
Acc
ount
ancy
Bod
ies
22 Key Facts and Trends in the Accountancy Profession (June 2016)
10 The accountancy bodies’ definitions of a “relevant degree” are as follows: ACCA - Accountancy, Finance, Accountancy & Finance CIMA - Business Studies, Business Administration, Finance, Accountancy CIPFA - Accountancy ICAEW - Accountancy, Finance, Accounting & Finance CAI - Accountancy, Business & Commerce, Finance ICAS - Accountancy AIA - Accountancy, Business, Finance, Accounting & Finance
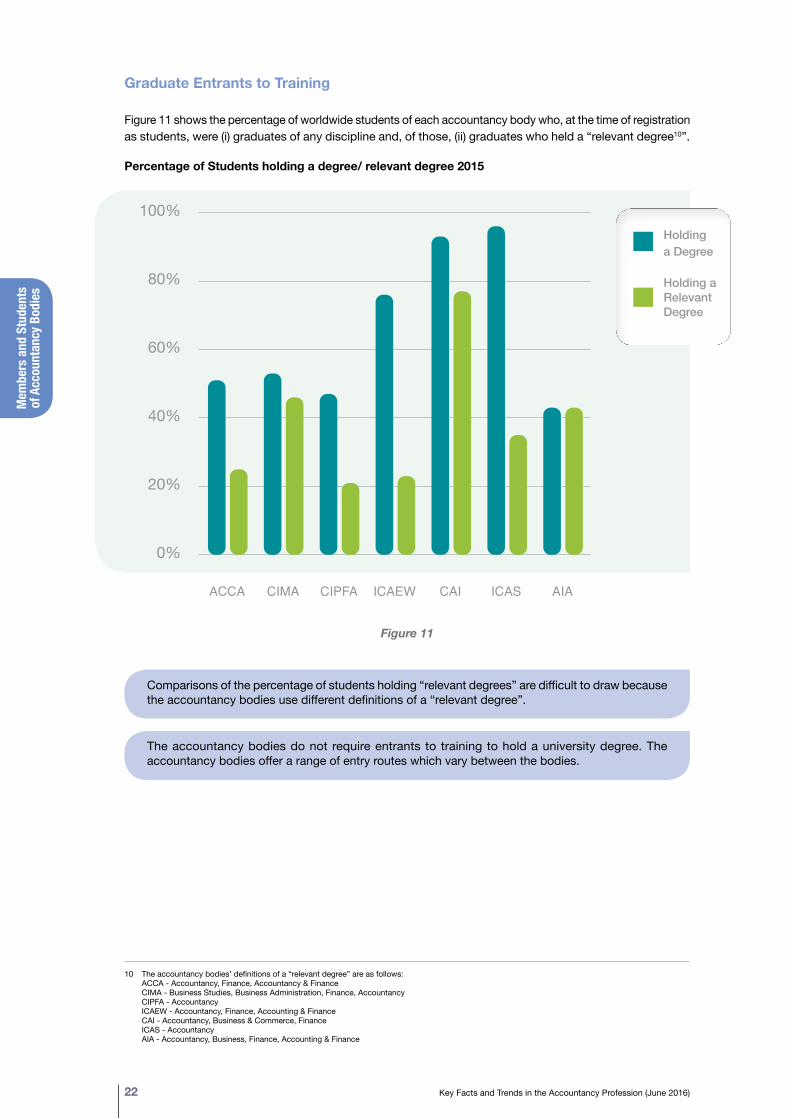
Graduate Entrants to Training
Figure 11 shows the percentage of worldwide students of each accountancy body who, at the time of registration as students, were (i) graduates of any discipline and, of those, (ii) graduates who held a “relevant degree10”.
Percentage of Students holding a degree/ relevant degree 2015
0
20%
40%
60%
80%
100%
Holding a Relevant Degree
Holding a Degree
AIAICASCAIICAEWCIPFACIMAACCA
0
20%
40%
60%
80%
100%
Holding a Relevant Degree
Holding a Degree
AIAICASCAIICAEWCIPFACIMAACCA
Holding a Degree
Holding a RelevantDegree
0%
20%
40%
60%
80%
100%
Holding a Relevant Degree
Holding a Degree
AIAICASCAIICAEWCIPFACIMAACCA0%
20%
40%
60%
80%
100%
Holding a Relevant Degree
Holding a Degree
AIAICASCAIICAEWCIPFACIMAACCA
Figure 11
Comparisons of the percentage of students holding “relevant degrees” are difficult to draw because the accountancy bodies use different definitions of a “relevant degree”.
The accountancy bodies do not require entrants to training to hold a university degree. The accountancy bodies offer a range of entry routes which vary between the bodies.
0%
10%
20%
30%
40%
50%
Students
Members
45 and over35 - 4425 - 34Under 25
Mem
bers and Students of Accountancy Bodies
Financial Reporting Council 23
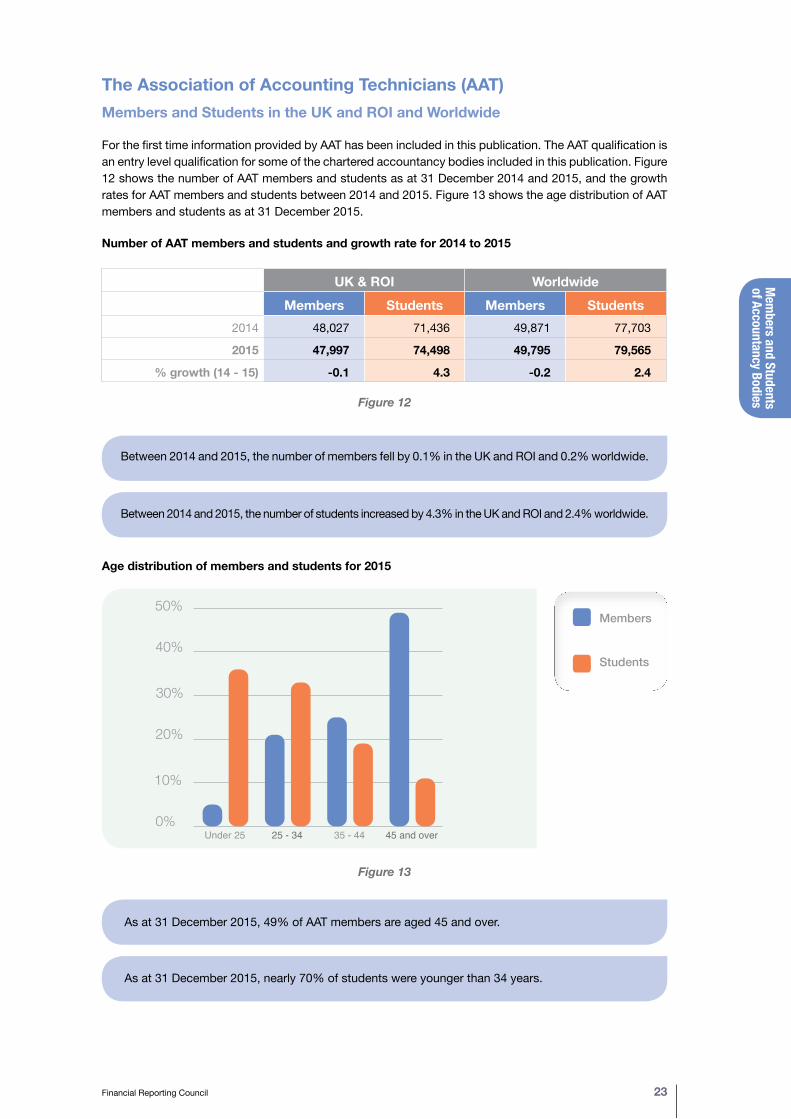
The Association of Accounting Technicians (AAT) Members and Students in the UK and ROI and Worldwide
For the first time information provided by AAT has been included in this publication. The AAT qualification is an entry level qualification for some of the chartered accountancy bodies included in this publication. Figure 12 shows the number of AAT members and students as at 31 December 2014 and 2015, and the growth rates for AAT members and students between 2014 and 2015. Figure 13 shows the age distribution of AAT members and students as at 31 December 2015.
Number of AAT members and students and growth rate for 2014 to 2015
UK & ROI WorldwideMembers Students Members Students
2014 48,027 71,436 49,871 77,703
2015 47,997 74,498 49,795 79,565
% growth (14 - 15) -0.1 4.3 -0.2 2.4
Figure 12
Between 2014 and 2015, the number of members fell by 0.1% in the UK and ROI and 0.2% worldwide.
Between 2014 and 2015, the number of students increased by 4.3% in the UK and ROI and 2.4% worldwide.
Age distribution of members and students for 2015
Figure 13
As at 31 December 2015, 49% of AAT members are aged 45 and over.
As at 31 December 2015, nearly 70% of students were younger than 34 years.
0%
10%
20%
30%
40%
Students
Members
65 & over55 - 6445 - 5435 - 4425 - 34Under 25
0%
10%
20%
30%
40%
Students
Members
65 & over55 - 6445 - 5435 - 4425 - 34Under 25
Members
Students
Mem
bers
and
Stu
dent
s of
Acc
ount
ancy
Bod
ies
24 Key Facts and Trends in the Accountancy Profession (June 2016)
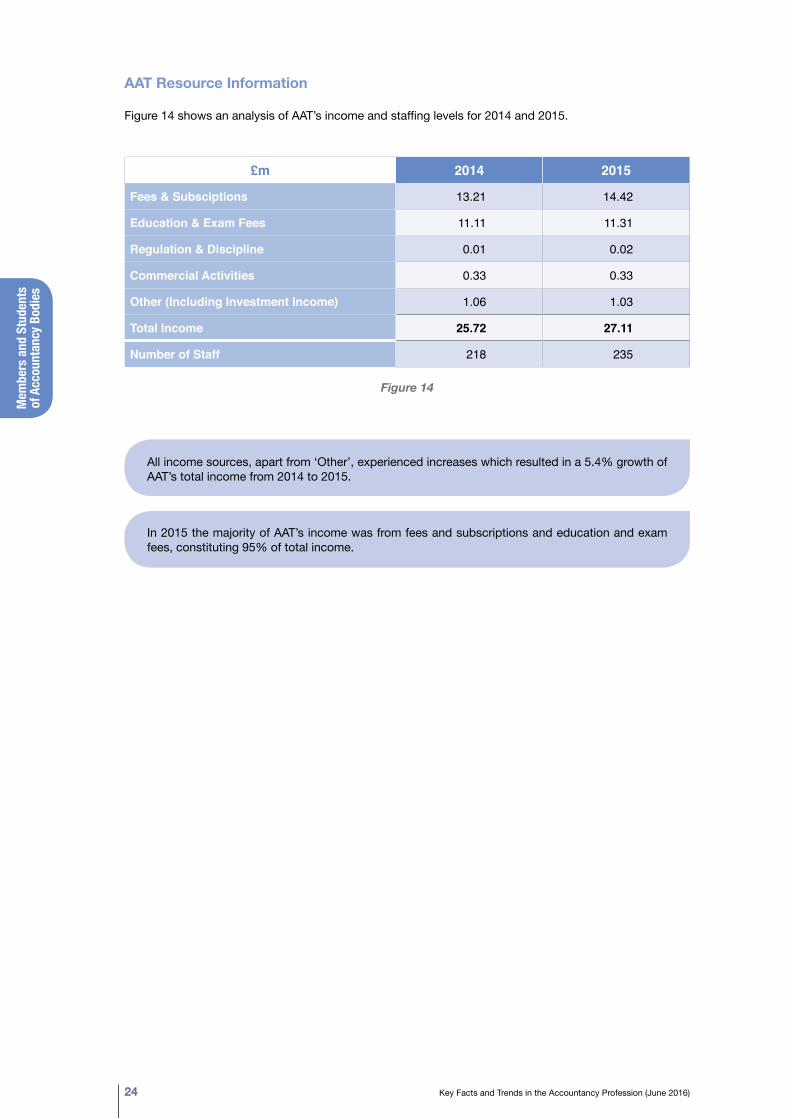
AAT Resource Information
Figure 14 shows an analysis of AAT’s income and staffing levels for 2014 and 2015.
£m 2014 2015
Fees & Subsciptions 13.21 14.42
Education & Exam Fees 11.11 11.31
Regulation & Discipline 0.01 0.02
Commercial Activities 0.33 0.33
Other (Including Investment Income) 1.06 1.03
Total Income 25.72 27.11
Number of Staff 218 235
Figure 14
All income sources, apart from ‘Other’, experienced increases which resulted in a 5.4% growth of AAT’s total income from 2014 to 2015.
In 2015 the majority of AAT’s income was from fees and subscriptions and education and exam fees, constituting 95% of total income.

Resource Information
on Accountancy Bodies
Financial Reporting Council 25
0
20
40
60
80
100
120
140
160
180 AIA
ICAS
CAI
ICAEW
CIPFA
CIMA
ACCA201520142013201220110
20
40
60
80
100
120
140
160
180 AIA
ICAS
CAI
ICAEW
CIPFA
CIMA
ACCA20152014201320122011
Section Three Resource Information on Accountancy Bodies
Income of Accountancy Bodies
Figures 15 to 17 show the income, average income per member/student and analysis of income of the accountancy bodies on a worldwide basis, from 2011 to 20151&2.
Figure 15
CIPFA has seen a 25% decrease in income between 2014 and 2015. In 2014, CIPFA’s income included the one off impact of the sale of three London properties3.
CIMA experienced a 12% fall in income due to the introduction a new assessment platform for student exams, which meant that fewer students sat exams in the year3.
There was an 11% increase in income for ICAEW from 2014 to 2015. Around half of this growth is from recovered fines and costs imposed by FRC in relation to disciplinary cases of ICAEW members and member firms3.
The aggregate compound annual income growth rate for the accountancy bodies was 4.2% from 2011 to 2015.
1 The ACCA’s figures are for the year to 31 March. ACCA’s figures to 31 March 2016 are provisional.2 CAI income has been converted from Euros at the year-end rate. As at 31 December 2015 the rate was £1.00 = €1.363 Sourced from the respective accountancy body.
£m
25
30
35
40
45
50 AIA
ICAS
CAI
ICAEW
CIPFA
CIMA
ACCA20142013201220112010
0
20
40
60
80
100
120
140
160
180 AIA
ICAS
CAI
ICAEW
CIPFA
CIMA
ACCA20152014201320122011

Reso
urce
Info
rmat
ion
on A
ccou
ntan
cy B
odies
26 Key Facts and Trends in the Accountancy Profession (June 2016)
4 The average income per member and student is calculated from the income of the accountancy body, excluding Commercial Activities and Other from Figure 16.
Average Income per Member and Student4
Figure 16
CIMA and CAI experienced a drop in the average income per member and student between 2011 and 2015 of 13.2% and 19.9% respectively.
0
100
200
300
400
500
600
700
800 AIA
ICAS
CAI
ICAEW
CIPFA
CIMA
ACCA20152014201320122011
0
100
200
300
400
500
600
700
800 AIA
ICAS
CAI
ICAEW
CIPFA
CIMA
ACCA20152014201320122011
£25
30
35
40
45
50 AIA
ICAS
CAI
ICAEW
CIPFA
CIMA
ACCA20142013201220112010
0
20
40
60
80
100
120
140
160
180 AIA
ICAS
CAI
ICAEW
CIPFA
CIMA
ACCA20152014201320122011
Resource Information
on Accountancy Bodies
Financial Reporting Council 27
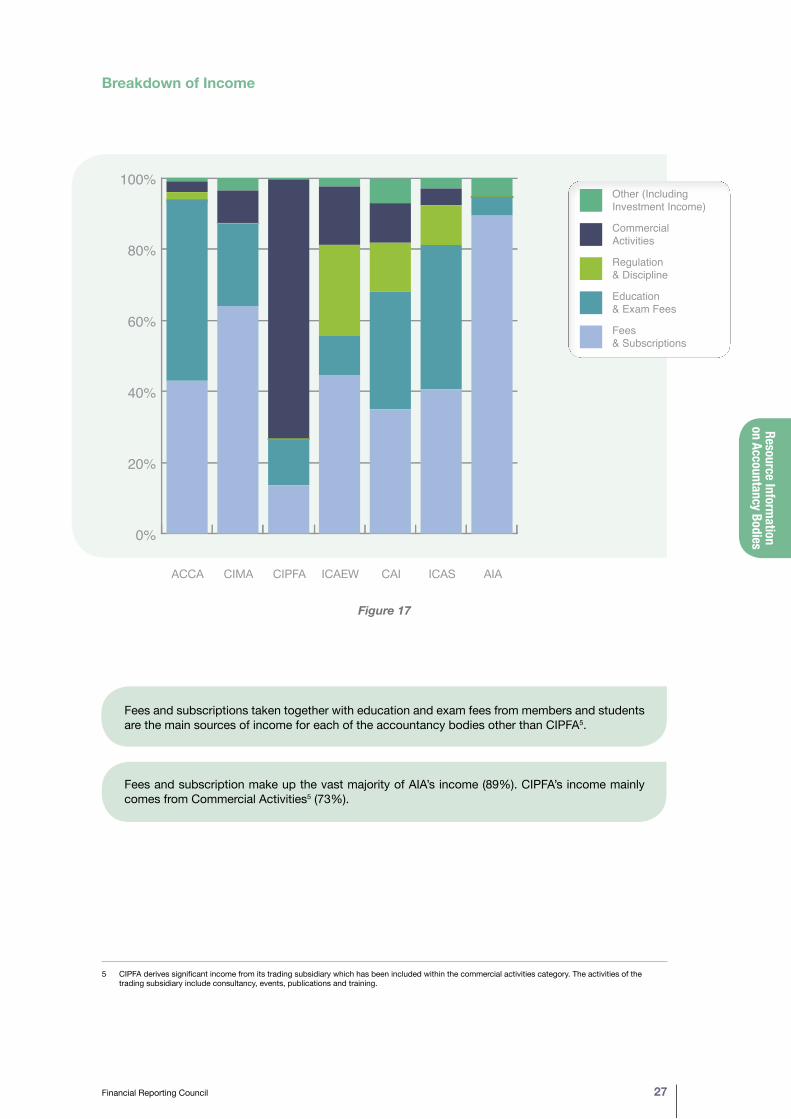
5 CIPFA derives significant income from its trading subsidiary which has been included within the commercial activities category. The activities of the trading subsidiary include consultancy, events, publications and training.
Breakdown of Income
Figure 17
Fees and subscriptions taken together with education and exam fees from members and students are the main sources of income for each of the accountancy bodies other than CIPFA5.
Fees and subscription make up the vast majority of AIA’s income (89%). CIPFA’s income mainly comes from Commercial Activities5 (73%).
0%
20%
40%
60%
80%
100% Other (Including Investment Income)
Commercial Activities
Regulation & Discipline
Education & Exam Fees
Fees & Subscriptions
AIAICASCAIICAEWCIPFACIMAACCA0%
20%
40%
60%
80%
100% Other (Including Investment Income)
Commercial Activities
Regulation & Discipline
Education & Exam Fees
Fees & Subscriptions
AIAICASCAIICAEWCIPFACIMAACCA
0%
20%
40%
60%
80%
100% Other (Including Investment Income)
Commercial Activities
Regulation & Discipline
Education & Exam Fees
Fees & Subscriptions
AIAICASCAIICAEWCIPFACIMAACCA
Reso
urce
Info
rmat
ion
on A
ccou
ntan
cy B
odies
28 Key Facts and Trends in the Accountancy Profession (June 2016)
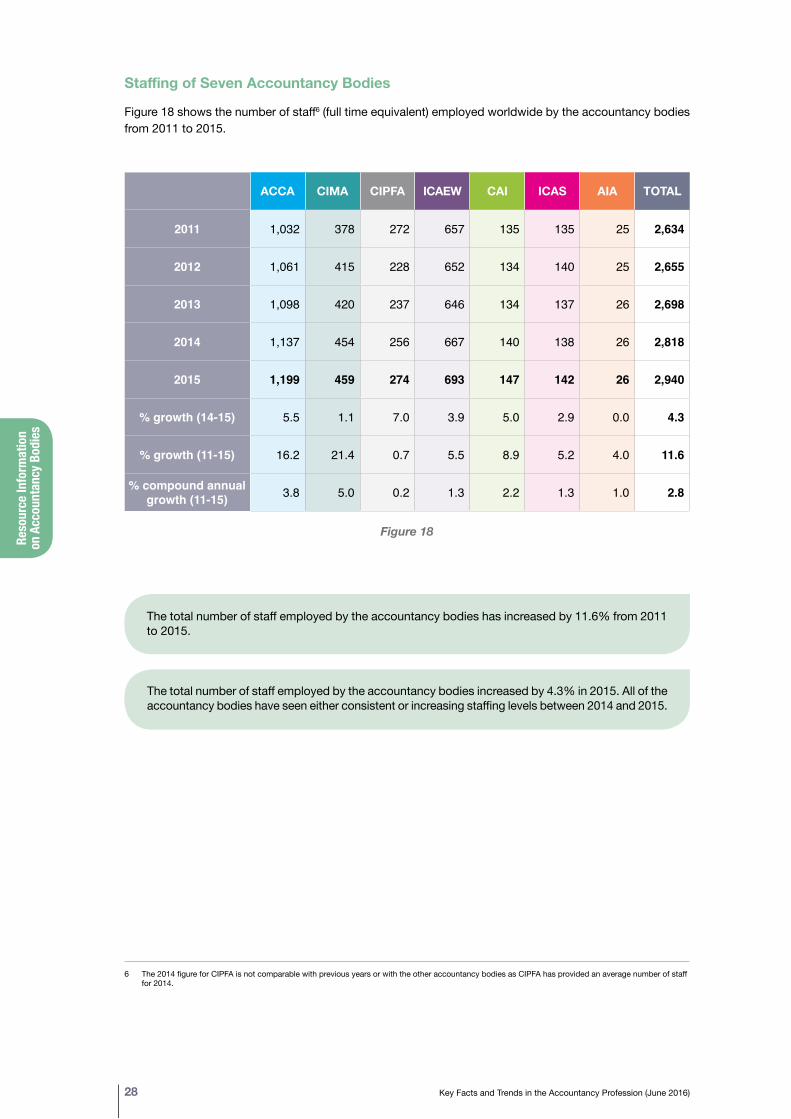
6 The 2014 figure for CIPFA is not comparable with previous years or with the other accountancy bodies as CIPFA has provided an average number of staff for 2014.
Staffing of Seven Accountancy Bodies
Figure 18 shows the number of staff6 (full time equivalent) employed worldwide by the accountancy bodies from 2011 to 2015.
ACCA CIMA CIPFA ICAEW CAI ICAS AIA TOTAL
2011 1,032 378 272 657 135 135 25 2,634
2012 1,061 415 228 652 134 140 25 2,655
2013 1,098 420 237 646 134 137 26 2,698
2014 1,137 454 256 667 140 138 26 2,818
2015 1,199 459 274 693 147 142 26 2,940
% growth (14-15) 5.5 1.1 7.0 3.9 5.0 2.9 0.0 4.3
% growth (11-15) 16.2 21.4 0.7 5.5 8.9 5.2 4.0 11.6
% compound annual growth (11-15) 3.8 5.0 0.2 1.3 2.2 1.3 1.0 2.8
Figure 18
The total number of staff employed by the accountancy bodies has increased by 11.6% from 2011 to 2015.
The total number of staff employed by the accountancy bodies increased by 4.3% in 2015. All of the accountancy bodies have seen either consistent or increasing staffing levels between 2014 and 2015.
Oversight of Audit Regulation
Financial Reporting Council 29
1 AAPA (subsidiary of the ACCA), ACCA, ICAEW, CAI and ICAS2 A Statutory Auditor is a person approved to carry out the audit of annual accounts or consolidated accounts.3 An Audit Firm is a firm that is approved to carry out Statutory Audits.
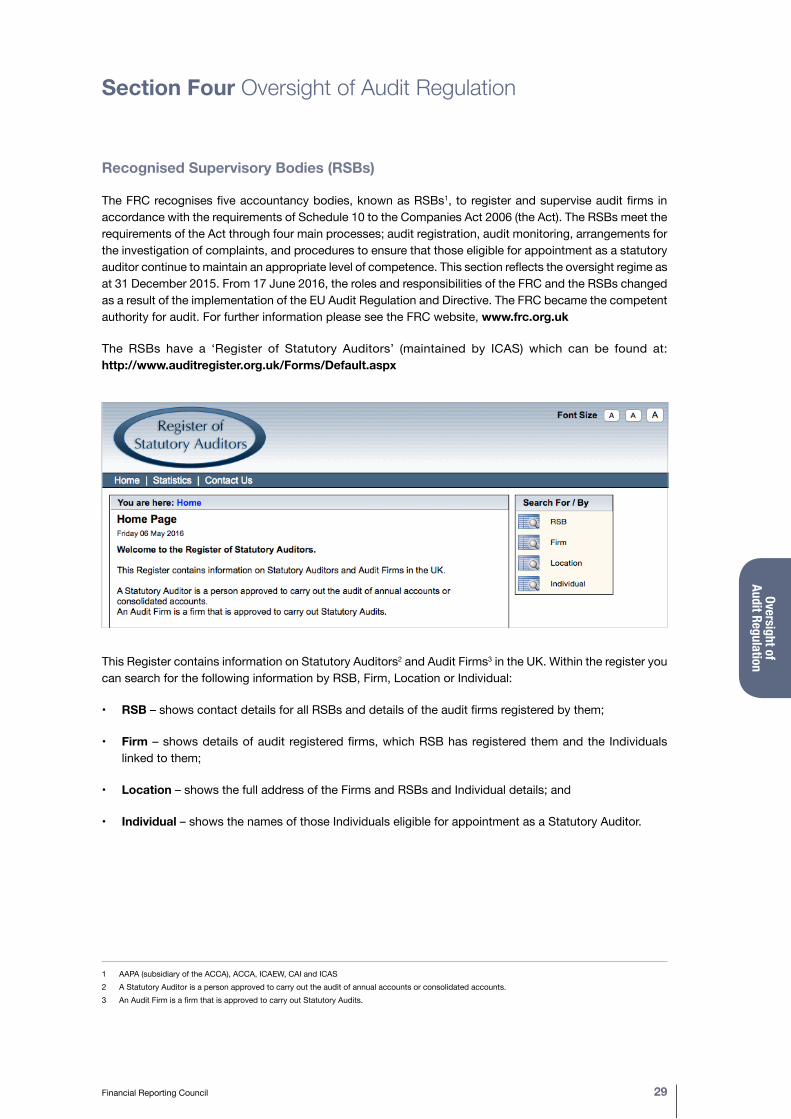
This Register contains information on Statutory Auditors2 and Audit Firms3 in the UK. Within the register you can search for the following information by RSB, Firm, Location or Individual:
• RSB – shows contact details for all RSBs and details of the audit firms registered by them;
• Firm – shows details of audit registered firms, which RSB has registered them and the Individuals linked to them;
• Location – shows the full address of the Firms and RSBs and Individual details; and
• Individual – shows the names of those Individuals eligible for appointment as a Statutory Auditor.
Section Four Oversight of Audit Regulation
Recognised Supervisory Bodies (RSBs)
The FRC recognises five accountancy bodies, known as RSBs1, to register and supervise audit firms in accordance with the requirements of Schedule 10 to the Companies Act 2006 (the Act). The RSBs meet the requirements of the Act through four main processes; audit registration, audit monitoring, arrangements for the investigation of complaints, and procedures to ensure that those eligible for appointment as a statutory auditor continue to maintain an appropriate level of competence. This section reflects the oversight regime as at 31 December 2015. From 17 June 2016, the roles and responsibilities of the FRC and the RSBs changed as a result of the implementation of the EU Audit Regulation and Directive. The FRC became the competent authority for audit. For further information please see the FRC website, www.frc.org.uk
The RSBs have a ‘Register of Statutory Auditors’ (maintained by ICAS) which can be found at: http://www.auditregister.org.uk/Forms/Default.aspx
Over
sight
of
Audi
t Reg
ulat
ion
30 Key Facts and Trends in the Accountancy Profession (June 2016)
4 This information has been derived from previous editions of Key Facts and Trends in the Accountancy Profession.5 See ‘Companies Registration Activities 2014-15’ spreadsheet on the Companies House website:
https://www.gov.uk/government/statistics/companies-register-activities-statistical-release-20142015
Number of Firms Registered with the RSBs
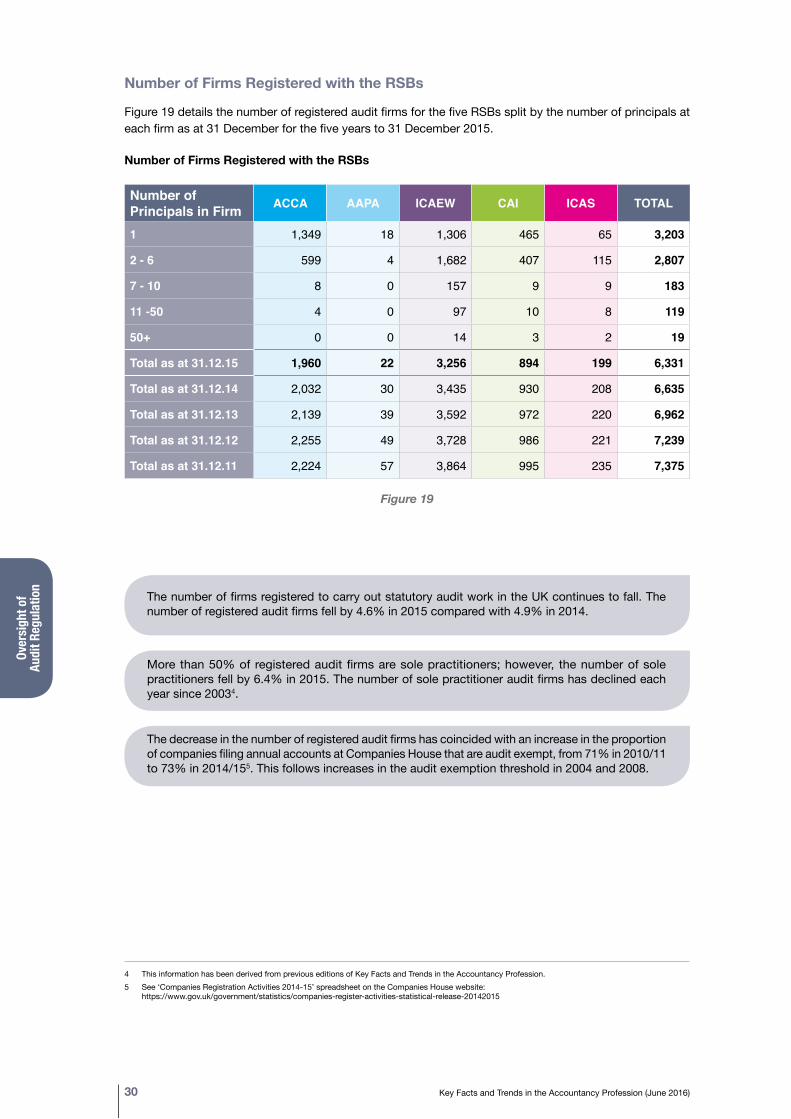
Figure 19 details the number of registered audit firms for the five RSBs split by the number of principals at each firm as at 31 December for the five years to 31 December 2015.
Number of Firms Registered with the RSBs
Number of Principals in Firm ACCA AAPA ICAEW CAI ICAS TOTAL
1 1,349 18 1,306 465 65 3,203
2 - 6 599 4 1,682 407 115 2,807
7 - 10 8 0 157 9 9 183
11 -50 4 0 97 10 8 119
50+ 0 0 14 3 2 19
Total as at 31.12.15 1,960 22 3,256 894 199 6,331
Total as at 31.12.14 2,032 30 3,435 930 208 6,635
Total as at 31.12.13 2,139 39 3,592 972 220 6,962
Total as at 31.12.12 2,255 49 3,728 986 221 7,239
Total as at 31.12.11 2,224 57 3,864 995 235 7,375
Figure 19
The number of firms registered to carry out statutory audit work in the UK continues to fall. The number of registered audit firms fell by 4.6% in 2015 compared with 4.9% in 2014.
More than 50% of registered audit firms are sole practitioners; however, the number of sole practitioners fell by 6.4% in 2015. The number of sole practitioner audit firms has declined each year since 20034.
The decrease in the number of registered audit firms has coincided with an increase in the proportion of companies filing annual accounts at Companies House that are audit exempt, from 71% in 2010/11 to 73% in 2014/155. This follows increases in the audit exemption threshold in 2004 and 2008.
Oversight of Audit Regulation
Financial Reporting Council 31
Statutory Audit Firm Applications to RSBs
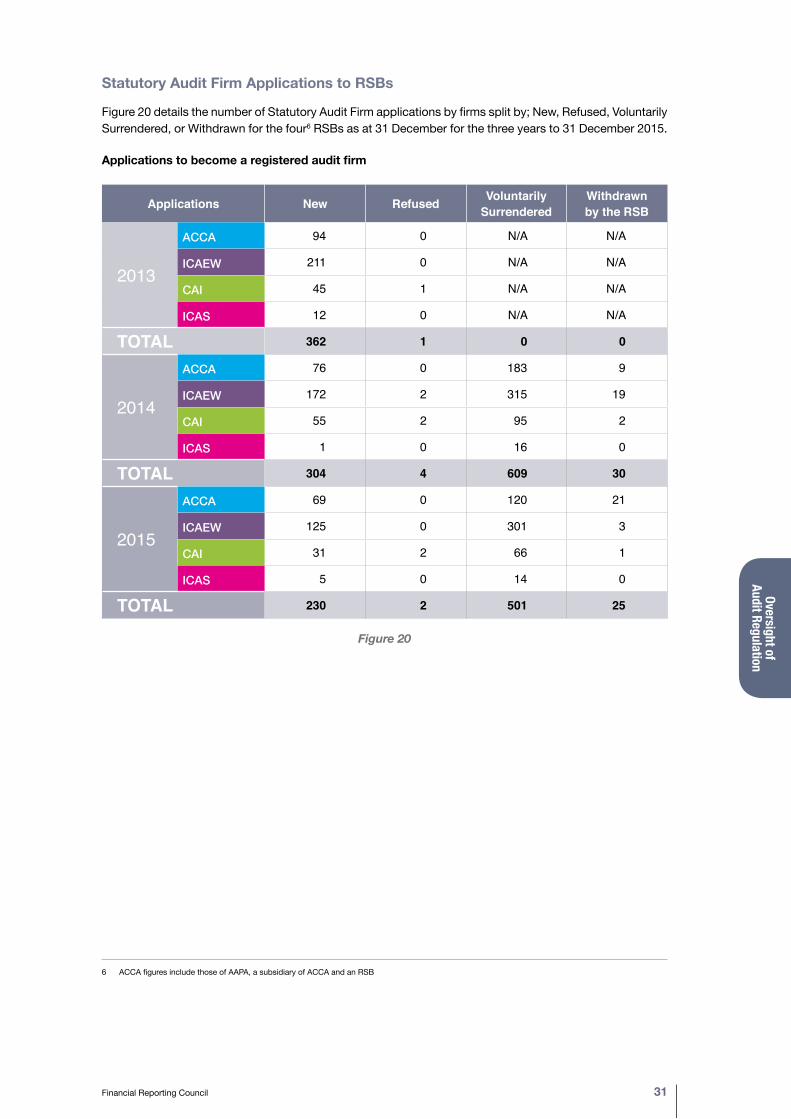
Figure 20 details the number of Statutory Audit Firm applications by firms split by; New, Refused, Voluntarily Surrendered, or Withdrawn for the four6 RSBs as at 31 December for the three years to 31 December 2015.
Applications to become a registered audit firm
Applications New Refused Voluntarily Surrendered
Withdrawn by the RSB
2013
ACCA 94 0 N/A N/A
ICAEW 211 0 N/A N/A
CAI 45 1 N/A N/A
ICAS 12 0 N/A N/A
TOTAL 362 1 0 0
2014
ACCA 76 0 183 9
ICAEW 172 2 315 19
CAI 55 2 95 2
ICAS 1 0 16 0
TOTAL 304 4 609 30
2015
ACCA 69 0 120 21
ICAEW 125 0 301 3
CAI 31 2 66 1
ICAS 5 0 14 0
TOTAL 230 2 501 25
Figure 20
6 ACCA figures include those of AAPA, a subsidiary of ACCA and an RSB

Over
sight
of
Audi
t Reg
ulat
ion
32 Key Facts and Trends in the Accountancy Profession (June 2016)
7 For more information on the work performed by the AQR team, please see the FRC’s Developments in Audit report, which will be published in July 2016 at www.frc.org.uk
8 This total relates to Crown Dependency companies audited by stand-alone Crown Dependency firms. A further 7, 7 and 11 Crown Dependency audits were inspected at the major audit firms in 2015/16, 2014/15 and 2013/14 respectively.
Monitoring of Registered Audit Firms by the FRC’s Audit Quality Review (AQR)
The FRC’s AQR7 team monitors the quality of the audits of listed companies and other major audits and the policies and procedures supporting audit quality at the major audit firms in the UK. The remainder of audit monitoring is conducted by the RSBs.
Figure 21 below gives details of the number of reviews of audits conducted by the AQR during the years ended 31 March 2014 to 31 March 2016.
INSPECTION CATEGORY Audit Reviews 2015/16
Audit Reviews 2014/15
Audit Reviews 2013/14
UK firmsDeloitte LLP 22 20 17
Ernst & Young LLP 20 16 16
KPMG LLP/ KPMG Audit Plc 22 20 17
PricewaterhouseCoopers LLP 25 22 19
Big Four firms 89 78 69
RSM LLP 1 - 6
BDO LLP 8 8 -
Crowe Clark Whitehill LLP - 5 -
Grant Thornton UK LLP 8 8 -
Mazars LLP 1 5 -
Joint audit adjustment - -1 -
107 103 75
Crown Dependency audit firms8 6 2 7
113 105 82
Third Country Auditors 6 4 3
Private sector audits 119 109 85
National Audit Office 6 6 6
Local Audit 12 11 10
Public Sector audits 18 17 16
Total audits inspected 137 126 101
Figure 21
Oversight of Audit Regulation
Financial Reporting Council 33
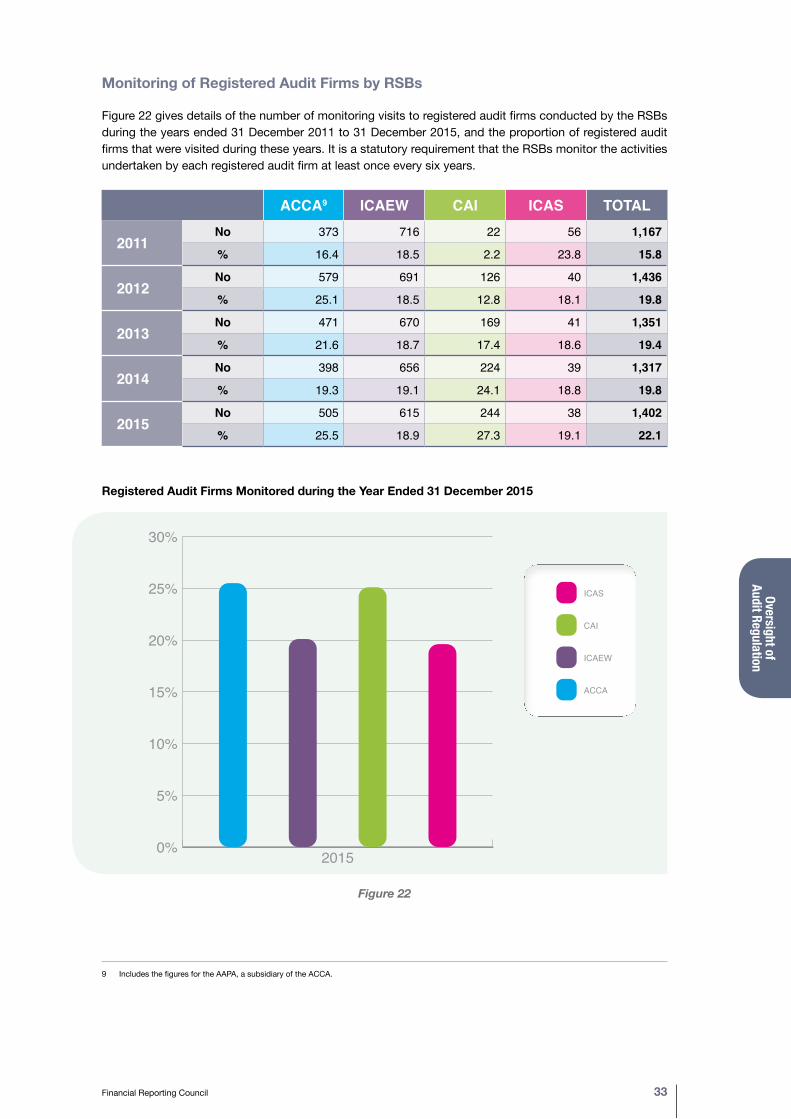
9 Includes the figures for the AAPA, a subsidiary of the ACCA.
Monitoring of Registered Audit Firms by RSBs
Figure 22 gives details of the number of monitoring visits to registered audit firms conducted by the RSBs during the years ended 31 December 2011 to 31 December 2015, and the proportion of registered audit firms that were visited during these years. It is a statutory requirement that the RSBs monitor the activities undertaken by each registered audit firm at least once every six years.
ACCA9 ICAEW CAI ICAS TOTAL
2011No 373 716 22 56 1,167
% 16.4 18.5 2.2 23.8 15.8
2012No 579 691 126 40 1,436
% 25.1 18.5 12.8 18.1 19.8
2013No 471 670 169 41 1,351
% 21.6 18.7 17.4 18.6 19.4
2014No 398 656 224 39 1,317
% 19.3 19.1 24.1 18.8 19.8
2015No 505 615 244 38 1,402
% 25.5 18.9 27.3 19.1 22.1
Registered Audit Firms Monitored during the Year Ended 31 December 2015
Figure 22
0%
5%
10%
15%
20%
25%
30%ICAS
CAI
ICAEW
ACCA
2015
0%
5%
10%
15%
20%
25%
30%ICAS
CAI
ICAEW
ACCA
2015
10 The bodies visit firms which have public interest entities. These inspections are either delegated to them by the AQR or are outside of the scope of the AQR.11 This excludes direct inspections by the FRC.
Over
sight
of
Audi
t Reg
ulat
ion
34 Key Facts and Trends in the Accountancy Profession (June 2016)
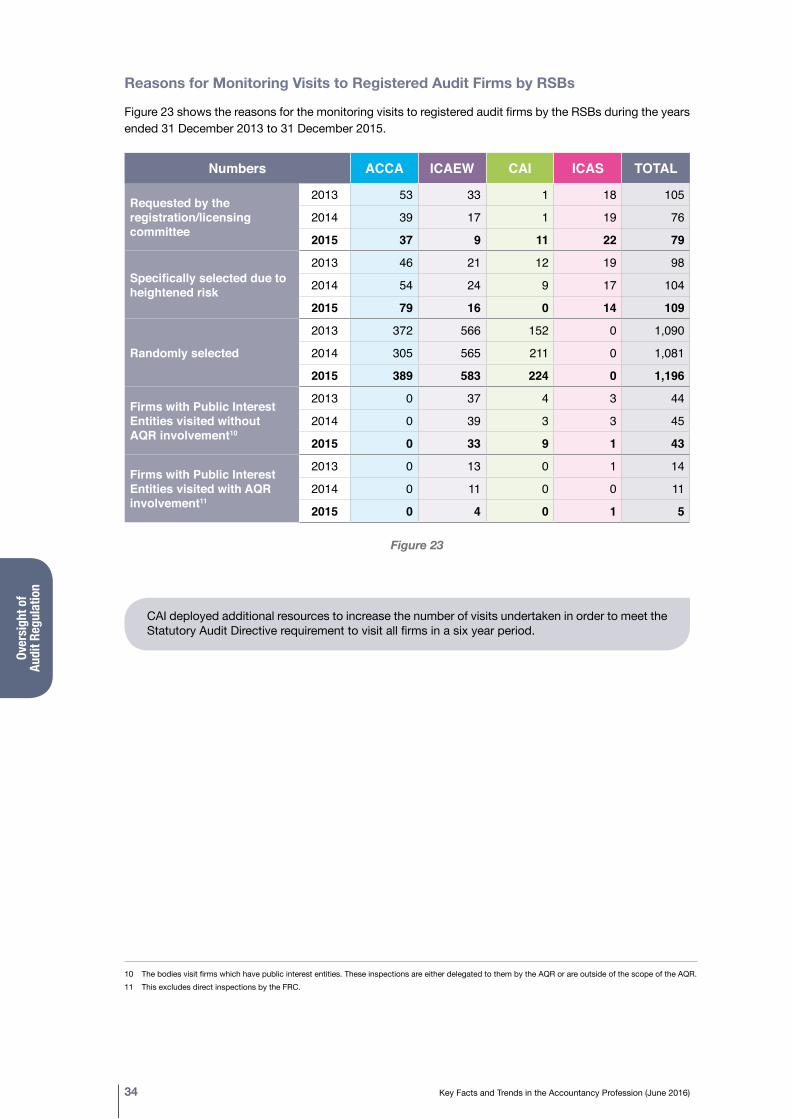
Reasons for Monitoring Visits to Registered Audit Firms by RSBs
Figure 23 shows the reasons for the monitoring visits to registered audit firms by the RSBs during the years ended 31 December 2013 to 31 December 2015.
Numbers ACCA ICAEW CAI ICAS TOTAL
Requested by the registration/licensing committee
2013 53 33 1 18 105
2014 39 17 1 19 76
2015 37 9 11 22 79
Specifically selected due to heightened risk
2013 46 21 12 19 98
2014 54 24 9 17 104
2015 79 16 0 14 109
Randomly selected
2013 372 566 152 0 1,090
2014 305 565 211 0 1,081
2015 389 583 224 0 1,196
Firms with Public Interest Entities visited without AQR involvement10
2013 0 37 4 3 44
2014 0 39 3 3 45
2015 0 33 9 1 43
Firms with Public Interest Entities visited with AQRinvolvement11
2013 0 13 0 1 14
2014 0 11 0 0 11
2015 0 4 0 1 5
Figure 23
CAI deployed additional resources to increase the number of visits undertaken in order to meet the Statutory Audit Directive requirement to visit all firms in a six year period.
Oversight of Audit Regulation
Financial Reporting Council 35
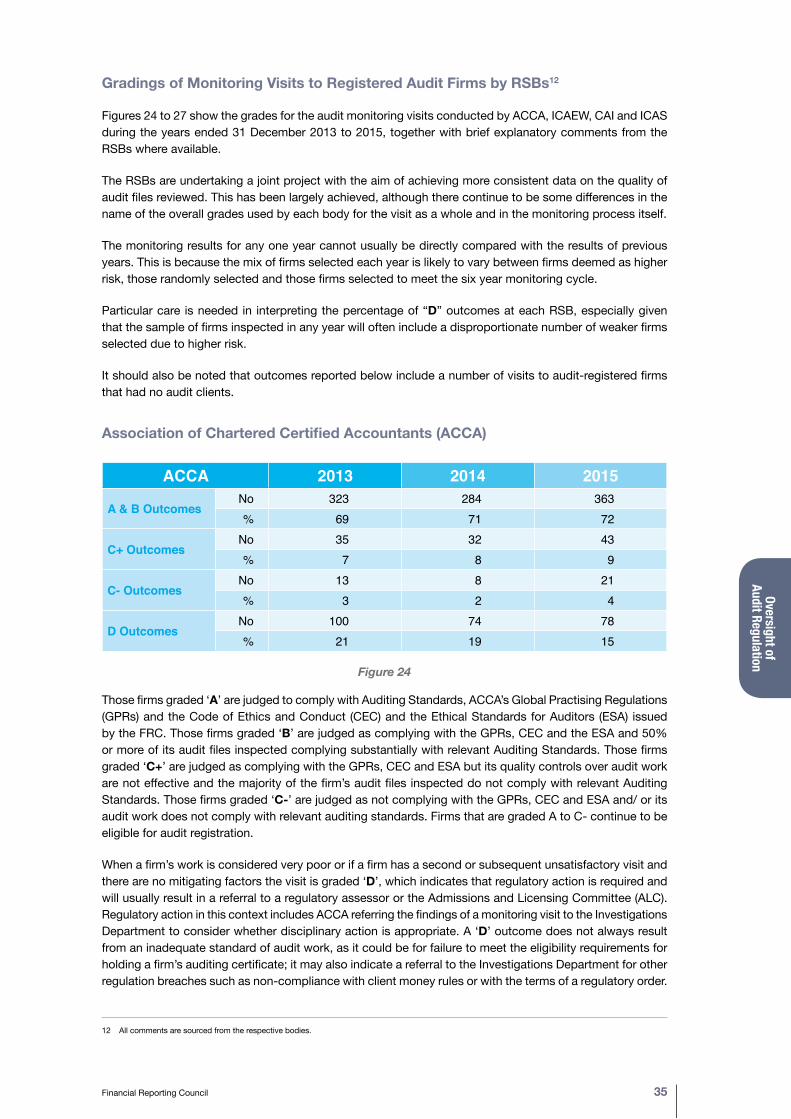
Gradings of Monitoring Visits to Registered Audit Firms by RSBs12
Figures 24 to 27 show the grades for the audit monitoring visits conducted by ACCA, ICAEW, CAI and ICAS during the years ended 31 December 2013 to 2015, together with brief explanatory comments from the RSBs where available.
The RSBs are undertaking a joint project with the aim of achieving more consistent data on the quality of audit files reviewed. This has been largely achieved, although there continue to be some differences in the name of the overall grades used by each body for the visit as a whole and in the monitoring process itself.
The monitoring results for any one year cannot usually be directly compared with the results of previous years. This is because the mix of firms selected each year is likely to vary between firms deemed as higher risk, those randomly selected and those firms selected to meet the six year monitoring cycle.
Particular care is needed in interpreting the percentage of “D” outcomes at each RSB, especially given that the sample of firms inspected in any year will often include a disproportionate number of weaker firms selected due to higher risk.
It should also be noted that outcomes reported below include a number of visits to audit-registered firms that had no audit clients.
Association of Chartered Certified Accountants (ACCA)
ACCA 2013 2014 2015
A & B OutcomesNo 323 284 363% 69 71 72
C+ OutcomesNo 35 32 43% 7 8 9
C- OutcomesNo 13 8 21% 3 2 4
D OutcomesNo 100 74 78% 21 19 15
Figure 24
Those firms graded ‘A’ are judged to comply with Auditing Standards, ACCA’s Global Practising Regulations (GPRs) and the Code of Ethics and Conduct (CEC) and the Ethical Standards for Auditors (ESA) issued by the FRC. Those firms graded ‘B’ are judged as complying with the GPRs, CEC and the ESA and 50% or more of its audit files inspected complying substantially with relevant Auditing Standards. Those firms graded ‘C+’ are judged as complying with the GPRs, CEC and ESA but its quality controls over audit work are not effective and the majority of the firm’s audit files inspected do not comply with relevant Auditing Standards. Those firms graded ‘C-’ are judged as not complying with the GPRs, CEC and ESA and/ or its audit work does not comply with relevant auditing standards. Firms that are graded A to C- continue to be eligible for audit registration.
When a firm’s work is considered very poor or if a firm has a second or subsequent unsatisfactory visit and there are no mitigating factors the visit is graded ‘D’, which indicates that regulatory action is required and will usually result in a referral to a regulatory assessor or the Admissions and Licensing Committee (ALC). Regulatory action in this context includes ACCA referring the findings of a monitoring visit to the Investigations Department to consider whether disciplinary action is appropriate. A ‘D’ outcome does not always result from an inadequate standard of audit work, as it could be for failure to meet the eligibility requirements for holding a firm’s auditing certificate; it may also indicate a referral to the Investigations Department for other regulation breaches such as non-compliance with client money rules or with the terms of a regulatory order.
12 All comments are sourced from the respective bodies.
Over
sight
of
Audi
t Reg
ulat
ion
36 Key Facts and Trends in the Accountancy Profession (June 2016)
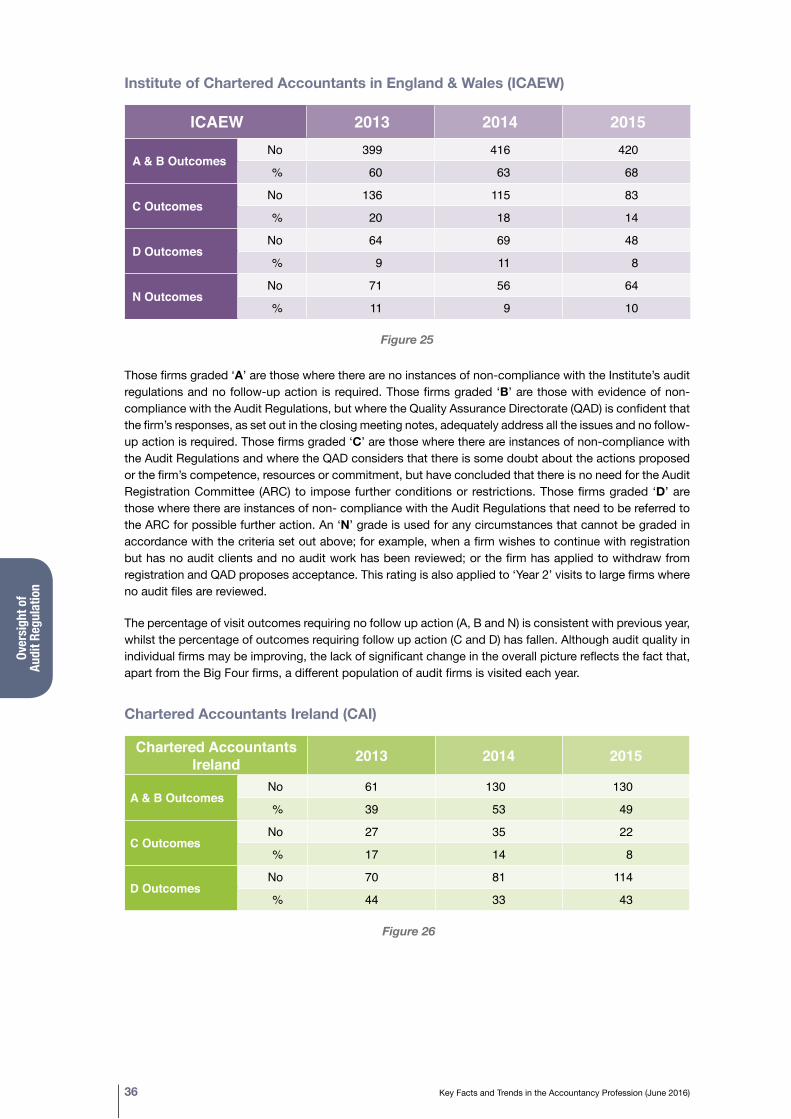
Institute of Chartered Accountants in England & Wales (ICAEW)
ICAEW 2013 2014 2015
A & B OutcomesNo 399 416 420
% 60 63 68
C OutcomesNo 136 115 83
% 20 18 14
D OutcomesNo 64 69 48
% 9 11 8
N OutcomesNo 71 56 64
% 11 9 10
Figure 25
Those firms graded ‘A’ are those where there are no instances of non-compliance with the Institute’s audit regulations and no follow-up action is required. Those firms graded ‘B’ are those with evidence of non-compliance with the Audit Regulations, but where the Quality Assurance Directorate (QAD) is confident that the firm’s responses, as set out in the closing meeting notes, adequately address all the issues and no follow-up action is required. Those firms graded ‘C’ are those where there are instances of non-compliance with the Audit Regulations and where the QAD considers that there is some doubt about the actions proposed or the firm’s competence, resources or commitment, but have concluded that there is no need for the Audit Registration Committee (ARC) to impose further conditions or restrictions. Those firms graded ‘D’ are those where there are instances of non- compliance with the Audit Regulations that need to be referred to the ARC for possible further action. An ‘N’ grade is used for any circumstances that cannot be graded in accordance with the criteria set out above; for example, when a firm wishes to continue with registration but has no audit clients and no audit work has been reviewed; or the firm has applied to withdraw from registration and QAD proposes acceptance. This rating is also applied to ‘Year 2’ visits to large firms where no audit files are reviewed.
The percentage of visit outcomes requiring no follow up action (A, B and N) is consistent with previous year, whilst the percentage of outcomes requiring follow up action (C and D) has fallen. Although audit quality in individual firms may be improving, the lack of significant change in the overall picture reflects the fact that, apart from the Big Four firms, a different population of audit firms is visited each year.
Chartered Accountants Ireland (CAI)
Chartered Accountants Ireland 2013 2014 2015
A & B OutcomesNo 61 130 130
% 39 53 49
C OutcomesNo 27 35 22
% 17 14 8
D OutcomesNo 70 81 114
% 44 33 43
Figure 26
Oversight of Audit Regulation
Financial Reporting Council 37
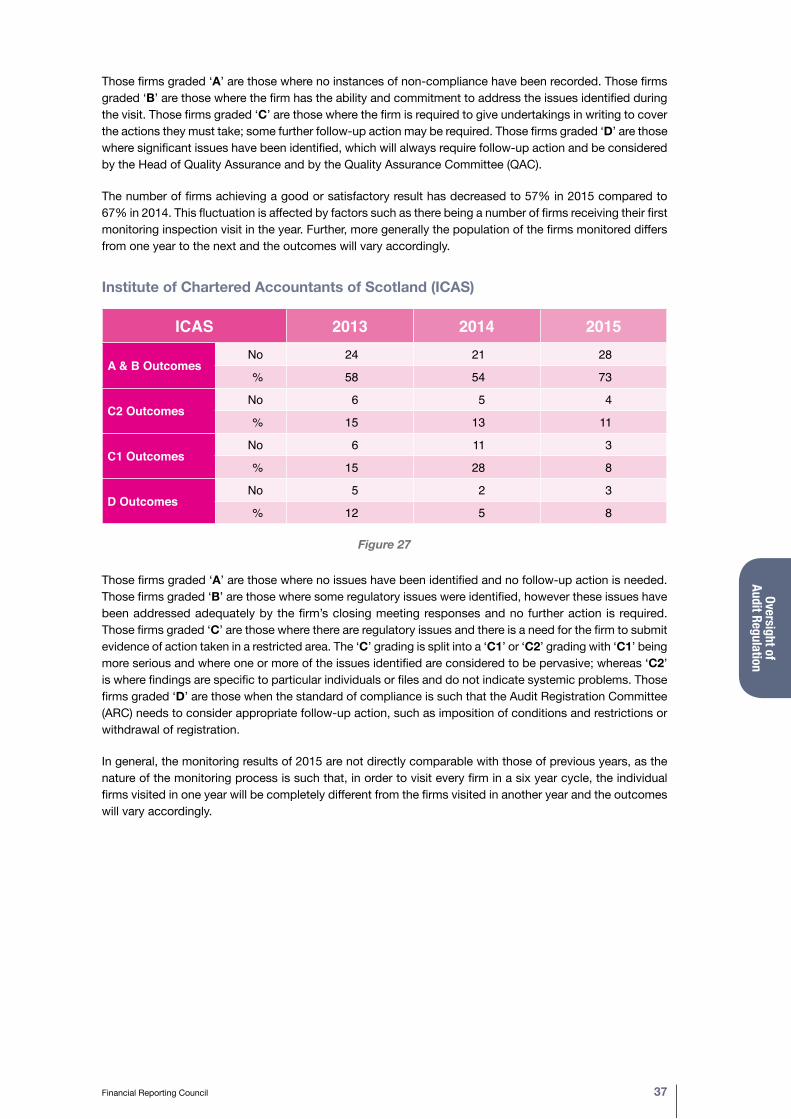
Those firms graded ‘A’ are those where no instances of non-compliance have been recorded. Those firms graded ‘B’ are those where the firm has the ability and commitment to address the issues identified during the visit. Those firms graded ‘C’ are those where the firm is required to give undertakings in writing to cover the actions they must take; some further follow-up action may be required. Those firms graded ‘D’ are those where significant issues have been identified, which will always require follow-up action and be considered by the Head of Quality Assurance and by the Quality Assurance Committee (QAC).
The number of firms achieving a good or satisfactory result has decreased to 57% in 2015 compared to 67% in 2014. This fluctuation is affected by factors such as there being a number of firms receiving their first monitoring inspection visit in the year. Further, more generally the population of the firms monitored differs from one year to the next and the outcomes will vary accordingly.
Institute of Chartered Accountants of Scotland (ICAS)
ICAS 2013 2014 2015
A & B OutcomesNo 24 21 28
% 58 54 73
C2 OutcomesNo 6 5 4
% 15 13 11
C1 OutcomesNo 6 11 3
% 15 28 8
D OutcomesNo 5 2 3
% 12 5 8
Figure 27
Those firms graded ‘A’ are those where no issues have been identified and no follow-up action is needed. Those firms graded ‘B’ are those where some regulatory issues were identified, however these issues have been addressed adequately by the firm’s closing meeting responses and no further action is required. Those firms graded ‘C’ are those where there are regulatory issues and there is a need for the firm to submit evidence of action taken in a restricted area. The ‘C’ grading is split into a ‘C1’ or ‘C2’ grading with ‘C1’ being more serious and where one or more of the issues identified are considered to be pervasive; whereas ‘C2’ is where findings are specific to particular individuals or files and do not indicate systemic problems. Those firms graded ‘D’ are those when the standard of compliance is such that the Audit Registration Committee (ARC) needs to consider appropriate follow-up action, such as imposition of conditions and restrictions or withdrawal of registration.
In general, the monitoring results of 2015 are not directly comparable with those of previous years, as the nature of the monitoring process is such that, in order to visit every firm in a six year cycle, the individual firms visited in one year will be completely different from the firms visited in another year and the outcomes will vary accordingly.
Over
sight
of
Audi
t Reg
ulat
ion
38 Key Facts and Trends in the Accountancy Profession (June 2016)
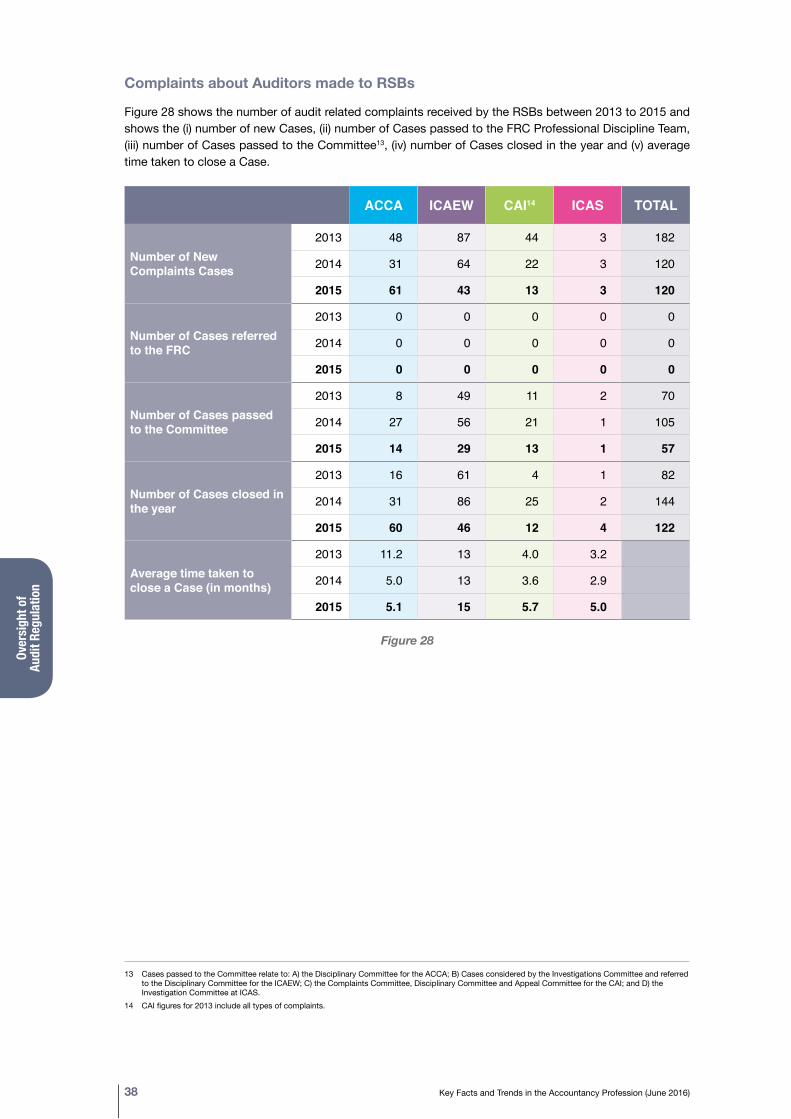
13 Cases passed to the Committee relate to: A) the Disciplinary Committee for the ACCA; B) Cases considered by the Investigations Committee and referred to the Disciplinary Committee for the ICAEW; C) the Complaints Committee, Disciplinary Committee and Appeal Committee for the CAI; and D) the Investigation Committee at ICAS.
14 CAI figures for 2013 include all types of complaints.
Complaints about Auditors made to RSBs
Figure 28 shows the number of audit related complaints received by the RSBs between 2013 to 2015 and shows the (i) number of new Cases, (ii) number of Cases passed to the FRC Professional Discipline Team, (iii) number of Cases passed to the Committee13, (iv) number of Cases closed in the year and (v) average time taken to close a Case.
ACCA ICAEW CAI14 ICAS TOTAL
Number of New Complaints Cases
2013 48 87 44 3 182
2014 31 64 22 3 120
2015 61 43 13 3 120
Number of Cases referred to the FRC
2013 0 0 0 0 0
2014 0 0 0 0 0
2015 0 0 0 0 0
Number of Cases passed to the Committee
2013 8 49 11 2 70
2014 27 56 21 1 105
2015 14 29 13 1 57
Number of Cases closed in the year
2013 16 61 4 1 82
2014 31 86 25 2 144
2015 60 46 12 4 122
Average time taken to close a Case (in months)
2013 11.2 13 4.0 3.2
2014 5.0 13 3.6 2.9
2015 5.1 15 5.7 5.0
Figure 28
Oversight of Audit Regulation
Financial Reporting Council 39
15 ACCA, AIA, CIPFA, ICAEW, CAI and ICAS. 16 Due to CIPFA’s RQB status being in abeyance for statutory audit purposes they have not provided the figures and we have therefore removed them from
this table going forward.17 Where N/A is stated the information is not collected by the body.
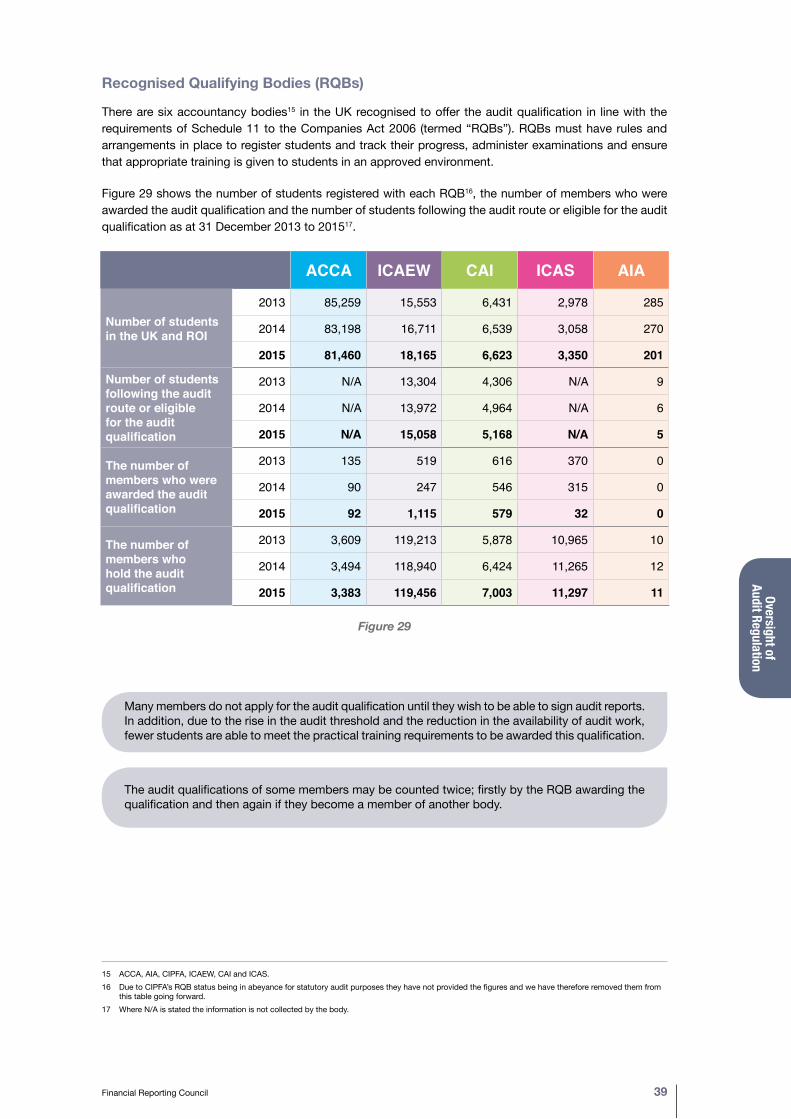
Recognised Qualifying Bodies (RQBs)
There are six accountancy bodies15 in the UK recognised to offer the audit qualification in line with the requirements of Schedule 11 to the Companies Act 2006 (termed “RQBs”). RQBs must have rules and arrangements in place to register students and track their progress, administer examinations and ensure that appropriate training is given to students in an approved environment.
Figure 29 shows the number of students registered with each RQB16, the number of members who were awarded the audit qualification and the number of students following the audit route or eligible for the audit qualification as at 31 December 2013 to 201517.
ACCA ICAEW CAI ICAS AIA
Number of students in the UK and ROI
2013 85,259 15,553 6,431 2,978 285
2014 83,198 16,711 6,539 3,058 270
2015 81,460 18,165 6,623 3,350 201
Number of students following the audit route or eligible for the audit qualification
2013 N/A 13,304 4,306 N/A 9
2014 N/A 13,972 4,964 N/A 6
2015 N/A 15,058 5,168 N/A 5
The number of members who were awarded the audit qualification
2013 135 519 616 370 0
2014 90 247 546 315 0
2015 92 1,115 579 32 0
The number of members who hold the audit qualification
2013 3,609 119,213 5,878 10,965 10
2014 3,494 118,940 6,424 11,265 12
2015 3,383 119,456 7,003 11,297 11
Figure 29
Many members do not apply for the audit qualification until they wish to be able to sign audit reports. In addition, due to the rise in the audit threshold and the reduction in the availability of audit work, fewer students are able to meet the practical training requirements to be awarded this qualification.
The audit qualifications of some members may be counted twice; firstly by the RQB awarding the qualification and then again if they become a member of another body.
Over
sight
of
Audi
t Reg
ulat
ion
40 Key Facts and Trends in the Accountancy Profession (June 2016)
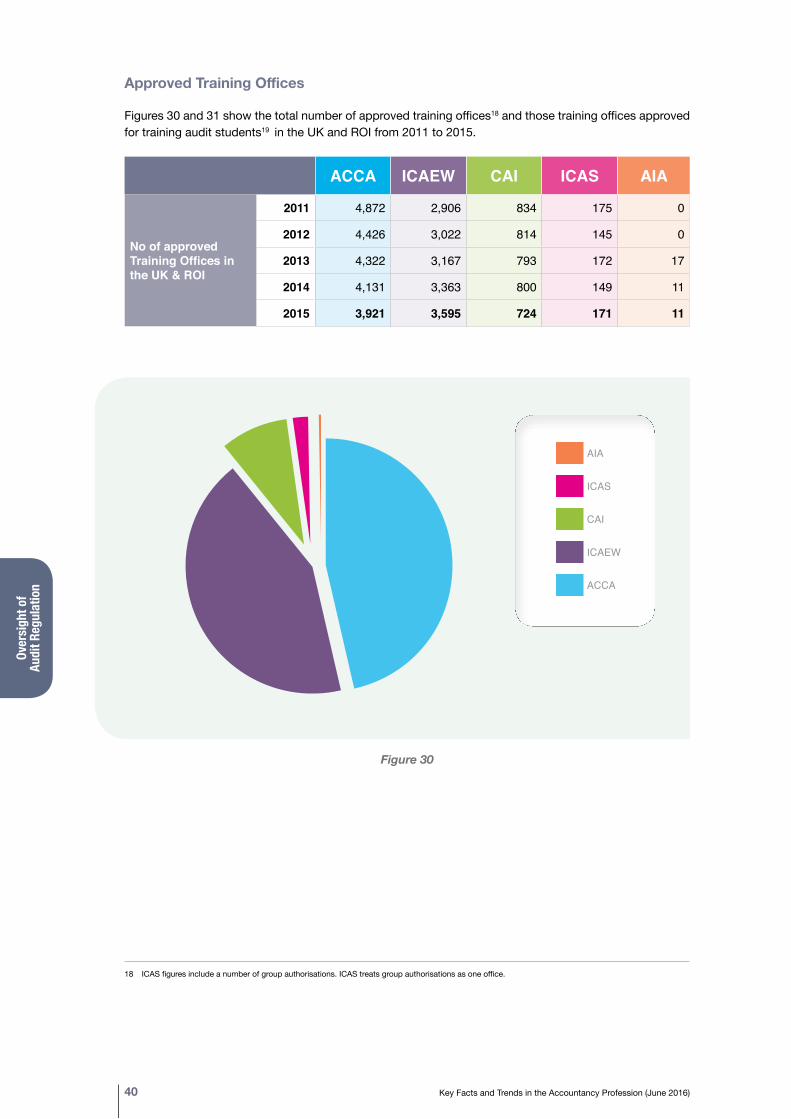
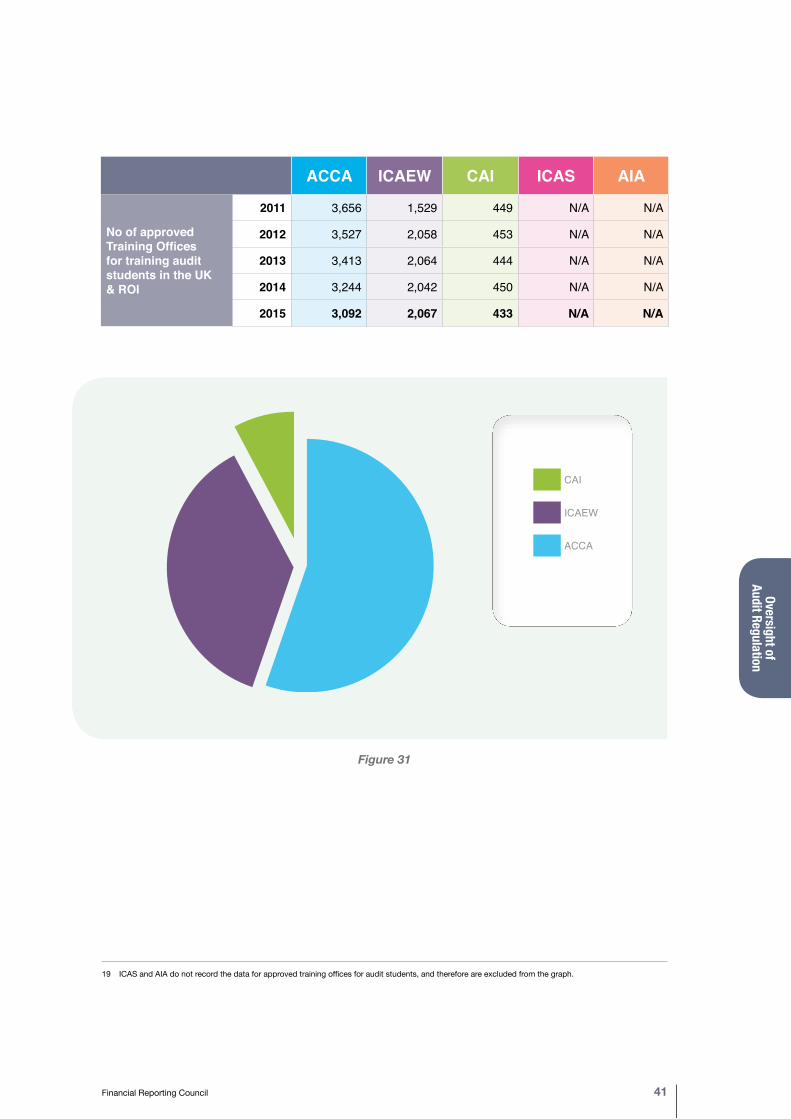
Approved Training Offices
Figures 30 and 31 show the total number of approved training offices18 and those training offices approved for training audit students19 in the UK and ROI from 2011 to 2015.
ACCA ICAEW CAI ICAS AIA
No of approved Training Offices in the UK & ROI
2011 4,872 2,906 834 175 0
2012 4,426 3,022 814 145 0
2013 4,322 3,167 793 172 17
2014 4,131 3,363 800 149 11
2015 3,921 3,595 724 171 11
Figure 30
AIA
ICAS
CAI
ICAEW
ACCA
AIA
ICAS
CAI
ICAEW
ACCA
18 ICAS figures include a number of group authorisations. ICAS treats group authorisations as one office.
Oversight of Audit Regulation
Financial Reporting Council 41
ACCA ICAEW CAI ICAS AIA
No of approved Training Offices for training audit students in the UK & ROI
2011 3,656 1,529 449 N/A N/A
2012 3,527 2,058 453 N/A N/A
2013 3,413 2,064 444 N/A N/A
2014 3,244 2,042 450 N/A N/A
2015 3,092 2,067 433 N/A N/A
Figure 31
AIA
ICAS
CAI
ICAEW
ACCA
AIA
ICAS
CAI
ICAEW
ACCA
19 ICAS and AIA do not record the data for approved training offices for audit students, and therefore are excluded from the graph.
Audi
t Firm
s
42 Key Facts and Trends in the Accountancy Profession (June 2016)
Section Five Audit Firms
Introductory Note: Audit Firms with Public Interest Entity Clients
This information has been provided on a voluntary basis and we would like to thank all the firms who responded to our requests. Some of this information is otherwise publicly available – for example those firms which are Limited Liability Partnerships (LLPs) must file accounts at Companies House which meet statutory requirements.
This year we have changed the scope of this chapter from the major audit firms in the UK to those firms which audit Public Interest Entity (PIE) clients under the new definition which came into force on 17 June 2016. (See glossary for definition).
Figure 32 shows the fee income for audit and non-audit services for the 41 audit firms with PIE audit clients for the year ended 2015. Firms are listed in order of fee income from audit, rather than total fee income.
Figure 32 should not be seen as a league table. Firms with no PIE audit clients were not requested to provide information this year. It is therefore likely that there are audit firms not included in Figure 32 that have a higher audit fee income than some of those that are included. Further, we have not included accountancy firms that are not registered audit firms.
Care is needed when making comparisons between firms using the information in Figure 32. Some firms do not analyse their fee income in this manner and have made an informed estimate of the figures. In addition, firms may classify their audit and non-audit income in slightly different ways.
Figures 33 and 34 analyse the detailed fee income from Figure 32 for the Big Four audit firms and for the audit firms with PIE audit clients outside of the Big Four respectively1.
Figure 37 shows those firms which audit FTSE 100 and FTSE 250 companies, and companies listed on other regulated markets and AIM.
The percentage of total fee income derived from audit work has been relatively constant for the Big Four audit firms, but has been steadily falling for all other audit firms over the last few years.
From 2013 to 2015, the percentage of fee income derived from non-audit clients has remained fairly consistent for the Big Four and the other audit firms alike.
In 2015, the average proportion of female partners of those firms with PIE audit clients was 15%. (Figure 32)
1 Information on fee income by audit for earlier years can be found in previous editions of Key Facts and Trends in the Accountancy Profession, available at www.frc.org.uk - Key Facts and Trends
Audit Firms
Financial Reporting Council 43
Figu
re 3
2 U
K F
EE IN
CO
ME
OF
AUD
IT F
IRM
S W
ITH
PIE
AU
DIT
CLI
ENTS
- YE
AR E
ND
ED 2
015
(By
fee
inco
me
from
aud
it)
2 Pr
inci
pals
are
par
tner
s or
mem
bers
of a
n LL
P3
Resp
onsi
ble
Indi
vidu
als
(RIs
) are
thos
e Au
dit P
rinci
ples
or E
mpl
oyee
s w
ho a
re a
ble
to s
ign
audi
t rep
orts
4 Th
e de
finiti
on o
f ‘au
dit-s
ervi
ces’
and
‘non
-aud
it se
rvic
es’ i
s se
t out
in p
arag
raph
12
of th
e Au
ditin
g Pr
actic
es B
oard
’s ‘E
thic
al S
tand
ard
5’ –
Dec
embe
r 201
15
Delo
itte
LLP
figur
es re
late
to p
ract
isin
g ac
tiviti
es in
the
UK,
Cha
nnel
Isla
nds
and
Isle
of M
an o
nly.
6 N
ame
chan
ge fr
om B
aker
Tilly
as
at 2
6 O
ctob
er 2
015.
Incl
udes
bot
h RS
M a
nd B
aker
Tilly
UK
Hol
ding
s Lt
d.7
Moo
re S
teph
ens
mer
ged
with
Cha
ntre
y Ve
llaco
tt DF
K as
at 1
May
201
5. F
our m
onth
s of
Cha
ntre
y Ve
llaco
tt DF
K’s
inco
me
prio
r to
mer
ger h
ave
been
incl
uded
in M
oore
Ste
phen
s’ fi
gure
s.
UK
Firm
Nam
eU
K
Stru
ctur
e Ye
ar E
ndN
o of
Pr
inci
pals
2 %
of F
emal
e Pr
inci
pals
No
of A
udit
Pr
inci
pals
No
of
Res
pons
ible
In
divi
dual
s3
No
of P
IE
Aud
it
Clie
nts
Fee
Inco
me:
A
udit
(£m
)
Fee
Inco
me:
N
on-A
udit
Wor
k4 to
Aud
it C
lient
s (£
m)
Fee
Inco
me:
N
on-A
udit
Clie
nts
(£m
)To
tal F
ee
Inco
me
(£m
)
Pric
ewat
erho
useC
oope
rsLL
P30
-Jun
-15
885
17%
198
352
428
604
365
1,79
02,
759
Del
oitte
5 LL
P31
-May
-15
721
14%
157
220
412
475
173
1,79
92,
447
KPM
GLL
P30
-Sep
-15
624
13%
140
254
342
471
281
1,20
61,
958
Erns
t & Y
oung
LLP
03-J
ul-1
564
817
%11
217
526
837
026
71,
373
2,01
0
Gra
nt T
horn
ton
UK
LLP
30-J
un-1
518
413
%59
106
7113
248
341
521
BD
OLL
P30
-Jun
-15
265
12%
102
132
7013
270
188
391
RSM
6 LL
P31
-Mar
-15
319
17%
105
140
1570
4317
929
2
Maz
ars
LLP
31-A
ug-1
512
813
%51
5530
4417
8915
0
Cro
we
Cla
rk W
hite
hill
LLP
31-M
ar-1
573
21%
4041
325
828
61
Moo
re S
teph
ens7
LLP
01-M
ay-1
586
15%
4041
2715
656
77
Nex
ia S
mith
&
Will
iam
son
Aud
itLi
mite
d C
ompa
ny30
-Apr
-15
138
18%
2625
212
N/A
5567
Kin
gsto
n Sm
ithLL
P30
-Apr
-15
6126
%45
451
129
1435
Audi
t Firm
s
44 Key Facts and Trends in the Accountancy Profession (June 2016)
UK
Firm
Nam
eU
K
Stru
ctur
e Ye
ar E
ndN
o of
Pr
inci
pals
2 %
of F
emal
e Pr
inci
pals
No
of A
udit
Pr
inci
pals
No
of
Res
pons
ible
In
divi
dual
s3
No
of P
IE
Aud
it
Clie
nts
Fee
Inco
me:
A
udit
(£m
)
Fee
Inco
me:
N
on-A
udit
Wor
k4 to
Aud
it C
lient
s (£
m)
Fee
Inco
me:
N
on-A
udit
Clie
nts
(£m
)To
tal F
ee
Inco
me
(£m
)
Hai
nes
Wat
ts G
roup
Gro
up o
f Pa
rtner
ship
s31
-Mar
-15
145
10%
7484
110
748
65
UH
Y H
acke
r You
ngG
roup
of
Partn
ersh
ips
30-A
pr-1
510
313
%57
633
106
3753
Saffe
ry C
ham
pnes
sPa
rtner
ship
31-M
ar-1
563
21%
3636
110
731
48
Hay
smac
inty
rePa
rtner
ship
31-M
ar-1
527
26%
2121
510
74
21
Buz
zaco
ttLL
P30
-Sep
t-15
3222
%15
151
92
2233
PKF
Littl
ejoh
nLL
P31
-May
-15
3213
%21
2115
83
718
Scot
t Mon
crie
ffPa
rtner
ship
30-A
pr-1
518
27%
89
45
24
11
Ree
s Po
llock
Partn
ersh
ip31
-Mar
-15
714
%7
72
51
27
Fran
cis
Cla
rkLL
P31
-Mar
-15
4912
%16
171
4N
/AN
/A31
Bee
ver a
nd S
trut
hers
Partn
ersh
ip30
-Sep
t-15
2133
%10
135
41
510
Haz
lew
oods
LLP
30-A
pr-1
520
15%
912
23
214
18
Jam
es C
owpe
rLL
P30
-Apr
-15
1323
%8
88
32
813
Bar
ber H
arris
on &
Pla
ttPa
rtner
ship
31-D
ec-1
518
22%
1011
13
18
12
Ship
leys
LLP
30-A
pr-1
515
13%
99
23
17
11
Cam
pbel
l Dal
las
LLP
31-M
ay-1
519
10%
88
12
28
11
Figu
re 3
2 U
K F
EE IN
CO
ME
OF
AUD
IT F
IRM
S W
ITH
PIE
AU
DIT
CLI
ENTS
- YE
AR E
ND
ED 2
015
(By
fee
inco
me
from
aud
it)
Audit Firms
Financial Reporting Council 45
UK
Firm
Nam
eU
K
Stru
ctur
e Ye
ar E
ndN
o of
Pr
inci
pals
2 %
of F
emal
e Pr
inci
pals
No
of A
udit
Pr
inci
pals
No
of
Res
pons
ible
In
divi
dual
s3
No
of P
IE
Aud
it
Clie
nts
Fee
Inco
me:
A
udit
(£m
)
Fee
Inco
me:
N
on-A
udit
Wor
k4 to
Aud
it C
lient
s (£
m)
Fee
Inco
me:
N
on-A
udit
Clie
nts
(£m
)To
tal F
ee
Inco
me
(£m
)
CLB
Coo
pers
Partn
ersh
ip31
-Mar
-15
128%
55
12
24
8
Hur
st &
Com
pany
A
ccou
ntan
tsLL
P31
-Mar
-15
1429
%5
51
21
14
Car
ter B
acke
r Win
ter
LLP
31-M
ar-1
518
0%10
133
10.
19
10
Fren
ch D
unca
nLL
P30
-Apr
-15
2124
%9
92
1N
/AN
/A10
BSG
Val
entin
ePa
rtner
ship
30-S
ep-1
512
0%3
31
10
56
Beg
bies
Partn
ersh
ip31
-Mar
-15
40%
45
11
02
3
Wat
son
Buc
kle
Lim
ited
Com
pany
31-D
ec-1
55
20%
44
11
0.3
12
Lark
ing
Gow
enLi
mite
d C
ompa
ny31
-Mar
-15
1020
%8
62
0.5
N/A
22
Wel
beck
Ass
ocia
tes
Lim
ited
Com
pany
30-J
un-1
53
0%2
31
0.5
0.1
0.6
1
F. W
. Sm
ith, R
iche
s
& C
o.Pa
rtner
ship
31-M
ar-1
54
25%
33
10.
40.
31
2
Edw
ards
Acc
ount
ants
(M
idla
nds)
Lim
ited
Com
pany
31-M
ar-1
54
0%4
41
0.4
0.1
12
Nay
lor W
inte
rsgi
llLi
mite
d C
ompa
ny31
-Dec
-15
825
%6
61
0.3
0.2
23
Rits
ons
Partn
ersh
ip31
-Oct
-15
729
%7
71
0.2
03
3
SRG
LLP
31-M
ar-1
54
0%3
41
0.1
0.1
11
Figu
re 3
2 U
K F
EE IN
CO
ME
OF
AUD
IT F
IRM
S W
ITH
PIE
AU
DIT
CLI
ENTS
- YE
AR E
ND
ED 2
015
(By
fee
inco
me
from
aud
it)
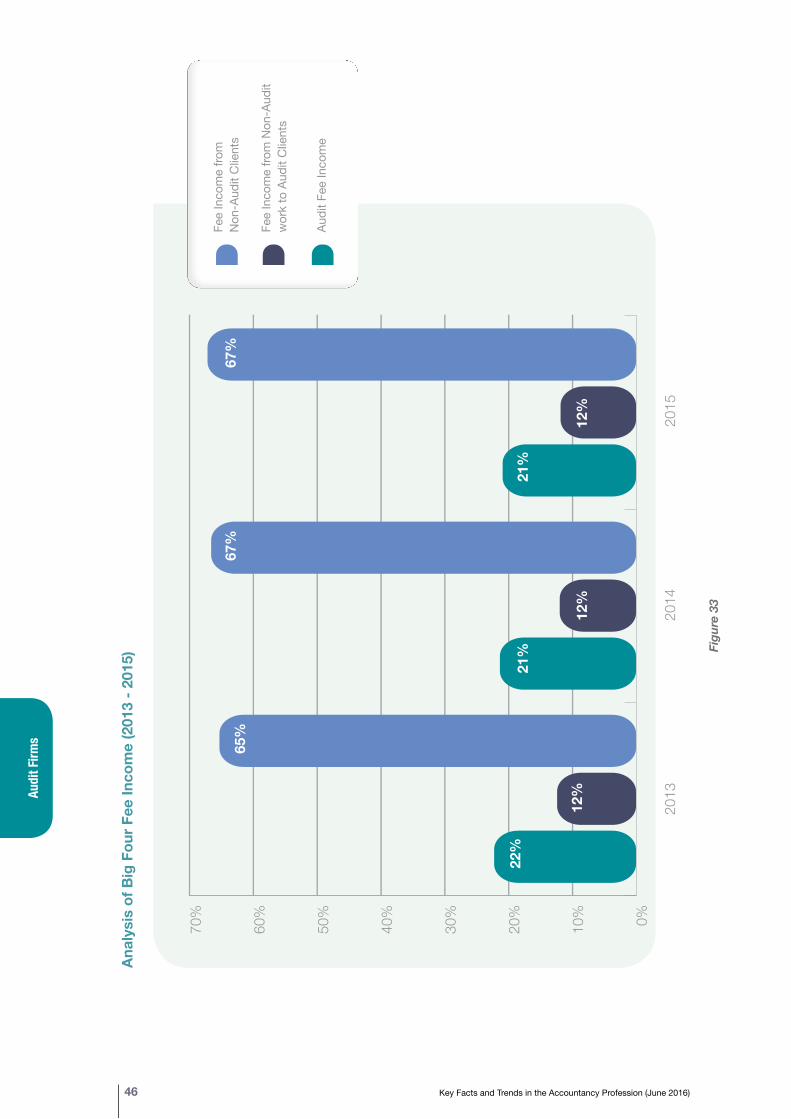
Audi
t Firm
s
46 Key Facts and Trends in the Accountancy Profession (June 2016)
Anal
ysis
of B
ig F
our F
ee In
com
e (2
013
- 201
5)
70%
60%
50%
40%
30%
20%
10% 0%010203040506070
Fee I
ncom
e fro
m No
n-Au
dit C
lients
Fee I
ncom
e from
No
n-Au
dit w
ork to
Aud
it Clie
nts
Audit
Fee I
ncom
e
2015
2014
2013
20
13
2014
20
15
22%
12%
65%
21%
12%
67%
21%
12%
67%
Figu
re 3
3
0%10%
20%
30%
40%
50%
60%
70%
Fee
Inco
me
from
Non
-Aud
it C
lient
s
Fee
Inco
me
from
Non
-Aud
it w
ork
to A
udit
Clie
nts
Audi
t Fee
Inco
me
2014
2013
2012
2011
2010
Fee
Inco
me
from
N
on-A
udit
Clie
nts
Fee
Inco
me
from
Non
-Aud
it w
ork
to A
udit
Clie
nts
Audi
t Fee
Inco
me
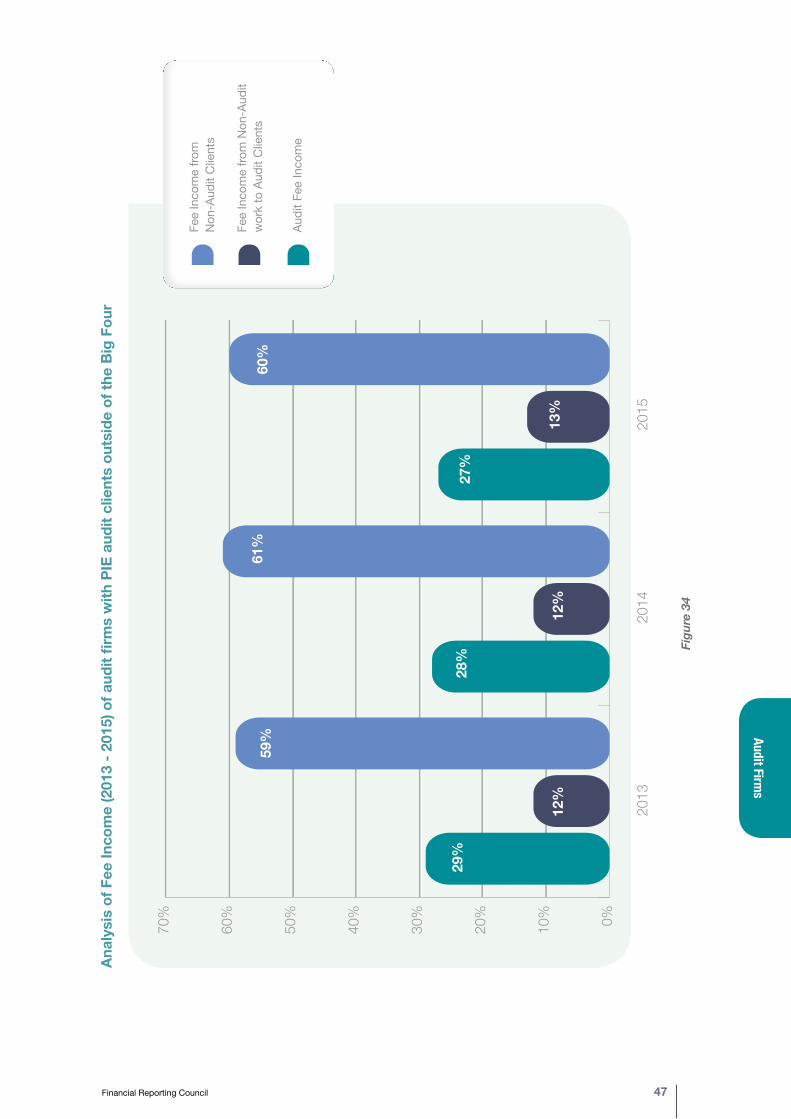
Audit Firms
Financial Reporting Council 47
Anal
ysis
of F
ee In
com
e (2
013
- 201
5) o
f aud
it fir
ms
with
PIE
aud
it cl
ient
s ou
tsid
e of
the
Big
Four
0.00.10.20.30.40.50.60.7Fe
e Inc
ome f
rom N
on-A
udit C
lients
Fee I
ncom
e from
Non
-Aud
it work
to A
udit C
lients
Audit
Fee I
ncom
e
2015
2014
2013
29%
12%
59%
28%
12%
61%
27%
13%
60%
20
13
2014
20
15
70%
60%
50%
40%
30%
20%
10% 0%
Figu
re 3
4
0%10%
20%
30%
40%
50%
60%
70%
Fee
Inco
me
from
Non
-Aud
it C
lient
s
Fee
Inco
me
from
Non
-Aud
it w
ork
to A
udit
Clie
nts
Audi
t Fee
Inco
me
2014
2013
2012
2011
2010
Fee
Inco
me
from
N
on-A
udit
Clie
nts
Fee
Inco
me
from
Non
-Aud
it w
ork
to A
udit
Clie
nts
Audi
t Fee
Inco
me
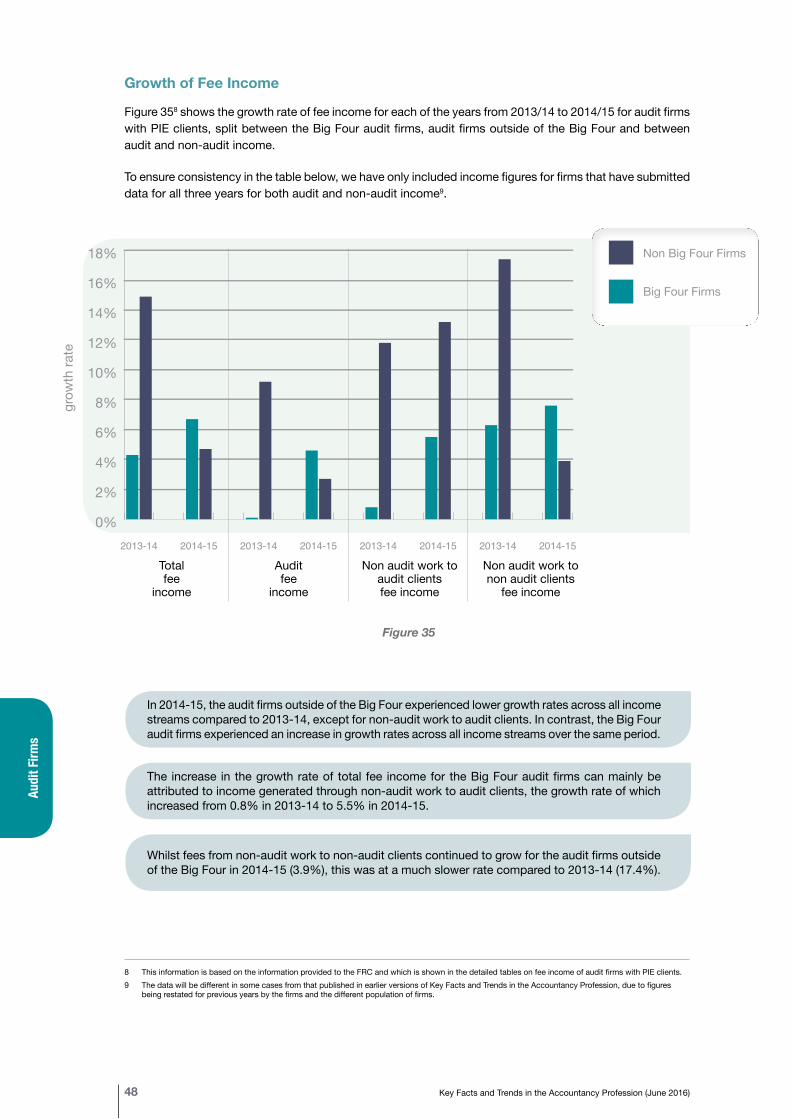
Audi
t Firm
s
48 Key Facts and Trends in the Accountancy Profession (June 2016)
Growth of Fee Income
Figure 358 shows the growth rate of fee income for each of the years from 2013/14 to 2014/15 for audit firms with PIE clients, split between the Big Four audit firms, audit firms outside of the Big Four and between audit and non-audit income.
To ensure consistency in the table below, we have only included income figures for firms that have submitted data for all three years for both audit and non-audit income9.
0%
2%
4%
6%
8%
10%
12%
14%
16%
18%Non Big Four Firms
Big Four Firms
2013-142014-152013-142014-152013-142014-152013-142014-15
0%
2%
4%
6%
8%
10%
12%
14%
16%
18%Non Big Four Firms
Big Four Firms
2013-142014-152013-142014-152013-142014-152013-142014-15
0%
2%
4%
6%
8%
10%
12%
14%
16%
18%
Non Big Four Firms
Big Four Firms
2014-152013-142014-152013-142014-152013-142014-152013-140%
2%
4%
6%
8%
10%
12%
14%
16%
18%
Non Big Four Firms
Big Four Firms
2014-152013-142014-152013-142014-152013-142014-152013-14
Figure 35
In 2014-15, the audit firms outside of the Big Four experienced lower growth rates across all income streams compared to 2013-14, except for non-audit work to audit clients. In contrast, the Big Four audit firms experienced an increase in growth rates across all income streams over the same period.
The increase in the growth rate of total fee income for the Big Four audit firms can mainly be attributed to income generated through non-audit work to audit clients, the growth rate of which increased from 0.8% in 2013-14 to 5.5% in 2014-15.
Whilst fees from non-audit work to non-audit clients continued to grow for the audit firms outside of the Big Four in 2014-15 (3.9%), this was at a much slower rate compared to 2013-14 (17.4%).
8 This information is based on the information provided to the FRC and which is shown in the detailed tables on fee income of audit firms with PIE clients.9 The data will be different in some cases from that published in earlier versions of Key Facts and Trends in the Accountancy Profession, due to figures
being restated for previous years by the firms and the different population of firms.
Total Audit Non audit work to Non audit work to fee fee audit clients non audit clients income income fee income fee income
grow
th ra
te
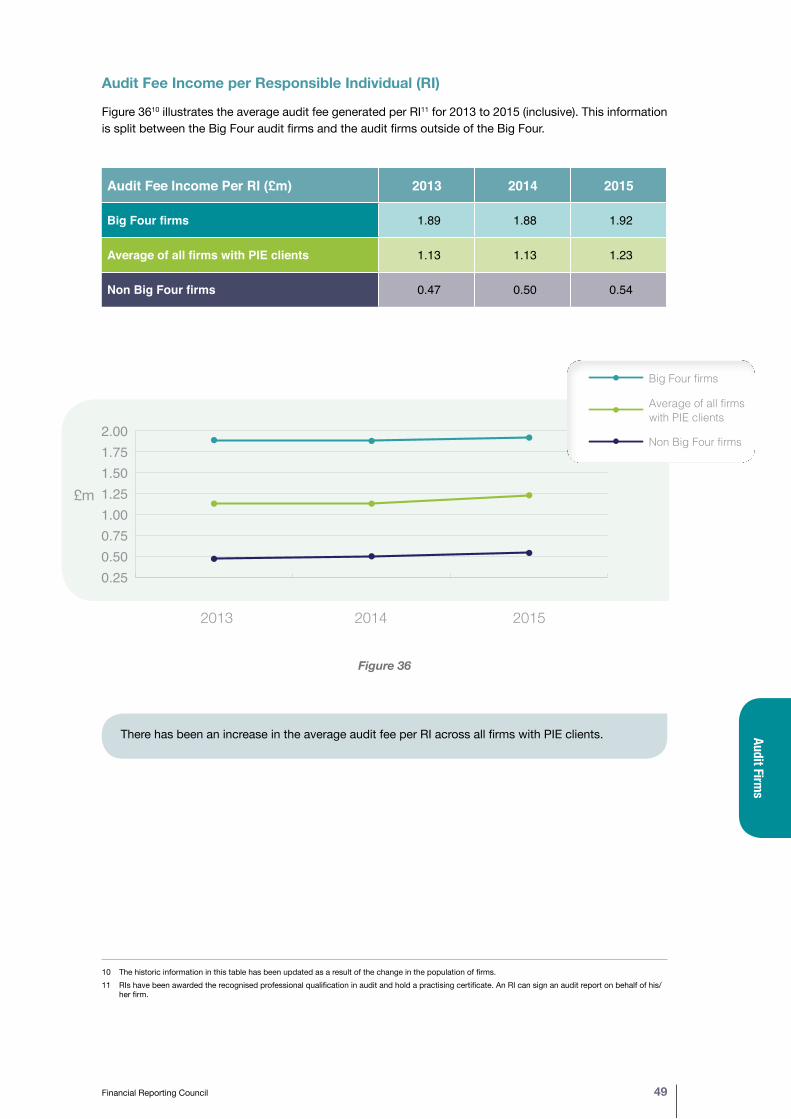
Audit Firms
Financial Reporting Council 49
10 The historic information in this table has been updated as a result of the change in the population of firms.11 RIs have been awarded the recognised professional qualification in audit and hold a practising certificate. An RI can sign an audit report on behalf of his/
her firm.
Audit Fee Income per Responsible Individual (RI)
Figure 3610 illustrates the average audit fee generated per RI11 for 2013 to 2015 (inclusive). This information is split between the Big Four audit firms and the audit firms outside of the Big Four.
Audit Fee Income Per RI (£m) 2013 2014 2015
Big Four firms 1.89 1.88 1.92
Average of all firms with PIE clients 1.13 1.13 1.23
Non Big Four firms 0.47 0.50 0.54
Figure 36
There has been an increase in the average audit fee per RI across all firms with PIE clients.
0.250.500.751.001.251.501.752.00 Non Big Four firms
Big Four firmsAverage of all firms with PIE clients
2013 2014 2015
£m
0.250.500.751.001.251.501.752.00 Non Big Four firms
Big Four firmsAverage of all firms with PIE clients
0.250.500.751.001.251.501.752.00 Non Big Four firms
Big Four firmsAverage of all firms with PIE clients
0.250.500.751.001.251.501.752.00 Non Big Four firms
Big Four firmsAverage of all firms with PIE clients
0.250.500.751.001.251.501.752.00 Non Big Four firms
Big Four firmsAverage of all firms with PIE clients
0.250.500.751.001.251.501.752.00 Non Big Four firms
Big Four firmsAverage of all firms with PIE clients
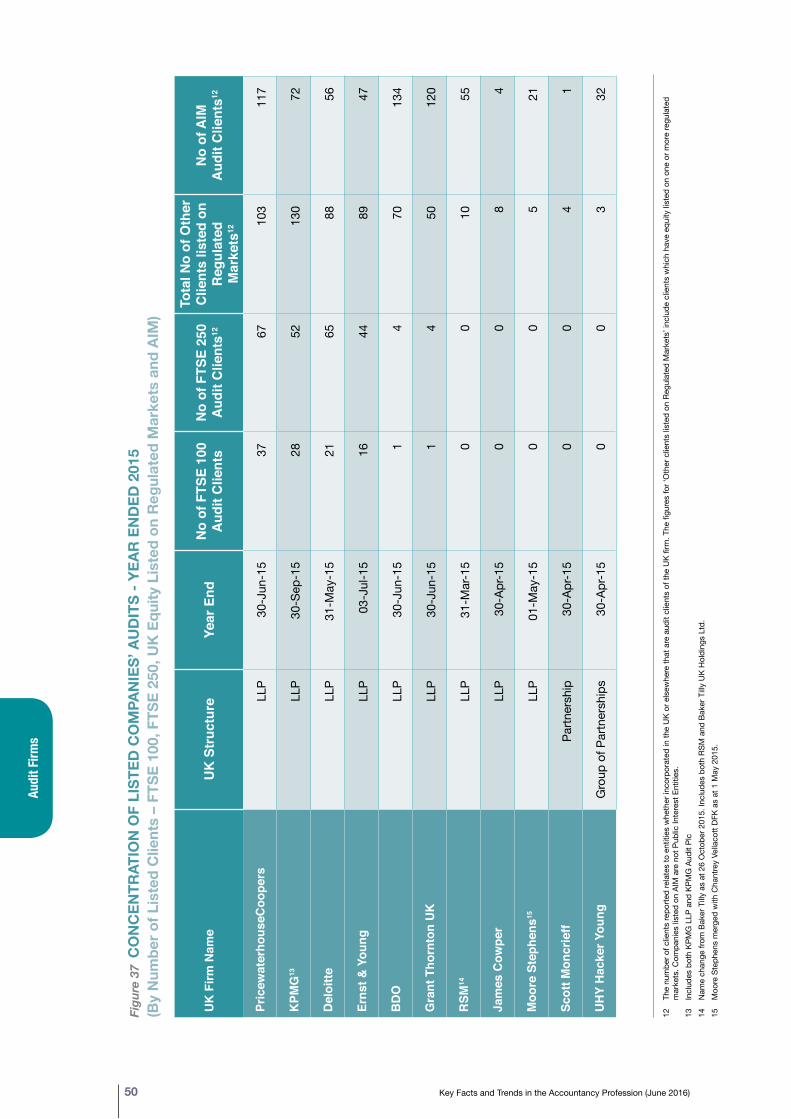
Audi
t Firm
s
50 Key Facts and Trends in the Accountancy Profession (June 2016)
Figu
re 3
7 C
ON
CEN
TRAT
ION
OF
LIST
ED C
OM
PAN
IES’
AU
DIT
S - Y
EAR
EN
DED
201
5 (B
y N
umbe
r of L
iste
d C
lient
s –
FTSE
100
, FTS
E 25
0, U
K E
quity
Lis
ted
on R
egul
ated
Mar
kets
and
AIM
)
UK
Firm
Nam
eU
K S
truc
ture
Ye
ar E
ndN
o of
FTS
E 10
0 A
udit
Clie
nts
No
of F
TSE
250
Aud
it C
lient
s12
Tota
l No
of O
ther
C
lient
s lis
ted
on
Reg
ulat
ed
Mar
kets
12
No
of A
IM
Aud
it C
lient
s12
Pric
ewat
erho
useC
oope
rsLL
P30
-Jun
-15
3767
103
117
KPM
G13
LLP
30-S
ep-1
528
5213
072
Del
oitte
LLP
31-M
ay-1
521
6588
56
Erns
t & Y
oung
LLP
03-J
ul-1
516
4489
47
BD
O
LLP
30-J
un-1
51
470
134
Gra
nt T
horn
ton
UK
LLP
30-J
un-1
51
450
120
RSM
14LL
P31
-Mar
-15
00
1055
Jam
es C
owpe
rLL
P30
-Apr
-15
00
84
Moo
re S
teph
ens15
LLP
01-M
ay-1
50
05
21
Scot
t Mon
crie
ffPa
rtner
ship
30-A
pr-1
50
04
1
UH
Y H
acke
r You
ngG
roup
of P
artn
ersh
ips
30-A
pr-1
50
03
32
12
The
num
ber o
f clie
nts
repo
rted
rela
tes
to e
ntiti
es w
heth
er in
corp
orat
ed in
the
UK
or e
lsew
here
that
are
aud
it cl
ient
s of
the
UK
firm
. The
figu
res
for ‘
Oth
er c
lient
s lis
ted
on R
egul
ated
Mar
kets
’ inc
lude
clie
nts
whi
ch h
ave
equi
ty li
sted
on
one
or m
ore
regu
late
d m
arke
ts. C
ompa
nies
list
ed o
n AI
M a
re n
ot P
ublic
Inte
rest
Ent
ities
.13
In
clud
es b
oth
KPM
G L
LP a
nd K
PMG
Aud
it Pl
c
14
Nam
e ch
ange
from
Bak
er T
illy a
s at
26
Oct
ober
201
5. In
clud
es b
oth
RSM
and
Bak
er T
illy U
K H
oldi
ngs
Ltd.
15
Moo
re S
teph
ens
mer
ged
with
Cha
ntre
y Ve
llaco
tt DF
K as
at 1
May
201
5.
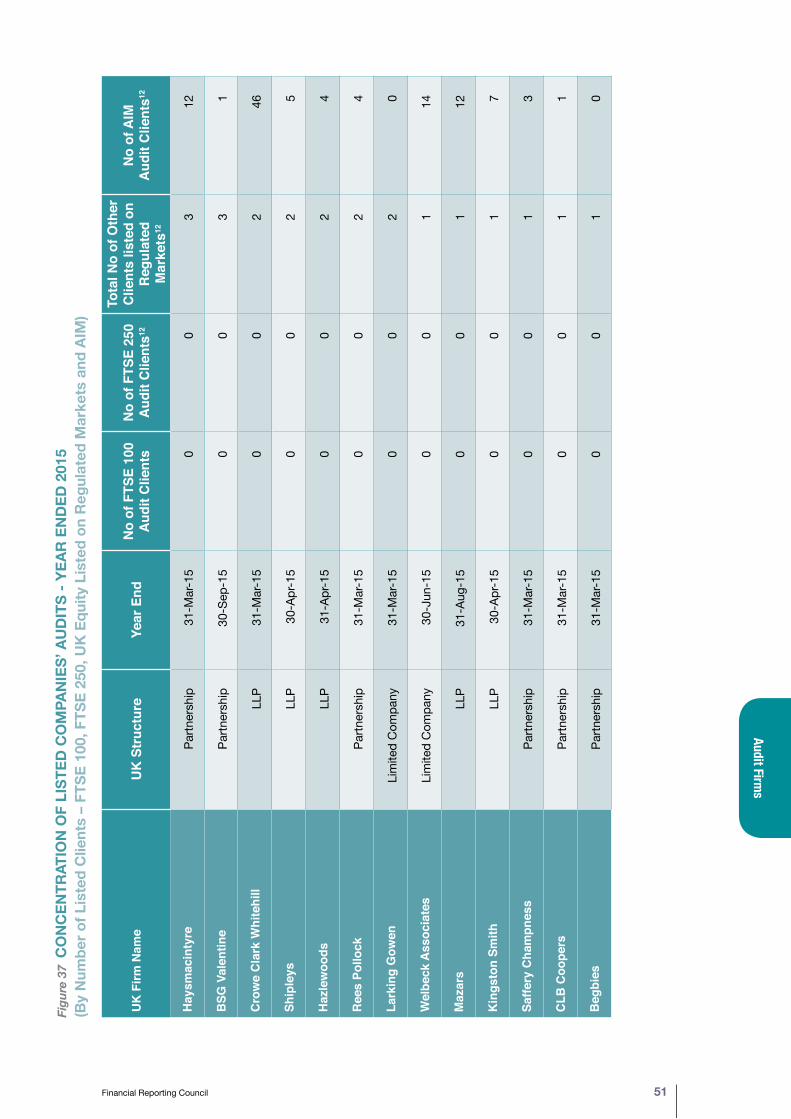
Audit Firms
Financial Reporting Council 51
UK
Firm
Nam
eU
K S
truc
ture
Ye
ar E
ndN
o of
FTS
E 10
0 A
udit
Clie
nts
No
of F
TSE
250
Aud
it C
lient
s12
Tota
l No
of O
ther
C
lient
s lis
ted
on
Reg
ulat
ed
Mar
kets
12
No
of A
IM
Aud
it C
lient
s12
Hay
smac
inty
rePa
rtner
ship
31-M
ar-1
50
03
12
BSG
Val
entin
ePa
rtner
ship
30-S
ep-1
50
03
1
Cro
we
Cla
rk W
hite
hill
LLP
31-M
ar-1
50
02
46
Ship
leys
LLP
30-A
pr-1
50
02
5
Haz
lew
oods
LLP
31-A
pr-1
50
02
4
Ree
s Po
llock
Partn
ersh
ip31
-Mar
-15
00
24
Lark
ing
Gow
enLi
mite
d C
ompa
ny31
-Mar
-15
00
20
Wel
beck
Ass
ocia
tes
Lim
ited
Com
pany
30-J
un-1
50
01
14
Maz
ars
LLP
31-A
ug-1
50
01
12
Kin
gsto
n Sm
ithLL
P30
-Apr
-15
00
17
Saffe
ry C
ham
pnes
sPa
rtner
ship
31-M
ar-1
50
01
3
CLB
Coo
pers
Partn
ersh
ip31
-Mar
-15
00
11
Beg
bies
Partn
ersh
ip31
-Mar
-15
00
10
Figu
re 3
7 C
ON
CEN
TRAT
ION
OF
LIST
ED C
OM
PAN
IES’
AU
DIT
S - Y
EAR
EN
DED
201
5 (B
y N
umbe
r of L
iste
d C
lient
s –
FTSE
100
, FTS
E 25
0, U
K E
quity
Lis
ted
on R
egul
ated
Mar
kets
and
AIM
)
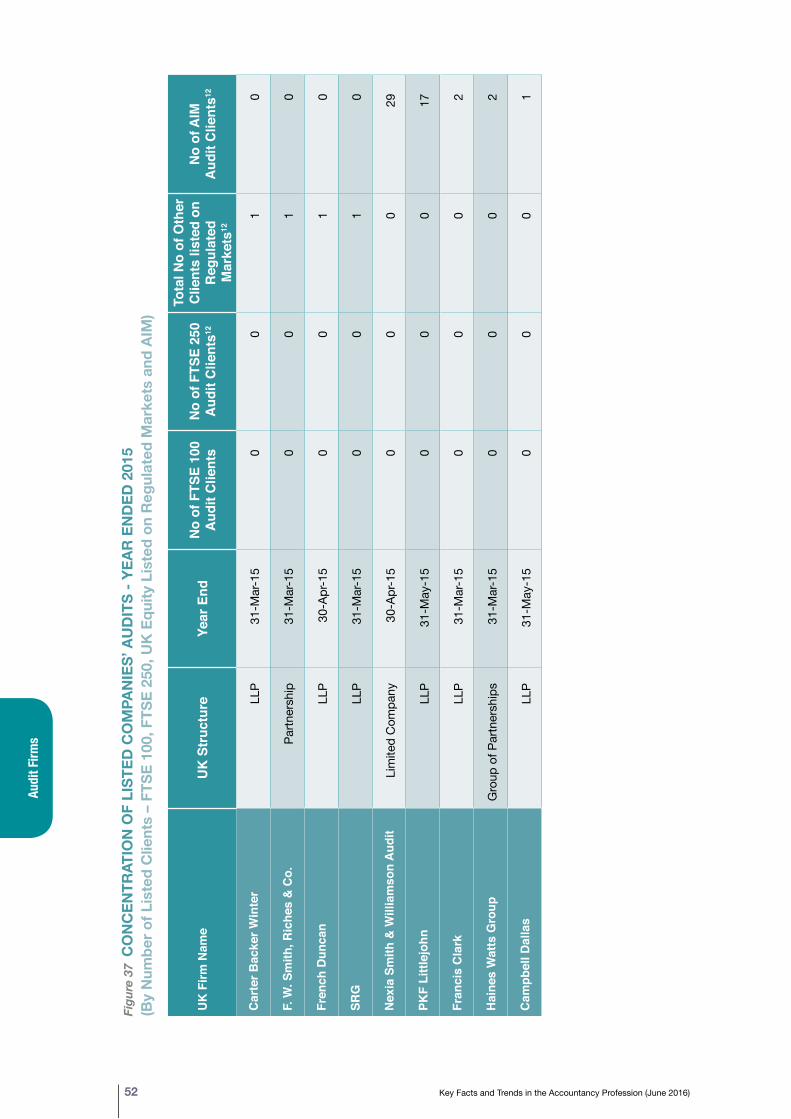
Audi
t Firm
s
52 Key Facts and Trends in the Accountancy Profession (June 2016)
UK
Firm
Nam
eU
K S
truc
ture
Ye
ar E
ndN
o of
FTS
E 10
0 A
udit
Clie
nts
No
of F
TSE
250
Aud
it C
lient
s12
Tota
l No
of O
ther
C
lient
s lis
ted
on
Reg
ulat
ed
Mar
kets
12
No
of A
IM
Aud
it C
lient
s12
Car
ter B
acke
r Win
ter
LLP
31-M
ar-1
50
01
0
F. W
. Sm
ith, R
iche
s &
Co.
Partn
ersh
ip31
-Mar
-15
00
10
Fren
ch D
unca
nLL
P30
-Apr
-15
00
10
SRG
LLP
31-M
ar-1
50
01
0
Nex
ia S
mith
& W
illia
mso
n A
udit
Lim
ited
Com
pany
30-A
pr-1
50
00
29
PKF
Littl
ejoh
nLL
P31
-May
-15
00
017
Fran
cis
Cla
rkLL
P31
-Mar
-15
00
02
Hai
nes
Wat
ts G
roup
Gro
up o
f Par
tner
ship
s31
-Mar
-15
00
02
Cam
pbel
l Dal
las
LLP
31-M
ay-1
50
00
1
Figu
re 3
7 C
ON
CEN
TRAT
ION
OF
LIST
ED C
OM
PAN
IES’
AU
DIT
S - Y
EAR
EN
DED
201
5 (B
y N
umbe
r of L
iste
d C
lient
s –
FTSE
100
, FTS
E 25
0, U
K E
quity
Lis
ted
on R
egul
ated
Mar
kets
and
AIM
)
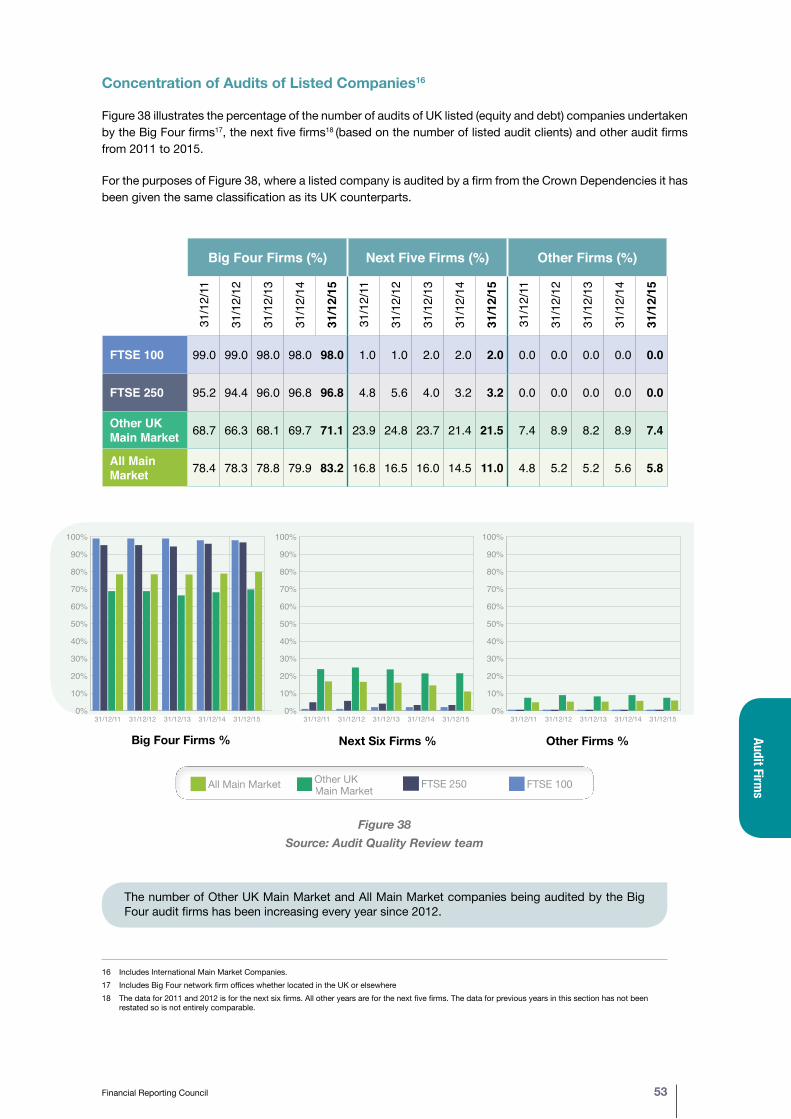
16 Includes International Main Market Companies.17 Includes Big Four network firm offices whether located in the UK or elsewhere18 The data for 2011 and 2012 is for the next six firms. All other years are for the next five firms. The data for previous years in this section has not been
restated so is not entirely comparable.
Audit Firms
Financial Reporting Council 53
Big Four Firms % Next Six Firms % Other Firms %
Concentration of Audits of Listed Companies16
Figure 38 illustrates the percentage of the number of audits of UK listed (equity and debt) companies undertaken by the Big Four firms17, the next five firms18 (based on the number of listed audit clients) and other audit firms from 2011 to 2015.
For the purposes of Figure 38, where a listed company is audited by a firm from the Crown Dependencies it has been given the same classification as its UK counterparts.
Big Four Firms (%) Next Five Firms (%) Other Firms (%)
31/1
2/11
31/1
2/12
31/1
2/13
31/1
2/14
31/1
2/15
31/1
2/11
31/1
2/12
31/1
2/13
31/1
2/14
31/1
2/15
31/1
2/11
31/1
2/12
31/1
2/13
31/1
2/14
31/1
2/15
FTSE 100 99.0 99.0 98.0 98.0 98.0 1.0 1.0 2.0 2.0 2.0 0.0 0.0 0.0 0.0 0.0
FTSE 250 95.2 94.4 96.0 96.8 96.8 4.8 5.6 4.0 3.2 3.2 0.0 0.0 0.0 0.0 0.0
Other UK Main Market 68.7 66.3 68.1 69.7 71.1 23.9 24.8 23.7 21.4 21.5 7.4 8.9 8.2 8.9 7.4
All Main Market 78.4 78.3 78.8 79.9 83.2 16.8 16.5 16.0 14.5 11.0 4.8 5.2 5.2 5.6 5.8
0%
10%
20%
30%
40%
50%
60%
70%
80%
90%
100%All Main Market
Other UK Main Market
FTSE 250
FTSE 100
31/12/1531/12/1431/12/1331/12/1231/12/11
Big Four Firms %
0%
10%
20%
30%
40%
50%
60%
70%
80%
90%
100%All Main Market
Other UK Main Market
FTSE 250
FTSE 100
31/12/1531/12/1431/12/1331/12/1231/12/11
Next Five Firms %
0%
10%
20%
30%
40%
50%
60%
70%
80%
90%
100%All Main Market
Other UK Main Market
FTSE 250
FTSE 100
31/12/1531/12/1431/12/1331/12/1231/12/11
Other Firms %
0%
10%
20%
30%
40%
50%
60%
70%
80%
90%
100%All Main Market
Other UK Main Market
FTSE 250
FTSE 100
31/12/1131/12/1231/12/1331/12/14
Big Four Firms %
0%
10%
20%
30%
40%
50%
60%
70%
80%
90%
100%All Main Market
Other UK Main Market
FTSE 250
FTSE 100
31/12/1131/12/1231/12/1331/12/14
Big Four Firms %
0%
10%
20%
30%
40%
50%
60%
70%
80%
90%
100%All Main Market
Other UK Main Market
FTSE 250
FTSE 100
31/12/1131/12/1231/12/1331/12/14
Big Four Firms %
0%
10%
20%
30%
40%
50%
60%
70%
80%
90%
100%All Main Market
Other UK Main Market
FTSE 250
FTSE 100
31/12/1131/12/1231/12/1331/12/14
Big Four Firms %
0%
10%
20%
30%
40%
50%
60%
70%
80%
90%
100%All Main Market
Other UK Main Market
FTSE 250
FTSE 100
31/12/1131/12/1231/12/1331/12/14
Big Four Firms %
0%
10%
20%
30%
40%
50%
60%
70%
80%
90%
100%All Main Market
Other UK Main Market
FTSE 250
FTSE 100
31/12/1131/12/1231/12/1331/12/14
Big Four Firms %
Figure 38Source: Audit Quality Review team
The number of Other UK Main Market and All Main Market companies being audited by the Big Four audit firms has been increasing every year since 2012.
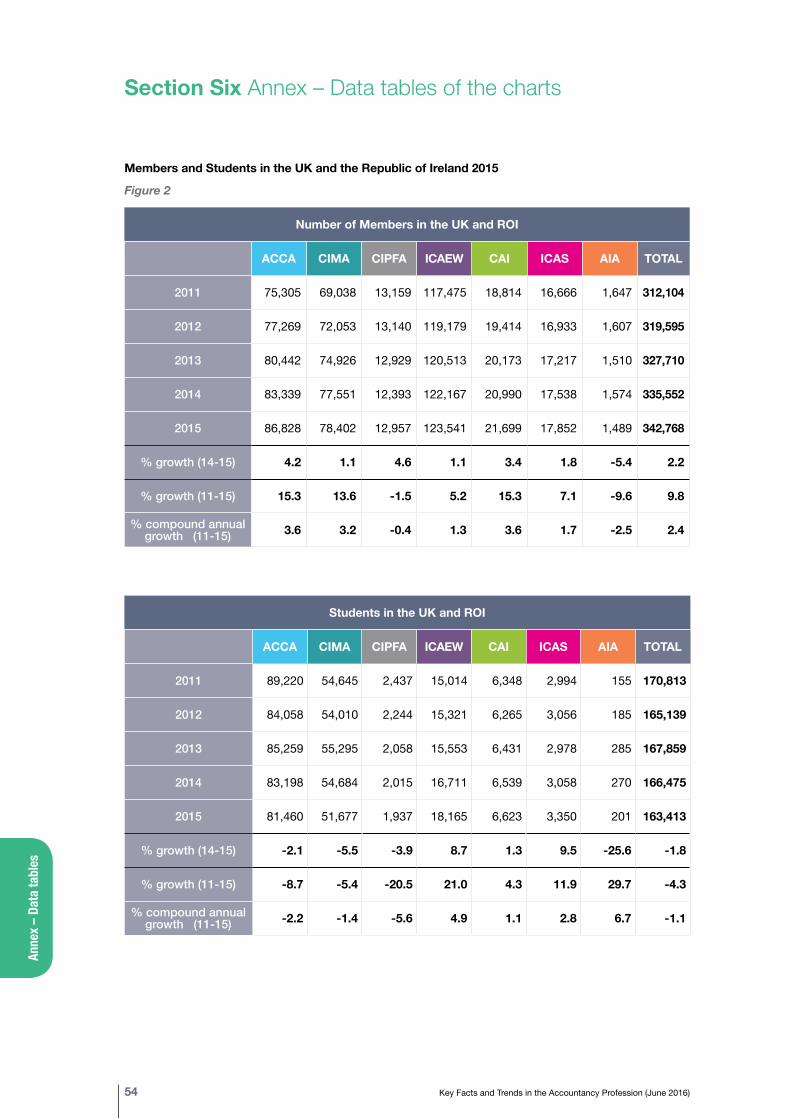
Anne
x – D
ata
tabl
es
54 Key Facts and Trends in the Accountancy Profession (June 2016)
Section Six Annex – Data tables of the charts
Members and Students in the UK and the Republic of Ireland 2015
Figure 2
Number of Members in the UK and ROI
ACCA CIMA CIPFA ICAEW CAI ICAS AIA TOTAL
2011 75,305 69,038 13,159 117,475 18,814 16,666 1,647 312,104
2012 77,269 72,053 13,140 119,179 19,414 16,933 1,607 319,595
2013 80,442 74,926 12,929 120,513 20,173 17,217 1,510 327,710
2014 83,339 77,551 12,393 122,167 20,990 17,538 1,574 335,552
2015 86,828 78,402 12,957 123,541 21,699 17,852 1,489 342,768
% growth (14-15) 4.2 1.1 4.6 1.1 3.4 1.8 -5.4 2.2
% growth (11-15) 15.3 13.6 -1.5 5.2 15.3 7.1 -9.6 9.8
% compound annual growth (11-15) 3.6 3.2 -0.4 1.3 3.6 1.7 -2.5 2.4
Students in the UK and ROI
ACCA CIMA CIPFA ICAEW CAI ICAS AIA TOTAL
2011 89,220 54,645 2,437 15,014 6,348 2,994 155 170,813
2012 84,058 54,010 2,244 15,321 6,265 3,056 185 165,139
2013 85,259 55,295 2,058 15,553 6,431 2,978 285 167,859
2014 83,198 54,684 2,015 16,711 6,539 3,058 270 166,475
2015 81,460 51,677 1,937 18,165 6,623 3,350 201 163,413
% growth (14-15) -2.1 -5.5 -3.9 8.7 1.3 9.5 -25.6 -1.8
% growth (11-15) -8.7 -5.4 -20.5 21.0 4.3 11.9 29.7 -4.3
% compound annual growth (11-15) -2.2 -1.4 -5.6 4.9 1.1 2.8 6.7 -1.1
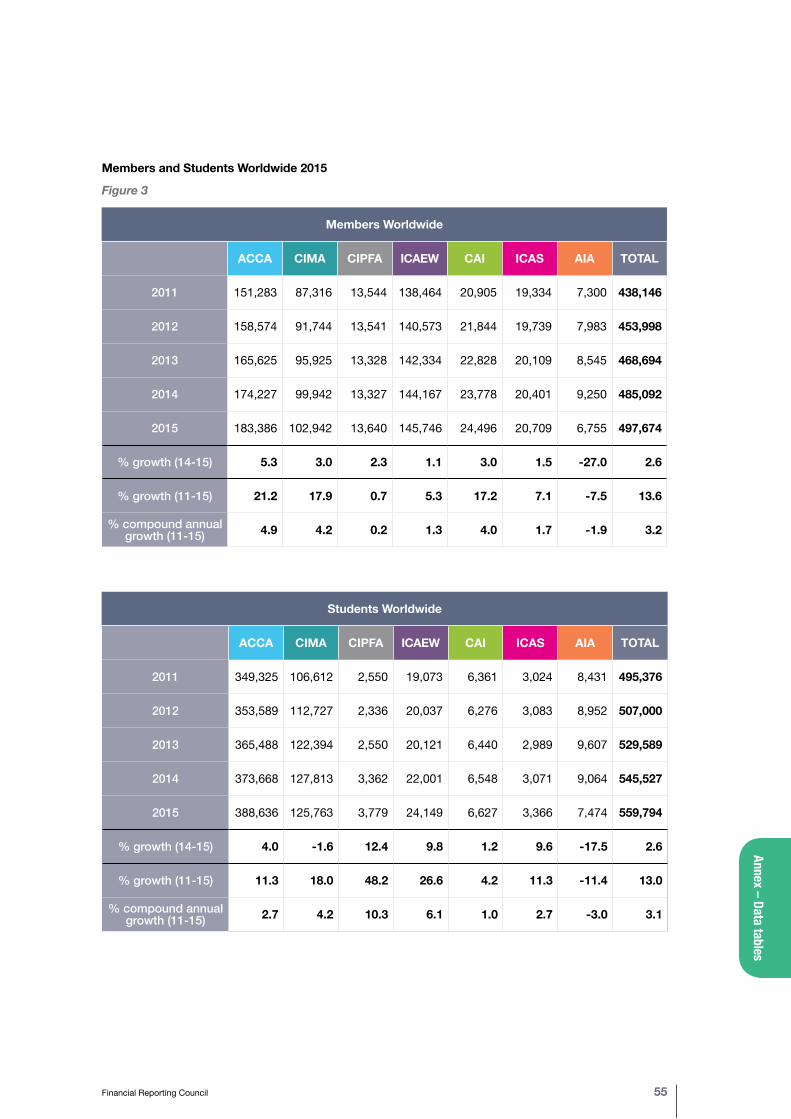
Annex – Data tables
Financial Reporting Council 55
Members and Students Worldwide 2015
Figure 3
Members Worldwide
ACCA CIMA CIPFA ICAEW CAI ICAS AIA TOTAL
2011 151,283 87,316 13,544 138,464 20,905 19,334 7,300 438,146
2012 158,574 91,744 13,541 140,573 21,844 19,739 7,983 453,998
2013 165,625 95,925 13,328 142,334 22,828 20,109 8,545 468,694
2014 174,227 99,942 13,327 144,167 23,778 20,401 9,250 485,092
2015 183,386 102,942 13,640 145,746 24,496 20,709 6,755 497,674
% growth (14-15) 5.3 3.0 2.3 1.1 3.0 1.5 -27.0 2.6
% growth (11-15) 21.2 17.9 0.7 5.3 17.2 7.1 -7.5 13.6
% compound annual growth (11-15) 4.9 4.2 0.2 1.3 4.0 1.7 -1.9 3.2
Students Worldwide
ACCA CIMA CIPFA ICAEW CAI ICAS AIA TOTAL
2011 349,325 106,612 2,550 19,073 6,361 3,024 8,431 495,376
2012 353,589 112,727 2,336 20,037 6,276 3,083 8,952 507,000
2013 365,488 122,394 2,550 20,121 6,440 2,989 9,607 529,589
2014 373,668 127,813 3,362 22,001 6,548 3,071 9,064 545,527
2015 388,636 125,763 3,779 24,149 6,627 3,366 7,474 559,794
% growth (14-15) 4.0 -1.6 12.4 9.8 1.2 9.6 -17.5 2.6
% growth (11-15) 11.3 18.0 48.2 26.6 4.2 11.3 -11.4 13.0
% compound annual growth (11-15) 2.7 4.2 10.3 6.1 1.0 2.7 -3.0 3.1
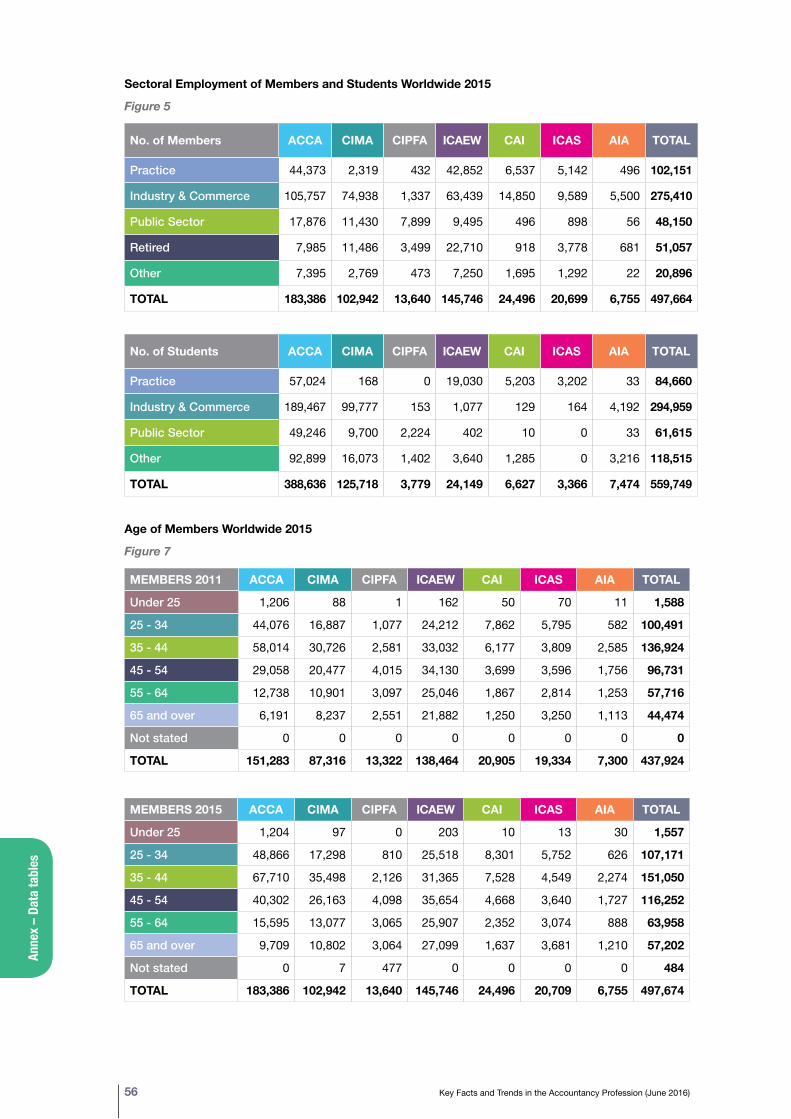
Anne
x – D
ata
tabl
es
56 Key Facts and Trends in the Accountancy Profession (June 2016)
Sectoral Employment of Members and Students Worldwide 2015
Figure 5
No. of Members ACCA CIMA CIPFA ICAEW CAI ICAS AIA TOTAL
Practice 44,373 2,319 432 42,852 6,537 5,142 496 102,151
Industry & Commerce 105,757 74,938 1,337 63,439 14,850 9,589 5,500 275,410
Public Sector 17,876 11,430 7,899 9,495 496 898 56 48,150
Retired 7,985 11,486 3,499 22,710 918 3,778 681 51,057
Other 7,395 2,769 473 7,250 1,695 1,292 22 20,896
TOTAL 183,386 102,942 13,640 145,746 24,496 20,699 6,755 497,664
No. of Students ACCA CIMA CIPFA ICAEW CAI ICAS AIA TOTAL
Practice 57,024 168 0 19,030 5,203 3,202 33 84,660
Industry & Commerce 189,467 99,777 153 1,077 129 164 4,192 294,959
Public Sector 49,246 9,700 2,224 402 10 0 33 61,615
Other 92,899 16,073 1,402 3,640 1,285 0 3,216 118,515
TOTAL 388,636 125,718 3,779 24,149 6,627 3,366 7,474 559,749
Age of Members Worldwide 2015
Figure 7
MEMBERS 2011 ACCA CIMA CIPFA ICAEW CAI ICAS AIA TOTAL
Under 25 1,206 88 1 162 50 70 11 1,588
25 - 34 44,076 16,887 1,077 24,212 7,862 5,795 582 100,491
35 - 44 58,014 30,726 2,581 33,032 6,177 3,809 2,585 136,924
45 - 54 29,058 20,477 4,015 34,130 3,699 3,596 1,756 96,731
55 - 64 12,738 10,901 3,097 25,046 1,867 2,814 1,253 57,716
65 and over 6,191 8,237 2,551 21,882 1,250 3,250 1,113 44,474
Not stated 0 0 0 0 0 0 0 0
TOTAL 151,283 87,316 13,322 138,464 20,905 19,334 7,300 437,924
MEMBERS 2015 ACCA CIMA CIPFA ICAEW CAI ICAS AIA TOTAL
Under 25 1,204 97 0 203 10 13 30 1,557
25 - 34 48,866 17,298 810 25,518 8,301 5,752 626 107,171
35 - 44 67,710 35,498 2,126 31,365 7,528 4,549 2,274 151,050
45 - 54 40,302 26,163 4,098 35,654 4,668 3,640 1,727 116,252
55 - 64 15,595 13,077 3,065 25,907 2,352 3,074 888 63,958
65 and over 9,709 10,802 3,064 27,099 1,637 3,681 1,210 57,202
Not stated 0 7 477 0 0 0 0 484
TOTAL 183,386 102,942 13,640 145,746 24,496 20,709 6,755 497,674
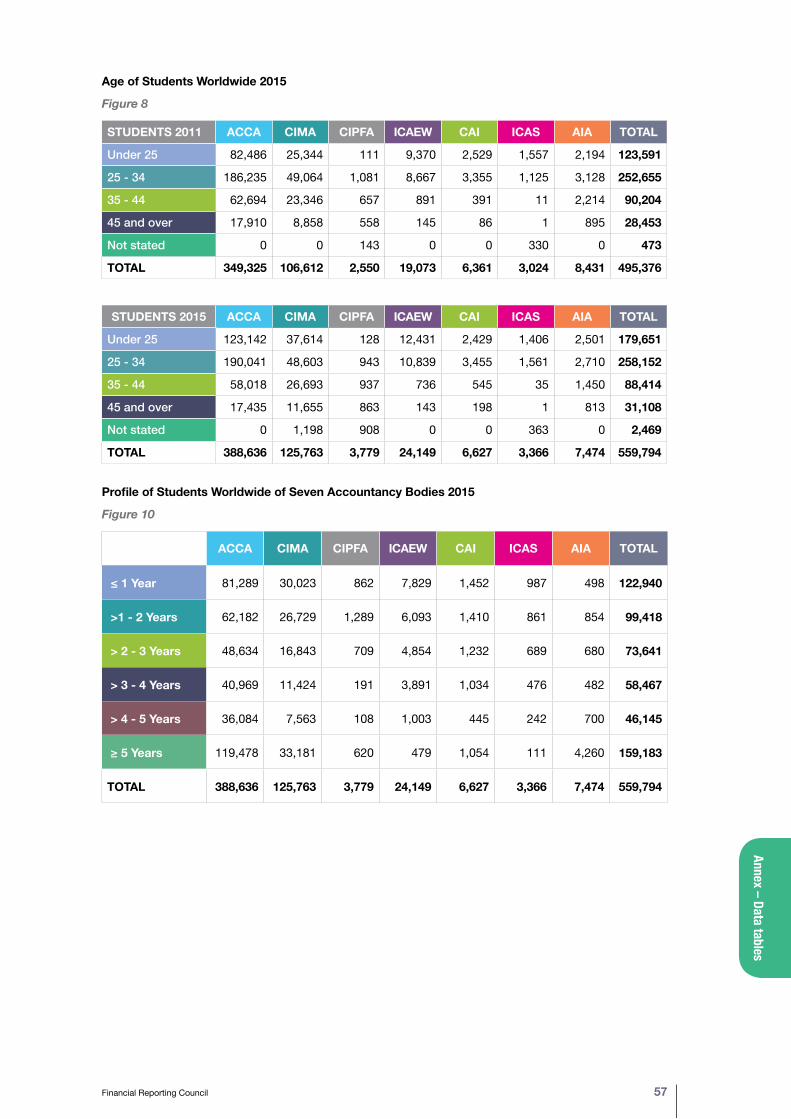
Age of Students Worldwide 2015
Figure 8
STUDENTS 2011 ACCA CIMA CIPFA ICAEW CAI ICAS AIA TOTAL
Under 25 82,486 25,344 111 9,370 2,529 1,557 2,194 123,591
25 - 34 186,235 49,064 1,081 8,667 3,355 1,125 3,128 252,655
35 - 44 62,694 23,346 657 891 391 11 2,214 90,204
45 and over 17,910 8,858 558 145 86 1 895 28,453
Not stated 0 0 143 0 0 330 0 473
TOTAL 349,325 106,612 2,550 19,073 6,361 3,024 8,431 495,376
STUDENTS 2015 ACCA CIMA CIPFA ICAEW CAI ICAS AIA TOTAL
Under 25 123,142 37,614 128 12,431 2,429 1,406 2,501 179,651
25 - 34 190,041 48,603 943 10,839 3,455 1,561 2,710 258,152
35 - 44 58,018 26,693 937 736 545 35 1,450 88,414
45 and over 17,435 11,655 863 143 198 1 813 31,108
Not stated 0 1,198 908 0 0 363 0 2,469
TOTAL 388,636 125,763 3,779 24,149 6,627 3,366 7,474 559,794
Profile of Students Worldwide of Seven Accountancy Bodies 2015
Figure 10
ACCA CIMA CIPFA ICAEW CAI ICAS AIA TOTAL
≤ 1 Year 81,289 30,023 862 7,829 1,452 987 498 122,940
>1 - 2 Years 62,182 26,729 1,289 6,093 1,410 861 854 99,418
> 2 - 3 Years 48,634 16,843 709 4,854 1,232 689 680 73,641
> 3 - 4 Years 40,969 11,424 191 3,891 1,034 476 482 58,467
> 4 - 5 Years 36,084 7,563 108 1,003 445 242 700 46,145
≥ 5 Years 119,478 33,181 620 479 1,054 111 4,260 159,183
TOTAL 388,636 125,763 3,779 24,149 6,627 3,366 7,474 559,794
Annex – Data tables
Financial Reporting Council 57
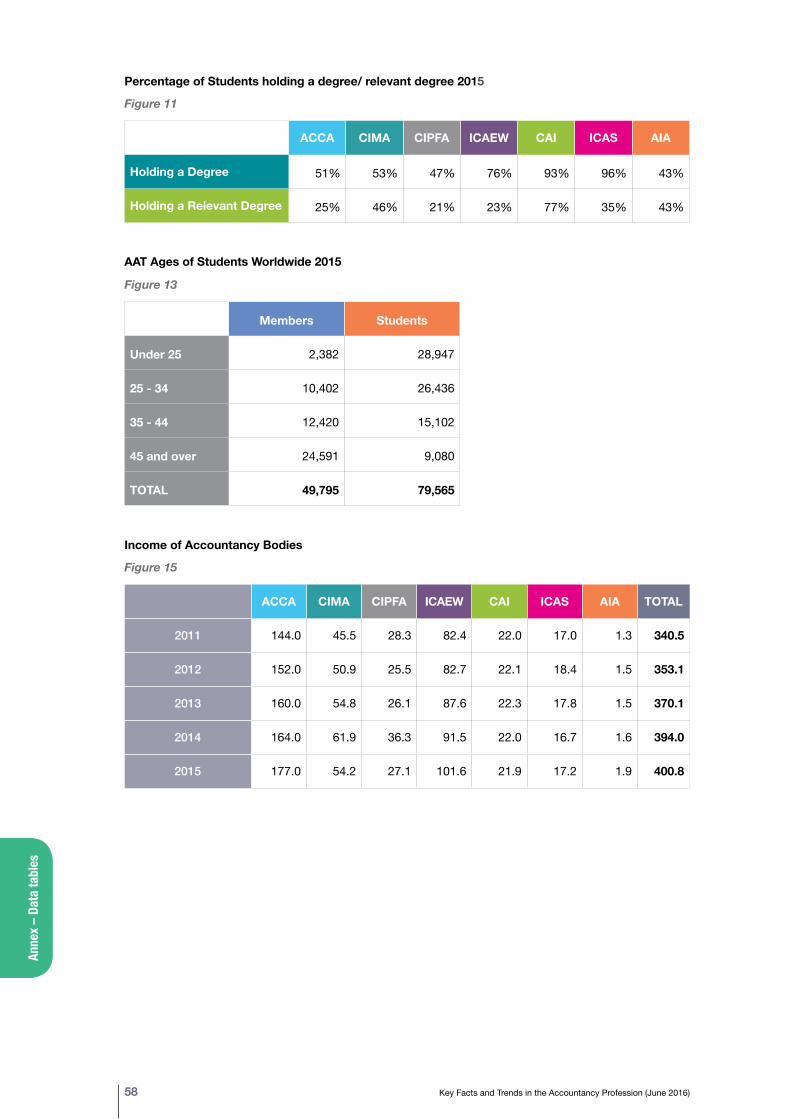
Percentage of Students holding a degree/ relevant degree 2015
Figure 11
ACCA CIMA CIPFA ICAEW CAI ICAS AIA
Holding a Degree 51% 53% 47% 76% 93% 96% 43%
Holding a Relevant Degree 25% 46% 21% 23% 77% 35% 43%
AAT Ages of Students Worldwide 2015
Figure 13
Members Students
Under 25 2,382 28,947
25 - 34 10,402 26,436
35 - 44 12,420 15,102
45 and over 24,591 9,080
TOTAL 49,795 79,565
Income of Accountancy Bodies
Figure 15
ACCA CIMA CIPFA ICAEW CAI ICAS AIA TOTAL
2011 144.0 45.5 28.3 82.4 22.0 17.0 1.3 340.5
2012 152.0 50.9 25.5 82.7 22.1 18.4 1.5 353.1
2013 160.0 54.8 26.1 87.6 22.3 17.8 1.5 370.1
2014 164.0 61.9 36.3 91.5 22.0 16.7 1.6 394.0
2015 177.0 54.2 27.1 101.6 21.9 17.2 1.9 400.8
Anne
x – D
ata
tabl
es
58 Key Facts and Trends in the Accountancy Profession (June 2016)
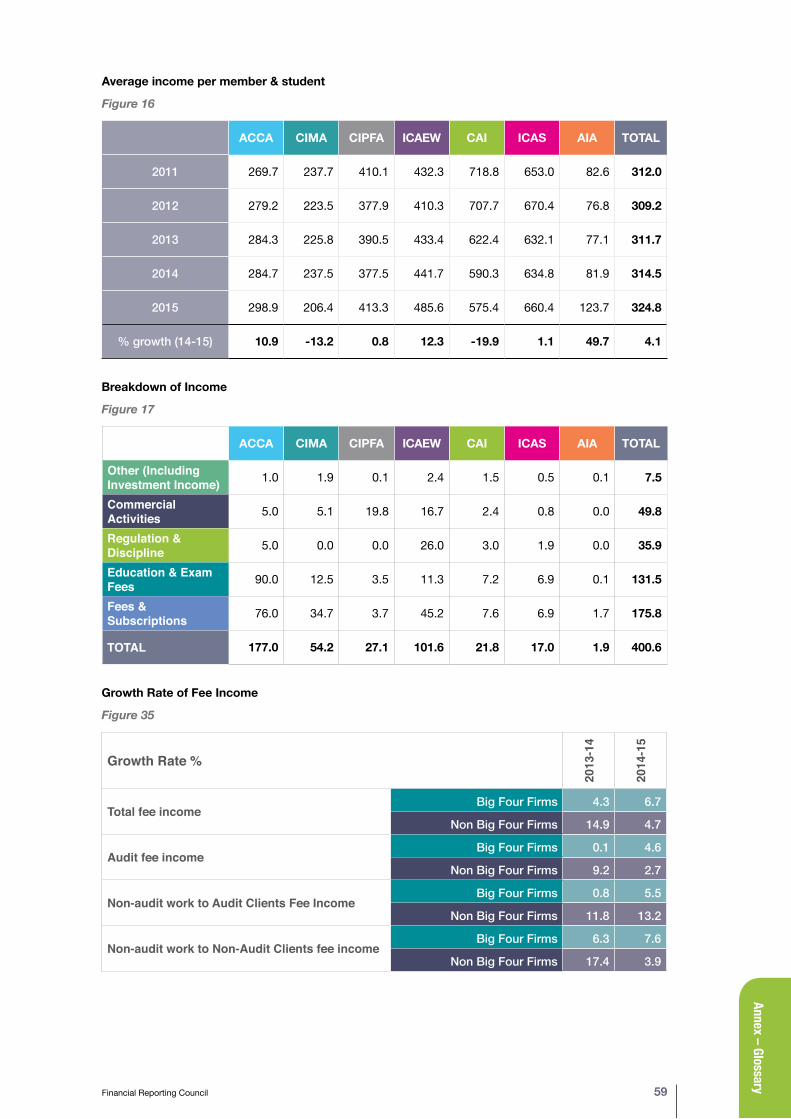
Annex – Glossary
Financial Reporting Council 59
Average income per member & student
Figure 16
ACCA CIMA CIPFA ICAEW CAI ICAS AIA TOTAL
2011 269.7 237.7 410.1 432.3 718.8 653.0 82.6 312.0
2012 279.2 223.5 377.9 410.3 707.7 670.4 76.8 309.2
2013 284.3 225.8 390.5 433.4 622.4 632.1 77.1 311.7
2014 284.7 237.5 377.5 441.7 590.3 634.8 81.9 314.5
2015 298.9 206.4 413.3 485.6 575.4 660.4 123.7 324.8
% growth (14-15) 10.9 -13.2 0.8 12.3 -19.9 1.1 49.7 4.1
Breakdown of Income
Figure 17
ACCA CIMA CIPFA ICAEW CAI ICAS AIA TOTAL
Other (Including Investment Income) 1.0 1.9 0.1 2.4 1.5 0.5 0.1 7.5
Commercial Activities 5.0 5.1 19.8 16.7 2.4 0.8 0.0 49.8
Regulation & Discipline 5.0 0.0 0.0 26.0 3.0 1.9 0.0 35.9
Education & Exam Fees 90.0 12.5 3.5 11.3 7.2 6.9 0.1 131.5
Fees & Subscriptions 76.0 34.7 3.7 45.2 7.6 6.9 1.7 175.8
TOTAL 177.0 54.2 27.1 101.6 21.8 17.0 1.9 400.6
Growth Rate of Fee Income
Figure 35
Growth Rate %
2013
-14
2014
-15
Total fee incomeBig Four Firms 4.3 6.7
Non Big Four Firms 14.9 4.7
Audit fee incomeBig Four Firms 0.1 4.6
Non Big Four Firms 9.2 2.7
Non-audit work to Audit Clients Fee Income Big Four Firms 0.8 5.5
Non Big Four Firms 11.8 13.2
Non-audit work to Non-Audit Clients fee income Big Four Firms 6.3 7.6
Non Big Four Firms 17.4 3.9
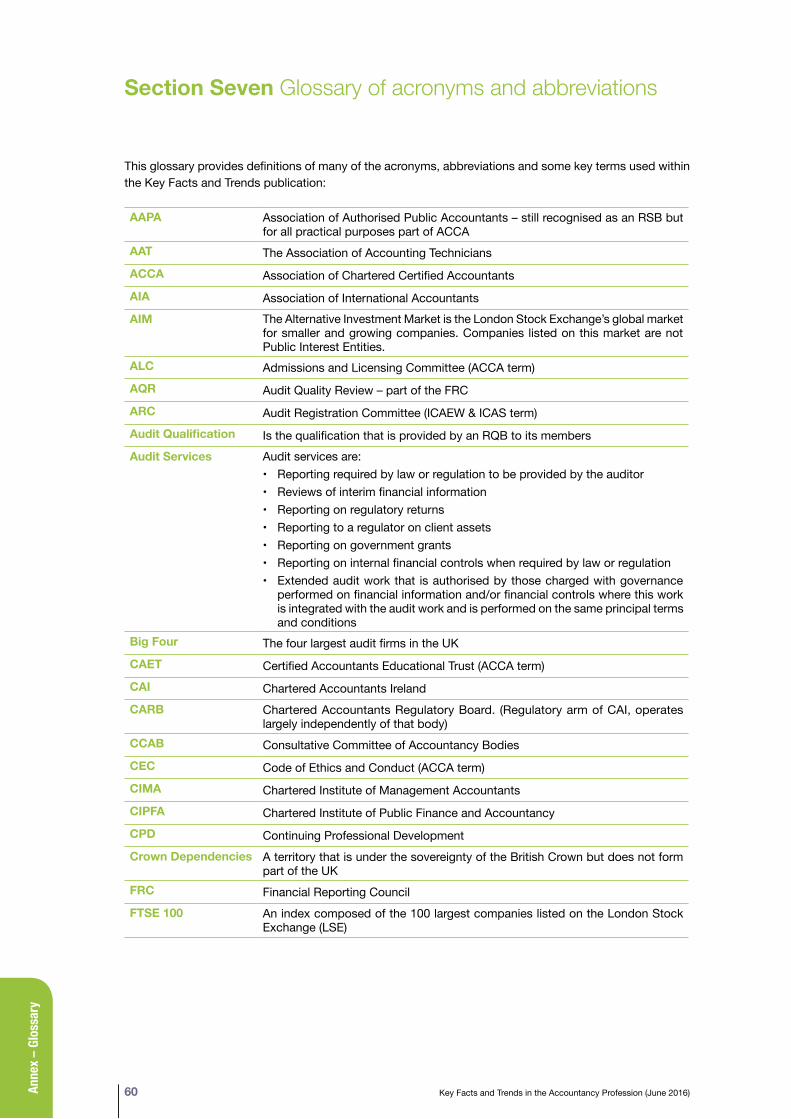
Anne
x – G
loss
ary
60 Key Facts and Trends in the Accountancy Profession (June 2016)
Section Seven Glossary of acronyms and abbreviations
This glossary provides definitions of many of the acronyms, abbreviations and some key terms used within the Key Facts and Trends publication:
AAPA Association of Authorised Public Accountants – still recognised as an RSB but for all practical purposes part of ACCA
AAT The Association of Accounting TechniciansACCA Association of Chartered Certified AccountantsAIA Association of International AccountantsAIM The Alternative Investment Market is the London Stock Exchange’s global market
for smaller and growing companies. Companies listed on this market are not Public Interest Entities.
ALC Admissions and Licensing Committee (ACCA term)AQR Audit Quality Review – part of the FRCARC Audit Registration Committee (ICAEW & ICAS term)Audit Qualification Is the qualification that is provided by an RQB to its membersAudit Services Audit services are:
• Reporting required by law or regulation to be provided by the auditor• Reviews of interim financial information• Reporting on regulatory returns• Reporting to a regulator on client assets• Reporting on government grants• Reporting on internal financial controls when required by law or regulation• Extended audit work that is authorised by those charged with governance
performed on financial information and/or financial controls where this work is integrated with the audit work and is performed on the same principal terms and conditions
Big Four The four largest audit firms in the UKCAET Certified Accountants Educational Trust (ACCA term)CAI Chartered Accountants IrelandCARB Chartered Accountants Regulatory Board. (Regulatory arm of CAI, operates
largely independently of that body)CCAB Consultative Committee of Accountancy BodiesCEC Code of Ethics and Conduct (ACCA term)CIMA Chartered Institute of Management AccountantsCIPFA Chartered Institute of Public Finance and AccountancyCPD Continuing Professional DevelopmentCrown Dependencies A territory that is under the sovereignty of the British Crown but does not form
part of the UKFRC Financial Reporting CouncilFTSE 100 An index composed of the 100 largest companies listed on the London Stock
Exchange (LSE)
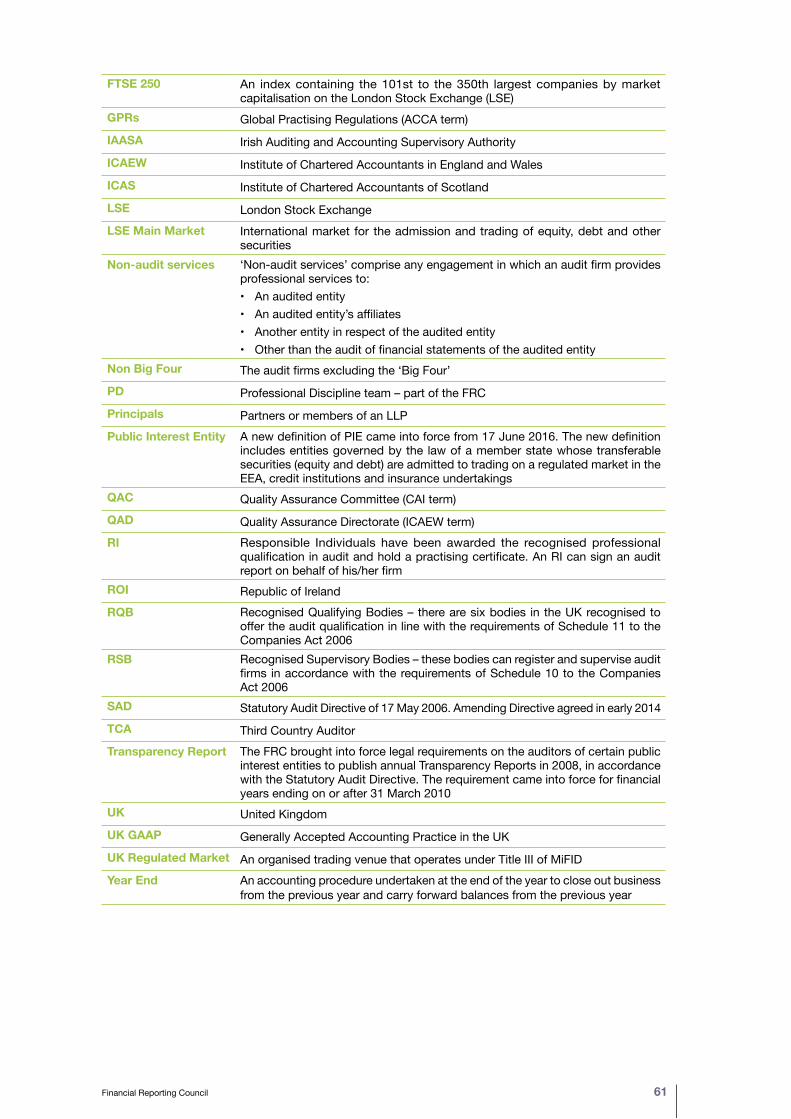
FTSE 250 An index containing the 101st to the 350th largest companies by market capitalisation on the London Stock Exchange (LSE)
GPRs Global Practising Regulations (ACCA term)IAASA Irish Auditing and Accounting Supervisory AuthorityICAEW Institute of Chartered Accountants in England and WalesICAS Institute of Chartered Accountants of ScotlandLSE London Stock ExchangeLSE Main Market International market for the admission and trading of equity, debt and other
securities Non-audit services ‘Non-audit services’ comprise any engagement in which an audit firm provides
professional services to:• An audited entity• An audited entity’s affiliates• Another entity in respect of the audited entity• Other than the audit of financial statements of the audited entity
Non Big Four The audit firms excluding the ‘Big Four’PD Professional Discipline team – part of the FRCPrincipals Partners or members of an LLPPublic Interest Entity A new definition of PIE came into force from 17 June 2016. The new definition
includes entities governed by the law of a member state whose transferable securities (equity and debt) are admitted to trading on a regulated market in the EEA, credit institutions and insurance undertakings
QAC Quality Assurance Committee (CAI term)QAD Quality Assurance Directorate (ICAEW term)RI Responsible Individuals have been awarded the recognised professional
qualification in audit and hold a practising certificate. An RI can sign an audit report on behalf of his/her firm
ROI Republic of IrelandRQB Recognised Qualifying Bodies – there are six bodies in the UK recognised to
offer the audit qualification in line with the requirements of Schedule 11 to the Companies Act 2006
RSB Recognised Supervisory Bodies – these bodies can register and supervise audit firms in accordance with the requirements of Schedule 10 to the Companies Act 2006
SAD Statutory Audit Directive of 17 May 2006. Amending Directive agreed in early 2014TCA Third Country AuditorTransparency Report The FRC brought into force legal requirements on the auditors of certain public
interest entities to publish annual Transparency Reports in 2008, in accordance with the Statutory Audit Directive. The requirement came into force for financial years ending on or after 31 March 2010
UK United KingdomUK GAAP Generally Accepted Accounting Practice in the UKUK Regulated Market An organised trading venue that operates under Title III of MiFIDYear End An accounting procedure undertaken at the end of the year to close out business
from the previous year and carry forward balances from the previous year
Financial Reporting Council 61


Financial Reporting Council
Financial Reporting Council8th Floor125 London WallLondon EC2Y 5AS
+44 (0)20 7492 2300
www.frc.org.uk