trends in migration: australia 2010–11 · pdf filechapter 2: the migration program ... 8...
TRANSCRIPT

Trends in Migration: Australia 2010–11 Annual submission to the OECD’s Continuous Reporting System on Migration (SOPEMI)

2 | people our business
Contents
List of Tables ................................................................................................................................ 3
List of Figures ............................................................................................................................... 5
Foreword ....................................................................................................................................... 6
Introduction to SOPEMI 2011 ....................................................................................................... 7
Chapter 1: Developments in Migration Policy ............................................................................. 15
Chapter 2: The Migration Program .............................................................................................. 21
Chapter 3: Temporary Entry ....................................................................................................... 35
Chapter 4: The Humanitarian Program ....................................................................................... 49
Chapter 5: Irregular Migration and Visa Compliance.................................................................. 55
Chapter 6: Australia’s Population ................................................................................................ 63
Chapter 7: Emigration and Return Migration ............................................................................... 71
Chapter 8: Naturalisation ............................................................................................................ 79
Chapter 9: Diversity and Integration............................................................................................ 85
Chapter 10: Special Focus (A) .................................................................................................... 93
Chapter 11: Special Focus (B) .................................................................................................. 107
Appendix A ............................................................................................................................... 112
Appendix B ............................................................................................................................... 129
Glossary .................................................................................................................................... 133

people our business | 3
List of Tables Table 2.1 Migration Program visa grants 2009–10 and 2010–11 ............................................... 25
Table 2.2 Migration Program visa grants 2010–11: offshore and onshore ................................. 26
Table 2.3 Migration Program visa grants 2010–11: applicant type ............................................. 27
Table 2.4 Migration Program visa grants 2010–11: age groups ................................................. 27
Table 2.5 Migration Program visa grants 2010–11: top 10 source countries .............................. 28
Table 2.6 General Skilled Migration visa grants 2010–11: top 10 source countries .................... 30
Table 2.7 Employer Sponsored visa grants 2010–11: top 10 source countries .......................... 30
Table 2.8 Business Skills visa grants 2010–11: top 10 source countries .................................... 31
Table 2.9 Family Stream visa grants 2010–11: top 10 source countries .................................... 32
Table 2.10 Migration Program planning levels 2011–12 ............................................................. 33
Table 3.1 Business Long Stay visa grants 2001–02 to 2010–11 ................................................ 37
Table 3.2 Business Long Stay visa grants 2010–11: top 10 source countries ............................ 37
Table 3.3 Permanent visas granted to Business Long Stay visa holders 2009–10 & 2010–11 .. 38
Table 3.4 Student visa grants 2008–09 to 2010–11: top 10 source countries ............................ 39
Table 3.5 Student visa grants 2008–09 to 2010–11: educational sector .................................... 39
Table 3.6 Migration Program visa grants to Student visa holders 2006–07 to 2010–11 ............. 40
Table 3.7 Skilled Graduate visa grants 2010–11: top three source countries ............................. 41
Table 3.8 Skilled Graduate visa grants 2010–11: qualifications completed in Australia ............. 41
Table 3.9 Migration Program visa grants to Skilled Graduate visa holders 2010–11 .................. 42
Table 3.10 Working Holiday visa grants 2010–11: participating countries .................................. 43
Table 3.11 Work and Holiday visa grants 2010–11: participating countries ............................... 44
Table 3.12 Tourism and short-term business visitor visa grants 2009–10 to 2010–11 ............... 44
Table 3.13 Tourism visa grants 2010–11: top 10 source countries............................................. 45
Table 3.14 Short-term business visitor visa grants 2010–11: top 10 source countries ............... 45
Table 3.15 Specialist entry visitor visa grants 2010–11 .............................................................. 46
Table 3.16 Other visitor visa grants 2010–11 ............................................................................. 47
Table 3.17 Short-term intracorporate transfers 2010–11 ............................................................ 48
Table 4.1 Humanitarian Program visa grants 2010–11 ............................................................... 52
Table 4.2 Humanitarian Program visa grants 2010–11: top five source countries ...................... 53
Table 4.4 Onshore Protection visa grants 2009–10 and 2010–11 .............................................. 53
Table 5.1 Estimated overstayer population at 30 June 2011: general visa categories ............... 57
Table 5.2 Estimated overstayer population at 30 June 2011: top 10 source countries ............... 58
Table 5.3 Visa cancellations 2009–10 and 2010–11: top 10 source countries ........................... 59
Table 5.4 Compliance-related departures from Australia 2010–11: top 10 source countries ...... 60
Table 5.5 Irregular maritime arrivals and unauthorised air arrivals 2002–03 to 2010–11 ............ 61
Table 6.1 Overseas-born residents at 30 June 1996 to 30 June 2010 ....................................... 67
Table 6.2 Overseas-born residents at 30 June 2010: age groups .............................................. 68

4 | people our business
Table 6.3 Overseas-born residents 30 June 2010: top five countries of birth ............................. 69
Table 6.4 Overseas-born residents at 30 June 2010: gender ratio ............................................. 69
Table 7.1 Emigrants 2009–10 and 2010–11: main source countries ......................................... 73
Table 7.2 Emigrants 2010–11: main destinations ....................................................................... 74
Table 7.3 Emigrant repatriation rates 2010–11: selected birthplaces ......................................... 74
Table 7.4 Characteristics of Emigrants 2010–11 ........................................................................ 76
Table 8.1 Citizenship conferrals 2010–11: top 15 countries of original citizenship ..................... 82
Table 9.1 Interpreting services provided 2010–11: top 10 languages ........................................ 90
Table 10.4 Employment outcomes of recently arrived migrants 2010 ........................................ 98
Table 11.1 Migrants' net impact on the Australian Government Budget by visa category 2010–11 (A$ million) ................................................................................................. 110

people our business | 5
List of Figures Figure 2.1 Australia’s Migration Program 2009–10 and 2010–11 at a glance ............................ 23
Figure 2.2 Australia’s Migration Program 2000–01 to 2010–11: streams ................................... 24
Figure 2.3 Components of the Skill Stream ................................................................................ 29
Figure 3.1 Overview of selected temporary entry visas granted 2010–11 .................................. 36
Figure 3.2 Student visa grants 1993–94 to 2010–11 .................................................................. 38
Figure 4.1 Humanitarian Program 1989–90 to 2010–11: onshore and offshore ......................... 50
Figure 5.1 Australia’s immigration compliance model at a glance ............................................... 56
Figure 6.1 Components of Australia’s population growth 1982 to 2010 ...................................... 65
Figure 6.2 Changing composition of net overseas migration 2004–05 to 2014–15 .................... 66
Figure 6.3 Components of net overseas migration: 2004–05 to 2014–15 .................................. 66
Figure 7.1 Emigration and Immigration 1996–97 to 2010–11 ..................................................... 77
Figure 7.2 Long-term residents returning to Australia: 2004–05 to 2010–11 .............................. 77
Figure 8.1 Conferrals of Australian citizenship 2001–02 to 2010–11.......................................... 81
Figure 8.2 Conferrals of Australian citizenship 2001–02 to 2010–11: OECD share ................... 82
Figure 10.1 Migrant unemployment rates by year of arrival 1991 to 2010 .................................. 99
Figure 10.2 Education Attainment and Employment Outcomes 2009: migrants and non-migrants aged 15-64 .......................................................................................................... 100
Figure 10.3 Proportion of tertiary educated working in a management or professional field 2009: migrants and non-migrants aged 15-64 .................................................................. 100
Figure 10.4 Employment rates since arrival for different MESC and NESC migrant cohorts .... 101
Figure 10.5 Unemployment Rate: country of birth, 2000–2010 ................................................ 102
Figure 10.6 Employment and share of civilian population: MESC and NESC migrants 2000–2011 ................................................................................................................. 103
Figure 10.7 Education and employment outcomes: children of Australians and children of migrants aged 15–34 .............................................................................................. 105

6 | people our business
Foreword
The Continuous Reporting System on Migration (known by its French acronym SOPEMI) was established in 1973
to enable the sharing of statistics on international migration and developments in migration policies among
Organisation for Economic Co-operation and Development (OECD) member countries.
The principal function of SOPEMI is to provide information to the OECD’s Working Party on Migration, whose
mandate is to collect information on migration trends and policies in the OECD member countries in order to
identify emerging problems in international cooperation.
SOPEMI comprises a network of migration experts (correspondents) from each member country, who prepare
annual reports on their countries’ migration policies and statistical trends. This report and reports from other
OECD countries serve the basis for the OECD’s annual flagship publication—the International Migration Outlook.
Mark Cully, Chief Economist at the Department of Immigration and Citizenship, is Australia’s SOPEMI
correspondent. He is also the current chair of the OECD’s Working Party on Migration.
Source: OECD (2011) International Migration Outlook 2011: SOPEMI, pp. 6–7, OECD Publishing,
http://dx.doi.org/10.1787/migr_outlook-2011-en

people our business | 7
Chapter 1: Developments in Migration Policy
Hi hli ht i 2010 11 1
Introduction to SOPEMI 2011 Overview and context

8 | people our business
Just over a week into the 2011 New Year, parts of Queensland and New South Wales experienced their worst
flooding for a generation. A few weeks later Cyclone Yasi blew through northern Queensland wreaking havoc
in its trail, and flooding large parts of interior Australia. The scale of the disasters, resulting in the loss of
many lives and livelihoods, was calamitous enough to hobble the overall level of economic activity in the first
quarter of the year. In the rebound from these twin disasters business and consumer confidence in Australia
faltered as uncertainty and turbulence in global financial and equity markets magnified throughout the year.
At the same time, rising global demand for mineral commodities – especially from China – and rising prices
for agricultural commodities pushed the Australian terms of trade to record high levels, delivering an income
windfall for the nation. Capital investment, spurred on by resources projects now made viable, rose strongly,
with huge sums projected in the investment pipeline. The Australian dollar broke through parity with the
United States dollar for the first time since it was floated in 1983, a boon for Australians travelling overseas
and those purchasing goods from abroad, and a challenge to companies and service providers in trade-
exposed industries whose price competitiveness was eroded.
Little wonder that the catchcry throughout the year has been the “two-speed economy”. The booming minerals
sector is a major contributor to exports and to gross domestic product, but it is a small employer, accounting
for around 2 per cent of total employment. The sluggish manufacturing, retail and hospitality sectors, on the
other hand, employ large numbers of people. The result has been a patchy labour market during 2011.
Australia experienced a mild downturn during the global financial crisis of 2008 and 2009, and made a quick
recovery during 2010. Employers hoarded labour during the downturn by reducing hours of work rather than
workers, then quickly took on additional workers during the recovery. In 2011, employers appear to be
correcting for their haste in 2010 by taking on fewer additional workers. Trend employment growth for the past
three years (ending October) has been 0.6 per cent, 3.4 per cent, and 0.8 per cent, respectively.
The level of employment growth has not kept pace with population growth and, as a consequence, the
unemployment rate has edged up slightly, from a post-downturn low of 4.9 per cent in March 2011 to 5.3 per
cent in October 2011. The participation rate has also fallen from a record high of 65.9 per cent in December
2010 to 65.6 per cent in October 2011.
The most recent national accounts point to some of the dilemmas. GDP grew in the June 2011 quarter by a
robust 1.2 per cent, but only 1.4 per cent for the year after factoring in the 0.9 per cent decline in the March
2011 quarter attributable to the natural disasters. Mining output fell in both the March and June quarters after
many mines were slow to re-start flood-damaged operations. As a result of this, as well as the high value of
the Australian dollar, exports fell while imports rose strongly. On the other hand, gross domestic income grew
by 2.6 per cent in the quarter and 4.4 per cent through the year due to the higher terms of trade.
These aggregate figures naturally mask a great deal of variation. This, as already discussed, is playing out
unevenly across different sectors of the economy, which are themselves concentrated in different parts of
Australia. Areas with a high concentration of mining and resources activity, such as Western Australia, have
been growing strongly, while growth has been more muted in other parts of the country. There is a heightened

people our business | 9
sense that the economy is going through a significant structural adjustment, adapting to potentially sustained
high levels of the terms of trade and the Australian dollar.
Much of the mining and resources activity occurs in remote regional centres. As labour is a less mobile factor
of production than capital, this has resulted in skill shortages in some regions alongside relatively high
unemployment in other regions. Employers facing shortages have increased their use of fly-in, fly-out workers
from capital city bases, and of migrant workers. Incoming migrants are more readily amenable to moving to
hot spots of economic activity. As an example, Western Australia attracted a net inflow of 27 400 migrants
during the year ending March 2011, compared with a net inflow of just 5000 people moving from other parts
of Australia.
In its 2011–12 Budget, the government introduced three new migration initiatives to aid the process of
structural adjustment. As recommended in the 2010 report by the National Resources Sector Employment
Taskforce, the government will assist the development of major new resource projects by allowing the
developers to source from abroad the necessary labour supply to get projects underway. The object is to
prevent labour supply bottlenecks from occurring due to the high volume of engineering and construction
activity associated with so many projects commencing simultaneously. Developers will enter into Enterprise
Migration Agreements with the government, which will specify for each project the type, number and visa
duration of the temporary migrant workers, modelled on the approach presently used in Labour Agreements.
These will be complemented by Regional Migration Agreements, an initiative which recognises that in some
parts of Australia there is an overall shortfall of workers, not just skilled workers. Partners to these
agreements will be employers, unions, and local and state governments as well as the federal government.
Where a region has a demonstrable labour supply constraint on growth, the agreements will permit
concessional arrangements to create incentives to attract skilled and semi-skilled migrant workers to base
themselves in those regions. The government is also facilitating a quick flow of incoming skilled migrant
workers under the Migration Program by giving first priority in visa processing to applicants under the
Regional Sponsored Migration Scheme.
Besides these initiatives the government has continued with its overall reforms to skilled migration. The new
points test for General Skilled Migration took effect at the start of July 2011. It does away with occupational
points, though retains the requirement for applicants to nominate an occupation listed on the Skilled
Occupations List and to obtain a pre-application skills assessment. The new test explicitly recognises and
awards points to holders of overseas qualifications, but still gives greater weight to those who have gained
qualifications – and work experience – in Australia. Greater weight is also given to those with advanced
English proficiency.
The government also announced that from July 2012 it will introduce a new two-step regime for skilled
migration, to be known as SkillSelect. In the first instance, would-be skilled migrants will submit an electronic
expression of interest for a skilled migration visa. In the second step, a sub-set will be invited to apply. For
independent skilled migrants, the expression of interest step will provide sufficient information from which to
derive a points test score and rank applicants within a nominated occupation, with the highest ranked in each
selection round issued an invitation to apply. For state-sponsored migrants, state and territory governments

10 | people our business
can select anyone from the expression of interest pool, so long as they meet the points test pass mark and
other criteria as specified in their State Migration Plans. For those wishing to enter through the Business Skills
program, they will also be required to make an expression of interest and can then be nominated by a state or
territory government and issued with an invitation to apply. Employers too will have access to the expression
of interest database, from which they can then select migrants who have indicated an interest in being
sponsored by an employer on a permanent or temporary basis, though they are not limited to using this
means to identify suitable migrant workers.
The new points test and Skill Select are designed to provide government with 21st century tools to choose
skilled migrants who have the most to offer Australia as well as promote effective administration of the
Migration Program. It will also allow for a greater degree of control over the level of net overseas migration.
Under existing regulations, a person who lodges a valid application for a General Skilled Migration visa is
legally entitled to a decision. Subject to health and character checks, that decision would be to grant a visa if
the applicant meets the points test pass mark. In circumstances where there are more applications than
places available this results in a pipeline of queued applicants, and puts upward pressure on net overseas
migration levels where those in the queue are already resident in Australia, i.e. as temporary migrants. Under
Skill Select, the regulations are to be amended to limit the legal entitlement to the second stage. Invitations to
apply will be issued in line with the number of visa places available.
After having peaked at 315 700 persons for the year ending December 2008, the annual level of net overseas
migration has since fallen for nine successive quarters. The preliminary estimate for the year ending March
2011 is 167 100 persons. The official forecast of the Department of Immigration and Citizenship is that it will
remain at about the same level for the year ending September 2011, at 177 400 persons. If accurate, this
would mean that for the first time since 2005–06 the level of net overseas migration is lower than the number
of permanent residence places made available in the same period under the Migration and Humanitarian
Programs.
The number of permanent residence places totalled 182 500 in 2010–11, slightly higher than the 2009–10
amount, and the second highest level on record after 2008–09. This record looks set to be broken in 2011–12,
with the government having announced a planning level of 199 750 places, comprising 125 850 skilled
migration places, 58 600 family places and 13 750 humanitarian places. In relative terms this constitutes a
0.8 per cent permanent addition to the 2011 population, which puts it on a par with the migration programs
operating in the early 1970s, but well below those of the post-World War II mass immigration programs which
ranged from 1.0 up to 1.4 per cent of the population throughout the 1950s and 1960s.
How is it that net overseas migration fell below the number of permanent visas granted? The explanation lies
primarily with changes in temporary migration, with a large fall from the previous year in newly arriving
temporary migrants as well as an increase in temporary migrants departing. The most marked changes were
among international students. Overall, there was a 7.4 per cent decline in student visa grants, but that
reflected an 11.1 per cent increase in student visas granted to temporary migrants already resident in
Australia (and thereby had no population impact), and a 20.5 per cent decrease in visa grants to students
coming from abroad. This latter group are likely to have been more sensitive to apparent course fee

people our business | 11
increases, a result of the rise in the value of the Australian dollar, up 15.6 per cent in trade-weighted terms
over the year ended June 2011.
Partly prompted by the decline in demand, the government commissioned the Hon. Michael Knight AO, a
former state government minister, to undertake a strategic review of the student visa program. The aim of the
review was to examine how to improve the competitiveness of Australia’s student visa program relative to
other countries and also to strengthen integrity. The government released the Knight report in September
2011 and announced that it intended to put into effect all of its recommendations. Key among those are:
streamlined visa processing for those enrolling in universities, including a lower level of up-front funds; a
requirement that applicants satisfy authorities that they are both a genuine student and a temporary entrant to
Australia; and post-study work rights for certain students, tied to the duration of their course. The first tranche
of changes took effect in November 2011.
After having fallen sharply in the wake of the global financial crisis, the number of applicants for temporary
skilled migration bounced back strongly, rising by 39.8 per cent over the year-ending June 2011. In recent
months application numbers have continued to rise, reaching levels on a par with those before the crisis. As a
fully demand-driven visa, this heightened activity might appear to be at odds with sluggish growth in overall
employment. However, again highlighting the two-speed economy theme running through this overview, the
increase has been very uneven across industries with substantial increases in mining, construction and
utilities.
The other main category of temporary migrants is working holiday makers. After having faltered slightly in
2009–10, again due to the global financial crisis, the number of visas granted rose by 5.3 per cent to 192 900
to recover to 2008–09 levels. Many of these working holiday makers are employed in the hospitality and
seasonal horticultural industries.
Another source of seasonal labour in regional Australia is workers hired through the Pacific Seasonal Worker
Pilot Scheme for use in the horticulture industry. The pilot, now in its third year of operation, saw a number of
significant program design changes during the year to broaden its appeal to horticultural employers, after just
67 workers came to Australia under the scheme in 2009–10. The main changes are: to allow workers to come
for a minimum period of four months (down from six months previously); for workers to share in the costs of
travel to and from Australia; to expand the number of regions and employers able to participate in the
scheme; and to expand the number of participating countries, with Nauru, Samoa, the Solomon Islands and
Tuvalu joining the scheme, and a separate small scale trial involving East Timorese workers in the hospitality
industry in Western Australia. During 2010–11, 423 visas were granted to Pacific workers under the scheme,
with strong growth projected in 2011–12. The government also announced in the 2011–12 Budget that it
intends to put in place more favourable income tax arrangements for Pacific workers, with a flat rate of 15
cents in the dollar.
The horticulture industry is among those known to have a disproportionately high incidence of illegal working,
alongside construction and hospitality, and this may partly account for the relatively low take-up to date in the
Pacific Seasonal Worker Pilot Scheme. In 2010 the government commissioned Stephen Howells, a legal
expert, to undertake an independent review of sanctions for employers hiring illegal workers. The government

12 | people our business
released the Howells report for public consultation in July 2011, in doing so stating that it accepted, in-
principle, all of the recommendations.
By its very nature, it is difficult to establish an estimate of the scale of illegal working. Howells arrives at a
figure of between 50 000 and 100 000 non-citizens likely to be working in contravention of their visa
conditions, a figure which includes students working in excess of their allotted limit, 20 hours per week during
term time for most students. To put this into context, at the upper limit this would represent less than 1 per
cent of total employment. The major change proposed by the report is to introduce civil penalties (or fines) for
employers found to be employing illegal workers and who could not provide evidence that they had taken
reasonable steps to satisfy themselves of the workers’ bona fides.
Asylum seekers arriving by boat in Australian waters dominated political and public debate on immigration
matters during the year. The debate centred around steps that might be taken to discourage asylum seekers
from embarking on a hazardous journey—as illustrated in December 2010 when a boat carrying asylum
seekers crashed into rocks near Christmas Island, resulting in many deaths by drowning—and how to process
asylum seekers claims.
In March 2011, regional ministers at the Bali Process on People Smuggling, Trafficking in Persons and
Related Transnational Crime ministerial conference agreed to establishment a Regional Cooperation
Framework. The framework lays the foundation for the implementation of practical arrangements to address
irregular movement through the region, including through parties entering into bilateral and multilateral
arrangements. In May 2011, the governments of Australia and Malaysia announced that they were
progressing a bilateral transfer and resettlement arrangement under the framework. The formal Arrangement
was entered into in July 2011. Under the Arrangement, up to 800 asylum seekers entering Australian waters
as irregular maritime arrivals were to be transferred to Malaysia for refugee status determination. In return,
Australia agreed to resettle an additional 1 000 refugees already residing in Malaysia each year over a four
year period. The United Nations High Commissioner for Refugees and the International Organization for
Migration were closely consulted in negotiation of the Arrangement and both supported its implementation. A
legal challenge to the Arrangement was heard by the High Court of Australia in August 2011. The High
Court’s judgement was handed down on 31 August 2011 and effectively prevented the transfer of individuals
to Malaysia under the Arrangement. Following on from a government announcement on 13 October 2011,
asylum claims of individuals arriving in Australia by irregular maritime means will be processed in Australia.
The government will also make greater use of existing powers to facilitate more asylum seekers residing in
the community while their asylum claims are assessed, rather than being held in immigration detention
facilities. The government has indicated the 1 000 additional refugees each year from Malaysia will be
accepted within Australia’s Humanitarian Program, set at 13 750 in 2011–12.
With the intense focus on asylum seekers there was less public debate than during 2010 on population growth
and its relationship with immigration, perhaps a reflection of declining levels of net overseas migration. The
government released its sustainable population strategy in May 2011, following a period of public consultation
and the release of a series of discussion papers produced by advisory panels. The role of migration in helping
to support growing areas of regional Australia was emphasised in the strategy. The strategy eschewed the
adoption of a population target and, implicit in that, a migration target. The public release of net overseas
people our business | 13
migration forecasts by the Department of Immigration and Citizenship can be seen as complementing the
strategy by aiding those involved in infrastructure and service planning and delivery.
The decline in the level of net overseas migration was reflected in community views on immigration in the
annual Mapping Social Cohesion study. In 2010 there had been a sharp increase in the proportion of
respondents claiming Australia’s immigration intake was too high, up 10 percentage points to 47 per cent. In
2011 the proportion regarding the intake as too high fell back towards 2009 levels, at 39 per cent, with a clear
majority, 55 per cent, who thought immigration levels were about right or too low. On broader measures of
social cohesion, the survey found a majority of people endorsed the underlying non-discriminatory character
of the migration program, with 64 per cent agreeing with the proposition that accepting migrants from many
countries makes Australia stronger.
In 2010–11, Australia accepted migrants from 185 different countries. Over time the composition of the major
source countries has altered. The 2010–11 year was notable as, for the first time, the greatest number of
permanent additions, aside from those from New Zealand, came from China, followed by the United
Kingdom, India and the Philippines.
The Minister for Immigration and Citizenship, the Hon. Chris Bowen MP, recognised the ethnic and cultural
diversity of the Australia population and its ability to absorb and bind new migrants, a phenomenon he dubbed
“the genius of Australian multiculturalism”, in a major speech given in February 2011. He identified three
attributes that provide the bedrock: respect for traditional Australian values; the acquisition of Australian
citizenship and its associated pledge; and bipartisan political support. In the same speech, the Minister
launched a new multicultural policy for Australia and the creation of an Australian Multicultural Council to
champion multiculturalism and provide advice to the government on multicultural affairs. Members of the
foundation were appointed in September 2011, alongside a call for community-based ambassadors to
promote social inclusion. The government also announced a national anti-racism partnership, the partners
tasked with developing an anti-racism strategy to be put into effect in 2012.
Late in 2011, Australia was welcomed into the family of countries whose migration laws and policies are
assessed and ranked in the Migration Integration Policy Index, or MIPEX as it is commonly known. This
exercise began in the European Union in 2004, and is periodically updated. Australia was ranked fifth out of
33 developed countries, behind Sweden, Portugal, Canada and Finland. It ranked relatively high in the areas
of access to nationality and education, and relatively low in the areas of labour market mobility and political
participation.
The scoring in MIPEX is predicated on the belief that an integrated society is one where migrants, both
temporary and permanent, are accorded the same legal rights and entitlements as in-country nationals. This
may or may not correlate with how well migrants do integrate, such as the welcome they receive or how
quickly they settle. On these kinds of measures we know that Australia rates very highly by international
standards, though there can be unevenness across different groups, with humanitarian entrants encountering
the most difficulties in the initial years of settlement.

14 | people our business
A report on the economic, civic and social contribution of humanitarian entrants by Professor Graeme Hugo
was published by the department in June 2011. It finds that humanitarian entrants contribute to Australia in a
variety of ways which are not always heralded – such as creation of new businesses – and, importantly, that
the second generation are able to overcome the disadvantages faced by their parents, with strong evidence
of convergence towards the educational attainment and employment participation of persons born in
Australia.
There are still considerable gaps in our knowledge, especially around identifying what kind of services and
support is most effective in enabling successful settlement. To address this, a new longitudinal survey of
refugees and other migrants, known as Building a New Life in Australia, is under development. It is expected
to track the journeys of a group of refugees and other migrants over a five year period from arrival in
Australia through to eligibility for citizenship, commencing in 2012.
Mark Cully
SOPEMI Correspondent for Australia
Chief Economist, Department of Immigration and Citizenship
Australian Government
people our business | 15
Chapter 1: Developments in Migration Policy Highlights in 2010–11
16 | people our business
1.1 Changes to skilled migration
In the 2011 budget speech, the Australian Government announced that it would allocate 16 000 skilled migration
places to regional areas of Australia. This initiative will be complemented by Regional Migration Agreements for
communities with skill shortages, and the introduction of Enterprise Migration Agreements to enable large
resource projects to gain readier access to temporary overseas labour to meet skilled vacancies that cannot be
met locally.
In addition to this, Perth (the capital of Western Australia and a city of 1.7 million people) will, for the purposes of
skilled migration, be considered a regional city. This action was taken because of widespread skill shortages in
Western Australia. This provides employers in Western Australia an easier avenue to recruit skilled workers from
overseas and gives skilled temporary visa holders in Perth a more streamlined pathway to permanent migration.
A new points test for General Skilled Migration applicants came into effect on 1 July 2011. The points test is a
mechanism used to select skilled migrants expected to offer the greatest economic benefit to Australia. Points are
awarded to applicants who have certain skills, attributes and qualifications. Compared with the previous test, the new
points test does not give undue weight to any one factor and recognises a broader range of skills and attributes,
focussing on:
better English levels
more extensive skilled employment
higher level qualifications obtained in Australia and overseas
better targeted age ranges.
The new points test will continue to award points for study in Australia, including regional study, community
languages, partner skills and completing an approved Professional Year. Points will no longer be awarded for
specific occupations, although all applicants must still nominate an occupation on the Skilled Occupation List
(SOL) and have their skills assessed in their nominated occupation. The pass mark to be eligible for a General
Skilled Migration visa is set at 65 points. More information on the new points test can be found at
www.immi.gov.au/skilled/general-skilled-migration/pdf/points-test.pdf.
In 2011, the Australian Government announced that a new skilled migrant selection register, SkillSelect, will be
introduced from 1 July 2012. It is designed to ensure Australia can select the best and brightest skilled migrants
from a pool of prospective migrants. It will be based on an electronic two-stage process whereby prospective
migrants first submit an expression of interest and may then be invited by the department to make a skilled
migration visa application. More information on SkillSelect can be found at www.immi.gov.au/skilled/general-
skilled-migration/pdf/skillselect-faq.pdf.

people our business | 17
1.2 Student Visa Program review In December 2010, the government appointed the Hon Michael Knight AO to conduct a strategic review of the
student visa program to help enhance the quality, integrity and competitiveness of the student visa program.
On 30 June 2011, Mr Knight reported to the government with 41 recommendations, including:
streamlined visa processing for international students enrolled in Bachelor or certain higher degree
courses at participating universities
access to a post study work visa dependent upon the duration and level of an applicant’s study
a “genuine temporary entrant” requirement for all Student visa applicants which will explicitly address
whether the applicant’s individual circumstances indicate that their principal aim is for a temporary stay
in Australia to study and then return home, and
a fundamental review of the Student visa risk management framework, the assessment levels, to be
concluded by mid 2012.
The Australian Government supports, in principle, all of Mr Knight's recommendations, however some
recommendations will be modified in places to enhance the performance of the Australian education sector and
to better safeguard the integrity of the visa system. The majority of the recommendations are expected to be
implemented between October 2011 and mid 2012, with some other changes expected to commence in early
2013. The full report and the Australian Government’s planned changes to the student visa program can be
found at www.immi.gov.au/students/knight/.
1.3 Visa Simplification and Deregulation project
In June 2010 the Australian Government announced it would simplify Australia’s visa system, which currently
consists of 149 different visas within a complex regulatory environment. The commitment is to reduce by 50 per
cent the number of temporary working visas by 2012 and target a 50 per cent reduction in the total number of
visa subclasses by 2015. A number of discussion papers that have informed stakeholder feedback during the
early development of this project can be found at: www.immi.gov.au/media/publications/discussion-
papers/simpler-visas.htm.
1.4 Refugees and asylum seekers Since 1 November 2010 all Protection visa applicants in Australia have been required to provide biometrics data
in the form of a digital photograph and fingerprints. The collection of this data is intended to reduce the potential
for compromise of the integrity of the refugee status determination process by, for example, identifying instances
of identity fraud.
On 1 March 2011, a new streamlined refugee assessment process for irregular maritime arrivals commenced —
the Protection Obligations Determination. The new process assists faster assessment of protection claims and
addressees issues of procedural fairness identified by the High Court of Australia in November 2010. Under the
new process, a departmental officer will conduct a Protection Obligations Evaluation. If the applicant is found not
18 | people our business
to be owed protection at that stage, the case will be automatically referred to an independent assessor for an
Independent Protection Assessment.
In March 2011, the fourth Bali Process Ministerial Conference on People Smuggling, Trafficking in Persons and
Related Transnational Crime endorsed a Regional Cooperation Framework for tackling people smuggling. The
framework provides several options for combating people smuggling including:
the development of bilateral arrangements to undermine people smuggling and create disincentives for irregular movement, including where appropriate, transfers, returns and readmissions
the targeting of people smuggling enterprises through coordinated border security arrangements
strengthened information and intelligence sharing. An important initiative under the Regional Cooperation Framework was the Transfer and Resettlement
Arrangement between the Governments of Australia and Malaysia. Implementation of the arrangement with
Malaysia was designed to undermine the people smuggling business model and prevent asylum seekers risking
their lives on the dangerous journey to Australia by boat. A decision of the High Court of Australia on
31 August 2011 effectively removed the ability of the Australian Government to pursue the arrangement under
current legislation. Although offshore processing and implementation of the Malaysia Arrangement cannot be
pursued at this time, the Government remains committed to this initiative as an important element in the
management of irregular migration in our region.
In July 2011, legislative changes were enacted to toughen penalties for criminal behaviour in immigration
detention. Under these changes, a person will fail the character test should they be convicted of any offence
committed while in immigration detention, and may be refused a visa. Additionally, the maximum penalty for the
manufacture, possession, use or distribution of weapons by immigration detainees has increased from three to
five years’ imprisonment.
In September 2011, new complementary protection legislation was passed to eliminate unnecessary processes
for people seeking a Protection visa who are at risk of torture, inhumane treatment or likely death if returned to
their home country. Under the new legislation, these people will be provided a transparent, efficient and
accountable migration decision process. This replaces the more complex decision making process that left the
decision to grant a visa at the discretion of the Minister for Immigration and Citizenship.
1.5 Review of sanctions for employers who employ illegal workers In May 2010, the Australian Government appointed independent legal expert Stephen Howells to review the
penalties to Australian employers who recruit illegal workers, prescribed in Australian migration law. The report
recommended legislative changes aimed at more effectively deterring Australian employers and labour suppliers
from engaging or referring foreigners who do not have lawful permission to work or who work in breach of their
visa conditions.
The government has agreed in-principle to the review’s recommendations, which include:
introducing a new three-tiered employer sanctions regime with civil penalties and fines, as well as
maintaining the current criminal penalties

people our business | 19
putting in place legal protections for employers that check their employees’ work entitlements
better education and awareness for employers and labour hire groups on their obligations
greater powers for visa compliance officers to gather documentary evidence against non-compliant
employers.
The full report can be accessed here: www.immi.gov.au/media/publications/compliance/review-employer-
sanctions/
1.6 Pacific Seasonal Worker Pilot Scheme expansion In 2011, the Australian Government invited Nauru, Samoa, Solomon Islands and Tuvalu to join Kiribati, Papua
New Guinea, Tonga and Vanuatu as participants in the Pacific Seasonal Worker Pilot Scheme. The government
also announced that it would implement a small scale trial with tourism industry employers in Western Australia
with workers from East Timor. Discussions to develop memoranda of understanding to give effect to these
arrangements will commence soon.
The Government has implemented a number of changes intended to make the pilot scheme more flexible and
better reflect the needs of the horticulture sector.
Approved employers now have three options to guarantee workers a minimum amount of work: six months work
at 30 hours per week, five months work at 35 hours per week, or 4 months work at 38 hours per week.
Approved employers will continue to pay the full cost of the workers’ international airfares to and from Australia
upfront, and later recoup a percentage of that cost from the worker. Previously, approved employers contributed
50 per cent of the international return trip for each worker. Under a new risk-based approach to cost-sharing,
employers will contribute 35 per cent of each Kiribati worker’s fare, 50 per cent for Tongan workers, 55 per cent
for Papua New Guinean workers, and 80 per cent for workers from Vanuatu.
The Pilot Scheme allows up to 2 500 seasonal workers over three years to work in low-skilled jobs in the
horticultural industry for up to seven months. For more information, see Chapter 3—Temporary Entry.
1.7 New Multicultural Policy
In 2011, the Australian Government launched its new multicultural policy, The People of Australia. This was the
first multicultural policy statement issued since 2003. The four principles that underpin the new policy are:
The government celebrates and values the benefits of cultural diversity, within the broader aims of
national unity, community harmony and maintenance of democratic values.
The government is committed to a just, inclusive and socially cohesive society where everyone can
participate in the opportunities that Australia offers and where government services are responsive to the
needs of Australians from culturally and linguistically diverse backgrounds.
The government welcomes the economic, trade and investment benefits which arise from a successful
multicultural nation.
The government will act to promote understanding and acceptance while responding to expressions of
intolerance and discrimination with strength, and where necessary, with the force of the law.
20 | people our business
For more information on government initiatives under the new multicultural policy, see Chapter 9—Diversity and
Integration.
1.8 Sustainable Population Strategy
In 2011, the government released Australia’s first Sustainable Population Strategy, Sustainable Australia—
Sustainable Communities. The strategy sets out the framework for improving the mix of services, job and skilled
training opportunities and affordable housing, whilst boosting the liveability of Australian cities and regions to
ensure they are places people want to live, work and build a future.
Initiatives under the framework include:
a Suburban Jobs initiative which aims to support local (municipal) and state governments develop
employment precincts, manufacturing hubs and multifunction developments close to residential areas in
growing outer suburbs
a Sustainable Regional Development initiative to support better sustainability planning in regions
experiencing high growth through strategic assessments under national environmental law
a Promoting Regional Living Program to support regional settlements outside Australia’s major cities to
market themselves as an alternative to living in a major capital city
new Regional Migration Agreements aimed at enhancing the effectiveness of the Migration Program by
ensuring it responds to changing economic needs, including building skills needed in regions outside of
the major cities.
The government’s Sustainable Population Strategy can be viewed in full here:
www.environment.gov.au/sustainability/population/publications/strategy.html.
people our business | 21
2 PERMANENT MIGRATION
Chapter 2: The Migration Program Permanent residence

22 | people our business
2.1 Overview The Migration Program is the main pathway to permanent residence in Australia. The only other way for migrants
to obtain permanent residence is to be accepted into Australia on humanitarian grounds.1
Australia’s Migration Program is non-discriminatory. A person can apply to migrate regardless of their ethnic
origin, gender or religion provided that they meet the criteria set out in the Migration Act 1958. Persons can apply
for Migration Program visas after they have arrived in Australia on a temporary visa (onshore) or before they
arrive (offshore).
There are two major streams within the Migration Program:
The Skill Stream—targets migrants who have skills, proven entrepreneurial capability or outstanding
abilities that will contribute to the Australian economy.
The Family Stream—enables the migration of immediate family members such as spouses, children,
parents and certain other members of extended families.
There are also a small number of special eligibility visas issued to people who meet specific criteria or issued
to resolve the status of certain groups of persons who have been allowed to remain in Australia as long-term
temporary residents on humanitarian grounds.
In reporting on the program size it should be noted that:
Both the primary applicant (i.e. the person who applied to migrate) and their migrating dependents
(secondary applicants) are counted in the program. In the case of the Family Stream, where the majority
of applicants are intending to become a partner of an Australian resident, there are relatively few
dependents involved. For the Skill Stream however, many primary applicants are already in a family unit
and will include their spouse and children on their visa application.
Under the 1973 Trans-Tasman Travel Arrangement, New Zealand citizens can enter and leave Australia
freely and live here indefinitely. This means that unless they choose to apply for permanent residence as
a skilled or family migrant, they are not counted as part of Australia’s Migration Program. In 2010–11
New Zealand provided Australia with 34 568 permanent settlers—making it the largest source of new
migrants for that year.
All applicants for permanent entry to Australia, regardless of stream must meet health and character
requirements. Applicants for Skill Stream visas also need to show that they have the skills and attributes
necessary to succeed in the Australian labour market.
1 For more information see Chapter 4 —The Humanitarian Program.

people our business | 23
The number of visas granted under Australia’s Migration Program is tightly controlled. The Government decides
the size and composition of the program and sets planning levels on an annual basis. Through careful
management and monitoring, visa grants in the Migration Program come very close to the planning levels
shown in figure 2.1.
Figure 2.1 Australia’s Migration Program 2009–10 and 2010–11 at a glance
Stream Skill Family Special Eligibility Purpose Allows for the migration of those
with skills and abilities which will contribute to the economy
Allows for the permanent entry of those with close family ties in
Australia
Allows for former permanent residents who meet certain criteria to remain in or
return to Australia as permanent residents
Comprising: Employer Sponsored Business Skills General Skilled Migration Distinguished Talent
Comprising: Partners Dependent Children Parents Other Family
Program year: 2009–10 2010–11 2009–10 2010–11 2009–10 2010–11
Planning levels: 108 100 113 850 5.3% 60 300 54 550 -9.5% 300 300 0.0%
Visas granted: 107 868 113 725 5.4% 60 254 54 543 -9.5% 501 417 -16.8%
Females: 47.6% 47.3% -0.3% 63.4% 64.7% 1.3% 48.1% 50.4% 2.3%
Primary applicants: 43.1% 49.4% 6.3% 84.2% 85.0% 0.8% 53.9% 54.7% 0.8%
Onshore applicants: 43.3% 59.0% 15.7% 27.3% 85.4% 58.1% 96.6% 89.2% -7.4%
2.2 Australia’s Migration Program 2010–11 The Migration Program for 2010–11 was set at 168 700 places. This consisted of a Skill S tream of 113 850
places, a Family Stream of 54 550 places and 300 Special Eligibility places.
The overall size of the 2010–11 program was virtually unchanged from the 2009–10 program year, with only 62
extra places delivered. In absolute terms, it was the second largest program to date, just 3 100 places less than
the record high of 171 800 places in the 2008–09 program. Like all migration programs of the past 12 years this
program has more Skill Stream than Family Stream migrants, with the Skill Stream contributing more than two-
thirds of the 2010–11 program. Compared with the 2009–10 program, Skill Stream visa grants grew by 5.4 per
cent in 2010–11 while both Family Stream and Special Eligibility visa grants fell by 9.5 and 16.8 per cent
respectively.
24 | people our business
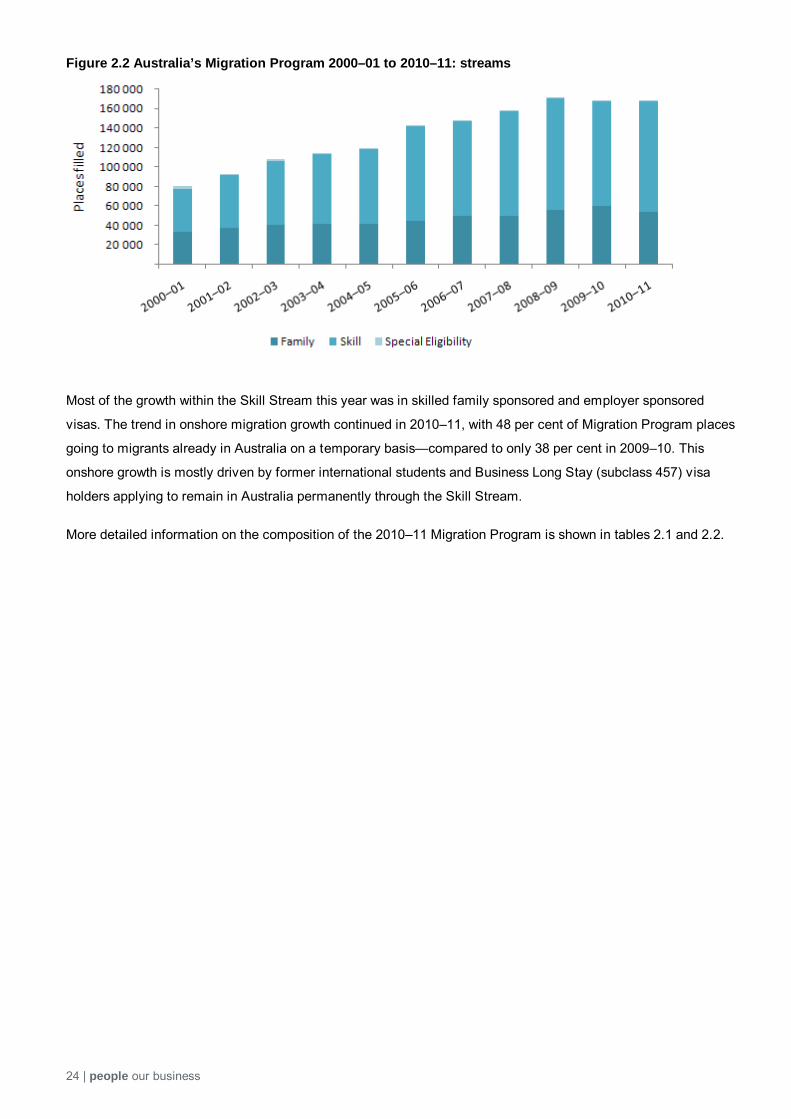
Figure 2.2 Australia’s Migration Program 2000–01 to 2010–11: streams
Most of the growth within the Skill Stream this year was in skilled family sponsored and employer sponsored
visas. The trend in onshore migration growth continued in 2010–11, with 48 per cent of Migration Program places
going to migrants already in Australia on a temporary basis—compared to only 38 per cent in 2009–10. This
onshore growth is mostly driven by former international students and Business Long Stay (subclass 457) visa
holders applying to remain in Australia permanently through the Skill Stream.
More detailed information on the composition of the 2010–11 Migration Program is shown in tables 2.1 and 2.2.

people our business | 25
Table 2.1 Migration Program visa grants 2009–10 and 2010–11
Category or Component 2009–10 % of Program 2010-11 % of
Program
Family
Partner* Includes fiancé, spouse and interdependent 44 755 26.5 41 994 24.9
Child Includes child adoption, child dependent and orphan minor
3 544 2.1 3 300 2.0
Parent Includes Contributory and Non Contributory Parents 9 487 5.6 8 499 5.0
Other Family Includes aged dependent relatives, carers, orphan unmarried relatives and remaining relatives
2 468 1.5 750 0.4
Total Family 60 254 35.7 54 543 32.3
Skill
Employer Sponsored Includes Employer Nomination Scheme, Labour Agreement and Regional Sponsored Migration Scheme
40 987 24.3 44 345 26.3
Business Skills** 6 789 4.0 7 796 4.6
Distinguished Talent 199 0.1 125 0.1
General Skilled Migration
Skilled Independent 37 315 22.1 36 167 21.4
State/Territory Sponsored 18 889 11.2 16 175 9.6
Skilled Australian Sponsored Includes skills tested brothers, sisters, nieces, nephews, non-dependent children, working age parents, grandchildren and first cousins
3 688 2.2 9 117 5.4
Total Skill 107 868 63.9 113 725 67.4
Special Eligibility 501 0.3 417 0.2
Total^ 168 623 100 168 685 100.0 *Figures for Partners are a net outcome as places in the Migration Program taken by provisional visa holders who do not subsequently obtain permanent visas are returned to the Migration Program in the year application for permanent residence was refused/withdrawn. **Net outcome as cancelled visas are returned to the Migration Program in the year in which they are cancelled. ^Table does not include permanent visas granted to New Zealand citizens. Total for 2009–10 includes one grant of a 1 November visa. Source: Migration Program Outcome data, Department of Immigration and Citizenship

26 | people our business
Table 2.2 Migration Program visa grants 2010–11: offshore and onshore
Category or Component Offshore Onshore Total
Family Partner* 29 432 12 562 41 994 Child 3 050 250 3 300 Parent 7 892 607 8 499 Other Family 545 205 750 Total Family 40 919 13 624 54 543
Skill Employer Sponsored 5 284 39 061 44 345 Business Skills** 7 538 258 7 796 Distinguished Talent 55 70 125 General Skilled Migration
Skilled Independent 16 938 19 229 36 167
State/Territory Sponsored 12 817 3 358 16 175
Skilled Australian Sponsored 3 984 5 133 9 117
Total Skill 46 616 67 109 113 725
Special Eligibility 45 372 417 Total^ 87 580 81 05 168 685 *Figures for Partners are a net outcome as places in the Migration Program taken by provisional visa holders who do not subsequently obtain permanent visas are returned to the Migration Program in the year application for permanent residence was refused/withdrawn. **Net outcome as cancelled visas are returned to the Migration Program in the year in which they are cancelled. ^Table does not include permanent visas granted to New Zealand citizens. Source: Migration Program Outcome data, Department of Immigration and Citizenship
2.3 Characteristics of permanent migrants The proportion of males to females in the 2010–11 Migration Program remains the same as 2009–10 levels, with
slightly more females than males—53 per cent compared with 47 per cent.
The main reason for this is because females comprise the majority of the Family Stream—taking up 65 per cent of
all places in 2010–11. As shown in Table 2.3, males do however continue to outnumber females in the Skill Stream,
although the female proportion is slightly higher than in 2009–10.

people our business | 27
Table 2.3 Migration Program visa grants 2010–11: applicant type
Program Stream Male Female Total^ Proportion female (%)
Family Stream 19 253 35 290 54 543 64.7
Primary applicants 15 955 30 611 46 566 65.7 Dependents 3 298 4 679 7 977 58.7
Skill Stream 59 889 53 829 113 725(a) 47.3 Primary applicants 36 553 19 604 56 157 34.9
Dependents 23 336 34 225 57 561 59.5 Special Eligibility 207 210 417 50.4
Primary applicants 131 97 228 42.5 Dependents 76 113 189 59.8
Total Program Outcome^ 79 349 89 329 168 685 53.0 ^Includes 7 “gender unknown” records. Source: Migration Program Outcome data, Department of Immigration and Citizenship
Persons in the Migration Program are relatively young. In 2010–11, 88.7 percent of migrants were aged under 45,
17.8 percent migrated as children under 15 years and only 3.1 per cent were aged 60 or over. Compared with the
2009–10 program, this represents a slight increase (1.3 per cent) in the share of migrants under 45 (87.4 per cent in
2009–10), with a 2.2 per cent fall in the proportion aged under 15 (20.0 per cent in 2009–10) and a 1 per cent fall in
the proportion aged 60 or over (4.1 per cent in 2009–10).
The reasons behind this young age profile are not surprising. An essential criterion for most Skill Stream visas is that
the primary applicant is aged younger than 45. Therefore the Skill Stream component of the program tends to attract
mostly young families and young persons migrating to Australia without dependents. Within the Family Stream, the
partner visa dominates and persons applying for these particular visas also tend to be young.
Table 2.4 Migration Program visa grants 2010–11: age groups
Age Group Male Female Total^
0–14 15 421 14 638 30 061 15–19 3 182 3 545 6 727 20–24 6 548 11 415 17 963 25–29 17 500 21 650 39 151 30–34 12 852 13 766 26 620 35–39 8 638 8 533 17 172 40–44 6 161 5 747 11 909 45–49 3 569 3 116 6 685 50–54 1 716 2 131 3 847 55–59 1 362 1 887 3 249 60 + 2 394 2 898 5 292 Unknown age 6 3 9 Total^ 79 349 89 329 168 685 ^Includes 7 “gender unknown” records. Source: Migration Program Outcome data, Department of Immigration and Citizenship
The top ten migrant source countries for the 2010–11 Migration Program remained similar to 2009–10 with some
re-ordering, and with Irish nationals replacing US nationals in the tenth spot. China remained the top source
country with 29 547 places (3 808 more than in 2009–10), followed by the UK with 23 931 places (1 807 less than
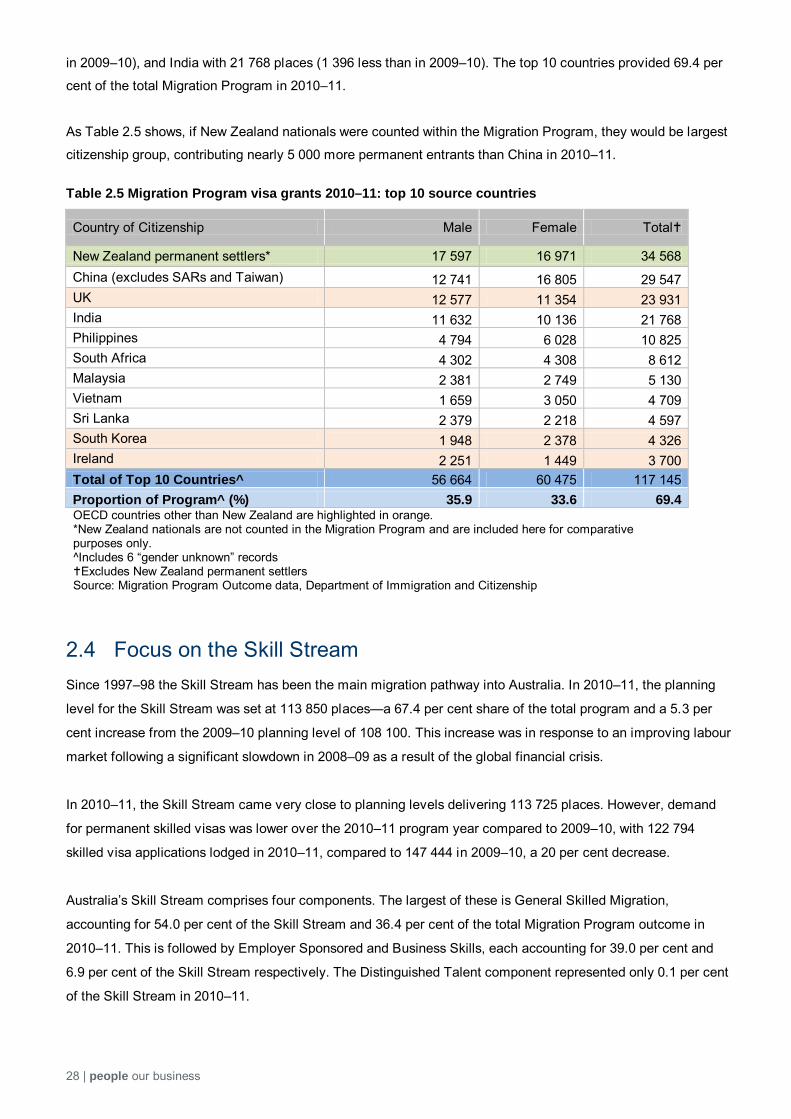
28 | people our business
in 2009–10), and India with 21 768 places (1 396 less than in 2009–10). The top 10 countries provided 69.4 per
cent of the total Migration Program in 2010–11.
As Table 2.5 shows, if New Zealand nationals were counted within the Migration Program, they would be largest
citizenship group, contributing nearly 5 000 more permanent entrants than China in 2010–11.
Table 2.5 Migration Program visa grants 2010–11: top 10 source countries
Country of Citizenship Male Female Total
New Zealand permanent settlers* 17 597 16 971 34 568 China (excludes SARs and Taiwan) 12 741 16 805 29 547 UK 12 577 11 354 23 931 India 11 632 10 136 21 768 Philippines 4 794 6 028 10 825 South Africa 4 302 4 308 8 612 Malaysia 2 381 2 749 5 130 Vietnam 1 659 3 050 4 709 Sri Lanka 2 379 2 218 4 597 South Korea 1 948 2 378 4 326 Ireland 2 251 1 449 3 700 Total of Top 10 Countries^ 56 664 60 475 117 145 Proportion of Program^ (%) 35.9 33.6 69.4 OECD countries other than New Zealand are highlighted in orange. *New Zealand nationals are not counted in the Migration Program and are included here for comparative purposes only. ^Includes 6 “gender unknown” records Excludes New Zealand permanent settlers Source: Migration Program Outcome data, Department of Immigration and Citizenship
2.4 Focus on the Skill Stream Since 1997–98 the Skill Stream has been the main migration pathway into Australia. In 2010–11, the planning
level for the Skill Stream was set at 113 850 places—a 67.4 per cent share of the total program and a 5.3 per
cent increase from the 2009–10 planning level of 108 100. This increase was in response to an improving labour
market following a significant slowdown in 2008–09 as a result of the global financial crisis.
In 2010–11, the Skill Stream came very close to planning levels delivering 113 725 places. However, demand
for permanent skilled visas was lower over the 2010–11 program year compared to 2009–10, with 122 794
skilled visa applications lodged in 2010–11, compared to 147 444 in 2009–10, a 20 per cent decrease.
Australia’s Skill Stream comprises four components. The largest of these is General Skilled Migration,
accounting for 54.0 per cent of the Skill Stream and 36.4 per cent of the total Migration Program outcome in
2010–11. This is followed by Employer Sponsored and Business Skills, each accounting for 39.0 per cent and
6.9 per cent of the Skill Stream respectively. The Distinguished Talent component represented only 0.1 per cent
of the Skill Stream in 2010–11.

people our business | 29
Figure 2.3 Components of the Skill Stream
General Skilled Migration Employer Sponsored
Applicants are not sponsored by an employer but must have either recent skilled work experience or a recently
completed eligible Australian qualification, and also pass a points test which awards higher points to prospective migrants with
certain skills and characteristics.
Main visa categories Skilled Independent
State/Territory Sponsored Skilled Australian Sponsored
61 459 migrants in 2010–11
Applicants must be sponsored by an Australian employer to fill a skilled job
vacancy.
Main visa categories Employer Nomination Scheme
Regional Sponsored Migration Scheme Labour Agreements
44 345 migrants in 2010–11
Business Skills Distinguished Talent
For suitably qualified business persons.
Most entrants are granted a four year provisional visa to establish a business or undertake designated investments. Once
fulfilled, the entrant can apply for permanent residence.
7 796 migrants in 2010–11
For persons who are internationally
recognised for exceptional and outstanding achievement in:
a profession the arts sport research or academia.
125 migrants in 2010–11
Total of 113 725 Skill Stream migrants in 2010–11
2.4.1 General Skilled Migration There were 61 459 General Skilled Migration (GSM) places filled in 2010–11, representing 54 percent of the total
Skill Stream. India, China and the UK remain the top three source countries for GSM visas. The GSM
component includes Skilled Independent, State/Territory Sponsored and Skilled Australian Sponsored visas.
The threshold criteria assessed through the GSM points test are a person’s age, their English proficiency and
their occupation. Applicants need to be younger than 45, possess at least a competent level of English and have
an occupation that is included on the Skilled Occupations List. Once these criteria are met, additional points are
awarded where a person: possesses relevant work experience; is younger; has an Australian qualification; and
can demonstrate a higher level of English proficiency. The points test was reviewed during 2010, and a new test
took effect in July 2011 (see Chapter 1—Developments in Migration Policy).

30 | people our business
Table 2.6 General Skilled Migration visa grants 2010–11: top 10 source countries
Country of Citizenship Male Female Total Total Proportion
India 8 064 4 669 12 733 20.7 China (excludes SARs and Taiwan) 5 353 6 805 12 158 19.8 UK 4 388 3 992 8 380 13.6 Sri Lanka 1 790 1 452 3 242 5.3 Malaysia 1 458 1 574 3 032 4.9 South Africa 1 373 1 389 2 762 4.5 Philippines 826 921 1 747 2.8 Nepal 803 602 1 405 2.3 Iran 756 628 1 384 2.3 South Korea 651 679 1 330 2.2 Total Top 10 countries 25 462 22 711 48 173 78.4 Other Countries 7 069 6 217 13 286 21.6 Total Program 32 531 28 928 61 459 100.0 Gender Split of Total (%) 52.9 47.1 100.0
OECD countries are highlighted in orange. Source: Migration Program Outcome data, Department of Immigration and Citizenship
2.4.2 Employer Sponsored
There were 44 345 Employer Sponsored places filled in 2010–11, representing 39 percent of Skill Stream
outcomes. Employer Sponsored visas are not capped, and receive higher priority under priority processing
directions. This is in an effort to respond quickly to the needs of Australian employers.
As in the previous program year, almost two-thirds of Employer Sponsored entrants in 2010–11 were from either
the UK, Philippines, India, South Africa or China.
The majority of Employer Sponsored outcomes (88.1 per cent) in 2010–11 were from onshore applicants already
in Australia on subclass 457 visas. Demand was slightly lower than the previous program year, with some 47 381
Employer Sponsored visa applications lodged in 2010–11, compared to 53 490 in 2009–10.
Table 2.7 Employer Sponsored visa grants 2010–11: top 10 source countries
Country of Citizenship Male Female Total Total Proportion (%)
UK 4 934 4 348 9 282 20.9 Philippines 3 265 2 829 6 097 13.7 India 2 463 2 074 4 537 10.2 South Africa 2 303 2 194 4 499 10.1 China (excludes SARs and Taiwan) 1 742 1 737 3 480 7.8 Ireland 952 613 1 565 3.5 South Korea 650 659 1 309 3.0 Zimbabwe 433 441 874 2.0 Germany 422 400 822 1.9 USA 384 386 770 1.7 Total Top 10 countries 17 548 15 681 33 235 74.9 Other Countries 5 745 5 364 11 110 25.1 Total^ 23 293 21 045 44 345 100 Gender Split of Total (%) 52.5 47.5 100.0
OECD countries are highlighted in orange. ^Includes 7 unknown gender Source: Migration Program Outcome data, Department of Immigration and Citizenship

people our business | 31
2.4.3 Business Skills There were 7 796 Business Skills places filled in 2010–11, out of 7 800 available places, representing 7 percent
of the total Skill Stream. Chinese nationals remain the largest group, receiving almost two-thirds of Business
Skills visas granted in 2010–11. Demand in this category decreased by 5.1 per cent in 2010–11, with 11 480
applications lodged compared to 12 099 in 2009–10.
Table 2.8 Business Skills visa grants 2010–11: top 10 source countries
Country of Citizenship Male Female Total Total Proportion (%)
China (excludes SARs and Taiwan) 2 457 2 334 4 791 61.5 South Korea 333 308 641 8.2 Malaysia 212 202 414 5.3 UK 202 189 391 5.0 South Africa 164 166 330 4.2 Taiwan 70 60 130 1.7 Hong Kong (SAR of China) 68 58 126 1.6 Pakistan 66 49 115 1.5 Iran 38 39 77 1.0 Sri Lanka 34 38 72 0.9 Total Top 10 countries 3 644 3 443 7 087 90.9 Other Countries 359 350 709 9.1 Total 4 003 3 793 7 796 100.0 Gender Split of Total (%) 51.3 48.7 100.0
OECD countries are highlighted in orange. Source: Migration Program Outcome data, Department of Immigration and Citizenship

32 | people our business
2.5 Family Stream
Table 2.9 contains information on the top 10 countries of citizenship for visas granted in the Family Stream in
2010–11. These 10 countries accounted for almost two-thirds of the Family Stream, and 64.7 per cent of visas
granted in this stream were for women.
Table 2.9 Family Stream visa grants 2010–11: top 10 source countries
Country of Citizenship Male Female Total Grants Proportion of
Family Stream (%)
China (excludes SARs and Taiwan) 3 170 5 907 9 077 16.6 UK 3 015 2 791 5 806 10.6 India 1 062 3 364 4 426 8.1 Vietnam 972 2 351 3 323 6.1 Philippines 695 2 268 2 963 5.4 Thailand 350 1 691 2 041 3.7 USA 810 984 1 794 3.3 Indonesia 314 907 1 221 2.2 South Korea 298 718 1 016 1.9 South Africa 454 548 1 002 1.8 Other 8 113 13 761 21 874 40.1
Total 19 253 35 290 54 543 100.0
Gender Split (%) 35.3 64.7 100.0
OECD countries are highlighted in orange. Source: Migration Program Outcome data, Department of Immigration and Citizenship

people our business | 33
2.6 Migration Program planning levels for 2011–12 The Migration Program planning levels for 2011–12 (table 2.10) represent a 10 percent growth in places on the
2010-11 program, with a maximum of 185 000 places, consisting of:
125 850 places under the Skill Stream—12 000 more places than in 2010–11
58 600 places under the Family Stream—4 050 more places than in 2010–11
550 Special Eligibility places—250 more places than in 2010–11.
Table 2.10 Migration Program planning levels 2011–12
Category 2010–11 Planning Level
2011–12 Planning Level Change (%)
Family Partner 42 000 45 400 8.1
Child 3 300 3 450 4.5 Other Family 750 1 250 66.7 Parent 8 500 8 500 0.0
Total Family 54 550 58 600 7.4 Skill Employer Sponsored 44 150 46 000 4.2 General Skilled Migration 61 700 72 450 17.4 Distinguished Talent 200 200 0.0 Business Skills 7 800 7 200 -7.7
Total Skill 113 850 125 850 10.5 Special Eligibility
Total Special Eligibility 300 550 83.3 Total Program 168 700 185 000 9.7
Source: Migration Program Statistics, www.immi.gov.au/media/statistics/statistical-info/visa-grants/migrant.htm

34 | people our business
This page has been intentionally left blank.

people our business | 35 3 Temporary Entry
Chapter 3: Temporary Entry

36 | people our business
3.1 Overview
In 2010–11, 3 994 830 temporary entry visas were granted. These included visas granted to tourists, long and
short-term business visitors, students, working holiday makers, onshore graduates as well as a range of
specialist work and medical treatment visas. Figure 3.1 shows that in 2010–11 tourists accounted for the vast
majority of temporary entry visas (74.6 per cent), while short-term business visitors came a distant second, with
a share of 11.1 per cent.
Figure 3.1 Overview of selected temporary entry visas granted 2010–11
3.2 Business Long Stay visa A significant component of the temporary entry program and a large contributor to net overseas migration is
Australia’s temporary Business Long Stay (subclass 457) visa. This visa enables employers to directly sponsor
overseas workers for a period of up to four years, provided they have been unable to source workers through the
domestic labour market.
Table 3.1 shows that, following a fall in visa grants in 2009–10, demand for Business Long Stay visas increased
in 2010–11, with 32.5 per cent more visas being granted compared with the previous year.

people our business | 37
Table 3.1 Business Long Stay visa grants 2001–02 to 2010–11
Year Male Female Gender unknown Total Grants
2001–02 20 554 17 551 487 38 592 2002–03 22 483 19 063 390 41 936 2003–04 23 007 18 864 566 42 437 2004–05 26 603 21 748 786 49 137 2005–06 40 162 30 868 707 71 737 2006–07 49 426 38 484 27 87 937 2007–08 61 940 49 060 19 111 019 2008–09 55 479 45 930 23 101 432 2009–10 36 688 31 332 3 68 023 2010–11 50 387 39 755 3 90 145 Includes grants to primary and secondary applicants. Source: Migration Planning and Strategies Section (BP0001), Department of Immigration and Citizenship
Table 3.2 shows that six of the top 10 countries of citizenship for Business Long Stay visa grants in 2010–11
were OECD countries, with OECD countries contributing 56.4 per cent of all grants in 2010–11.
Table 3.2 Business Long Stay visa grants 2010–11: top 10 source countries
Citizenship Country Female Male Total Proportion of
total grants (%)
UK 9 621 12 053 21 674 24.0 India 6 452 9 358 15 810 17.5 USA 3 000 4 019 7 020^ 7.8 Philippines 2 736 3 161 5 898^ 6.5 Ireland 2 366 3 452 5 818 6.5 South Africa 1 699 1 796 3 495 3.9 China (excludes SARs and Taiwan) 1 427 1 554 2 981 3.3 Canada 1 256 1 475 2 731 3.0 Germany 963 1 181 2 144 2.4 France 880 1 208 2 089^ 2.3 Total Top 10 countries 30 400 39 257 69 660 77.3 Other 9 355 11 130 20 485 22.7 Grand Total 39 755 50 387 90 145 100.0 Gender Split of Total (%) 44.1 55.9 100.0 OECD countries are highlighted in orange.
^Includes a small number of "unknown gender" records. Source: Migration Planning and Strategies Section (BP0001), Department of Immigration and Citizenship
The Business Long Stay visa is a common pathway to permanent residence. In 2010–11, 41 720 people
transitioned from a Business Long Stay visa to a place in the Migration Program, with 96.2 per cent granted a
permanent skilled visa and 3.9 per cent a family visa. The majority of people making this transition to permanent
residence were sponsored by their employer, with 68.2 per cent moving onto an Employer Nomination Scheme
visa and 17.5 per cent transitioning to a Regional Sponsored Migration Scheme visa.

38 | people our business
Table 3.3 Permanent visas granted to Business Long Stay visa holders 2009–10 & 2010–11
Visa Category 2009–10 2010–11 % change % of total transitions 2010–11
Skill Employer Nomination Scheme 25 990 28 430 9.4 68.2 Regional Sponsored Migration Scheme 7 670 7 290 -5.0 17.5 Labour Agreement 80 30 -66.7 0.1 Skilled Independent 5 570 2 730 -51.0 6.5 Other Skilled 1 950 1 640 -15.8 3.9
Skill total 41 260 40 120 -2.8 96.2 Family Spouse 1 870 1 400 -25.5 3.3 Other Family 270 200 -24.2 0.5
Family total 2 140 1 600 -25.4 3.8 Total 43 400 41 720 3.9 100.0 In determining the last visa held, bridging visas have been excluded. Figures are rounded. Source: Migration Planning and Population Strategies Section, Department of Immigration and Citizenship
3.3 Students and Graduates In 2010–11, 250 438 Student visas were granted to foreign nationals to enrol in a full fee paying course in
Australia. This represented a decrease of 7.4 per cent compared to the 270 499 student visas granted in 2009–
10, and a 21.6 per cent decrease on the peak of 2008–09 (319 632 visa grants). Figure 3.2 Student visa grants 1993–94 to 2010–11
Table 3.4 shows that student visa grants fell across all major source countries between 2009–10 and 2010–11.
In 2010–11 reductions in grants were most pronounced for applicants from South Korea (down 19.4 per cent
from 2009–10), while grants to Indian students experienced the largest two-year decline (down 55.8 per cent
from 2008–09).

people our business | 39
Table 3.4 Student visa grants 2008–09 to 2010–11: top 10 source countries
Source country 2008–09 2009–10 2010–11 Per cent change
(2009–10 to 2010–11) (%)
China (excludes SARS and Taiwan) 55 331 54 541 49 852 -8.6 India 65 516 29 826 28 954 -2.9 South Korea 17 351 16 416 13 238 -19.4 Brazil 12 525 11 461 9 780 -14.7 Malaysia 11 545 10 643 9 709 -8.8 Thailand 13 489 11 742 9 273 -21.0 Nepal 13 995 6 073 8 830 45.4 US 9 644 9 007 8 562 -4.9 Indonesia 8 681 8 729 8 088 -7.3 Saudi Arabia 7 629 7 318 7 798 6.6 Other 103 926 104 743 96 354 -8.0 Total 319 632 270 499 250 438 -7.4
Proportion citizens of OECD countries (%) 20.7 24.3 23.3
Proportion Female (%) 45.4 47.4 47.3 OECD countries are highlighted in orange Source: Migration Planning and Strategies Section (BP0001), Department of Immigration and Citizenship
In terms of educational sector, table 3.5 shows that in 2010–11, grants in the English Language Intensive
Courses for Overseas Students (ELICOS) and Schools sectors declined the most with decreases of 17.5 and
16.5 per cent respectively compared with 2009–10. This table also shows that the share of offshore student visa
grants has declined by 8.0 per cent over the period 2008–09 to 2010–11.
Table 3.5 Student visa grants 2008–09 to 2010–11: educational sector
Educational sector 2008–09 2009–10 2010–11 Change (%) 2008–09 to
2009–10
Change (%) 2009–10 to
2010–11
Higher Education 133 860 119 004 112 567 -11.1 -5.4
Vocational Education and Training 103 789 72 030 67 406 -30.6 -6.4
ELICOS^ 36 452 35 242 29 062 -3.3 -17.5
Non-Award 18 999 18 139 17 107 -4.5 -5.7
Schools 14 139 12 527 10 460 -11.4 -16.5
Postgraduate Research 8 335 9 341 9 203 12.1 -1.5
AusAID/Defence 4 058 4 216 4 633 3.9 9.9
Total Grants 319 632 270 499* 250 438 -15.4 -7.4
Offshore share (%) 28.3 24.0 20.3
Onshore share (%) 71.7 76.0 79.7 ^ELICOS: English Language Intensive Courses for Overseas Students. *Includes 24 unknown location (on/offshore) records. Source: Migration Planning and Strategies Section (BP0001), Department of Immigration and Citizenship

40 | people our business
Several factors contributed to the decline in grants since the peak of 2008–09. These include: a stronger
Australian dollar; the ongoing impact of the global economic crisis in some countries; increased international
competition in the education market; and changes to the Skilled Migration program such as tightening of the
Skilled Occupation List (see Chapter 1—Developments in Migration Policy).
The decline in student visa grants since 2008–09 is also having an impact on the stock of international students
in Australia. On 30 June 2011, there were 332 709 student visa holders in Australia, a decline of 13.1 per cent
compared to 30 June 2010 when there were 382 716 international students. The main source countries of these
students are China and India with 75 578 and 50 980 visa holders respectively. OECD countries accounted for
15.5 per cent of student visa holders currently at 30 June 2011.
At 30 June 2011, 54.1 per cent of student visa holders in Australia held a Higher Education visa and 28.3 per
cent held a Vocation Education and Training Sector visa.
3.3.1 Student and graduate pathways to permanent residence
Since restrictions on onshore skilled migration visa applications for students were eased in 2001, many students
have transitioned to the Skill Stream of the Migration Program on completion of their courses. Table 3.6 contains
data on the numbers of student visa holders transitioning to selected Migration Program visas for the period
2006–07 to 2010–11. The considerable jump in students transitioning to a Skilled Independent visa in 2010–11 is
flow-on from the spike in student visa grants in 2008–09.
Table 3.6 Migration Program visa grants to Student visa holders 2006–07 to 2010–11
Permanent visa category
Grants to former student visa holders^ Per cent change
(2009–10 to 2010–11)
Per cent change
(2006–07 to 2010–11) 2006–07 2007–08 2008–09 2009–10 2010–11
Employer Sponsored 464 615 1 010 1 406 2 291 62.9 393.8
Skilled Australian Sponsored 2 571 3 566 2 504 819 4 564 457.3 77.5
Skilled Independent 20 294 17 836 9 649 6 139 16 883 175.0 -16.8
Partner 3 024 3 038 3 733 4 941 5 372 8.7 77.6
State/Territory Sponsored 337 413 2 368 2 320 2 847 22.7 744.8
Other skilled and family 322 338 336 270 116 -57.0 -64.0
Total 27 012 25 806 19 600 15 895 32 073 101.8 18.7
^Persons whose last visa held was a student visa (excluding bridging visas). Students transitioning to permanent residency via a Skilled Graduate visa are detailed in table 3.9. Source: Migration Planning and Population Strategies Section, Department of Immigration and Citizenship
International students who do not meet the criteria for a permanent Skill Stream visa after graduating may apply
for a Skilled Graduate (subclass 485) visa, which allows temporary residence in Australia for 18 months to gain

people our business | 41
skilled work experience or improve their English language skills. Holders of this visa may apply for permanent
residence at any time if they meet the passmark on the General Skilled Migration points test. In 2010–11 the top
three source countries for Skilled Graduate visa grants were India, China and Nepal, which collectively
accounted for 72.8 per cent of all grants.
Table 3.7 Skilled Graduate visa grants 2010–11: top three source countries
Country of Citizenship Grants 2009–10 Grants 2010–11 Change (%)
India 9 230 9 644 4.5% China (excludes SARs and Taiwan) 4 942 4 330 -12.4% Nepal 1 270 1 734 36.5% OECD countries 2 256 1 395 -38.2% Other countries 5 692 4 484 -21.2% Total grants 23 390 21 587 -7.7%
Source: Migration Planning and Strategies Section (BP0001), Department of Immigration and Citizenship
Table 3.8 shows that in 2010–11 the majority of Skilled Graduate visas were granted to students who completed
a diploma (17.3 per cent of all grants) or a masters degree (16.3 per cent of all grants) in Australia. Table 3.9
shows that In 2010–11, 6 267 Skilled Graduate visa holders transitioned to a permanent skilled visa.
Table 3.8 Skilled Graduate visa grants 2010–11: qualifications completed in Australia
Qualification completed in Australia Grants 2010–11 Proportion (%)
Diploma 3 727 17.3
Masters Degree 3 512 16.3
Bachelor Degree 2 240 10.4
Certificate III 1 535 7.1
Advanced Diploma 1 381 6.4
Certificate IV 475 2.2
Graduate Diploma 295 1.4
Doctoral Degree 35 0.2
Honours Degree (other) 32 0.1
Honours Degree (upper 2nd Class) 30 0.1
Honours Degree (1st Class) 15 0.1
Other 8 310 38.5
Total 21 587 100.0
Source: Migration Planning and Strategies Section (BP0001), Department of Immigration and Citizenship
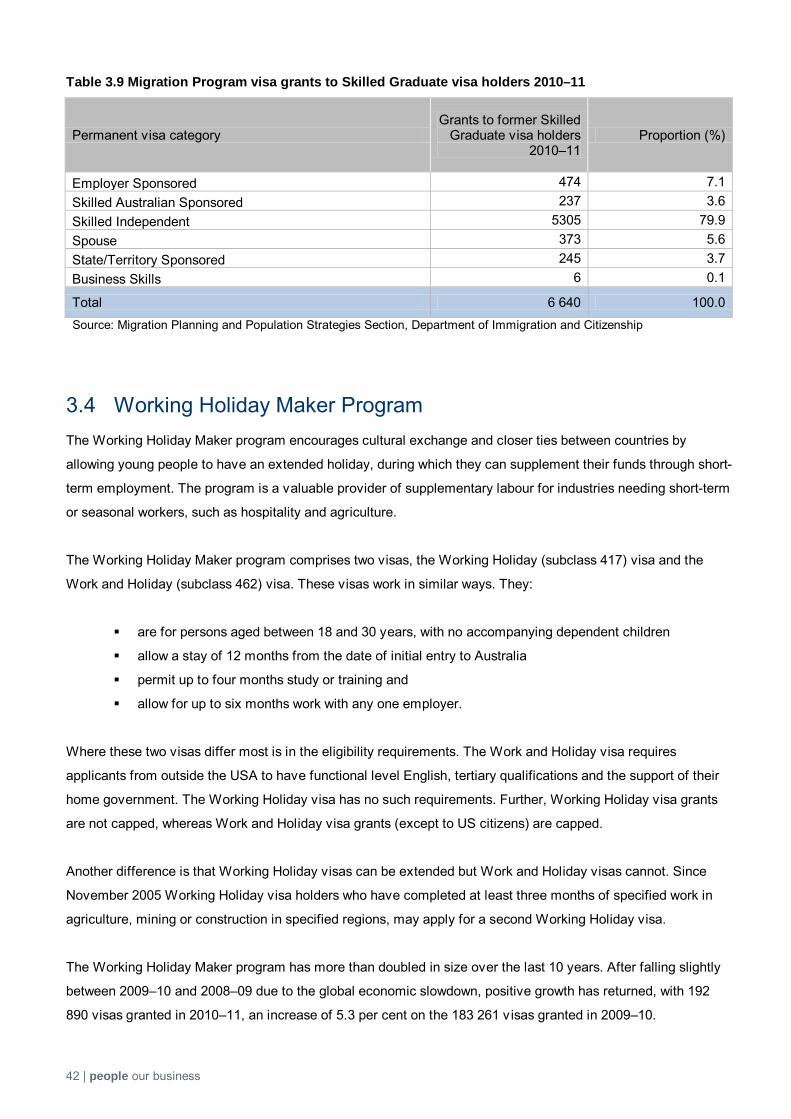
42 | people our business
Table 3.9 Migration Program visa grants to Skilled Graduate visa holders 2010–11
Permanent visa category Grants to former Skilled
Graduate visa holders 2010–11
Proportion (%)
Employer Sponsored 474 7.1 Skilled Australian Sponsored 237 3.6 Skilled Independent 5305 79.9 Spouse 373 5.6 State/Territory Sponsored 245 3.7 Business Skills 6 0.1
Total 6 640 100.0 Source: Migration Planning and Population Strategies Section, Department of Immigration and Citizenship
3.4 Working Holiday Maker Program The Working Holiday Maker program encourages cultural exchange and closer ties between countries by
allowing young people to have an extended holiday, during which they can supplement their funds through short-
term employment. The program is a valuable provider of supplementary labour for industries needing short-term
or seasonal workers, such as hospitality and agriculture.
The Working Holiday Maker program comprises two visas, the Working Holiday (subclass 417) visa and the
Work and Holiday (subclass 462) visa. These visas work in similar ways. They:
are for persons aged between 18 and 30 years, with no accompanying dependent children
allow a stay of 12 months from the date of initial entry to Australia
permit up to four months study or training and
allow for up to six months work with any one employer.
Where these two visas differ most is in the eligibility requirements. The Work and Holiday visa requires
applicants from outside the USA to have functional level English, tertiary qualifications and the support of their
home government. The Working Holiday visa has no such requirements. Further, Working Holiday visa grants
are not capped, whereas Work and Holiday visa grants (except to US citizens) are capped.
Another difference is that Working Holiday visas can be extended but Work and Holiday visas cannot. Since
November 2005 Working Holiday visa holders who have completed at least three months of specified work in
agriculture, mining or construction in specified regions, may apply for a second Working Holiday visa.
The Working Holiday Maker program has more than doubled in size over the last 10 years. After falling slightly
between 2009–10 and 2008–09 due to the global economic slowdown, positive growth has returned, with 192
890 visas granted in 2010–11, an increase of 5.3 per cent on the 183 261 visas granted in 2009–10.

people our business | 43
3.4.1 Working Holiday visas
Australia currently has reciprocal Working Holiday visa arrangements with 19 countries. These are Belgium,
Canada, Cyprus, Denmark, Estonia, Finland, France, Germany, Hong Kong, Ireland, Italy, Japan, South Korea,
Malta, Netherlands, Norway, Sweden, UK, and Taiwan. All but four of these countries are OECD member states.
In 2010–11, 185 448 Working Holiday visas were granted, 5.5 per cent more than the 175 742 grants in 2009–
10. The top five source countries in 2010–11 were the UK, Korea, Ireland, Germany and France. These five
countries collectively accounted for 70.7 per cent of the program for 2010–11. Male visa holders (51.7 per cent)
slightly outnumbered females.
Table 3.10 Working Holiday visa grants 2010–11: participating countries
Arrangement country / citizenship Male Female Total Proportion (%)
UK 21 867 17 192 39 059 21.1 South Korea 16 914 13 609 30 523 16.5 Germany 9 465 11 702 21 167 11.4 France 10 719 7 833 18 552 10.0 Ireland 13 625 8 159 21 784 11.7 Taiwan 4 497 9 317 13 814 7.4 Canada 3 505 4 405 7 910 4.3 Japan 2 722 5 028 7 750 4.2 Italy 4 209 2 229 6 438 3.5 Sweden 1 760 2 367 4 127 2.2 Netherlands 1 873 1 949 3 822 2.1 Hong Kong (SAR of China) 1 831 2 712 4 543 2.4 Estonia 852 600 1 452 0.8 Belgium 651 579 1 230 0.7 Denmark 685 578 1 263 0.7 Finland 327 741 1 068 0.6 Norway 270 566 836 0.5 Malta 51 37 88 0.05 Cyprus 12 6 18 0.01 Unknown* 2 2 4 0.00 Total 95 837 89 611 185 448 100.0 Gender Split of Total (%) 51.7 48.3 100.0
OECD countries are highlighted in orange Figures include first and second Working Holiday Visa. *These are cases where the visa applicant has dual nationality and the visa approval has been recorded against a non Working Holiday Visa eligible nationality. Source: Migration Planning and Strategies Section (BP0001), Department of Immigration and Citizenship
3.4.2 Work and Holiday visas
Work and Holiday visa arrangements are in place with Bangladesh, Chile, Indonesia, Malaysia, Thailand, Turkey
and the USA. With the exception of the USA, the annual number of Work and Holiday visa holders allowed
under this category is capped in line with limits upon number of Australians able to take a working holiday in an
arrangement country.
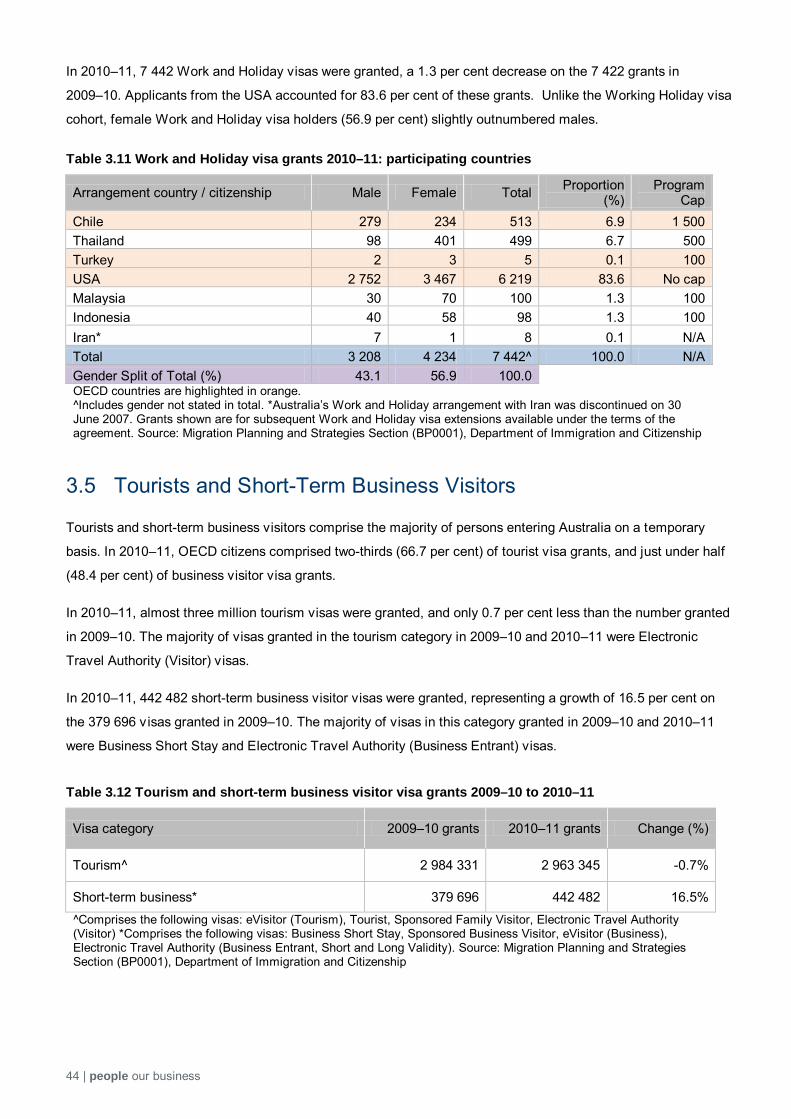
44 | people our business
In 2010–11, 7 442 Work and Holiday visas were granted, a 1.3 per cent decrease on the 7 422 grants in
2009–10. Applicants from the USA accounted for 83.6 per cent of these grants. Unlike the Working Holiday visa
cohort, female Work and Holiday visa holders (56.9 per cent) slightly outnumbered males.
Table 3.11 Work and Holiday visa grants 2010–11: participating countries
Arrangement country / citizenship Male Female Total Proportion (%)
Program Cap
Chile 279 234 513 6.9 1 500 Thailand 98 401 499 6.7 500 Turkey 2 3 5 0.1 100 USA 2 752 3 467 6 219 83.6 No cap Malaysia 30 70 100 1.3 100 Indonesia 40 58 98 1.3 100 Iran* 7 1 8 0.1 N/A Total 3 208 4 234 7 442^ 100.0 N/A Gender Split of Total (%) 43.1 56.9 100.0
OECD countries are highlighted in orange. ^Includes gender not stated in total. *Australia’s Work and Holiday arrangement with Iran was discontinued on 30 June 2007. Grants shown are for subsequent Work and Holiday visa extensions available under the terms of the agreement. Source: Migration Planning and Strategies Section (BP0001), Department of Immigration and Citizenship
3.5 Tourists and Short-Term Business Visitors
Tourists and short-term business visitors comprise the majority of persons entering Australia on a temporary
basis. In 2010–11, OECD citizens comprised two-thirds (66.7 per cent) of tourist visa grants, and just under half
(48.4 per cent) of business visitor visa grants.
In 2010–11, almost three million tourism visas were granted, and only 0.7 per cent less than the number granted
in 2009–10. The majority of visas granted in the tourism category in 2009–10 and 2010–11 were Electronic
Travel Authority (Visitor) visas.
In 2010–11, 442 482 short-term business visitor visas were granted, representing a growth of 16.5 per cent on
the 379 696 visas granted in 2009–10. The majority of visas in this category granted in 2009–10 and 2010–11
were Business Short Stay and Electronic Travel Authority (Business Entrant) visas.
Table 3.12 Tourism and short-term business visitor visa grants 2009–10 to 2010–11
Visa category 2009–10 grants 2010–11 grants Change (%)
Tourism^ 2 984 331 2 963 345 -0.7%
Short-term business* 379 696 442 482 16.5% ^Comprises the following visas: eVisitor (Tourism), Tourist, Sponsored Family Visitor, Electronic Travel Authority (Visitor) *Comprises the following visas: Business Short Stay, Sponsored Business Visitor, eVisitor (Business), Electronic Travel Authority (Business Entrant, Short and Long Validity). Source: Migration Planning and Strategies Section (BP0001), Department of Immigration and Citizenship

people our business | 45
In 2010–11, OECD countries featured in seven of the top 10 source countries for tourism visa grants and four of
the top 10 source countries for business visitor visa grants. Tables 3.13 and 3.14 contain more information about
the main countries of citizenship for grants of these visas in 2010–11.
Table 3.13 Tourism visa grants 2010–11: top 10 source countries
Country of Citizenship Female Male Total 2010–11 grants
Proportion (%)
UK 272 734 257 720 530 454 17.9 USA 160 820 149 509 310 329 10.5 Japan 173 948 127 222 301 170 10.2 Malaysia 99 041 78 630 177 671 6.0 South Korea 88 592 74 567 163 159 5.5 China (excludes SARs and Taiwan) 80 900 57 588 138 488 4.7 Germany 65 817 62 385 128 202 4.3 Singapore 68 986 53 408 122 394 4.1 France 56 335 56 057 112 392 3.8 Canada 50 258 43 549 93 807 3.2 Other countries 491 900 393 378 885 279 29.9 Total Tourism 1 609 331 1 354 013 2 963 345 100.0 Gender Split of Total (%) 54.3 45.7 100.0 OECD countries are highlighted in orange. Source: Migration Planning and Strategies Section (BP0001), Department of Immigration and Citizenship
Table 3.14 Short-term business visitor visa grants 2010–11: top 10 source countries
Country of Citizenship Female Male Total 2010–11 grants
Proportion (%)
China (excludes SARs and Taiwan) 24 617 49 703 74 320 16.8 USA 13 134 49 535 62 669 14.2 UK 6 828 33 188 40 016 9.0 India 4 552 21 034 25 586 5.8 Japan 3 400 19 645 23 045 5.2 Singapore 5 941 13 349 19 290 4.4 Indonesia 5 102 10 790 15 892 3.6 Malaysia 4 032 10 448 14 480 3.3 Germany 1 932 11 995 13 927 3.1 Thailand 5 175 8 004 13 179 3.0 Other countries 31 547 108 531 140 078 31.7 Total Business 106 260 336 222 442 482 100.0 Gender Split of Total (%) 24.0 76.0 100.0
OECD countries are highlighted in orange. Source: Migration Planning and Strategies Section (BP0001), Department of Immigration and Citizenship

46 | people our business
3.6 Other Temporary Visas
The specialist entry program provides a range of visas for people to participate in specific professional, cultural
or social activities other than tourism in Australia. There are two streams within this program. The Social/Cultural
Stream facilitates the entry of workers whose professions contribute to an increased understanding between
cultures. The International Relations Stream seeks to foster better relations between countries by facilitating the
entry of foreign government personnel, diplomats, and others.
Table 3.15 Specialist entry visitor visa grants 2010–11
Category and visa type 2010–11 grants
Social/Cultural Stream
Entertainment for workers in the entertainment industry, including film directors, performers etc 16 319
Special Programme for approved special programs, including youth exchanges and Pacific Seasonal Worker Pilot Scheme workers 2 563
Visiting Academic for professional academics to observe or participate in research activities at tertiary and research institutions in Australia 2 602
Religious Worker for persons wishing to conduct full-time religious work in Australia 1 835
Sport for sportspeople participating in sports competition or training events in Australia 497
Media and Film Staff for journalists, film crew etc 30
Professional Development for professionals, managers or government officials undertaking professional development training programs in Australia 491
Proportion citizens of OECD countries (%) 70.2
Total Social/Cultural 24 337
International Relations Stream
Domestic Worker (Executive) for full-time domestic workers of certain senior executives holding a Business Long Stay visa 17
Domestic Worker (Diplomatic or Consular) for full-time domestic workers of holders of a Diplomatic visa 145
Government Agreement for those working under a bilateral arrangement with the British Council, Alliance Francais, Goethe-Insitut and Italian Cultural Institute 496
Foreign Government Agency for representatives of foreign government agencies without official status 286
Exchange for workers participating in a reciprocal exchange program 306
Diplomatic for diplomats 2 330
Occupational Trainee for certain workers undertaking training to improve their occupational skills 3 480
Proportion citizens of OECD countries (%) 49.6
Total International Relations 7 060
Source: Migration Planning and Strategies Section (BP0001), Department of Immigration and Citizenship

people our business | 47
3.6.1 Pacific Seasonal Worker Pilot Scheme
Within the Social/Cultural Stream, the Pacific Seasonal Worker Pilot Scheme enables up to 2 500 seasonal
workers, over three years, from Kiribati, Papua New Guinea, Tonga and Vanuatu to work in low-skilled jobs in the
horticultural industry in regional Australia for up to seven months in a 12 month period. Pacific seasonal workers
contribute to the economic development of their home country through skills transfers and remittances.
In September 2011, the Australian Government invited Nauru, Samoa, Solomon Islands and Tuvalu to enter into
memoranda of understanding to join the scheme, and announced an additional small scale trial will be
implemented involving the employment of workers from East Timor in West Australian tourism businesses.
Now in its third year of operation, the pilot has seen considerable increase in demand. In 2010–11, 392 workers
were recruited by eight approved employers. This compares with 67 workers recruited by two approved
employers in 2009–10. In 2010–11, Papua New Guinea workers also participated in the scheme for the first time.
Demand in the 2011–12 program year is expected to top 1 000 workers.
3.6.2 Other visitors
In 2010–11, 2 197 Medical Treatment (Short Stay) visas were granted to citizens of 60 countries, with citizens of
France accounting for 58.4 per cent2 of these grants. In addition to these were 131 Medical Treatment (Long
Stay) visa grant to citizens of 36 countries, with more than half of these going to citizens of Vietnam, Indonesia,
Philippines, Fiji or Pakistan.
There were 243 visas granted to superyacht crew in 2010–11. Of these, 72.8 per cent were for citizens from
OECD countries, with UK and US visa holders being the main recipients (85 and 30 grants respectively).
Table 3.16 Other visitor visa grants 2010–11
Category and visa type 2010–11 grants Proportion granted to citizens of OECD countries (%)
Superyacht Crew 243 72.8
Medical Treatment (Short Stay) 2 197 60.9
Medical Treatment (Long Stay) 131 5.3
Total 2 571 59.2
Source: Migration Planning and Strategies Section (BP0001), Department of Immigration and Citizenship
2 The majority of these were people born in New Caledonia.

48 | people our business
3.7 Short-Term Intracorporate Flows Short-term intracorporate transfers (or ‘posted workers’) are employees whose employer temporarily transfers
them to a different country to provide services for a limited period. In contrast to ordinary labour migration, these
workers (if salaried) are employees of a company in the country of origin rather than of a domestic company or
(if self-employed) are based in the country of origin rather than the country where the service is carried out.
Short-term intracorporate flows are an under-studied aspect of international trade, and can be difficult to
measure in the Australian context. This is due to the limited availability of data collected for some of the visas
that could be used to travel to Australia under an intracorporate transfer arrangement. It is planned that further
information on business visitors travelling on intracorporate transfer arrangements will be collected in the future.
In this analysis we use the following categories to reflect intracorporate flows:
Persons who arrive on one of Australia’s five short-term business visitor visas, who indicate business or
employment as their primary reason for travel on their incoming passenger card. Holders of these visas
can stay in Australia for up to three months at a time. Information on their business activities is currently
limited to their stated intentions at the time of arrival.
Persons who arrive on a Business Long Stay visa whose visa application indicated that they were
travelling on an internal company transfer arrangement.
Table 3.17 includes information about arrivals of these cohorts.
Table 3.17 Short-term intracorporate transfers 2010–11
Visa category Reason for travel^ Length of stay Arrivals 2010–11
Short-stay business visitor* Employment
3 months 9 610
Business 342 794
Business Long Stay visa** Temporary intra-company employee transfer
Less than 1 year 1 970
1 year or more 1 690
Total 356 064 *Comprises the following visas: Business Short Stay, Sponsored Business Visitor, eVisitor (Business), Electronic Travel Authority (Business Entrant Long and Short Validity). **Figures are rounded estimates. Business Long Stay visas are generally valid for 4 years, therefore this includes persons granted this visa in 2006–07 and who stayed in Australia for less than 12 months by the time their visa expired in 2010–11. ^For short-stay business visitor visa holders, reason for travel is determined by the travel purpose they indicate on their incoming passenger card—options include ‘convention/conference’, ‘business’, ‘employment’, ‘visiting friends/relatives’, ‘holiday’, and ‘education’. Information on the travel purposes of Business Long Stay visa holders is collected from their visa application. Maximum length of stay allowed is 3 months for short-term business visa holders and 4 years for Business Long Stay visa holders. Source: Overseas Arrivals and Departures data and Migration Planning and Strategies Section (BE4402.01), Department of Immigration and Citizenship.

people our business | 49
Chapter 4: The Humanitarian Program Permanent settlement for refugees

50 | people our business
4.1 Overview Australia’s Humanitarian Program consists of an offshore resettlement component for people outside Australia
who are in need of humanitarian assistance and an onshore protection component for people who seek asylum
after arrival in Australia and are subsequently found to be refugees.
Figure 4.1 shows that from 1989–90 to 2010–11, offshore applicants represented an average of 82.8 per cent of
total visa grants in the Humanitarian Program. In 2010–11, 35.0 per cent of Humanitarian Program visas were
granted to onshore applicants—the second highest in 22 years (the 2000–01 program had the highest share of
onshore applicants—41.8 per cent). This greater onshore share is a consequence of increased numbers of
irregular maritime arrivals, that is, asylum seekers arriving by boat without a valid visa. In 2010–11, there were
4 910 irregular maritime arrivals.
Figure 4.1 Humanitarian Program 1989–90 to 2010–11: onshore and offshore

people our business | 51
4.2 Humanitarian Program places 2010–11
In 2010–11, the Humanitarian Program was set at 13 750, comprising:
6 000 places primarily for those who have been referred to Australia for resettlement by the United
Nations High Commissioner for Refugees (UNHCR), and
7 750 places catering for people overseas subject to substantial discrimination and human rights abuses
in their home country, and people who have sought protection after arrival in Australia who are
subsequently found to be refugees.
In 2010–11, 8 971 visas were granted to people overseas, while 4 828 visas were granted to people found to be
refugees in Australia.
The majority (58.1 per cent) of the 8 971 persons granted a visa in the offshore component were granted a
Refugee (subclass 200) visa, representing 37.8 per cent of the total Humanitarian Program. These are
predominantly persons residing overseas and outside their home country who have been referred to the
Australian Government by the UNHCR.
Within the offshore component, the government sets annual targets for grants of Woman at Risk visas. In
2010–11 the target for Woman at Risk visa grants was 12 per cent of visas allocated under the Refugee
category, which comprises the Refugee, In-Country Special Humanitarian, Emergency Rescue and Woman at
Risk visa subclasses. In 2010–11, 759 Woman at Risk visas were granted, 0.7 per cent more than the target,
mostly to applicants from the Democratic Republic of the Congo, Afghanistan, Burma, Iraq and Eritrea.
Among the onshore component, the vast majority of visas granted are Protection visas. Generally people
applying for Protection visas are already in Australia on a valid visa or are irregular maritime arrivals. For
example, an overseas student may apply for a Protection visa if they have a well-founded fear that they will be
persecuted because of their race, religion, nationality or political opinion on their return home.
Other visas in the Humanitarian Program and their main source countries are outlined in tables 4.1 and 4.2.
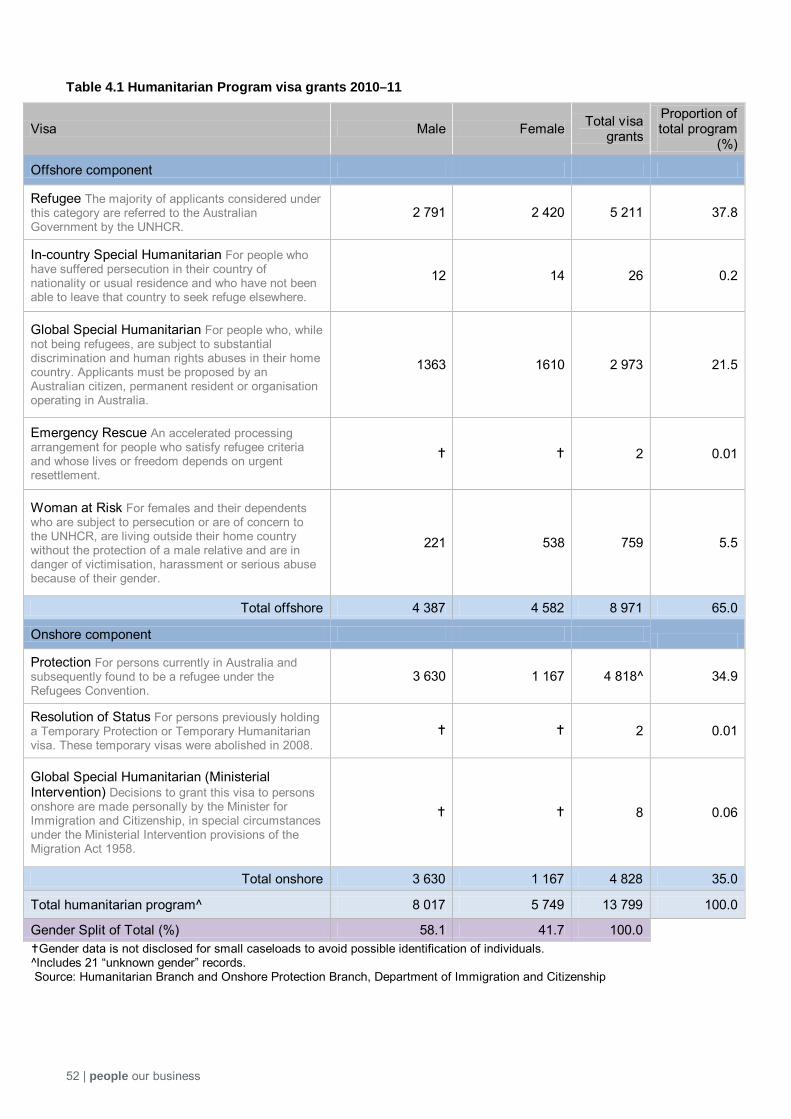
52 | people our business
Table 4.1 Humanitarian Program visa grants 2010–11
Visa Male Female Total visa grants
Proportion of total program
(%)
Offshore component
Refugee The majority of applicants considered under this category are referred to the Australian Government by the UNHCR.
2 791 2 420 5 211 37.8
In-country Special Humanitarian For people who have suffered persecution in their country of nationality or usual residence and who have not been able to leave that country to seek refuge elsewhere.
12 14 26 0.2
Global Special Humanitarian For people who, while not being refugees, are subject to substantial discrimination and human rights abuses in their home country. Applicants must be proposed by an Australian citizen, permanent resident or organisation operating in Australia.
1363 1610 2 973 21.5
Emergency Rescue An accelerated processing arrangement for people who satisfy refugee criteria and whose lives or freedom depends on urgent resettlement.
2 0.01
Woman at Risk For females and their dependents who are subject to persecution or are of concern to the UNHCR, are living outside their home country without the protection of a male relative and are in danger of victimisation, harassment or serious abuse because of their gender.
221 538 759 5.5
Total offshore 4 387 4 582 8 971 65.0
Onshore component Protection For persons currently in Australia and subsequently found to be a refugee under the Refugees Convention.
3 630 1 167 4 818^ 34.9
Resolution of Status For persons previously holding a Temporary Protection or Temporary Humanitarian visa. These temporary visas were abolished in 2008.
2 0.01
Global Special Humanitarian (Ministerial Intervention) Decisions to grant this visa to persons onshore are made personally by the Minister for Immigration and Citizenship, in special circumstances under the Ministerial Intervention provisions of the Migration Act 1958.
8 0.06
Total onshore 3 630 1 167 4 828 35.0
Total humanitarian program^ 8 017 5 749 13 799 100.0
Gender Split of Total (%) 58.1 41.7 100.0 Gender data is not disclosed for small caseloads to avoid possible identification of individuals.
^Includes 21 “unknown gender” records. Source: Humanitarian Branch and Onshore Protection Branch, Department of Immigration and Citizenship

people our business | 53
Table 4.2 Humanitarian Program visa grants 2010–11: top five source countries
Visa Top source countries* (grants)
1 2 3 4 5
Refugee Burma 1 289
Iraq 1 023
Bhutan 975
DR Congo 386
Afghanistan 289
In-country Special Humanitarian ** ** ** ** **
Global Special Humanitarian
Iraq 1 037
Afghanistan 604
Sri Lanka 211
Sudan 182
Iran 130
Emergency Rescue ** ** ** ** **
Woman at Risk DR Congo 128
Afghanistan 110
Burma 104
Iraq 90
Eritrea 56
Protection (IMA) Afghanistan 1 335
Stateless 481
Iran 333
Iraq 239
Sri Lanka 236
Protection (other) Iran 369
China 315
Pakistan 208
Zimbabwe 172
Egypt 142
*Refugee, In-country Special Humanitarian, Global Special Humanitarian, Emergency Rescue and Woman at Risk visas are measured by country of birth, whereas Protection visas are measured by country of citizenship. **Country of origin data is not disclosed for small caseloads as this may enable identification of individuals. IMA—irregular maritime arrival. Source: Humanitarian Branch and Onshore Protection Branch, Department of Immigration and Citizenship
As already mentioned, the onshore protection visa caseload comprises two distinct client cohorts: irregular
maritime arrivals and all others. Table 4.4 provides more information on Protection visa grants within these
cohorts.
In 2010–11, onshore Protection visa grants grew by 6.7 per cent, with 4 818 Protection visas granted, compared
with 4 516 in 2009–10. This growth was primarily felt in the irregular maritime arrival caseload, with visa grants
increasing by 27.2 per cent in 2010–11. This growth was accompanied by a 11.2 decrease in grants to other
onshore applicants. As table 4.4 shows, of the Protection visas granted in 2010–11, 2 696 (56.2 per cent) were
granted to irregular maritime arrivals, while 2 101 (43.8 per cent) were granted to other onshore persons. Both
client cohorts comprise significantly larger numbers of males than females.
Table 4.4 Onshore Protection visa grants 2009–10 and 2010–11
Client category 2009–10 2010–11 Male Female Total Male Female Total
Irregular maritime arrivals (IMA) 1 984 135 2 119 2 371 325 2 696 Other 1 403 964 2 367 1 259 842 2 101
Data adjustment* 30 21 Grand Total 3 387 1 099 4 516 3 630 1 167 4 818 IMA Gender Split (%) 93.6 6.4 100.0 87.9 12.1 100.0 Other Gender Split (%) 59.3 40.7 100.0 59.9 40.1 100.0 Total Gender Split (%) 75.5 24.5 100.0 75.7 24.3 100.0 Includes grants to primary applicants and dependents. *Data adjustment reflects visa grants with unattributed gender and arrival category. Source: Onshore Protection Branch, Department of Immigration and Citizenship

54 | people our business
4.3 Humanitarian Program places 2011–12
In 2011–12, Australia’s Humanitarian Program will remain at 13 750 places. This comprises 6 000 places
primarily for refugees, and 7 750 places for the special humanitarian and onshore protection programs.
4.4 Recent research: contributions of humanitarian entrants
In June 2011, a report by Professor Graeme Hugo into the economic, social and civic contributions of first and
second generation humanitarian entrants was released by the Minister for Immigration and Citizenship. Among
his findings were that humanitarian entrants:
provide an important demographic dividend due to their younger age profile, greater fertility and lower
emigration
increasingly settle outside the major cities, helping to address regional labour shortages
are prepared to work hard in low-skilled jobs to see their children succeed in Australia
respond to labour market barriers by setting up their own businesses and opening up linkages with
domestic and international markets
show a greater propensity to setting up their own businesses
play an important role in providing support networks and knowledge about settling into life in Australia for
new arrivals, and that
second generation humanitarian migrants have much higher levels of labour force engagement than the
first generation, and in many cases the level is higher than for second generation Australians.
Professor Hugo’s full report can be accessed here:
www.immi.gov.au/media/publications/research/_pdf/economic-social-civic-contributions-about-the-
research2011.pdf. A booklet that summarises Professor Hugo’s findings, prepared by the department, can be
found at: www.immi.gov.au/media/publications/research/_pdf/economic-social-civic-contributions-
booklet2011.pdf.

people our business | 55
Chapter 5: Irregular Migration and Visa Compliance

56 | people our business
5.1 Overview The Australian Government defines irregular migration as including persons:
who enter Australia without authority, for example through entry with fraudulent or no documents
who overstay their visas
who gain visas fraudulently, for example, through contrived marriages
who breach their visa conditions
whose entry to Australia is facilitated by people smugglers or traffickers. Australian citizens and permanent residents have the unrestricted right to reside in Australia and to travel freely
in and out of the country.3 Australia also has a universal visa system, meaning that all non-citizens, including
those from New Zealand,4 need a visa to enter and stay in Australia.
Australia’s universal visa system acts as a screening method, preventing the entry of persons who are identified
as posing a character, security or health risk to the Australian community. Health and character checking, in the
form of police clearances, health clearances or declaratory statements, are undertaken as part of a standard visa
application process.
The vast majority of people do comply with Australia’s immigration rules and enter Australia lawfully. Australia’s
compliance model is based on a four-stage approach, outlined in figure 5.1.
Figure 5.1 Australia’s immigration compliance model at a glance
Preventative activities
are aimed at maximising voluntary compliance. These activities include raising awareness of Australia’s immigration laws; ensuring that program settings, policies and processes encourage compliance; and early engagement with persons through the Community Status Resolution Service to proactively resolve their immigration status.
Deterrence activities
are targeted at those who might be considered non-compliant and who are opportunistic in their exploitation of the Migration Programs. In addition to having a preventative function, the department’s communication activities—including community outreach visits—ensures strong messaging around the consequences of non-compliance.
Detection activities
include information provided by the Australian community through the Immigration “Dob-in Line” and partnerships with Australian law enforcement agencies, other Commonwealth agencies, and a broad range of community organisations, including employers and unions.
Enforcement activities
are a last resort, and are aimed at those who are deliberately non-compliant and who seek to exploit Australia’s Migration Programs. The department has the authority to locate persons, cancel visas, and ultimately to detain and remove persons who refuse to regularise their status or depart Australia voluntarily when they no longer have the legal basis to remain.
3 Permanent residents living overseas need to obtain a resident return visa on a five year basis. 4 New Zealand citizens are granted a Special Category (subclass 444) visa on arrival, which entitles them to work and reside in Australia indefinitely.
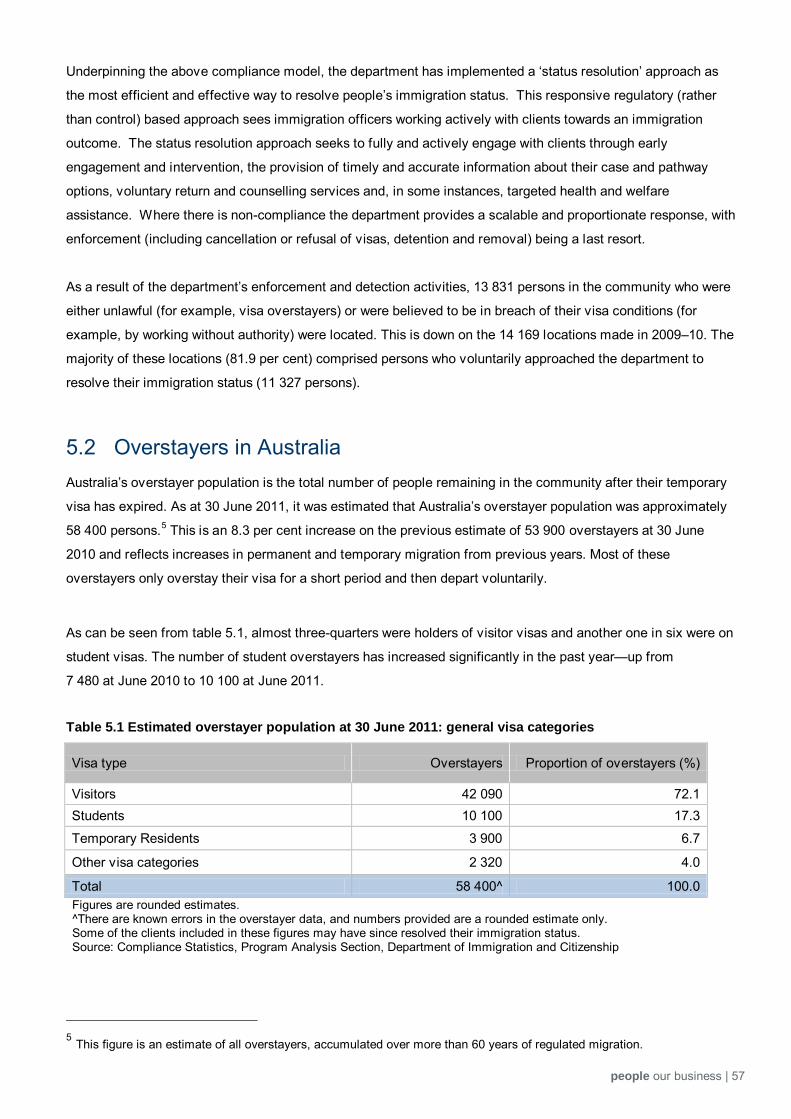
people our business | 57
Underpinning the above compliance model, the department has implemented a ‘status resolution’ approach as
the most efficient and effective way to resolve people’s immigration status. This responsive regulatory (rather
than control) based approach sees immigration officers working actively with clients towards an immigration
outcome. The status resolution approach seeks to fully and actively engage with clients through early
engagement and intervention, the provision of timely and accurate information about their case and pathway
options, voluntary return and counselling services and, in some instances, targeted health and welfare
assistance. Where there is non-compliance the department provides a scalable and proportionate response, with
enforcement (including cancellation or refusal of visas, detention and removal) being a last resort.
As a result of the department’s enforcement and detection activities, 13 831 persons in the community who were
either unlawful (for example, visa overstayers) or were believed to be in breach of their visa conditions (for
example, by working without authority) were located. This is down on the 14 169 locations made in 2009–10. The
majority of these locations (81.9 per cent) comprised persons who voluntarily approached the department to
resolve their immigration status (11 327 persons).
5.2 Overstayers in Australia Australia’s overstayer population is the total number of people remaining in the community after their temporary
visa has expired. As at 30 June 2011, it was estimated that Australia’s overstayer population was approximately
58 400 persons.5 This is an 8.3 per cent increase on the previous estimate of 53 900 overstayers at 30 June
2010 and reflects increases in permanent and temporary migration from previous years. Most of these
overstayers only overstay their visa for a short period and then depart voluntarily.
As can be seen from table 5.1, almost three-quarters were holders of visitor visas and another one in six were on
student visas. The number of student overstayers has increased significantly in the past year—up from
7 480 at June 2010 to 10 100 at June 2011.
Table 5.1 Estimated overstayer population at 30 June 2011: general visa categories
Visa type Overstayers Proportion of overstayers (%)
Visitors 42 090 72.1 Students 10 100 17.3
Temporary Residents 3 900 6.7
Other visa categories 2 320 4.0
Total 58 400^ 100.0 Figures are rounded estimates. ^There are known errors in the overstayer data, and numbers provided are a rounded estimate only. Some of the clients included in these figures may have since resolved their immigration status. Source: Compliance Statistics, Program Analysis Section, Department of Immigration and Citizenship
5 This figure is an estimate of all overstayers, accumulated over more than 60 years of regulated migration.

58 | people our business
Table 5.2 shows the estimated stock of overstayers at 30 June 2011 by country of citizenship. Given the
dominance of visitors among the overstayer cohort, countries that provide large numbers of visitors to Australia
feature prominently in this table.
US nationals, for example, were the second largest overstayer group in 2010–11, and also the second largest
provider of visitors to Australia over that period. Similarly, the UK was the largest source of visitors to Australia in
2010–11 and UK nationals were the fourth largest overstayer group. The situation with Chinese nationals is a
little different however. Chinese nationals were the largest overstayer group in 2010–11—this was because they
were the fourth largest contributor of visitors and the largest provider of international students during this year.
Indians were the fastest growing overstayer group—increasing 49.5 per cent from 2 200 at June 2010 to 3 290
at June 2011. This is related to the growth in student overstayers, which is likely to be a consequence of reduced
permanent migration pathways for international students.
It is estimated that collectively, OECD countries contributed 38.7 per cent of Australia’s overstayer population at
June 2011.
Table 5.2 Estimated overstayer population at 30 June 2011: top 10 source countries
Citizenship Overstayers at 30 June 2010
Overstayers at 30 June 2011
Change (%)
Proportion of overstayers in 2011 (%)
China (excludes SARs and Taiwan) 7 490 8 070 7.7 13.8 USA 5 010 5 080 1.4 8.7 Malaysia 3 890 4 260 9.5 7.3 UK 3 470 3 610 4.0 6.2 India 2 200 3 290 49.5 5.6 South Korea 2 570 2 730 6.2 4.7 Indonesia 2 460 2 580 4.9 4.4 Philippines 2 430 2 400 -1.2 4.1 Thailand 1 660 1 790 7.8 3.1 Vietnam 1 550 1 670 7.7 2.9 Other 21 130 22 970 8.7 39.3 Total^ 53 860 58 400^ 8.5 100.0 OECD countries are highlighted in orange. Figures are rounded estimates. ^Due to known errors in overstayer data, the total is not the same as the sum of data presented. Source: Compliance Statistics, Program Analysis Section, Department of Immigration and Citizenship
5.3 Visa cancellations
Under the Migration Act 1958, visas can be cancelled for non-compliance with visa conditions, including
overstaying, working without authority, or on the basis of character concerns (such as committing serious
criminal offences). When a person’s visa is cancelled, the person becomes an unlawful non-citizen and
arrangements are subsequently made for detention and removal from Australia. Visa cancellation is a last resort,
and the department seeks to assist in resolving a person’s immigration status in the first instance through the
Community Status Resolution Service (CSRS). More information on the CSRS can be found at
www.immi.gov.au/managing-australias-borders/compliance/community-status-resolution.

people our business | 59
In 2010–11, 39 620 visas were cancelled, a 2.6 per cent increase on the 38 633 visas cancelled in 2009–10.
In 2010–11, Indian citizens accounted for almost a quarter (24.9 per cent) of all cancellations. Citizens of OECD
countries accounted for 23.3 per cent of cancellations. Table 5.3 contains more information on the top 10 source
countries for visa cancellations in 2009–10 and 2010–11.
Table 5.3 Visa cancellations 2009–10 and 2010–11: top 10 source countries
Country of Citizenship
2009–10 2010–11
Male Female Total^ Cancellations Male Female Total^
Cancellations
Proportion of total 2010–11 cancellations
(%) India 5 604 2 551 8 156 6 956 2 915 9 871 24.9 UK 3 215 2 735 5 951 2 572 2 102 4 674 11.8 South Korea 1 232 913 2 145 1 517 1 140 2 657 6.7 USA 1 400 1 079 2 479 1 325 1 089 2 414 6.1 China (excludes SARs and Taiwan) 1 285 791 2 076 1 446 897 2 343 5.9
Malaysia 796 462 1 258 813 465 1 279 3.2 Canada 703 688 1 391 623 570 1 193 3.0 Ireland 576 599 1 175 518 481 999 2.5 Germany 604 484 1 088 472 431 903 2.3 France 465 350 815 498 320 818 2.1 Other (including unknown) 7 133 4 804 11 754 7 408 5 061 12 469 31.5
Total 23 013 15 616 38 633 24 148 15 471 39 620 100.0 OECD countries are highlighted in orange ^Totals include "unknown gender" records. Source: Compliance Statistics, Program Analysis Section, Department of Immigration and Citizenship
5.4 Compliance-related departures The department facilitates the departure of persons who have no entitlement to remain in Australia. In
2010–11, there were 10 175 returns and removals from Australia, an increase of 15.3 per cent on the 8 825
departures in 2009–10. These persons either:
left voluntarily as an assisted voluntary return or monitored departure—approximately 69 per cent, or
were forcibly removed or deported under section 198 of the Migration Act 1958.
Returns and removals generally apply to the following categories of unlawful non-citizens:
persons who have overstayed their visa
persons who have been refused a further visa or had their visa cancelled, including those whose visas
are cancelled on the basis of their criminal conduct
crews of vessels caught fishing illegally in Australian waters
persons who arrived in Australia without authorisation and have not been granted a visa to remain in
Australia (i.e. unauthorised and irregular arrivals).
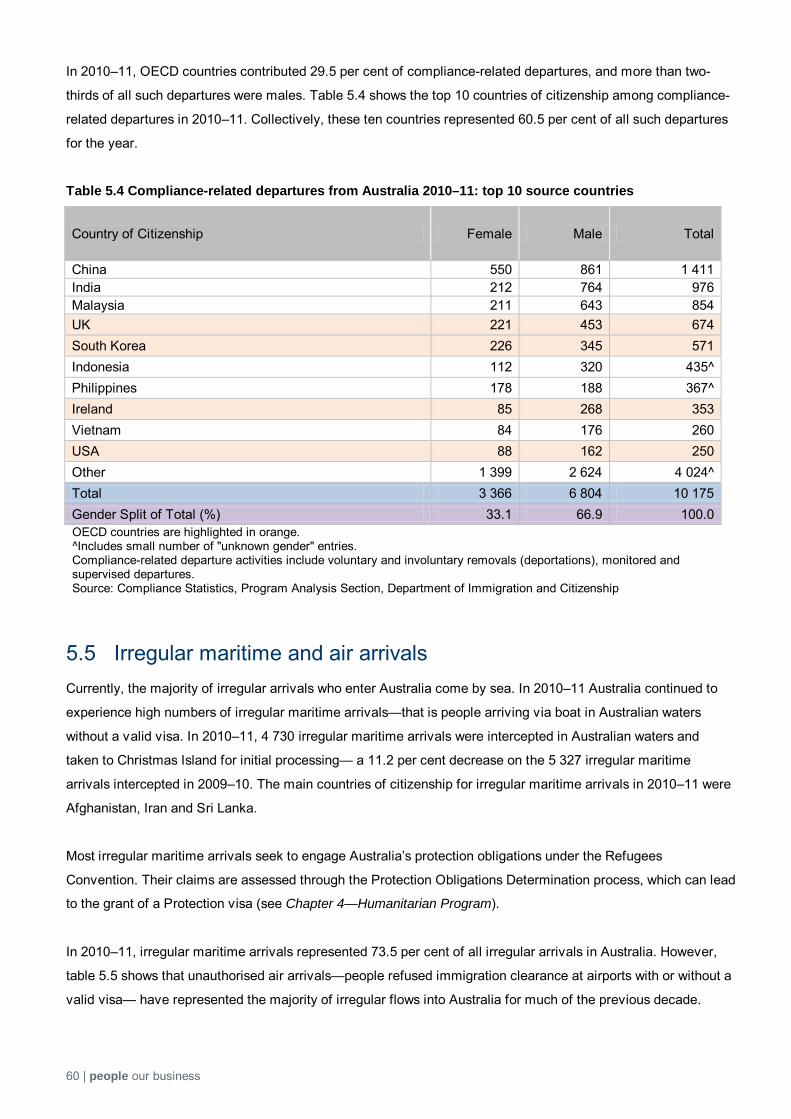
60 | people our business
In 2010–11, OECD countries contributed 29.5 per cent of compliance-related departures, and more than two-
thirds of all such departures were males. Table 5.4 shows the top 10 countries of citizenship among compliance-
related departures in 2010–11. Collectively, these ten countries represented 60.5 per cent of all such departures
for the year.
Table 5.4 Compliance-related departures from Australia 2010–11: top 10 source countries
Country of Citizenship Female Male Total
China 550 861 1 411 India 212 764 976 Malaysia 211 643 854 UK 221 453 674 South Korea 226 345 571 Indonesia 112 320 435^ Philippines 178 188 367^ Ireland 85 268 353 Vietnam 84 176 260 USA 88 162 250 Other 1 399 2 624 4 024^ Total 3 366 6 804 10 175 Gender Split of Total (%) 33.1 66.9 100.0 OECD countries are highlighted in orange. ^Includes small number of "unknown gender" entries. Compliance-related departure activities include voluntary and involuntary removals (deportations), monitored and supervised departures. Source: Compliance Statistics, Program Analysis Section, Department of Immigration and Citizenship
5.5 Irregular maritime and air arrivals Currently, the majority of irregular arrivals who enter Australia come by sea. In 2010–11 Australia continued to
experience high numbers of irregular maritime arrivals—that is people arriving via boat in Australian waters
without a valid visa. In 2010–11, 4 730 irregular maritime arrivals were intercepted in Australian waters and
taken to Christmas Island for initial processing— a 11.2 per cent decrease on the 5 327 irregular maritime
arrivals intercepted in 2009–10. The main countries of citizenship for irregular maritime arrivals in 2010–11 were
Afghanistan, Iran and Sri Lanka.
Most irregular maritime arrivals seek to engage Australia’s protection obligations under the Refugees
Convention. Their claims are assessed through the Protection Obligations Determination process, which can lead
to the grant of a Protection visa (see Chapter 4—Humanitarian Program).
In 2010–11, irregular maritime arrivals represented 73.5 per cent of all irregular arrivals in Australia. However,
table 5.5 shows that unauthorised air arrivals—people refused immigration clearance at airports with or without a
valid visa— have represented the majority of irregular flows into Australia for much of the previous decade.

people our business | 61
Table 5.5 Irregular maritime arrivals and unauthorised air arrivals 2002–03 to 2010–11
Year Irregular maritime arrivals Unauthorised air arrivals^
Total
Arrivals Proportion (%) Arrivals Proportion (%)
2002–03 0 0.0 937 100.0 937 2003–04 82 6.2 1 241 93.8 1 323 2004–05 0 0.0 2 058 100.0 2 058 2005–06 61 3.0 1 995 97.0 2 056 2006–07 133 7.3 1 678 92.7 1 811 2007–08 25 2.1 1 189 97.9 1 214 2008–09 985 43.4 1 284 56.6 2 269 2009–10 5 327 77.2 1 573 22.8 6 900 2010–11 4 730 72.8 1 768 27.2 6 498 ^These are persons refused immigration clearance at airports for any reason, including those who do not present with a valid visa or have their visa cancelled on arrival. Source: DIAC Annual Report 2010–11 and the DIAC submission to the Joint Select Committee on Australia’s Immigration Detention Network September 2011
For information on Protection visas granted to irregular maritime arrivals in 2010–11, see Chapter 4—
The Humanitarian Program.

62 | people our business
This page has been intentionally left blank.

people our business | 63
Chapter 6: Australia’s Population Native and overseas-born

64 | people our business
6.1 Overview Australia’s preliminary estimated resident population at the end of March 2011 was 22 546 300 persons. This was
an increase of 312 400 persons (1.2 per cent) since 31 March 2010. This growth in population is a result of two
factors:
Natural increase—the number of births less the number of deaths
Net overseas migration (NOM)—the net gain or loss of population through people arriving and
departing from Australia for 12 months or more in a 16 month period. In calculating NOM, the 12
months does not have to be continuous over the reference period. This means that an international
student who visits their home country only during semester breaks will be counted as a NOM arrival.
When they return to their home country at the end of their studies they will subsequently be counted
as a NOM departure.
The contribution to population growth for the year ended 31 March 2011 was higher for NOM (53.5 per cent) than
for natural increase (46.5 per cent). Natural increase for the year ended 31 March 2011 was 145 200 persons, a
decrease of 6.1 per cent, or 9 400 persons when compared with natural increase for the year ended 31 March
2010 (154 600 persons).
For the year ended 31 March 2011, Australia’s preliminary NOM estimate was 167 100 persons. This was 24.0
per cent (52 800 persons) lower than the NOM recorded for the year ended 31 March 2010 (220 000 persons).
Figure 6.1 also shows that NOM’s recent decline is leading to lower overall population growth. Australia's annual
population growth rate slowed to 1.4 per cent in the year ending March 2011, down from its peak growth rate of
2.2 per cent for the year ending December 2008. This is equal to the long term average since 1982.
The reason why NOM is currently outstripping natural population is Australia’s low fertility rate. Even though
fertility rates have shown some growth in recent years and is now at 1.9 births per woman (up from a low of 1.7
in 2001), it remains below replacement levels of 2.1 births per woman.

people our business | 65
Figure 6.1 Components of Australia’s population growth 1982 to 2010
Source: Australian Demographic Statistics (3101.0), Australian Bureau of Statistics
6.2 NOM forecasting model The department is working to implement a Long-Term Migration Planning Framework which looks at both
temporary and permanent migration flows over a multi-year period. 6 As part of this, the department is
forecasting NOM departures and arrivals, disaggregated by visa components and updating these forecasts on a
quarterly basis. The NOM forecasting model combines the latest data on visa grants with past behaviour of
migrants across different visa groups to enter the population. It includes the impact of existing policy decisions
(and assumed no change in policy settings) as well as Treasury’s forecasts for leading economic indicators.
Using this model, the department estimates that the level of NOM for the year ending September 2011 is
177 400. This represents a fall of 43.8 per cent from the December 2008 peak. The key driver behind the
expected fall in NOM is a much lower inflow of international students as well as higher student departures. The
reduction in international students is partly due to Australia's high exchange rate has made it a more expensive
destination for overseas students.
As most of the decline in NOM has been felt mostly in the international student sector, the share of NOM has
shifted towards both permanent and temporary skilled workers (Figure 6.2). The skilled component of NOM—
permanent Skill Stream visas and temporary Business Short Stay (subclass 457) visas—is projected to increase
its share from around 28 per cent in 2009–10 to 45 per cent by 2014–15.
In comparison, the share of NOM comprising temporary migrants with limited work rights—that is, international
students and working holiday makers—is expected to fall from a peak of 49 per cent in 2008–09 to 24 per cent
by 2014–15.
6 A copy of The Outlook for Net Overseas Migration–July 2011 can be found here: www.immi.gov.au/media/publications/statistics/immigration-update/nom-july11.pdf

66 | people our business
Figure 6.2 Changing composition of net overseas migration 2004–05 to 2014–15
Source: The Outlook for Net Overseas Migration July 2011, Department of Immigration and Citizenship
Beyond 2011 the projections are that NOM will recover and stabilise at between 190 000 and 200 000 (Figure
6.3). These projections take into account Treasury’s Economic Outlook from the 2011–12 Australian Government
Budget, as well as the progressive implementation of the recommendations of the Knight Review of the Student
Visa Program.7 The effects of these changes, including the roll-out of the post study work rights visa, are not
expected to be visible until late 2013. Therefore NOM forecasts from September 2013 account for a small but
steady increase in net student numbers as more students arrive and proportionally less students leave Australia.
Figure 6.3 Components of net overseas migration: 2004–05 to 2014–15
Source: The Outlook for Net Overseas Migration July 2011, Department of Immigration and Citizenship
7 See Chapter 1—Developments in Migration Policy.
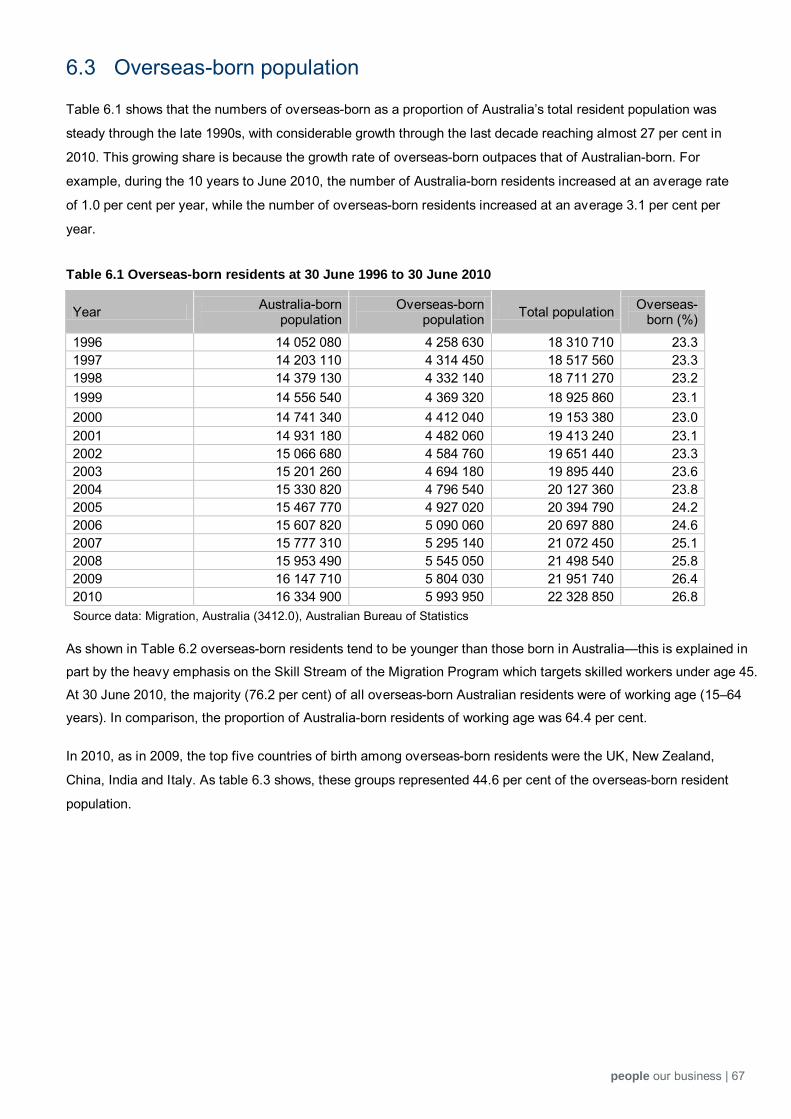
people our business | 67
6.3 Overseas-born population
Table 6.1 shows that the numbers of overseas-born as a proportion of Australia’s total resident population was
steady through the late 1990s, with considerable growth through the last decade reaching almost 27 per cent in
2010. This growing share is because the growth rate of overseas-born outpaces that of Australian-born. For
example, during the 10 years to June 2010, the number of Australia-born residents increased at an average rate
of 1.0 per cent per year, while the number of overseas-born residents increased at an average 3.1 per cent per
year.
Table 6.1 Overseas-born residents at 30 June 1996 to 30 June 2010
Year Australia-born population
Overseas-born population Total population Overseas-
born (%)
1996 14 052 080 4 258 630 18 310 710 23.3 1997 14 203 110 4 314 450 18 517 560 23.3 1998 14 379 130 4 332 140 18 711 270 23.2 1999 14 556 540 4 369 320 18 925 860 23.1 2000 14 741 340 4 412 040 19 153 380 23.0 2001 14 931 180 4 482 060 19 413 240 23.1 2002 15 066 680 4 584 760 19 651 440 23.3 2003 15 201 260 4 694 180 19 895 440 23.6 2004 15 330 820 4 796 540 20 127 360 23.8 2005 15 467 770 4 927 020 20 394 790 24.2 2006 15 607 820 5 090 060 20 697 880 24.6 2007 15 777 310 5 295 140 21 072 450 25.1 2008 15 953 490 5 545 050 21 498 540 25.8 2009 16 147 710 5 804 030 21 951 740 26.4 2010 16 334 900 5 993 950 22 328 850 26.8 Source data: Migration, Australia (3412.0), Australian Bureau of Statistics
As shown in Table 6.2 overseas-born residents tend to be younger than those born in Australia—this is explained in
part by the heavy emphasis on the Skill Stream of the Migration Program which targets skilled workers under age 45.
At 30 June 2010, the majority (76.2 per cent) of all overseas-born Australian residents were of working age (15–64
years). In comparison, the proportion of Australia-born residents of working age was 64.4 per cent.
In 2010, as in 2009, the top five countries of birth among overseas-born residents were the UK, New Zealand,
China, India and Italy. As table 6.3 shows, these groups represented 44.6 per cent of the overseas-born resident
population.

68 | people our business
Table 6.2 Overseas-born residents at 30 June 2010: age groups
Age Overseas-born ERP Australia-born ERP
Male (cumulative %)
Female (cumulative %)
Male (cumulative %)
Female (cumulative %)
0–4 1.0 0.9 8.9 8.3 5–9 3.2 3.0 16.6 15.7 10–14 6.0 5.7 24.5 23.0 15–19 10.1 9.4 32.4 30.6 20–24 18.2 16.7 39.9 37.6 25–29 27.3 25.5 46.9 44.4 30–34 35.4 33.6 53.4 50.7 35–39 43.1 41.6 60.5 57.7 40–44 51.2 49.9 67.0 64.2 45–49 59.8 58.7 73.4 70.6 50–54 67.7 66.9 79.4 76.7 55–59 74.9 74.3 84.8 82.1 60–64 82.5 81.6 89.5 86.9 65–69 88.2 87.0 92.9 90.5 70–74 92.8 91.5 95.5 93.3 75 and over 100.0 100.0 100.0 100.0 Gender % of total population 13.3 13.5 36.4 36.7 % of population under 15 0.8 0.8 8.9 8.5 % of population 15–64 10.2 10.3 23.7 23.4 % of population over 65 2.3 2.5 3.8 4.8 Grand total ERP 22 329 830 ERP: Estimated Resident Population Source: Migration, Australia (3412.0), Australian Bureau of Statistics
Over the past decade the share of UK-born among the overseas-born population fell from 5.9 per cent in 2000 to
5.3 per cent in 2010. There was also a decline in share of persons born in Italy (from 1.3 per cent to 1.0 per
cent). Conversely, the proportions increased for people born in New Zealand (from 1.9 per cent to 2.4 per cent),
China (from 0.8 per cent to 1.7 per cent) and India (from 0.5 per cent to 1.5 per cent).

people our business | 69
Table 6.3 Overseas-born residents 30 June 2010: top five countries of birth
Country of birth Estimated number Proportion of overseas-born (%)
Proportion of total ERP^ (%)
UK 1 192 878 19.9 5.3 New Zealand 544 171 9.1 2.4
China (excludes SARS and Taiwan) 379 776 6.3 1.7
India 340 604 5.7 1.5 Italy 216 303 3.6 1.0 Total top five 2 673 732 44.6 12.0 Other 3 320 218 55.4 14.9
Total overseas-born 5 993 950 100.0 26.8
^Based on figure of 22 328 850 total ERP at 30 June 2010 OECD countries are highlighted in orange. Source data: Migration, Australia (3412.0), Australian Bureau of Statistics
The ratio of males to females among the overseas-born population at 30 June 2010 was 98.8 males per hundred
females. This is roughly equivalent to the 98.6 males per hundred females among the overseas-born population who
were born in an OECD country, and slightly less than the 99.8 males per hundred females among the Australia-born
population. However as table 6.4 shows with the exception of China all of the top five countries of birth among the
overseas-born population comprise more males than females.
Table 6.4 Overseas-born residents at 30 June 2010: gender ratio
Birthplace Males per 100 females
Top five birth countries^ UK 103.4 New Zealand 105.5 China (excluding SARs and Taiwan) 84.2 India 140.8 Italy 106.8 Other cohorts Overseas-born (OECD-born) average 98.6 Overseas-born (non-OECD) average 100.7 Overseas-born (all birthplaces) average 98.8 Australia-born average 99.8 Total population average 99.2 OECD countries are highlighted in orange. ^Refers to top five birth countries of total ERP (see table 6.3) Source data: Migration, Australia (3412.0), Australian Bureau of Statistics

70 | people our business
This page has been intentionally left blank.
people our business | 71
Chapter 7: Emigration and Return Migration
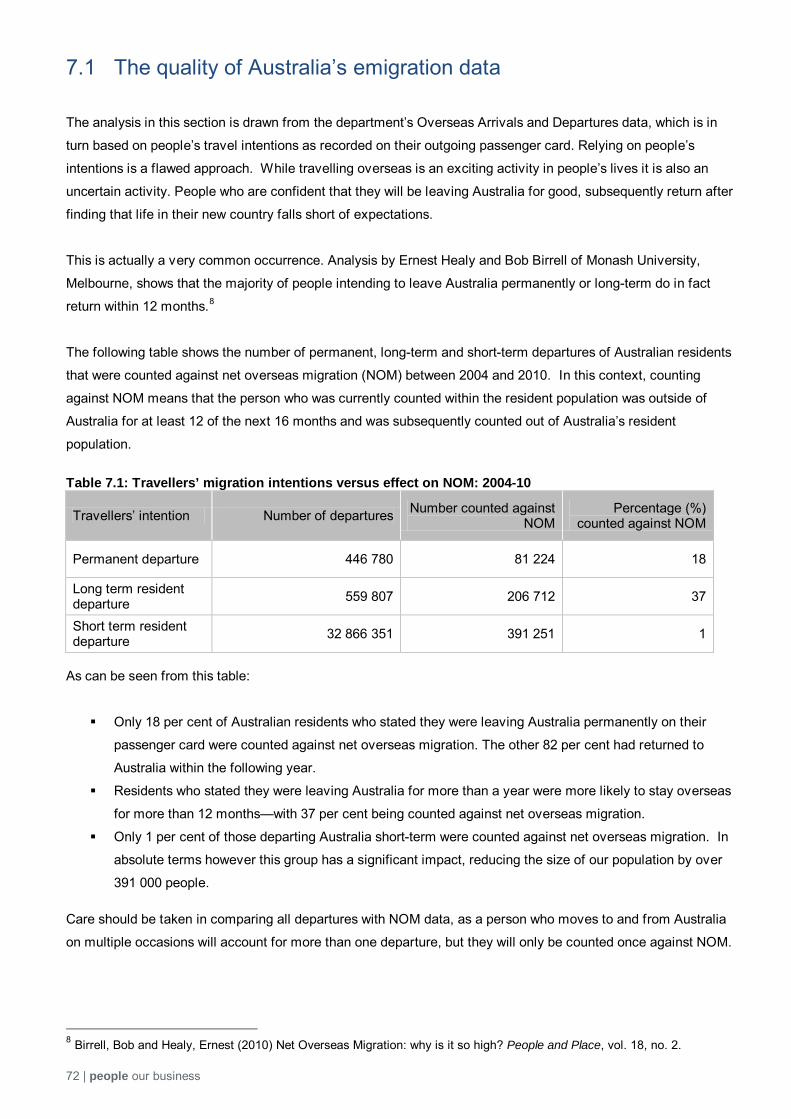
72 | people our business
7.1 The quality of Australia’s emigration data The analysis in this section is drawn from the department’s Overseas Arrivals and Departures data, which is in
turn based on people’s travel intentions as recorded on their outgoing passenger card. Relying on people’s
intentions is a flawed approach. While travelling overseas is an exciting activity in people’s lives it is also an
uncertain activity. People who are confident that they will be leaving Australia for good, subsequently return after
finding that life in their new country falls short of expectations.
This is actually a very common occurrence. Analysis by Ernest Healy and Bob Birrell of Monash University,
Melbourne, shows that the majority of people intending to leave Australia permanently or long-term do in fact
return within 12 months.8
The following table shows the number of permanent, long-term and short-term departures of Australian residents
that were counted against net overseas migration (NOM) between 2004 and 2010. In this context, counting
against NOM means that the person who was currently counted within the resident population was outside of
Australia for at least 12 of the next 16 months and was subsequently counted out of Australia’s resident
population.
Table 7.1: Travellers’ migration intentions versus effect on NOM: 2004-10
Travellers’ intention Number of departures Number counted against NOM
Percentage (%) counted against NOM
Permanent departure 446 780 81 224 18
Long term resident departure 559 807 206 712 37
Short term resident departure 32 866 351 391 251 1
As can be seen from this table:
Only 18 per cent of Australian residents who stated they were leaving Australia permanently on their
passenger card were counted against net overseas migration. The other 82 per cent had returned to
Australia within the following year.
Residents who stated they were leaving Australia for more than a year were more likely to stay overseas
for more than 12 months—with 37 per cent being counted against net overseas migration.
Only 1 per cent of those departing Australia short-term were counted against net overseas migration. In
absolute terms however this group has a significant impact, reducing the size of our population by over
391 000 people.
Care should be taken in comparing all departures with NOM data, as a person who moves to and from Australia
on multiple occasions will account for more than one departure, but they will only be counted once against NOM.
8 Birrell, Bob and Healy, Ernest (2010) Net Overseas Migration: why is it so high? People and Place, vol. 18, no. 2.

people our business | 73
Despite these significant shortcomings, we have used DIAC data in this section because while data from the
ABS is more accurate it does not provide an estimate of permanent departures. The ABS data is also less timely
as measuring return migration delays the release of the data.
7.2 Emigration by birthplace In 2010–11, 88 461 persons indicated that they were departing Australia permanently, representing a
1.2 per cent increase on the 86 277 emigrants recorded in 2009–10. While this is the largest on record and the 16th
annual increase in a row, this growth is less than in 2009–10, which saw a 6.5 per cent increase on 2008–09 levels.
In recent years around half of all emigrants have been people born outside Australia—that is, former migrants
themselves. This trend continued to 2010–11 with 44 045 Australia-born and 44 416 overseas-born emigrants. More
than half of all overseas born emigrants were from either New Zealand (8 115 emigrants), UK (7 173 emigrants) or
China (5 796 emigrants).
Table 7.1 Emigrants 2009–10 and 2010–11: main source countries
Country of birth 2009–10 2010–11 Per cent change (%)
Australia 42 570 44 045 1.7 New Zealand 8 744 8 115 -3.7 UK 7 127 7 173 0.3 China (excludes SARs and Taiwan) 5 550 5 796 2.2 Hong Kong (SAR of China) 2 407 2 669 5.2 Vietnam 1 350 1 340 -0.4 USA 1 261 1 196 -2.6 Other 17 268 18 127 2.4 Total 86 277 88 461 1.2
OECD countries are highlighted in orange. Source: Overseas Arrivals and Departures data, Department of Immigration and Citizenship
7.3 Emigration by destination The most common destinations for emigrants are shown in table 7.2. Three things are notable from this table.
More than half (51.6 per cent of all emigrants) went to the UK, New Zealand, USA or Singapore. This is
consistent with 2009–10 levels, with New Zealand and British emigrants swapping places in 2010–11.
In 2010–11, New Zealand remained the most popular destination for overseas-born emigrants (9 319),
while UK was the most popular destination for Australia-born emigrants (9 242)
In 2010–11, as for previous years, Australian-born emigrants significantly outnumbered those born
overseas among those emigrating to the UK, USA, Canada or the United Arab Emirates.

74 | people our business
Table 7.2 Emigrants 2010–11: main destinations
Destination Australia-born Overseas-born Total Proportion
overseas-born (%)
UK 9 242 5 877 15 119 38.9 New Zealand 5 276 9 319 14 595 63.9 USA 5 559 2 486 8 045 30.9 Singapore 4 145 2 807 6 952 40.4 Hong Kong (SAR of China) 2 546 4 089 6 635 61.6 China (excludes SARs and Taiwan) 1 234 4 507 5 741 78.5 United Arab Emirates 2 297 1 060 3 357 31.6 Canada 1 387 782 2 169 36.1 Indonesia 903 837 1 740 48.1 Thailand 810 915 1 725 53.0 Malaysia 640 753 1 393 54.1 Japan 759 615 1 374 44.8 Vietnam 408 883 1 291 68.4 Other 8 835 9 478 18 313 51.8 Total^ 44 041 44 408 88 449 50.2 OECD countries are highlighted in orange. ^Excludes countries and destinations 'not stated'. Source: Overseas Arrivals and Departures data, Department of Immigration and Citizenship
Table 7.3 shows the variation in repatriation rates between different birthplace groups. In 2010–11, over
80 percent of New Zealand-born emigrants returned to New Zealand, while just under 20 per cent of South
African-born emigrants returned to their country of birth.
Table 7.3 Emigrant repatriation rates 2010–11: selected birthplaces
Birthplace Emigrating to country of birth
Emigrating to another country
Proportion emigrating to country of birth (%)
New Zealand 6 501 1 613 80.1 UK 4 078 3 095 56.9 China (excludes SARs and Taiwan) 3 939 1 857 68.0 Hong Kong (SAR of China) 2 027 642 75.9 Vietnam 774 566 57.8 USA 864 332 72.2 Taiwan 701 290 70.7 Malaysia 288 682 29.7 India 345 568 37.8 South Africa 161 653 19.8
OECD countries are highlighted in orange. Source: Overseas Arrivals and Departures data, Department of Immigration and Citizenship

people our business | 75
6.4 Characteristics of emigrants For both Australian and overseas cohorts, male emigrants slightly outnumbered female emigrants in 2010–11.
This slight difference is a continuation of a trend dating back to 1999–2000.
Although the gender balance is similar for both the Australia and overseas-born cohort, Australian-born
emigrants do tend to be younger than emigrants born overseas. In 2010–11, 80.1 per cent of Australian-born
emigrants were aged under 45 compared with 65.7 percent for the overseas-born.
Table 7.4 shows that Australia-born emigrants were also more likely to be in the labour market and engaged in
skilled employment than those born overseas. In 2010–11, 85.2 per cent of Australian-born emigrants aged 15–
64 were employed, with just over two-thirds of those working being employed in either managerial or professional
roles. In comparison, the employment rate for overseas-born emigrants was 73.5 per cent, with just under two-
thirds having professional or managerial occupations. The employment rate among both Australia-born and
overseas-born emigrants decreased on 2009–10 levels, with a drop of 2.5 and 2.3 percentage points,
respectively.

76 | people our business
Table 7.4 Characteristics of Emigrants 2010–11
Characteristic Australia-born (%) Overseas-born (%) Overall (%)
Gender Male 52.8 50.3 51.5 Female 47.2 49.7 48.5 Age 0–4 Years 9.1 6.2 7.6 5–9 Years 5.9 4.6 5.2 10–14 Years 3.8 3.6 3.7 15–19 Years 2.2 3.5 2.9 20–24 Years 4.8 5.3 5.1 25–29 Years 13.5 10.2 11.9 30–34 Years 15.8 11.5 13.6 35–39 Years 14.6 11.0 12.8 40–44 Years 10.4 9.7 10.1 45–49 Years 7.2 9.3 8.3 50–54 Years 5.4 8.1 6.7 55–59 Years 3.9 6.1 5.0 60–64 Years 1.9 4.2 3.1 65+ Years 1.5 6.6 4.1 Occupation profile (emigrants aged 15–64) Managers 18.1 15.1 16.6 Professionals 39.6 27.5 33.6 Technicians and Trades Workers 4.8 6.8 5.8 Community and Personal Service Workers 6.0 4.0 5.0 Clerical and Administrative Workers 5.8 5.0 5.4 Sales Workers 3.6 3.6 3.6 Machinery Operators and Drivers 0.7 1.9 1.3 Labourers 0.9 2.3 1.6 Inadequately Described 5.7 7.3 6.5 Not in Labour Force 12.8 21.1 16.9 Not in Employment 0.5 1.4 1.0 Not Stated 1.5 4.0 2.8 Summary Employment rate of emigrants aged 15–64 (%) 85.2 73.5 79.3
Proportion of emigrants aged 15–64 employed as professionals / managers (%) 72.6 64.4 68.9
Source: Overseas Arrivals and Departures data, Department of Immigration and Citizenship

people our business | 77
7.5 Return migration Between 2000–01 and 2010–11, emigration of overseas-born increased by 92 per cent. However, as figures 7.1
and 7.2 show, this increase is strongly correlated with growing migration levels and long-term resident returns.
Figure 7.1 Emigration and Immigration 1996–97 to 2010–11
Source: Overseas Arrivals and Departures data and Permanent Additions data, Department of Immigration and Citizenship
In 2010–11, 115 056 Australian residents who had lived overseas for one year or more indicated on their
incoming passenger card that they were returning to Australia permanently. This is a slight decrease on the
115 354 resident returns in 2009–10.
Figure 7.2 Long-term residents returning to Australia: 2004–05 to 2010–11
Source: Overseas Arrivals and Departures data, Department of Immigration and Citizenship

78 | people our business
This page has been left intentionally blank.
people our business | 79
Chapter 8: Naturalisation Conferral of Australian Citizenship

80 | people our business
8.1 Overview
Citizenship by conferral is the most common method for migrants to acquire Australian citizenship. This
application pathway is open to:
migrants with permanent residence
spouses or partners of Australian citizens
New Zealand citizens living in Australia
children of former Australian citizens
Commonwealth Child Migration Scheme arrivals9
refugee or humanitarian entrants
persons born in Papua before independence in 1975.
The other modes of naturalisation are citizenship by descent (for those born overseas to an Australian citizen),
citizenship by adoption (for those adopted by an Australian citizen) and citizenship by resumption (for those
who previously lost or gave up their Australian citizenship). The total number of people approved as Australian
citizens in 2010–11, including by conferral, descent and resumption was 101 780. This chapter focuses on the
largest naturalisation stream—citizenship by conferral.
Migrants seeking citizenship by conferral are required to satisfy a range of criteria. The General Eligibility
provisions—under which most migrants apply—require applicants to:
hold an Australian permanent residence visa
have been resident in Australia for a prescribed period of time10
be of good character
have an understanding of the rights and responsibilities of Australian citizenship, demonstrated through
the successful completion of a citizenship test
be likely to reside, or to continue to reside in Australia or to maintain a close and continuing association
with Australia.
A total of 95 284 people were conferred Australian citizenship in 2010–11, 20.5 per cent less than in
2009–10. This decrease in applications is likely due to the cessation of transitional residence requirements at the
end of June 2010. Under these arrangements, migrants who were permanent residents before 1 July 2007
needed to be residing in Australia for two years as a permanent resident in the five years immediately before
applying. From 1 July 2010, all applicants must have been living in Australia lawfully for four years, including 12
months as a permanent resident immediately before applying for citizenship.
9 Unaccompanied children, mostly from the UK and Malta, arrived in Australia under this scheme between 22 September 1947 and 31 December 1967. 10 In or der t o m eet t he r esidence r equirement, persons who appl y f or Australian citizenship on or after 1 July 2007 must have been lawfully resident in Australia for 4 y ears i mmediately be fore appl ying, i ncluding 12 m onths as a pe rmanent resident immediately before applying.
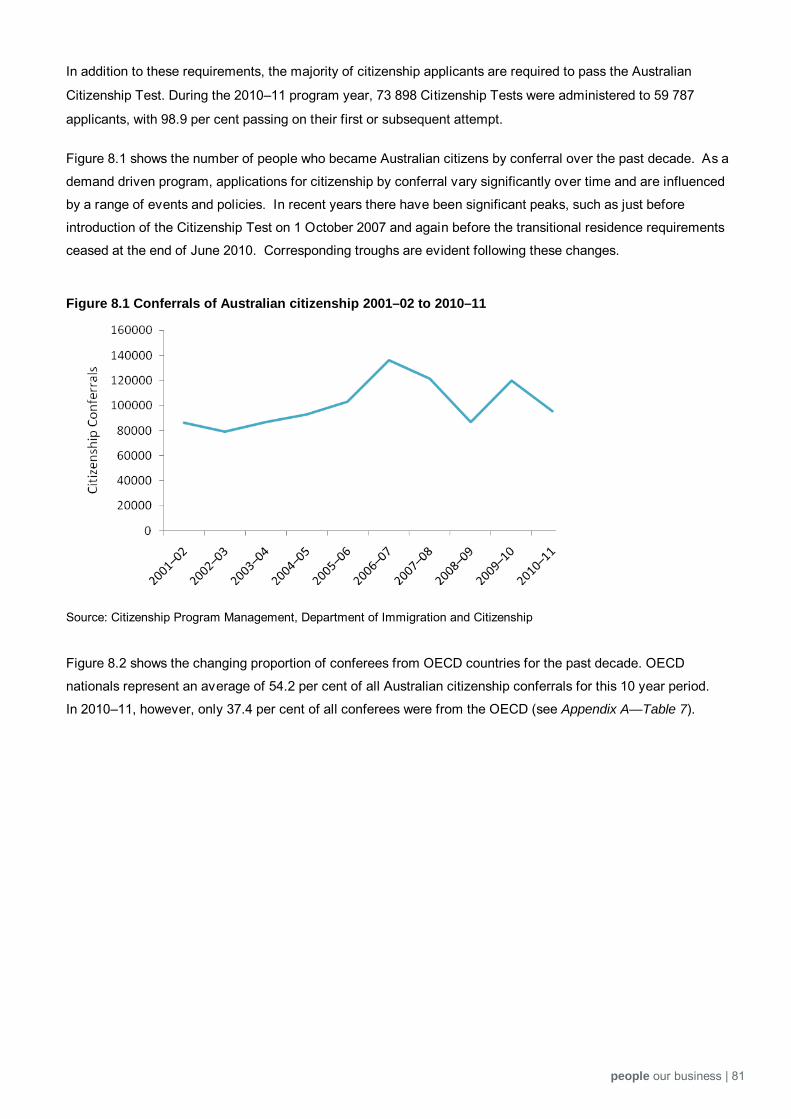
people our business | 81
In addition to these requirements, the majority of citizenship applicants are required to pass the Australian
Citizenship Test. During the 2010–11 program year, 73 898 Citizenship Tests were administered to 59 787
applicants, with 98.9 per cent passing on their first or subsequent attempt.
Figure 8.1 shows the number of people who became Australian citizens by conferral over the past decade. As a
demand driven program, applications for citizenship by conferral vary significantly over time and are influenced
by a range of events and policies. In recent years there have been significant peaks, such as just before
introduction of the Citizenship Test on 1 October 2007 and again before the transitional residence requirements
ceased at the end of June 2010. Corresponding troughs are evident following these changes.
Figure 8.1 Conferrals of Australian citizenship 2001–02 to 2010–11
Source: Citizenship Program Management, Department of Immigration and Citizenship
Figure 8.2 shows the changing proportion of conferees from OECD countries for the past decade. OECD
nationals represent an average of 54.2 per cent of all Australian citizenship conferrals for this 10 year period.
In 2010–11, however, only 37.4 per cent of all conferees were from the OECD (see Appendix A—Table 7).

82 | people our business
Figure 8.2 Conferrals of Australian citizenship 2001–02 to 2010–11: OECD share
Source: Citizenship Program Management, Department of Immigration and Citizenship
Table 8.1 shows the top 15 original countries of citizenship of people who were conferred Australian citizenship
in 2010–11. Consistent with recent trends, the UK continues to provide the highest number of new citizens to
Australia, followed by India and China. These three source countries represented 42.9 per cent of all conferees in
2010–11, similar to the 43.2 per cent in 2009–10, and above the 37.0 per cent in 2008–09.
Table 8.1 Citizenship conferrals 2010–11: top 15 countries of original citizenship
Country of original citizenship Male Female Total conferees
Proportion of all conferees
(%)
Proportion female (%)
UK 9 939 9 162 19 101 20.0 48.0 India 7 930 5 018 12 948 13.6 38.8 China 3 746 5 152 8 898 9.3 57.9 South Africa 2 212 2 177 4 389 4.6 49.6 New Zealand 2 120 2 184 4 304 4.5 50.7 Philippines 1 681 2 370 4 051 4.3 58.5 Sri Lanka 1 339 1 181 2 520 2.6 46.9 South Korea 1 058 1 263 2 321 2.4 54.4 Malaysia 1 023 1 184 2 207 2.3 53.6 Vietnam 573 1 115 1 688 1.8 66.1 USA 826 854 1680 1.8 50.8 Indonesia 555 794 1349 1.4 58.9 Thailand 327 1016 1343 1.4 75.7 Ireland 733 569 1302 1.4 43.7 Bangladesh 656 522 1178 1.2 44.3 Other countries 12 415 13 590 26 005 27.3 52.3 Grand Total 47 133 48 151 95 284 100 50.5 OECD countries are highlighted in orange.

people our business | 83
8.2 Rates of citizenship acquisition At the time of the 2006 Census there were almost three million migrants living in Australia who had acquired
citizenship—a citizenship rate of 68 per cent. This is 20 percentage points higher than the OECD average,
slightly lower than Canada’s 75 per cent and well above the US rate of 48 per cent.
However this rate does not factor in the time it takes for a person to become ‘residentially eligible’ for citizenship,
nor does it account for the number of temporary entrants who, because they are in Australia for 12 months or
more, are counted in the Census population. By taking these two factors into consideration we get a much
higher citizenship rate of 80 per cent. This figure will be updated next year when results from the 2011 Census
become available.
Analysis by nationality reveals a lot of variation in the take-up rate of Australian citizenship among migrants from
different countries. Migrants born in India and China have a low-take up rate because at the time of the Census
many of their migrants were relatively recent arrivals who had not yet met citizenship residency requirements.
Since then many have become citizens—with 12 948 former citizens of India and 8 898 former citizens of China
being conferred citizenship in 2010–11. This made India and China the second and third largest provider of new
Australian citizens during this period.
The absence of dual citizenship arrangements may explain low take-up rates for migrants from Japan (15 per
cent) and Singapore (55 per cent). This is consistent with data from the second Longitudinal Survey of
Immigrants in Australia conducted in 2003 which shows that the two most common reasons for not wanting to
take up Australian citizenship were to retain citizenship of their home country and to keep their current passport.
Migrants from the UK also have relatively low take-up rates. Many of these migrants have been in Australia a
long time, and provided they were on the electoral roll before January 1984, enjoy all the rights of Australian
citizens including the right to vote in federal elections (a right that is not extended to other countries).
Furthermore, because Australia did not allow dual citizenship until 2002, many older UK migrants who were
initially reluctant to give up their UK citizenship may now see little point in acquiring Australian citizenship at this
stage in their lives.
The limited citizenship pathways for New Zealanders who came to Australia following the introduction of the
bilateral social security arrangements in 2001 have contributed to their low citizenship take-up rates. Under these
arrangements New Zealanders who first arrived in Australia after February 2001 need to satisfy the criteria for
skilled or family reunion migration and then formally apply if they want to gain permanent residence and obtain
Australian citizenship. On the other hand New Zealanders who arrived before this date probably have less
motivation to become citizens than most other nationalities as they receive all the benefits of permanent
residence and they can continue to move freely to and from New Zealand and maintain strong connections with
their home country.

84 | people our business
Cette page a été laissée en blanc intentionnellement.

people our business | 85
Chapter 9: Diversity and Integration An introduction to Australia’s multicultural and settlement
policies

86 | people our business
9.1 Multiculturalism in Australia
Australia’s Multicultural Policy—The People of Australia— was launched on 16 February 2011.11 The policy
clearly states that Australia celebrates and values the benefits of cultural diversity for all Australians within the
broader aims of national unity, community harmony and maintenance of our democratic values. It also makes an
important statement that all Australians are entitled to celebrate, practise and maintain their cultural heritage and
language within the law and free from discrimination. The policy includes several important new initiatives,
outlined below.
9.1.2 The Australian Multicultural Council (AMC)
The AMC was launched on 22 August 2011. It is a permanent and independent body which will:
advise the government on multicultural affairs
have a formal role in a strengthened access and equity strategy
have a research advisory role around multicultural policy
assist with cultural diversity celebrations and Harmony Day activities
implement the ‘People of Australia’ Ambassadors’ program to articulate the benefits of and help
celebrate our multicultural nation.
9.1.3 The National Anti-Racism Partnership and Strategy
The National Anti-Racism Partnership and Strategy will be led by the Australian Human Rights Commission and
a new full-time Race Discrimination Commissioner. It will have five key areas of effort:
research and consultation
education resources
public awareness
youth engagement and
ongoing evaluation.
9.1.4 Multicultural Arts and Festivals Grants
The new Multicultural Arts and Festivals Grants program provides opportunities for Australians of all
backgrounds to come together and experience different cultural activities, and encourage social cohesion and
mutual understanding.
11 See www.immi.gov.au/living-in-australia/a-multicultural-australia/multicultural-policy

people our business | 87
9.1.5 The Multicultural Youth Sports Partnership Program
The new Multicultural Youth Sports Partnership Program provides opportunities for young people from new and
emerging communities, including young refugees, to connect and be involved with local sports and community
organisations. It will complement and strengthen existing initiatives and be consistent with the Government’s
National Strategy for Young Australians which envisions all young Australians growing up safe, healthy, happy
and resilient.
9.1.6 Strengthened Access and Equity Framework
The Australian Government’s access and equity framework is based on the principle that all Australians should
be able to access government programs and services equitably, regardless of their cultural, linguistic or religious
backgrounds.
To ensure that government programs and services are responsive to Australians from culturally and linguistically
diverse backgrounds, the Government will strengthen the access and equity framework by conducting an inquiry
into the responsiveness of Australian Government services to clients disadvantaged by cultural or linguistic
barriers.
9.2 Settlement and integration in Australia
The Australian Government works to ensure that eligible migrants and humanitarian entrants can become
contributing members of the Australian community as quickly as possible through the provision of settlement
services. This support is targeted to new arrivals most in need, particularly refugees and humanitarian entrants in
their first five years. These services and programs are outlined below.
9.2.1 The Australian Cultural Orientation (AUSCO) program
The Australian Cultural Orientation (AUSCO) program is the beginning of the settlement journey for refugee and
humanitarian visa holders preparing to settle in Australia. It is delivered overseas before they travel to Australia,
and provides an initial introduction to aspects of Australian life which will enhance entrants' settlement prospects,
help create realistic expectations for their life in Australia and help entrants learn about Australian culture prior to
arrival. AUSCO supplements the on-arrival services provided through the Humanitarian Settlement Services
(HSS).
In 2010–11, 351 AUSCO courses were delivered to 5 275 participants in their own languages in Bangladesh,
Egypt, Eritrea, Ethiopia, Ghana, Guinea, India, Indonesia, Iran, Jordan, Kenya, Lebanon, Malaysia, Nepal,
Pakistan, Romania, Rwanda, the Republic of Congo, Sierra Leone, Sudan, Syria, Tanzania, Thailand, Turkey,
Uganda, Zambia and Zimbabwe.
88 | people our business
9.2.2 Humanitarian Settlement Services (HSS)
Humanitarian Settlement Services (HSS) provides intensive settlement support, through a coordinated case
management approach, to newly-arrived humanitarian clients on arrival and throughout their initial settlement
period. Support through the HSS program is tailored to individual needs, including the specific needs of young
people. HSS endeavours to strengthen the ability of humanitarian clients to participate in the economic and
social life of Australia, and to equip individuals with the skills and knowledge to independently access services
beyond the initial settlement period.
9.2.3 Adult Migrant English Program (AMEP)
The Australian Government encourages eligible migrants and humanitarian entrants to undertake free English
language tuition through the Adult Migration English Program (AMEP). The AMEP aims not only to assist
migrants becoming independent and to participate fully in Australian life, but also provides pathways to finding
employment, training or further education and applying for citizenship.
The AMEP complements the AUSCO and HSS programs and is available to eligible migrants from the
humanitarian, family and skilled visa streams who do not have functional English. All AMEP clients have access
to up to 510 hours of English language courses in their first five years of settlement in Australia.
In 2010–11, AMEP services were provided to 55 134 clients. This is a 3.8 per cent decrease on 2009–10 when
57 343 received AMEP services. Of the client group in 2010–11, 66 per cent were women and 74.5 per cent
were aged between 16 and 44 years. Fifty-five per cent of clients were family entrants, 27 per cent were
humanitarian entrants and 18 per cent were dependents of skilled migrant entrants. Twenty per cent indicated
they had seven years or less of formal education. Clients came from 191 countries and the top three languages
spoken were Mandarin (20 per cent), Arabic (10 per cent) and Vietnamese (7 per cent).
9.2.4 Diversity and Social Cohesion Program (DSCP)
The Diversity and Social Cohesion Program (DSCP) aims to provide an environment in which all Australians can
develop a sense of belonging by providing opportunities to participate and contribute to Australian society. This
work is undertaken through initiatives that address cultural, racial and religious intolerance by promoting respect,
fairness and a sense of belonging for everyone. It also includes projects which develop the community capacity
building skills of specific community groups under significant pressure due to their cultural, religious or racial
diversity.
Generally, funding for individual projects of up to A$50 000 is available to incorporated, not for profit
organisations seeking to address an issue involving prejudices which might lead to racial discrimination, and
which affects social cohesion and community harmony in the local area. Projects are aimed at providing
opportunities for interaction between members of different communities and for all people to participate in
Australian social and cultural life.
people our business | 89
9.2.5 Settlement Grants Program (SGP) The Settlement Grants Program (SGP) is a national grants program that aims to help eligible migrants to
become self-reliant and participate equitably in Australia society as soon as possible after their arrival. In
addition to providing settlement services for eligible migrants it encourages referrals and cooperation among
other government services to achieve better client outcomes.
In 2010–11 the settlement service providers delivered the following services:
• Orientation to Australia—activities to promote self-reliance in individuals and families through the
development of Australian life skills. Orientation may take the form of providing information or referrals to
appropriate agencies and casework with individuals and families.
• Developing Communities—activities to assist communities to identify common goals and interests, develop
a shared purpose and promote a sense of identity and belonging.
• Integration, inclusion and participation—activities to promote inclusion and participation in Australian society
by encouraging partnership initiatives with mainstream community and government organisations.
9.2.6 Complex Case Support (CCS)
Some humanitarian entrants have significant and particularly complex needs that affect their settlement and
participation in Australian society. These migrants are eligible to receive specialised and intensive case
management services under the Complex Case Support (CCS) Program.
Like the HSS program, eligibility for CCS services extends to all humanitarian entrants, including Refugee and
Protection visa holders. These clients are eligible for CCS services for up to five years after their arrival in
Australia, and there is provision to extend this timeframe in exceptional circumstances.
In 2010–11 there were 437 cases referred to the program with 301 being accepted to receive CCS services.
Services to these clients were delivered by a panel of 38 service providers throughout Australia known as the
Humanitarian Services Panel. The top six countries of birth for CCS clients in 2010–11 were Sudan
(27 per cent), Iraq (12 per cent), Burma (Myanmar) (11 per cent), Burundi (7 per cent), Congo (6 per cent) and
Afghanistan (6 per cent). The majority of referrals to the CCS program come from settlement service providers,
government agencies, such as health services and child protection services, as well as church and community
groups.
9.2.7 Translating and Interpreting Services (TIS National)
Through TIS National, the department provides translating and interpreting services for people who do not speak
English and for the English speakers who need to communicate with them.
TIS National has access to more than 2 000 contracted interpreters, speaking more than 160 languages and
dialects. TIS National is accessible from anywhere in Australia and provides telephone interpreting services 24
hours a day, seven days a week.

90 | people our business
In 2010–11, TIS National provided almost one million interpreting services, 13.1 per cent more than were
provided in 2009–10. This increase was due to changing patterns in the composition and number of irregular
maritime arrivals, and significant changes in humanitarian settlement patterns. The main languages for which an
interpreter was requested in 2010–11 are shown in table 9.1.
Table 9.1 Interpreting services provided 2010–11: top 10 languages
Language Services provided Proportion (%)
Mandarin 171 570 17.2 Arabic 145 709 14.6 Vietnamese 107 205 10.7 Cantonese 61 534 6.2 Korean 58 174 5.8 Persian 55 202 5.5 Turkish 31 378 3.1 Spanish 28 141 2.8 Dari (Afghani) 22 181 2.2 Greek 21 002 2.1 Other 297 272 29.7 Total 999 368 100.0
Source: Translating and Interpreting Service statistics, Department of Immigration and Citizenship Fee-free interpreting services are provided through TIS National to approved individuals and organisations to
help them communicate with non-English speaking migrants and humanitarian entrants who are Australian
citizens, or permanent residents. Fee-free interpreting services are available to:
private medical practitioners providing services under Medicare
non-profit, non-government, community-based organisations providing settlement services and casework
(subject to their funding arrangements)
members of parliament for constituency purposes
local government authorities
trade unions
emergency Management Australia
pharmacies for the purpose of dispensing Pharmaceutical Benefits Scheme medications.
During 2010 –11, a t otal of 160 490 f ee-free i nterpreting s ervices w ere pr ovided, c ompared t o 197 060 i n
2009–10. O f t hese f ee-free interpreting services, 130 298 w ere f or telephone interpreting and 30 192 w ere f or
on-site interpreting. The decrease in the number of fee-free interpreting services provided between 2009–10 and
2010–11 is due to a change in the administrative definition of services. The decrease does not reflect an actual
reduction in interpreting services to clients.
Fee-free translations of personal settlement-related documents are provided to permanent residents and some
temporary visa holders, as well as to returning Australian citizens within their first two years of arrival or grant of
permanent residence. In 2010–11, 8 408 clients utilised the fee-free translation service in 2010–11, compared to
10 015 in 2009–10.

people our business | 91
9.3 Recent research: settlement outcomes of new arrivals
The department commissioned a study to better understand socio-economic outcomes of Humanitarian and
Migration Program entrants in their first five years of settlement, and to identify what factors contribute to
successful settlement. The survey sample used comprised 60 per cent humanitarian entrants, 20 per cent skilled
migrants and 20 per cent family migrants. The findings of the Settlement Outcomes of New Arrivals12 report
include:
Humanitarian entrants are more likely than Skill and Family Stream migrants to be unemployed,
however they are more highly involved in further education activities.
Seventy-five per cent of humanitarian entrants arrive with at least high school level education. Around a
quarter of humanitarian entrants obtain a technical or university qualification after arriving in Australia.
Nearly 50 per cent of those who arrive with trade qualifications go on to obtain more technical or
university qualifications in Australia. Forty-three per cent of those arriving with a university degree obtain
further university qualifications after arrival.
Humanitarian entrants who have no community or family links in Australia prior to arrival are more
economically independent—they are more likely to learn English quickly, obtain a qualification and gain
paid employment.
12 Full version available at www.immi.gov.au/media/publications/research/_pdf/settlement-outcomes-new-arrivals.pdf

92 | people our business
This page has been intentionally left blank.

people our business | 93 10 Special Focus: Fiscal Impact of Migrants
Chapter 10: Special Focus (A) Labour and educational outcomes of migrants and their
children
94 | people our business
10.1 Overview A key measure of the success of a country’s migration program is the labour market outcomes of the migrants it
has selected. In recent years between a quarter and a third of Australia’s Migration Program has been made up
of Primary Applicants entering through the Skill Stream. These migrants would be expected to adjust easily to
Australia’s labour market conditions—enjoying a high rate of labour force participation, a low rate of
unemployment and a high likelihood of working in a skilled job.
The remainder of Australia’s Migration Program is made up of dependents of these skilled migrants plus people
coming to Australia through Australia’s Family Stream. There are also currently around 14 000 people each year
receiving permanent residence through Australia’s Humanitarian Program. These latter groups would not be
expected to enjoy the same level of labour market success as skilled migrants.
Being able to measure the variation in labour market performance across these different groups is the reason
why the department surveys recent migrants. Complementing this are the Australian Bureau of Statistics (ABS)
Labour Force Survey, which measures labour market outcomes based on country of origin and time in Australia
and the ABS Characteristics of Migrants Survey which includes information on the labour force performance of
humanitarian entrants and temporary migrants.
The performance of different categories of migrants constitutes the first part of this chapter. In the second part,
the focus shifts to examine the labour market outcomes of the children of migrants. Using data from the ABS
2009 Survey of Education and Training we report on the education attainment, employment outcomes and
returns to increased education for this group.
10.2 Outcomes for all overseas born
In August 2011, the Australian labour force comprised 12.07 million persons13 of which 8.63 million were born in
Australia. Of the 3.32 million overseas-born, 1.34 million were from the Mainly English Speaking Countries
(MESC) of New Zealand, Canada, USA, UK, South Africa and Ireland. The remaining 1.99 million migrants were
from Non English Speaking Countries (NESC).
Table 10.1 uses ABS Labour Force Survey data to provide a summary of the labour force status of these
persons averaged over the year to August 2011.14
13 ABS Labour Force, Australia (6202.002)—seasonally adjusted. 14 ABS Labour Force, Australia Detailed Electronic Delivery (6291.0.55.001)—LM7 data cube: data has been averaged over 12 months due to small sizes of survey subgroups.

people our business | 95
Table 10.1 Employment status of civilian population aged 15 years or more, by birthplace, 2010–11
Category Employment rate (%)
Unemployment rate (%)
Participation rate (%)
Australian born males 71.1 5.0 74.8
Australian born females 59.2 5.1 62.4
Australian born 65.1 5.0 68.6
MESC born males 71.7 3.9 74.6
MESC born females 58.5 5.0 61.6
MESC born 65.3 4.4 68.2
NESC born males 63.5 4.9 66.8
NESC born females 47.6 6.6 51.0
NESC born 55.3 5.6 58.6
Total 63.3 5.1 66.6
Source: Labour Force, Australia (6291.0), Australian Bureau of Statistics
As seen in Table 10.1:
the Australia-born and MESC migrants are more strongly represented in the workforce than NESC
migrants. Their participation rates of 68.6 per cent and 68.2 per cent respectively are substantially
higher than the 58.6 per cent rate for NESC migrants
MESC migrants have the lowest unemployment rates, slightly below the Australia-born and
considerably lower than NESC migrants
the female participation rate for NESC migrants (51.0 per cent) was considerably below the female
participation rate for Australian born and MESC migrants (62.4 per cent and 61.6 per cent
respectively).
Table 10.2 shows that both NESC and MESC migrants are more likely to be employed as professionals than the
Australian-born and MESC migrants are also over-represented in management positions due to the skilled focus
of the Migration Program. Compared with others in the population, NESC migrants are significantly over-
represented in lower skilled labouring jobs.

96 | people our business
Table 10.2 Occupation by birthplace, August 2011
Occupation Australia (%) MESC (%) NESC (%) Overall (%)
Managers 13.1 15.1 11.0 13.0
Professionals 20.0 25.7 25.6 21.6
Technicians and Trades Workers 14.8 13.9 12.0 14.2
Community and Personal Service Workers 9.9 8.6 9.6 9.7
Clerical and Administrative Workers 15.6 14.7 12.9 15.1
Sales Workers 10.2 6.9 7.6 9.4
Machinery Operators And Drivers 6.8 6.9 6.9 6.8
Labourers 9.6 8.2 14.4 10.3
Total 100.0 100.0 100.0 100.0
Source: unpublished labour force data, Australian Bureau of Statistics. Monthly labour force data has been averaged over 12 months due to small sizes of survey subgroups. In terms of industry, table 10.3 shows that:
NESC migrant workers are over-represented in Health Care and Social Assistance, Accommodation and
Food Services and in Manufacturing industries, but are under-represented in Construction, Public
Administration and Safety and Education and Training sectors. While MESC migrant workers are notably
over-represented in mining and construction, less than 1 per cent of NESC workers are in mining jobs
and are significantly under-represented in construction.
MESC workers have higher representation in the Professional, Scientific and Technical Services
industry, but have lower representation in the Retail Trade and Accommodation and Food Services
industries.
MESC and NESC workers are significantly under-represented in the agricultural sector. This is not
surprising since migrants—in particular recent migrants—are more likely than the rest of the population
to be living in urban areas. For example, while more than a third of the Australia-born population lives
outside of Australia’s major cities, only 15 per cent of the overseas-born population and just 11 per cent
of migrants arriving since 2000 chose to live in regional Australia.15
15 Source: Unpublished data from 2006 Census of Population and Housing

people our business | 97
Table 10.3 Industry by birthplace, August 2011
Industry Australia (%) MESC (%) NESC (%) Total (%)
Agriculture, Forestry and Fishing 3.4 1.3 1.1 2.8
Mining 2.1 3.2 0.8 2.0 Manufacturing 7.7 8.3 11.0 8.3 Electricity, Gas and Water Supply 1.3 1.2 1.1 1.2
Construction 9.7 9.8 6.0 9.1 Wholesale Trade 3.4 3.6 4.2 3.6 Retail Trade 11.4 8.3 9.5 10.8 Accommodation and Food Services 6.4 4.7 10.4 6.9
Transport Postal and Warehousing 5.0 5.1 5.7 5.1
Information Media and Telecommunications 1.7 2.1 1.9 1.8
Finance and Insurance Services 3.6 4.7 4.1 3.8
Rental, Hiring and Real Estate Services 1.8 2.0 1.2 1.7
Professional, Scientific and Technical Services 7.0 9.9 9.5 7.7
Administrative and Support Services 3.2 4.0 5.0 3.6
Public Administration and Safety 7.0 5.5 5.0 6.5
Education and Training 8.0 8.6 5.6 7.6 Health Care and Social Assistance 11.1 12.2 13.6 11.7
Arts and Recreation Services 2.0 1.9 1.1 1.8
Other Services 4.1 3.9 3.6 4.0
Total 100 100 100 100
Source: unpublished labour force data, Australian Bureau of Statistics. Monthly labour force data has been averaged over 12 months due to small sizes of survey subgroups. 10.3 Outcomes across different visa categories
Results from the Continuous Survey of Australian Migrants (CSAM)—the department’s survey of recently arrived
Skill and Family Stream migrants—indicate that 6 months after arrival or grant of permanent residence the vast
majority of skilled migrants have quickly become active participants in the Australian labour market, with
migrants who are sponsored by an employer performing particularly well. Results also show that other primary
applicants, including those from the Family Stream, have higher participation rates than the national average.
The main results from the survey run in late 2010 are as follows:
The unemployment rate of recently arrived skilled migrants was 4.0 per cent—considerably lower than
the national average of 5.2 per cent

98 | people our business
Recently arrived skilled migrants had a participation rate of 97 per cent—well above the national
average of 65 per cent
Skilled migrants sponsored by an employer enjoyed the best employment outcomes—they had a
negligible unemployment rate of less than 1 per cent and 91 per cent were working in a skilled job
Skilled graduates had a participation rate of 100 per cent and an unemployment rate of less than 1 per
cent, although only 68 per cent were working in a skilled job
Unemployment for the primary applicants from the Family Stream was relatively high at 29 per cent.
This is due to a combination of factors—employment not being the main motive for migration; being
new to the Australian labour market; and being less likely than skilled migrants to have the
qualifications and experience sought by employers.
Table 10.4 Employment outcomes of recently arrived migrants 2010
Visa category In skilled work (%)
In other jobs (%)
Not working
(%)
In full-time work
(%)
Participation rate (%)
Unemployment rate (%)
Median full-time earnings
(A$)
Family Stream 19 31 55 30 69 29 40 600
Skill Stream
Employer sponsored 91 6 4 92 97 1 65 000 State/Territory Sponsored and Skilled Australian Sponsored
67 22 12 74 99 10 60 000
Skilled Independent (offshore applicants) 76 10 14 76 96 10 78 000
Skilled Independent (onshore applicants) 56 36 8 70 97 5 44 700
Other Skill Stream primary applicants 45 38 18 63 89 7 41 000
All Skill Stream primary applicants 71 22 8 75 97 4 52 000
Skilled graduates 68 30 2 68 100 1 41 000 Source: Continuous Survey of Australia’s Migrants, Cohort 3 October 2010, Department of Immigration and Citizenship Results from the ABS Characteristics of Recent Migrants Survey (CORMS)—a survey run in 2010 of around
3 000 skilled, family and humanitarian migrants who arrived in the past decade—show that the labour market
integration of humanitarian entrants is quite poor.
For instance, although the humanitarian entrants surveyed had been in Australia for up to 10 years, only three in
10 were working at the time of the survey and more than half had never worked at all since coming to Australia.
It is therefore not surprising that almost six out of every 10 humanitarian entrants relied on government pensions
and allowances as their main source of income.

people our business | 99
Given the importance of English in securing employment, one encouraging finding from the survey was that
humanitarian entrants indicated their English language skills had improved substantially since arrival, with 53 per
cent claiming good English compared with only 29 per cent on arrival.
A feature of the CORMS is that it also provides information on the labour market performance of temporary
residents. Among these migrants around 66 per cent are labour market participants and 5 per cent are
unemployed. These outcomes are similar to that of Australia’s resident population.
10.4 The Labour Market Integration of Migrants
So far we have looked at outcomes by visa category and outcomes by origin, without controlling either for time in
Australia or education attainment. These are significant oversights. As seen from figure 10.1 it takes migrants
around five years on average to adapt to the Australian labour market.
Figure 10.1 Migrant unemployment rates by year of arrival 1991 to 2010
ABS Labour Force, Australia Detailed Electronic Delivery (6291.0.55.001) — LM7 data cube: data
In this section we address these oversights by using data from the 2009 ABS Survey of Education and Training
to report on the educational attainment, labour market outcomes, and returns on education for three migrant
cohorts:
persons born in Australia
persons from Mainly English Speaking Countries (MESC)
persons from Non English Speaking Countries (NESC)
To enable a more precise comparison, we limit the analysis to persons aged 15 to 64 who are no longer in full-
time study.

100 | people our business
As can be seen from figure 10.2, NESC migrants are a highly educated cohort but this is not translating into good
labour market outcomes.
Figure 10.2 Education Attainment and Employment Outcomes 2009: migrants and non-migrants aged 15-64
Source: Survey of Education and Training, 2009, unit record file (ABS catalogue 6278.0.055.001)
For example, almost half (46 per cent) of NESC migrants have a tertiary qualification, but only two thirds are
working. The returns for education are poorer as well. Only two thirds of NESC migrants with a tertiary
qualification are working in a skilled field compared with 79–80 per cent of MESC migrants and Australian-born.
Outcomes are especially poor for females (figure 10.3). Only 62 per cent of tertiary-educated female NESC
migrants work in skilled occupations.
Figure 10.3 Proportion of tertiary educated working in a management or professional field 2009: migrants and non-migrants aged 15-64
Source: Survey of Education and Training, 2009, unit record file (ABS catalogue 6278.0.055.001)

people our business | 101
While the overall labour market performance of NESC migrants falls short of migrants from MESC and the
Australia-born, there is evidence that their performance is improving. Figure 10.4 uses data from the 1996, 2001
and 2006 Censuses to show the employment rate for recent migrants.
Figure 10.4 Employment rates since arrival for different MESC and NESC migrant cohorts
Source: ABS Census of Population and Housing 1996, 2001, 2006
As can be seen from the figure, employment rates improve with increased time in Australia. This is consistent
with the labour force data presented earlier in figure 10.1 and is a natural consequence of improved confidence
and greater familiarity with the Australian labour market, the acquisition of Australian work experience and
Australian qualifications and improved English.
The figure also shows that more recent cohorts of NESC migrants perform better than earlier cohorts. For
instance, 5 years after arrival only about 45 per cent of the 1996–2001 NESC cohort were working, compared
with almost 70 per cent of the 2006–2011 cohort. In fact the gap between NESC and MESC who have been in
Australia for 5 years has narrowed from 30 percentage points for the 1996–2001 cohort to just 10 percentage
points for the 2006–11 cohorts. This improved performance is due to the growing number of Skill Stream
migrants among more recent NESC cohorts.

102 | people our business
10.5 The longer-term view
So far we have focussed on current labour market data. We now broaden the analysis to examine how migrants
have contributed to the labour force over the past decade. Figure 10.5 shows the unemployment rate for migrant
and non-migrant groups over the period 2000 to 2010. As can be seen from this figure MESC migrants
consistently have lower unemployment than NESC migrants and the Australian-born . The figure also shows that
the unemployment rates for NESC migrants have tracked unemployment rates for the rest of the population but
have been on average 1.4 percentage points higher than the Australian born and 2.3 percentage points higher
than that of MESC migrants.
Figure 10.5 Unemployment Rate: country of birth, 2000–2010
Source: Labour Force, Australia (6291.0), Australian Bureau of Statistics
NESC migrants are however more susceptible to down-turns in the labour market. As can be seen in the shaded
area in figure 10.5, the global economic crisis triggered a sharp increase in NESC migrant unemployment—with
unemployment rising from 4.7 per cent in October 2008 to 8.4 per cent in August 2009. Over the same period,
MESC migrants and the Australia-born experienced relatively modest increases in unemployment of around 1.5
percentage points and 0.9 percentage points respectively. When the Australian economy started improving, the
unemployment rates for NESC migrants decreased sharply—falling from 8.4 per cent in August 2009 to 5.7 per
cent in August 2011. This spike in NESC unemployment, and unemployment in general, was far less pronounced
and much shorter in duration than the spikes that occurred in the recessions of the early 1980s and early 1990s.

people our business | 103
The difference between labour market outcomes of migrants from MESC and NESC can also be looked at in
another way. Figure 10.6 shows that over the past 10 years the proportion of MESC migrants in employment has
been almost identical to its population share. In contrast, NESC migrants are under-represented in Australia’s
workforce. While they represented around 18 per cent of Australia’s population in 2011 they only accounted for
16 per cent of employed persons. This 2 percentage point gap has been more or less consistent for the past
decade.
Figure 10.6 Employment and share of civilian population: MESC and NESC migrants 2000–2011
Source: Labour Force Quarterly (6291.0.55.001), Australian Bureau of Statistics
10.6 Labour market outcomes for children of migrants
ABS Census data shows that the children of migrants (whether they were born overseas or were born in Australia
to migrant parents) made up 32 per cent of Australia’s overall population, while accounting for a somewhat
higher share of our working age population. This is a remarkably large contribution to our labour market when
one considers people who migrated as adults are now mostly retired, and account for only 13 per cent of
Australia’s working age population.
In this section we use data from the 2009 Survey of Education and Training (the same dataset that was used in
Section 10.5) to report on the labour market performance and returns to education for three groups of migrants
and non-migrants:
104 | people our business
Children of Australians—people born in Australia with at least one Australia-born parent
Australia-born children of migrants—people born in Australia with both parents born overseas
Overseas-born children of migrants—people born overseas who arrived before the age of 15.
Within these three groups we have only selected people who are relatively young—i.e. between 15 and 34 years
of age. This is because for older age cohorts a person’s migrant background becomes less relevant in terms of
labour market participation. Also as with the earlier analysis we have excluded those engaged in full-time study.
Data from this survey shows that it is the overseas-born children of migrants that have the highest level of
education, with 36 per cent having a tertiary qualification compared with only 23 per cent of those who are
children of Australians. Australia-born children of migrants fall between these two extremes, with 29 per cent
having tertiary qualifications.
The reasons why the overseas-born children of migrants are better educated can be traced back to how long this
particular cohort has been in the country. Unlike the other two cohorts—where by definition everyone has been
in Australia at least 15 years— the overseas-born children of migrants cohort contains a mix of established and
recent migrants. For example, it will include people who are aged 34 who have been living in Australia for
almost all their life, and it will also contain 15 year olds who have been in Australia for less than a year.
Given the emphasis on skilled migration in the past decade, these more recent arrivals are likely to have been
the dependent of a skilled migrant. It then follows that the children of these migrants will be more educated on
average as well. This is because their parents will have experienced the benefits of a good education and will
have wanted to ensure that their children are given the same opportunities.
As shown in figure 10.7 the returns on this additional human capital for children of migrants (whether they are
born overseas or in Australia) are mixed.
After excluding those still in full-time education, children of migrants are less likely to be working than those born
to Australian parents. One possible explanation is that because they a young, well-educated cohort they will
have entered the workforce at a later age and therefore have less work experience on average than those with
Australian parents. A lack of work experience is a substantial barrier for young people looking for their first full-
time job. Some overseas born children of migrants—those who arrived from a non-English speaking country in
their teens—may also be having difficulties finding work because of poorer English.

people our business | 105
Figure 10.7 Education and employment outcomes: children of Australians and children of migrants aged 15–34
Source: Survey of Education and Training, 2009, unit record file (ABS catalogue 6278.0.055.001)
Provided they are working, however, children of migrants do appear to be getting better jobs. For instance
almost half of the jobs for overseas-born children of migrants are in management, professional or technical fields
(ISCO 1/2/3) compared with just over a third of jobs for the children of Australians.

106 | people our business
This page has been intentionally left blank.

people our business | 107
Chapter 11: Special Focus (B) The fiscal impact of migrants
108 | people our business
11.1 Overview of the model Migration contributes to economic growth by bringing people into Australia who are concentrated in the prime
working ages of 25 to 44 years, have a high propensity to work and are highly skilled. It is difficult to measure in
overall terms the economic contribution of migrants, however good indicators include the impact on labour
market participation and employment growth, and the fiscal impact that migration has on Australia’s Budget
bottom line.
The department worked with Access Economics, an independent economic consultancy, over many years to
develop the Migrants’ Fiscal Impact Model. The model provides a detailed profile of the effect of new migrants
on the Australian Government Budget, taking into account their impact on revenues and expenditure.
In terms of revenues this is achieved by using estimates of income, employment and expenditure for different
categories of migrants to model income tax and goods and service tax receipts. The model also estimates the
indirect contribution of migration to other revenue streams such as company tax.
When modelling expenditure estimates of government outlays on health, education, social security and
settlement services, we take into account the migrant’s age profile and propensity of different migrant groups to
use government services.
In interpreting the model’s findings some considerations need to be considered:
Fiscal impacts are modelled over a 20-year period, taking into account the starting age profile of the
migrant cohort and survival rates over time. The model also takes into account broader government
spending and revenue and as such can be very responsive to changes in the fiscal outlook.
The model, however, is not a ‘life cycle’ model of migrants. This is because most Primary Applicants
(particularly in the Skill Stream) tend to be aged between 20 and 40 years, meaning that over the 20-
year timeframe most would remain in the workforce and not draw significantly on health or aged
pension costs.
The model only examines the first generation of migrants, meaning that the impact on the Australian
Government Budget from any children born after arrival in Australia is not considered.

people our business | 109
11.2 Findings from the model
These caveats aside, the model shows that most new migrants provide a substantial positive contribution to the
Budget. In fact, over their first 10 years of settlement, migrants arriving through the 2010–11 Migration and
Humanitarian programs will provide an estimated net fiscal benefit of over A$10 billion.
The reasons for this strong net contribution are that the migrants:
have high average incomes and rates of workforce participation leading to a high level of direct tax
receipts and less reliance on welfare payments
have good levels of English overall, which reduces the need for language services
from the Skill and Family Streams are excluded from many government benefits for the first two years
after arrival, and
have an age profile that is generally much younger than the Australian population, reducing their
demand on health services.
Table 11.1 below shows the fiscal contribution of migrants coming through the 2010-11 Migration Program over a
20 year settlement period. These estimates are more detailed than those in the government's Budget Papers,
which only show the overall effect on forward estimates of varying the size and composition of the program.
As can be seen from this table, while the fiscal contribution of migrants grows over time, skilled migrants make
the greatest fiscal contribution. In aggregate terms the model estimates that the total fiscal contribution from the
2010–11 Migration and Humanitarian programs (approximately 182 500 migrants) is around A$712 million in the
first year after their arrival. Over the first 10 years the cumulative contribution of these migrants is estimated to
be more than A$10.2 billion.
Additionally, the continuation of the Business Long Stay visa intake at 2010–11 levels (approximately 90 100
migrants) is estimated to contribute about A$890 million in the first year after arrival and deliver a cumulative
benefit of around A$5.2 billion 10 years after arrival.
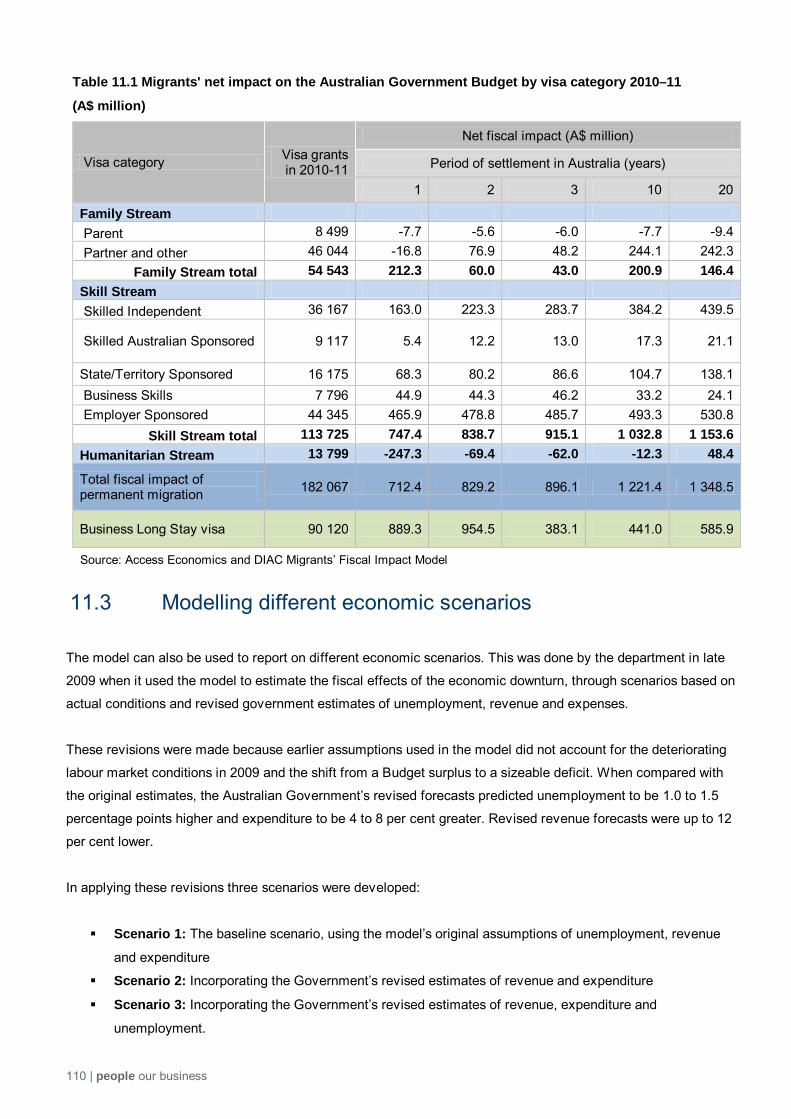
110 | people our business
Table 11.1 Migrants' net impact on the Australian Government Budget by visa category 2010–11
(A$ million)
Visa category Visa grants in 2010-11
Net fiscal impact (A$ million)
Period of settlement in Australia (years)
1 2 3 10 20
Family Stream Parent 8 499 -7.7 -5.6 -6.0 -7.7 -9.4 Partner and other 46 044 -16.8 76.9 48.2 244.1 242.3
Family Stream total 54 543 212.3 60.0 43.0 200.9 146.4 Skill Stream Skilled Independent 36 167 163.0 223.3 283.7 384.2 439.5
Skilled Australian Sponsored 9 117 5.4 12.2 13.0 17.3 21.1
State/Territory Sponsored 16 175 68.3 80.2 86.6 104.7 138.1 Business Skills 7 796 44.9 44.3 46.2 33.2 24.1 Employer Sponsored 44 345 465.9 478.8 485.7 493.3 530.8
Skill Stream total 113 725 747.4 838.7 915.1 1 032.8 1 153.6 Humanitarian Stream 13 799 -247.3 -69.4 -62.0 -12.3 48.4
Total fiscal impact of permanent migration 182 067 712.4 829.2 896.1 1 221.4 1 348.5
Business Long Stay visa 90 120 889.3 954.5 383.1 441.0 585.9
Source: Access Economics and DIAC Migrants’ Fiscal Impact Model
11.3 Modelling different economic scenarios
The model can also be used to report on different economic scenarios. This was done by the department in late
2009 when it used the model to estimate the fiscal effects of the economic downturn, through scenarios based on
actual conditions and revised government estimates of unemployment, revenue and expenses.
These revisions were made because earlier assumptions used in the model did not account for the deteriorating
labour market conditions in 2009 and the shift from a Budget surplus to a sizeable deficit. When compared with
the original estimates, the Australian Government’s revised forecasts predicted unemployment to be 1.0 to 1.5
percentage points higher and expenditure to be 4 to 8 per cent greater. Revised revenue forecasts were up to 12
per cent lower.
In applying these revisions three scenarios were developed:
Scenario 1: The baseline scenario, using the model’s original assumptions of unemployment, revenue
and expenditure
Scenario 2: Incorporating the Government’s revised estimates of revenue and expenditure
Scenario 3: Incorporating the Government’s revised estimates of revenue, expenditure and
unemployment.

people our business | 111
Comparing the fiscal impacts of these three scenarios revealed three important findings.
Even in times of higher unemployment, migrants continue to make a large positive fiscal contribution,
one which increases over time.
The impact of higher unemployment is much smaller than the indirect impact of the Budget moving into
deficit. During the economic downturn, the government stimulated the Australian economy through cash
payouts and implementing major infrastructure programs. The share of this increased expenditure to the
182 000 migrants who came through 2008–09 Migration Program was about three times greater than the
direct impact of higher migrant unemployment.
In the long term this decline in benefits is not a major concern. Over time migrants will continue to make
a positive fiscal impact that overshadows the short-term fiscal effects of higher unemployment and
greater spending. Extending the model to a 20 year period showed the cumulative fiscal benefit of the
2008–09 Migration Program to be about A$23 billion (in 2009 dollars) for all three scenarios.
For more details on this scenario analysis can be found at:
www.immi.gov.au/media/publications/statistics/popflows2008-09

112 | people our business
This page has been intentionally left blank.

people our business | 113
Appendix A Citizens of OECD countries in Australia
114 | people our business
Appendix A Notes
Unless stated otherwise, figures exclude small numbers of visa grants where the gender and/or country of
citizenship of the applicant has not been recorded.
Under the 1973 Trans Tasman Travel Arrangement, most New Zealand citizens are automatically granted a
Special Category (subclass 444) visa on arrival, which allows them to visit, live, work or study in Australia
indefinitely. As this visa ceases when the holder departs Australia, and a new one is granted on each entry, it is
not considered a ‘permanent residence’ visa, and is not counted as part of Australia’s Migration Program. In the
following tables, visa grant figures for New Zealand citizens do not accurately reflect the number of New Zealand
citizens residing in Australia, as these are likely to be New Zealand citizens who also have citizenship of a third
country.

people our business | 115
Table 1 Migration Program visa grants 2010–11
Country of Citizenship Male Female Total Grants
Austria 58 55 113
Belgium 92 84 176
Canada 747 953 1 700
Chile 100 114 214
Czech Republic 68 110 178
Denmark 68 72 140
Estonia 15 50 65
Finland 46 93 139
France 643 580 1 223
Germany 776 1 023 1 799
Greece 82 52 134
Hungary 121 142 263
Iceland 5 3 8
Ireland 2 251 1 449 3 700
Israel 226 185 411
Italy 477 335 812
Japan 363 1 116 1 479
Luxembourg 1 1 2
Mexico 110 116 226
Netherlands 369 347 716
New Zealand Nil Nil Nil
Norway 51 85 136
Poland 162 326 488
Portugal 115 109 224
Slovakia 47 91 138
Slovenia 22 23 45
South Korea 1 948 2 378 4 326
Spain 104 151 255
Sweden 136 231 367
Switzerland 123 117 240
Turkey 385 324 709
UK 12 577 11 354 23 931
USA 1 353 1 545 2 898
OECD Total 23 641 23 614 47 255
OECD Proportion of Grand Total (%) 14.0 14.0 28.0
Non-OECD Total 55 708 65 715 121 423
Grand Total 79 349 89 329 168 678
OECD Gender Split (%) 50.0 50.0 100.0

116 | people our business
Table 2 Business Long Stay visa grants 2010–11 Country of Citizenship Male Female Total Grants
Austria 112 81 193
Belgium 188 113 301
Canada 1 475 1 256 2 731
Chile 121 101 222
Czech Republic 70 76 146
Denmark 176 139 315
Estonia 27 22 49
Finland 74 94 168
France 1 208 880 2 089^
Germany 1 181 963 2 144
Greece 41 16 57
Hungary 82 80 162
Iceland 4 7 11
Ireland 3 452 2 366 5 818
Israel 211 169 380
Italy 609 314 923
Japan 841 751 1 592
Luxembourg 4 1 5
Mexico 74 66 140
Netherlands 875 498 1 373
New Zealand 32 32 64
Norway 149 70 219
Poland 133 122 255
Portugal 68 53 121
Slovakia 43 36 79
Slovenia 16 21 37
South Korea 562 556 1 118
Spain 334 240 574
Sweden 235 227 462
Switzerland 160 104 264
Turkey 88 66 154
UK 12 053 9 621 21 674
USA 4 019 3 000 7 020^
OECD Total 28 717 22 141 50 860
OECD Proportion of Grand Total (%) 31.9 24.6 56.4
Non-OECD Total 21 670 17 614 39 285
Grand Total 50 387 39 755 90 145
OECD Gender Split (%) 56.5 43.5 100
^Includes 1 unknown gender

people our business | 117
Table 3 Student visa grants 2010–11 Country of Citizenship Male Female Total Grants
Austria 146 228 374
Belgium 92 129 221
Canada 1 067 1 566 2 633
Chile 759 598 1 357
Czech Republic 571 571 1 142
Denmark 351 449 800
Estonia 51 70 121
Finland 94 193 287
France 1 246 1 386 2 632
Germany 1 877 2 564 4 441
Greece 64 38 102
Hungary 301 256 557
Iceland 10 13 23
Ireland 371 345 716
Israel 154 97 251
Italy 1 126 830 1 956
Japan 1 949 3 843 5 792
Luxembourg 4 8 12
Mexico 565 498 1 063
Netherlands 223 321 544
New Zealand 7 1 8
Norway 591 974 1 565
Poland 532 550 1 082
Portugal 198 202 400
Slovakia 303 310 613
Slovenia 54 42 96
South Korea 6 459 7 118 13 577
Spain 671 576 1 247
Sweden 441 779 1 220
Switzerland 461 598 1 059
Turkey 813 329 1 142
UK 1 460 1 651 3 111
USA 3 327 5 237 8 564
OECD Total 26 338 32 370 58 708
OECD Proportion of Grand Total (%) 10.5 12.9 23.3
Non-OECD Total 105 829 87 017 192 846
Grand Total 132 167 119 387 251 554
OECD Gender Split (%) 44.9 55.1 100.0

118 | people our business
Table 4 Visitor visa grants 2010–11 Country of Citizenship Male Female Total Grants
Austria 8 788 7 836 16 624
Belgium 7 668 5 608 13 276
Canada 52 673 53 021 105 694
Chile 2 862 2 704 5 566
Czech Republic 3 224 3 034 6 258
Denmark 10 894 9 869 20 763
Estonia 515 577 1 092
Finland 4 854 5 118 9 972
France 64 564 58 891 123 455
Germany 74 798 68 399 143 197
Greece 4 036 2 941 6 977
Hungary 1 878 2 077 3 955
Iceland 285 290 575
Ireland 22 889 24 792 47 681
Israel 5 616 3 777 9 393
Italy 30 493 22 117 52 610
Japan 147 041 177 810 324 851
Luxembourg 298 298 596
Mexico 2 334 2 245 4 579
Netherlands 29 239 25 229 54 468
New Zealand 386 60 446
Norway 7 973 7 767 15 740
Poland 5 064 5 633 10 697
Portugal 3 728 3 270 6 998
Slovakia 1 293 1 589 2 882
Slovenia 1 062 1 020 2 082
South Korea 86 230 91 234 177 464
Spain 11 132 8 622 19 754
Sweden 15 176 15 045 30 221
Switzerland 18 463 17 897 36 360
Turkey 2 508 2 203 4 711
UK 292 217 280 764 572 981
USA 199 690 174 663 374 353
OECD Total 1 119 871 1 086 400 2 206 271
OECD Proportion of Grand Total (%) 31.6 30.7 62.3
Non-OECD Total 632 438 705 173 1 337 612
Grand Total 1 752 309 1 791 573 3 543 883
OECD Gender Split (%) 50.8 49.2 100 Visitor visas comprise the following subclasses: 456 (Business Short Stay), 459 (Sponsored Business Visitor), 488 (Superyacht Crew), 651 (eVisitor), 675 and 685 (Medical Treatment, 956 and 977 (Electronic Travel Authority–Business Entrant), 976 (Electronic Travel Authority–Visitor), 676 (Tourist), and 679 (Sponsored Family Visitor).

people our business | 119
Table 5 Specialist Entry (Social/Cultural Stream) visa grants 2010–11 Country of Citizenship
Investor Retirement Retirement Special
Program Visiting Academic Entertainment Sport
Media & Film Staff
Religious Worker Total Grants
Austria 2 1 11 18 62 1 0 0 95
Belgium 1 0 15 12 130 0 0 0 158
Canada 2 28 94 120 684 8 0 50 986
Chile 0 0 6 1 34 4 0 5 50
Czech Republic 0 0 5 3 19 1 0 0 28
Denmark 0 8 86 56 73 0 0 1 224
Estonia 0 0 1 0 17 0 0 0 18
Finland 0 0 0 64 53 1 0 6 124
France 10 26 69 89 469 3 0 11 677
Germany 4 82 170 141 606 6 4 13 1 026
Greece 1 0 0 1 136 0 0 10 148
Hungary 0 0 12 4 50 5 0 2 73
Iceland 0 0 5 0 21 0 0 0 26
Ireland 0 10 21 5 278 5 0 4 323
Israel 0 2 32 47 57 1 0 5 144
Italy 3 7 55 28 140 2 0 5 240
Japan 9 132 88 173 142 6 0 43 593
Luxembourg 0 0 0 1 3 0 0 0 4
Mexico 0 0 13 9 32 0 0 2 56
Netherlands 2 52 8 56 276 3 0 4 401
New Zealand 0 0 0 0 0 0 0 0 0
Norway 0 3 17 33 47 0 0 9 109
Poland 0 0 8 13 26 0 0 1 48
Portugal 0 0 5 5 27 0 0 3 40
Slovakia 0 0 4 2 62 0 0 0 68
Slovenia 0 0 1 0 5 1 0 0 7
South Korea 0 17 33 143 109 7 0 240 549
Spain 0 3 21 79 75 0 0 4 182
Sweden 0 4 22 54 150 1 0 20 251
Switzerland 2 47 55 76 44 1 0 5 230
Turkey 0 0 3 5 31 0 0 14 53
UK 64 1 037 218 96 2 860 99 5 67 4 446
USA 4 92 421 204 6 074 100 4 458 7 357
OECD Total 104 1 551 1 499 1 538 12 792 255 13 982 18 734 OECD Proportion of visa subclass (%)
78.2 82.7 58.5 59.1 78.4 51.3 43.3 53.5 72.5
Non-OECD Total 29 324 1 064 1 064 3 527 242 17 853 7 120
Grand Total 133 1 875 2 563 2 602 16 319 497 30 1 835 25 854

120 | people our business
Table 6 Specialist Entry (International Relations Stream) visa grants 2010–11
Country of Citizenship Educational Government Agreement
Exchange Foreign Government Agency
Domestic Worker (Diplomatic or Consular)
Domestic Worker (Executive)
Occupational Trainee Diplomatic Total
Grants
Austria 0 3 1 0 0 42 5 51 Belgium 0 0 0 0 0 9 1 10 Canada 41 153 2 0 0 81 36 313 Chile 0 0 0 1 1 8 18 28 Czech Republic 0 0 0 0 0 0 12 12 Denmark 0 4 5 0 0 75 4 88 Estonia 0 0 0 0 0 1 0 1 Finland 0 0 2 0 0 15 1 18 France 93 2 62 0 0 287 52 496 Germany 5 4 12 0 0 280 29 330 Greece 0 0 10 0 0 4 29 43 Hungary 0 0 0 0 0 3 7 10 Iceland 0 0 0 0 0 0 0 0 Ireland 0 0 2 0 0 32 5 39 Israel 0 0 0 0 0 27 14 41 Italy 0 0 16 0 0 56 65 137 Japan 17 5 50 0 0 45 68 185 Luxembourg 0 0 0 0 0 0 0 0 Mexico 0 0 0 0 0 18 0 18 Netherlands 0 2 2 0 0 154 7 165 New Zealand 0 0 0 0 0 0 40 40 Norway 0 0 5 0 0 17 3 25 Poland 0 0 0 0 0 18 7 25 Portugal 0 0 0 0 0 9 2 11 Slovakia 0 0 0 0 0 2 8 10 Slovenia 0 0 0 0 0 1 5 6 South Korea 7 0 20 0 0 84 33 144 Spain 0 2 16 0 0 49 14 81 Sweden 0 2 11 1 0 53 6 73 Switzerland 7 10 0 0 0 33 11 61 Turkey 0 0 2 0 0 5 63 70 UK 20 83 0 0 0 216 56 375 USA 228 25 6 0 0 161 178 598 OECD Total 418 295 224 2 1 1 785 779 3 504 OECD Proportion of visa subclass (%) 84.3 96.4 78.3 1.4 5.9 51.3 33.4 49.6
Non-OECD Total 78 11 62 143 16 1 695 1 551 3 556 Grand Total 496 306 286 145 17 3 480 2 330 7 060
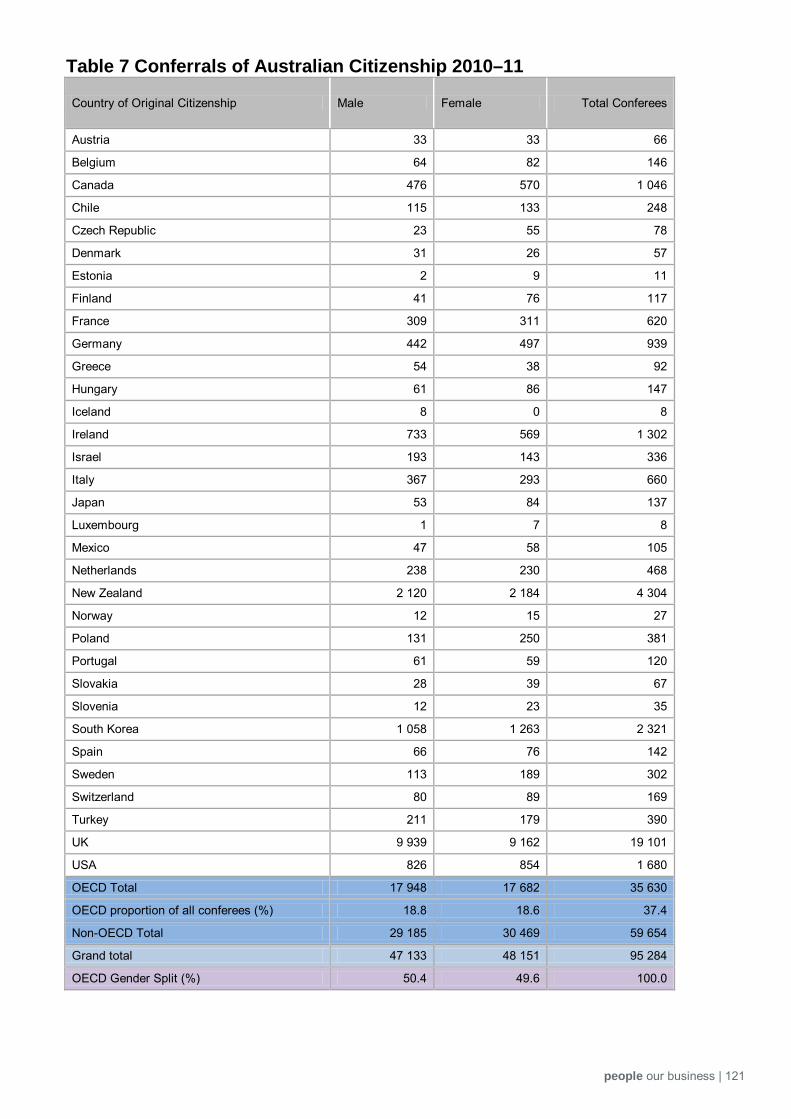
people our business | 121
Table 7 Conferrals of Australian Citizenship 2010–11
Country of Original Citizenship Male Female Total Conferees
Austria 33 33 66
Belgium 64 82 146
Canada 476 570 1 046
Chile 115 133 248
Czech Republic 23 55 78
Denmark 31 26 57
Estonia 2 9 11
Finland 41 76 117
France 309 311 620
Germany 442 497 939
Greece 54 38 92
Hungary 61 86 147
Iceland 8 0 8
Ireland 733 569 1 302
Israel 193 143 336
Italy 367 293 660
Japan 53 84 137
Luxembourg 1 7 8
Mexico 47 58 105
Netherlands 238 230 468
New Zealand 2 120 2 184 4 304
Norway 12 15 27
Poland 131 250 381
Portugal 61 59 120
Slovakia 28 39 67
Slovenia 12 23 35
South Korea 1 058 1 263 2 321
Spain 66 76 142
Sweden 113 189 302
Switzerland 80 89 169
Turkey 211 179 390
UK 9 939 9 162 19 101
USA 826 854 1 680
OECD Total 17 948 17 682 35 630
OECD proportion of all conferees (%) 18.8 18.6 37.4
Non-OECD Total 29 185 30 469 59 654
Grand total 47 133 48 151 95 284
OECD Gender Split (%) 50.4 49.6 100.0

122 | people our business
Table 8 Estimated Resident Population (overseas-born) at 30 June 2010
Birth country Male Female Estimated Total Residents
Austria 10 870 9 640 20 510
Belgium 3 320 3 380 6 700
Canada 20 920 23 210 44 130
Chile 13 830 14 760 28 590
Czech Republic 6 850 7 170 14 020
Denmark 5 780 5 230 11 010
Estonia 1 390 1 560 2 950
Finland 4 170 5 480 9 650
France 15 980 14 670 30 650
Germany 61 660 66 900 128 560
Greece 62 780 64 430 127 210
Hungary 11 470 11 190 22 660
Iceland 310 290 600
Ireland 38 970 33 450 72 420
Israel 6 050 4 840 10 890
Italy 111 710 104 590 216 300
Japan 18 770 33 330 52 100
Luxembourg 130 160 290
Mexico 1 750 1 760 3 510
Netherlands 45 300 43 310 88 610
New Zealand 279 360 264 830 544 190
Norway 2 180 2 380 4 560
Poland 25 980 32 460 58 440
Portugal 9 530 9 000 18 530
Slovakia 2 590 2 910 5 500
Slovenia 3 770 3 680 7 450
South Korea 48 020 52 230 100 250
Spain 7 980 7 640 15 620
Sweden 4 920 5 870 10 790
Switzerland 7 700 7 090 14 790
Turkey 20 740 19 220 39 960
UK 606 370 586 520 1 192 890
USA 42 490 41 520 84 010
OECD Total 1 503 640 1 484 700 2 988 340
OECD Proportion of Grand Total (%) 25.1 24.8 49.8
Non-OECD Total 1 474 740 1 531 830 3 006 570
Grand Total 2 978 380 3 016 530 5 994 910
OECD Gender Split (%) 50.3 49.7 100.0

people our business | 123
Table 9 Overseas-born residents emigrating 2010–11 Birth Country Male Female Total Emigrants
Austria 45 34 79 Belgium 23 33 56 Canada 281 335 616 Chile 77 89 166 Czech Republic 17 17 34 Denmark 47 36 83 Estonia 1 5 6 Finland 25 30 55 France 187 171 358 Germany 277 231 508 Greece 160 134 294 Hungary 53 28 81 Iceland 2 5 7 Ireland 247 258 505 Israel 98 70 168 Italy 185 98 283 Japan 210 278 488 Luxembourg 5 1 6 Mexico 17 18 35 Netherlands 144 98 242 New Zealand 3 941 4 174 8 115 Norway 18 39 57 Poland 97 94 191 Portugal 32 32 64 Slovakia 13 8 21 Slovenia 1 4 5 South Korea 350 376 726 Spain 49 51 100 Sweden 67 100 167 Switzerland 162 124 286 Turkey 110 114 224 UK 3 866 3 307 7 173 USA 612 584 1 196 OECD Total 11 419 10 976 22 395 OECD Proportion of Grand Total (%) 12.9 12.4 25.3 Non-OECD Total 34 165 31 901 66 066 Grand Total 45 584 42 877 88 461 OECD Gender Split (%) 51 49 100
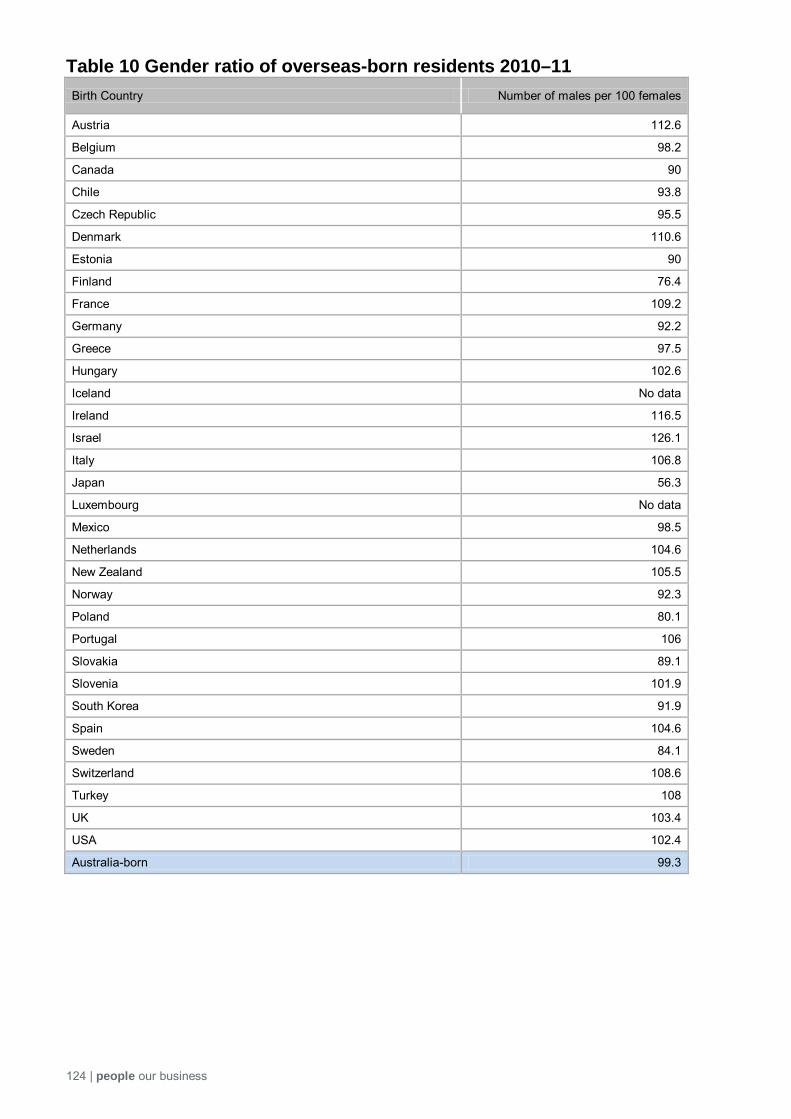
124 | people our business
Table 10 Gender ratio of overseas-born residents 2010–11 Birth Country Number of males per 100 females
Austria 112.6
Belgium 98.2
Canada 90
Chile 93.8
Czech Republic 95.5
Denmark 110.6
Estonia 90
Finland 76.4
France 109.2
Germany 92.2
Greece 97.5
Hungary 102.6
Iceland No data
Ireland 116.5
Israel 126.1
Italy 106.8
Japan 56.3
Luxembourg No data
Mexico 98.5
Netherlands 104.6
New Zealand 105.5
Norway 92.3
Poland 80.1
Portugal 106
Slovakia 89.1
Slovenia 101.9
South Korea 91.9
Spain 104.6
Sweden 84.1
Switzerland 108.6
Turkey 108
UK 103.4
USA 102.4
Australia-born 99.3

people our business | 125
Table 11 Estimate of unlawful non-citizens in Australia at 30 June 2011
Country of Citizenship Estimated Number of Unlawful Non-Citizens*
Austria 210
Belgium 110
Canada 940
Chile 130
Czech Republic 50
Denmark 230
Estonia < 10
Finland 80
France 1 230
Germany 1 430
Greece 420
Hungary 80
Iceland <10
Ireland 1 250
Israel < 10
Italy 750
Japan 1 300
Luxembourg <10
Mexico 110
Netherlands 670
New Zealand 80
Norway 210
Poland 290
Portugal 210
Slovakia 30
Slovenia 20
South Korea 2 730
Spain 420
Sweden 390
Switzerland 350
Turkey 210
UK 3 610
USA 5 080
Estimated total 22 660
Due to known errors in Overstayer data, figures are provided as an estimate only and rounded to the nearest 10. *Excludes persons in immigration detention

126 | people our business
Table 12 Visa cancellations 2010–11 Country of Citizenship Male Female Total
Austria 42 33 75
Belgium 100 50 150
Canada 623 570 1 193
Chile 56 41 97
Czech Republic 34 21 55
Denmark 56 53 109
Estonia 40 33 73
Finland 41 44 85
France 498 320 818
Germany 472 431 903
Greece 15 4 19
Hungary 24 16 40
Iceland 7 5 12
Ireland 518 481 999
Israel 64 46 110
Italy 171 111 282
Japan 394 403 797
Luxembourg 0 0 0
Mexico 24 27 51
Netherlands 233 152 385
New Zealand 3 2 5
Norway 57 50 107
Poland 57 53 110
Portugal 23 11 34
Slovakia 24 16 40
Slovenia 5 0 5
South Korea 1 517 1 140 2 657
Spain 72 62 134
Sweden 127 137 264
Switzerland 64 54 118
Turkey 73 27 100
UK 2 572 2 102 4 674
USA 1 325 1 089 2 414
OECD Total 9 331 7 584 16 915
OECD Proportion of All Cancellations (%) 23.6 19.1 42.7
Total Non-OECD 14 817 7 887 22 705 Grand Total 24 148 15 471 39 620 OECD Gender Split (%) 55.2 44.8 100.0

people our business | 127
Table 13 Visa compliance-related departures 2010–11 Country of Citizenship Male Female Total Departures
Austria 3 6 9
Belgium 14 8 22
Canada 56 56 112
Chile 12 9 21
Czech Republic 18 7 25
Denmark 11 6 17
Estonia 15 10 25
Finland 2 6 8
France 98 52 150
Germany 65 53 118
Greece 18 11 29
Hungary 8 2 10
Iceland 0 0 0
Ireland 268 85 353
Israel 52 22 74
Italy 48 24 72
Japan 39 38 77
Luxembourg 0 0 0
Mexico 7 11 18
Netherlands 19 15 34
New Zealand 127 10 137
Norway 6 3 9
Poland 14 8 22
Portugal 9 1 10
Slovakia 4 2 6
Slovenia 3 1 4
South Korea 345 226 571
Spain 27 9 36
Sweden 22 21 43
Switzerland 7 11 18
Turkey 34 10 44
UK 453 221 674
USA 162 88 250
OECD Total 1 966 1 032 2 998
OECD Proportion of Grand Total (%) 28.9 15.2 44.1
Total Non-OECD 4 838 5 772 3 806
Grand Total 6 804 6 804 6 804
OECD Gender Split (%) 65.6 34.4 100.0 Compliance-related departures include: voluntary and involuntary removals (deportations), monitored departures, supervised departures, voluntary returns, criminal deportations.

128 | people our business
This page has been intentionally left blank.
people our business | 129
Appendix B Relevant literature
130 | people our business
2008 Update of the Migrant’s Fiscal Impact Model Access Economics for Department of Immigration and Citizenship (April 2008) www.immi.gov.au/media/publications/research/_pdf/migrants-fiscal-impact-april-2008.pdf Australian Bureau of Statistics data package: 3101.0 Australian Demographic Statistics—March 2011 www.abs.gov.au/ausstats/[email protected]/mf/3101.0 Australian Bureau of Statistics data package: 3412.0 Migration, Australia—2009–10 www.abs.gov.au/ausstats/[email protected]/mf/3412.0 Creating a Simpler Framework for Temporary and Permanent Entry to Australia Department of Immigration and Citizenship (June 2011) www.immi.gov.au/media/publications/pdf/simpler-visas.pdf Department of Immigration and Citizenship Annual Report 2010–11 Department of Immigration and Citizenship (October 2011) www.immi.gov.au/about/reports/annual/2010-11/pdf Economic, Civic and Social Contributions of First and Second Generation Humanitarian Entrants Professor Graeme Hugo for Department of Immigration and Citizenship (May 2011) www.immi.gov.au/media/publications/research/_pdf/economic-social-civic-contributions-about-the-research2011.pdf Economic, Civic and Social Contributions of Refugees and Humanitarian Entrants: A Literature Review Refugee Council of Australia for Department of Immigration and Citizenship (February 2010) www.immi.gov.au/media/publications/research/_pdf/economic-civic-social-contributions-refugees-humanitarian-entrants-literature-review.pdf Implementing a Simpler Framework for Temporary Residence Work Visas Department of Immigration and Citizenship (December 2011) www.immi.gov.au/media/publications/pdf/temp-res-dereg.pdf Migrant Economic Outcomes and Contributions Department of Immigration and Citizenship (April 2011) www.immi.gov.au/media/publications/research/_pdf/outcomes-contributions-apr11.pdf Net Overseas Migration: why is it so high? Birrell, Bob and Healy, Ernest (2010) , People and Place, vol. 18, no. 2. Population Flows: Immigration Aspects 2009–10 (most recent edition) Department of Immigration and Citizenship (July 2011) www.immi.gov.au/media/publications/statistics/popflows2009-10/pop-flows.pdf Refugee and Humanitarian Issues: Australia’s Response Department of Immigration and Citizenship (June 2011) www.immi.gov.au/media/publications/refugee/ref-hum-issues/pdf/refugee-humanitarian-issues-june11.pdf Report of the 2010 review of the Migration Amendment (Employer Sanctions) Act 2007 Stephen Howells for Department of Immigration and Citizenship (July 2011) www.immi.gov.au/media/publications/compliance/review-employer-sanctions/pdf/howells_report.pdf Settlement Outcomes of New Arrivals Australian Survey Research Group for Department of Immigration and Citizenship (April 2011) www.immi.gov.au/media/publications/research/_pdf/settlement-outcomes-new-arrivals.pdf
people our business | 131
Simpler Visas: Making Visitor Visas Simpler Discussion Paper Department of Immigration and Citizenship (April 2011) www.immi.gov.au/media/publications/discussion-papers/_pdf/visitor-dereg.pdf Strategic Review of the Student Visa Program 2011 Michael Knight for Department of Immigration and Citizenship (June 2011) www.immi.gov.au/students/_pdf/2011-knight-review.pdf Submission to the Joint Select Committee on Australia’s Immigration Detention Network Department of Immigration and Citizenship (September 2011) http://www.immi.gov.au/media/publications/pdf/2011/diac-jscaidn-submission-sept11.pdf Sustainable Australia–Sustainable Communities: A Sustainable Population Strategy for Australia Department of Sustainability, Environment, Water, Population and Communities (May 2011) www.environment.gov.au/sustainability/population/publications/strategy.html The 2010 Intergenerational Report The Treasury, Australian Government (2010) www.treasury.gov.au/igr/igr2010/default.asp The Outlook for Net Overseas Migration September 2011 Department of Immigration and Citizenship (September 2011) www.immi.gov.au/media/publications/statistics/immigration-update/nom-sept11.pdf

132 | people our business
This page has been intentionally left blank.
people our business | 133
Glossary

134 | people our business
Census Refers to the Census of Population and Housing, conducted by the Australian
Bureau of Statistics every five years. The latest Census for which data was
available at the time of this report was conducted in 2006. Data from the most
recent Census, conducted in 2011, will become available from late 2012.
Citizenship by
Conferral
Process of naturalisation whereby an applicant, after meeting all other criteria,
becomes an Australian citizen at a formal citizenship ceremony. The other
naturalisation pathways are Citizenship by Descent, Adoption and Resumption.
Electronic Travel
Authority (ETA)
A type of visa which does not require a stamp or label in the passport. It is
available for citizens of certain countries to visit Australia for tourism or business
purposes.
Estimated resident
population (ERP)
An estimate of the Australian population obtained by adding natural increase (the
excess of births over deaths) and net overseas migration (NOM) occurring during
the period at the beginning of the period. ERP refers to all people, regardless of
nationality or citizenship, who usually live in Australia, with the exception of
foreign diplomatic personnel and their families. Conceptually, it includes usual
residents who are overseas for less than 12 months and excludes overseas
visitors who are in Australia for less than 12 months.
See net overseas migration (NOM).
Irregular maritime
arrival
A person who arrives in Australia by boat at a place outside of Australia’s regular
migration zone (including Christmas Island), without a valid visa. Also referred to
as an ‘offshore entry person’.
Labour force Population aged 15 years or over who are employed or unemployed.
Main English speaking
countries (MESC)
The main English speaking countries, other than Australia, comprise the United
Kingdom, Ireland, Canada, the United States of America, South Africa and New
Zealand. See non-English speaking countries (NESC).
Net overseas
migration (NOM)
Net overseas migration is a measure of the net addition (or loss) to Australia’s
resident population from migration. NOM is net permanent and long-term
overseas migration plus an adjustment for changes in travel intentions.
Non-English speaking
countries (NESC)
Non-English speaking countries are all countries other than those listed under
main English-speaking countries (MESC).
Outcomes The number of permanent visas granted net of visas cancelled, but include any
cancelled visas that have been re-issued in the reference period. The reference
period is the financial year, i.e. 2010–11 etc. See planning levels.
Passenger card Completed by all passengers arriving in or departing from Australia. Information
including occupation, nationality, intended length of stay and state or territory of
intended stay/residence is collected.

people our business | 135
Permanent Settlers Permanent Settlers is the term used that collectively defines the sum of offshore
and onshore permanent migration, i.e. the number of settlers arriving in Australia
from overseas plus the number of people granted permanent residence while in
Australia on a temporary visa.
Planning levels Notional number of places available in the Migration Program for the financial
year, set by the Australian Government. Due to the way outcomes in the
Migration Program are measured, these levels will not always precisely match
outcomes. See outcomes.
Primary applicant The visa applicant who must satisfy the primary criteria for the grant of the visa.
For example, the primary applicant of a Business Long Stay visa must be
sponsored by an Australia employer, while the secondary applicants (their
dependents) need not. See secondary applicant.
Program year The program year (e.g. 2010–11) aligns with the Australian financial year, i.e. 1
July 2010 to 30 June 2011.
Secondary applicant Usually the dependent child/ren or spouse who will accompany the primary
applicant of the visa to Australia. See primary applicant.
Settlement Roughly equivalent to ‘integration’, settlement refers to the experience of
adapting to life in Australia for newly arrived permanent settlers.
Short-term
intracorporate
transfers
Also known as “posted workers”, includes employees whose employer temporarily
transfers them to a different country to provide services for a limited period. In
the Australian context, these include certain persons arriving on one of Australia’s
five short-term business visitor visas or Electronic Travel Authorities, and some
holders of a Business Long Stay visa.
Subclass A unique three-digit numerical code associated with each visa. For example, the
Business Long Stay visa is also known as the subclass 457 visa.