trends in interstate migration among the aged
TRANSCRIPT
Trends in Interstate Migration Among the Aged
By Jacob Fisher*
*Bureau of Research and Statistics, D iv i s i on of Coordinat ion Studies.
T H E N O R M A L M O B I L I T Y of the A m e r i c a n people h a s a l w a y s been acce lerated i n w a r t i m e . T h e last w a r witnessed populat ion shifts on a scale u n s u r passed i n the his tory of the U n i t e d States . T h e B u r e a u of the C e n s u s est imates t h a t f r o m 16 to 18 mi l l ion persons , exclusive of the a r m e d forces, c h a n g e d their county of residence be tween 1940 a n d 1945 1 a n d t h a t i n the 14 m o n t h s after V J - d a y some 11 m i l l ion persons left the county i n w h i c h t h e y were l iv ing w h e n the w a r ended. T h e s e moves are of m a j o r signif icance for t h e c o n s t a n t l y shi f t ing balance between h u m a n a n d n a t u r a l resources i n t h e different p a r t s of the country . T h e y h a v e a b e a r i n g , too, o n the size a n d c h a r a c t e r of t h e community ' s e d u c a t i o n a l , public h e a l t h , a n d social s e c u r i t y problems.
T h e present ar t ic le deals w i t h the p a r t i c i p a t i o n of t h e aged i n interstate m i g r a t i o n . I t suggests a n s w e r s to s u c h questions as t h e re lat ion of r e cent S t a t e changes i n the n u m b e r of aged persons to long- t ime t r e n d s i n t h e g r o w t h of the aged population, the re lat ive roles of n a t u r a l increase a n d m i g r a t i o n i n S t a t e changes i n t h e size of the aged population, the extent of difference i n these respects between the g e n e r a l population a n d the aged, a n d the re lat ion of migrat ion to the dis tr ibut ion of aged beneficiaries u n d e r t h e social secur i ty p r o g r a m .
1 Henry S. Shryock, Jr., "War t ime Shifts of the Civ i l i an Populat ion , " The Milbank Memorial Fund Quarterly, Ju ly 1947.
2 Bureau of the Census, Postwar Migration and Its Causes in the United, States: August, 1945, to October, 1946 (Current Populat ion Reports—Population Characteristics , Series P-20, No. 4 ) .
State Changes in Aged Population in 1940-46 and in Earlier Years
F r o m J u l y 1940 to J u l y 1946 the n u m b e r of persons aged 65 a n d over i n t h e U n i t e d S t a t e s i n c r e a s e d by 15 percent . T h i s growth was distr ibuted very unevenly . T h e B u r e a u of t h e C e n s u s does not m a k e i n t e r c e n s a l -y e a r estimates of S t a t e population by
age, b u t pro ject ions by the S o c i a l S e c u r i t y A d m i n i s t r a t i o n , based on m o r ta l i ty s t a t i s t i c s , i n d i c a t e t h a t p e r h a p s 18 S t a t e s g a i n e d aged population a t a r a t e equal to or greater t h a n the n a t i o n a l average . I n the other 31 S t a t e s t h e r a t e of growth appears to h a v e been below the average, a n d i n 12 S t a t e s t h e i n c r e a s e was less t h a n a n est imated 10 percent (table 1 ) .
I n c r e a s e s of 25 percent or m o r e seem to h a v e t a k e n place i n 4 W e s t e r n S t a t e s — A r i z o n a , C a l i f o r n i a , N e v a d a , a n d W y o m i n g . A l l but 4 of the other States w i t h a b e t t e r - t h a n - a v e r a g e r a t e were e i ther i n the West or i n the N o r t h e a s t e r n a n d N o r t h C e n t r a l r e gions. O f t h e 12 States w i t h probable gains of less t h a n 10 percent , 7 were i n the S o u t h a n d 3 i n New E n g l a n d .
W e r e these regional differences p e c u l i a r to 1940-46 or d id they reflect a p a t t e r n evident also i n earl ier y e a r s ?
E x a m i n a t i o n of the changes f r o m 1930 to 1940 reveals some likenesses but also s e v e r a l i m p o r t a n t differences. O f t h e 18 S t a t e s w i t h a rate of growth i n aged populat ion d u r i n g the forties above t h e n a t i o n a l average, 1 2 — h a l f of t h e m W e s t e r n S t a t e s — a l s o h a d b e t t e r - t h a n - a v e r a g e gains i n the th ir t ies . A n d t h e 3 New E n g l a n d S t a t e s — M a i n e , N e w H a m p s h i r e , a n d V e r m o n t — t h a t h a d a rate of growth i n the fort ies of h a l f or less t h a n h a l f the n a t i o n a l average were also i n t h a t group i n t h e t h i r t i e s . B u t here t h e resemblance ends. U n l i k e their e x per ience i n t h e forties , most S o u t h e r n S t a t e s showed large increments of aged persons i n the thirt ies relat ive to t h e n a t i o n a l rate of increase . ( T h i s i s t r u e e v e n w h e n al lowance is m a d e for w h a t appears to h a v e been, i n the j u d g m e n t of the C e n s u s B u r e a u , the m o r e frequent overstate m e n t of age i n the S o u t h i n 1940.) T h e i n d u s t r i a l S t a t e s i n the Northeast a n d N o r t h C e n t r a l regions, by c o n t r a s t , w e r e p r e d o m i n a n t l y above the m e d i a n S t a t e i n r a t e of growth i n the forties but below the m e d i a n i n the thir t ies .
A s u b s t a n t i a l l y different picture emerges f r o m a c o m p a r i s o n of the
periods 1940-46 a n d 1920-30. I n both decades the W e s t e r n States by a n d large h a d b e t t e r - t h a n - a v e r a g e g a i n s i n t h e i r aged populat ion, a n d t h e S o u t h e r n S t a t e s , w i t h some exceptions, showed below-average rates of growth. T h e greatest difference b e tween the two periods is found for t h e i n d u s t r i a l S t a t e s east of the M i s s i s s ippi a n d n o r t h of the O h i o a n d P o t o m a c R i v e r s . T h e s e States tended to exceed the n a t i o n a l r a t e of g r o w t h i n the forties but exhibited a m i x e d p a t t e r n i n the twenties .
W h e n t h e ent ire period 1920-46 i s considered, the c u m u l a t i v e effect of the d o m i n a n t p a t t e r n s i n the twent ies a n d forties emerges c learly . F l o r i d a , where the aged populat ion more t h a n quadrupled , h a d the most r a p i d rate of growth, but 7 of the 10 S t a t e s w i t h the greatest re lat ive gains were i n the West , a n d of the 10 States w i t h the smal lest re lat ive increase , 5 were i n the S o u t h . A l l but 1 of the W e s t e r n States exceeded the n a t i o n a l r a t e of g r o w t h ; 13 of the 17 S o u t h e r n States h a d a l e s s - t h a n - a v e r a g e p e r centage gain . T h e i n d u s t r i a l S t a t e s of the N o r t h fel l somewhere between these two t r e n d s .
I n this perspective t h e experience of the States i n 1940-46 would appear to represent not a phenomenon p e c u l i a r to the w a r y e a r s but p a r t of a l o n g t ime t r e n d , w h i c h m a y be expected to continue . T h e 1930's witnessed a t e m p o r a r y break i n the t r e n d , for reasons re lated to t h e depression a n d d i s cussed more fu l ly below.
Natural Growth as a Factor in State Changes in Number of Aged
H o w m u c h of a State ' s increase i n the n u m b e r of aged is due to the a g i n g of the res ident population, how m u c h to the b a l a n c e of m i g r a t i o n of aged persons?
T h e f irst factor h a s two s ides : t h e r a t e a t w h i c h the size of the aged population is i n c r e a s e d by the a c c e s sion of persons r e a c h i n g age 65 a n d the rate a t w h i c h i t is decreased by departures due to death . T h e i m portance of accessions i s not the same i n e a c h S t a t e . B e c a u s e of differences i n b i r t h rates i n ear l ier years a n d i n m i g r a t i o n experience , the age classes feeding into the group 65 years a n d over are re lat ive ly l a r g e r i n some States t h a n i n others . S u c h States
are l ikely to show a greater p r o p o r t ional increase i n aged population. I n 1940 the percentage r e l a t i o n s h i p between the age class 60-64 y e a r s a n d the age class 65 years a n d over v a r i e d among the States from 44.8 percent i n M a i n e to 66.3 percent i n N e v a d a .
T h e influence of the losses c a u s e d by d e a t h m a y be measured by the m o r tal i ty experience of the age groups affected. P e r s o n s aged 65 a n d over i n a given S t a t e i n 1948, for example , a r e the survivors among those w h o were 57 years a n d over i n 1940 ( leaving aside for the m o m e n t the effect of i n - m i -grat ion a n d o u t - m i g r a t i o n ) . I f S t a t e s
differ i n s u r v i v a l rates i n the older ages, t h e n they m a y be expected to differ also i n the rate of g r o w t h i n t h e i r aged population. I n 1940 t h e d e a t h rate for persons 65 y e a r s a n d over v a r i e d a m o n g t h e States f rom 59 p e r 1,000 i n A r k a n s a s to 79.4 i n M a r y l a n d . 3 I n d u s t r i a l S t a t e s by a n d large tended to have rates above t h e n a t i o n a l average of 71.7, a n d r u r a l S tates to h a v e rates below the a v e r age. H o w m u c h of t h i s difference is
3 Bureau of the Census, Summary of Vital Statistics, 1940 (Vital Statistics— Special Reports, Vol. 14).
due to m o r e complete report ing of d e a t h s i n u r b a n a r e a s is not k n o w n .
S o m e of the v a r i a t i o n i n d e a t h rates reflects differences i n t h e composi t ion of the aged populat ion . T h e d e a t h rate is h i g h e r for males t h a n females i n every age c l a s s ; i t is h igher for nonwhite persons i n the two age groups 66-69 a n d 70-74, but h i g h e r for w h i t e persons i n a l l succeeding age c lasses ; a n d it r ises , of course, as age a d v a n c e s . O t h e r factors being equal , S t a t e s w i t h a n aged population c o n s is t ing of re lat ively m o r e m e n t h a n i n the U n i t e d States as a whole, or of re lat ive ly more persons who are whi te or h a v e a h i g h e r m e d i a n age, should h a v e a death r a t e for t h e aged i n e x cess of the n a t i o n a l average.
E v e n w i t h i n a given age-sex-color c lass , however, S t a t e s are u n l i k e i n t h e i r m o r t a l i t y experience. T h i s i s a second factor m a k i n g for v a r i a t i o n . T h e d e a t h r a t e i n 1940 for white m e n aged 65 to 74, for i n s t a n c e , r a n g e d f r o m 42.2 per 1,000 i n S o u t h D a k o t a to 63.1 i n R h o d e I s l a n d . 4 T h i s k i n d of difference, i t is sometimes suggested, reflects i n p a r t differences i n m o r t a l i ty a t younger ages ; t h a t is , older m e n a n d w o m e n i n S t a t e s w i t h relat ively h i g h d e a t h rates for younger persons h a v e a better expectat ion of life t h a n t h e i r contemporaries i n States w h e r e the m o r t a l i t y experience a t younger ages is more favorable .
B u t v a r i a t i o n i n t u r n - o v e r ( the net b a l a n c e of accessions a n d separations i n t h e n u m b e r of persons 65 years a n d over) is not a complete explanat ion of S t a t e differences i n the r a t e of g r o w t h of the aged population. K a n sas , w i t h a n " a c c e s s i o n r a t i o " of 48.1 p e r c e n t i n 1940 a n d a d e a t h rate of 67 p e r 1,000 persons 65 y e a r s a n d over i n t h a t y e a r , showed a 1930-40 g a i n of o n l y 21 percent i n its aged p o p u l a t i o n , whi le F l o r i d a , w i t h the s a m e d e a t h r a t e a n d a n access ion r a t e of 49.8 percent , i n c r e a s e d its aged populat ion 84 percent d u r i n g the s a m e decade. T h e inference is obvious t h a t some aged persons left K a n s a s i n t h e t h i r t i e s to live e lsewhere a n d t h a t F l o r i d a experienced a substant ia l i n -m i g r a t i o n of the aged. F o r a n u m b e r
4 Sixteenth Census of the United States: 1940, Vital Statistics Rates in the United States 1900-1940, 1943, table 23.
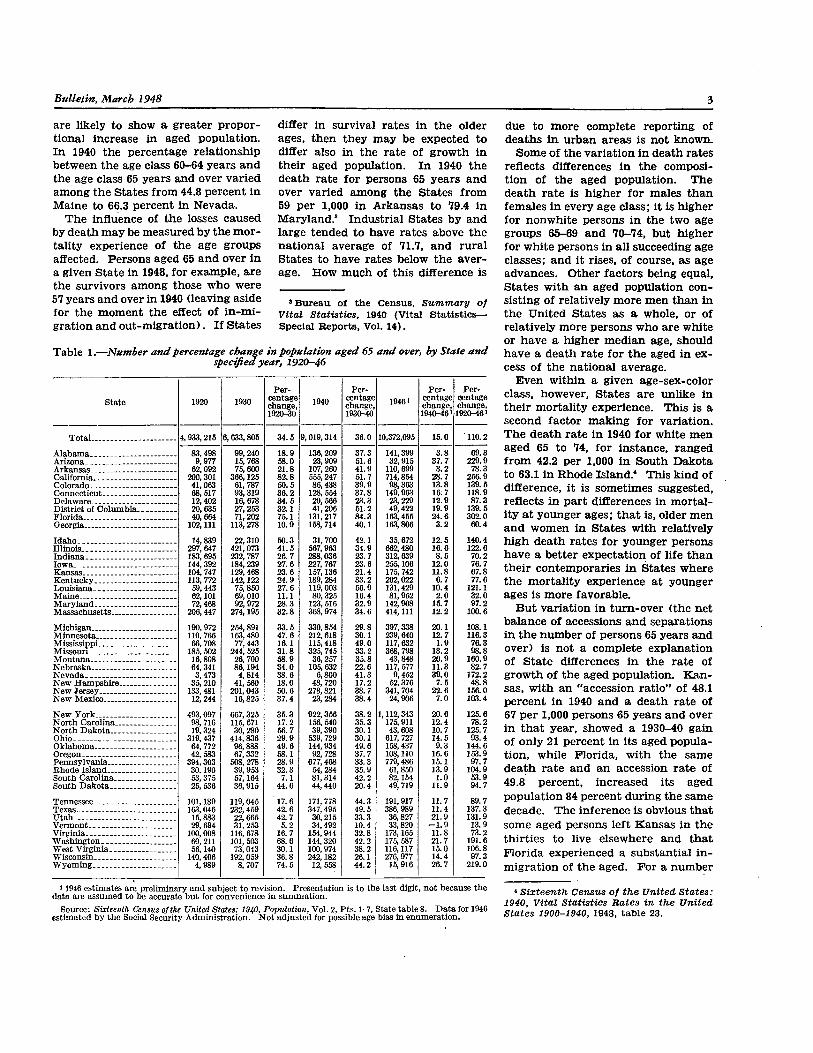
Table 1.—Number and percentage change in population aged 65 and over, by State and specified year, 1920-46
State 1920 1930 Per
centage change, 1920-30
1940 Per
centage change, 1930-40
19461
Percentage change, 1940-461
Percentage change, 1920-461
Tota l 4,933,215 6,633,805 34.5 9,019,314 36.0 10,372,095 15.0 110.2
Alabama 83,498 99,240 18.9 136,209 37.3 141,399 3.8 69.3 Arizona 9,977 15,768 58.0 23,909 51.6 32,915 37.7 229.9 Arkansas 62,092 75,600 21.8 107, 260 41.9 110,699 3.2 78.3
California 200,301 366,125 82.8 555,247 51.7 714,854 28.7 256.9 Colorado 41,063 61,787 50.5 86,438 39.9 98,363 13.8 139.5 Connecticut 68,517 93,319 36.2 128,554 37.8 149,963 16.7 118.9 Delaware 12,402 16,678 34.5 20,566 23.3 23,229 12.9 87.3 District of Columbia 20,635 27,253 32.1 41,206 51.2 49,422 19.9 139.5 Florida 40,664 71,202 75.1 131,217 84.3 163,455 24.6 302.0 Georgia 102,111 113,278 10.9 158,714 40.1 163,806 3.2 60.4
Idaho 14,839 22,310 50.3 31,700 42.1 35,672 12.5 140.4 Il l inois 297,647 421,073 41.5 567,963 34.9 662,480 16.6 122.6 Indiana 183,695 232,787 26.7 288,036 23.7 312,639 8.5 70.2 Iowa 144,392 184,239 27.6 227,767 23.6 255,106 12.0 76.7 K a n s a s . 104,747 129,468 23.6 157,136 21.4 175,742 11.8 67.8 Kentucky 113,772 142,122 24.9 189,284 33.2 202,022 6.7 77.6 Louisiana 59,443 75,850 27.6 119,003 56.9 131,429 10.4 121.1 Maine 62,101 69,010 11.1 80,325 16.4 81,952 2.0 32.0 Mary land 72,468 92,972 28.3 123,516 32.9 142,908 15.7 97.2 Massachusetts 206,447 274,195 32.8 368,974 34.6 414,111 12.2 100.6 Michigan 190,972 254,891 33.5 330,854 29.8 397,338 20.1 108.1 Minnesota 110,766 163,480 47.6 212,618 30.1 239,640 12.7 116.3 Mississippi 66,708 77,443 16.1 115,418 49.0 117,632 1.9 76.3 Missouri 185,502 244,525 31.8 325,745 33.2 368,798 13.2 98.8 Montana 16,808 26,700 58.9 36,257 35.8 43,848 20.9 160.9 Nebraska 64,341 86,194 34.0 105,632 22.6 117,577 11.3 82.7 Nevada 3,473 4,814 38.6 6,800 41.3 9,452 39.0 172.2 New Hampshire 35,210 41,560 18.0 48,720 17.2 52,376 7.5 48.8 New Jersey 133,481 201,043 50.6 278,821 38.7 341,704 22.6 156.0 New Mexico 12,244 16,825 37.4 23,284 38.4 24,906 7.0 103.4 New York 493,097 667,325 35.3 922,356 38.2 1,112,343 20.6 125.6 N o r t h Carolina 98,716 115,671 17.2 156,540 35.3 175,911 12.4 78.2 N o r t h Dakota 19,324 30,280 56.7 39,390 30.1 43, 608 10.7 125.7 Ohio 319,437 414,836 29.9 539,729 30.1 617,727 14.5 93.4 Oklahoma 64,772 96,888 49.6 144,934 49.6 158,437 9.3 144.6 Oregon 42,583 67,332 58.1 92,728 37.7 108,110 16.6 153.9 Pennsylvania 394,303 508,278 28.9 677,468 33.3 779,486 15.1 97.7 Rhode Island 30,190 39,953 32.3 54,284 35.9 61,850 13.9 104.9
South Carolina 53,375 57,164 7.1 81,314 42.2 82,154 1.0 53.9 South Dakota 25,536 36,915 44.6 44,440 20.4 49,719 11.9 94.7 Tennessee 101,189 119,045 17.6 171,778 44.3 191,917 11.7 89.7 Texas 163,046 232,459 42.6 347,495 49.5 386,989 11.4 137.3 Utah 15,883 22,665 42.7 30,215 33.3 36,827 21.9 131.9 Vermont 29,694 31,253 5.2 34,492 10.4 33,820 - 1 . 9 13.9 Virginia 100,008 116,678 16.7 154,944 32.8 173,165 11.8 73.2 Washington 60,211 101,503 68.6 144,320 42.2 175,587 21.7 191.6 West Virginia 56,140 73,043 30.1 100,974 38.2 116,117 15.0 106.8 Wisconsin 140,406 192,059 36.8 242,182 26.1 276,977 14.4 97.3
Wyoming 4,989 8,707 74.5 12,558 44.2 15,916 26.7 219.0
1 1946 estimates are preliminary and subject to revision. Presentation is to the last d ig i t , not because the data are assumed to be accurate but for convenience i n summation.
Source: Sixteenth Census of the United States: 1940, Population, V o l . 2, Pts. 1-7, State table 8. Data for 1946 estimated by the Social Security Administrat ion . N o t adjusted for possible age bias i n enumeration.
of S t a t e s , as a m a t t e r of fact , m i g r a t ion i s a lmost as important a factor i n d e t e r m i n i n g the size of the aged p o p u l a t i o n as is n a t u r a l growth.
The Effect of Migration I n 1940, for the first t ime i n a n y
d e c e n n i a l census, the populat ion schedule inc luded a question on place of residence 5 y e a r s earl ier . T h e t a b u lat ions based on the replies do not tell us h o w m a n y different indiv iduals moved f r o m one place to a n o t h e r a n d the n u m b e r of moves made , but w i t h
respect to persons l i v i n g i n the U n i t e d States i n b o t h 1935 a n d 1940 we do know the n u m b e r l i v i n g i n the same place i n both y e a r s a n d the number who were i n a different S t a t e or county a t the e n d of the period. F o r e a c h S t a t e , t h r e e figures are t h u s a v a i l a b l e — t h e n u m b e r who l ived i n the S t a t e i n 1940 but not i n 1935 ( i n -m i g r a n t s ) , t h e n u m b e r who l ived there i n 1935 but not i n 1940 (out -m i g r a n t s ) , a n d the n e t balance ( i n -m i g r a n t s m i n u s o u t - m i g r a n t s ) .
T h e d a t a i n d i c a t e t h a t a l l States
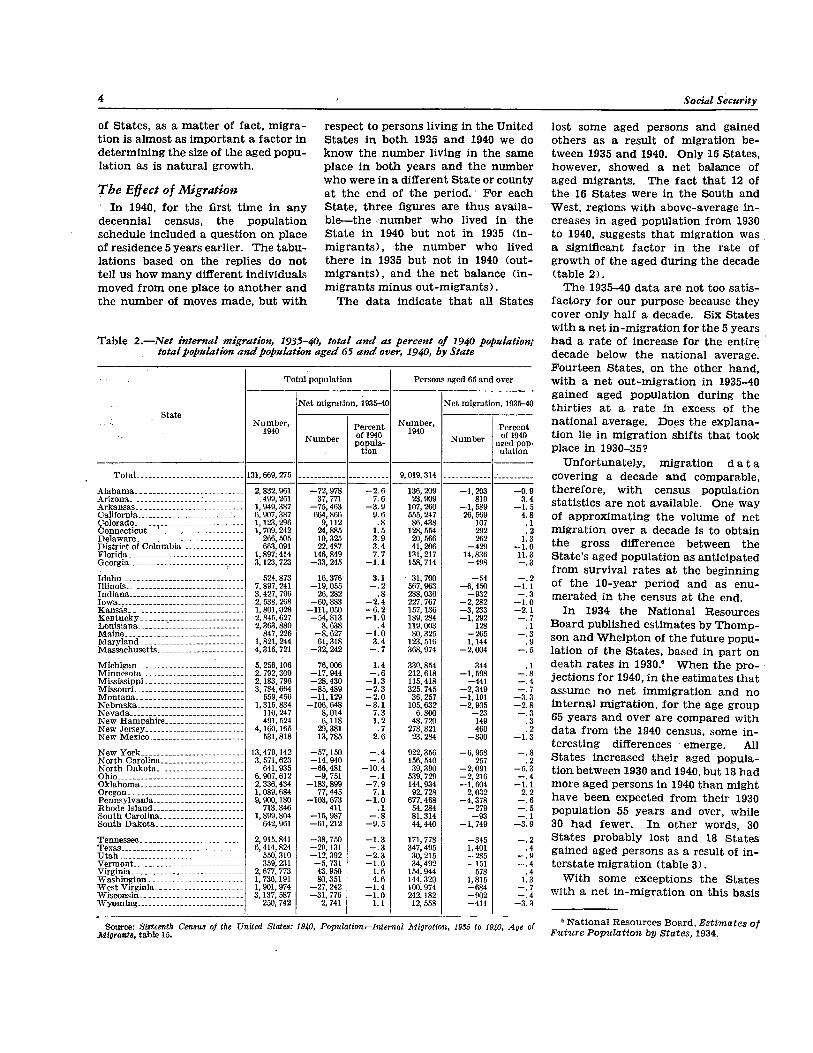
T a b l e 2.—Net internal migration, 1935-40, total and as percent of 1940 population; total population and population aged 65 and over, 1940, by State
State
Tota l population Persons aged 65 and over
State Number ,
1940
Net migration, 1935-40
Number , 1940
N e t migration, 1935-40 State
Number , 1940
Number Percent of 1940 popula
t ion
Number , 1940
Number Percent of 1940
aged population
Tota l 131,669,275 --- ---
9,019,314 --- ---
Alabama 2,832,961 -72,978 - 2 . 6 136,209 -1,203 - 0 . 9 Arizona 499,261 37,771 7.6 23,909 810 3.4
Arkansas 1,949,387 -75,463 - 3 . 9 107,260 -1,589 - 1 . 5 California 6,907,387 664,866 9.6 555,247 26,569 4.8 Colorado 1,123,296 9,112 .8 86,438 107 . 1 Connecticut 1,709,242 24,885 1.5 128,554 292 .2 Delaware 266,605 10,325 3.9 20,566 262 1.3 Distr ic t of Columbia 663,091 22,487 3.4 41,206 -429 - 1 . 0 Florida 1,897,414 146,849 7.7 131,217 14,836 11.3 Georgia 3,123,723 -33,245 - 1 . 1 158,714 -498 - . 3 Idaho 524,873 16,376 3.1 31,700 - 5 4 - . 2
Illinois 7,897,241 -19,055 - . 2 567,963 -6,450 - 1 . 1 Indiana 3,427,796 26,282 .8 288,036 -932 - . 3 Iowa 2,538,268 -60,883 - 2 . 4 227,767 -2.282 - 1 . 0 Kansas 1,801,028 -111,050 - 6 . 2 157,136 -3,233 - 2 . 1 Kentucky 2,845,627 -54,813 - 1 . 9 189,284 -1,292 - . 7 Louisiana 2,363,880 8,638 .4 119,003 128 . 1 Maine 847,226 -8,627 - 1 . 0 80,325 -265 - . 3 M a r y l a n d 1,821,244 61,318 3.4 123,516 1,144 .9 Massachusetts 4,316,721 -32,242 - . 7 368,974 -2,004 - . 5 Michigan 5,256,106 76,006 1.4 330,854 344 . 1 Minnesota 2,792,300 -17,944 - . 6 212,618 -1,598 - . 8 Mississippi 2,183,796 -28,430 - 1 . 3 115.418 - 4 4 1 - . 4 Missouri 3,784,664 -85,489 - 2 . 3 325,745 -2,349 - . 7 Montana 589,456 -11,129 - 2 . 0 36,257 -1 ,191 - 3 . 3 Nebraska 1,315,834 -106,648 - 8 . 1 105,632 -2,905 - 2 . 8 Nevada 110,247 8,014 7.3 6,800 - 2 3 - . 3 New Hampshire 491,524 6,118 1.2 48,720 149 .3 New Jersey 4,160,165 29,381 .7 278,821 460 .2 New Mexico 531,818 13,785 2.6 23,284 -300 - 1 . 3 New York 13,479,142 -57,150 - . 4 922,356 -6,958 - . 8 N o r t h Carolina 3,571,623 -14,940 - . 4 156,540 257 .2 N o r t h Dakota 641,935 -66,481 - 1 0 . 4 39,390 -2 ,091 - 5 . 3 Ohio 6,907,612 -9 ,751 - . 1 539,729 -2,216 - . 4 Oklahoma 2,336,434 -183,899 - 7 . 9 144,934 -1,604 - 1 . 1 Oregon 1,089,684 77,445 7.1 92,728 2,032 2.2 Pennsylvania 9,900,180 -103,673 - 1 . 0 677,468 -4,378 - . 6 Rhode Island 713,346 411 . 1 54,284 -279 - . 5 South Carolina 1,899,804 -15,987 - . 8 81,314 - 9 3 - . 1 South Dakota 642,961 -61,212 - 9 . 5 44,440 -1,749 - 3 . 9
Tennessee 2,915,841 -38,750 - 1 . 3 171,778 -345 -.2 Texas 6,414,824 -20,131 - . 3 347,495 1,401 .4 U t a h 550,310 -12,392 - 2 . 3 30,215 -285 - .9 Vermont 359,231 -5 ,731 - 1 . 6 34,492 - 1 5 1 - . 4 Virginia 2,677,773 43,950 1.6 154,944 578 .4 Washington 1,736,191 80,351 4.6 144,320 1,815 1.3 West Virginia 1,901,974 -27,242 - 1 . 4 100,974 -684 - . 7 Wisconsin 3,137,587 -31,776 - 1 . 0 242,182 -902 - . 4 W y o m i n g 250,742 2,741 1.1 12,558 - 4 1 1 - 3 . 3
Source: Sixteenth Census of the United States: 1940, Population—Internal Migration, 1935 to 1940, Age of Migrants, table 15.
lost some aged persons a n d gained others as a resul t of migrat ion be tween 1935 a n d 1940. O n l y 16 States , however , showed a net ba lance of aged m i g r a n t s . T h e f a c t t h a t 12 of the 16 States were i n the S o u t h a n d West , regions w i t h above-average i n creases i n aged population from 1930 to 1940, suggests t h a t migrat ion was a s ignif icant factor i n the rate of growth of the aged d u r i n g the decade (table 2 ) .
T h e 1935-40 d a t a are not too s a t i s factory for our purpose because they cover only h a l f a decade. S i x States w i t h a net i n - m i g r a t i o n for the 5 years h a d a r a t e of i n c r e a s e for the entire decade below the n a t i o n a l average. F o u r t e e n S t a t e s , o n t h e other h a n d , w i t h a net o u t - m i g r a t i o n i n 1935-40 gained aged populat ion dur ing the thirt ies a t a r a t e i n excess of the n a t i o n a l average. Does the e x p l a n a t ion lie i n m i g r a t i o n shifts that took place i n 1930-35?
U n f o r t u n a t e l y , m i g r a t i o n d a t a covering a decade a n d comparable , therefore, w i t h census population stat is t ics a r e not avai lable . O n e w a y of a p p r o x i m a t i n g the volume of net m i g r a t i o n over a decade is to obtain the gross difference between the S t a t e ' s aged populat ion as ant ic ipated f rom s u r v i v a l r a t e s a t the beginning of the 10 -year period a n d as e n u merated i n the census a t the end.
I n 1934 the N a t i o n a l Resources B o a r d publ ished est imates by T h o m p son a n d W h e l p t o n of t h e future popul a t i o n of t h e S t a t e s , based i n p a r t on d e a t h r a t e s i n 1930.5 W h e n the p r o ject ions for 1940, i n the estimates t h a t assume no net i m m i g r a t i o n a n d no i n t e r n a l m i g r a t i o n , for the age group 65 y e a r s a n d over are compared w i t h d a t a f r o m the 1940 census , some i n terest ing differences emerge. A l l States i n c r e a s e d t h e i r aged p o p u l a t i o n between 1930 a n d 1940, but 18 h a d more aged persons i n 1940 t h a n might h a v e been expected f rom their 1930 population 55 y e a r s a n d over, whi le 30 h a d fewer. I n other words, 30 S t a t e s probably lost a n d 18 States gained aged persons as a result of i n terstate m i g r a t i o n (table 3 ) .
W i t h some exceptions the States w i t h a net i n - m i g r a t i o n on this basis
5 National Resources Board, Estimates of Future Population by States, 1934.
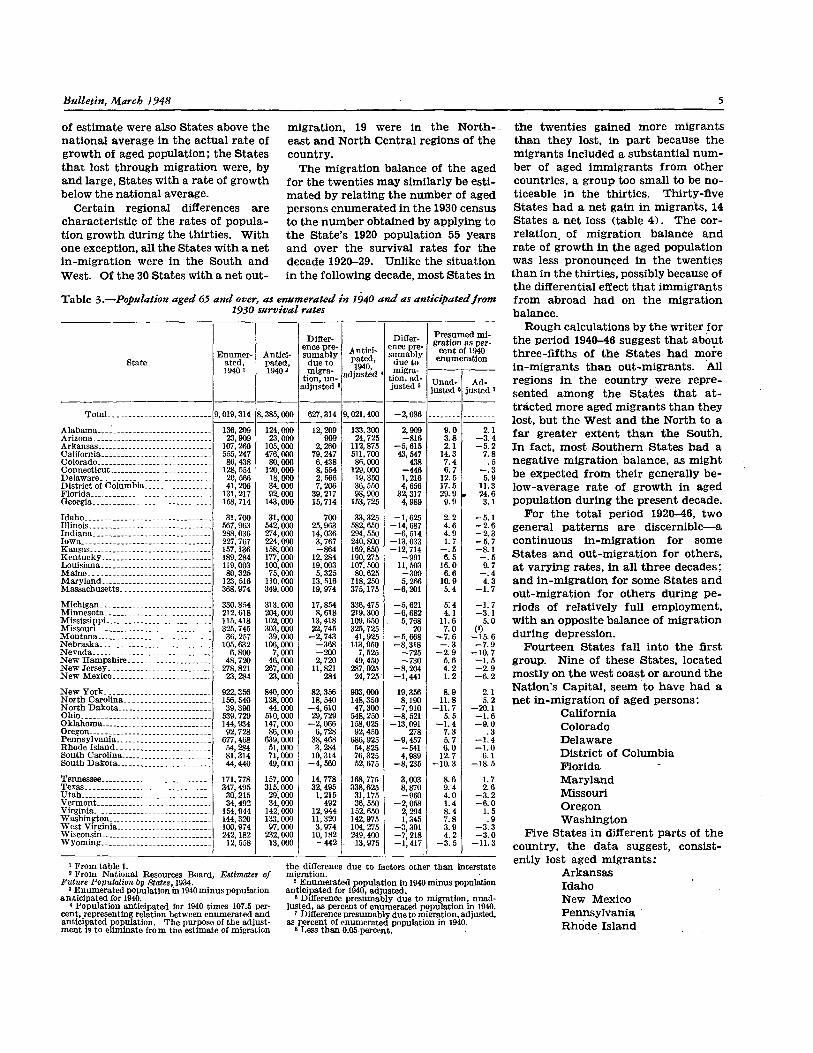
of est imate were also States above the n a t i o n a l average i n the actual r a t e of growth of aged populat ion; the States t h a t lost through migrat ion were, by a n d large , States w i t h a rate of growth below the n a t i o n a l average.
C e r t a i n regional differences a r e c h a r a c t e r i s t i c of the rates of p o p u l a t ion growth dur ing the thir t ies . W i t h one exception, a l l the States w i t h a net i n - m i g r a t i o n were i n the S o u t h a n d West . O f the 30 States w i t h a net out -
m i g r a t i o n , 19 were i n the N o r t h east a n d N o r t h C e n t r a l regions of the country .
T h e m i g r a t i o n b a l a n c e of the aged for the twenties m a y s i m i l a r l y be e s t i m a t e d by r e l a t i n g the n u m b e r of aged persons e n u m e r a t e d i n the 1930 census to the n u m b e r obtained by apply ing to t h e S t a t e ' s 1920 population 55 y e a r s a n d over the s u r v i v a l r a t e s for t h e decade 1920-29. U n l i k e the s i t u a t i o n i n the following decade, most S t a t e s i n
T a b l e 3.—Population aged 65 and over, as enumerated in 1940 and as anticipated from 1930 survival rates
State Enumer
ated, 1940 1
A n t i c i pated, 19402
Differ-ence presumably
due to migra
t ion , u n adjusted 3
A n t i c i pated, 1940,
adjusted 4
Difference presumably
due to migra
t ion , adjusted s
Presumed m i gration as per
cent of 1940 enumeration State
Enumerated, 1940 1
A n t i c i pated, 19402
Differ-ence presumably
due to migra
t ion , u n adjusted 3
A n t i c i pated, 1940,
adjusted 4
Difference presumably
due to migra
t ion , adjusted s Unad
justed 6
A d justed 7
Total 9,019,314 8,385,000 627,314 9,021,400 -2,086 --- ---
136,209 124,000 12,209 133,300 2,909 9.0 2.1 Arizona 23,909 23,000 909 24,725 -816 3.8 - 3 . 4
Arkansas 107,260 105,000 2,260 112,875 -5,615 2.1 - 5 . 2 California 555,247 476,000 79,247 511,700 43,547 14.3 7.8 Colorado 86,438 80,000 6,438 86,000 438 7.4 .5 Connecticut 128,554 120,000 8,554 129,000 -446 6.7 - . 3 Delaware 20,566 18,000 2,566 19,350 1,216 12.5 5.9 Distr i c t of Columbia 41,206 34,000 7,206 36,650 4,656 17.5 11.3 Florida 131,217 92,000 39,217 98,900 32,317 29.9 24.6
Georgia 158,714 143,000 15,714 153,725 4,989 9.9 3.1 Idaho 31,700 31,000 700 33,325 -1,625 2.2 - 5 . 1 I l l inois 567,963 542,000 25,963 582,650 -14,687 4.6 - 2 . 6 Indiana 288,036 274,000 14,036 294,550 -6,514 4.9 - 2 . 3 Iowa 227,767 224,000 3,767 240,800 -13,033 1.7 - 5 . 7 Kansas 157,136 158,000 -864 169,850 -12,714 - . 5 - 8 . 1 Kentucky 189,284 177,000 12,284 190,275 - 9 9 1 6.5 - . 5 Louisiana 119,003 100,000 19,003 107,500 11,503 16.0 9.7
Maine 80,325 75,000 5,325 80,625 -300 6.6 - . 4 M a r y l a n d 123,516 110,000 13,516 118,250 5,266 10.9 4.3 Massachusetts 368,974 349,000 19,974 375,175 -6 ,201 5.4 - 1 . 7 Michigan 330,854 313,000 17,854 336,475 -5 ,621 5:4 - 1 . 7 Minnesota 212,618 204,000 8,618 219,300 -6,682 4.1 - 3 . 1 Mississippi 115,418 102,000 13,418 109,650 5,768 11.6 5.0 Missouri 325,745 303,000 22,745 325,725 20 7.0 (8)
36,257 39,000 -2,743 41,925 -5,668 - 7 . 6 - 1 5 . 6 Nebraska 105,632 106,000 -368 113,950 -8,318 - . 3 - 7 . 9 Nevada 6,800 7,000 -200 7,525 -725 - 2 . 9 - 10 .7 N e w Hampshire 48,720 46,000 2,720 49,450 -730 5.6 -1.5 N e w Jersey 278,821 267,000 11,821 287,025 -8,204 4.2 - 2 . 9 N e w Mexico 23,284 23,000 284 24,725 -1,441 1.2 - 6 . 2 N e w York 922,356 840,000 82,356 903,000 19,356 8.9 2.1 N o r t h Carolina 156,540 138,000 18,540 148,350 8,190 11.8 5.2 N o r t h Dakota 39,390 44,000 -4 ,610 47,300 -7,910 - 1 1 . 7 - 2 0 . 1 Ohio 539,729 510,000 29,729 548,250 -8 ,521 5.5 - 1 . 6
Oklahoma 144,934 147,000 -2 ,066 158,025 -13,091 - 1 . 4 - 9 . 0 Oregon 92,728 86,000 6,728 92,450 278 7.3 .3 Pennsylvania 677,468 639,000 38,468 686,925 -9,457 5.7 - 1 . 4 Ehode Island 54,284 51,000 3,284 54,825 - 5 4 1 6.0 - 1 . 0 South Carolina 81,314 71,000 10,314 76,325 4,989 12.7 6.1 South Dakota 44,440 49,000 -4 ,560 52,675 -8,235 -10 .3 -18 .5 Tennessee 171,778 157,000 14,778 168,775 3,003 8.6 1.7 Texas 347,495 315,000 32,495 338,625 8,870 9.4 2.6 U t a h 30,215 29,000 1,215 31,175 -960 4.0 - 3 . 2 Vermont 34,492 34,000 492 36,550 -2,058 1.4 - 6 . 0 Virginia 154,944 142,000 12,944 152,650 2,294 8.4 1.5 Washington 144,320 133,000 11,320 142,975 1,345 7.8 .9 West Virginia 100,974 97,000 3,974 104,275 -3 ,301 3.9 - 3 . 3 Wisconsin 242,182 232,000 10,182 249,400 -7,218 4.2 - 3 . 0 Wyoming 12,558 13,000 -442 13,975 -1,417 - 3 . 5 - 11 .3
1 From table 1. 2 From National Resources Board, Estimates of
Future Population by States, 1934. 3 Enumerated population in 1940 minus population
antic ipated for 1940. 4 Population anticipated for 1940 times 107.5 per
cent, representing relation between enumerated and anticipated population. The purpose of the adjustment is to eliminate f r o m the estimate of migration
the difference due to factors other than interstate migration.
5 Enumerated population i n 1940 minus population anticipated for 1940, adjusted.
6 Difference presumably due to migration, unadjusted, as percent of enumerated population in 1940.
7 Difference presumably due to migration, adjusted, as percent of enumerated population i n 1940.
8 Less than 0.05 percent.
the twenties gained m o r e m i g r a n t s t h a n t h e y lost, i n p a r t because the m i g r a n t s i n c l u d e d a s u b s t a n t i a l n u m ber of aged i m m i g r a n t s f r o m other countr ies , a group too s m a l l to be n o ticeable i n the thir t ies . T h i r t y - f i v e States h a d a net g a i n i n m i g r a n t s , 14 States a net loss (table 4 ) . T h e c o r r e l a t i o n of m i g r a t i o n b a l a n c e a n d r a t e of g r o w t h i n the aged population was less pronounced i n the twenties t h a n i n t h e th ir t ies , possibly because of the differential effect t h a t i m m i g r a n t s f r o m a b r o a d h a d on t h e m i g r a t i o n b a l a n c e .
R o u g h ca lculat ions by t h e wri ter for the period 1940-46 suggest t h a t about three - f i f ths of the S t a t e s h a d m o r e i n - m i g r a n t s t h a n o u t - m i g r a n t s . A l l regions i n the c o u n t r y w e r e r e p r e sented a m o n g the S t a t e s t h a t a t t r a c t e d more aged m i g r a n t s t h a n t h e y lost, but the W e s t a n d t h e N o r t h to a f a r greater extent t h a n t h e S o u t h . I n fact , most S o u t h e r n States h a d a negative m i g r a t i o n b a l a n c e , as m i g h t be expected f r o m t h e i r general ly b e l o w - a v e r a g e rate of g r o w t h i n aged populat ion d u r i n g the present decade.
F o r t h e total period 1920-46, two general pat terns a r e d i s c e r n i b l e — a continuous i n - m i g r a t i o n for some S t a t e s a n d o u t - m i g r a t i o n for others , a t v a r y i n g rates , i n a l l t h r e e decades ; a n d i n - m i g r a t i o n for some States a n d o u t - m i g r a t i o n for others d u r i n g p e riods of re lat ively ful l employment , w i t h a n opposite b a l a n c e of m i g r a t i o n d u r i n g depression.
F o u r t e e n States f a l l into t h e first group. N i n e of these S t a t e s , located most ly on the west coast or a r o u n d t h e Nat ion ' s C a p i t a l , seem to h a v e h a d a net i n - m i g r a t i o n of aged persons :
C a l i f o r n i a Colorado D e l a w a r e D i s t r i c t of C o l u m b i a F l o r i d a M a r y l a n d M i s s o u r i Oregon W a s h i n g t o n
F i v e States i n different parts of the country , the d a t a suggest, cons is t ently lost aged m i g r a n t s :
A r k a n s a s I d a h o New Mexico P e n n s y l v a n i a R h o d e I s l a n d
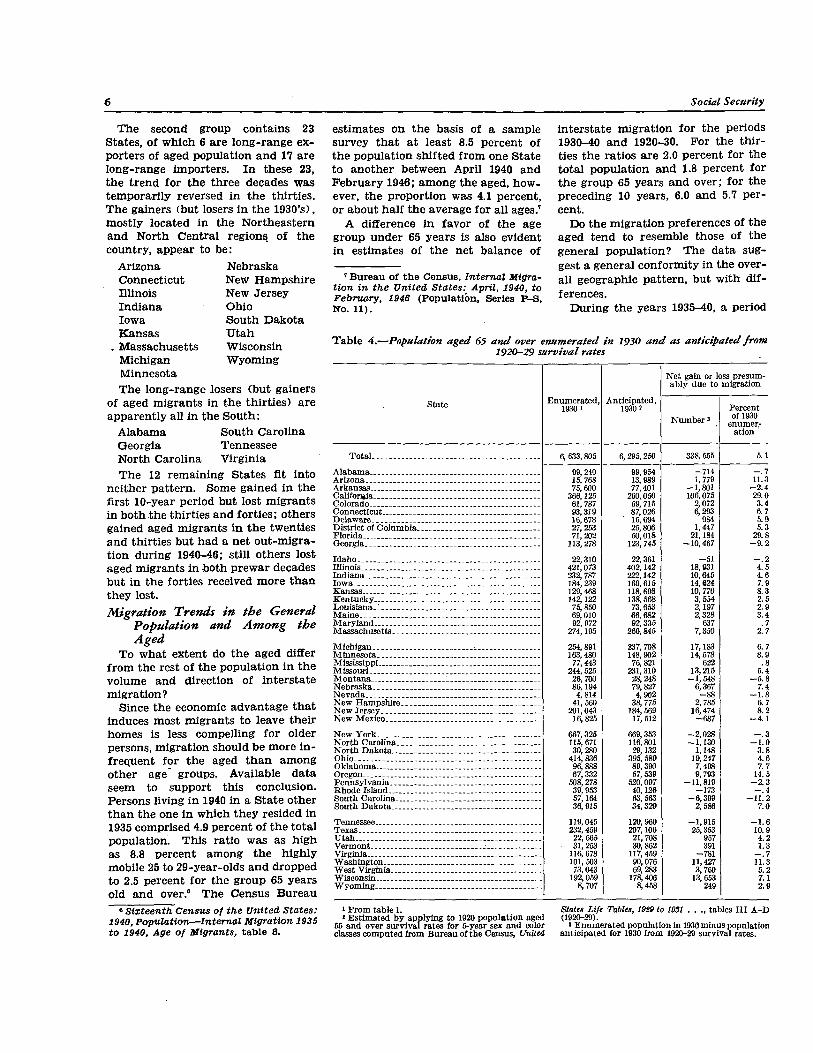
T h e second group c o n t a i n s 23 States , of w h i c h 6 are l o n g - r a n g e e x porters of aged population a n d 17 are long -range importers . I n these 23, the t r e n d for the three decades w a s t e m p o r a r i l y reversed i n the thir t ies . T h e gainers (but losers i n the 1930's) , most ly located i n t h e N o r t h e a s t e r n a n d N o r t h C e n t r a l regions, of the country , appear to be:
A r i z o n a C o n n e c t i c u t I l l ino is I n d i a n a I o w a K a n s a s Massachuset ts M i c h i g a n Minnesota
N e b r a s k a New H a m p s h i r e N e w J e r s e y O h i o S o u t h D a k o t a U t a h W i s c o n s i n W y o m i n g
T h e l o n g - r a n g e losers (but gainers of aged m i g r a n t s i n the t h i r t i e s ) are apparent ly a l l i n the S o u t h :
A l a b a m a S o u t h C a r o l i n a G e o r g i a T e n n e s s e e N o r t h C a r o l i n a V i r g i n i a T h e 12 r e m a i n i n g S t a t e s fit into
ne i ther p a t t e r n . Some gained i n the f irst 10 -year period but lost m i g r a n t s i n both the th ir t ies a n d fort ies ; others gained aged m i g r a n t s i n t h e twenties a n d thirt ies but h a d a net o u t - m i g r a t ion dur ing 1940-46; s t i l l others lost aged m i g r a n t s i n both p r e w a r decades b u t i n the forties received m o r e t h a n t h e y lost. Migration Trends in the General
Population and Among the Aged
T o w h a t extent do the aged differ f r o m the rest of t h e populat ion i n t h e volume a n d direct ion of interstate m i g r a t i o n ?
S i n c e the economic advantage t h a t induces most m i g r a n t s to leave t h e i r homes is less compel l ing for older persons, m i g r a t i o n should be more i n frequent for t h e aged t h a n among other age groups. Avai lab le d a t a s e e m to support t h i s conclusion . P e r s o n s l iv ing i n 1940 i n a S t a t e other t h a n the one i n w h i c h t h e y res ided i n 1935 comprised 4.9 percent of the total population. T h i s rat io was as h i g h as 8.8 percent a m o n g t h e h i g h l y mobile 25 to 2 9 - y e a r - o l d s a n d dropped to 2.5 percent for t h e group 65 years old a n d over. 6 T h e C e n s u s B u r e a u
6 Sixteenth Census of the United States: 1940, Population—Internal Migration 1935 to 1940, Age of Migrants, table 8.
est imates o n the basis of a sample s u r v e y t h a t a t least 8.5 percent of the population sh i f ted f rom one S t a t e to a n o t h e r between A p r i l 1940 a n d F e b r u a r y 1946; a m o n g the aged, h o w ever, the proport ion was 4.1 percent , or about h a l f the average for a l l ages. 7
A difference i n favor of the age group u n d e r 65 y e a r s is also evident i n estimates of t h e net balance of
7 Bureau of the Census, Internal Migration in the United States: April, 1940, to February, 1946 (Population, Series P - S , No. 11).
i n t e r s t a t e m i g r a t i o n for the periods 1930-40 a n d 1920-30. F o r the t h i r ties the rat ios a r e 2.0 percent for the total populat ion a n d 1.8 p e r c e n t for the group 65 years a n d over; for the preceding 10 y e a r s , 6.0 a n d 5.7 p e r cent .
D o the m i g r a t i o n preferences of the aged t e n d to resemble those of the general populat ion? T h e d a t a s u g gest a g e n e r a l conformity i n the over a l l geographic p a t t e r n , but w i t h di f ferences .
D u r i n g the y e a r s 1935-40, a period
T a b l e 4.—Population aged 65 and over enumerated in 1930 and as anticipated from 1920-29 survival rates
State Enumerated, 1930 1
Antic ipated, 1930 2
Net gain or loss presumably due to migration
State Enumerated, 1930 1
Antic ipated, 1930 2
Number 3
Percent of 1930
enumeration
State Enumerated, 1930 1
Antic ipated, 1930 2
Number 3
Percent of 1930
enumeration
Tota l 6,633,805 6,295,250 338,555 5.1
Alabama 99,240 99,954 -714 - . 7 Arizona 15,768 13,989 1,779 11.3 Arkansas 75,600 77,401 -1 ,801 - 2 . 4 California 366,125 260,050 106,075 29.0
Colorado 61,787 59,715 2,072 3.4 Connecticut 93,319 87,026 6,293 6.7 Delaware 16,678 15,694 984 5.9 Distr ic t of Columbia 27,253 25,806 1,447 5.3 Florida 71,202 50,018 21,184 29.8 Georgia 113,278 123,745 -10,467 - 9 . 2 Idaho 22,310 22,361 - 5 1 - . 2
Illinois 421,073 402,142 18,931 4.5 Indiana 232,787 222,142 10,645 4.6 Iowa 184,239 169,615 14,624 7.9 Kansas 129,468 118,698 10,770 8.3 Kentucky 142,122 138,568 3,554 2.5 Louisiana 75,850 73,653 2,197 2.9
Maine 69,010 66,682 2,328 3.4 Maryland 92,972 92,335 637 .7 Massachusetts 274,195 266,845 7,350 2.7 Michigan 254,891 237,708 17,183 6.7 Minnesota 163,480 148,902 14,578 8.9 Mississippi 77,443 76,821 622 .8 Missouri 244,525 231,310 13,215 5.4
Montana 26,700 28,248 -1,548 - 5 . 8 Nebraska 86,194 79,827 6,367 7.4 Nevada 4,814 4,902 - 8 8 - 1 . 8
New Hampshire 41,560 38,775 2,785 6.7 New Jersey 201,043 184,569 16,474 8.2 New Mexico 16,825 17,512 -687 - 4 . 1 New York 667,325 669,353 -2,028 - . 3 N o r t h Carolina 115,671 116,801 -1,130 - 1 . 0 N o r t h Dakota 30,280 29,132 1,148 3.8 Ohio 414,836 395,589 19,247 4.6
Oklahoma 96,888 89,390 7,498 7.7 Oregon 67,332 57,539 9,793 14.5
Pennsylvania 508,278 520,097 -11,819 - 2 . 3 Rhode Island 39,953 40,126 -173 - . 4 South Carolina 57,164 63,563 -6,399 -11 .2
South Dakota 36,915 34,329 2,586 7.0 Tennessee 119,045 120,960 -1,915 - 1 . 6 Texas 232,459 207,106 25,353 10.9 U t a h 22,665 21,708 957 4.2
Vermont 31,253 30,862 391 1.3 Virginia 116,678 117,459 - 7 8 1 - . 7 Washington 101,503 90,076 11,427 11.3 West Virginia 73,043 69,283 3,760 5.2 Wisconsin 192,059 178,406 13,653 7.1
Wyoming 8,707 8,458 249 2.9
1 From table 1. 2 Estimated b y applying to 1920 populat ion aged
55 and over surv ival rates for 5-year sex and color classes computed from Bureau of the Census, United
States Life Tables, 1929 to 1931 . . ., tables I I I A - D (1920-29).
3 Enumerated population in 1930 minus population anticipated for 1930 from 1920-29 survival rates.
T a b l e 5.—Net internal migration, 1935-40, total and as percent of 1940 population; total population and population aged 65 and over, 1940, by regional group
Regional group
Tota l population Persons aged 65 and over
Regional group Number,
1940
Net migration, 1935-40
Number , 1940
Net migration, 1935-40
Regional group Number,
1940 Number
Percent of 1940 popula
t ion
Number , 1940
Number Percent of 1940
aged population
Tota l 131,669,275 --- ---
9,019,314 --- ---
N e w E n g l a n d 1 8,437,290 -15,186 - 0 . 2 715,349 -2,258 - 0 . 3 Central At lant ic seaboard 2 32,968,100 6,638 (8) 2,218,877 -9 ,321 - . 4 Florida 1,897,414 146,849 7.7 131,217 14,836 11.3 Southeast, excluding Florida 3 23,639,229 -277,747 - 1 . 2 1,229,234 -4 ,171 - . 3 Great L a k e s 4 26,626,342 41,706 .2 1,968,764 -10,156 - . 5 Central bloc 5 19,137,882 -761,081 - 4 . 0 1,445,437 -21,056 - 1 . 5 Southwest 6 9,229,756 36,159 .4 518,141 1,710 .3 Pacific coast 7 9,733,262 822,662 8.5 792,295 30,416 3.8
1 Connecticut, Rhode Island, Massachusetts, Vermont, New Hampshire, Maine.
2 New York , New Jersey, Pennsylvania, Delaware, Mary land , Distr ic t of Columbia, Virginia.
3 West Virginia, Kentucky, N o r t h Carolina, Tennessee, South Carolina, Georgia, Alabama, Mississippi, Louisiana.
4 Ohio, Indiana, I l l inois , Michigan, Wisconsin. 5 Minnesota, Iowa, Missouri , Arkansas, N o r t h
Dakota, South Dakota, Nebraska, Kansas, Oklahoma, Idaho, M o n t a n a , Wyoming .
6 Texas, Colorado, New Mexico, U t a h , Arizona, Nevada.
7 California, Washington, Oregon. 8 Less than 0.05 percent. Source: Sixteenth Census of the United States: 1940,
Population—Internal Migration, 1935 to 1940, Age of Migrants, table 15.
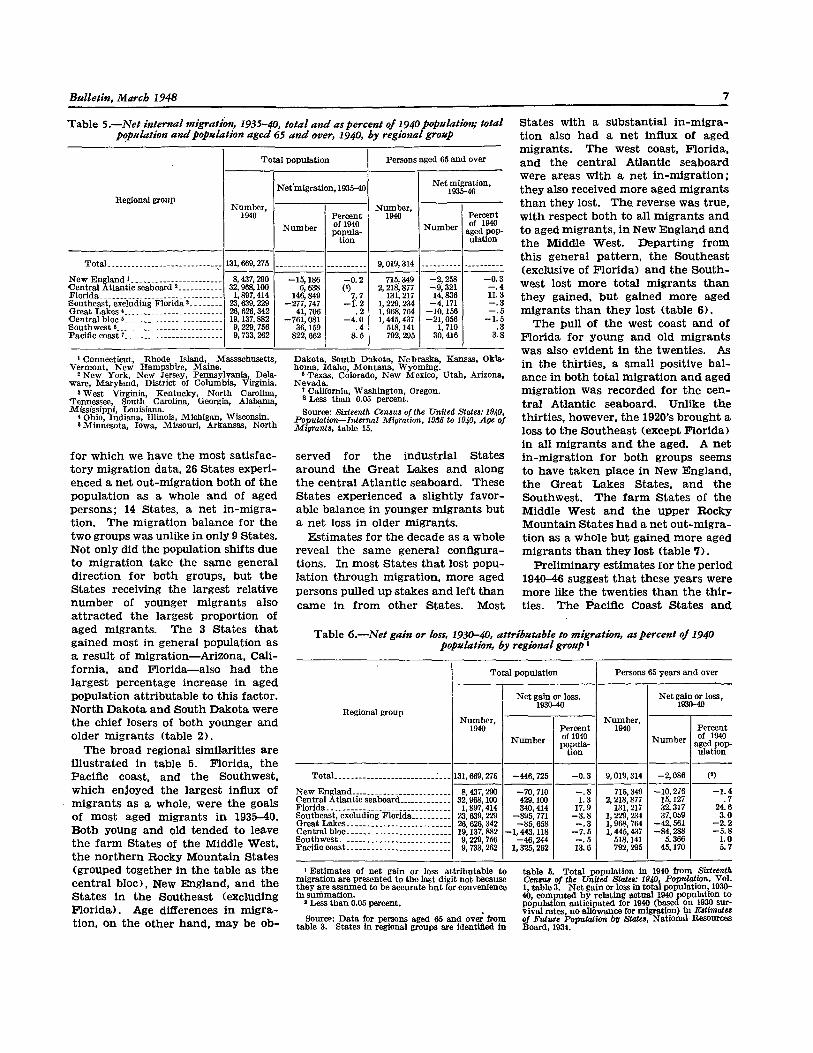
for w h i c h we h a v e the most s a t i s f a c t o r y migrat ion data , 26 States exper i enced a net o u t - m i g r a t i o n both of t h e populat ion as a whole a n d of aged p e r s o n s ; 14 States , a net i n - m i g r a t ion . T h e migrat ion ba lance for the two groups w a s unl ike i n only 9 States . Not only did the population shifts due to m i g r a t i o n t a k e the s a m e general direct ion for both groups, but t h e S t a t e s receiving the largest relat ive n u m b e r of younger m i g r a n t s also a t t r a c t e d the largest proportion of aged migrants . T h e 3 States t h a t gained most i n general population as a resul t of m i g r a t i o n — A r i z o n a , C a l i f o r n i a , a n d F l o r i d a — a l s o h a d t h e largest percentage increase i n aged population attributable to this factor. N o r t h D a k o t a a n d S o u t h D a k o t a were the chief losers of both younger a n d older m i g r a n t s (table 2 ) .
T h e broad regional s imilarit ies are i l lus trated i n table 5. F l o r i d a , the P a c i f i c coast, a n d the Southwest , w h i c h enjoyed the largest influx of m i g r a n t s as a whole, were the goals of most aged m i g r a n t s i n 1935-40. B o t h young a n d old tended to leave t h e f a r m States of the Middle West , t h e n o r t h e r n R o c k y M o u n t a i n States (grouped together i n the table as the c e n t r a l b l o c ) , New E n g l a n d , a n d t h e S t a t e s i n the Southeast (excluding F l o r i d a ) . Age differences i n m i g r a t ion , on the other h a n d , m a y be o b
served for the i n d u s t r i a l S tates a r o u n d t h e G r e a t L a k e s a n d along t h e c e n t r a l A t l a n t i c seaboard. T h e s e S t a t e s experienced a s l ightly f a v o r able balance, i n younger m i g r a n t s but a net loss i n older m i g r a n t s .
E s t i m a t e s for t h e decade as a whole r e v e a l the s a m e general conf igura t ions. I n most States t h a t lost p o p u lat ion t h r o u g h m i g r a t i o n , more aged persons pul led u p s takes a n d left t h a n c a m e i n f r o m other States . Most
S t a t e s w i t h a s u b s t a n t i a l i n - m i g r a t ion also h a d a n e t inf lux of aged m i g r a n t s . T h e west coast, F l o r i d a , a n d the c e n t r a l A t l a n t i c seaboard were areas w i t h a net i n - m i g r a t i o n ; t h e y also received m o r e aged m i g r a n t s t h a n they lost. The . reverse w a s true , w i t h respect b o t h to a l l m i g r a n t s a n d to aged m i g r a n t s , i n New E n g l a n d a n d the Middle W e s t . D e p a r t i n g f r o m t h i s general p a t t e r n , t h e S o u t h e a s t (exclusive of F l o r i d a ) a n d the S o u t h west lost m o r e tota l m i g r a n t s t h a n t h e y gained, b u t gained more aged m i g r a n t s t h a n t h e y lost (table 6 ) .
T h e pul l of t h e west coast a n d of F l o r i d a for y o u n g a n d old m i g r a n t s w a s also evident i n the twenties . A s i n the t h i r t i e s , a s m a l l positive b a l ance i n both tota l m i g r a t i o n a n d aged m i g r a t i o n w a s recorded for t h e c e n t r a l A t l a n t i c seaboard. U n l i k e the th ir t ies , however , the 1920's brought a loss to the S o u t h e a s t (except F l o r i d a ) i n a l l m i g r a n t s a n d the aged. A n e t i n - m i g r a t i o n for both groups seems to have t a k e n place i n New E n g l a n d , the G r e a t L a k e s S t a t e s , a n d t h e Southwest . T h e f a r m S t a t e s of the Middle W e s t a n d the upper R o c k y M o u n t a i n S t a t e s h a d a net o u t - m i g r a t i o n as a whole b u t gained more aged m i g r a n t s t h a n t h e y lost (table 7 ) .
P r e l i m i n a r y est imates for t h e period 1940-46 suggest t h a t these y e a r s were more l ike t h e twenties t h a n the t h i r ties . T h e P a c i f i c C o a s t States a n d
T a b l e 6.—Net gain or loss, 1930-40, attributable to migration, as percent of 1940 population, by regional group1
Regional group
Total population Persons 65 years and over
Regional group Number,
1940
Net gain or loss, 1930-40
Number , 1940
Net gain or loss, 1930-40
Regional group Number,
1940 Number
Percent of 1940 popula
t i on
Number , 1940
Number Percent of 1940
aged population
Tota l 131,669,275 -446,725 - 0 . 3 9,019,314 -2,086 (2)
N e w England 8,437,290 -70,710 - . 8 715,349 -10,276 - 1 . 4 Central At lant i c seaboard 32,968,100 429,100 1.3 2,218,877 15,127 .7
Florida 1,897,414 340,414 17.9 131,217 32,317 24.6 Southeast, excluding Florida 23,639,229 -895,771 - 3 . 8 1,229,234 37,059 3.0 Great Lakes 26,626,342 -85,658 - . 3 1,968,764 -42,561 - 2 . 2
Central bloc 19,137,882 -1,443,118 - 7 . 5 1.445,437 -84,288 - 5 . 8 Southwest 9,229,756 -46,244 - . 5 518,141 5,366 1.0 Pacific coast 9,733,262 1,325,262 13.6 792,295 45,170 5.7
1 Estimates of net gain or loss attributable to migration are presented to the last digit not because they are assumed to be accurate b u t for convenience i n summation.
2 Less than 0.05 percent.
Source: Data for persons aged 65 and over from table 3. States i n regional groups are identified i n
table 5. Tota l population i n 1940 from Sixteenth Census of the United States: 1940, Population, Vo l . 1, table 3. Net gain or loss i n to ta l population, 1930-40, computed b y relating actual 1940 population to population anticipated for 1940 (based on 1930 surv i v a l rates, no allowance for migration) i n Estimates of Future Population by States, National Resources Board, 1934.
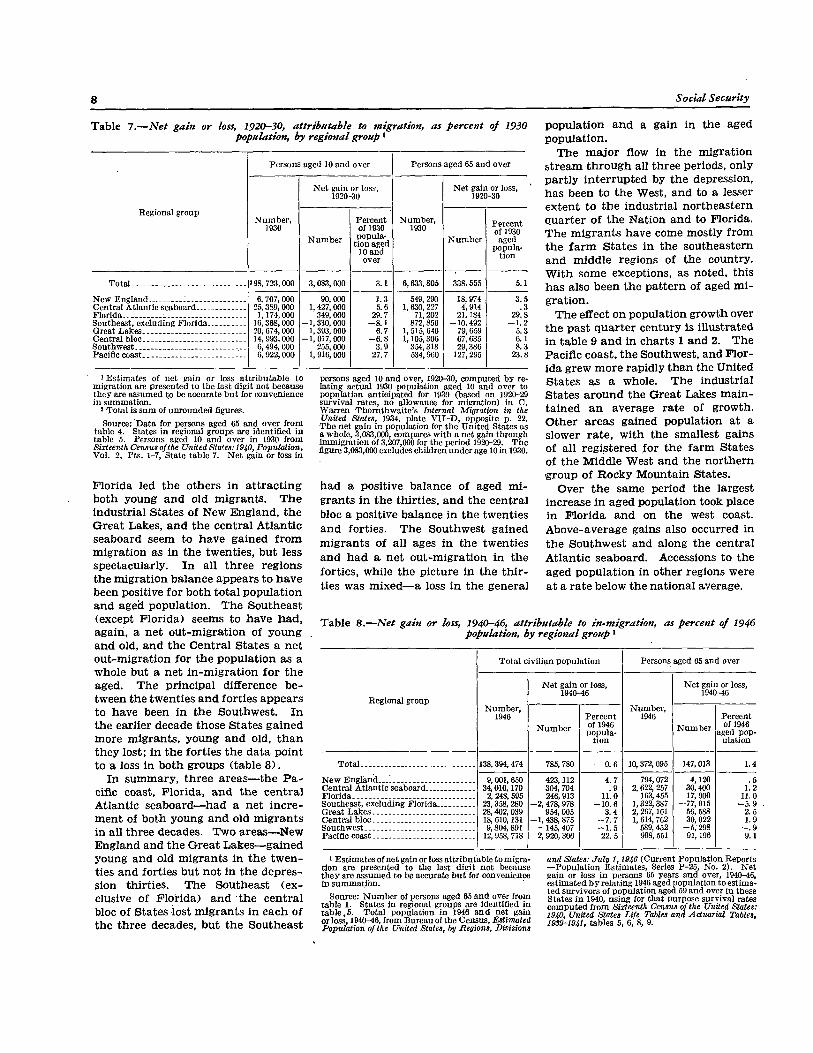
Table 7.—Net gain or loss, 1920-30, attributable to migration, as percent of 1930 population, by regional group 1
Regional group
Persons aged 10 and over Persons aged 65 and over
Regional group Number, 1930
Net gain or loss, 1920-30
Number, 1930
Net gain or loss, 1920-30
Regional group Number, 1930
Number
Percent of 1930 popula
t ion aged 10 and
over
Number, 1930
Number
Percent of 1930 aged
population
Total 2 98,723,000 3,083,000 3.1 6,633,805 338,555 5.1
New England 6,707,000 90,000 1.3 549,290 18,974 3.5 Central Atlantic seaboard 25,389,000 1,427,000 5.6 1,630,227 4,914 .3 Florida 1,174,000 349,000 29.7 71,202 21,184 29.8 Southeast, excluding Florida 16,368,000 -1,330,000 - 8 . 1 872,856 -10,492 - 1 . 2 Great Lakes 20,674,000 1,393,000 6.7 1,515,646 79,659 5.3
Central bloc 14,993,000 -1,017,000 - 6 . 8 1,105,306 67,635 6.1 Southwest 6,494,000 255,000 3.9 354,318 29,386 8.3 Pacific coast 6,922,000 1,916,000 27.7 534,960 127,295 23.8
1 Estimates of net gain or loss attr ibutable to migration are presented to the last digit not because they are assumed to be accurate b u t for convenience i n summation.
2 Tota l is sum of unrounded figures. Source: Data for persons aged 65 and over from
table 4. States i n regional groups are identified i n table 5. Persons aged 10 and over i n 1930 from Sixteenth Census of the United States: 1940, Population, Vo l . 2, Pts. 1-7, State table 7. Net gain or loss i n
persons aged 10 and over, 1920-30, computed b y relating actual 1930 population aged 10 and over to population anticipated for 1930 (based on 1920-29 survival rates, no allowance for migration) i n C. Warren Thornthwaite 's Internal Migration in the United States, 1934, plate V I I - D , opposite p. 22. The net gain i n population for the United States as a whole, 3,083,000, compares w i t h a net gain through immigration of 3,207,000 for the period 1920-29. The figure 3,083,000 excludes children under age 10 i n 1930.
F l o r i d a led the others i n a t t r a c t i n g both young a n d old m i g r a n t s . T h e i n d u s t r i a l S tates of New E n g l a n d , the G r e a t L a k e s , a n d the c e n t r a l A t l a n t i c seaboard seem to h a v e gained f r o m migrat ion as i n the twenties , but less spectacular ly . I n a l l t h r e e regions the m i g r a t i o n ba lance appears to h a v e been positive for both total populat ion a n d aged population. T h e S o u t h e a s t (except F l o r i d a ) seems to h a v e h a d , a g a i n , a net o u t - m i g r a t i o n of y o u n g a n d old, a n d the C e n t r a l States a net o u t - m i g r a t i o n for the population as a whole but a n e t i n - m i g r a t i o n for the aged. T h e p r i n c i p a l difference b e tween the twenties a n d forties appears to have been i n t h e Southwest . I n the earl ier decade those States ga ined more m i g r a n t s , young a n d old, t h a n they lost ; i n the forties the d a t a point to a loss i n both groups (table 8 ) .
I n s u m m a r y , three a r e a s — t h e P a cific coast, F l o r i d a , a n d the c e n t r a l A t l a n t i c s e a b o a r d — h a d a net i n c r e m e n t of both young a n d old m i g r a n t s i n a l l three decades. T w o a r e a s — N e w E n g l a n d a n d the G r e a t L a k e s — g a i n e d young a n d old m i g r a n t s i n the t w e n ties a n d forties but not i n the depres sion thirt ies . T h e Southeast ( e x clusive of F l o r i d a ) a n d the c e n t r a l bloc of States lost m i g r a n t s i n e a c h of the three decades, but the S o u t h e a s t
h a d a positive balance of aged m i grants i n the thirt ies , a n d the c e n t r a l bloc a positive balance i n the twenties a n d forties. T h e Southwest gained m i g r a n t s of a l l ages i n the twenties a n d h a d a net o u t - m i g r a t i o n i n the forties, whi le the picture i n the t h i r ties was m i x e d — a loss i n the general
populat ion a n d a g a i n i n the aged populat ion .
T h e m a j o r flow i n t h e m i g r a t i o n s t r e a m t h r o u g h al l three periods, only p a r t l y i n t e r r u p t e d by the depression, h a s been to the West, a n d to a lesser extent to t h e i n d u s t r i a l n o r t h e a s t e r n quarter of the Nat ion a n d to F l o r i d a . T h e m i g r a n t s have come mostly from the f a r m States i n the southeastern a n d middle regions of the country . W i t h some exceptions, as noted, this h a s also been the p a t t e r n of aged m i grat ion .
T h e effect on population growth over t h e past q u a r t e r century i s i l lustrated i n table 9 a n d i n c h a r t s 1 a n d 2. T h e Paci f ic coast , the Southwest , a n d F l o r i d a grew m o r e rapidly t h a n the U n i t e d S t a t e s as a whole. T h e i n d u s t r i a l S tates a r o u n d the G r e a t L a k e s m a i n t a i n e d a n average r a t e of growth. O t h e r a r e a s gained population at a slower r a t e , w i t h the smal lest gains of a l l registered for the f a r m States of the M i d d l e W e s t a n d the n o r t h e r n group of R o c k y M o u n t a i n States .
O v e r t h e s a m e period the largest increase i n aged population took place i n F l o r i d a a n d on the west coast . A b o v e - a v e r a g e gains also occurred i n the S o u t h w e s t a n d along the c e n t r a l A t l a n t i c seaboard . Accessions to the aged populat ion i n other regions were a t a r a t e below the n a t i o n a l average.
T a b l e 8.—Net gain or loss, 1940-46, attributable to in-migration, as percent of 1946 population, by regional group 1
Regional group
Tota l c iv i l ian population Persons aged 65 and over
Regional group Number,
1946
Net gain or loss, 1940-46
Number, 1946
Net gain or loss, 1940-46
Regional group Number,
1946 Number
Percent of 1946
populat i on
Number, 1946
Number Percent of 1946
aged population
Total 138,394,474 785,780 0.6 10,372,095 147,013 1.4
N e w England 9,001,650 423,112 4.7 794,072 4,120 .5 Central At lant i c seaboard 34,010,170 304,704 .9 2,622,257 30,400 1.2 Florida 2,248,595 246,913 11.0 163,455 17,900 11.0 Southeast, excluding Florida 23,358,280 -2,478,978 - 1 0 . 6 1,322,387 -77,915 - 5 . 9 Great Lakes 28,402,039 954,005 3.4 2,267,161 56,588 2.5 Central b l o c 18,610,131 -1,438,875 - 7 . 7 1,614,762 30,022 1.9 Southwest 9,804,891 -145,407 - 1 . 5 589,452 -5,298 - . 9 Pacific coast 12,958,718 2,920,306 22.5 998,551 91,196 9.1
1 Estimates of net gain or loss attributable to migrat ion are presented to the last d ig i t not because they are assumed to be accurate b u t for convenience i n summation.
Source: Number of persons aged 65 and over from table 1. States i n regional groups are identified i n table 5. T o t a l population i n 1946 a n d net gain or loss, 1940-46, from Bureau of the Census, Estimated Population of the United States, by Regions, Divisions
and States: July 1, 1946 (Current Population Reports —Population Estimates, Series P-25, No. 2). Net gain or loss i n persons 65 years and over, 1940-46, estimated b y relating 1946 aged population to estimated survivors of population aged 59 and over i n these States i n 1940, using for that purpose survival rates computed from Sixteenth Census of the United States: 1940, United States Life Tables and Actuarial Tables, 1939-1941, tables 5, 6, 8, 9.
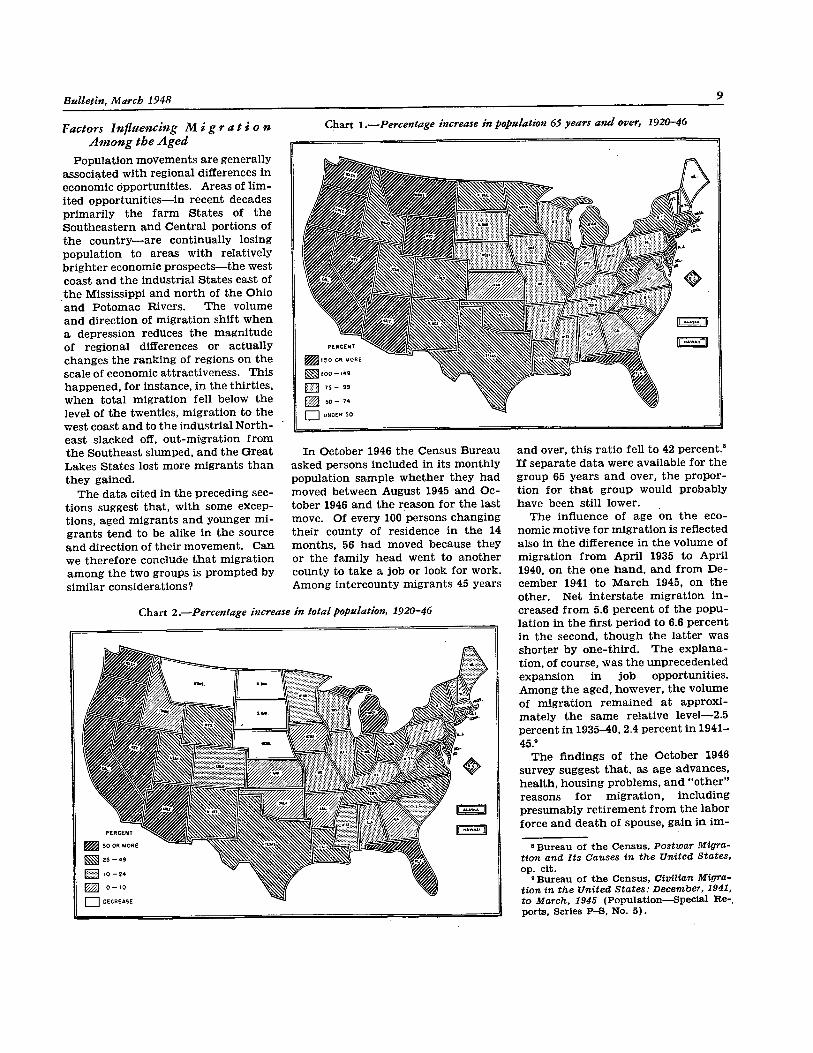
Factors Influencing Migration Among the Aged
P o p u l a t i o n movements a r e general ly associated w i t h regional differences i n economic opportunities. Areas of l i m ited o p p o r t u n i t i e s — i n recent decades p r i m a r i l y the f a r m States of the S o u t h e a s t e r n a n d C e n t r a l portions of the c o u n t r y — a r e cont inual ly losing populat ion to areas w i t h relat ively br ighter economic prospects—the west coast a n d the i n d u s t r i a l States east of t h e Miss i ss ippi a n d n o r t h of the O h i o a n d P o t o m a c R i v e r s . T h e volume a n d direct ion of m i g r a t i o n shif t w h e n a depression reduces the magnitude of regional differences or actua l ly changes the r a n k i n g of regions on the scale of economic attract iveness . T h i s h a p p e n e d , for instance , i n the thirt ies , w h e n total migrat ion fe l l below the level of the twenties , m i g r a t i o n to the west coast a n d to the i n d u s t r i a l N o r t h east s l a c k e d off, o u t - m i g r a t i o n f rom t h e S o u t h e a s t s lumped, a n d t h e G r e a t L a k e s States lost more m i g r a n t s t h a n they gained.
T h e d a t a cited i n the preceding s e c t ions suggest that , w i t h some except ions , aged m i g r a n t s a n d younger m i g r a n t s t e n d to be a l ike i n the source a n d direct ion of t h e i r movement . C a n we therefore conclude t h a t m i g r a t i o n a m o n g the two groups is prompted by s i m i l a r considerations?
Chart 1.—Percentage increase in population 65 years and over, 1920-46
I n October 1946 the C e n s u s B u r e a u asked persons i n c l u d e d i n i ts monthly population sample w h e t h e r t h e y h a d moved between August 1945 a n d O c tober 1946 a n d t h e r e a s o n for the last move. O f every 100 persons changing their county of residence i n the 14 months , 56 h a d moved because they or the fami ly h e a d went to another county to t a k e a job or look for work. A m o n g i n t e r c o u n t y m i g r a n t s 45 years
a n d over, t h i s r a t i o fel l to 42 p e r c e n t . 8
I f separate d a t a were avai lable for the group 65 y e a r s a n d over, the propor t ion for t h a t group would probably have been s t i l l lower.
T h e inf luence of age on the eco nomic motive for m i g r a t i o n is reflected also i n the difference i n the volume of m i g r a t i o n f r o m A p r i l 1935 to A p r i l 1940, on t h e one h a n d , a n d f rom D e cember 1941 to M a r c h 1945, on the other. Net i n t e r s t a t e m i g r a t i o n i n creased f r o m 5.6 percent of the p o p u lat ion i n the f irst period to 6.6 p e r c e n t i n the second, t h o u g h the latter was shorter by o n e - t h i r d . T h e e x p l a n a t ion, of course , w a s t h e unprecedented e x p a n s i o n i n job opportunit ies . A m o n g the aged, however , the volume of m i g r a t i o n r e m a i n e d a t a p p r o x i mate ly t h e s a m e re lat ive level—2.5 percent i n 1935-40, 2.4 percent i n 1941-45. 9
T h e f indings of t h e October 1946 s u r v e y suggest t h a t , as age a d v a n c e s , h e a l t h , h o u s i n g problems, a n d " o t h e r " reasons for m i g r a t i o n , i n c l u d i n g presumably r e t i r e m e n t f r o m the labor force a n d d e a t h of spouse, g a i n i n i m -
8 Bureau of the Census, Postwar Migration and Its Causes in the United States, op. cit.
9 Bureau of the Census, Civilian Migration in the United States: December, 1941, to March, 1945 (Population—Special R e -ports, Series P - S , No. 5 ) .
Chart 2.—Percentage increase in total population, 1920-46
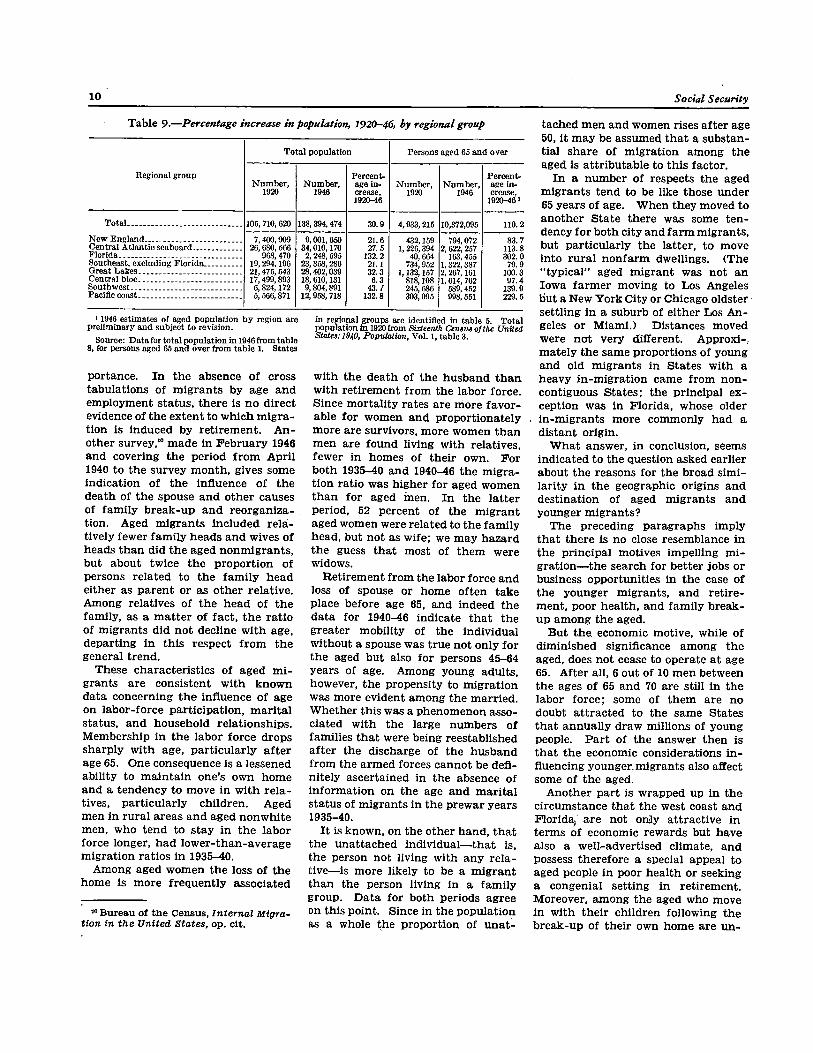
T a b l e 9.—Percentage increase in population, 1920—46, by regional group
Regional group
Tota l population Persons aged 65 and over
Regional group Number ,
1920 Number,
1946
Percentage i n crease, 1920-46
Number, 1920
Number , 1946
Percentage i n crease,
1920-461
Tota l 105,710,620 138,394,474 30.9 4,933,215 10,372,095 110.2 New England 7,400,909 9,001,650 21.6 432,159 794,072 83.7 Central At lant i c seaboard 26,680,666 34,010,170 27.5 1,226,394 2,622,257 113.8 Florida 968,470 2,248,595 132.2 40,664 163,455 302.0 Southeast, excluding Florida 19,294,196 23,358,280 21.1 734,952 1,322,387 79.9 Great Lakes 21,475,543 28,402,039 32.3 1,132,157 2,267,161 100.3 Central bloc 17,499,893 18,610,131 6.3 818,108 1,614,762 97.4 Southwest 6,824,172 9,804,891 43.1 245,686 589,452 139.9 Pacific coast 5,566,871 12,958,718 132.8 303,095 998,551 229.5
11946 estimates of aged population b y region are preliminary and subject to revision.
Source: Data for to ta l population in 1946 from table 8, for persons aged 65 and over from table 1. States
i n regional groups are identified i n table 5. To ta l population i n 1920 from Sixteenth Census of the United States: 1940, Population, Vo l . 1, table 3.
portance. I n the absence of cross tabulations of m i g r a n t s by age a n d employment s tatus , there is no direct evidence of the extent to w h i c h m i g r a tion is i n d u c e d by r e t i r e m e n t . A n other s u r v e y , 1 0 m a d e i n F e b r u a r y 1946 a n d covering t h e period f r o m A p r i l 1940 to the s u r v e y m o n t h , gives some indicat ion of the influence of t h e d e a t h of t h e spouse a n d other causes of f a m i l y b r e a k - u p a n d r e o r g a n i z a t ion. Aged m i g r a n t s i n c l u d e d r e l a t ively fewer f a m i l y h e a d s a n d wives of heads t h a n did the aged n o n m i g r a n t s , but about twice t h e proport ion of persons re lated to the f a m i l y h e a d either as p a r e n t or as other r e l a t i v e . A m o n g relat ives of the h e a d of t h e family , as a m a t t e r of f a c t , t h e r a t i o of m i g r a n t s d id not decline w i t h age, depart ing i n t h i s respect f r o m t h e general t r e n d .
T h e s e c h a r a c t e r i s t i c s of aged m i grants are consistent w i t h k n o w n d a t a c o n c e r n i n g t h e influence of age on labor - force p a r t i c i p a t i o n , m a r i t a l status , a n d household r e l a t i o n s h i p s . Membership i n the labor force drops s h a r p l y w i t h age, p a r t i c u l a r l y after age 65. O n e consequence is a lessened abil ity to m a i n t a i n one's o w n h o m e a n d a tendency to move i n w i t h r e l a tives, p a r t i c u l a r l y c h i l d r e n . Aged m e n i n r u r a l a r e a s a n d aged n o n w h i t e m e n , who tend to s t a y i n the labor force longer, h a d l o w e r - t h a n - a v e r a g e migrat ion ratios i n 1935-40.
A m o n g aged w o m e n the loss of t h e home is more frequent ly associated
1 0 Bureau of the Census, Internal Migration in the United States, op. clt.
w i t h the d e a t h of t h e h u s b a n d t h a n w i t h ret irement f rom the labor force. S i n c e morta l i ty rates are more f a v o r able for w o m e n a n d proportionately more are survivors , more w o m e n t h a n m e n a r e found l iv ing w i t h re lat ives , fewer i n homes of t h e i r own. F o r both 1935-40 a n d 1940-46 the m i g r a tion ratio was higher for aged w o m e n t h a n for aged m e n . I n the l a t t e r period, 52 percent of t h e m i g r a n t aged women were re lated to the f a m i l y h e a d , but not as wife ; we m a y h a z a r d t h e guess t h a t most of t h e m were widows.
R e t i r e m e n t from the labor force a n d loss of spouse or home often take place before age 65, a n d indeed the d a t a for 1940-46 i n d i c a t e t h a t t h e greater mobility of the i n d i v i d u a l without a spouse was true not only for the aged but also for persons 45-64 years of age. A m o n g young adults , however, t h e propensity to m i g r a t i o n was more evident among the m a r r i e d . W h e t h e r t h i s was a phenomenon a s s o ciated w i t h the large n u m b e r s of families t h a t were being reestabl ished after t h e discharge of t h e h u s b a n d f r o m the a r m e d forces c a n n o t be defi nitely ascerta ined i n the absence of i n f o r m a t i o n on the age a n d m a r i t a l s tatus of m i g r a n t s i n the p r e w a r y e a r s 1935-40.
I t is k n o w n , on the other h a n d , t h a t the u n a t t a c h e d i n d i v i d u a l — t h a t is , the person not l iv ing w i t h a n y r e l a t i v e — i s more l ikely to be a m i g r a n t t h a n the person l iv ing i n a f a m i l y group. D a t a for both periods agree on this point . S i n c e i n the populat ion as a whole the proport ion of u n a t
tached m e n a n d women rises after age 50, i t m a y be assumed t h a t a s u b s t a n t ia l s h a r e of m i g r a t i o n among the aged is attr ibutable to t h i s factor.
I n a n u m b e r of respects the aged m i g r a n t s tend to be l ike those under 65 y e a r s of age. W h e n t h e y moved to another S t a t e there was some t e n dency for both c i ty a n d f a r m migrants , but p a r t i c u l a r l y the latter , to move into r u r a l n o n f a r m dwellings. ( T h e " t y p i c a l " aged m i g r a n t was not a n I o w a f a r m e r moving to L o s Angeles but a New Y o r k C i t y or C h i c a g o oldster sett l ing i n a suburb of e i ther L o s A n geles or M i a m i . ) D i s t a n c e s moved were not v e r y different. A p p r o x i -m a t e l y the s a m e proportions of young a n d old m i g r a n t s i n States w i t h a h e a v y i n - m i g r a t i o n c a m e f r o m n o n contiguous S t a t e s ; the p r i n c i p a l e x ception w a s i n F l o r i d a , whose older i n - m i g r a n t s more commonly h a d a distant origin .
W h a t answer , i n conclusion, seems i n d i c a t e d to the question asked ear l ier about the reasons for the broad s i m i l a r i t y i n the geographic origins a n d dest inat ion of aged m i g r a n t s a n d younger m i g r a n t s ?
T h e preceding p a r a g r a p h s i m p l y t h a t there is no close resemblance i n the p r i n c i p a l motives impel l ing m i g r a t i o n — t h e s e a r c h for better jobs or business opportunities i n the case of the younger migrants , a n d r e t i r e ment , poor h e a l t h , a n d f a m i l y b r e a k u p a m o n g the aged.
B u t the. economic motive, while of d i m i n i s h e d significance among t h e aged, does not cease to operate a t age 65. After a l l , 6 out of 10 m e n between the ages of 65 a n d 70 are st i l l i n the labor force ; some of t h e m are no doubt a t t r a c t e d to the same States t h a t a n n u a l l y d r a w mi l l ions of young people. P a r t of the a n s w e r t h e n is t h a t the economic considerations i n fluencing younger m i g r a n t s also affect some of the aged.
A n o t h e r p a r t is w r a p p e d up i n t h e c i r c u m s t a n c e t h a t the west coast a n d F l o r i d a a r e not only a t t r a c t i v e i n terms of economic r e w a r d s but h a v e also a wel l -advert i sed c l imate , a n d possess therefore a special appeal to aged people i n poor h e a l t h or seeking a congenial sett ing i n ret irement . Moreover, a m o n g the aged who move i n w i t h t h e i r c h i l d r e n following the b r e a k - u p of their own h o m e a r e u n -
doubtedly some whose c h i l d r e n h a d ear l ier m i g r a t e d to other S t a t e s ; i n s u c h cases the aged followed i n the footsteps of the young, albeit some y e a r s l a t e r .
T h e relat ive signif icance of these a n d other factors c a n n o t be establ ished i n the absence of more i n f o r m a t i o n t h a n we now possess; t h e y a r e suggestive of areas of f u r t h e r i n q u i r y .
Relation of Migration Trends to Social Security Programs
T h e bear ing on social security p r o g r a m s of interstate m i g r a t i o n a m o n g t h e aged meri ts some attention. T o w h a t extent h a s m i g r a t i o n affected the d is tr ibut ion of p r o g r a m b e n e f ic iaries? T o w h a t extent , o n the other h a n d , have the programs i n fluenced migrat ion?
P r i m a r y beneficiaries of old-age a n d survivors i n s u r a n c e are d r a w n f r o m aged workers w i t h ful ly i n s u r e d status . O t h e r th ings being equal , the relat ive n u m b e r of s u c h beneficiaries, S t a t e by S t a t e , should bear a f a i r l y close r e l a t ionship to the relative n u m b e r of aged insured workers . W h e n p r i m a r y b e n e ficiaries a r e distributed by S t a t e of residence on December 31, 1945, a n d the r e s u l t a n t percentage distr ibut ion is c o m p a r e d w i t h t h a t of aged workers w i t h wage credits i n 1945 a n d w i t h ful ly i n s u r e d status on J a n u a r y 1,1946, a rough re lat ionship between the two m a y be observed, but also some c o n trasts .
S u c h relat ively h e a v y i n - m i g r a n t States as C a l i f o r n i a , F l o r i d a , Oregon, a n d W a s h i n g t o n h a d relat ively more beneficiaries t h a n insured workers . I n the aggregate, however, o u t - m i g r a n t States were twice as frequent as i n -m i g r a n t States among States w i t h a beneficiary " s u r p l u s . " A m o n g the States w i t h a " d e f i c i t " of beneficiaries , by contrast , a l l but two were i n - m i g r a n t S t a t e s .
T h a t States losing aged m i g r a n t s tend to h a v e more i n s u r a n c e benefi c iar ies t h a n one might ant ic ipate f rom the n u m b e r of aged i n s u r e d workers is p a r a d o x i c a l , s ince it would seem r e a sonable to assume t h a t aged workers r e t i r i n g f r o m the labor force are more l ikely to leave the S t a t e t h a n workers r e m a i n i n g i n the labor force.
T h e explanat ion m a y lie i n the a s s o c i a t i o n between the m i g r a t i o n b a l a n c e
on the one h a n d a n d re lat ive w e a l t h a n d opportunit ies for covered employ m e n t o n the other. O u t - m i g r a n t S t a t e s t e n d to be poor S t a t e s a n d to h a v e re lat ive ly few jobs i n covered i n dustry . T h e opposite is general ly true of i n - m i g r a n t S t a t e s . I n S t a t e s w i t h re la t ive ly m o r e covered employment opportunit ies a n d w i t h re lat ive ly h i g h wages , t h e i n s u r a n c e benefit probably possesses less a t t r a c t i o n for a n aged person able to h o l d a job t h a n i t does i n a n a g r i c u l t u r a l l o w - i n c o m e State . T h e r e s u l t would seem to be fewer r e t i r e m e n t s (re lat ive to the n u m b e r of aged i n s u r e d w o r k e r s ) i n t h e r i c h i n d u s t r i a l S t a t e s t h a n i n the poor f a r m S t a t e s a n d therefore a deficit of beneficiaries i n the first group a n d a s u r p l u s i n the second. T h e negative associat ion between the m i g r a t i o n b a l a n c e a n d the re lat ive n u m b e r of p r i m a r y beneficiaries appears to be a reflection of these re lat ionships .
T h e r e l a t i o n of m i g r a t i o n a n d the o ld -age a s s i s t a n c e p r o g r a m does n o t l e n d itself to the s a m e k i n d of a n a l y sis because eligibility condit ions v a r y f r o m S t a t e to S t a t e a n d i n f o r m a t i o n o n t h e re lat ive n u m b e r of potential r e c i p i e n t s of a s s i s t a n c e is l a c k i n g . T h e m a t e r i a l s do permit , however, a n e x a m i n a t i o n of the r e l a t i o n of m i g r a t ion to the re lat ive n u m b e r of aged a c t u a l l y receiving ass is tance a n d to t h e size of the ass is tance p a y m e n t .
I n J a n u a r y 1941 the n u m b e r of o l d -age ass i s tance recipients per 1,000 aged persons v a r i e d f rom 86 i n the D i s t r i c t of C o l u m b i a to 522 i n O k l a h o m a . O f the 10 S t a t e s w i t h the h ighest r e c ip ient rates , 6 h a d a net o u t - m i g r a t ion of t h e aged i n 1935-40, 4 a net i n - m i g r a t i o n . A m o n g the 10 States w i t h the lowest recipient rates , 4 lost a n d 6 ga ined aged m i g r a n t s . Net aged m i g r a t i o n d u r i n g the period 1940-46 w a s positive for 6 of the first 10 States by rec ip ient r a t e i n J u n e 1946, n e g a tive for 4. A m o n g the 10 S t a t e s w i t h the lowest recipient rates , 7 gained m i g r a n t s , 3 lost .
T h e r e is evidently no direct re lat ion between rec ipient r a t e a n d m i g r a t i o n . S t a t e s w i t h h i g h rec ip ient r a t e s do n o t a t t r a c t more aged m i g r a n t s t h a n S t a t e s w i t h low recipient r a t e s .
S ize of p a y m e n t , on the other h a n d , reflects S t a t e differences i n average i n come, a m o n g o t h e r th ings , a n d m a y therefore be expected to be associated
to some degree w i t h m i g r a t i o n pref erences . T h e 10 S t a t e s m a k i n g the highest p a y m e n t s i n D e c e m b e r 1946 a l l appear to h a v e been i n - m i g r a n t States for the aged i n 1940-46. H a l f t h e h i g h - p a y m e n t S t a t e s i n D e c e m b e r 1940 h a d lost aged m i g r a n t s f r o m 1935 to 1940, but t h i s n o n r e l a t i o n s h i p m a y h a v e been due to t h e effects of the depression. N i n e of the 10 States w i t h t h e lowest p a y m e n t i n D e c e m b e r 1946 a n d 7 of the 10 i n D e c e m b e r 1940 seem to have lost aged m i g r a n t s i n the preceding q u i n q u e n n i u m .
Does t h i s m e a n t h a t the newspaper editor a n d the S t a t e legislator w h o fear t h a t h i g h p a y m e n t s a t t r a c t i n digent aged f r o m other S t a t e s a r e r i g h t ? Not n e c e s s a r i l y . O n e c a n n o t prove a c a u s a l r e l a t i o n s h i p between h i g h assistance p a y m e n t s a n d i n -m i g r a t i o n as s u c h . T h e S t a t e s w i t h relat ively large p a y m e n t s h a v e , by a n d large, been i n - m i g r a n t S t a t e s for the aged for s e v e r a l decades, w h i l e t h e reverse is t rue for m a n y of the States w i t h low p a y m e n t s . I n other words , t h e economic factors t h a t affect t h e tides of m i g r a t i o n also influence t h e size of p a y m e n t . Poor S t a t e s tend to h a v e low p a y m e n t s a n d to lose m i g r a n t s of a l l ages ; S t a t e s w i t h h i g h p e r c a p i t a i n c o m e s t e n d to h a v e h i g h p a y m e n t s a n d a n e t i n - m i g r a t i o n of persons of a l l ages.
Summary T h e increase i n aged populat ion
s ince 1920 h a s been m a r k e d l y u n e v e n a m o n g the S t a t e s . T h e most r a p i d growth h a s t a k e n place i n t h e W e s t , t h e least r a p i d i n t h e S o u t h e a s t a n d i n New E n g l a n d . T h e presence of a long -range t r e n d is i n d i c a t e d by t h e r e c u r r e n c e of a p p r o x i m a t e l y the s a m e regional g r o w t h p a t t e r n s i n the t w e n ties a n d the forties. T h e experience of the th ir t ies , w h e n otherwise s low-growing regions ga ined more r a p i d l y whi le the r a t e of i n c r e a s e i n f a s t -growing regions dropped, suggests t h a t a depression m a y i n t e r r u p t the t r e n d but does not a l ter i t p e r m a n e n t l y .
T h e rate of c h a n g e i n the aged popu l a t i o n of a g iven S t a t e is d e t e r m i n e d by the t u r n - o v e r of t h e resident populat ion a n d the net b a l a n c e of m i grat ion .
A m o n g the States t h e m o r t a l i t y of the resident populat ion varies because of differences i n sex, age, a n d color
composition a n d i n age-specif ic d e a t h rates . D e a t h r a t e s for aged persons as a whole tend to be h i g h e r i n i n d u s t r i a l States , lower i n r u r a l S t a t e s .
States w i t h a net i n - m i g r a t i o n of aged persons t e n d to h a v e a r a t e of growth of aged population i n excess of t h e n a t i o n a l average a n d vice v e r s a . R e g i o n a l differentiation i n r a t e of growth reflects broad differences i n the balance of m i g r a t i o n .
B e t w e e n 1920 a n d 1946, m i g r a t i o n among the aged was s m a l l e r i n relat ive volume t h a n a m o n g y o u n g e r age classes but resembled i t i n or ig in a n d direct ion. T h e m a j o r flow of m i g r a n t s of a l l ages w a s f r o m the f a r m S t a t e s i n the S o u t h e r n a n d C e n t r a l regions of the country to the W e s t a n d , to a lesser extent, to t h e i n d u s t r i a l S tates a r o u n d the G r e a t L a k e s a n d a l o n g the n o r t h e r n A t l a n t i c seaboard . T h i s movement is largely i n d u c e d b y r e gional differences i n economic opportunities .
Most m i g r a t i o n i n the e a r l y a n d middle years of a w o r k i n g l i fetime represents a s e a r c h for a better job, h i g h e r wages, or br ighter business prospects. W i t h a d v a n c i n g y e a r s the economic motive i n m i g r a t i o n d i m i n ishes i n i m p o r t a n c e , a n d t h e s i g n i f i cance of s u c h factors as h e a l t h , r e t i r e m e n t f rom the labor force, a n d f a m i l y b r e a k - u p increases . T h e shi f t is c o n sistent w i t h changes associated w i t h old age—decl ine i n labor - force p a r t ic ipat ion , fa i l ing h e a l t h , d e a t h of spouse, loss of home, a n d t e n d e n c y to move i n w i t h re lat ives .
T h e s i m i l a r i t y i n the regional o r i gins a n d dest inat ion of young a n d old m i g r a n t s is due to the cont inued , a l though reduced, influence of the economic factor a m o n g aged m i g r a n t s , the possession by regions w i t h a large i n - m i g r a t i o n of c l i m a t i c as wel l as economic advantages , a n d t h e c i r c u m stance t h a t aged persons who move i n w i t h c h i l d r e n after t h e y h a v e lost t h e i r own home necessari ly follow t h e geographic shifts m a d e e a r l i e r by the c h i l d r e n .
States w i t h a n i n - m i g r a t i o n of aged persons tend to h a v e fewer aged o l d -age a n d survivors i n s u r a n c e b e n e f i c iar ies t h a n m i g h t be expected f r o m the number of aged i n s u r e d w o r k e r s , a n d States w i t h a n o u t - m i g r a t i o n to h a v e m o r e beneficiaries . T h e s e r e l a t ionships reflect differences i n e m
ployment opportunities for the aged i n covered industry . I n - m i g r a n t States tend to be h i g h - i n c o m e States a n d to h a v e relatively more covered employment t h a n o u t - m i g r a n t S t a t e s . I n s u c h States the benefit h a s r e l a tively less a t t r a c t i o n t h a n i n o u t - m i grant low- income a g r i c u l t u r a l S t a t e s , the volume of r e t i r e m e n t is re lat ively lower, a n d the " d e f i c i t " of benef ic i aries therefore is re lat ive ly larger .
T h e r e appears to be no direct r e l a t ion between the rec ipient r a t e i n old-age assistance a n d m i g r a t i o n . T h o u g h i n - m i g r a n t S t a t e s t e n d to have h i g h assistance p a y m e n t s a n d o u t - m i g r a n t States low ass is tance payments , one is not the cause of the other. B o t h tendencies are re lated to economic factors t h a t m a k e for h i g h per c a p i t a income, h e a v y i n -migrat ion , a n d h i g h ass is tance p a y ments i n some States , a n d low per capi ta income, o u t - m i g r a t i o n , a n d low ass i s tance p a y m e n t s i n other States . T h e m i g r a t i o n differences predate the old-age ass is tance p r o g r a m .
Technical Note T o assist the reader to evaluate the
rel iabi l i ty of the est imates presented i n the art ic le , a brief s ta tement is a p pended on the methods used a n d the possible biases involved.
T h e 1946 estimate of aged p o p u l a t ion by S t a t e (table 1) is based on deaths a m o n g aged persons i n the State as reported to the N a t i o n a l O f fice of V i t a l S t a t i s t i c s . F o r e a c h State a n d for each of the 7 years 1940-46 t h e number of deaths w i t h i n e a c h 5 - y e a r age -sex -co lor c lass w a s divided by the n a t i o n a l d e a t h rate for t h a t c lass . ( T h e latter represents t h e re lat ion between the n u m b e r of deaths i n the class i n the c o u n t r y as a whole a n d the m i d y e a r size of the class , as est imated by the B u r e a u of the C e n s u s . ) A regression l ine for the S t a t e w a s fitted from the results a n d the 1946 value r e a d f r o m the l ine , after a d j u s t m e n t for 1940 differences i n the est imate of aged population as obtained by this m e t h o d a n d as e n u m e r a t e d (adjusted i n e a c h S t a t e for overstatement of age a long l ines s u g gested by the B u r e a u of the C e n s u s ) a n d for a presumed d i m i n u t i o n i n S t a t e differences i n age -sex -co lor d e a t h r a t e s . T h e B u r e a u of the Census provided some of the bas ic d a t a for the estimates a n d w a s helpful i n the development of the m e t h o d outlined. T h e estimates are p r e l i m i n a r y . R e v i s e d figures a r e i n p r e p a r a t i o n for l a t e r publ icat ion .
U s e of the n a t i o n a l d e a t h rate would seem to give results w h i c h over look S t a t e differences i n specific d e a t h
r a t e s a n d differences i n the completeness of d e a t h registrations . T h e s e l i m i t a t i o n s are p a r t l y t a k e n c a r e of by the a d j u s t m e n t for n a t i o n a l - S t a t e differences i n 1940. T h e use of a s t r a i g h t l ine to c h a r t 1940-46 popula t i o n growth is necessary to smooth out i rregular i t ies a r i s i n g from the c h a r a c t e r of the d a t a , but i t also tends to remove the true irregulari t ies i n a n y populat ion -growth curve .
S t a t e est imates of the net balance of m i g r a t i o n a m o n g the aged for the per iod 1920-30 (table 4) were devel oped by m a t c h i n g the enumerated populat ion 65 years a n d over i n 1930 w i t h the a n t i c i p a t e d n u m b e r of s u r v ivors of the 1920 population 55 years a n d over o n the basis of 1920-29 d e a t h rates for the age-sex-color classes affected. No a d j u s t m e n t was m a d e for S t a t e v a r i a t i o n s i n death r a t e s or for possible biases i n age r e p o r t i n g i n 1920 or 1930.
A s i m i l a r procedure was followed to est imate the net balance of migrat ion a m o n g the aged for the period 1940-46 (table 8 ) . T h e r a n g e of error i n the results is probably greater because a n t i c i p a t e d survivors were m a t c h e d n o t w i t h a n e n u m e r a t e d populat ion i n 1946 but w i t h a n est imated popul a t i o n , a n d because no al lowance was m a d e for a n improvement i n m o r t a l i ty r a t e s (1939-41 rates were u s e d ) . T h e net g a i n of 147,013 i n table 8 for t h e c o u n t r y as a whole is probably too h i g h to be accounted for by i m m i g r a t i o n a n d suggests t h a t the use of 1939-41 d e a t h r a t e s probably understates the n u m b e r of survivors t h a t m a y be a n t i c i p a t e d f r o m the 1940 population 59 years a n d over.
T h e est imate of net ba lance of m i g r a t i o n a m o n g the aged for the decade 1930-40 (table 3) w a s derived by m a t c h i n g the 1940 e n u m e r a t e d populat ion w i t h the T h o m p s o n - W h e l p t o n 1934 forecast for 1940 i n the series t h a t a s s u m e d no net i m m i g r a t i o n a n d n o i n t e r s t a t e m i g r a t i o n . T h e forec a s t a s s u m e d a r e d u c t i o n i n death r a t e s a n d a decline i n interstate differences i n d e a t h rates . No a d j u s t m e n t was made for possible biases i n age report ing i n the 1930 or 1940 censuses .
E s t i m a t e s of the net b a l a n c e of m i g r a t i o n for the total population for t h e period 1920-30 (table 7) were t a k e n direct ly f r o m T h o r n t h w a i t e , who developed t h e m by applying to the 1920 populat ion n a t i o n a l " s u r v i v a l r a t e s " for specific age-color groups a n d r e l a t i n g the results to the 1930 e n u m e r a t e d population 10 years old a n d over. T h e n a t i o n a l s u r v i v a l r a t e s were computed by dividing the 1930 U n i t e d S t a t e s e n u m e r a t e d p o p u l a t i o n 15-19 y e a r s old by the 1920 U n i t e d S t a t e s e n u m e r a t e d population 5-9 y e a r s old, et cetera . T o exclude the effect of m i g r a t i o n T h o r n t h w a i t e used t h e nat ive white rate for foreign-b o r n w h i t e s a n d nonwhites other t h a n Negroes. T h e results tend to d i s r e g a r d S t a t e differences i n s u r v i v a l r a t e s .
(Continued on page 40)
(Continued from page 12) T h e net ba lance of m i g r a t i o n for
the total population for the decade 1930-40 (table 6) w a s es t imated by m a t c h i n g the 1940 e n u m e r a t e d p o p u lat ion with the T h o m p s o n - W h e l p t o n 1934 forecast i n the series t h a t a s s u m e d no net i m m i g r a t i o n a n d n o interstate m i g r a t i o n . T h e forecast assumed a decline i n the b i r t h r a t e f r o m 1930 to 1940 a n d a r e d u c t i o n i n death rates a n d i n i n t e r s t a t e differences i n death r a t e s ; i t a d j u s t e d for possible u n d e r e n u m e r a t i o n of c h i l dren under 5 y e a r s i n the 1930 census
but not for biases i n the report ing of age i n other age groups i n t h a t year .
T h e estimates of net m i g r a t i o n for the total populat ion for the period 1940-46 (table 8) were m a d e by the B u r e a u of the Census a n d are based on d a t a f rom the 1940 census , s t a t i s t ics on school enrol lment , a n d on r e g is trat ions for W a r R a t i o n Book No. 4.11
1 1 For a detailed description see Estimates and Forecasts of the Population (Population—Special Reports, Series P -47, No. 4 ) , method I I .