trends in industry and occupational data workforce development council nov 2012 mathew barewicz...
TRANSCRIPT

Trends in Industry and Occupational
DataWorkforce Development
Council Nov 2012Mathew Barewicz
Vermont Department of LaborEconomic & Labor Market Information Chief
Labor Market Information online at VTLMI.info

Who/What is ‘LMI’?The Economic & Labor Market Information Division
~ housed in the Vermont Department of Labor
~ affectionately referred to as LMI
~ state partner to the federal government
= 100% federally funded
Purpose:
- to produce, explain and disseminate economic data for the benefit of the State of Vermont, educational institutes, employers, students, job-seekers, researchers, etc…
Labor Market Information online @ vtlmi.info

LMI Data Series & the Valued Input from
EmployersQuarterly Census of Employment & Wages – Required
Current Employment Statistics – monthly panel survey
Occupation Employment Study – 3 year managed panel survey of employers; Required
Other Studies - Fringe Benefits, Vacancy, Skills Assessment, Industry Focus, etc… OPTIONAL
Labor Market Information online @ vtlmi.info
Presentation Outline
PART I ~ Status of the Vermont Economy– Where we are at in the recovery
PART II ~ Occupational Projections 2010-2020– National Industry Data & Trends– Vermont Occupational Projections by Education

PART I
• Status of the Vermont Economy– Where we are at in the recovery

National Recession
Labor Market Information online @ vtlmi.info

Last 3 Vermont Recessions
Labor Market Information online @ vtlmi.info
-5.0%
-4.0%
-3.0%
-2.0%
-1.0%
0.0%
1.0%
2.0%
-18 -16 -14 -12 -10 -8 -6 -4 -2 0 2 4 6 8 10 12 14 16 18 20 22 24 26 28 30 32 34 36
%
Job
Losses
VT's Last Three Recessions: % Change in Jobs & Duration in Months (relative to trough of US recessions)
2008 2001 1990
Months, aligned with bottom of the recession
NBER announcing end of US recession
S
Aug '12
S

Labor Market Information online @ vtlmi.info

Job Growth During the ‘Recovery’Since January 2011
-Vermont doesn’t run as ‘hot’ during up-swings-Private sector leading the recovery
Labor Market Information online @ vtlmi.info
Vermont USTotal Nonfarm +1.6% +2.3%Total Private +2.4% +3.0%Total Government -2.0% -1.1%
*Total Gov’t includes public education

Job Growth During the ‘Recovery’
Since January 2011
VT showing strong growth in two sectors:-Professional, Scientific & Technical --- still room to grow vs. national concentration of total private (6% in VT vs. 7% in US)-Private Education ~ riding a winning horse; to what end?
Labor Market Information online @ vtlmi.info
Vermont USTotal Private +2.4% +3.0% Prof., Scientific & Technical
+11.9% 5.8% Private Education +7.9% +4.0%

Professional, Scientific, & Technical SERVICES in VT
-Approximately 3,000 establishments in VT classified in NAICS 541
- over 13,500 employment opportunities- Average wage across the sector of nearly $65k
Labor Market Information online @ vtlmi.info
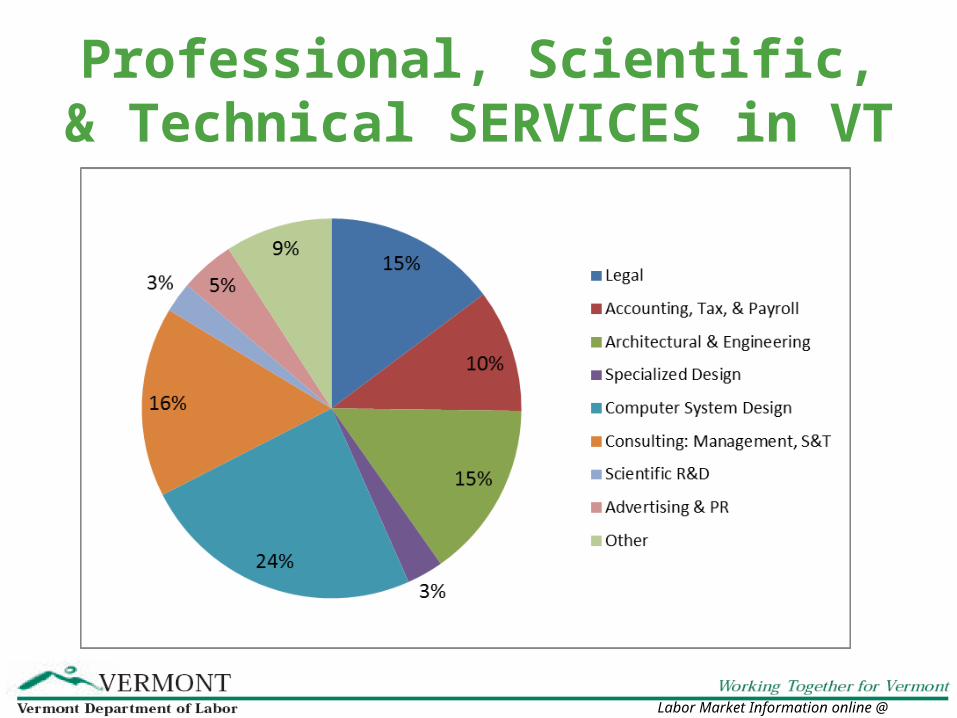
Professional, Scientific, & Technical SERVICES in VT
Labor Market Information online @ vtlmi.info
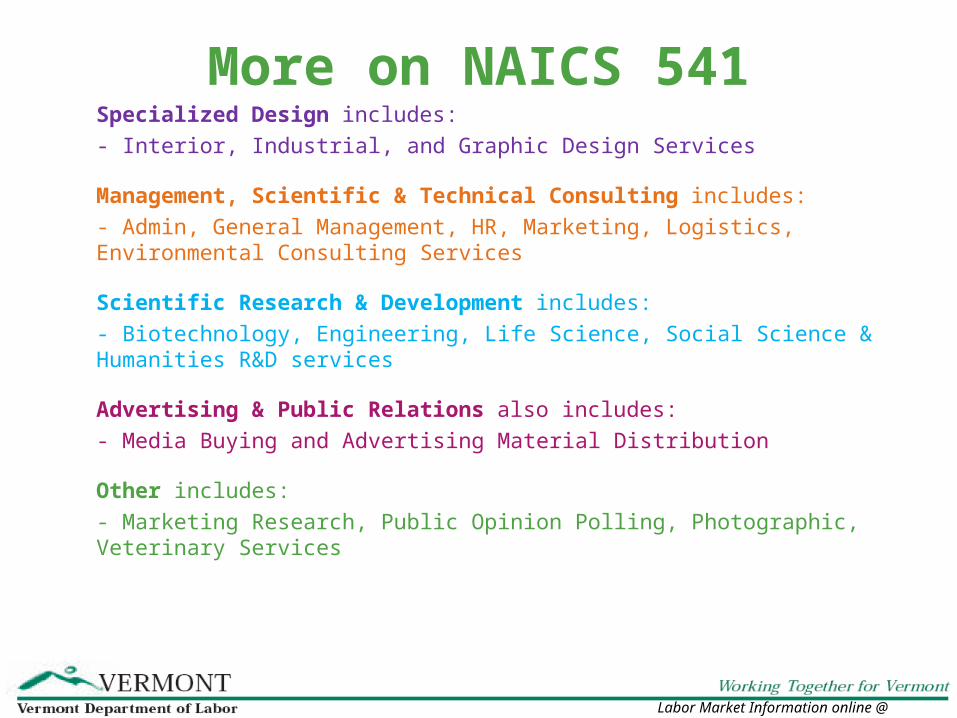
More on NAICS 541Specialized Design includes:
- Interior, Industrial, and Graphic Design Services
Management, Scientific & Technical Consulting includes:
- Admin, General Management, HR, Marketing, Logistics, Environmental Consulting Services
Scientific Research & Development includes:
- Biotechnology, Engineering, Life Science, Social Science & Humanities R&D services
Advertising & Public Relations also includes:
- Media Buying and Advertising Material Distribution
Other includes:
- Marketing Research, Public Opinion Polling, Photographic, Veterinary Services
Labor Market Information online @ vtlmi.info
Part I: Conclusions
-The economic recovery = slow and uneven- Potential Risks: US ‘fiscal cliff’, international financial crises, threats of
military conflicts, etc.
-Vermont is faring better than the nation
-Professional, Scientific & Technical Services work can be done from anywhere in the world
- Requires talented workforce and adequate technology/infrastructure
Labor Market Information online @ vtlmi.info

PART II
• Occupational Projections 2010-2020– National Industry Data & Trends– Vermont Occupational Projections by Education
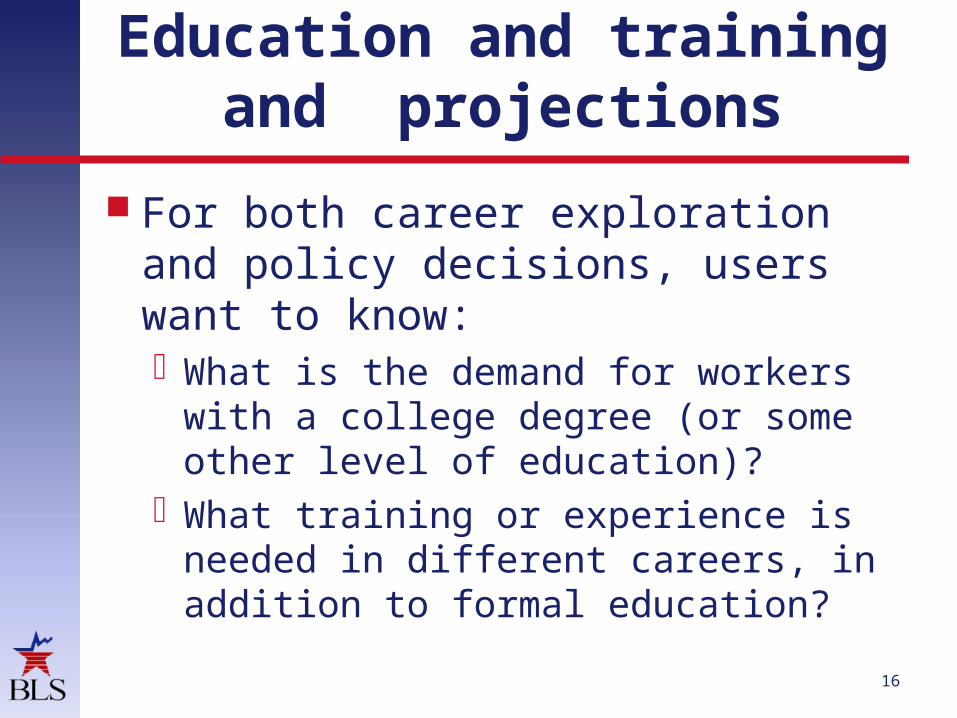
Education and training and projections
For both career exploration and policy decisions, users want to know: What is the demand for workers with
a college degree (or some other level of education)?
What training or experience is needed in different careers, in addition to formal education?
16
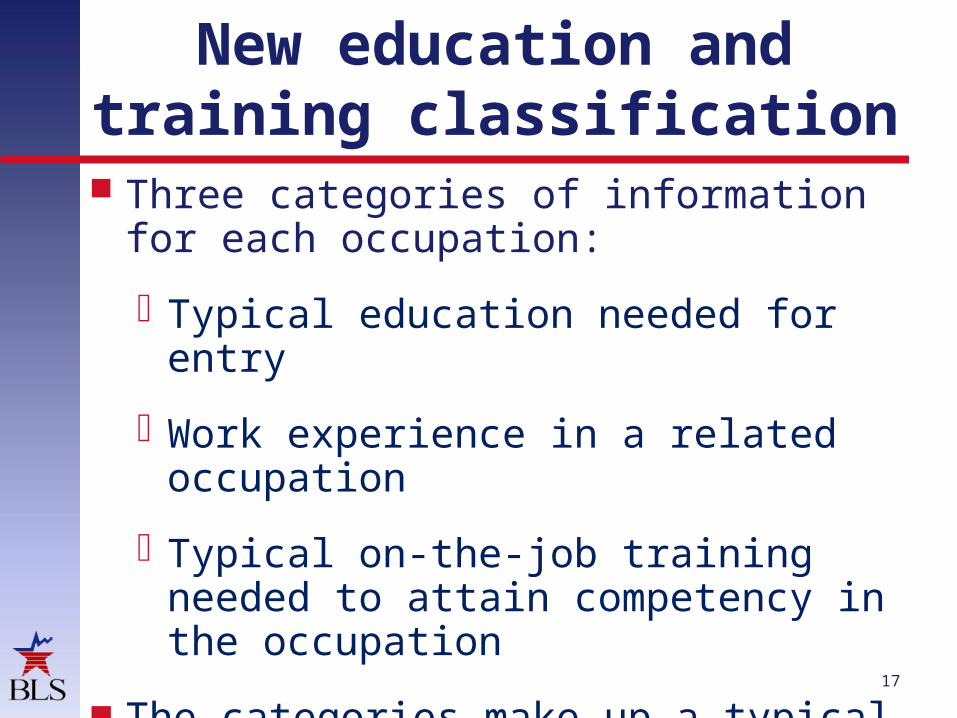
New education and training classification
17
Three categories of information for each occupation:
Typical education needed for entry
Work experience in a related occupation
Typical on-the-job training needed to attain competency in the occupation
■ The categories make up a typical path to entry and competency
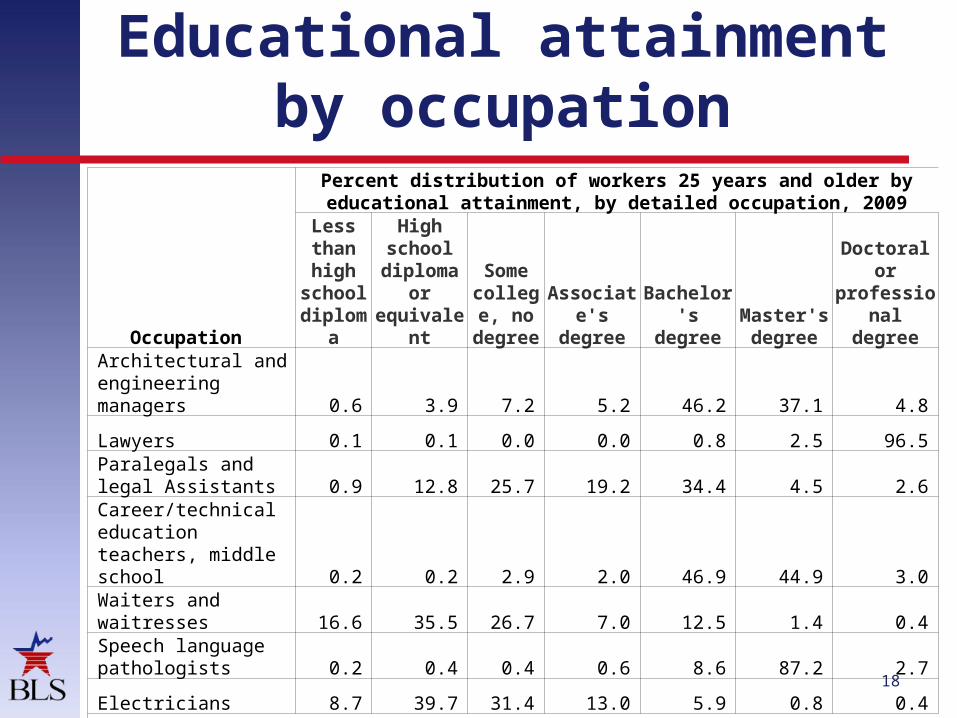
Educational attainment by occupation
18
Occupation
Percent distribution of workers 25 years and older by educational attainment, by detailed occupation, 2009
Less than high
school diploma
High school diploma or equivalent
Some college,
no degree
Associate's degree
Bachelor's degree
Master's degree
Doctoral or professional
degreeArchitectural and engineering managers 0.6 3.9 7.2 5.2 46.2 37.1 4.8
Lawyers 0.1 0.1 0.0 0.0 0.8 2.5 96.5Paralegals and legal Assistants 0.9 12.8 25.7 19.2 34.4 4.5 2.6Career/technical education teachers, middle school 0.2 0.2 2.9 2.0 46.9 44.9 3.0
Waiters and waitresses 16.6 35.5 26.7 7.0 12.5 1.4 0.4Speech language pathologists 0.2 0.4 0.4 0.6 8.6 87.2 2.7
Electricians 8.7 39.7 31.4 13.0 5.9 0.8 0.4
Source: U.S. Census Bureau, American Community Survey, 2005-2009 5-year file.

Education and training classification
Occupation
BLS education and training assignments
Typical entry-level education
Work experience in a related occupation
Typical OJT needed to attain
competency
Architectural and engineering managers Bachelor’s degree
More than 5 years None
LawyersDoctoral or
professional degree None None
Paralegals and legal assistants Associate's degree None None
Career/technical education teachers, middle school Bachelor’s degree 1-5 years
Internship/residency
Waiters and waitressesLess than high school
diploma NoneShort-term
OJT
Speech language pathologists Master’s degree None None
Electricians High school diploma NoneApprentice-
ship19

National: % change in employment by typical entry-level education
category
20
Percent change, projected 2010-20Average, all occupations =
14.3%
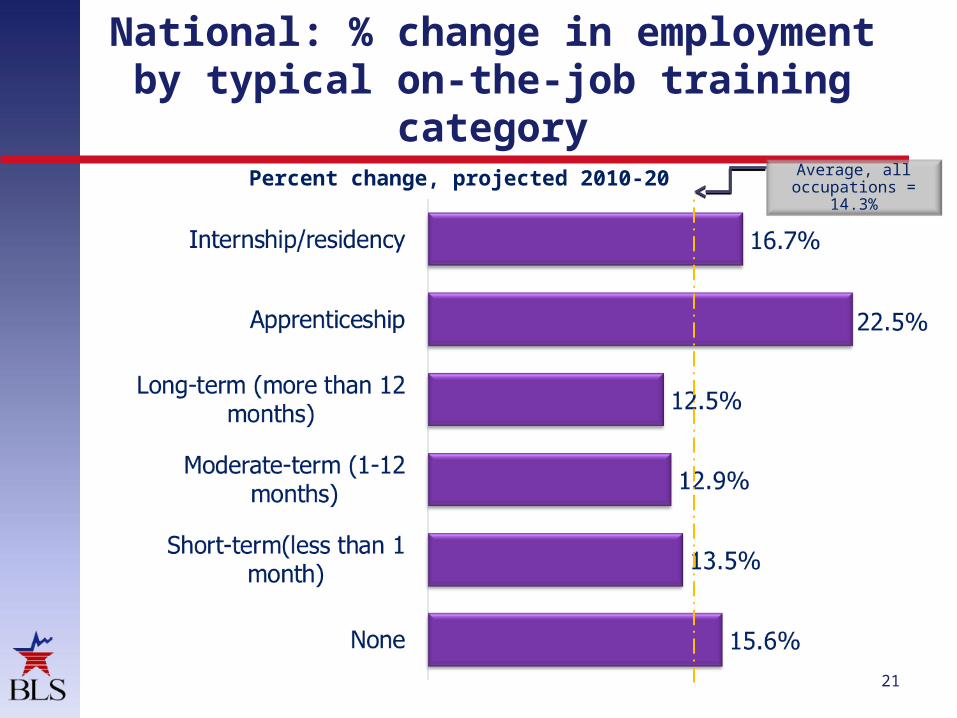
National: % change in employment by typical on-the-job training
category
21
Percent change, projected 2010-20 Average, all occupations =
14.3%

National: % growth in employment for selected paths
22
Percent change, projected 2010-20Education, work experience, OJTEducation, work experience, OJT

National: % Change in Employment by Industry: 2006-
10
23
Annual rate of change for wage and salary employment
Service providingGoods producing
Total nonagricultural wage and salary growth= -1.2%
2006 Data: BLS Current Employment Statistics

National Employment by Industry: 2010
24
Thousands of wage and salary jobs
Service providing
Goods producing

National % Change in Employment by Industry:
Projected 2010-20
25
Annual rate of change for wage and salary employment
Service providingGoods producing
Total nonagricultural wage and
salary growth=
1.4%
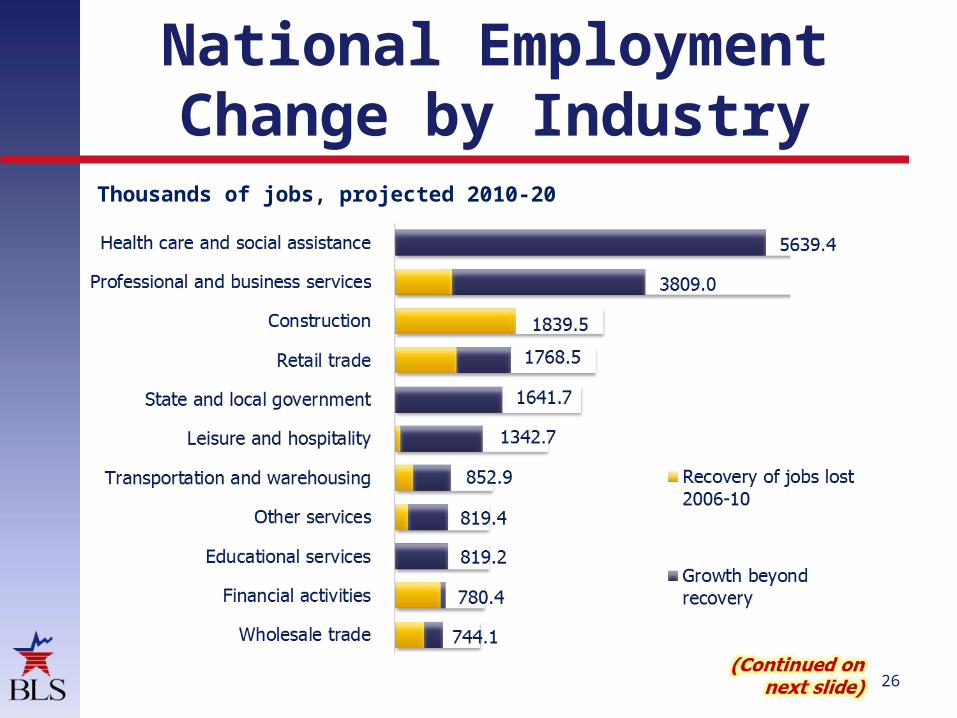
National Employment Change by Industry
26
Thousands of jobs, projected 2010-20
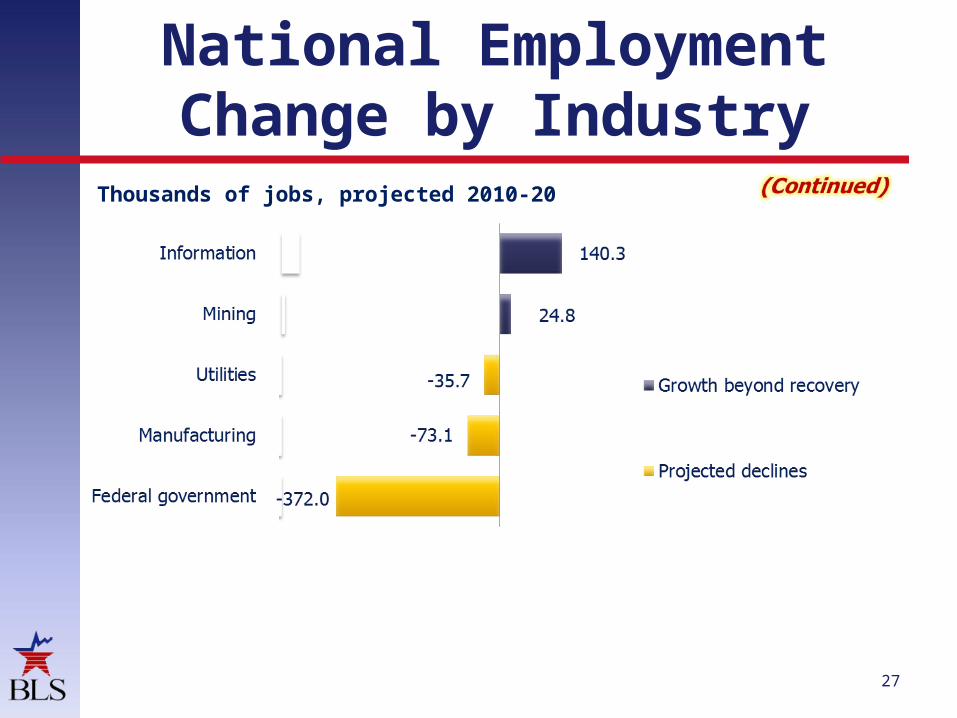
National Employment Change by Industry
27
Thousands of jobs, projected 2010-20
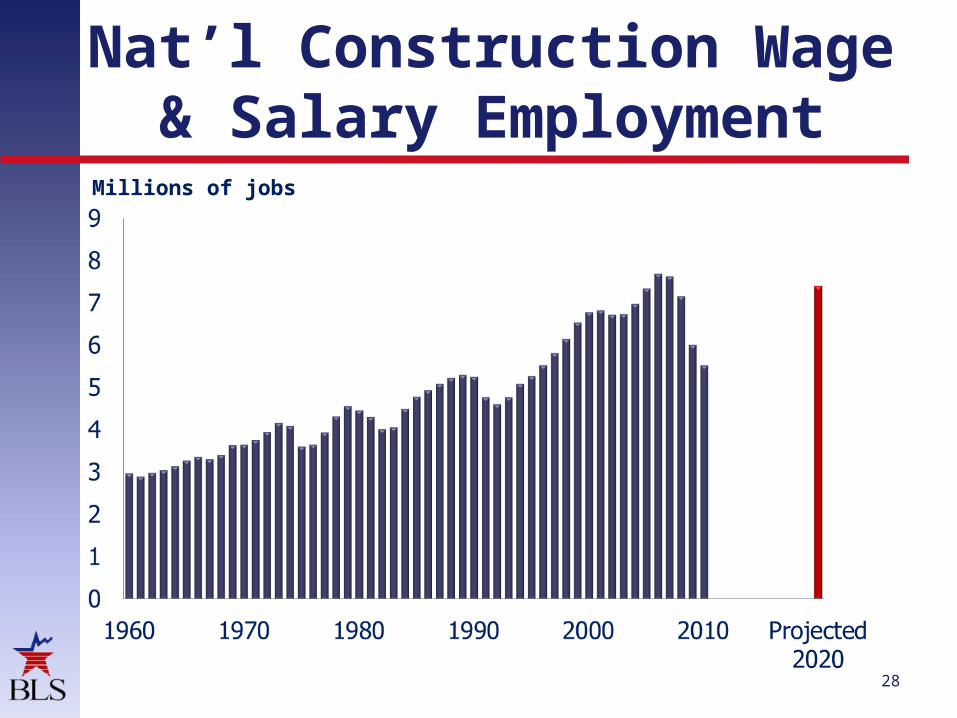
Nat’l Construction Wage & Salary Employment
28
Millions of jobs

Nat’l Manufacturing Wage & Salary Employment
29
Millions of jobs

Vermont’s 2010-2020Occupational Projections
Labor Market Information online @ vtlmi.info
Fastest Growing Occupations by Growth Wage Education; 2010-2020 Projections Rate (per/hr)
Helpers--Carpenters 4.4% $13.07Personal Care Aides 3.8% $10.74Helpers--Brick & Stone Masons 3.8% $14.58Home Health Aides 3.4% $13.02Nonfarm Animal Caretakers 2.1% $12.01Septic Tank & Sewer Pipe Servicers 2.0% $15.37Refuse and Recyclable Material Collectors 1.5% $13.18Drywall and Ceiling Tile Installers 1.5% $20.92Hand Packers and Packagers 1.5% $11.13Cleaners of Vehicles and Equipment 1.4% $11.69
Less than high school ST
EM
?
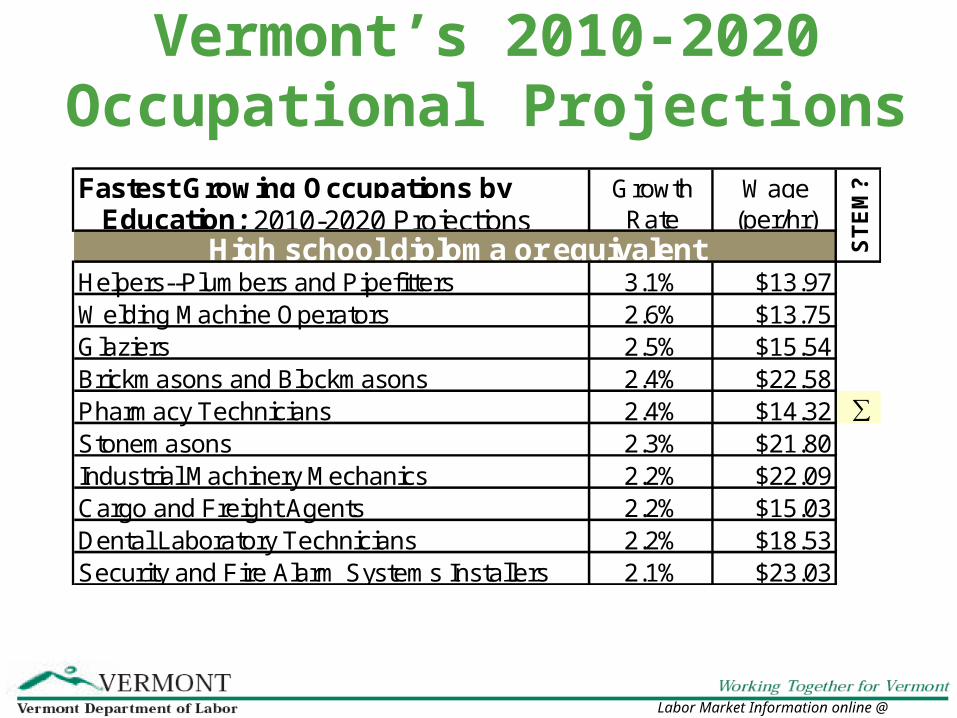
Vermont’s 2010-2020Occupational Projections
Labor Market Information online @ vtlmi.info
Fastest Growing Occupations by Growth Wage Education; 2010-2020 Projections Rate (per/hr)
Helpers--Plumbers and Pipefitters 3.1% $13.97Welding Machine Operators 2.6% $13.75Glaziers 2.5% $15.54Brickmasons and Blockmasons 2.4% $22.58Pharmacy Technicians 2.4% $14.32 ∑Stonemasons 2.3% $21.80Industrial Machinery Mechanics 2.2% $22.09Cargo and Freight Agents 2.2% $15.03Dental Laboratory Technicians 2.2% $18.53Security and Fire Alarm Systems Installers 2.1% $23.03
High school diploma or equivalent ST
EM
?
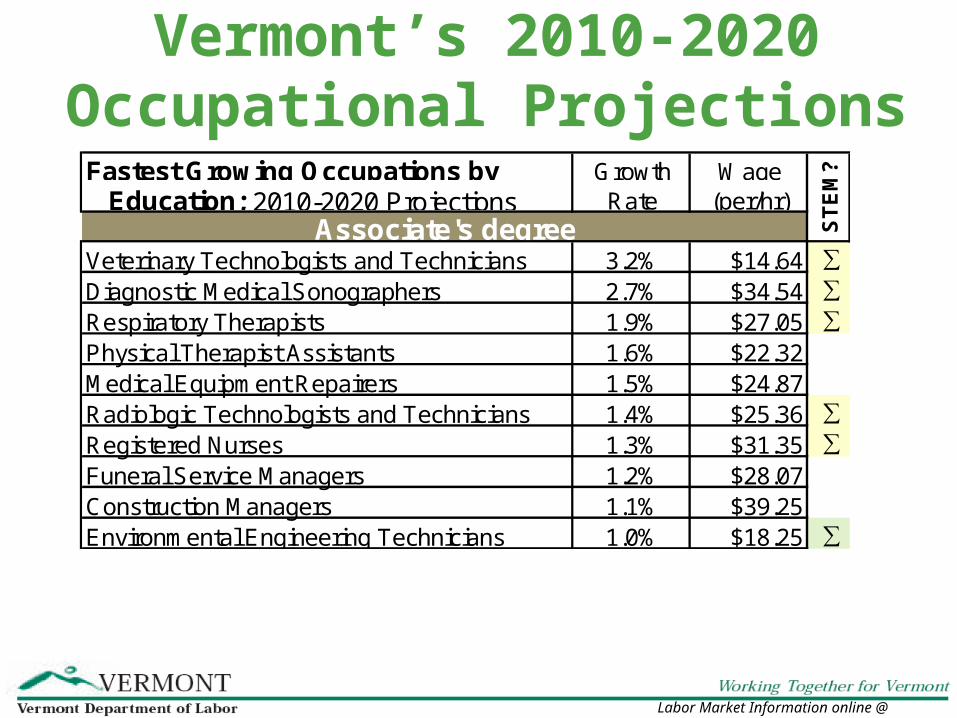
Vermont’s 2010-2020Occupational Projections
Labor Market Information online @ vtlmi.info
Fastest Growing Occupations by Growth Wage Education; 2010-2020 Projections Rate (per/hr)
Veterinary Technologists and Technicians 3.2% $14.64 ∑Diagnostic Medical Sonographers 2.7% $34.54 ∑Respiratory Therapists 1.9% $27.05 ∑Physical Therapist Assistants 1.6% $22.32Medical Equipment Repairers 1.5% $24.87Radiologic Technologists and Technicians 1.4% $25.36 ∑Registered Nurses 1.3% $31.35 ∑Funeral Service Managers 1.2% $28.07Construction Managers 1.1% $39.25Environmental Engineering Technicians 1.0% $18.25 ∑
Associate's degree ST
EM
?

Vermont’s 2010-2020Occupational Projections
Labor Market Information online @ vtlmi.info
Fastest Growing Occupations by Growth Wage Education; 2010-2020 Projections Rate (per/hr)
Market Research Analysts 2.9% $26.76Interpreters and Translators 2.8% $17.96Convention, and Event Planners 2.6% $20.09Personal Financial Advisors 2.3% $41.24Cost Estimators 2.3% $27.04Health Educators 2.0% $23.93Software Developers, Apps 1.9% $38.72 ∑Software Systems Developers 1.9% $43.51 ∑Network & Computer Systems Administrators 1.9% $31.79 ∑Database Administrators 1.9% $30.63 ∑
Bachelor's degree ST
EM
?

Part II: National Conclusions
Industries Leading the Way:
- Health Care
- Personal Care & Social Assistance
- Professional & Business Services
- Construction
- not regaining all it has lost
By education category – fastest growth found in Master’s degree (21.7%)
By training category – fastest growth found in apprenticeship is the typical on the job training (22.5%)
Labor Market Information online @ vtlmi.info

Part II: Nat’l Conclusions (cont.)
- In 4 out of 5 occupations, openings due to replacement needs exceed the number due to growth. Replacement needs are expected in every occupation, even in those that are declining.
- Of the 30 detailed occupations projected to have the fastest employment growth, 17 typically need some type of postsecondary education for entry into the occupation.
- More than two-thirds of all job openings are expected to be in occupations that typically do not need postsecondary education for entry
Labor Market Information online @ vtlmi.info
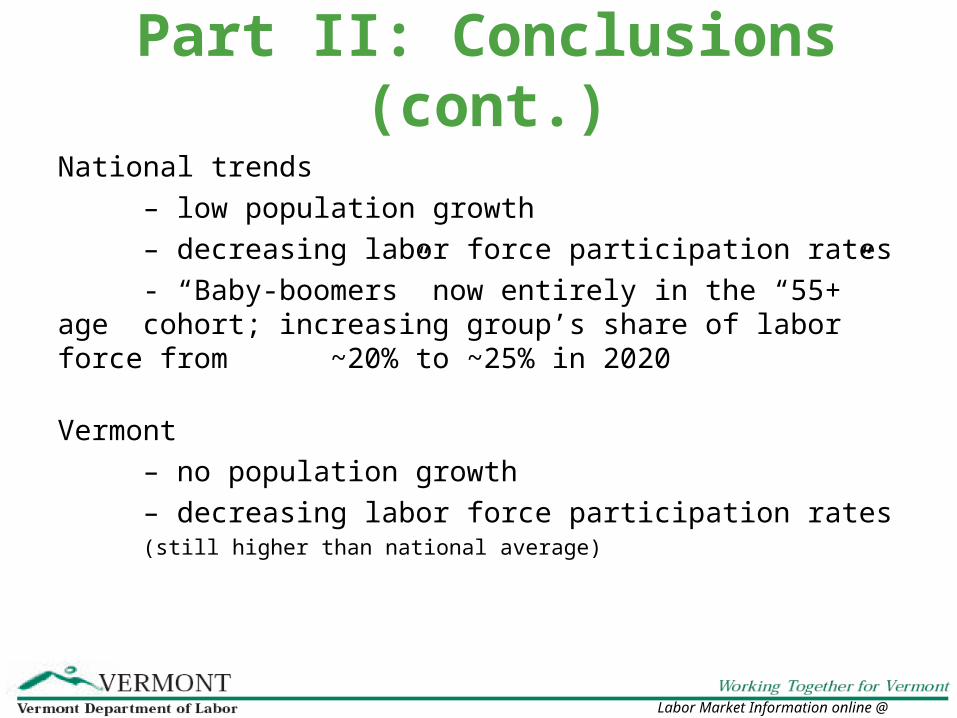
Part II: Conclusions (cont.)
National trends
– low population growth
– decreasing labor force participation rates
- “Baby-boomers” now entirely in the “55+” age cohort; increasing group’s share of labor force from ~20% to ~25% in 2020
Vermont
– no population growth
– decreasing labor force participation rates (still higher than national average)
Labor Market Information online @ vtlmi.info

Presentation Summary
-There are lots of opportunities in the Vermont economy for workers of all educational backgrounds
- However, more skills leads to more wages
-VTLMI.info has a wealth of free information
-More information leads to better decisions
Labor Market Information online @ vtlmi.info

Questions?Thank you!
Contact Information:Mathew J. BarewiczVermont Department of Labor5 Green Mountain Dr.Montpelier, VT 05601-0488Phone- (802)[email protected]: www.vtlmi.info