trends in healthy life expectancy in japan: 1986 – 2004 · this article examines the increasing...
TRANSCRIPT
Demographic Research a free, expedited, online journal of peer-reviewed research and commentary in the population sciences published by the Max Planck Institute for Demographic Research Konrad-Zuse Str. 1, D-18057 Rostock · GERMANY www.demographic-research.org
DEMOGRAPHIC RESEARCH VOLUME 20, ARTICLE 19, PAGES 467-494 PUBLISHED 28 APRIL 2009 http://www.demographic-research.org/Volumes/Vol20/19/ DOI: 10.4054/DemRes.2009.20.19 Research Article
Trends in healthy life expectancy in Japan: 1986 – 2004
Vanessa Yong
Yasuhiko Saito
© 2009 Vanessa Yong & Yasuhiko Saito This open-access work is published under the terms of the Creative Commons Attribution NonCommercial License 2.0 Germany, which permits use, reproduction & distribution in any medium for non-commercial purposes, provided the original author(s) and source are given credit. See http:// creativecommons.org/licenses/by-nc/2.0/de/
Table of Contents
1 Introduction 468 2 Data 470 3 Methods 471 4 Results 472 4.1 Expected number of years in different health states 472 4.2 Proportion of life expectancy in different health states 476 5 Summary and discussion 480 6 Acknowledgements 486 References 487 Appendix 493

Demographic Research: Volume 20, Article 19 Research Article
Trends in healthy life expectancy in Japan: 1986 – 2004
Vanessa Yong 1
Yasuhiko Saito 2
Abstract
This article examines the increasing life expectancy of Japanese men and women in relation to their health from 1986 to 2004. We computed healthy life expectancy for seven available time-points using the prevalence-based Sullivan method. The results showed that, for both sexes and at all ages, the gains in life expectancy prior to 1995 were mostly in years of good self-rated health, while the gains thereafter were in years of poor self-rated health. The exception was for women at age 85, among whom there was an almost continuous increase in the number of years in poor health. The proportion of life spent in different health states suggested evidence of morbidity compression until 1995, followed by an expansion of morbidity.
1 Nihon University, E-mail: [email protected]. 2 Nihon University, E-mail: [email protected].
http://www.demographic-research.org 467

Yong & Saito: Trends in healthy life expectancy in Japan: 1986 – 2004
1. Introduction
In almost all parts of the world, improvements in health and sanitation conditions, better living standards, higher educational attainments, and advancements in medical technologies are enabling people to live longer. In this regard, Japan leads the world. Life expectancy at birth in 2007 stood at 79.19 for Japanese men and 85.99 years for Japanese women (Ministry of Health, Labour and Welfare 2008a). According to recent statistics, 21.8% of the Japanese population is aged 65 and over, making the nation the oldest in the world (Ministry of Health, Labour and Welfare 2008b). As people live longer, several key health-related quality-of-life questions arise: Are these longer lives lived in good or in poor health? How many years and what proportion of the lifespan are lived in good versus poor health? And what are the changes and trends over time at the population level?
To answer these questions, we use the concept of health expectancy. As an extension of the concept of life expectancy, health expectancy is a summary measure of population health that takes into account both current mortality and morbidity levels of a population, and partitions years of life lived at a particular age into healthy and unhealthy years. This extension shifts the focus from quantity of life to quality of life. In recent years, the value of longer but less healthy lives has been questioned. Research has shown that increases in the total expected years of life are not necessarily accompanied by increases in the expected years of, or proportion of, disability-free life (Crimmins, Saito, and Ingegneri 1989, 1997; Crimmins, Hayward, and Saito 1994). As countries progress through the later stages of the epidemiological transition and chronic illnesses become more prevalent, it is no longer sufficient to rely on mortality indicators alone.
Since the 1980s, three main theoretical hypotheses about the relationship between increasing life expectancy and expected life-time in good health have been discussed. The first hypothesis is that a longer life involves greater suffering, as there are more years of life spent in ill health and with disabilities. The sick and frail are kept alive, but with expanding morbidity (Kramer 1980; Gruenberg 1977). Changes in life expectancy with a decrease in the proportion of healthy life years can be evidence of an expansion of morbidity. The second hypothesis is that there are longer periods of life in good health, i.e., that there is a delay in the onset and progression of illness with a compression of morbidity (Fries 1980, 1989). An increase in life expectancy accompanied by an increase in the proportion of life spent healthy can be regarded as evidence of a compression of morbidity. The last hypothesis is that there is a dynamic equilibrium between health and years of life. There could be more disability, but it is light and moderate, with a dynamic equilibrium maintained (Manton 1982).
http://www.demographic-research.org 468

Demographic Research: Volume 20, Article 19
Health expectancy can be measured by a variety of different health dimensions. This results in more specific terms used for health expectancies. For instance, if global self-rated health is measured, it is often called healthy life expectancy. In this paper, we used self-rated health to compute health expectancy. The use of this particular health measure has both strengths and weaknesses. In terms of strengths, self-rated health is a good fundamental indicator of overall health status, and is almost always measured in large population health surveys. Self-rated health can reflect aspects of health not captured in other single health measures. People are more likely to evaluate their own health holistically, taking into account a variety of social, physical, and emotional factors that impact their health. In addition, perhaps because overall health is considered, an extensive body of literature reflecting a variety of settings and cultures has consistently demonstrated that self-rated health is a strong and independent predictor of subsequent illness, and both all-cause and specific mortality (Idler and Benyami 1997; Benjamins et al. 2004; Lyyra et al. 2006; DeSalvo et al. 2006; Miller and Wolinsky 2007).
A major weakness of self-rated health is its subjective nature. Self-rated health is assessed broadly and subjectively by the respondents themselves, rather than by physician diagnoses or other more objective indicators of health, such as chronic conditions, functional limitations, and disability. Consequently, reports of self-rated health could be more prone to the effects of exogenous factors, such as gender, race, and income levels, as well as changes in attitudes and expectations towards health over time. This could limit comparisons of responses over time (Iburg et al. 2001). We discuss some of these factors in greater detail at the end of this paper. In our case, the relatively homogeneous nature of Japanese society as a whole could serve to mediate the effects of these factors. Studies of different countries have found self-rated health to be correlated strongly with more objective health measures (Idler and Benyami 1997; Jylha et al. 1998; Zimmer et al. 2002). As a global and general health measure, self-rated health also eliminates the problem of changes in knowledge and awareness of health conditions over time, which might affect responses.
To date, despite a number of studies on health expectancy in the United States and other more developed countries, few studies have computed healthy life expectancy in Asia, particularly using self-rated health as a measure. An exception is a comparative study by Ofstedal and her colleagues (2004) that examined self-assessed health expectancy in six Asian settings (China, Indonesia, the Philippines, Singapore, Taiwan, and Thailand). Using data from national surveys conducted in the mid-1990s, the study found that the patterns of healthy life expectancy by age and sex are similar across the six settings, despite differences in the proportion reporting negative health.
Healthy life expectancy declined steadily with age in each setting, whereas unhealthy life expectancy remained fairly stable in China, the Philippines, and
http://www.demographic-research.org 469

Yong & Saito: Trends in healthy life expectancy in Japan: 1986 – 2004
Singapore, and decreased very slightly in Indonesia, Taiwan, and Thailand. It was also found that women generally live longer, but less healthy lives than men. Outside of Asia, various other studies have used self-rated health as a measure to compute healthy life expectancy (Doblhammer and Kytir 2001; Brønnum-Hansen et al. 2004; Wood et al. 2006; Groenewegen, Westert, and Boshuizen 2003; Camargos, Machado, and Rodrigues 2007).
The objective of this paper is to examine trends in healthy life expectancy in Japan over a 19-year period from 1986 to 2004 by age and sex for adults 25 years old and over.
Is the number of years and proportion of life spent in poor health increasing or decreasing? While there have been clear increases in overall life expectancy over time, there are concerns that not all the years gained are spent in good health, and that the proportion of life spent in good general health may have fallen. As Japan’s population continues to grow older, will the Japanese remain healthy, or suffer from greater chronic ill health? The trend analysis in this paper would be useful in monitoring population health over time by age and sex.
2. Data
To compute healthy life expectancy for this study, two key pieces of information are needed: one, a standard period life table where age- and sex-specific mortality information and life expectancies can be obtained; and two, prevalence or proportions of self-rated health by age and sex from a cross-sectional survey for the same period as the standard life table.
Age- and sex-specific standard period life tables from 1986 to 2004 were obtained from the Japanese Ministry of Health, Labour and Welfare. These life tables are published annually by the Ministry. For prevalence of self-rated health by age and sex, data came from a repeated cross-sectional survey conducted by the same Ministry. This survey, “Kokumin Seikastu Kiso Chosa” (Comprehensive Survey of Living Conditions of the People on Health and Welfare) has been conducted annually since 1986, but only on a large scale every three years, when questions about health were asked. It is a nationally representative survey of community dwellers, and uses stratified sampling of census areas. About 280,000 households were surveyed, and data on over 750,000 individuals were collected. The interviews were conducted face-to-face, with interviewer-entry for the household section, and respondent self-entry for the health section of the questionnaires. For respondents who were unable to complete the survey on their own, family members were allowed to assist. The surveys do not include the institutionalized population, which comprises only a very small percentage of the
http://www.demographic-research.org 470
Demographic Research: Volume 20, Article 19
Japanese population.3 The implications of not including the institutionalized population in the computations are discussed at the end of this paper.
The time period for the trend analyses spans from 1986 to 2004 in intervals of three years using the large-scale surveys. Thus a total of seven time points (1986, 1989, 1992, 1995, 1998, 2001, 2004) and data on Japanese aged 25 and over were used. In the surveys, a single item was used to measure self-rated health. The respondents were asked about their general health condition (“In general, how would you describe your state of health?”). There were five response categories: “good,” “above average,” average,” “not so good,” and “poor.” In the computations, the good and above average categories were combined into good health, the average category was kept the same, and the not so good and poor categories were combined into poor health to create three recoded categories. Across all the seven time-points, the sampling, question wording and response categories, and the placement of questions remained consistent. The overall response rate for the surveys was about 90%, except in 2004, when it dropped to 80%.4 For the self-rated health question, missing data increased over the years ranging from 0.6% to 6.6%. We excluded the missing data from our analysis, and discuss the implications of the increases in non-response at the end of the paper.
3. Methods
To compute healthy life expectancy and determine the number of years and proportion of life lived in the three different health states (good, average, poor), we used a method devised by Sullivan (1971). This method partitions total life expectancy into the different health states based on the prevalence of self-rated health within a representative sample at a single point in time. Age- and sex- specific mortality data from published life tables were combined with age- and sex- specific self-rated health prevalence rates obtained from the survey. The prevalence rates were used to calculate the person-years of life lived in a specific health state for the age intervals of the population in the life tables. The person-years of health for each age interval are
3 The actual number of Japanese who are living in institutions in the overall population is not available. However, computations in one study show that about 0.5% of Japanese aged 40 and over lived in homes for the elderly between 1992 and 1998, with little change over the seven years. The estimation for the population aged 65 and over should be slightly higher (Saito 2001). In addition, Japanese aged 20 and over who are incarcerated is a negligible 0.05% (Ministry of Internal Affairs and Communications 2008). Thus, overall, we conclude that only a very small percentage of the Japanese population resides in institutions. 4 The decline in the response rate in 2004 was likely associated with the enactment of a privacy protection law in Japan in May 2003. As a result of the new law, the non-response rate for the mid-decade 2005 census doubled.
http://www.demographic-research.org 471

Yong & Saito: Trends in healthy life expectancy in Japan: 1986 – 2004
summed up from age x onwards to the end of the table to obtain the total person-years that are healthy. Healthy life expectancy values were obtained by dividing total healthy person-years at each age by the survivors at that age from the basic life table. This method reflects the current health structure of a real population adjusted for age and mortality levels. For more details on health expectancy computation using the Sullivan method, see Jagger et al. (2006). The variance of the prevalence rates and the confidence intervals were approximated using the formulae provided by Jagger. The variance was computed using the weighted prevalence rates and unweighted number of individuals in the age interval; i.e., the actual number who took part in the survey in the given age interval. Because we have data on the unweighted number of people in the age interval for 1992, 1995, and 1998 only,5 we estimated the confidence intervals for those selected years. For 1986 and 1989, the confidence intervals were derived by approximating the unweighted number of people in the age intervals using the proportion of respondents aged 25 and over, and the age distribution from 1992. For 2001 and 2004, the proportion and age distribution from 1998 were used.6
4. Results
4.1 Expected number of years in different health states
Table 1 shows total life expectancy, expected number of years lived in good, average, and poor self-rated health, and the proportion of the life-time spent in good or average self-rated health for 25-, 45-, 65-, and 85-year-old Japanese men across seven time points in 1986, 1989, 1992, 1995, 1998, 2001, and 2004.7 Between 1986 and 2004, life expectancy showed a steady increase across all ages. The life expectancy of 25- and 45-
5 The actual number of respondents by age group and sex was obtained from the analyses prepared for the article entitled “Kenko Jotai Betsu Yomyo No Nenji Suii: 1992 Nen, 1995 Nen, 1998 Nen” (Changes in Health Expectancy in Japan: 1992, 1995, and 1998), published in Jinko Mondai Kenkyu (Journal of Population Problems), Vol.57, No.4, December 2001 by Y. Saito. 6 To approximate the unweighted number of individuals in the age intervals for 1986 and 1989, we first divided the number of respondents aged 25+ in 1992 by the total number of respondents in 1992 to obtain the proportion of respondents aged 25+. By multiplying this proportion with the total number of respondents in 1986 and 1989, respectively, we derived the number of people aged 25+ in 1986 and 1989. We then distributed according to the age distribution in 1992. We used the same procedure to approximate the unweighted number of people in the age intervals for 2001 and 2004 using the proportion and age distributions for 1998. 7 A more detailed table showing information in 10-year age intervals is available upon request from the authors.
http://www.demographic-research.org 472

Demographic Research: Volume 20, Article 19
year-old men increased by 2.9 years each, while the life expectancy of 65- and 85-year-old men increased by 2.3 and 1.3 years, respectively, over the observed period.
Table 1: Life expectancy and healthy life expectancy for Japanese men, 1986-2004
Expected number of years in: Proportion in good Year Life expectancy Good health Average health Poor health or average health
years years (99% CI) years (99% CI) years (99% CI) (percent) (99% CI) 25 year old men
1986 51.4 20.2 (20.1-20.4) 24.0 (23.8-24.1) 7.2 (7.1-7.3) 86.0 (85.9-86.1) 1989 52.0 22.2 (22.1-22.3) 22.5 (22.4-22.7) 7.2 (7.1-7.3) 86.1 (86.0-86.2) 1992 52.1 24.3 (24.2-24.4) 21.5 (21.4-21.6) 6.3 (6.2-6.4) 87.9 (87.8-88.0) 1995 52.3 25.5 (25.3-25.6) 21.2 (21.0-21.3) 5.7 (5.6-5.8) 89.1 (89.0-89.2) 1998 53.0 22.6 (22.5-22.7) 23.6 (23.4-23.7) 6.9 (6.8-7.0) 87.1 (87.0-87.2) 2001 53.8 21.5 (21.3-21.6) 24.7 (24.5-24.8) 7.7 (7.6-7.8) 85.7 (85.6-85.8) 2004 54.3 22.1 (21.9-22.2) 24.2 (24.1-24.4) 8.0 (7.9-8.1) 85.2 (85.1-85.3)
45 year old men 1986 32.4 11.5 (11.4-11.6) 15.2 (15.1-15.3) 5.7 (5.7-5.8) 82.3 (82.2-82.4) 1989 32.9 12.3 (12.2-12.4) 14.8 (14.7-14.9) 5.9 (5.8-5.9) 82.2 (82.1-82.3) 1992 33.0 13.7 (13.6-13.8) 14.3 (14.2-14.4) 5.0 (4.9-5.1) 84.8 (84.7-84.9) 1995 33.3 14.4 (14.3-14.5) 14.3 (14.2-14.4) 4.6 (4.5-4.6) 86.3 (86.2-86.4) 1998 34.0 12.8 (12.7-12.9) 15.7 (15.6-15.8) 5.5 (5.4-5.5) 83.9 (83.8-84.0) 2001 34.8 12.0 (11.9-12.1) 16.6 (16.4-16.7) 6.2 (6.1-6.3) 82.2 (82.1-82.3) 2004 35.3 12.5 (12.4-12.6) 16.3 (16.2-16.4) 6.5 (6.3-6.6) 81.7 (81.6-81.8)
65 year old men 1986 15.9 4.9 (4.8-4.9) 7.2 (7.1-7.3) 3.8 (3.7-3.9) 75.9 (75.8-76.0) 1989 16.2 5.1 (5.0-5.2) 7.2 (7.1-7.3) 3.9 (3.9-4.0) 75.7 (75.6-75.8) 1992 16.3 5.8 (5.7-5.9) 7.1 (7.0-7.2) 3.4 (3.3-3.5) 79.3 (79.2-79.4) 1995 16.5 6.2 (6.1-6.3) 7.2 (7.1-7.3) 3.1 (3.0-3.2) 81.2 (81.1-81.3) 1998 17.1 5.5 (5.4-5.6) 7.8 (7.7-7.9) 3.8 (3.7-3.9) 77.8 (77.7-77.8) 2001 17.8 5.3 (5.2-5.4) 8.1 (8.0-8.2) 4.4 (4.3-4.5) 75.1 (75.0-75.2) 2004 18.2 5.5 (5.4-5.6) 8.0 (7.9-8.1) 4.7 (4.6-4.8) 74.1 (74.0-74.2)
85 year old men 1986 4.8 1.3 (1.2-1.4) 2.1 (2.0-2.2) 1.4 (1.3-1.5) 71.6 (71.4-71.7) 1989 4.9 1.3 (1.2-1.4) 2.2 (2.1-2.3) 1.5 (1.3-1.6) 70.4 (70.3-70.5) 1992 4.9 1.4 (1.3-1.5) 2.2 (2.1-2.3) 1.2 (1.1-1.3) 74.6 (74.4-74.7) 1995 5.1 1.6 (1.5-1.7) 2.3 (2.2-2.5) 1.1 (1.0-1.2) 77.7 (77.6-77.7) 1998 5.5 1.5 (1.4-1.6) 2.4 (2.3-2.5) 1.6 (1.4-1.7) 71.7 (71.6-71.8) 2001 5.9 1.4 (1.3-1.5) 2.4 (2.3-2.5) 2.1 (2.0-2.2) 64.7 (64.5-64.8) 2004 6.1 1.3 (1.2-1.4) 2.5 (2.4-2.6) 2.3 (2.2-2.4) 62.1 (62.0-62.2)
Note: Sum of healthy life expectancy may not add up to total life expectancy because of rounding. CI: confidence interval (see note in text)
The trend in healthy life expectancy – the expected number of remaining years of life lived in different self-rated health states at a particular age – is, however, less straightforward and does not move in a single direction. With increases in life expectancy, there was an increase in the expected number of years lived in good self-
http://www.demographic-research.org 473

Yong & Saito: Trends in healthy life expectancy in Japan: 1986 – 2004
rated health from 1986 to 1995 for all ages, but in 1998 and 2001, the number of years in good self-rated health actually decreased, followed by a slight increase in 2004 over the previous year for men aged 25, 45, and 65. Correspondingly, the number of years lived in poor self-rated health decreased for the most part for all ages from 1986 to 1995, but increased continuously for all ages after 1995.
In 1986, a 25-year-old man has a life expectancy of 51.4 years, and can expect to live on average 20.2 years in good self-rated health, 24.0 years in average self-rated health, and 7.2 years in poor self-rated health. With an increase in life expectancy to 52.3 years in 1995, he can expect to live 25.5 years in good self-rated health, 21.2 years in average self-rated health, and 5.7 years in poor self-rated health. Of the 0.9 years gained in life expectancy between 1986 and 1995, expected life-time years in good health increased by 5.3 years, while expected life-time years in average and poor self-rated health decreased by 2.8 years and 1.5 years, respectively. However, from 1995 to 2004, even as life expectancy increased by more than two years, the number of years in good self-rated health declined by 3.4 years, and the years in average and poor self-rated health increased by 3.0 and 2.3 years, respectively.
A similar pattern was observed for men at older ages. Most of the increases in life expectancy from 1986 to 1995 were in years of good self-rated health, while the increases in life expectancy from 1995 to 2004, which are greater than in the previous period, were in years of poor self-rated health. Overall, the increase from 1986 to 1995 and the decrease after 1995 in expected number of years in good self-rated health were both greater at younger ages than at older ages, relative to the increases in life expectancy. Japanese men aged 45 and under expected to spend more than 80% of their remaining lives in good or average health.
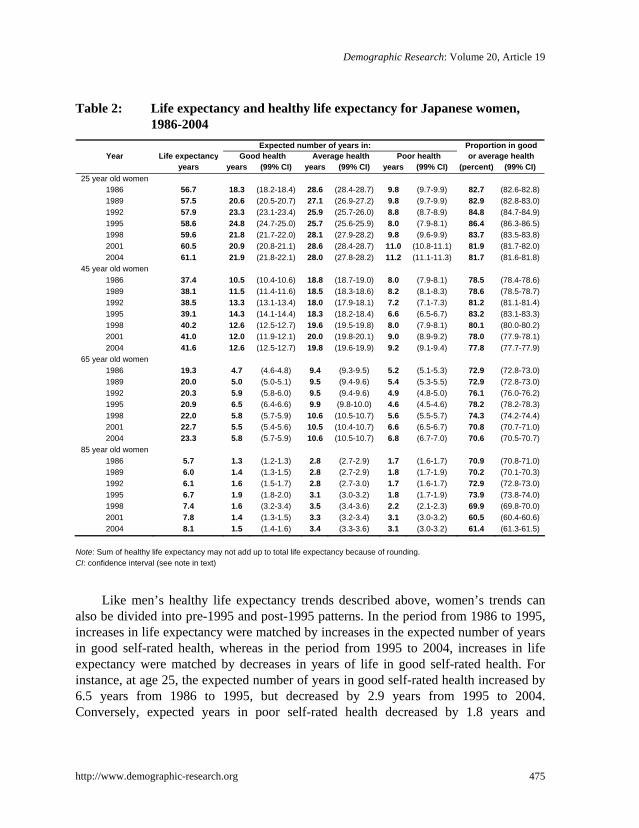
Table 2 provides the results on total life expectancy and healthy life expectancy for Japanese women. Total expected life-time increased at a faster rate for women than for men. From 1986 to 2004, life expectancy increased by 4.4 years for 25-year-olds, 4.2 years for 45-year-olds, 4.0 years for 65-year-olds, and 2.4 years for 85-year-olds. Following a worldwide pattern (Barford et al. 2006), Japanese women can expect to live longer than men at all ages, but are these longer lives lived in good or in poor health? How does the healthy life expectancy of Japanese women compare to that of Japanese men?
http://www.demographic-research.org 474
Demographic Research: Volume 20, Article 19
Table 2: Life expectancy and healthy life expectancy for Japanese women, 1986-2004
Expected number of years in: Proportion in good Year Life expectancy Good health Average health Poor health or average health
years years (99% CI) years (99% CI) years (99% CI) (percent) (99% CI) 25 year old women
1986 56.7 18.3 (18.2-18.4) 28.6 (28.4-28.7) 9.8 (9.7-9.9) 82.7 (82.6-82.8) 1989 57.5 20.6 (20.5-20.7) 27.1 (26.9-27.2) 9.8 (9.7-9.9) 82.9 (82.8-83.0) 1992 57.9 23.3 (23.1-23.4) 25.9 (25.7-26.0) 8.8 (8.7-8.9) 84.8 (84.7-84.9) 1995 58.6 24.8 (24.7-25.0) 25.7 (25.6-25.9) 8.0 (7.9-8.1) 86.4 (86.3-86.5) 1998 59.6 21.8 (21.7-22.0) 28.1 (27.9-28.2) 9.8 (9.6-9.9) 83.7 (83.5-83.8) 2001 60.5 20.9 (20.8-21.1) 28.6 (28.4-28.7) 11.0 (10.8-11.1) 81.9 (81.7-82.0) 2004 61.1 21.9 (21.8-22.1) 28.0 (27.8-28.2) 11.2 (11.1-11.3) 81.7 (81.6-81.8)
45 year old women 1986 37.4 10.5 (10.4-10.6) 18.8 (18.7-19.0) 8.0 (7.9-8.1) 78.5 (78.4-78.6) 1989 38.1 11.5 (11.4-11.6) 18.5 (18.3-18.6) 8.2 (8.1-8.3) 78.6 (78.5-78.7) 1992 38.5 13.3 (13.1-13.4) 18.0 (17.9-18.1) 7.2 (7.1-7.3) 81.2 (81.1-81.4) 1995 39.1 14.3 (14.1-14.4) 18.3 (18.2-18.4) 6.6 (6.5-6.7) 83.2 (83.1-83.3) 1998 40.2 12.6 (12.5-12.7) 19.6 (19.5-19.8) 8.0 (7.9-8.1) 80.1 (80.0-80.2) 2001 41.0 12.0 (11.9-12.1) 20.0 (19.8-20.1) 9.0 (8.9-9.2) 78.0 (77.9-78.1) 2004 41.6 12.6 (12.5-12.7) 19.8 (19.6-19.9) 9.2 (9.1-9.4) 77.8 (77.7-77.9)
65 year old women 1986 19.3 4.7 (4.6-4.8) 9.4 (9.3-9.5) 5.2 (5.1-5.3) 72.9 (72.8-73.0) 1989 20.0 5.0 (5.0-5.1) 9.5 (9.4-9.6) 5.4 (5.3-5.5) 72.9 (72.8-73.0) 1992 20.3 5.9 (5.8-6.0) 9.5 (9.4-9.6) 4.9 (4.8-5.0) 76.1 (76.0-76.2) 1995 20.9 6.5 (6.4-6.6) 9.9 (9.8-10.0) 4.6 (4.5-4.6) 78.2 (78.2-78.3) 1998 22.0 5.8 (5.7-5.9) 10.6 (10.5-10.7) 5.6 (5.5-5.7) 74.3 (74.2-74.4) 2001 22.7 5.5 (5.4-5.6) 10.5 (10.4-10.7) 6.6 (6.5-6.7) 70.8 (70.7-71.0) 2004 23.3 5.8 (5.7-5.9) 10.6 (10.5-10.7) 6.8 (6.7-7.0) 70.6 (70.5-70.7)
85 year old women 1986 5.7 1.3 (1.2-1.3) 2.8 (2.7-2.9) 1.7 (1.6-1.7) 70.9 (70.8-71.0) 1989 6.0 1.4 (1.3-1.5) 2.8 (2.7-2.9) 1.8 (1.7-1.9) 70.2 (70.1-70.3) 1992 6.1 1.6 (1.5-1.7) 2.8 (2.7-3.0) 1.7 (1.6-1.7) 72.9 (72.8-73.0) 1995 6.7 1.9 (1.8-2.0) 3.1 (3.0-3.2) 1.8 (1.7-1.9) 73.9 (73.8-74.0) 1998 7.4 1.6 (3.2-3.4) 3.5 (3.4-3.6) 2.2 (2.1-2.3) 69.9 (69.8-70.0) 2001 7.8 1.4 (1.3-1.5) 3.3 (3.2-3.4) 3.1 (3.0-3.2) 60.5 (60.4-60.6) 2004 8.1 1.5 (1.4-1.6) 3.4 (3.3-3.6) 3.1 (3.0-3.2) 61.4 (61.3-61.5)
Note: Sum of healthy life expectancy may not add up to total life expectancy because of rounding. CI: confidence interval (see note in text)
Like men’s healthy life expectancy trends described above, women’s trends can also be divided into pre-1995 and post-1995 patterns. In the period from 1986 to 1995, increases in life expectancy were matched by increases in the expected number of years in good self-rated health, whereas in the period from 1995 to 2004, increases in life expectancy were matched by decreases in years of life in good self-rated health. For instance, at age 25, the expected number of years in good self-rated health increased by 6.5 years from 1986 to 1995, but decreased by 2.9 years from 1995 to 2004. Conversely, expected years in poor self-rated health decreased by 1.8 years and
http://www.demographic-research.org 475
Yong & Saito: Trends in healthy life expectancy in Japan: 1986 – 2004
increased by 3.2 years in the periods before and after 1995, respectively. These trends are observed for Japanese women at all ages, except at age 85. At age 85, the expected number of years in poor self-rated health generally increased continuously for the entire period observed, except for a 0.1 year decrease in 1992, before levelling off at 3.1 years of life in poor self-rated health in 2004.
Compared to men, women at all ages live a greater number of years in average and poor self-rated health, despite living longer. Men live more years than women in good self-rated health at ages 25 and 45, but by ages 65 and 85, particularly after 1989, women live more years in good self-rated health than men. This reversal could be due to the selective survival of men in poorer health who survived to older ages. Although men at ages 25 and 45 live more years than women in good self-rated health, between 1995 and 2004 the decrease in the number of good self-rated health years for men was also greater than for women. For instance, 25-year-old and 45-year-old men can expect to live 3.4 and 1.9 fewer years in good self-rated health between 1995 and 2004. The corresponding figures for women for the same period are 2.9 and 1.7 years, respectively.
4.2 Proportion of life expectancy in different health states
In addition to examining life expectancy in different health states, and how it has changed over time in absolute number of life years, it is also useful to look at the proportion of life expectancy spent in different health states. An increase in the proportion of life expectancy in good and average health could indicate a compression of morbidity, while a decrease could signify an expansion of morbidity. Figures 1 and 2 show the proportion of life expectancy in different health states for Japanese men at different ages from 1986 to 2004.
http://www.demographic-research.org 476

Demographic Research: Volume 20, Article 19
Figure 1: Proportion of life expectancy in various health states for 25- and 45-year-old Japanese men, 1986-2004
39.4
42.7 46.6
48.6
42.6
39.9
40.7
35.5
37.3 41.5
43.3
37.7
34.5
35.4
46.6
43.4 41
.3
40.4
44.4
45.8
44.6
46.8
44.9 43
.3
43.0
46.2
47.7
46.3
14.0
13.9
12.1
10.9
12.9
14.3
14.8
17.7
17.8
15.2
13.7
16.1
17.8
18.3
0%
20%
40%
60%
80%
100%19
86
1989
1992
1995
1998
2001
2004
1986
1989
1992
1995
1998
2001
2004
25 year-old men 45 year-old men
Good health Average health Poor health
Figure 2: Proportion of life expectancy in various health states for 65- and 85-year-old Japanese men, 1986-2004
30.6
31.4 35.8
37.7
32.3
29.7
30.1
27.6
25.8
29.4
31.8
27.6
23.3
20.8
45.3
44.3 43
.5
43.5
45.4
45.4
44.0
44.0
44.6 45
.2 45.8
44.0
41.4
41.3
24.1
24.3
20.7
18.8
22.2
24.9
25.9
28.4
29.6
25.4
22.3
28.3
35.3
37.9
0%
20%
40%
60%
80%
100%
1986
1989
1992
1995
1998
2001
2004
1986
1989
1992
1995
1998
2001
2004
65 year-old men 85 year-old men
Good health Average health Poor health
Note: Sum of healthy life expectancy may not add up to total life expectancy because of rounding.
http://www.demographic-research.org 477
Yong & Saito: Trends in healthy life expectancy in Japan: 1986 – 2004
Overall, for all ages, there is some indication of a compression of morbidity in the years before 1995, after which an expansion of morbidity is suggested as the proportion of life expectancy in good or average health decreases, and the proportion of life expectancy in poor health increases, especially at older ages. Men at age 25 can expect to live more than 85% of their lives in good or average health. As age increases, the proportion of life expectancy lived in good health decreases, and the proportion lived in average and poor health increases. By age 85, the proportion of life expectancy lived in good or average health has dropped to less than 75%, except in 1995. The decrease in the proportion of life expectancy in good or average health among 85-year-old men in 2001 and 2004 is especially noteworthy. They can expect to live less than two-thirds of their lives in good or average health.
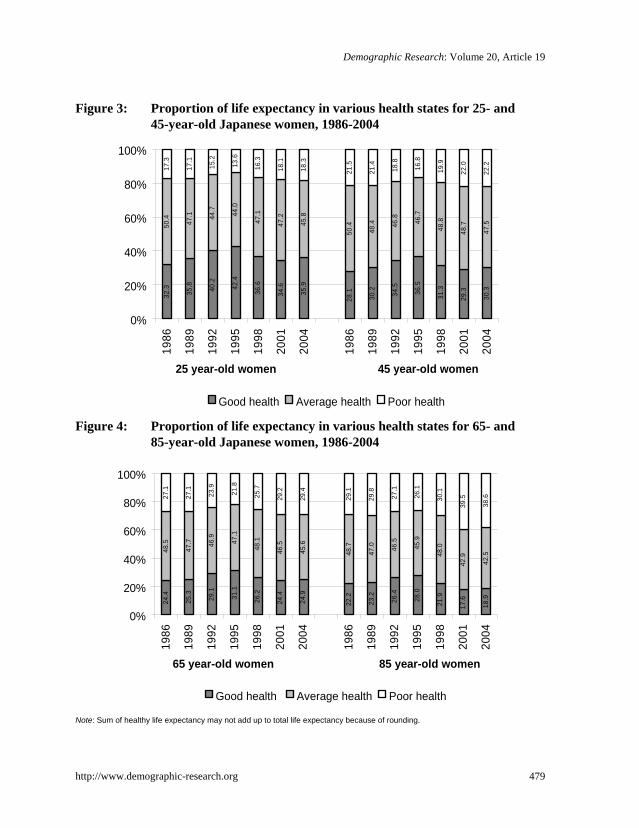
The proportion of life expectancy spent in different health states for Japanese women are shown in Figures 3 and 4. As in the case of men, there is some indication of a compression of morbidity before 1995 and an expansion of morbidity after 1995, although the trend is less clear for those aged 85. Overall, 25-year-old women can expect to live slightly more than 80% of their lives in good or average health. This proportion is lower than that for men at the same age. The proportion of life expectancy lived in good and average health states for 25-year-old women is comparable with that of 45-year-old men in some years, particularly in 1992, 1995, 1998, and 2004. Increasing age brings about a decrease in the proportion of life lived in good or average health. At age 65, women can expect to spend less than 75% of their life-time in good or average health. At age 85, the proportion drops further to about 60% in 2001 and 2004. Compared with men across all ages and all years, Japanese women are more likely to spend a smaller proportion of their lives in good health, and a larger proportion in average and poor health. Interestingly, for nearly all years, Japanese women’s proportion of life expectancy in good health is still comparatively smaller than that of men 20 years older than they are.
http://www.demographic-research.org 478
Demographic Research: Volume 20, Article 19
Figure 3: Proportion of life expectancy in various health states for 25- and 45-year-old Japanese women, 1986-2004
35.8 40.2
42.4
36.6
34.6
35.9
28.1
30.2 34.5
36.5
31.3
29.3
30.3
50.4 47.1 44
.7 44.0
47.1
47.2
45.8
50.4
48.4 46
.8 46.7
48.8
48.7
47.5
17.3
17.1
15.2
13.6
16.3
18.1
18.3
21.5
21.4
18.8
16.8
19.9
22.0
22.2
32.3
0%
20%
40%
60%
80%
100%19
86
1989
1992
1995
1998
2001
2004
1986
1989
1992
1995
1998
2001
2004
25 year-old women 45 year-old women
Good health Average health Poor health Figure 4: Proportion of life expectancy in various health states for 65- and
85-year-old Japanese women, 1986-2004
24.4
25.3
29.1
31.1
26.2
24.4
24.9
22.2
23.2
26.4
28.0
21.9
17.6
18.9
48.5
47.7 46
.9
47.1
48.1
46.5
45.6
48.7
47.0 46
.5
45.9
48.0
42.9
42.5
27.1
27.1
23.9
21.8
25.7
29.2
29.4
29.1
29.8
27.1
26.1
30.1
39.5
38.6
0%
20%
40%
60%
80%
100%
1986
1989
1992
1995
1998
2001
2004
1986
1989
1992
1995
1998
2001
2004
65 year-old women 85 year-old women
Good health Average health Poor health Note: Sum of healthy life expectancy may not add up to total life expectancy because of rounding.
http://www.demographic-research.org 479

Yong & Saito: Trends in healthy life expectancy in Japan: 1986 – 2004
5. Summary and discussion
This paper has examined the increasing life expectancy of Japanese men and women in relation to their health over the period 1986 to 2004. While life expectancy has increased steadily for both sexes, the trends in healthy life expectancy measured by self-rated health were less clear. The gains in life expectancy in the period prior to 1995 were in years of good self-rated health, while the gains in life expectancy in the period after 1995 were in years of poor-self-rated health. These trends apply to both men and women at all ages, except for women at age 85, where there was an almost continuous increase in the number of years in poor self-rated health throughout the observed period. The analysis of proportion of life lived in different health states suggests evidence of a trend of morbidity compression in the years before 1995, followed by an expansion of morbidity across all ages and for both men and women.
The trends that we observed may be partially explained by contextual factors related to policy implementation and the economic conditions in Japan during the same period. In 1989, the Japanese government implemented the “Golden Plan,” which was aimed at promoting health and welfare services for the aged. The plan included home helper and short-stay services, day-care and senior centres, and health care facilities for the elderly. In 1994, this plan was revised into the New Golden Plan, which increased the numerical targets of the original 1989 plan. Such support services and infrastructure are not only helpful for the elderly, but also ease the burden on caregivers, and could in part explain the positive trend in healthy life expectancy during the same period. In addition, between 1986 and 1990, Japan experienced a “bubble” economy buoyed by soaring stock and land prices. The rosy economic conditions during this period brought about a sense of well-being, which may have translated into more positive self-rated health responses, and, thus, longer healthy life expectancies.
The decrease in the expected number of years lived in good self-rated health after 1995, particularly in the years 1998 and 2001, is directly related to the prevalence in good self-rated health (not shown), which was lowest in 1998 and 2001 for all ages. The change in the trend from earlier years may be a consequence of the Asian financial crisis in 1997, which hit the Japanese economy and its people hard. Studies have indicated both a positive and negative relationship between macroeconomic conditions and health, with various mechanisms—such as changes in stress levels, risk-taking, lifestyle and health behaviours, human capital investments, opportunity cost of time, unemployment levels, relative income, and relative price of medical care—linking the two variables (Ruhm 2000; Tapia Granados 2008; Brenner and Mooney 1983; Fenwick and Tausig 1994; Catalano and Dooley 1983). In two recent longitudinal studies conducted in Denmark and the United States, a decline in self-rated health was shown to be causally linked to worries about financial difficulties and job insecurities
http://www.demographic-research.org 480

Demographic Research: Volume 20, Article 19
(Rugulies et al. 2008; Angel et al. 2003). In Japan, economic growth began to slow down considerably in the early 1990s, but the impact on self-rated health was perhaps more gradual than the sudden and global effect of the Asian financial crisis. The effect of such a major setback in 1997, before the economy could recover from the general slowdown, was, arguably, stronger. Available data show that the number of bankruptcies in Japan increased significantly between 1997 and 2003, with a corresponding accrual of enormous amounts of debt. This is in contrast to the continuous decrease in the number of bankruptcies and the smaller total debt level during the bubble economy (Tokyo Shoukou Research 2005). The bleak economic situation also appears to be associated with a trend towards more people taking their own lives. An examination of trends in suicide rates in Japan shows a large increase in the number of suicides from 1995 onwards, with a noticeable jump from 18.8 suicides per 100,000 persons in 1997, to 25.4 suicides per 100,000 persons in 1998; and suicide rates have remained high (Ministry of Health, Labour and Welfare 2006). Since 2003, the Japanese economy has shown some signs of slight recovery, which could explain, in part, the marginal increase in expected years lived in good self-rated health in 2004.
Interestingly, we note that although the expected number of years in good self-rated health declined after 1995, Japanese life expectancy continued to increase, and at a faster rate than prior to 1995. Thus, the economic factors that were consistent with poorer self-rated health did not seem to impact overall mortality levels, even though the number of deaths by suicide increased. A closer examination of cause-specific mortality in Japan during the same period shows a large decrease in the number of deaths by cerebrovascular diseases (i.e., stroke). Since 1970, stroke mortality has decreased steadily, with the exception of an increase from 1994 to 1995.8 From 1995 to 2002, deaths caused by stroke fell from 117.9 per 100,000 persons in 1995 to 103.4 per 100,000 persons in 2002 (Ministry of Health, Labour and Welfare 2006). The decrease in stroke mortality was even larger among older Japanese, since the risk of stroke increases with age and afflicts mostly older adults. For instance, among Japanese aged 70-74, deaths from stroke dropped from 313.8 to 213.0 per 100,000 persons over the same period. Given the relatively stable incidence of stroke from 1996 to 1999, followed by a slight increase from 1999 to 2005, which was estimated from a national patient survey9 (Ministry of Health, Labour and Welfare 2007), the decrease in stroke mortality implies the survival of stroke victims in poor health, thus further contributing to the higher prevalence of poor self-rated health during this period.
8 The exception in the increase in stroke mortality was a result of a change in coding from ICD-9 to ICD-10 codes starting from 1995 (Health and Welfare Statistics Association 1997:51-52).
9 Because population estimates from a national registry are unavailable, data on stroke inpatients from a national patient survey were used to approximate the incidence of stroke.
http://www.demographic-research.org 481

Yong & Saito: Trends in healthy life expectancy in Japan: 1986 – 2004
The decrease in mortality due to other fatal conditions such as cancer, despite an increasing incidence of these conditions, has resulted in an increase in the prevalence of cancer (particularly breast, uterine, colon, and prostate cancers) among the Japanese (National Cancer Center 2007). Advanced diagnostic tools that can detect cancer earlier and improved medical treatments for cancer have enabled more Japanese to survive, despite having, or having ever had cancer. The survivors could report poorer health as a result.
In Japan, the increase in certain chronic diseases and conditions, and their related risk factors, could also have contributed to the downward trend in healthy life expectancy from 1995 to 2004. Because of a shift towards a more sedentary lifestyle and a high-fat diet among the Japanese in recent years, there has been a substantial increase in the proportion with hypercholestrolemia, large weight gains, and non-insulin-dependent diabetes mellitus (Matsumura 2001; Kawamori 2002; Fujishima and Kiyohara 2004). In addition, mental health conditions, such as Alzheimer’s disease and affective mood disorders, have also been on the rise, and could have contributed to the downward trend (Shigeta 2004; Kawakami et al. 2005; Ministry of Health, Labour and Welfare 2007).
Exogenous factors that are not directly related to these actual pathological changes in health, such as an increase in awareness and knowledge of health issues, better access to health care services and preventive health screenings, and new or modified health policies, could likewise serve to change the way in which people perceive their own health and healthy life expectancy over time. In general, health knowledge among the Japanese is high, in part due to the annual health examination that most undergo. The number of recipients of basic health examinations and cancer screenings has also increased for the period 2001 to 2005 (Ministry of Health, Labour and Welfare 2007). The incidence of certain diseases and conditions might have increased with increases in health screenings and improved diagnostic tools, thereby leading to more reports of poor health.
The introduction of a national long-term care insurance program in Japan in 2000 could also have resulted in more Japanese reporting poorer health conditions in order to be eligible for care services. Under the program, all Japanese aged 40 and over must enrol, and eligibility for care services, both at home and at facilities, is determined by health conditions, rather than by income or assets. A recent study showed that the average entitlement rate rose from 13% in 2001 to 17.4% by 2006 (Mitchell, Piggott, and Shimizutani 2006). Despite initial reluctance to utilize care services when the program was first implemented (Tsukada and Saito 2006), utilization rates, particularly in the home health care area, have increased over the years (Mitchell, Piggott, and Shimizutani 2006).
http://www.demographic-research.org 482

Demographic Research: Volume 20, Article 19
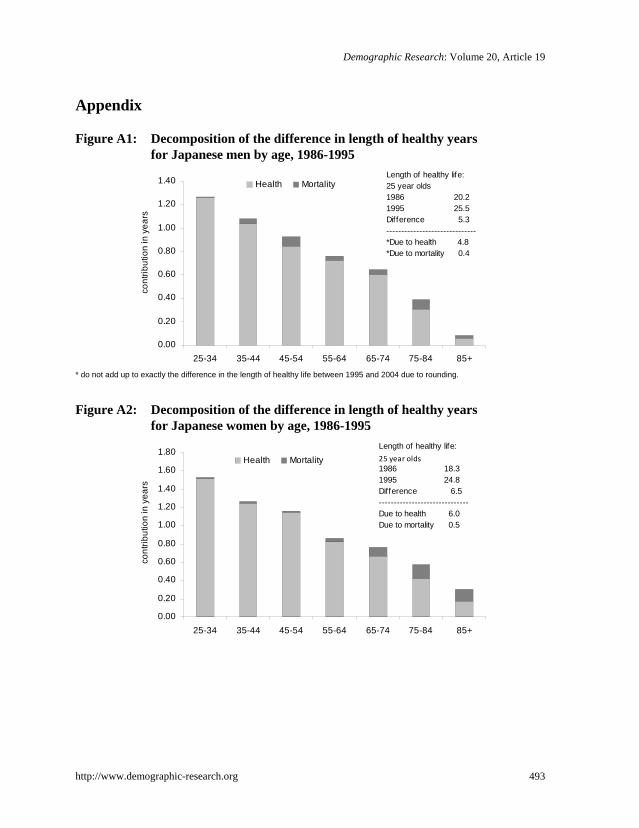
To evaluate these possible explanations of healthy life expectancy trends, we applied a general algorithm proposed by Andreev, Shkolnikov, and Begun (2002) to decompose the changes in length of healthy life years into the effects of changes in mortality and health by age and sex. The results, found in the Appendix, show that the contributions from health changes are much greater than those from changes in mortality for both the upward trend from 1986 to 1995, and the downward trend from 1995 to 2004 for all ages and both sexes. From 1986 to 1995, the effects of health are greater at younger ages than at older ages for men and women (Figures A1 and A2). This might suggest that the bubble economy of the mid-1980s and the Golden Plan, which lessened the burden on caregivers, had a larger effect on younger Japanese.
For the downward trend in healthy life expectancy from 1995 to 2004, the health effects are distributed across different ages with somewhat larger effects at younger working ages, particularly for men (Figures A3 and A4). This result provides some support for the economic crisis explanation for the decrease in the length of healthy lives, especially with regard to working Japanese men. The negative self-ratings of health could reflect actual health declines, or a psychological reaction to general pessimistic expectations. It should be noted that, in the earlier period of increases in healthy life expectancy (1986–1995), those of working age contributed the most to the length of healthy life expectancy. At older ages, the health effects could partially be due to the additional stroke survivors in poor health, as well as a greater willingness among the elderly to report poor health following the introduction of the long-term care insurance program.
Comparing our results with those of other countries that use the same measure of self-rated health, we can see that there was an upward trend in healthy life expectancy for Finland (1978–1986), Great Britain (1980–1996), and Austria (1978–1998) for both men and women (Valkonen, Sihvonen, and Lahelma 1997; Kelly, Baker, and Gupta 2000; Doblhammer and Kytir 2001). A downward trend was observed for Germany (1986–1995) (Brückner 1997), while in the Netherlands (1983–2000) there was an upward trend for men, but a downward or stable trend for women (Perenboom et al. 2002). We advise caution in making direct comparisons between these studies’ findings and our current study. In addition to differences in survey design, cut-off points between good and poor health, and computational methods, it is not clear that the concept of self-rated health is understood in the same way in different time periods and countries, and across sub-groups within a population (Deeg 1999).
This study has a few limitations. First, the institutionalized population was not taken into account in our computations, unlike in other studies conducted in the United States (Crimmins et al. 1989, 1997). Currently, the institutionalized population in Japan is, relative to that in the United States, very small, due in part to the preference in Japan to have family members provide care (Yamamoto and Wallhagen 1997). Even with the
http://www.demographic-research.org 483

Yong & Saito: Trends in healthy life expectancy in Japan: 1986 – 2004
implementation of the long-term care insurance program in 2000, the rate of institutionalization continued to be low, with Japanese preferring to use home health care services instead (Mitchell et al. 2006; Mitchell, Piggott, and Shimizutani 2008). What are the consequences of not taking into account the institutionalized population? With regard to the institutionalized population, there are two assumptions that can be made. The first is that individuals living in institutions have poorer self-rated health than individuals residing in the community. Not including the institutionalized may produce bias, particularly for older populations and certain health conditions (Ritchie et al. 1992). If we make this assumption, then the computations of healthy life expectancy in this paper are overestimated, especially at older ages. The second assumption is that individuals living in institutions exhibit the same distribution of health conditions and rate their health the same as the population living in the community at large. In this paper, in view of the very marginal portion of their life-spans that the Japanese are expected to spend in institutions (Saito 2001), we adopted the second assumption.
Second, while self-rated health is the most inclusive form of health measure, and is a frequently used indicator shown to accurately predict subsequent health problems and mortality, certain issues should be considered. The subjective nature of health could pose some problems, particularly when comparing responses over time. The levels of self-rated health may also vary systematically over time across subgroups, making comparisons difficult. This could reflect real differences in health among groups, but could also be a result of differences in reporting or changing health expectations. For instance, there could be gender differences in reporting health. Therefore, direct gender comparisons of self-rated health should be made with caution. Women’s and men’s reports of their subjective health may partly reflect gender-based differences in assessing and reporting health. Any systematic differences in the way men and women assess and report their health will thus introduce bias in the findings (Case and Paxson 2005). Generally, women are more negative in their health assessments, report more health problems, and recall their symptoms more accurately than men. Women are also more willing than men to admit to having health problems, and tend to report them as more severe (Verbrugge 1985). Furthermore, it is possible that individuals’ health perceptions may change while their health does not: if population health has improved on the whole, people may be less likely to tolerate their health problems, and will report them more systematically, whereas they would not have mentioned them in the past. More research on the validity and sensitivity of self-rated health as a measure may be needed.
Third, we need to consider that the use of different health indicators may show different trends over time (Crimmins 1996). Studies using different health dimensions, such as functional limitations or disability, have produced varying estimates and different evidence for the expansion or compression of morbidity hypotheses. For
http://www.demographic-research.org 484

Demographic Research: Volume 20, Article 19
instance, a compression of morbidity using one particular dimension of health, such as disability, does not necessarily indicate better overall health over time, as there could be worsening of health in other dimensions, such as diseases and medical conditions (Parker and Thorslund 2007). For example, a study on Japan that used functioning and disability as health measures indicated improvements in health among the Japanese in 1993-2002 (Schoeni et al. 2006), which was quite different from our findings measured by self-rated health. To provide a more comprehensive, as well as clearer, picture of a country’s health, future studies should examine a range of health dimensions.
It is also important to note that, apart from actual health changes, and regardless of which health dimension is measured, any changes to the survey design over time would inevitably affect the trend estimates and limit the validity of comparisons over time. For instance, changes in sampling, question wording and response categories, placement of questions within the questionnaire, use of proxies and proxy response rates, and response rates for the specific question used and for the survey as a whole would have an effect on the results (Freedman, Martin, and Schoeni 2002; Freedman et al. 2004). In our study, the sampling, question wording and response categories, and placement of questions have remained consistent over time. However, the response rate for the survey dropped in 2004, and missing self-rated health data, which we excluded from our analysis, have increased over the years. The decrease in the survey response rate in 2004 was likely associated with the enactment of a privacy protection law in Japan in May 2003, which heightened awareness among the Japanese of their privacy rights, and may be responsible for refusals to participate in surveys. If the non-responses, particularly for the specific self-rated health question, were from those in poorer health, then the prevalence of poor self-rated health may have been under-reported.
Fourth, the Sullivan method used in this study has an inherent weakness. The Sullivan method employs age-specific health prevalence rates, a stock measure, instead of incidence rates to obtain the number of person-years lived in a health state at a particular age. This is largely because data on prevalence are more readily available from cross-sectional surveys than is incidence of health states, which is a flow measure requiring longitudinal data. However, in using these prevalence rates, a bias is introduced to the health expectancy estimates, since the prevalence rates are partially dependent on past health conditions, and on probabilities of becoming ill or recovering from illness (Mathers 1991). To resolve this bias, longitudinal data should be used to obtain the transition rates between health states and a multistate life table method used to compute the health expectancy estimates (Rogers, Rogers, and Belanger 1990). But because such data are not always available, and are time-consuming and expensive to collect, the Sullivan method is commonly used instead. Simulation models conducted have shown that the Sullivan and multistate life table methods generally produce similar results, provided that transition rates are smooth and regular over time, and that there
http://www.demographic-research.org 485

Yong & Saito: Trends in healthy life expectancy in Japan: 1986 – 2004
are no sudden changes (Robine and Mathers 1993; Mathers 1991). In our current study, the assumption of smooth transition rates over time might, however, not hold, particularly given the rather sharp decline in prevalence of good self-rated health associated with the economic crisis in the second half of the 1990s. Therefore, it is possible that our healthy life expectancy estimates could have been over- or under-estimated to some extent.
Finally, we should bear in mind that the health of future cohorts will be influenced by a range of factors, so it cannot be assumed that healthy life expectancy will remain at current levels. For example, recent weight gains among the Japanese as a result of lifestyle and dietary changes (McCurry 2007) might cause further decreases in healthy life expectancy, whereas improvements in medical technologies could contribute to longer healthy life expectancy in the future. 6. Acknowledgements
This research was supported by a grant, Academic Frontier Project for Private Universities: a matching fund subsidy from the Ministry of Education, Culture, Sports, Science and Technology, awarded to Nihon University Population Research Institute. An earlier version of this paper was presented at the annual REVES meeting in Manila, the Philippines in May 2008. The authors would like to thank the participants for the useful comments received. The authors are also grateful to the two anonymous reviewers for their helpful and constructive comments on the manuscript.
http://www.demographic-research.org 486

Demographic Research: Volume 20, Article 19
References
Andreev, E. M., Shkolnikov, V. M., and Begun, A. Z. (2002). Algorithm for decomposition of differences between aggregate demographic measures and its application to life expectancies, healthy life expectancies, parity-progression ratios and total fertility rates. Demographic Research 7:499-522. doi:10.4054/DemRes.2002.7.14.
Angel, R., Frisco, M., Angel, J. L. and Chiriboga, D. A. (2003). Financial strain and health among elderly Mexican-origin individuals. Journal of Health and Social Behavior 44:536-551. doi:10.2307/1519798.
Barford, A., Dorling, D., Smith, G. D., and Shaw, M. (2006). Life expectancy: Women now on top everywhere. British Medical Journal 332:808. doi:10.1136/bmj.332.7545.808.
Benjamins, M. R., Hummer, R. A., Eberstein, I. W., and Nam, C. B. (2004). Self-reported health and adult mortality risk: An analysis of cause-specific mortality. Social Science and Medicine 59:1297-1306. doi:10.1016/j.socscimed.2003.01.001.
Brenner, M. H. and Mooney, A. (1983). Unemployment and health in the context of economic change. Social Science and Medicine 17:1125-38. doi:10.1016/0277-9536(83)90005-9.
Brønnum-Hansen, H., Andersen, O., Kjoller, M., and Rasmussen, N. K. (2004). Social gradient in life expectancy and health expectancy in Denmark. Soz. Praventivmed 49:36-41. doi:10.1007/s00038-003-3003-9.
Brückner, G. (1997). Health expectancy in Germany: What do we learn from the reunification process? Paper presented at the 10th REVES meeting, Tokyo.
Case, A. and Paxson, C. (2005). Sex differences in morbidity and mortality. Demography 42:189-211. doi:10.1353/dem.2005.0011.
Camargos, M. C. S., Machado, C. J., and Rodrigues, R. N. (2007). Sex differences in healthy life expectancy from self-perceived assessments of health in the city of Sao Paulo, Brazil. Aging and Society 28:35-48.
Catalano, R. and Dooley, D. (1983). Health effects of economic instability: A test of economic stress hypothesis. Journal of Health and Social Behavior 24:46-60. doi:10.2307/2136302.
http://www.demographic-research.org 487

Yong & Saito: Trends in healthy life expectancy in Japan: 1986 – 2004
Crimmins, E. M. (1996). Mixed trends in population health among older adults. The Journals of Gerontology 51B:S223-225.
Crimmins, E. M., Hayward, M. D., and Saito, Y. (1994). Changing mortality and morbidity rates and the health status and life expectancy of the older population. Demography 31:159-175. doi:10.2307/2061913.
Crimmins, E. M., Saito, Y., and Ingegneri, D. (1989). Changes in life expectancy and disability-free expectancy in the United States. Population and Development Review 15:235-267. doi:10.2307/1973704.
Crimmins, E. M., Saito, Y., and Ingegneri, D. (1997). Trends in disability-free life expectancy in the United States, 1970-90. Population and Development Review 23:555-572. doi:10.2307/2137572.
Deeg, D. J. H. (1999). Self rated health: Does it measure health as well as we think it does? Paper presented at the 11th REVES meeting, London.
DeSalvo, K. B., Bloser, N., Reynolds, K., He J., and Muntner, P. (2006). Clinical review: Mortality prediction with a single general self-rated health question. Journal of General Internal Medicine 21:267-275. doi:10.1111/j.1525-1497.2005.00291.x.
Doblhammer, G. and Kytir, J. (2001). Compression or expansion of morbidity? Trends in healthy life expectancy in the elderly Austrian population between 1978 and 1998. Social Science and Medicine 52:385-391. doi:10.1016/S0277-9536(00)00141-6.
Fenwick, R. and Tausig, M. (1994). The macroeconomic context of job stress. Journal of Health and Social Behavior 35:266-282. doi:10.2307/2137280.
Freedman, V. A., Martin, L. G., and Schoeni, R. F. (2002). Recent trends in disability and functioning among older adults in the United States: A systematic review. Journal of the American Medical Association 288:3137-3146. doi:10.1001/jama.288.24.3137.
Freedman, V. A., Crimmins, E. M., Schoeni, R. F., Spillman, B. C., Aykan, H., Kramarow, E., Land, K., Lubitz, J., Manton, K., Martin, L. G., Shinberg, D., and Waidmann, T. (2004). Resolving inconsistencies in trends in old-age disability: Report from a technical working group. Demography 41:417-441. doi:10.1353/dem.2004.0022.
Fries, J. (1980). Aging, natural death, and the compression of morbidity. New England Journal of Medicine 303:130-135.
http://www.demographic-research.org 488

Demographic Research: Volume 20, Article 19
Fries, J. (1989). The compression of morbidity: near or far? Milbank Quarterly 67:208-232. doi:10.2307/3350138.
Fujishima, M. and Kiyohara, Y. (2004). Changes in incidence and mortality of stroke and risk factors in a Japanese general population: the Hisayama study. International Congress Series 1262:344-347. doi:10.1016/j.ics.2003.12.032.
Groenewegen, P. P., Westert, G. P., and Boshuizen, H. C. (2003). Regional differences in healthy life expectancy in the Netherlands. Public Health 117:424-429. doi:10.1016/S0033-3506(03)00100-8.
Gruenberg, E. M. (1977). The failure of success. Milbank Memorial Fund Quarterly 55:3-24. doi:10.2307/3349592.
Health and Welfare Statistics Association. (1997). Kokumin Eisei no Doukou. Kousei no Shihyou. Vol. 44, No. 9. (in Japanese).
Iburg, K. M., Salomon, J. A., Tandon, A., and Murray, C. J. L. (2001). Cross-population comparability of physician-assessed and self-reported measures of health. The Global Burden of Diseases 2000 in Aging Populations. Harvard Burden of Disease Unit, Cambridge.
Idler, E. L. and Benyami, Y. (1997). Self rated health and mortality: A review of twenty-seven community studies. Journal of Health and Social Behavior 38:21-37. doi:10.2307/2955359.
Jagger, C., Cox, B., Le Roy, S., and EHEMU. (2006). Health expectancy calculation by the Sullivan method. EHEMU Technical Report 2006-3.
Jylha, M., Guralnik, J. M., Ferrucci, L., Jokela, J., and Heikkinen, E. (1998). Is self-rated health comparable across cultures and genders? Journals of Gerontology Series B: Psychological Sciences and Social Sciences 53:144-152.
Kawakami, N., Takeshima, T., Ono, Y., Uda, H., Hata, Y., Nakane, Y., and Kikkawa, T. (2005). Twelve-month prevalence, severity, and treatment of common mental disorders in communities in Japan: preliminary finding from the World Mental Health Japan Survey 2002-2003. Psychiatry and Clinical Neurosciences 59:441-452. doi:10.1111/j.1440-1819.2005.01397.x.
Kawamori, R. (2002). Diabetes trends in Japan. Diabetes Metabolic Research Review 18:S9-13. doi:10.1002/dmrr.296.
Kelly, S., Baker, A. and Gupta, S. (2000). Healthy life expectancy in Great Britain, 1980-96, and its use as an indicator in United Kingdom government strategies. Health Statistics Quarterly 7:32-37.
http://www.demographic-research.org 489

Yong & Saito: Trends in healthy life expectancy in Japan: 1986 – 2004
Kramer, M. (1980). The rising pandemic of mental disorders and associated chronic diseases and disabilities. Acta Psychiatrica Scandinavica 62:382-397. doi:10.1111/j.1600-0447.1980.tb07714.x.
Lyyra, T. M., Heikkinen, E., Lyyra, A. L., and Jylha, M. (2006). Self-rated health and mortality: Could clinical and performance-based measures of health and functioning explain the association? Archives of Gerontology and Geriatrics 42:277-288. doi:10.1016/j.archger.2005.08.001.
Manton, K. (1982). Changing concepts of morbidity and mortality in the elderly population. Milbank Memorial Fund Quarterly/Health and Society 60:183-244. doi:10.2307/3349767.
Mathers, C. D. (1991). Health Expectancies in Australia 1981 and 1988: Australian Government Printing Service.
Matsumura, Y. (2001). Nutrition trends in Japan. Asia Pacific Journal of Clinical Nutrition 10:40-47.
McCurry, J. (2007). Japan battles with obesity. The Lancet 369:451-452. doi:10.1016/S0140-6736(07)60214-1.
Miller, T. R. and Wolinsky, F. D. (2007). Self-rated health trajectories and mortality among older adults. Journals of Gerontology Series B: Psychological Sciences and Social Sciences 62B:S22-S27.
Ministry of Health, Labour and Welfare, Japan. (2006). Vital statistics of Japan Statistics and Information Department, Tokyo.
Ministry of Health, Labour and Welfare, Japan. (2007). Health statistics in Japan 2007. Health Statistics Office, Minister's Secretariat, Tokyo.
Ministry of Health, Labour and Welfare, Japan. (2008a). Abridged life tables for Japan 2007. Statistics and Information Department, Tokyo.
Ministry of Health, Labour and Welfare, Japan. (2008b). Statistical handbook of Japan 2007. Statistics and Information Department, Tokyo.
Ministry of Internal Affairs and Communications, Japan. (2008). Nihon Tokei Nenkan Statistics Bureau and Statistical Research and Training Institute, Tokyo. (in Japanese).
Mitchell, O. S., Piggott, J., and Shimizutani, S. (2006). Aged-care support in Japan: Perspectives and challenges. Benefits Quarterly 22(1):7-18.
http://www.demographic-research.org 490
Demographic Research: Volume 20, Article 19
Mitchell, O. S., Piggott, J., and Shimizutani, S. (2008). Developments in long-term care insurance in Japan. University of New South Wales, Australian School of Business Research Paper.
National Cancer Center. (2007). Cancer statistics in Japan’07 [electronic resource]. http://ganjoho.ncc.go.jp/public/statistics/ backnumber/2007_en.html
Ofstedal, M. B., Zimmer, Z., Cruz, G., Chan, A., and Chuang, Y. L. (2004). Self-assessed health expectancy among older adults: A comparison of six Asian settings. Hallym International Journal of Aging 6(2):95-117. doi:10.2190/0DM2-GDRT-E6J9-2DXQ.
Parker, M. G. and Thorslund, M. (2007). Health trends in the elderly population: getting better and getting worse. The Gerontologist 47:150-158.
Perenboom, R. J. M., Mulder, Y. M., van Herten, L. M., Oudshoorn, K., and Hoeymans, N. (2002). "Trends in healthy life expectancy, Netherlands 1983-2000." Leiden: TNO Prevention and Health.
Ritchie, K., Jagger, C., Brayne, C., and Letenneur, L. (1992). Dementia-free life expectancy: preliminary calculations for France and the United Kingdom. In Robine, J. M., Mathers, C. D., Bone, M. R and Romieu, I. (ed.) Calculation of health expectancies: Harmonization, consensus achieved and future perspectives. Colloque INSERM/John Libbey Eurotext Ltd.
Robine, J. M. and Mathers, C. D. (1993). Measuring the compression or expansion of morbidity through changes in health expectancy. In Robine, J. M., Mathers, C. D., Bone, M. R and Romieu, I. (ed.) Calculation of health expectancies: Harmonization, consensus achieved and future perspectives. Colloque INSERM/John Libbey Eurotext Ltd.
Rogers, A., Rogers, R. G., and Belanger, A. (1990). Longer life but worse health? Measurement and dynamics. The Gerontologist 30:640-649.
Rugulies, R., Aust, B., Burr, H., and Bultmann, U. (2008). Job insecurity, chances on the labor market and decline in self-rated health in a representative sample of the Danish workforce. Journal of Epidemiology and Community Health 62:245-250. doi:10.1136/jech.2006.059113.
Ruhm, C. J. (2000). Are recessions good for your health? The Quarterly Journal of Economics 115:617-650. doi:10.1162/003355300554872.
http://www.demographic-research.org 491

Yong & Saito: Trends in healthy life expectancy in Japan: 1986 – 2004
Saito, Y. (2001). Kenko Jotai Betsu Yomyo No Nenji Suii: 1992 Nen, 1995 Nen, 1998 Nen (Changes in Health Expectancy in Japan: 1992, 1995, and 1998) Jinko Mondai Kenkyu 57:31-50. (in Japanese)
Schoeni, R. F., Liang, J., Bennett, J., Sugisawa, H., Fukaya, T. and Kobayashi, E. (2006). Trends in old-age functioning and disability in Japan, 1993-2002. Population Studies 60:39-53. doi:10.1080/00324720500462280.
Shigeta, M. (2004). Epidemiology: Rapid increase in Alzheimer's disease prevalence in Japan. Psychogeriatrics 4:117-119. doi:10.1111/j.1479-8301.2004.00037.x.
Sullivan, D. F. (1971). A single index of mortality and morbidity. HSMHA Health Report 86:347-354.
Tapia Granados, J. A. (2008). Macroeconomic fluctuations and mortality in postwar Japan. Demography 45:323-343. doi:10.1353/dem.0.0008.
Tokyo Shoukou Research. (2005). Tousan kensuu [electronic resource] http://www.tsr-net.co.jp/new/zenkoku/transit/index.html. (in Japanese).
Tsukada, N. and Saito, Y. (2006). Factors that affect older Japanese people’s reluctance to use home help care and adult day care services. Journal of Cross-Cultural Gerontology 21:121-137. doi:10.1007/s10823-006-9028-9.
Valkonen, T., Sihvonen, A. P and Lahelma, E. (1997). Health expectancy by level of education in Finland. Social Science and Medicine 44:801-808. doi:10.1016/S0277-9536(96)00190-6.
Verbrugge, L. M. (1985). Gender and health: An update on hypotheses and evidence. Journal of Health and Social Behavior 26:156-182. doi:10.2307/2136750.
Wood, R., Sutton, M., Clark, D., McKeon, A., and Bain, M. (2006). Measuring inequalities in health: the case for healthy life expectancy. Journal of Epidemiology and Community Health 60:1089-1092. doi:10.1136/jech.2005.044941.
Yamamoto, N. and Wallhagen, M. I. (1997). The continuation of family caregiving in Japan. Journal of Health and Social Behavior 38:164-176. doi:10.2307/2955423.
Zimmer, Z., Natividad, J. N., Ofstedal, M. B., and Lin, H. S. (2002). Physical and mental health of the elderly. In Hermalin, A. I. (ed.) The well-being of the elderly in Asia: A four-country comparative study. Ann Arbor: University of Michigan.
http://www.demographic-research.org 492
Demographic Research: Volume 20, Article 19
Appendix
Figure A1: Decomposition of the difference in length of healthy years for Japanese men by age, 1986-1995
0.00
0.20
0.40
0.60
0.80
1.00
1.20
1.40
25-34 35-44 45-54 55-64 65-74 75-84 85+
cont
ribut
ion
in y
ears
Health MortalityLength of healthy life: 25 year olds1986 20.21995 25.5Difference 5.3------------------------------*Due to health 4.8*Due to mortality 0.4
* do not add up to exactly the difference in the length of healthy life between 1995 and 2004 due to rounding.
Figure A2: Decomposition of the difference in length of healthy years
for Japanese women by age, 1986-1995
0.00
0.20
0.40
0.60
0.80
1.00
1.20
1.40
1.60
1.80
25-34 35-44 45-54 55-64 65-74 75-84 85+
cont
ribut
ion
in y
ears
Health MortalityLength of healthy life:25 year olds1986 18.31995 24.8Difference 6.5------------------------------Due to health 6.0Due to mortality 0.5
http://www.demographic-research.org 493

Yong & Saito: Trends in healthy life expectancy in Japan: 1986 – 2004
Figure A3: Decomposition of the difference in length of healthy years for Japanese men by age, 1995-2004
-1.00
-0.80
-0.60
-0.40
-0.20
0.00
0.20
0.40
25-34 35-44 45-54 55-64 65-74 75-84 85+
cont
ribut
ion
in y
ears
Health Mortality
Length of healthy life:25 year olds1995 25.52004 22.1Difference -3.4------------------------------*Due to health -3.9*Due to mortality 0.6
* do not add up to exactly the difference in the length of healthy life between 1995 and 2004 due to rounding.
Figure A4: Decomposition of the difference in length of healthy years
for Japanese women by age, 1995-2004
-1.00
-0.80
-0.60
-0.40
-0.20
0.00
0.20
0.40
25-34 35-44 45-54 55-64 65-74 75-84 85+
cont
ribut
ion
in y
ears
Health Mortality
Length of healthy life:25 year olds1995 24.82004 21.9Difference -2.9------------------------------Due to health -3.5Due to mortality 0.6
http://www.demographic-research.org 494