healthy life expectancy calculation guidelines
TRANSCRIPT

1
Healthy Life Expectancy Calculation Guidelines
(Tentative translation)
2012 Health and Labor Sciences Research Grant
Study group on future predictions of healthy life expectancy and cost-effectiveness of
measures to prevent lifestyle-related diseases, part of an integrated research project on
measures to prevent cardiovascular disease, diabetes mellitus, and other lifestyle-related
diseases
1. Introduction
The aim of the Healthy Life Expectancy Calculation Guidelines (“Guidelines”) is to
present a standard method of calculating healthy life expectancy that can be applied in
the planning and assessment of healthcare and welfare measures. Such planning and
assessment are done in the light of prefectural and municipal health promotion plans
under “the second term of National Health Promotion Movement in the 21st Century, ”
(Health Japan 21 (the second term)).
Healthy life expectancy is a generic term that is generally used for the average time
people can be expected to live in a given state of health, or indices of measuring it. In
Health Japan 21 (the second term), healthy life expectancy is defined as length of life
that an individual lives without limitation in daily activities due to health problems.
Here we look at the indices of “average period of time spent without limitation in daily
activities,” “average period of time individuals consider themselves as healthy,” and
“average period of time spent independent in daily activities.”

2
In calculating the index of healthy life expectancy it is important to clarify the
purpose. The definition of a healthy state and clarification of the subject year,
population, and age is the basis on which the index is calculated. It is also essential that
the basic data and calculation method be used properly. Several other points should also
be borne in mind when performing the calculations and interpretations.
The “Healthy life expectancy calculation program” is a simple program to calculate
the indices of healthy life expectancy from basic data. It is made publicly available on
the assumption that it will be used together with these Guidelines.
The Guidelines explain how healthy life expectancy is calculated (including how to
use the “Healthy life expectancy calculation program”). The subject years for the
calculations are taken to be 2010 and later. The subject populations are prefectures in
the “average period of time spent without limitation (in daily activities)” and “average
period of time individuals consider themselves as healthy,” and prefectures and
municipalities in “average period of time spent independent in daily activities.” The
Appendix gives results of calculations for the three indices, results of trial calculations
of accuracy, and detailed calculation methods.
2. Healthy life expectancy and its indices
Healthy life expectancy is a generic term that generally indicates the average time
people can be expected to live in a given state of health, or indices for measuring it. Life
expectancy is currently divided into periods of health and periods of poor health, and
the average number of years of health in all individuals in a population is obtained as an
indicator of healthy life expectancy.
The periods of health and poor health of five individuals, A–E, are shown in Figure

3
2-1. Individual A went from a healthy state to an unhealthy state with the occurrence of
a health problem at age 54 years 3 months. He then recovered from that unhealthy state
to a healthy state at the age of 56 years 9 months. Later, his health became poor again at
age 72 years 3 months and he died at age 77 years 6 months. Individual A’s total period
of health was 69 years and 9 months, from age 0 to 54 years 3 months (54 years and 3
months), and from age 56 years 9 months to 72 years, 3 months (15 years and 6 months).
Individual A’s total period of poor health was 7 years and 9 months, from age 54 years 3
months to age 56 years 9 months (2 years and 6 months) and from age 72 years 3
months to 77 years 6 months (5 years and 3 months). His survival time (life expectancy)
was from age 0 years to 77 years 6 months, of which the proportion of healthy time was
90% (69 years 9 months/77 years 6 months).
In this group the average period of health was 70.0 years and the average period of
poor health was 8.5 years. These figures were obtained by averaging the periods of
health and ill health for the five individuals, A–E. Average life expectancy (sum of the

4
two periods) was 78.5 years, of which the average period of health accounted for 89%.
The periods of health and poor health from the age of 65 years and beyond were
averaged for four of the individuals (Individual B, who died before the age of 65 years,
was excluded), and the average period of health was found to be 11.1 years and the
average period of poor health was found to be 6.4 years. Average remaining life
expectancy was 17.5 years, of which the average years of health accounted for 63%.
To obtain periods of health and poor health, peoples’ lives need to be followed until
the end. Directly obtaining the average periods of health and poor health would
therefore require follow-up data for more than 100 years, but this is not practical as an
index of healthcare and welfare. Therefore, the measure of healthy life expectancy,
described in the following, is calculated based on data obtained at the present time
under uniform assumptions.
The indicator of healthy life expectancy is normally defined by how a state of health
is determined conceptually (conceptual definition), how a state of health is measured in
individuals (measurement method), and how the value of the index is calculated from
the results of those measurements (calculation method). The conceptual definition of a
healthy state is divided broadly as objective and subjective, and the measurement
method as self-reported and other.
The conceptual definition of health and the measurement method is objective and
self-reported, respectively, for “average period of time spent without limitation (in daily
activities)”; subjective and self-reported for “average period of time individuals
consider themselves as healthy”; and objective and other (care need level in long-term
care insurance) for “average period of time spent independent in daily activities.” The
conceptual definition and measurement method are explained in detail below. The
5
calculation method is the same in the three indices, and the concept is described in “4.
Healthy life expectancy calculation method.” It should be noted here that dividing
health into either healthy or unhealthy states has been criticized on the basis that health
is essentially a continuum that cannot be rigidly dichotomized as either healthy or
unhealthy.
(1) “Average period of time spent without limitation (in daily activities)”
Health is taken to mean having no restrictions in daily life. A response of “No” to
question 1 on the questionnaire (Table 2-1) indicates health, while a response of “Yes”
indicates poor health. Question 2 asks whether or not the person is restricted in
performing individual activities (not used in calculating the index). From the content of
the activities, this index is related to the development of an active life based on health
promotion, together with the effects from prevention of serious disease and the need for
care.
Table 2-1. Questions on “Average period of time spent without limitation (in daily
activities)”
Question 1. Do health problems currently affect your daily life in some way?
(1) Yes (2) No
Question 2. What kinds of effects are they?
Circle the numbers of all that apply.
(1) Activities of daily living (rising, dressing, eating, bathing, etc.) (2) Going out
6
(restrictions from time or amount of effort, etc.) (3) Work, housework, school
(restrictions from time or amount of effort, etc.) (4) Exercise (including sports)
(5) Other
(2) Average period of time individuals consider themselves as healthy
A healthy state is defined as when an individual feels he or she is healthy. Subjects
respond to the questions by selecting one of the five options. Selection of “(1) Good,”
“(2) Fairly good,” or “(3) Average” is taken to indicate a healthy state, and selection of
“(4) Not very good” or “(5) Not good” is taken to indicate an unhealthy state.
Table 2-2. Questions for average period of time individuals consider themselves as
healthy
Question. How is your health at present? Circle the number that applies.
(1) Good (2) Fairly good (3) Ordinary (4) Not very good (5) Not good
(3) Average period of time spent independent in daily activities
A healthy state is taken to be independence in activities of daily living. Care need
levels of 2–5 in the long-term care insurance system are taken to be an unhealthy state
(need for care), and everything else is taken to be a healthy (independent) state.
The reasons for determining the unhealthy (need for care) state based on care need
level in the long-term care insurance were that the care need level in the long-term care
insurance system is judged using uniform criteria nationwide, and that care insurance
data can be obtained equally in all parts of the country. The reasons that support need

7
levels 1 and 2 and care need level 1 were not included in the unhealthy (need for care)
state were that in the care insurance system support need levels 1 and 2 do not indicate
the need for care and are not targeted for care need prevention, and that care need level
1 indicates about the same level of functioning in daily life as support need level 2.
Although this method of determining health state may be debated, it does have a certain
degree of validity.
The care need levels in the long-term care insurance system are for people aged 65
years and older. For ages 40–64 years the system covers only patients who have
diseases that develop with the mental and physical changes that occur with age. Ages 0–
39 years are excluded. Hence, for subjects beyond the age of 65 it is more natural to use
“average period of time spent independent in daily activities” at age 65. When
calculating indices from the age of 0 years, it is assumed that all people aged 0–39 years
and nearly all people aged 40–64 years (other than those with diseases that have
developed with the mental and physical changes that occur with age) are in a healthy
(independent) state.
This index is also called “average number of years of independence.”
3. The aim of calculating healthy life expectancy
In planning and assessing healthcare and welfare activities, it is important to apply
indices that accurately express the goals. The goals may be broadly divided into things
directly related to the efforts, things related to the final results (outcomes), and things
related to intermediate states. Indices are determined with consideration of suitability to
each goal, ease of calculation, and other matters.
The index of healthy life expectancy combines survival, death, and status of health or

8
poor health. It is related to final outcomes in the field of healthcare and welfare, and its
application to the planning and assessment of efforts is of considerable significance. At
the same time, the factors that determine healthy life expectancy are diverse and
demonstrative data associated with these factors have not been sufficiently identified.
Hence, in the planning and assessment of healthcare measures it is better to apply and
interpret not only the index of healthy life expectancy but also indices that are indirectly
related to the measures and individual outcome indices (such as the mortality rate from
cerebrovascular disease or ischemic heart disease).
“Average period of time spend without limitation in daily activities” is taken up in
Health Japan 21 (the second term) with the aim of extending health life expectancy,
while “average period of time individuals consider themselves as healthy” is positioned
as an index to note in the achievement of that goal. A characteristic of “average period
of time spent independent in daily activities” is that it can be calculated in all
municipalities nationwide without conducting a special survey, since a healthy state is
based on the care need level in the long-term care insurance system. It is important to
choose indices after considering their position relative to others and their characteristics.
As will be described in “6. Points to remember in interpreting healthy life expectancy,”
the healthy life expectancy index is not interpreted strictly as an absolute value; rather, it
is thought to be more practical to view it relatively. One way to look at it relatively is,
for example, to compare different years in the subject population (such as 2010 and
2015 in prefectures). This is important to keep in mind when applying this to planning
and assessment of healthcare and welfare measures.
The basic approach when applying the index of healthy life expectancy is to confirm
the purpose of the calculations while considering the goals in planning and assessment

9
of healthcare and welfare measures.
4. Method of calculating healthy life expectancy
The three indices of healthy life expectancy share a common framework in their
calculation methods. The concepts of basic items, basic data, and calculation method in
that framework are described below together with an explanation of how to use the
“healthy life expectancy calculation program.”
(1) Basic items
Confirmation of this conceptual definition of health status and clarification of the
subject year, age, and population are fundamental. In these Guidelines, the subject year
is assumed to be 2010 or later. The subject age is 0 years for boys and girls separately,
but for “average period of time spent independent in daily activities” age 65 is more
natural. The subject population is assumed to be prefectures for “average period of time
spent without limitation in daily life” and “average period of time individuals consider
themselves as healthy,” and prefectures and municipalities for “average period of time
spend independent in daily activities.” With small study populations there are certain
items that should be noted in the calculation method (5. Points to remember in
calculating healthy life expectancy).
2) Basic data
Mortality rate and poor health ratio by sex and age group are used in calculating
healthy life expectancy. Age groups are set at 0–4 years, 5–9 years, …, 85 years and
older. The basic data for mortality rate are population and number of deaths. The

10
population is taken to be the Japanese population (or total population) at mid-year (or as
of October 1), and is obtained from the national census, projected population, or
population register. The number of deaths is basically obtained from the vital statistics
of Japan for the year in question. The poor health ratio differs with the index, the details
of which are shown in “5. Points to remember in calculating healthy life expectancy.”
Also used are the national population in the same year as the subject population and
number of deaths (obtained in the same way as for the subject population), the number
of survivors in abridged life tables, and the static population (accumulated; in life tables
normally expressed as T). These data are publicly available at the Portal Site of Official
Statistics of Japan (http://www.e-stat.go.jp/).
(3) Concept for the calculation method
The standard Chiang life table and Sullivan method are used to calculate healthy life
expectancy, and average number of years of health, average number of years of poor
health, and their approximate 95% confidence intervals are obtained. The calculation
method is shown in detail in “9. Appendix (5) Details of the method of calculating
healthy life expectancy.”
(4) Calculation program
The “Healthy life expectancy calculation program” is a simple program in Excel
format. It is expected that it will be downloaded from the website and used in
calculating healthy life expectancy. When this program is read by Excel, a “readme”
sheet (Fig. 4-1) is shown on the screen. This gives a very simple explanation of each
sheet. The “Healthy life expectancy calculation table” sheet is the calculation program.

11
The sheet entitled “Notes on using the calculation table” gives some things to be aware
of in using the calculation program, and it outlines the explanations for the present
chapter and the next chapter. The “National basic data” sheet is basic data for the entire
country that is used in the calculation program. The prefectural basic data sheet and the
“Healthy life expectancy calculation table that uses life tables for the subject group”
sheet are explained in “9. Appendix.”
When the “Healthy life expectancy calculation table” sheet is read, the screens shown
in Figures 4-2 and 4-3 are displayed. The top half of the screens has input cells (white
section) for basic data. The basic data are population size of the subject population,
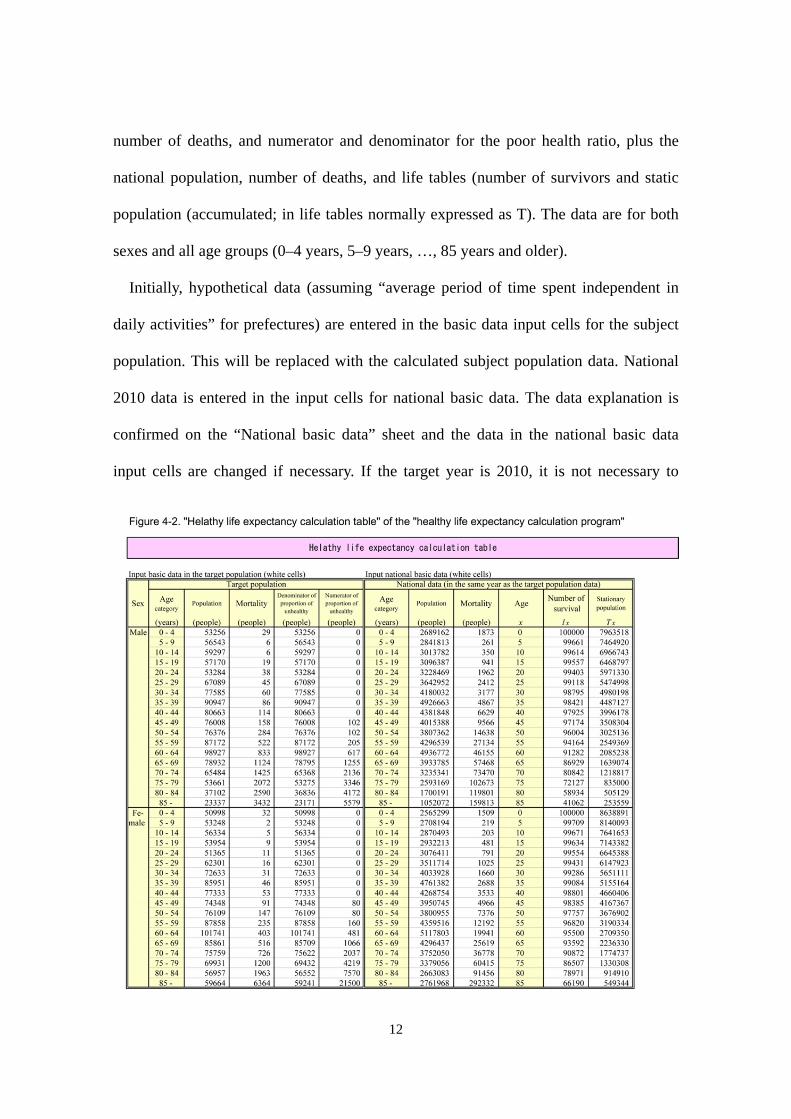
12
number of deaths, and numerator and denominator for the poor health ratio, plus the
national population, number of deaths, and life tables (number of survivors and static
population (accumulated; in life tables normally expressed as T). The data are for both
sexes and all age groups (0–4 years, 5–9 years, …, 85 years and older).
Initially, hypothetical data (assuming “average period of time spent independent in
daily activities” for prefectures) are entered in the basic data input cells for the subject
population. This will be replaced with the calculated subject population data. National
2010 data is entered in the input cells for national basic data. The data explanation is
confirmed on the “National basic data” sheet and the data in the national basic data
input cells are changed if necessary. If the target year is 2010, it is not necessary to
13
change any of the indices.
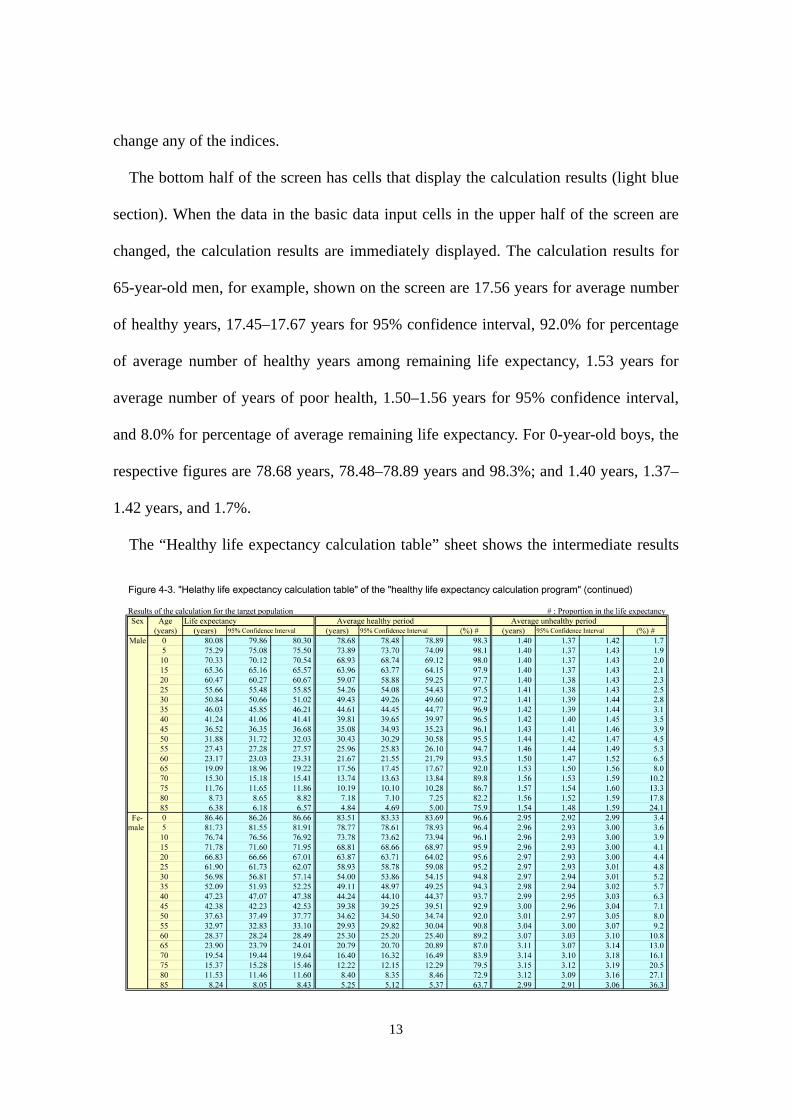
The bottom half of the screen has cells that display the calculation results (light blue
section). When the data in the basic data input cells in the upper half of the screen are
changed, the calculation results are immediately displayed. The calculation results for
65-year-old men, for example, shown on the screen are 17.56 years for average number
of healthy years, 17.45–17.67 years for 95% confidence interval, 92.0% for percentage
of average number of healthy years among remaining life expectancy, 1.53 years for
average number of years of poor health, 1.50–1.56 years for 95% confidence interval,
and 8.0% for percentage of average remaining life expectancy. For 0-year-old boys, the
respective figures are 78.68 years, 78.48–78.89 years and 98.3%; and 1.40 years, 1.37–
1.42 years, and 1.7%.
The “Healthy life expectancy calculation table” sheet shows the intermediate results

14
of the calculations for reference. Moving to the right of the screen, the results are shown
for the five levels of the healthy life expectancy calculation method: (1) Calculation
preparations, (2) Life table calculations, (3) Life table calculations for health and ill
health, (4) Calculation of healthy life expectancy, and (5) Healthy life expectancy
interval estimation. These cells (purple section) must never be changed (cells are
protected).
5. Points to remember in calculating healthy life expectancy
Points to remember in calculating healthy life expectancy are related to
Comprehensive Survey of Living Conditions data, surveys based on the Comprehensive
Survey of Living Conditions, long-term care insurance information, and small subject
populations.
(1) Comprehensive Survey of Living Conditions data
In calculating the “average period of time spent without limitation (in daily activities)”
and “average period of time individuals consider themselves as healthy” in prefectures,
it is assumed that poor health ratio is obtained from Comprehensive Survey of Living
Conditions data. The denominator and numerator are the total number of respondents
(people who did not answer this question are not included among respondents) and the
number of respondents who classified as having poor health, respectively, from the
relevant questions (see Tables 2-1 and 2-2). In this case the target year for calculations
is the year of large-scale implementation of the same survey (expected to be 2010 and
every three years afterward), and the subject population is the nation or prefectures.
Since 0–5-year-old children are not included among the response subjects for the
15
questions used, the poor health ratio for 6–9-year-old children is substituted for the ratio
in 0–4 and 5–9-year-old children. In the “Healthy life expectancy calculation table”
sheet of the “Healthy life expectancy calculation program,” data for 6–9-year-olds is
entered into cells for 0–4 and 5–9-year-olds in the input columns for the denominator
and numerator for poor health ratio. The effect of these manipulations is relatively small,
and even if “0” is entered into the cell for the number of 0–4-year-olds, the change in
the index value is limited to about 0.1 years.
In the Comprehensive Survey of Living Conditions the estimated number of people is
shown rather than the number of people surveyed. In the “Healthy life expectancy
calculation table” sheet in the “Healthy life expectancy calculation program,” the
variance in the estimated number is not considered when the estimated number is
entered into the denominator and numerator input columns for poor health ratio. As a
result, the 95% confidence interval for healthy life expectancy becomes excessively
narrow. In prefectural data large numbers of 10,000 to 22,000 people are surveyed and
so the 95% confidence interval is relatively narrow (see “9. Appendix (4) Trial
calculations of healthy life expectancy accuracy”).
(2) Surveys that conform to the Comprehensive Survey of Living Conditions
When calculating the “average period of time spent without limitation in daily
activities” and “average period of time individuals consider themselves as healthy” in
municipalities, the poor health ratio cannot be obtained from the Comprehensive Survey
of Living Conditions. A separate survey that conforms to the Comprehensive Survey of
Living Conditions is therefore conducted to obtain the denominator and numerator for
the poor health ratio. When such surveys are not done, the “average period of time spent

16
independent in daily activities” is calculated from long-term health insurance
information.
The following raises some points to bear in mind when conducting a survey that
conforms to the Comprehensive Survey of Living Conditions. The survey should be
self-administered and use the same questions with regard to healthy life expectancy (see
Tables 2-1 and 2-2). As a rule survey subjects should be selected randomly. For example,
by simple random sampling from the subject population or subdividing the subject
population into small groups and taking all subjects of a randomly sampled small group
as the subjects. To limit the bias in healthy life expectancy from non-collection of
survey forms, the response rate should preferably meet a given standard (for example,
70% or higher). Repeated requests for responses from survey subjects are effective in
achieving this. Ensuring a certain level of accuracy in healthy life expectancy requires a
quite large number of survey subjects. From the results of trial calculations for the
accuracy of “average period of time spent without limitation in daily activities” (see “9.
Appendix (4) Trial calculations of healthy life expectancy accuracy”), the target for
number of responses (number of survey subjects × response rate) should be 3,000
people or more; if possible 10,000 or more is preferable. Information from surveys that
do not satisfy the above is not appropriate for use in calculating healthy life expectancy.
(3) Information from long-term care insurance
In calculating the “average period of time spent independent in daily activities,” the
poor health ratio is obtained from long-term care insurance information. That
information should be for some point in the subject year; for example, information as of
the end of September or information from an October screening. If the long-term care

17
insurance system has been recently revised, it is important to avoid a time soon after the
revisions.
The denominator and numerator for the poor health ratio are the number of people
covered by long-term care insurance (or the population) and the number of people
certified as having care need levels 2–5, respectively. The poor health ratio for 0–39
years old is assumed to be zero. In the “Healthy life expectancy calculation table” of the
“Healthy life expectancy calculation program,” “0” is entered in the input column for 0–
39-year-olds as the numerator for the poor health ratio (the population or other figure
can be entered in the denominator input column). “Average period of time spent
independent in daily activities” at 65 years old is calculated from the data for ages 65
years and older (the input column for 0–64 years old can be left blank). When the
number of people aged 40–64 years who are certified as having care need levels 2 to 5
is obtained as the number of people by 5-year age group, the number of people is
apportioned a uniform number of people for each age group or a predetermined ratio.
The method of apportioning with a predetermined ratio is shown on the “Notes on using
the calculation table” sheet in the “Healthy life expectancy calculation program.”
(4) Small subject populations
In subject populations of small size the number of deaths will be low, and as a result
the accuracy of the healthy life expectancy based on this subject population will
decrease. To ensure a certain level of accuracy it is necessary to have a certain
population size. From the trial calculations of accuracy in the “average period of time
spent independent in daily activities” (see “9. Appendix (4) Trial calculations of healthy
life expectancy accuracy”), the target for the subject population size should be 130,000

18
people or more. To improve the accuracy with fewer than 130,000 people it is
recommended that the number of deaths in several years be used. For example, the
number of deaths in three years, including the target year and the years before and after
the target year, may be used.
When using the number of deaths in multiple years in the “Healthy life expectancy
calculation program,” the number of deaths for the study population in the “Healthy life
expectancy calculation table” sheet is the total number of deaths in all the years, and the
population size of the study population is the total population in the all the years. Other
settings are the same as for single years. For example, in calculating the “average period
of time spent independent in daily activities” in 2010, the total population in 2009–2011
(or three times the population in 2010) is taken as the population. The numerator and
denominator for the poor health ratio in the subject population and the national basic
data are data for 2010. Even in cases when data for multiple years are used for the
numerator for the poor health ratio (the number of people certified to need care in the
long-term care insurance), correlations associated with duplication of the same
individuals need to be corrected. Even so, this does lead to much improvement in
accuracy.
In subject populations of very small size the accuracy declines markedly. There is a
high likelihood that the healthy life expectancy will become excessively high or low, the
interpretation of which is difficult. Based on the results of trial calculations of the
“average period of time spent independent in daily activities” at age 65, healthy life
expectancy cannot be considered accurate even with the use of the number of deaths
over three years in populations of less than 120,000. Such subject populations are not
appropriate for calculating healthy life expectancy.

19
Since the accuracy of healthy life expectancy is not high when subject populations
are small, the estimated value and 95% confidence interval need to be calculated,
displayed, and interpreted together. Due consideration should be given to this in order to
avoid interpretation errors in healthy life expectancy associated with low accuracy. In
very small study populations, one may consider using calculation methods that employ
life tables for the study population (life tables for each municipality, etc.) in place of the
population and number of deaths (see “9. Appendix (6) Healthy life expectancy
calculation method using subject population life tables).