tree canopy size and density assessment with a laser scanner citrus research and education center...
TRANSCRIPT

Tree Canopy Size and Density
Assessment with a Laser Scanner
Citrus Research and Education Center
Masoud Salyani and J. Brian Wei
2nd Workshop on
Precision Agriculture for Florida Citrus
January 21, 2004

Citrus grove with dead trees and resets

Spray drift

Ultrasonic sensors
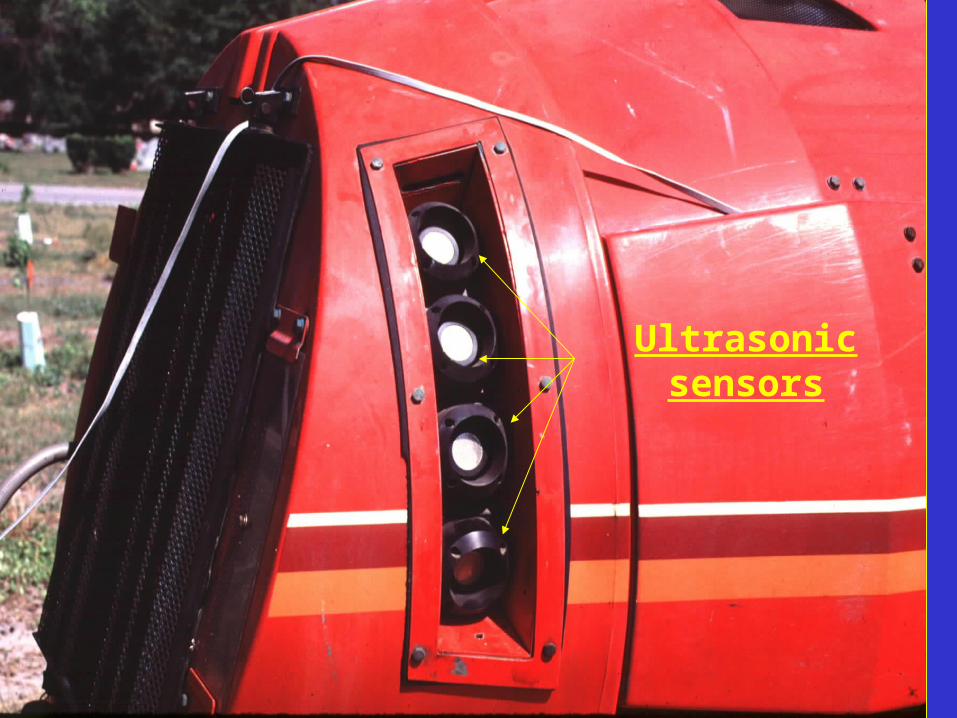
Ultrasonic sensors
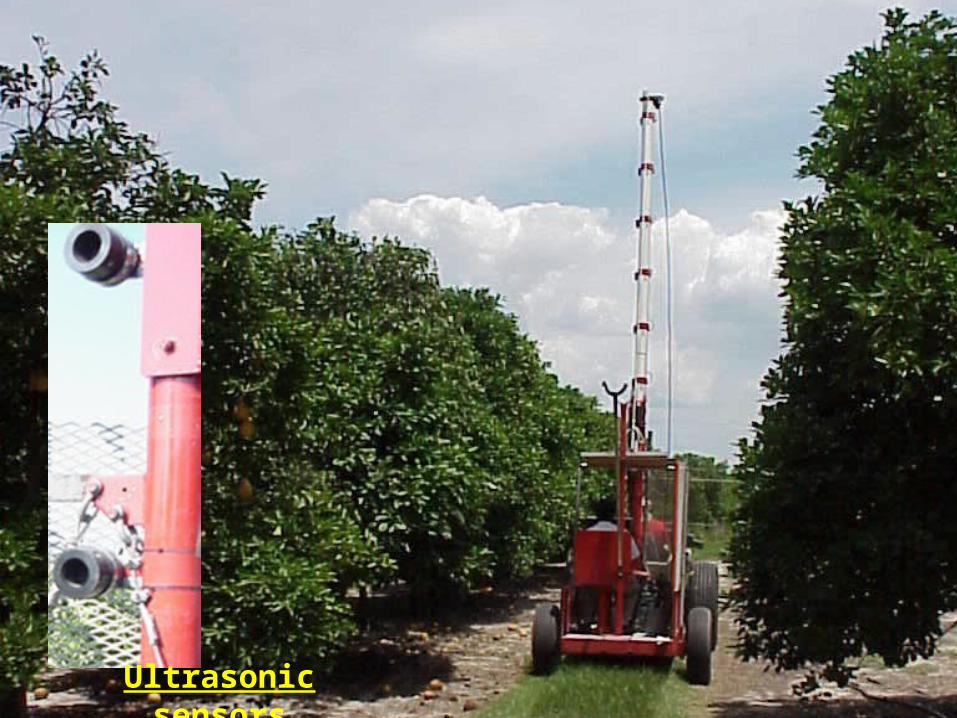
Ultrasonic sensors

Photocells
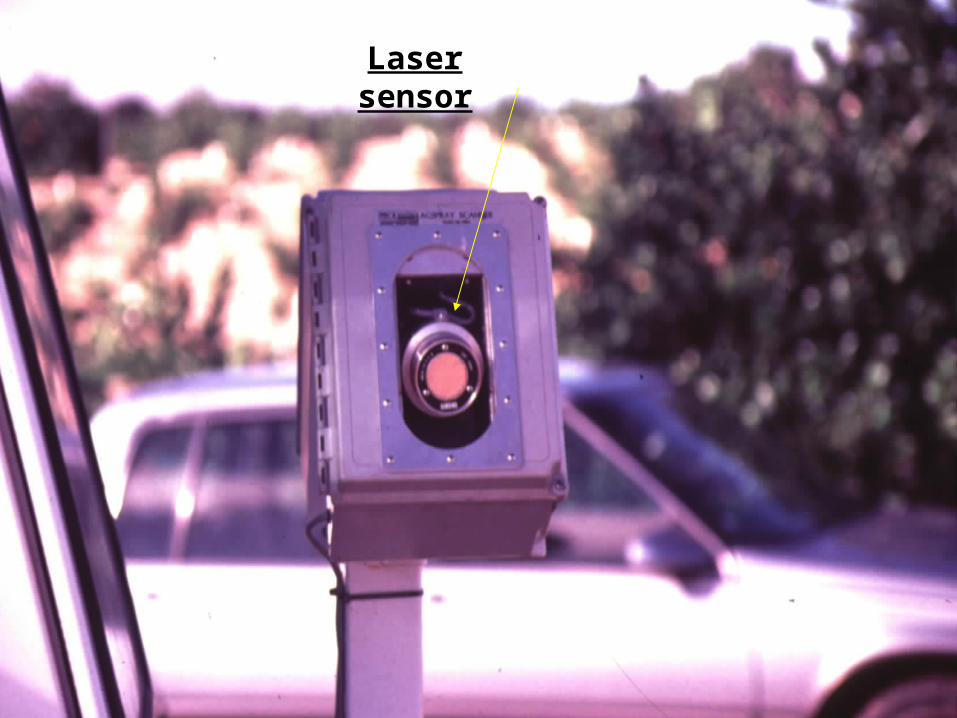
Laser sensor

Laser sensor

CREC Laser system in operation

Scanning system principle

Scan profile
Ground
Window start
α
Li1Li2
Dij
Lij
Lij+1
Hs
D
LG
LLij+1
LLij
Window stop
Ө
132.40
βj
βG
βT
I
II
Sensor
LT

Schematic view of a Distance image
i+1+
ΔW
XL
XR
YB
YT
j
j+1
i
Illustrated in next slide
(1,1)
x
y

Pseudo-color image of a tree

Spatial resolution test
A
HIJK
LM
B
A
HIJK
LMB C D E F G
C
D
E
F
G

A
HIJK
LMB C D E F G
Not continuous
Continuous image lines
Distance image for vertical targets (horizontal resolution)

A
HIJK
LM
B
C
D
E
F
G
Not continuous
Continuous
Distance image for horizontal targets (Vertical resolution)

A
HIJK
LMB C D E F G
WhiteBlack
Signal amplitude image for vertical targets

Ground truth of length measurements in three dimensions

0
200
400
600
w1 w2 w3
Manual measurement
Instrument measurement
0
100
200
300
400
D1 D2 D3
Le
ng
th, c
m.
0
200
400
600
H1 H2 H3
Targets
Std. dev.
Manual vs. laser length measurements

Picture of a test tree

Signal amplitude image
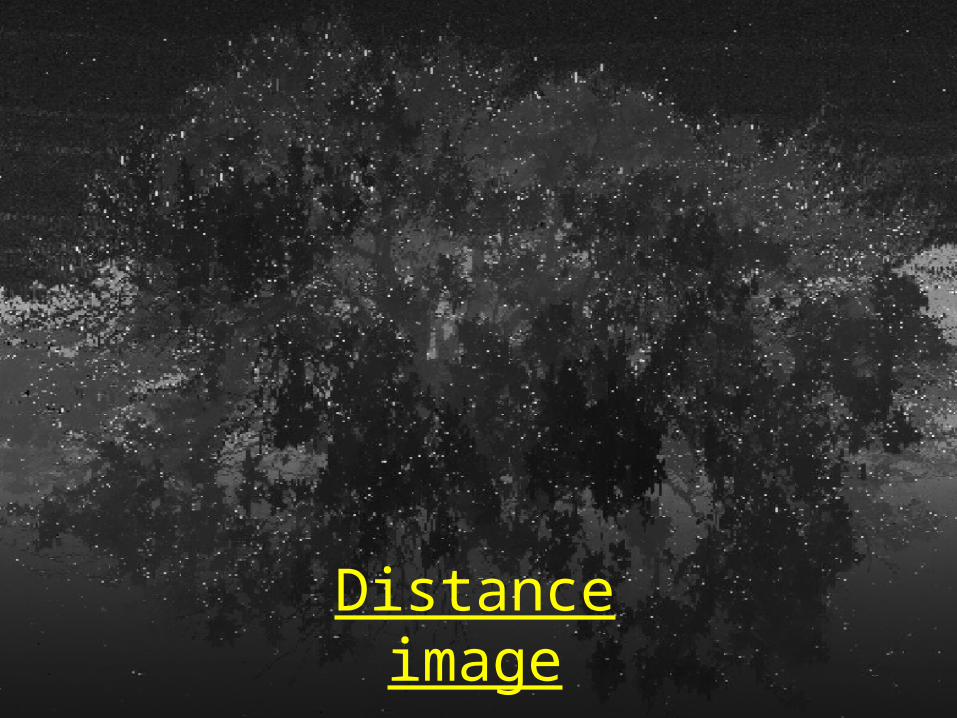
Distance image

Inverted distance image

Smoothing of canopy boundary
Figure 2: Scanning illustration and canopy boundary smoothing
Ground
Lij
Lij+1 LLij+1
LLij
Ө
Sensor
Smoothed canopy
Original canopy
Hs
β
D
Deep gap
Shallow gap
Through hole

Peak-link algorithm
0
50
100
150
200
250
0 50 100 150 200
Distance from tree row plane to canopy, cm
Ve
rtic
al
co
ord
ina
te f
rom
to
p o
f im
ag
e,
pix
el
3rd peak-link
Laser incident point
1st peak-link
Tree row plane
2nd peak-link
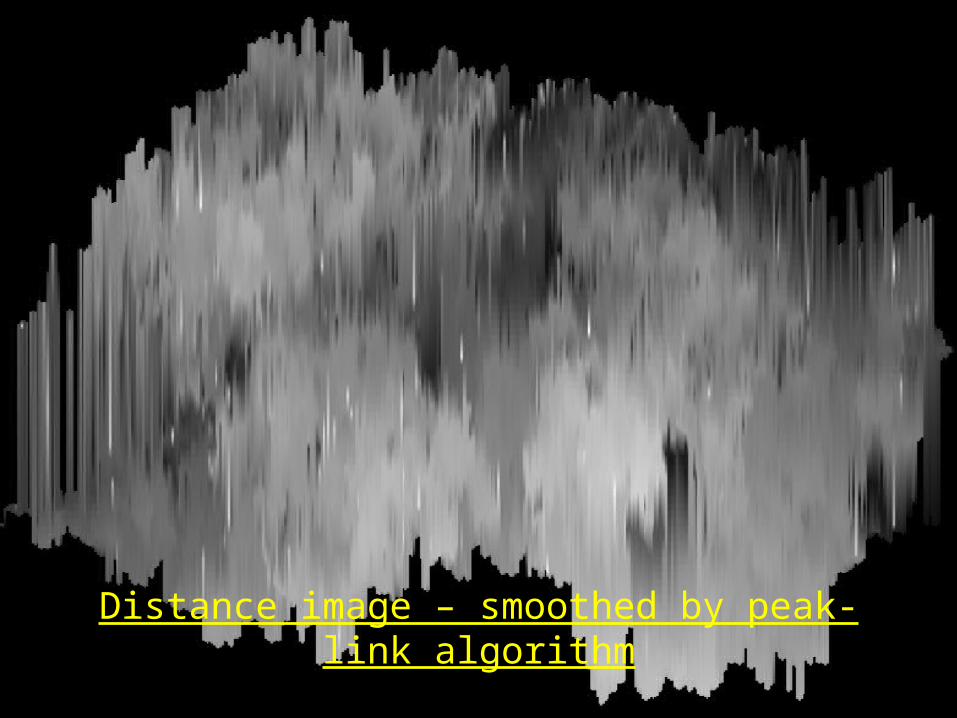
Distance image – smoothed by peak-link algorithm

D1a
D2a
Ha
Hb
Hd
Hc
Ground
Level
D2c
D1c
D1b
D2b
Tree
Canopy
Manual Volume Measurement

0
10
20
30
40
50
60
70
80
90
100
D1 L1 L2 L3 M1 M2 M3 H1 H2 H3
Tree
Vo
lum
e, m
3
ManualLaser
Manual- and laser-measured volumes
Std. dev.
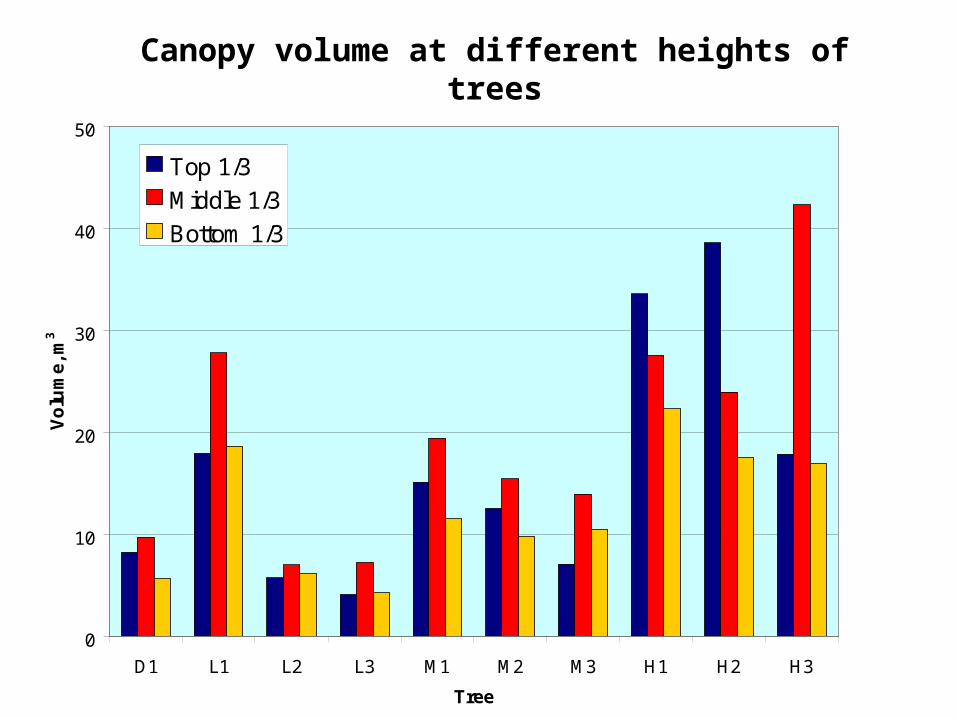
Canopy volume at different heights of trees
0
10
20
30
40
50
D1 L1 L2 L3 M1 M2 M3 H1 H2 H3
Tree
Vo
lum
e, m
3
Top 1/3
Middle 1/3
Bottom 1/3
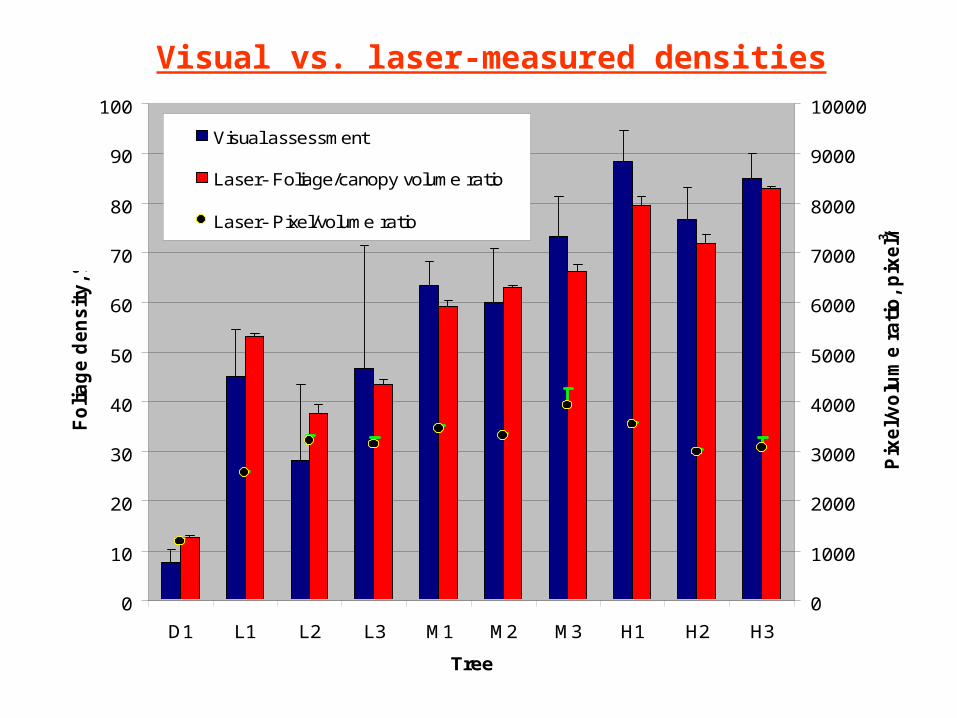
Visual vs. laser-measured densities
0
10
20
30
40
50
60
70
80
90
100
D1 L1 L2 L3 M1 M2 M3 H1 H2 H3
Tree
Fo
lia
ge
de
ns
ity
, %
0
1000
2000
3000
4000
5000
6000
7000
8000
9000
10000
Pix
el/
vo
lum
e r
ati
o,
pix
el/
m3
Visual assessment
Laser- Foliage/canopy volume ratio
Laser- Pixel/volume ratio

yB = 1484.3x - 11237
RB2 = 0.74
yA = 0.808x + 10.582
RA2 = 0.96
0
10
20
30
40
50
60
70
80
90
100
0 10 20 30 40 50 60 70 80 90 100
Visual density assessment, %
La
ser
me
asu
rem
en
t, %
0
1000
2000
3000
4000
5000
6000
7000
8000
9000
10000
Pix
el-
volu
me
ra
tio,
pix
el/m
3
Corr. bet. Visual and laser-measured densities
0
10
20
30
40
50
60
70
80
90
D1 L1 L2 L3 M1 M2 M3 H1 H2 H3
Tree
Fol
iag
e D
ensi
ty, %
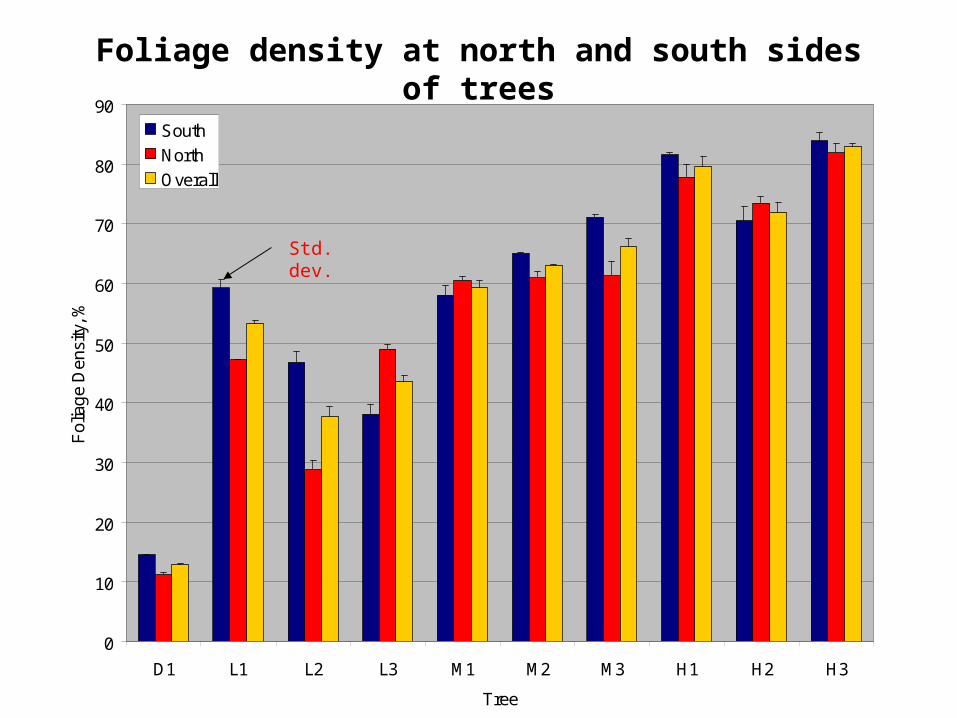
South
North
Overall
Foliage density at north and south sides of trees
Std. dev.

Foliage density at different tree heights
0
10
20
30
40
50
60
70
80
90
100
D1 L1 L2 L3 M1 M2 M3 H1 H2 H3
Tree
Fo
liag
e d
ensi
ty, %
Top 1/3Middle 1/3Bottom 1/3

User Interface

Amplitude image of one row
Processed canopy image of the row

Real-time measurements of one row

Real-time run, 1 mph

Real-time run, 3 mph

Thankyou