treating coalbed natural gas produced water for … library/research/oil-gas...treating coalbed...
TRANSCRIPT

Treating Coalbed Natural Gas Produced Water for Beneficial Use by
MFI Zeolite Membranes
Final Report
Submitted by
New Mexico Petroleum Recovery Research Center New Mexico Institute of Mining and Technology
Socorro, New Mexico 87801
Robert R. Lee Liangxiong Li
Prepared for
U.S. Department of Energy National Energy Technology Laboratory
(Project Number: DE-FC26-04NT15548)
Report Submittal Date: April 10 2008

ii
DISCLAIMER This report was prepared as an account of work sponsored by an agency of the United States Government. Neither the United States Government nor any agency thereof, or any of their employees, makes any warranty, expressed or implied, or assumes any legal liability or responsibility for the accuracy, completeness, or usefulness of any information, apparatus, product, or process disclosed, or represents that its use will not infringe on privately owned rights. Reference herein to any specific commercial product, process, or service by trade name, trademark, manufacturer, or otherwise does not necessarily constitute or imply its endorsement, recommendation, or favoring by the United States Government or any agency thereof. The views and opinions of the authors expressed herein do not necessarily state or reflect those of the United States Government.

iii
Acknowledgement
This research was sponsored by the U.S. Department of Energy through the
National Energy Technology Laboratory (grant # DE-FC26-04NT15548).
The contributions of the project team members and graduate students are greatly
appreciated. They are Dr. Ning Liu, Dr. Brian Mcpherson, Ms. Liz Bustmante, Mr. Jun
Lu, and Ms. Xinhua Li. Dr. Junhang Dong, Associate professor of Chemical and
Materials Engineering (CME) Department at the University of Cincinnati, also contribute
to the success of this project.

iv
PUBLIC ABSTRACT
Desalination of brines produced from oil and gas fields is an attractive option for
providing potable water in arid regions. Recent field-testing of subsurface sequestration
of carbon dioxide for climate management purposes provides new motivation for
optimizing efficacy of oilfield brine desalination: as subsurface reservoirs become used
for storing CO2, the displaced brines must be managed somehow. However, oilfield brine
desalination is not economical at this time because of high costs of synthesizing
membranes and the need for sophisticated pretreatments to reduce initial high TDS and to
prevent serious fouling of membranes. In addition to these barriers, oil/gas field brines
typically contain high concentrations of multivalent counter cations (eg. Ca2+ and SO42-)
that can reduce efficacy of reverse osmosis (RO). Development of inorganic membranes
with typical characteristics of high strength and stability provide a valuable option to
clean produced water for beneficial uses.
Zeolite membranes have a well-defined subnanometer pore structure and extreme
chemical and mechanical stability, thus showing promising applicability in produced
water purification. For example, the MFI-type zeolite membranes with uniform pore size of
~0.56 nm can separate ions from aqueous solution through a mechanism of size exclusion
and electrostatic repulsion (Donnan exclusion). Such a combination allows zeolite
membranes to be unique in separation of both organics and electrolytes from aqueous
solutions by a reverse osmosis process, which is of great interest for difficult separations,
such as oil-containing produced water purification.
v
The objectives of the project “Treating Coalbed Natural Gas Produced Water for
Beneficial Use by MFI Zeolite Membranes” are: (1) to conduct extensive fundamental
investigations and understand the mechanism of the RO process on zeolite membranes and
factors determining the membrane performance, (2) to improve the membranes and optimize
operating conditions to enhance water flux and ion rejection, and (3) to perform long-term
RO operation on tubular membranes to study membrane stability and to collect experimental
data necessary for reliable evaluations of technical and economic feasibilities.
Our completed research has resulted in deep understanding of the ion and organic
separation mechanism by zeolite membranes. A two-step hydrothermal crystallization
process resulted in a highly efficient membrane with good reproducibility. The zeolite
membranes synthesized therein has an overall surface area of ~0.3 m2 . Multichannel
vessels were designed and machined for holding the tubular zeolite membrane for water
purification. A zeolite membrane RO demonstration with zeolite membranes fabricated
on commercial alpha-alumina support was established in the laboratory. Good test results
were obtained for both actual produced water samples and simulated samples. An overall
96.9% ion rejection and 2.23 kg/m2.h water flux was achieved in the demonstration. In
addition, a post-synthesis modification method using Al3+-oligomers was developed for
repairing the undesirable nano-scale intercrystalline pores. Considerable enhancement in ion
rejection was achieved. This new method of zeolite membrane modification is
particularly useful for enhancing the efficiency of ion separation from aqueous solutions
because the modification does not need high temperature operation and may be carried
out online during the RO operation. A long-term separation test for actual CBM produced
water has indicated that the zeolite membranes show excellent ion separation and
extraordinary stability at high pressure and produced water environment.

vi
Table of Contents
EXECUTIVE SUMMARY .............................................................................................. 1 Introduction ..................................................................................................................... 1 Project objectives ............................................................................................................ 1 Project achievements ...................................................................................................... 2 Conclusions and recommendations ................................................................................. 6 Technology Transfer efforts ........................................................................................... 7
1. INTRODUCTION......................................................................................................... 8 1.1. Broader Context of Produced Water Purification .................................................... 8 1.2. Zeolite Membranes for Ion Separation .................................................................... 8 1.3. Statement of Work ................................................................................................. 10 1.4. Layout of the Report .............................................................................................. 10
2. SYNTHESIS OF PURE SILICALITE ZEOLITE MEMBRANES ....................... 13 2.1 Porous Alpha-alumina support ............................................................................... 13 2.2 Equipment and membrane characterization ............................................................ 15 2.3. Membrane synthesis by in-situ crystallization ....................................................... 16 2.4. Membrane synthesis by seeding and second growth ............................................. 19
3. SYNTHESIS OF HIGH-ALUMINUM ZEOLITE MEMBRANES FOR ENHANCED WATER PERMEATION ....................................................................... 22
3.1 Process of ZSM-5 membrane fabrication ............................................................... 23 3.2 Surface chemistry and ion separation ..................................................................... 32 3.3. Presence of aluminum ions on membrane performance ........................................ 36
4. ZEOLITE INTRA/INTERCRYSTALLINE PORES AND THEIR INFLUENCE ON ION SEPARATION ................................................................................................. 40
4.1 Isotherm and pore filling of micro- and mesoporous materials .............................. 41 4.2. Adsorption isotherm of zeolite with different crystal size ..................................... 46 4.3. Pore size distribution of zeolite films on glass surface .......................................... 46 4.4. Pore size distribution of polycrystalline zeolite membranes on porous support ... 49
5. ELIMINATION OF ZEOLITE INTERCRYSTALLINE PORES BY POST-SYNTHESIS AL3+ OLIGOMER DEPOSITION ......................................................... 51
5.1. Tests of the modified membranes .......................................................................... 52 5.2. Long-term stability of modified membranes ......................................................... 56
6. ION SEPARATION PERFORMANCE OF ZEOLITE MEMBRANES .............. 57 6.1 Influence of operation condition and solution chemistry on ion separation performance .................................................................................................................. 61 6.2 Mechanism of ion separation through zeolite membranes ..................................... 70
7. EXPERIMENTAL STUY OF ION AND WATER FLUXES THROUGH ZEOLITE MEMBRANES ............................................................................................. 75
7.1. Operating pressure and feed concentration ............................................................ 79 7.2. Influence of counter ions ....................................................................................... 83
8. COMPETITIVE DIFFUSION OF ION/WATER THROUGH ZEOLITE MEMBRANES ................................................................................................................ 89
8.1. RO permeation tests of alkali metal ions ............................................................... 89 8.2. RO models for dilute ionic solutions ..................................................................... 92 8.3. Activation energy ................................................................................................... 99

vii
8.4. Diffusivities of ion and water in zeolite membranes ........................................... 101 8.5. Influence of dissolved organics on RO performance of zeolite membranes ....... 104
9. UPSCALE OF MEMBRANE SYNTHESIS AND INDUSTRY APPLICATION......................................................................................................................................... 109
9.1. Tubular zeolite membranes .................................................................................. 109 9.2. Scale-up of zeolite membranes and desalination demonstration ......................... 113 9.3. Membrane modules .............................................................................................. 115 9.4. Reverse osmosis desalination unit ....................................................................... 118
10. LONG-TERM DESALINATION OF PRODUCED WATER BY ZEOLITE MEMBRANES .............................................................................................................. 120
10.1. Chemistry of produced water ............................................................................. 121 10.2. Long-term separation of produced water by zeolite membranes ....................... 122 10.3. Mechanism of membrane fouling at loading of produced water ....................... 125 10.4. Membrane regeneration by H2O2 solution ......................................................... 128
11. ENGINEERING ASPECT AND ECONOMICS ................................................. 132 12. CONCLUSION AND RECOMMENDATIONS .................................................. 141

viii
List of Figures
Fig. 1. Picture of tubular zeolite membranes synthesized by two-step hydrothermal crystallization. ........................................................................................................... 3
Fig. 2. Ion separation performance of zeolite membranes synthesized by two-step hydrothermal treatment. .......................................................................................... 3
Fig. 3. Reverse osmosis zeolite membrane demonstration ............................................ 5
Fig. 4. Alpha-alumina substrate for zeolite membrane fabrication with different dimension. ................................................................................................................ 14
Fig. 5. Schematic diagram of membrane synthesis. ..................................................... 15
Fig. 6. SEM images of zeolite membrane synthesized by single in-situ crystallization. ................................................................................................................................... 17
Fig. 7. SEM images of zeolite membrane synthesized by double in-situ crystallization. ......................................................................................................... 17
Fig. 8. XRD patterns of MFI zeolite membranes synthesized by single and double in-situ crystallization. .................................................................................................. 18
Fig. 9. SEM images of zeolite seeding layer on α-alumina substrate. ........................ 20
Fig. 10. Surface SEM image of zeolite film synthesized by second growth. ............. 21
Fig. 11. SEM image of cross-section of zeolite film synthesized by second growth. . 21
Fig. 12. Effect of synthesis time on membrane morphology. ...................................... 26
Fig. 13. The XRD pattern of a zeolite film synthesized by seeding and secondary growth. ..................................................................................................................... 27
Fig. 14. SEM images of ZSM-5 membranes synthesized from solutions with different alkalinities. ............................................................................................................... 28
Fig. 15. Effect of Si/Al ratio on zeolite membrane morphology. ................................. 30
Fig. 16. SEM images of cross-section of seeded substrates before and after the second growth (Si/Al=65). ...................................................................................... 32
Fig. 17. Contact angle measurement of zeolite film on porous support: (a) silicalite, (b) Si/Al=65, (c) Si/Al=50. ....................................................................................... 35
Fig. 18. Zeta potential of zeolite particles with different Si/Al ratios at 0.01 M NaCl solution. .................................................................................................................... 36
Fig. 19. Water flux of zeolite membranes as a function of operating pressure. ........ 37
Fig. 20. Ion rejection as a function of operating pressure for zeolite membranes with different Si/Al ratios. .............................................................................................. 38
Fig. 21. Enhanced ion flux by water transport in zeolite membranes. ...................... 39

ix
Fig. 22. N2 adsorption isotherm at 77K ((a) γ-alumina, (b) SBA-15, (c) MFI-type zeolite, and (d) Fau-type zeolite). Solid circles denote adsorption and open circle denote desorption branch. ........................................................................... 42
Fig. 23. BJH pore size distribution derived from N2 physisorption isotherm. ......... 45
Fig. 24. Physisorption isotherm of N2 at 77K for MFI zeolite with different particle size. ........................................................................................................................... 46
Fig. 25. SEM images of zeolite film on glass slides with different orientation. ......... 47
Fig. 26. Pore size distribution (HK) of zeolite film on glass slides. Insets are t-plots with solid circle denoting the second inflection. ................................................... 48
Fig. 27. N2 adsorption isotherm at 77K. ....................................................................... 50
Fig. 28. Pore size distribution of substrate and zeolite membrane. ............................ 50
Fig. 29. Schematic diagram of the apparatus for membrane modification. .............. 52
Fig. 30. Ion rejection as functions of feed concentration and double layer thickness (insert: ion flux as a function of the feed concentration). .................................... 55
Fig. 31. Water flux variation at the prolonged RO permeation time. ........................ 57
Fig. 32. Schematic diagram of the RO system. ............................................................. 59
Fig. 33. Effect of cation valance on water and ion fluxes. ........................................... 62
Fig. 34. Effects of cation size on water and ion flux. .................................................... 63
Fig. 35. Influence of ion concentration on individual ion rejection ............................ 64
Fig. 36. Influence of ion concentration on overall ion rejection and water flux. ...... 65
Fig. 37. Influence of operation pressure on membrane performance ........................ 66
Fig. 38. Water flux variation as a function of transmembrane pressure. .................. 67
Fig. 39. Ion rejection changes as a function of transmembrane pressure. ................ 68
Fig. 40. Influence of feed water flow rate on the membrane separation performance. ................................................................................................................................... 69
Fig. 41. Influence of temperature on water flux and ion rejection of zeolite membrane. ............................................................................................................... 70
Fig. 42. Schematic illustration of water and ion transport through the MFI zeolite membranes. .............................................................................................................. 73
Fig. 43. Schematic diagram of separation cell for tubular membranes ..................... 76
Fig. 44. Effect of operating pressure on RO permeation of 0.01 M NaCl. ................. 77
Fig. 45. Influence of ion concentration on water flux and ion rejection (P=2.07 MPa). ................................................................................................................................... 78
Fig. 46. Permeate flux of 0.01 M NaCl and DI water as a function of net driving force. ......................................................................................................................... 80

x
Fig. 47. Water flux of NaCl solutions as function of driving force, varying with ion concentration. .......................................................................................................... 81
Fig. 48. Regression of ion flux versus the salt concentration gradient across a zeolite membrane. ............................................................................................................... 82
Fig. 49. Permeate flux of multicomponent solution as function of driving force. ..... 84
Fig. 50. Dependence of permeate water flux on counter-ions with different valences ................................................................................................................................... 85
Fig. 51. Dependence of Na+ rejection on counter-ions with different valences ......... 86
Fig. 52. Alkali ion rejection on the MFI-type zeolite membrane as a function of ion size at 50 °C. ............................................................................................................. 91
Fig. 53. Ion and water fluxes in 0.10 M alkali metal chloride solutions on the MFI membrane as functions of ion size at 50 °C. ......................................................... 92
Fig. 54. Schematic showing the three-step molecular transport through a zeolitic channel. .................................................................................................................... 94
Fig. 55. Arrhenius plots of the ion fluxes for 0.10 M LiCl and 0.10 M NaCl solutions. ................................................................................................................................. 100
Fig. 56. Arrhenius plots of ion diffusivities in the zeolite channel. ........................... 100
Fig. 57. Effective ion/water diffusivities of alkali metal ions inside MFI zeolite microchannel (T=50 °C). ...................................................................................... 103
Fig. 58. Cross-section of alpha-alumina tubular substrate (SEM image). ............... 109
Fig. 59. Schematic diagram of membrane synthesis. ................................................. 111
Fig. 60. Lab-constructed rotating equipment for tubular membrane synthesis. .... 111
Fig. 61. SEM images of zeolite membranes synthesized by two-step crystallization. ................................................................................................................................. 112
Fig. 62. Tubular zeolite membranes synthesized on commercial alpha-alumina substrate for produced water desalination. ........................................................ 113
Fig. 63. Summary of RO separation performance of zeolite membranes synthesized by two-step hydrothermal crystallization. .......................................................... 114
Fig. 64. Schematic diagram of RO demonstration. .................................................... 115
Fig. 65. Schematic diagram of multichannel membrane vessel. ............................... 116
Fig. 66. Side view of separation module with and without inserting zeolite membranes. ............................................................................................................ 117
Fig. 67. Top view of separation module with and without inserting zeolite membranes. ............................................................................................................ 117
Fig. 68. Desalination demonstration of zeolite RO membranes................................ 119
Fig. 69. Particle size distribution of suspensions in produced water. ...................... 121

xi
Fig. 70. Water flux variation as a function of elapsed RO permeation time. .......... 123
Fig. 71. Ion rejection (Na+) as a function of elapsed RO permeation time. ............. 124
Fig. 72. Ion rejection (Cl-) as a function of elapsed RO permeation time. .............. 124
Fig. 73. Influence of organic species in produced water on membrane performance. ................................................................................................................................. 125
Fig. 74. Cross-section of fouled zeolite membrane after produced water desalination. ........................................................................................................... 126
Fig. 75. Surface SEM image of zeolite membrane with foulant and EDS result for chemical composition. ........................................................................................... 127
Fig. 76. SEM images (cross-section) of zeolite membrane before and after acid cleaning with 0.1M HCl solution. ........................................................................ 127
Fig. 77. SEM surface images of zeolite membrane before and after acid cleaning with 0.1M HCl solution. ........................................................................................ 128
Fig. 78. Oxidative regeneration of zeolite membranes after organic fouling. ......... 129
Fig. 79. Low resolution survey spectra of zeolite before and after H2O2 oxidative treatment. ............................................................................................................... 130
Fig. 80. High resolution C 1s spectra for zeolite membrane before and after oxidative H2O2 oxidation. .................................................................................... 131
Fig. 81. Inorganic substrates tested for zeolite membrane fabrication. ................... 131
Fig. 82. Membrane synthesis process by two-step crystallization ........................... .131
Fig. 83. Elements used for cost analysis of RO desalination. .................................... 131 .

xii
List of Tables
Table 1. RO permeation of 0.10 M NaCl solution on MFI zeolite membranes with
different Si/Al ratios (P=2.76 Mpa) ....................................................................... 33
Table 2. Pore size distribution determined by different model .................................. 43
Table 3. Results of reverse osmosis for NaCl solutions with different concentrations.
................................................................................................................................... 53
Table 4. Effect of membrane modification on the RO performance .......................... 57
Table 5. Coordination numbers, experimental ADHN, and sizes of the ions involved
in this study .............................................................................................................. 72
Table 6. Reverse osmosis results of multicomponent solutions .................................. 79
Table 7. Water and ion fluxes and ion rejection by reverse osmosis on the MFI
zeolite membrane at applied trans-membrane pressure of 2.75 MPa ............... 90
Table 8 Effective diffusivities of alkali metal ions and water in the zeolite pores at 50
°C ............................................................................................................................ 102
Table 9. Influence of organics on the separation performance of zeolite membranes
................................................................................................................................. 105
Table 10. Parameters of water permeation in an organic-ion-water system ........... 108
Table 11. Ion removal from produced water by zeolite membranes ....................... 108
Table 12. Overall cost of a RO unit with capacity of 1,000 m3/d .............................. 108
Table 13. Membrane cost and replacement rate ............................................... 108
Table 14. Influence of membrane material and replacement on the unit water cost
................................................................................................................................. 108
1
EXECUTIVE SUMMARY
Introduction
Desalinated brine from oilfields or coalbed methane gasfield is a potential water
resource for beneficial use. Produced water typically contains a high concentration of
dissolved salts and organic compounds, requiring the desalination technology to be
tolerant of strong solvents and high concentrations of salts. To reclaim produced water
for beneficial use, dissolved components in produced water, both organics and inorganic
salt, must be removed in a cost-effective way. Current technologies, such as polymeric
reverse osmosis (RO) membranes, multiple-effect evaporation, and ion exchange, purify
produced water with difficulty due to serious fouling, material instability and insufficient
efficiency. The project “Treating Coalbed Natural Gas Produced Water for Beneficial
Use by MFI Zeolite Membranes” was proposed to develop and demonstrate zeolite
membranes for produced water treatment, targeting the removal of both salt and
dissolved organics simultaneously.
Project objectives
This project aimed to develop a new technology of reverse osmosis through
molecular sieve zeolite membranes for purifying high-TDS CBM produced water. The
project included three phases with the following objectives for each phase:
Phase I. The fundamental studies in Phase I include mass-transport behaviors of water,
ions, and dissolved organics passed through the zeolite membranes of varied Si/Al ratios;
and effects of operation temperature, pressure, feed velocity, feed chemical composition,
and pH on RO performance.

2
Phase II. Research focuses on optimizing RO operating conditions and developing a
cost-effective method to repair the undesirable nanoscale intercrystalline pores.
Phase III. A RO unit with a 0.1-m² tubular membrane module will be established to carry
out long-term operations testing for technical and economic evaluations.
Project achievements
Researchers focused on membrane fabrication, ion/water transport in confined
zeolite pores, and module design. Considerable success has been achieved through the
proposed processes, including (1) experimental demonstration of ion separation by
zeolite membranes, (2) development of a two-step process for zeolite fabrication with
high flux and good reproducibility, (3) establishment of a mathematical model for
describing the ion/water competitive diffusion through zeolite membranes, (4)
development of a post-synthesis modification method for “healing” of zeolite
intercrystalline pores, and (5) construction of a RO demonstration with membrane area of
0.3 m2.
In phase I, ion separation by zeolite membranes has been sucessfuly demonstrated
and a two-step process for fabrication of high-flux zeolite membranes has been
established. Pure silica zeolite membranes have been synthesized on both lab-made disc
substrate and commercial tubular substrate. The pure silicalite zeolite membranes
synthesized by in-situ hydrothermal crystallization process show good ion separation
efficiency but low water flux. To enhance water throughput, hydrophilic zeolite
membranes with high aluminum content in zeolite framework have been synthesized on
tubular alpha-alumina substrate by a two-step process. Zeolite membranes show high ion
removal efficiency at a mechanism of size exclusion and electrostatic repulsion. Zeolite

3
membranes synthesized with the newly developed two-step crystallization show
considerable enhancement in RO separation with a water flux increase averaged from
0.165 to 2.23 kg/m2.h and ion rejection improvement from 66.5% to 96.9%. Also, over
91% of zeolite membranes synthesized with this process show high ion rejection
efficiency, indicating good reproducibility and the potential for large-scale application of
this technology. Figure 1 shows the tubular zeolite membranes synthesized with the two-
step hydrothermal crystallization. Each zeolite membrane was tested for ion rejection and
water flux, which is indicated in Fig. 2.
0
20
40
60
80
100
120
0 1 2 3 4 5 6 7 8 9 10 11
Water flux, kg/m2.h
Ion
reje
ctio
n, %
Fig. 1. Picture of tubular zeolite membranes synthesized by two-step hydrothermal crystallization.
Fig. 2. Ion separation performance of zeolite membranes synthesized by two-step hydrothermal treatment.
Influences of ion species, ion valence, transmembrane pressure and water
sweeping flow rate on the zeolite membrane RO performance have been investigated.
Experimental results suggest that size exclusion of large hydrated ions is the major
mechanism of ion separation by zeolite membranes. Also, electrostatic repulsion plays
critical role in ion separation from intercrystalline pores.

4
In Phase II, a post-synthesis modification for enhanced ion separation has been
established. An efficient process for membrane modification was developed by
depositing metal oligomers into the zeolite intercrystalline pore region. To selectively
deposite metal oligomers into zeolite intercrystalline pores, on-line filtration and counter
diffusion were applied to modify the pore structure of zeolite membrane or “heal” the
non-selective intercrystalline pores. Al3+-oligomers were screened out from other metal
ions because of their appropriate size and oligomer growth rate. At the same operating
pressure, water flux declined while the ion rejection rate increased significantly after
modification. The membrane modified by metal oligomer deposition was tested with
actual produced water (TDS=1.2×10⁴ ppm) for long-term stability evaluation. Ion
rejection remained nearly constant while water flux declined slightly with elapsed time
for more than 500 hr, indicating the strong attachment of metal oligomers in zeolite
pores, with no need for reinforcement.
A mathematical model for describing ion/water permeation through zeolite thin
film has been developed. Activated diffusion at zeolite pore entrance governs the ion
diffusion through zeolite membranes. Raising temperature has a greater influence on the
ion permeation than on the water permeation, resulting in a decline of the ion rejection.
On the contrary, increasing the transmembrane pressure can enhance both the water flux
and ion rejection rates because the ion flux is much less affected by pressure compared to
the water flux. These findings suggest that for RO on zeolite membranes, operating at
elevated temperatures and high hydraulic pressures is desirable for enhancing the
separation efficiency.

5
In Phase III, a zeolite membrane demonstration with membrane surface area of 0.3
m2 has been constructed and long-term permeation of produced water has been
performed. About 73 zeolite membranes (total surface area of ~0.3m2) with good ion
separation efficiency and high water flux have been synthesized. Each membrane was
tested for RO separation on 0.1 M NaCl solution for membrane quality evaluation. A
multichannel nylon vessel was designed and machined for the cross-flow RO permeation
of tubular zeolite membranes. A reverse osmosis demonstration with total membrane
surface area of ~0.3 m2 was constructed in a trailer with the lab-designed multichannel
vessels. The zeolite RO demonstration gave an overall 96.9% ion rejection and 2.23
kg/m2.h water flux for 0.1M NaCl solution. Figure 3 shows a picture of the zeolite RO
demonstration established in our laboratory and cross-flow vessels for tubular zeolite
membranes.
Fig. 3. Reverse osmosis zeolite membrane demonstration.
Long-term desalination of CBM produced water indicated that both water flux
and ion rejection declined with elapsed permeation time. The fouling mechanism was

6
revealed to be scale deposition and organic sorption on zeolite membrane surfaces.
Periodic chemical cleaning is suggested to maintain a sustainable separation performance
of zeolite membranes.
Conclusions and recommendations
Ion separation by zeolite membranes was first demonstrated by experimental
process. Ion separation by zeolite membranes is controlled by size exclusion through
intracrystalline zeolitic pores and electrostatic repulsion through intercrystalline pores.
The size exclusion through zeolitic pores dominates ion and organic separation
mechanism and thus ion separation efficiency is less affected by ionic strength and pH.
Operating the zeolite membranes, which possess excellent thermal and mechanical
stabilities, at elevated temperatures and high hydraulic pressures is desirable for
enhancing the separation efficiency.
Zeolite membranes modified by ion doping show enhanced ion separation
efficiency and water throughput. The improvement in water flux and ion separation
efficiency is attributed to the strong surface hydrophilicty and surface charge. Long-term
permeation indicated that both water flux and ion rejection decline gradually with elapsed
operating time. Scale deposition and organic sorption on membrane surface are the main
reason for the decline of water permeation. Periodic chemical cleaning is suggested to
maintain a stable membrane performance.
Even with the excellent thermal, mechanical stabilities and comparable water flux
to polymeric membranes, zeolite membranes are not competitive in seawater desalination
due to the expensive substrates. At the very specific condition where polymeric

7
membranes fail, i.e., a produced water environment, zeolite membranes are more likely
be used and will be competitive, with the assumption of 5-year membrane lifetime.
Technology Transfer Efforts
The research of this project has resulted in one pending patent, eight peer-
reviewed journal papers, and six conference proceedings. The research findings have also
been presented in multiple international conference, including 2007 SPE International
Symposium on Oilfield Chemistry, Farmington Carbon Sequestration Southwest
Partnership Workshop (Aug. 20, 2006, Farmington), 2004 SPE Annual Meeting at
Houston, and the 3th International Zeolite Membrane meeting.
8
1. INTRODUCTION
1.1. Broader Context of Produced Water Purification
Desalination of brines produced from oil and gas fields is an attractive option for
providing potable water in arid regions. At present, more than seven barrels of produced
brine are generated for each barrel of oil in the United States; coalbed methane (CBM)
produced water is increasing rapidly as CBM production increases [1]. Dissolved salts
and organics are the main components that need to be removed in CBM produced water
for direct disposal or beneficial use. In addition, recent field-testing of subsurface
sequestration of carbon dioxide for climate management purposes provides new
motivation for optimizing efficacy of oilfield brine desalination: if subsurface reservoirs
are utilized for storing CO2, the displaced brines must be managed somehow.
The successful handling and utilization of produced water relies on the effective
removal of dissolved salts and organics from the water. However, oilfield brine
purification is not economical at this time because of the high costs of synthesizing
membranes, the need for sophisticated pretreatments to reduce initial high TDS and the
lack of prevention for serious fouling of the membranes [2−4]. Novel technology must be
developed for all these purposes.
1.2. Zeolite Membranes for Ion Separation
Zeolites are crystalline aluminosilicate materials with well-defined pore
structures. Ions could be separated from aqueous solution by zeolite membranes,
particularly those with a small pore size, such as A-type and MFI-type zeolites (silicalite
or ZSM-5), at a mechanism of size exclusion and electric restriction [5−6]. Their solvent
resistance and molecular sieving mechanism allow zeolite membranes to be unique in
9
separations of both organics and electrolytes from aqueous solutions by reverse osmosis
[5], which is of great interest for difficult separations, such as produced water
purification.
In aqueous solutions, electrolyte ions exist tightly bound with water due to polar-
polar interactions [7]. The diffusivity of ions in an aqueous solution is governed by the
crystallographic ion size [8, 9] and the interactions between ions and surrounding water
molecules [10]. The mobility and transport behavior of water and hydrated ions in
microchannels will be more complicated because of strong interactions between pore
surface and ion species [11, 12]. The ionic mobility of hydrated ions in cylindrical pores
of radius less than 1.1 nm was reported to be considerably lower than that in bulk
solution [13]. The factors governing the structure and diffusion of ion and water in
microchannel include surface charge [12], hydrophilicity [14], and pore wall roughness
[15]. However, data on ion permeation in zeolite membranes are very limited with regard
to furthering insight into the transport mechanism, especially when the hydrated ion size
is in the same range as that of the pore diameter [16].
Zeolite membranes synthesized on α-alumina substrate have a negatively charged
surface via several mechanisms including ion substitution in the zeolite framework
during membrane synthesis [17], dissociation of surface hydroxyl hydrogen [15], and/or
ionization of surface hydroxyl groups [18]. When in contact with liquid water or aqueous
solutions, an electrically charged double layer forms at the surface of the zeolite pore
walls and shows restriction on ion entering and permeation if the double layers are thick
enough to overlap at the pore opening. The thickness of the double layer decreases with
an increase in ion concentration or in the presence of the membrane’s high valence

10
counter ions (ions with opposite charge as the membrane surface) [19]. The electrostatic
exclusion governing ion transport will therefore be strongly dependent on the surface
charge of zeolite and the chemistry of the feed solution.
Basic understanding of ion and water transport in microporous zeolite channel is
essential to fabricate and modify the material for satisfying the separation requirements.
This research targets the ion/water transport in microporous zeolite membranes and
fabrication of zeolite membranes for produced water desalination.
1.3. Statement of Work
The proposed research includes experimental studies on the mechanism of the RO
process on zeolite membranes, membrane improvement, optimization of operation
conditions, and long-term membrane performance. The fundamental studies in Phase 1
included membrane fabrication, mass transport behaviors of water, ions and dissolved
organics through the zeolite membranes of varied Si/Al ratios and effects of operation
temperature, pressure, feed velocity, feed chemical composition and pH on the RO
performance. In Phase 2, research focused on optimizing the RO operating conditions and
developing a cost-effective method to repair the undesirable nano-scale intercrystal pores. In
Phase 3, a RO unit with a ∼0.3-m2 tubular membrane module has been established to carry
out long-term operation test for technical and economic evaluations and system design.
1.4. Layout of the Report
This research aims to develop a new technology of reverse osmosis through
molecular sieve zeolite membranes to efficiently treat organic-containing produced water.
We have focused on zeolite membrane fabrication, ion/water transport in confined zeolite
11
micropores, post-synthesis modification, and module design for desalination
demonstration.
In Chapters 2 and 3, we introduced the fabrication of zeolite membranes with
different Si/Al ratios. Pure silicalite membranes show high ion separation efficiency but
low water flux. High water-flux zeolite membranes were synthesized by incorporating
aluminum ions into zeolite framework.
In Chapter 4, pore structure of zeolite membranes was investigated by applying
HK and BJK model to N2 adsorption/desorption curve. Study revealed that nanoscale
intercrystalline pores (2.0−4.0nm) in zeolite membranes formed on porous support. A
smooth surface with random packing of zeolite crystals reduces the density and pore size
distribution of intercrystalline pores.
In Chapter 5, a post-synthesis modification method by using Al3+−oligomers for
zeolite intercrystalline remediation was developed and considerable enhancement in ion
separation was achieved.
In Chapter 6, operating conditions and feed water chemistry have been found to
play crucial roles in the ion separation performance of zeolite membranes. Both size
exclusion and electrostatic repulsion govern ion permeation through zeolite membranes.
However, size exclusion dominates the separation process.
In Chapters 7 and 8, ion and water permeation through zeolite membranes was
experimentally investigated. A mathematical model for describing ion/water permeation
through thin zeolite film has been developed.

12
In Chapter 9, a zeolite RO demonstration with membrane surface area of ∼0.3m2
has been established. Ways to upscale the fabrication of zeolite membrane for industry
implementation is discussed.
In Chapter 10, CBM produced water desalination by zeolite membranes was
tested for prolonged times. Membrane fouling and remediation during long-term
produced water desalination was investigated.
In Chapter 11, engineering aspects of application of zeolite membrane for
produced water purification are discussed. Economic evaluation suggests that the high
cost of membrane substrates is the primary obstacle for upscale application of this
technology to water desalination. However, zeolite membranes will be competitive in
specific applications where conventional polymeric membranes fail.

13
2. SYNTHESIS OF PURE SILICALITE ZEOLITE MEMBRANES
MFI-type zeolite membranes were synthesized through two techniques: (1) in-situ
crystallization, and (2) seeding and second growth method. In-situ crystallization is
carried out by immersing porous substrate into a synthesis solution containing organic
templates function as a structure directing agent, such as tetrapropylammonium
hydroxide (TPAOH). Membranes synthesized by in-situ crystallization need to be heat-
treated to remove the template (TPAOH) and open zeolite pores for mass transport. In the
second growth technique, a seeding layer of synthesized silicalite nano particles (average
dia. ~100 nm) was first coated onto the polished surface of substrates by conventional
dip-coating technique. After drying and firing at 450°C, a secondary growth step was
conducted in a solution without template. Zeolite membranes formed thereafter had an
open pore structure and did not need firing for template removal.
2.1 Porous alpha-alumina support
Alumina substrates with different geometry were deployed for membrane
fabrication in this study, including disc-shaped and tubular substrates. The tubular
substrates (pore dia. 0.2 μm) were purchased from Pall Inc. Tubular substrates with
length of 8.0 cm and 25 cm both have an ID of 7.4 mm and OD of 10 mm. Porous α–
alumina disks with thickness of 3.0 mm and diameter of 28 mm were fabricated in our
laboraty by pressing commercial α-alumina powders and sintering at 1150°C. The α-
alumina powders used for substrate preparation were provided by Alcoa (lot# 4422603,
mean particle size 0.44 μm). Figure 4 shows these α-alumina substrates for zeolite
membrane coating.

14
Fig. 4. Alpha-alumina substrate for zeolite membrane fabrication with different dimensions.
Tubular membrane synthesis was carried out in a stainless steel vessel lined with
Teflon. A lab-constructed rotation system was designed and constructed to rotate the
stainless steel autoclave for homogeneous nucleation. The tubular membranes were
wrapped outside with Teflon tape and rotated at a constant rate of 1.5 rad/min during
hydrothermal crystallization. Disc-shaped zeolite membranes were synthesized by in-situ
crystallization at static state. Figure 5 gives the diagram of the membranes synthesized at
static and rotation conditions.

15
Fig. 5. Schematic diagram of membrane synthesis reactor.
2.2 Equipment and membrane characterization
Fumed silica (99.8%, Aldrich), sodium hydroxide (99.99%, Aldrich), tetraethyl
orthosilicate (TEOS, 98%, ACROS Organics) and TPAOH (1.0 M, Aldrich) were used
for the membrane synthesis. Hydroxypropyl cellulose (HPC, Mw=100,000, Aldrich) was
used as a binder for dip-coating to avoid crack formation during sintering and 0.1 M
nitric acid (0.998 M, Aldrich) was used to adjust the pH value of the coating suspensions.
Other chemicals used in this study include sodium chloride (analytical reagent, Riedel-
deHaen), potassium chloride (analytical reagent, J. T. Baker), calcium chloride (biotech
grade, FisherBiotech), aluminum chloride (>99.0%, ACROS), sodium bromide (>99.0%,
ACROS), and sodium sulfate Na2SO42- (>99.0%, Alfa Aesar®).
The membrane was examined by X-ray diffraction (XRD, Siemens D-500) with
Cu kα radiation. The membrane thickness and surface morphology were studied with a
scanning electron microscope (SEM, JEOL 5800LV). All the SEM samples were coated
with gold before analysis. Zeolite morphology and membrane thickness were investigated
by scanning electron microscope (SEM, JEOL 5800LV). Chemical composition of the
Rotation Motor
Oven Oven
Synthesis solution
Membrane
Synthesis solution
Membrane
O-ring
(b) Rotating synthesis system (b) Static synthesis cell

16
zeolite membranes was verified by microscope (Cameca SX-100 with SPARC-5
workstation).
2.3. Membrane synthesis by in-situ crystallization
The disc-shaped substrate for membrane growth was first polished with 320-mesh
silicon carbide paper and then with 600-mesh. The tubular porous substrate was used as
received.
The in-situ crystallization of MFI-type zeolite membranes by hydrothermal
synthesis was conducted at 180°C and autogenous pressure in an autoclave. The synthesis
solution was prepared by dissolution of 5.0 g fumed SiO2 and 0.35 g NaOH into 25 mL
TPAOH (1.0 M) solution at 80°C. The substrate was immersed in the solution in a 30 mL
Teflon-lined autoclave. The autoclave was closed with O-ring sealing and put in a
preheated oven at 180°C for 4 hr for crystallization. After hydrothermal treatment, the
membranes were recovered and washed with DI water and immersed in a large quantity
of DI water for 24 hr to remove ions trapped in the membrane and substrate. The
membrane was then dried at 50°C overnight. The silicalite membranes were calcined at
450°C in air for 8 hr to remove the template (TPA+). The calcination used a heating rate
of 0.5°C/min and a cooling rate of 1.0°C/min. The same synthesis procedure was
repeated once to minimize the intercrystalline gaps. Figures 6 and 7 give the SEM images
of zeolite membrane synthesized on disc-shaped substrate once and twice, respectively.
The membrane thickness increased from ~1.5 μm to ~3 μm after the second synthesis
process. The zeolite crystal sizes increased from ~0.3 μm to ~1.0 μm, indicating the
crystal growth during the second crystallization process.

17
(a) Surface (b) Cross-section
Fig. 6. SEM images of zeolite membrane synthesized by single in-situ crystallization.
Fig. 7. SEM images of zeolite membrane synthesized by double in-situ crystallization.
The X-ray diffraction patterns of the zeolite membranes obtained by single and
double in-situ crystallization are shown in Fig. 8 together with the patterns of the alumina
substrate and standard MFI silicalite powders. The XRD patterns verified that the
membranes had a crystal structure of pure MFI-type zeolite. The increase in relative

18
intensity of the zeolite XRD peaks after the second hydrothermal synthesis also indicated
the growth of zeolite film thickness.
Fig. 8. XRD patterns of MFI zeolite membranes synthesized by single and double in-
situ crystallization.
The synthesis of tubular membranes was performed in a Teflon-lined autoclave,
which was constructed in our laboratory for a constant rotation. The synthesis solution
and crystallization condition is the same as that of the disc-shaped membranes except that
the synthesis time was extended to 20 hr. After membrane synthesis, the zeolite
membranes were rinsed and dipped into a large quantity of deionized (DI) water for
cleaning. After drying at 45°C for two days, the membrane was fired at 450°C for 8 hr to
remove the organic template. The synthesis was also repeated once to eliminate zeolite
intercrystalline pores. The zeolite membrane synthesized therein had a thickness of ∼2

19
μm as measured by scanning electron microscopy (SEM), slightly thinner than that
formed in static condition.
2.4. Membrane synthesis by seeding and second growth
Fabrication of zeolite membranes by second growth was also investigated in this
research; a zeolite thin film was first formed by coating silicalite nanocrystalls on porous
support and then a second growth was carried out to form a defect-free zeolite film for
separation. The nanosized silicalite crystals with diameter of ∼100 nm were synthesized
from a solution identical to the sol used for the in-situ crystallization. The crystallization
was carried out at 120°C for 12 hr. The seeding crystals were purified by repeated
centrifuge until the conductivity of supernant was below 10 μs/cm. Dip-coating was
applied to form a thin seeding layer on porous α-alumina substrates. In the dip-coating
process, zeolite suspensions were mixed with HPC binder in a controlled weight ratio.
Next, 0.1 M nitric acid was added dropwise to adjust the pH to desired value. The pH
value, zeolite composition and binder concentration were varied to optimize the coating
condition for uniform coating layer formation. A good seeding film was obtained by
coating with a suspension of 0.6% seeds and 0.05% HPC, at a pH of 3 to 4. After coating,
the seeded support was dried in an oven at 45°C in a controlled humidity (∼60%) for 48
hr. Then, the support was fired at 450°C for 8 hr to remove the organic template and
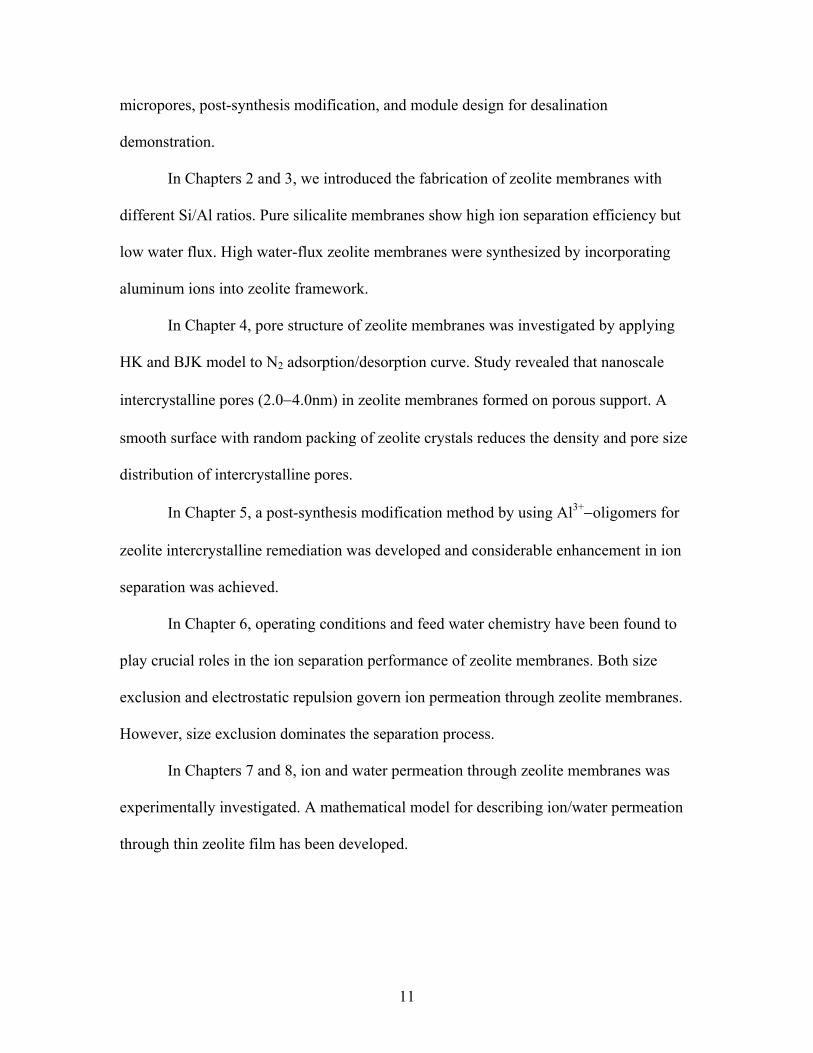
enhance the adhesion between the coated seed layer and the substrate. Figure 9 gives the
SEM image of a coated zeolite film.
20
Fig. 9. SEM images of zeolite seeding layer on α-alumina substrate.
A second growth synthesis solution with molar composition of 1.0 TPAOH: 4.5
SiO2: 550 H2O: 18 EtOH was prepared by dissolution of TEOS and TPAOH (1.0 M) into
DI water at 50°C for 12 hr. Following the preparation of the synthesis solution, the
seeded support was mounted in a Teflon holder with the coated side facing down and
immersed in the synthesis solution in Teflon-lined autoclave. The autoclave was closed
and put in a preheated oven at 180°C for 6 hr. In the hydrothermal condition, the seeded
zeolite crystals grow to form continuous layer on the support. After synthesis, the
membrane was rinsed with DI water and fired at 450 °C for 8 hr. Figures 10 and 11 give
the surface and cross-section of SEM images of the zeolite membrane synthesized by
second growth. The zeolite membrane synthesized with above procedure has a thickness
of ∼1.5 μm as revealed by SEM images.

21
Fig. 10. Surface SEM image of zeolite film synthesized by second growth.
Fig. 11. SEM image of Cross-section of zeolite membranes synthesized by second growth.
Zeolite film
Coated seeds

22
3. SYNTHESIS OF HIGH-ALUMINUM ZEOLITE MEMBRANES
FOR ENHANCED WATER PERMEATION
Pore network and surface chemistry are the principal properties by which a
membrane controls the permeability of different species and achieves separation. The
material chemistry (i.e. Si/Al ratio) plays an important role on the membrane charge and
surface wettability and thus water permeation because water transport in confined spaces,
such as micropores, whose pore sizes are in the range of intermolecular forces, is strongly
dependent on the surface wettability and pore wall roughness [15, 20]. The understanding
of the dynamics of ion and water entrance into zeolite pores and interaction between ion
and water in zeolite micropores will be crucial to tailor the membrane structure for
enhanced water flux and ion separation efficiency.
Water wettability on a zeolite surface is mainly determined by the aluminum
content of the zeolite framework and extraframework counterions [21]. Zeolite
membranes with high Si/Al ratios, such as pure silicalite-1 membranes, exhibit
hydrophobic separation behavior [22; 23]. As aluminum ions are incorporated into the
zeolite framework, more hydroxyl group forms on the membrane surface [24], resulting
in a higher tendency to adsorb water molecules [25]. Also, the substitution of Si4+ by Al3+
in the zeolite framework creates a large-density surface charge, which is usually balanced
by small cations (i.e. Na+ and Ca2+) [25]. The extra framework cations present in the
pores can coordinate with water molecules and enhance the water affinity on the zeolite
surface. The high surface charge created by ion substitution will form strong surface
potential when in contact with aqueous solution. A double layer will form and overlap in

23
the intercrystalline pore region, showing restriction on ion entering and permeation and
enhance the ion separation efficiency.
In the work described in this chapter, MFI-type zeolite membranes with large
variations in Si/Al ratio were synthesized on porous α-alumina supports by seeding and
secondary growth. The influence of chemical composition on the surface zeta potential
and water wettability as well as on RO separation was investigated. The water permeation
behavior in confined spaces (i.e. zeolite micropores) was further analyzed.
Considering the commonly encountered problem of poor reproducibility in zeolite
membrane synthesis [26,27], the variation in ion rejection of zeolite membranes
synthesized in this work is within a reasonable range.
3.1 Process of ZSM-5 membrane fabrication
ZSM-5 membranes were synthesized by seeding and secondary growth on disc-
shaped α-Al2O3 substrates. The substrates were made in the laboratory with a diameter of
28 mm and thickness of 4 mm. The substrate surface for seed coating was polished with
600-mesh sand paper. Coating the substrate surface with a layer of silicalite seeds of
about 60 nm was carried out by dipping the substrate into a seed suspension contain 0.5%
silicate and 0.05% hydroxypropyl cellulose (HPC, MW=100,000, Aldrich) for 3 sec. The
pH of the coating suspension was adjusted to ∼3 by adding 0.1 M HNO3 by drops. The
seeded substrates were dried at 45°C for two days and calcinated at 450°C for 6 hr to
remove the organic template. The seeding process was repeated one time to obtain better
surface coverage. The nanosized silicalite seeds were synthesized from a solution
24
containing 0.35 g NaOH pellets (>99.99%, Aldrich), 5.0 g fumed SiO2 (particle size
0.014 μm, Aldrich), and 25 ml 1.0M TPAOH (Aldrich) at 60°C for 14 days.
Following the substrate seeding, a second growth was performed to form a
continuous zeolite layer on the seeded substrate. The second growth synthesis solution
was prepared by dissolving fumed silica and NaOH pellets into deionized water at 80°C.
When a clear solution was obtained, a measured amount of OHSOAl 2342 18)( ⋅ (>98%,
Aldrich) was added and stirred at room temperature for 12 hr. The seeded substrate was
placed in a Teflon-lined autoclave with the coated surface facing down and the synthesis
solution was poured in to immerse the substrate. The autoclave was sealed and moved to
a preheated oven at 180°C for 6 hr. After synthesis, the membranes were rinsed with
deionized water and dried at 150°C for the RO permeation test.
As described in the last chapter, random surface searching of SEM images of
seeded substrated indicated that the whole surface was covered by zeolite crystals with
diameter of 60−100 nm. However, high densities of interparticle pores and a dome-like
structure of the coating layer were observed due to random packing of the zeolite crystals
on the porous support.
After the template was removed by calcination at 450°C for 6 hr, the seeded
substrate was immersed in a synthesis solution containing 1.0 SiO2+41.5 H2O+ 0.38
NaOH +0.0076 Al2O3 for secondary growth. The crystallization time was varied to
improve the intergrowth and surface coverage for achievement of high separation
performance.
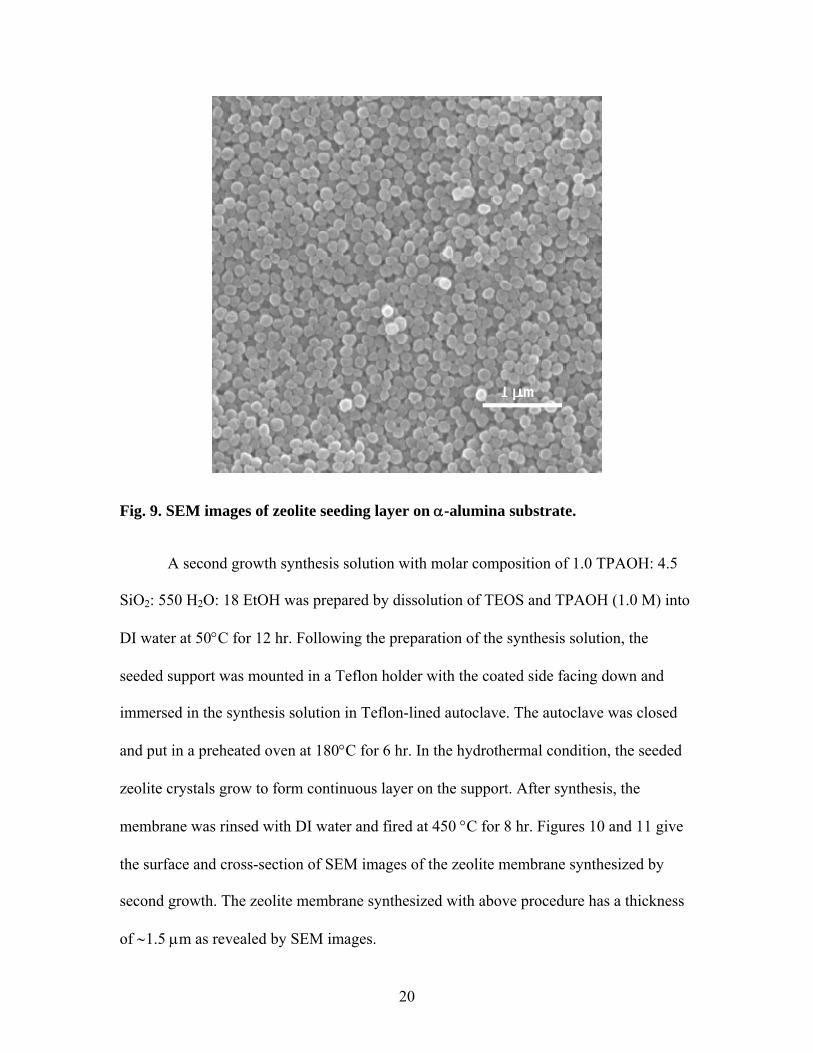
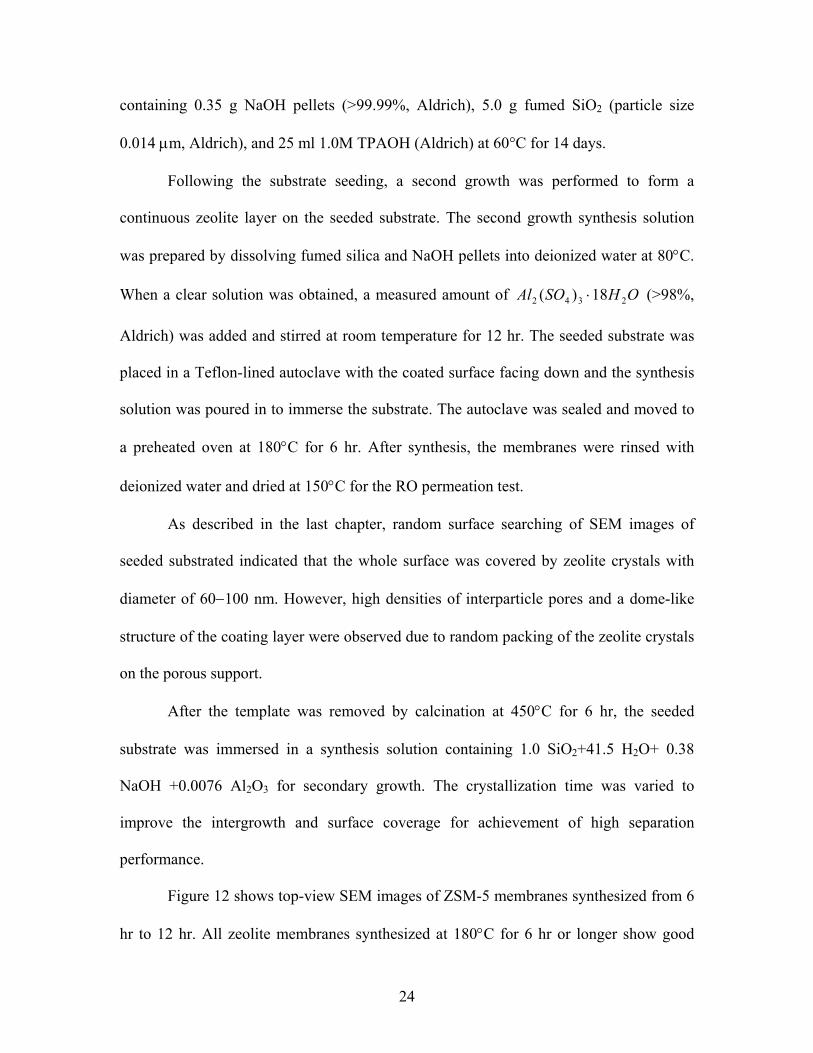
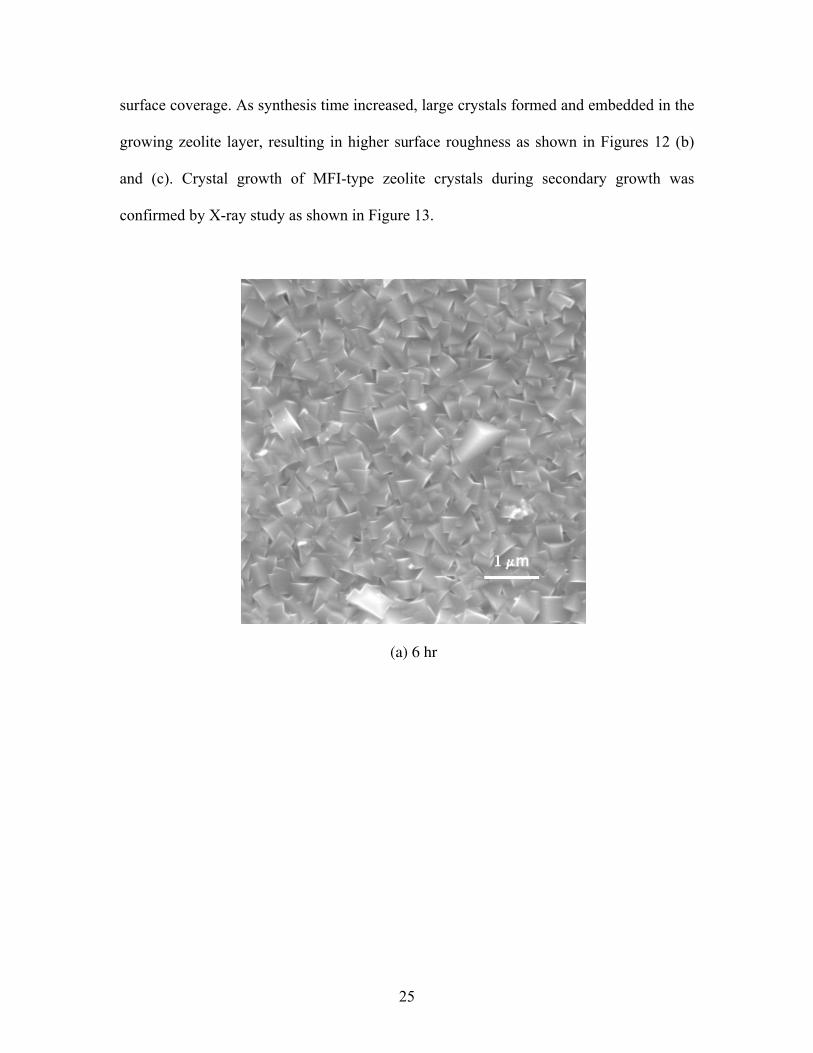
Figure 12 shows top-view SEM images of ZSM-5 membranes synthesized from 6
hr to 12 hr. All zeolite membranes synthesized at 180°C for 6 hr or longer show good
25
surface coverage. As synthesis time increased, large crystals formed and embedded in the
growing zeolite layer, resulting in higher surface roughness as shown in Figures 12 (b)
and (c). Crystal growth of MFI-type zeolite crystals during secondary growth was
confirmed by X-ray study as shown in Figure 13.
(a) 6 hr

26
(b) 9 hr
(c) 12 hr
Fig. 12. Effect of synthesis time on membrane morphology.

27
0 10 20 30 40
2 theta
Rel
ativ
e in
tens
ity
α−alumina substrate
Seeding
Second growth
Fig. 13. The XRD pattern of a zeolite film synthesized by seeding and secondary growth.
Alkalinity in the synthesis solution is crucial for zeolite nucleation and growth,
especially in the absence of the organic template, because the Na+ essentially functions as
the structure directing agent [28]. Also, the alkalinity will affect the dissolution of SiO2
species in the synthesis solution and thus the zeolite crystallinity during zeolite
crystallization [29]. In this study, zeolite membranes with good surface coverage were
synthesized from solutions having a wide range of alkalinity. Figure 14 shows the surface
images of zeolite membranes synthesized from solutions having NaOH:SiO2 ratios (x) of
0.32 and 0.48, respectively. Comparing these to the SEM image shown in Figure 12 (a)
(x=0.38), it can be seen that increasing solution alkalinity promotes the zeolite crystal
growth and forms large zeolite crystals and rough membrane surface.

28
(a) x=0.32
(b) x=0.48
Fig. 14. SEM images of ZSM-5 membranes synthesized from solutions with different alkalinities (1.0 SiO2+41.5 H2O+ x NaOH +0.0076 Al2O3).
29
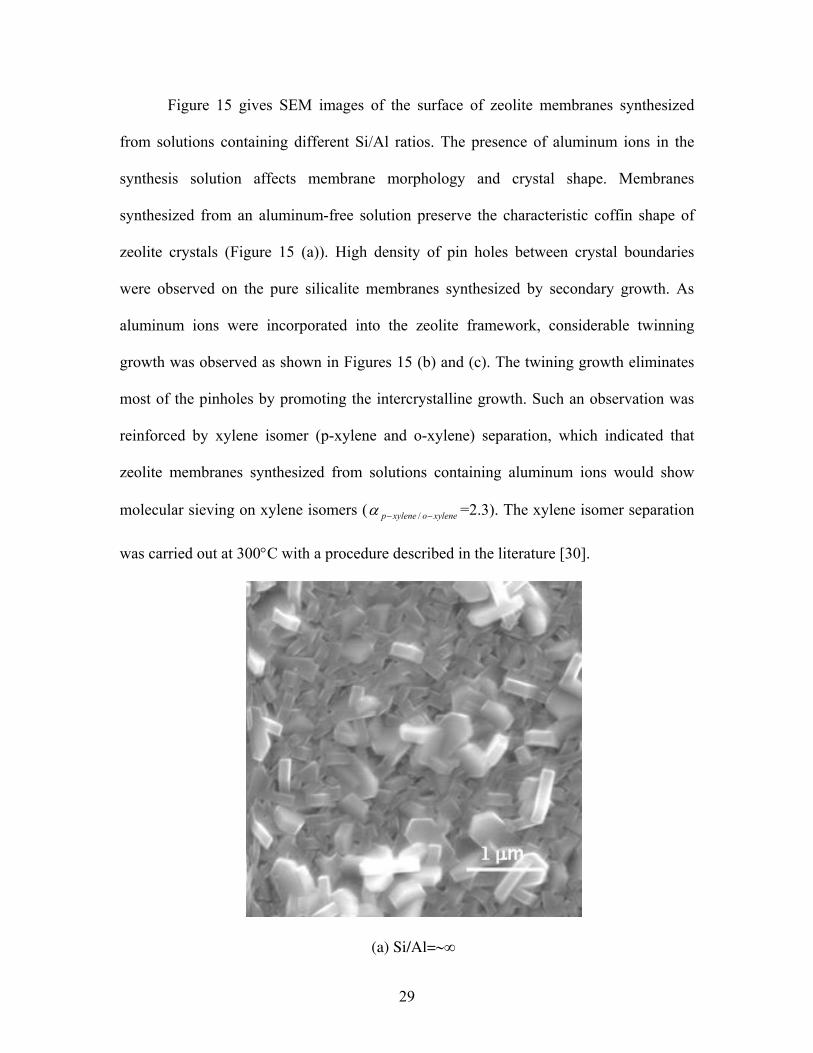
Figure 15 gives SEM images of the surface of zeolite membranes synthesized
from solutions containing different Si/Al ratios. The presence of aluminum ions in the
synthesis solution affects membrane morphology and crystal shape. Membranes
synthesized from an aluminum-free solution preserve the characteristic coffin shape of
zeolite crystals (Figure 15 (a)). High density of pin holes between crystal boundaries
were observed on the pure silicalite membranes synthesized by secondary growth. As
aluminum ions were incorporated into the zeolite framework, considerable twinning
growth was observed as shown in Figures 15 (b) and (c). The twining growth eliminates
most of the pinholes by promoting the intercrystalline growth. Such an observation was
reinforced by xylene isomer (p-xylene and o-xylene) separation, which indicated that
zeolite membranes synthesized from solutions containing aluminum ions would show
molecular sieving on xylene isomers ( xyleneoxylenep −− /α =2.3). The xylene isomer separation
was carried out at 300°C with a procedure described in the literature [30].
(a) Si/Al=∼∞

30
(b) Si/Al=65
(c) Si/Al=50
Fig. 15. Effect of Si/Al ratio on zeolite membrane morphology (1.0 SiO2+41.5 H2O+ 0.38 NaOH + x Al2O3).

31
Figure 16 gives the cross-section SEM images of the seeded substrate before and after
the secondary growth. To increase the surface coverage, dip-coating was repeated once
and the seeding layer formed therein had a thickness of 0.5~1.0 μm. The second growth
was carried out at 180°C for 6 hr. The membrane synthesized in that condition had an
overall zeolite thickness of ~2.5 μm, giving an effective membrane thickness of ~2 μm.
(a) Zeolite seeding layer

32
(b) ZSM-5 membrane
Fig. 16. SEM images of cross-section of seeded substrates before and after the second growth (Si/Al=65).
3.2 Surface chemistry and ion separation
The surface hydrophilicity of the zeolite membranes with different Si/Al ratios
was determined by contact angle measurement (OCA 30, FDS Inc.) using sessile and
captive drop methods. The surface charges of the zeolite membranes were estimated from
the zeta potential measurement of zeolite particles synthesized from the same solution.
Zeolite particles with an average particle size of 120 nm were diluted to ∼0.05% in a 0.01
M NaCl solution and the zeta potential was measured by DELSA 440SX (Coulter).
Ion separations were performed with a cross-flow RO permeation setup. The feed
side was connected to a pressurized solution tank containing NaCl solutions; the desired
trans-membrane pressure was maintained by a high-pressure nitrogen cylinder. A

33
constant feed flow rate of 1.0 mL/min was controlled through a needle valve located at
the concentrate side. The permeate, defined as the solution transport across the
membrane, was collected every 12 hr and stored at 5°C for further composition analysis.
The NaCl concentrations in both the feed and the permeate sides were analyzed by ion
chromatograph (IC, DX120, Dionex).
Each RO test lasted for ~80 hrs for achievement of stabilized water flux and ion
rejection. Water flux (Fw) and ion rejection (ri) are two important parameters in the RO
membrane process.
Table 1 gives the RO separation results for 0.10 M NaCl solution on ZSM-5
membranes synthesized from solutions with Si/Al ratios ranging from 40 to 65. For
comparison, RO permeation of 0.10 M NaCl solution on a pure silicalite membrane was
also given in Table 1. The silicalite membrane was synthesized by in-situ crystallization
with a procedure reported the previous chapter.
Table 1. RO permeation of 0.10 M NaCl solution on MFI zeolite membranes with different Si/Al ratios (P=2.76 Mpa)
No. Si/Al
Ratio
Membrane thickness, μm
Na+ rejection, %
Water flux, kg/m2.h
Permeability mol/(m.h.kPa)
Remarks
M-1 40 ∼2 81.8 1.416 5.70×10⁻⁸ 2th growth
M-2 50 ∼2 92.9 1.129 4.55×10⁻⁸ 2th growth
M-3 65 ∼2 91.5 0.527 2.12×10⁻⁸ 2th growth
M-4 ∼∞ ∼3 90.6 0.112 6.76×10⁻⁹ In-situ
Pure silicalite membrane synthesized by in-situ crystallization gives an ion
rejection of 90.6% and water flux of 0.112 kg/m2.h at an operating pressure of 2.76 MPa.
Both water flux and ion rejection increase considerably as small amount of aluminum

34
ions were substituted into zeolite structure, with water flux increase from 0.112 kg/m2.h
to 1.129 kg/m2.h and ion rejection enhancement from 90.6% to 92.9%. However, as
aluminum content increased further (i.e. Si/Al=40), ion rejection declined because of
poor zeolite crystallinity. The nearly onefold increase in water flux of ZSM-5 membranes
is attributed to the reduced membrane thickness and enhanced surface hydrophilicity. As
trivalent cations (Al3+) are progressively incorporated into zeolite framework, a high-
density hydroxyl group forms and enhances the affinity of water molecules with the
membrane surface [22]. Also, extra-framework counter ions (i.e. Na+, and Ca2+) can
coordinate to water molecules, enhancing water affinity on the membrane surface. The
thickness-independent permeabilities calculated in Table 1 clearly show the enhancement
in water permeation for high aluminum ZSM-5 membranes. The water affinity on the
membrane surface was qualitatively studied by contact-angle measurements. The
membrane samples were tested as received to simulate the actual membrane preparation
process. Because water droplets spread rapidly on membrane surface, the images were
taken 30 sec after the water droplet touched the membrane surface. Figure 17 gives the
contact angle measurement results of zeolite membranes with increasing aluminum
contents. The pure silicalite membrane shows a weak hydrophilic property with a contact
angle of ~30°, which is consistent with the literature result [31]. Such an observation is
explained by the dissolution of trace aluminum elements from the α-alumina substrate in
the strong basic synthesis solution and their incorporation into the zeolite structure [23].
As the aluminum content increased, the contact angles were below 5° as shown in Figs.
17(b) and (c), indicating strong hydrophilic characteristic of the membranes.

35
Fig. 17. Contact angle measurement of zeolite film on porous support: (a) silicalite, (b) Si/Al=65, (c) Si/Al=50.
Zeolite membranes synthesized from a wide range of aluminum content show
high ion rejection for 0.10 M NaCl solution (ri>90%). Both the xylene isomer separation
and gas permeation study indicated that zeolite membranes synthesized from an
aluminum-containing solution have poor intercrystalline growth [32]. It is more likely
that the enhancement in ion rejection for ZSM-5 membranes is caused by strong surface
charge rather than the molecular sieving [33]. The surface charge of zeolite membranes
was estimated from zeta-potential measurement of zeolite nanoparticles synthesized from
the same solution as that of the membranes. Figure 18 gives the zeta potential of
nanocrystalline zeolite particles as a function of aluminum content. The trace element of
aluminum ions (Si/Al=200) resulted in a high increase in surface ζ-potential, from -4.7 to
-49.2 mv. As aluminum content increased further (i.e. Si/Al=65), surface zeta potential
increased gradually to -54.7 mv. The further increase of aluminum contents (Si/Al=50)
resulted in a leap in zeta potential to –76.2 mv. In contacting with aqueous solution, a
double layer will develop and overlap in the intercrystalline pore region and restrict ion
entrance and transport. The double layer thickness monotonically increases with increase
of surface potential, [34], with the result that more intercrystalline pores are
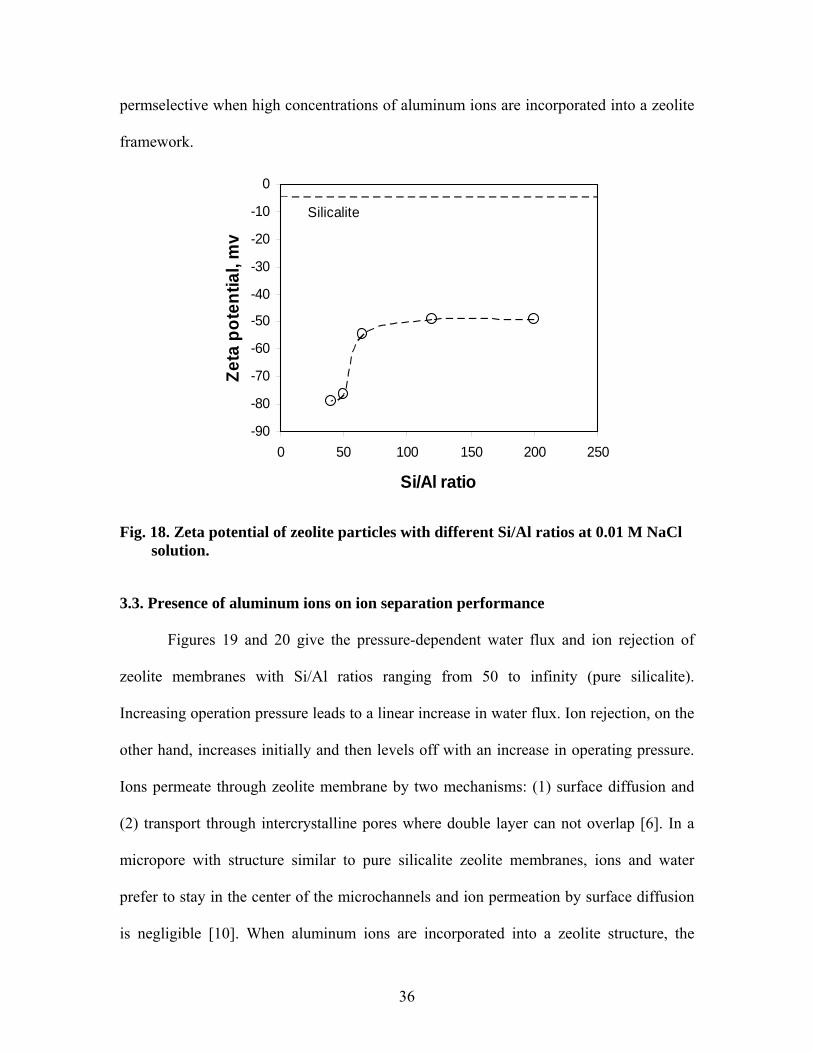
36
permselective when high concentrations of aluminum ions are incorporated into a zeolite
framework.
-90
-80
-70
-60
-50
-40
-30
-20
-10
0
0 50 100 150 200 250
Si/Al ratio
Zeta
pot
entia
l, m
vSilicalite
Fig. 18. Zeta potential of zeolite particles with different Si/Al ratios at 0.01 M NaCl solution.
3.3. Presence of aluminum ions on ion separation performance
Figures 19 and 20 give the pressure-dependent water flux and ion rejection of
zeolite membranes with Si/Al ratios ranging from 50 to infinity (pure silicalite).
Increasing operation pressure leads to a linear increase in water flux. Ion rejection, on the
other hand, increases initially and then levels off with an increase in operating pressure.
Ions permeate through zeolite membrane by two mechanisms: (1) surface diffusion and
(2) transport through intercrystalline pores where double layer can not overlap [6]. In a
micropore with structure similar to pure silicalite zeolite membranes, ions and water
prefer to stay in the center of the microchannels and ion permeation by surface diffusion
is negligible [10]. When aluminum ions are incorporated into a zeolite structure, the

37
framework is anionic with its charge balanced by extraframework cations. Such changes
in zeolite structure will enhance ion permeation through surface diffusion while hindering
ion transport from intercrystalline pores because of the high ion surface coverage and
increased double layer thickness [35]. At low operating pressures, zeolite membranes
with higher aluminum contents show lower ion rejection because of the large contribution
of ion permeation through surface diffusion. As transmembrane pressure increases, water
permeation increases faster than do ions [16], resulting in enhanced ion rejection
efficiency. The increase in ion rejection with operating pressure is more significant when
high aluminum ions are incorporated into zeolite framework, as shown in Figure 20.
0
0.2
0.4
0.6
0.8
1
1.2
0.00 0.50 1.00 1.50 2.00 2.50 3.00
Operation pressure, MPa
Fw, K
g/m
2 .h
SilicaliteSi/Al=65Si/Al=50
Fig. 19. Water flux of zeolite membranes as a function of operating pressure.

38
50
5560
6570
75
8085
9095
100
0.00 0.50 1.00 1.50 2.00 2.50 3.00
Operation pressure, MPa
Salt
reje
ctio
n, %
SilicaliteSi/Al=65Si/Al=50
Fig. 20. Ion rejection as a function of operating pressure for zeolite membranes with different Si/Al ratios.
Conventional reverse osmosis theory suggests that water permeation in RO
membranes increase linearly with the transmembrane pressure [36], while ion transport is
pressure-independent [37]. These theories cannot easily explain the transport behavior of
water and ions in zeolite membranes because the permeation of ions and water in
confined spaces, i.e. zeolite pores, are strongly dependent [10, 38]. Ion and water
permeation in zeolite-like pores is not a single file movement; they need to overcome a
high energy profile to pass each other [39]. Enhanced water permeation under increased
operating pressure facilitates the diffusion of ions due to the “dragging effect” of water
molecules on large and slow ions [38]. This results in a monotonic increase of ion flux
with increase of water flux, as shown in Figure 21. The enhanced diffusion of large
species by small and fast molecules is widely observed in zeolite membranes [40].

39
0.E+001.E-032.E-033.E-034.E-035.E-036.E-037.E-038.E-039.E-031.E-02
0 0.2 0.4 0.6 0.8 1 1.2
Water flux, Kg/m2.h
Ion
flux,
mol
/m2 .h
SilicaliteSi/Al=65Si/Al=50
Fig. 21. Enhanced ion flux by water transport in zeolite membranes.

40
4. ZEOLITE INTRA/INTERCRYSTALLINE PORES AND THEIR
INFLUENCE ON ION SEPARATION
All practical zeolite films are polycrystalline, suggesting the presence of non- or
less-selective intercrystal pores [25]. The presence of the non-selective intercrystal pores
limits the separation performance so these need to be eliminated by post-synthesis
modification such as metal oligomer modification or chemical vapor deposition (CVD)
[41]. Precise determination of the pore size distribution (PSD) and porosity is important
for understand the separation mechanism and design appropriate processes for pore
modification. In this work, zeolite membrane microstructure, particularly intercrystalline
pore size distribution, was studied by applying the HK and BJH models to the N2
adsorption isotherm at 77K. The research indicated that the zeolite intercrystalline pore
sizes are related to surface roughness associated with the properties of substrate and
zeolite orientation. Zeolite films on a dense glass surface have mesopores with size
distribution ranging from 1.0 nm to 2.5 nm. The intercrystal pore sizes of zeolite
membranes on porous α-alumina support shift to larger values at 2.0–4.0 nm.
All the micro- and mesoporous materials used in this study were synthesized in
the laboratory. The microporous crystalline materials including MFI-type zeolite with
different particle sizes and Fau-type zeolite were synthesized by hydrothermal
crystallization [6, 42]. Mesoporous γ-alumina was synthesized by sol-gel process [43].
Hexagonally ordered SBA-15 was synthesized by silica-surfactant self-assembly [44].
Other materials investigated in this study include MFI-type zeolite membranes on porous
α-alumina support, b-oriented and randomly oriented zeolite film on silica glass. The

41
porous supports were made in the laboratory with a procedure described in previous
chapter.
Nitrogen adsorption isotherms at 77K were determined using ASAP 2020
MicroPore System (Micromeritics, USA). The micro- and mesoporous powder samples
were used as obtained. The membrane samples including zeolite membranes on porous
support and thin films on glass surface were ground to small power in a marble mortar for
N2 physisorption isotherm analysis. All samples for the BET test were degassed at 90°C
for 1 hr and then at 350°C for 8 hr. The isotherm data were analyzed by t-plot, HK, DFT,
and BJH models for PSD derivation. Particle size, zeolite orientation and membrane
morphology were studied by scanning electron microscopy (SEM, JEOL 5800LV). X-ray
diffraction (XRD, Rigaku® Geigerflex diffractometer using Cu Kα radiation) was used
to determine the real pore size. All the samples for X-ray test were dried at 120°C for 24
hours.
4.1 Isotherm and pore filling of micro- and mesoporous materials
Physical gas adsorption and desorption isotherm reveal the kind of porosity, pore
size and surface area. More importantly, PSD can be further derived from the feature of
the isotherm such as hysteresis loop and inflection point. Figure 22 gives the adsorption
isotherm of the different type of micro- and mesoporous materials investigated in this
work. The insets are the adsorption isotherm branch at low relative pressures (P/P0)
ranging from 10-7 to 10-2.

42
0
50
100
150
200
250
0 0.1 0.2 0.3 0.4 0.5 0.6 0.7 0.8 0.9 1P/P0
Qua
ntity
Ads
orbe
d, c
m3 /g
(a) γ-alumina
0
50
100
150
200
250
1.E-06 1.E-05 1.E-04 1.E-03 1.E-02
0
100
200
300
400
500
600
700
0 0.1 0.2 0.3 0.4 0.5 0.6 0.7 0.8 0.9 1
P/P0
Qua
ntity
Ads
orbe
d, c
m3 /g
(b) SBA-15
0100200300400500600700
1.E-06 1.E-05 1.E-04 1.E-03 1.E-02
0
20
40
60
80
100
120
140
160
0 0.1 0.2 0.3 0.4 0.5 0.6 0.7 0.8 0.9 1
P/P0
Qua
ntity
Ads
orbe
d, c
m3 /g
(c) MFI-type zeolite
0
2040
6080
100
120140
160
1.E-07 1.E-06 1.E-05 1.E-04 1.E-03 1.E-02
0
50
100
150
200
250
0 0.1 0.2 0.3 0.4 0.5 0.6 0.7 0.8 0.9 1
P/P0
Qua
ntity
Ads
orbe
d, c
m3 /g
(d) Fau-type zeolite
0
50
100
150
200
250
1.E-07 1.E-06 1.E-05 1.E-04 1.E-03 1.E-02
Fig. 22. N2 adsorption isotherm at 77K ((a) γ-alumina, (b) SBA-15, (c) MFI-type
zeolite, and (d) Fau-type zeolite). Solid circles denote adsorption and open circle denote desorption branch.
Zeolites show typical Type I isotherms (Figures 15 (c) and (d)) as defined by
Brunauer [45], in which primary adsorption occurred at low relative pressures
(P/P0<0.01). The mesoporous γ-alumina and SBA-15 show typical Type IV isotherms
with a large adsorption increase at higher relative pressure (P/P0=0.4–0.7) and
characteristic hysteresis loop as shown in Figs. 15 (a) and (b). The insets low-pressure
adsorption isotherm branch (P/P0=10-7–10-2) gives the characteristics of micropore filling.
The γ-alumina and SBA-15 show a continuous increase in absorption volume at low P/P0
range with no observable pressure transition and inflection point, suggesting the absence
of micropores [46]. The rapid increase in adsorption at low relative pressure of Fau- and
MFI-type zeolites is caused by the micropore filling of N2. The adsorption isotherms of

43
MFI-type zeolites (dia.=0.56 nm) and Fau-type zeolites (dia.=0.74 nm) each have
different features, so that the latter show much faster increases in adsorption at low
partial pressure ranges.
To derive the PSD of micro- and mesoporous materials as well as microporous
membranes, several models including HK, BJH and DFT models were applied to the
physisorption isotherm shown in Fig. 15. The HK model derived from relations between
relative pressures ranging from 10-7 to 10-2 and micropore radius is reported to be reliable
for slit-shape micropore determination [47]. In this case, HK (Saito-Foley) model was
applied for micropore size calculation because of the cylindrical pore geometry of
zeolites [48]. Table 2 compares the pore size of microporous zeolites (Fau-type and MFI-
type) and mesoporous γ-alumina and SBA-15 derived from different models and pore
size calculated from X-ray diffraction pattern.
Table 2. Pore size distribution determined by different model
Material HK
(SF model) BJH DFT, cylindrical pore X-ray
γ-alumina 4.0 nm 4.6 nm (adsorption branch)
4.3 nm (desorption branch) 5.0–8.5 nm 4.5 nm
SBA-15 7.1 nm 7.6 nm (adsorption branch)
6.0 nm (desorption branch) 9.5 nm 8.0 nm
MFI-type zeolite 0.72 nm 50 nm for particles with
dia.<100 nm 0.76 nm 0.56 nm
Fau-type zeolite 0.78 nm 0.38 nm for desorption branch 0.75 nm 0.74 nm
Large deviations in PSD of microporous zeolite derived from HK and DFT
models were observed. Also, the PSDs of MFI-type and Fau-type zeolites are not
distinguishable, which was explained by the presence of quadrupolar moment in N2 [49].

44
The HK pore size distribution of mesoporous γ-alumina and SBA-15 are underestimated
comparing to the real pore size obtained from x-ray diffraction. The DFT model, on the
other hand, overestimates the PSD for both micro- and mesoporous materials. The BJH
pore size distribution of γ-alumina and SBA-15 in this study is in good agreement with
the X-ray results but considerable difference between the adsorption and desorption
branches was observed. If the physisorption is used as a routine analysis method, the
experimental condition, pore model selection, and operating parameters must be carefully
calibrated using materials with well-defined pore structure.
Presence of mesopores is widely observed in microporous membranes
synthesized by sol-gel process (i.e. silica membranes) and hydrothermal crystallization
(i.e. zeolite membranes) [50]. Pore size distribution in the mesopore range is critical to
evaluate the membrane performance in molecular sieving because they are usually non-
selective for separation. In order to judge the presence and amount of mesopores in
microporous membranes, it is necessary to determine the PSD in the mesoporous region
(2.0nm<dia.<50nm). Figure 23 gives the BJH pore size distribution of the porous
material derived from the N2 adsorption and desorption isotherm.
0
0.1
0.2
0.3
0.4
0.5
0.6
1 10 100 1000
Pore diameter, nm
dV/d
D, c
m3 /g
. nm Adsorption
Desorption
0
0.2
0.4
0.6
0.8
1
1.2
1 10 100 1000
Pore diameter, nm
dV/d
D, c
m3 /g
.nm
AdsorptionDesorption
(a) γ-alumina (b)SBA-15

45
0
0.02
0.04
0.06
0.08
0.1
0.12
1 10 100 1000
Pore diameter, nm
dV/d
D, c
m3 /g
. nm Adsorption
Desorption
0
0.005
0.01
0.015
0.02
0.025
1 10 100 1000
Pore diameter, nm
dV/d
D, c
m3 /g
.nm
AdsorptionDesorption
(c)MFI-type zeolite (d) Fau-type zeolite
Fig. 23. BJH pore size distribution derived from N2 physisorption isotherm.
For mesoporous material, the PSD derived from adsorption branch of the
physisorption isotherm give a large pore size compared to that obtained from the
desorption branch, for example. We attribute this observation to the hysteresis loop in the
phyisorption isotherm. The inhibition of evaporation causes the decreasing loop lag
behind and result a shift of PSD to lower values [51]. The PSD determined by BJH model
on adsorption isotherm is in good agreement with the XRD results. In this case, using the
adsorption branch for PSD calculation is suggested even though the BJH pore size
distribution obtained from the adsorption and desorption branches has identical trends
due to the reversible adsorption and desorption isotherm. The BJH model does not give
an estimation of PSD when the pore sizes are less than 1.0 nm. However, PSD at ~4.0nm
could be erroneously created when the BJH model is applied to the desorption branch of
the isotherm, as shown in Fig. 16 (d). A similar phenomenon was reported on ZSM-5,
which is explained by the forced closure of the hysteresis loop on the desorption branch
[49].

46
4.2. Adsorption isotherm of zeolite with different crystal size
MFI-type zeolite crystals having different particle sizes were synthesized with the
procedure listed in Table 2. Figure 24 gives the N2 physisorption isotherm of these
zeolites at 77K. The insets are corresponding SEM images of the zeolite crystals. As
particle size decreased from 500 nm to 80 nm, a considerable increase in adsorption
amounts at a high relative pressure (P/P0>0.9) was observed. The adsorption on the outer
surface and gas filling in the interparticle spaces are responsible for such inflections.
0
20
40
60
80
100
120
140
160
0 0.1 0.2 0.3 0.4 0.5 0.6 0.7 0.8 0.9 1
P/P0
Qua
ntity
Ads
orbe
d, c
m3 /g
STP
1.0 μm
0
50
100
150
200
0 0.1 0.2 0.3 0.4 0.5 0.6 0.7 0.8 0.9 1
P/P0
Qua
ntity
Ads
orbe
d, c
m3 /g
STP
1.0 μm
0
50
100
150
200
250
300
350
0 0.1 0.2 0.3 0.4 0.5 0.6 0.7 0.8 0.9 1
P/P0
Qua
ntity
Ads
orbe
d, c
m3 /g S
TP
1.0 μm
0
50
100
150
200
250
300
350
400
450
0 0.1 0.2 0.3 0.4 0.5 0.6 0.7 0.8 0.9 1
P/P0
Qua
ntity
Ads
orbe
d, c
m3/
g ST
P
1.0 μm
Fig. 24. Physisorption isotherm of N2 at 77K for MFI zeolite with different particle size.
4.3. Pore size distribution of zeolite films on glass surface
Many zeolites exhibit anisotropic pore geometry. For example, MFI-type zeolite
has an anisoptropic bidimensional pore structure: straight channels of elliptical cross

47
section and sinusoidal channels of nearly circular cross section [52]. Zeolite membranes
with b-orientation were suggested to have minimized intercrystal pores and enhanced
molecular sieving performance when used for gas and liquid separations [30]. To study
the influence of orientation on the intercrystal pore size distribution, MFI-type zeolite
films with b-orientation and random-orientation were synthesized on thin glass slides by
hydrothermal crystallization. Figure 25 shows the SEM surface images of b-oriented and
randomly-oriented zeolite on dense glass. After firing at 500°C for 3 hr, the zeolite film
on glass was tested for N2 adsorption isotherm at 77K. Figure 26 gives the HK pore size
distribution of the zeolite film shown in Figs. 25(a) and 25(b), respectively. The insets are
t-plots derived from the adsorption isotherm, with solid circles denoting the second
inflection in the curve.
(a) b-oriented (b) randomly-oriented
Fig. 25. SEM images of zeolite film on glass slides with different orientation.
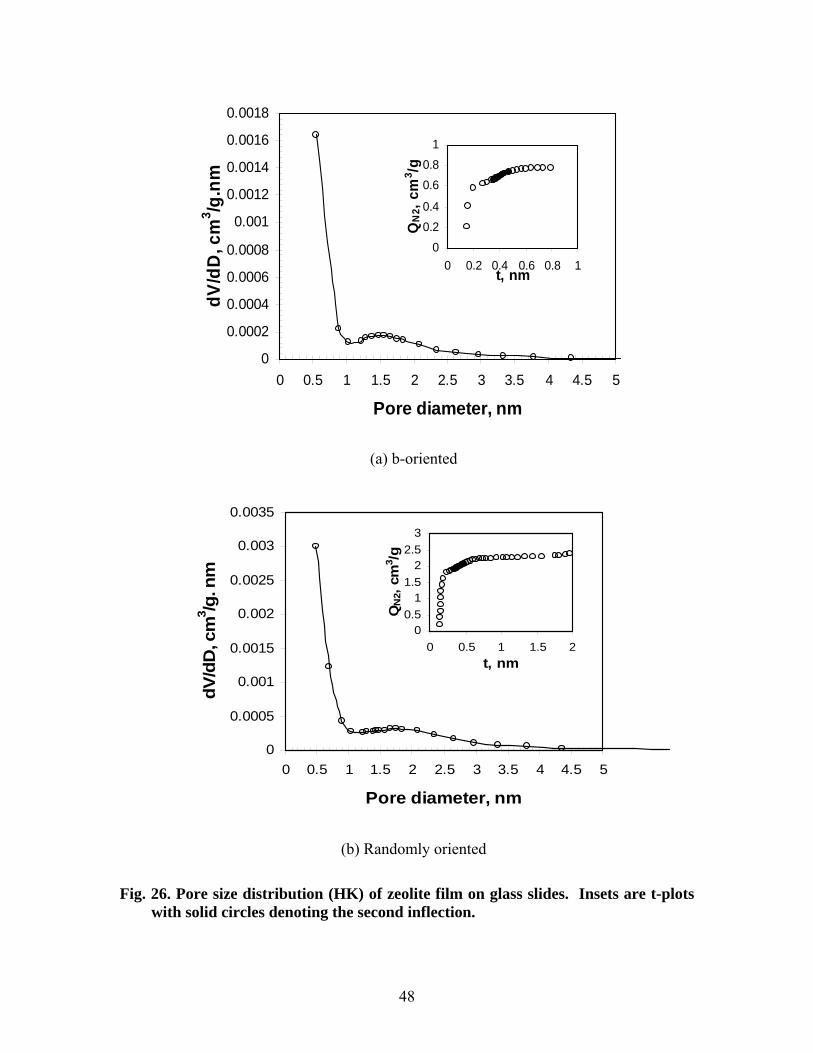
48
0
0.0002
0.0004
0.0006
0.0008
0.001
0.0012
0.0014
0.0016
0.0018
0 0.5 1 1.5 2 2.5 3 3.5 4 4.5 5
Pore diameter, nm
dV/d
D, c
m3 /g
.nm
00.20.4
0.60.8
1
0 0.2 0.4 0.6 0.8 1t, nm
QN
2, c
m3 /g
(a) b-oriented
0
0.0005
0.001
0.0015
0.002
0.0025
0.003
0.0035
0 0.5 1 1.5 2 2.5 3 3.5 4 4.5 5
Pore diameter, nm
dV/d
D, c
m3 /g
. nm
00.5
11.5
22.5
3
0 0.5 1 1.5 2t, nm
QN
2, cm
3 /g
(b) Randomly oriented
Fig. 26. Pore size distribution (HK) of zeolite film on glass slides. Insets are t-plots with solid circles denoting the second inflection.

49
Both HK pore size distribution and step-wise t-plot (two inflections in the curve)
denote the presence of bimodal pore structure of zeolite film synthesized therein. Besides
the well-known zeolitic pores (0.56 nm), b-oriented zeolite films also have intercrystal
pores with PSD ranging from 1.0 nm to 2.5 nm while the randomly-oriented zeolite films
give enlarged intercrystal pores centering at 2.0 nm. The PSD of zeolite film on glass
slides is in the same range as that of the spin-on zeolite film (2.7-3.3 nm) [53], but is
larger than that on stainless steel revealed by molecular probing [54].
4.4. Pore size distribution of polycrystalline zeolite membranes on porous support
Zeolite membranes are generally formed on porous supports such as α-alumina
and stainless steel for separation applications. The PSD of zeolite membranes is subject
to increasing interest due to its determining influence on separation performance [30].
Figure 27 gives the adsorption isotherms of MFI-type zeolite membranes and porous α-
alumina support. The isotherm of the substrate has a sharp increase in adsorption at
relative pressure (P/P0) of 0.9, which is explained by pore filling in large pores (>50 nm).
Since the zeolitic pores are well-defined (dia.=0.56nm), a BJH model is applied to the
isotherm of both substrate and zeolite membrane for mesopore characterization. Figure
28 gives the PSD of the substrate and zeolite membranes on porous α-alumina support.
The substrate has large pores with PSD at ~90 nm as expected. The zeolite membranes
have a wide PSD with major mesopores in the range of 2.0nm–4.0nm, which is
responsible for the size of grain boundary defects caused by synthesis and sintering.
However, the presence of larger intercrystal pores cannot be determined from the
isotherm analysis. The PSD of zeolite membranes derived from physisorption isotherm is
in good consistency with the estimation reported in the literature [17].
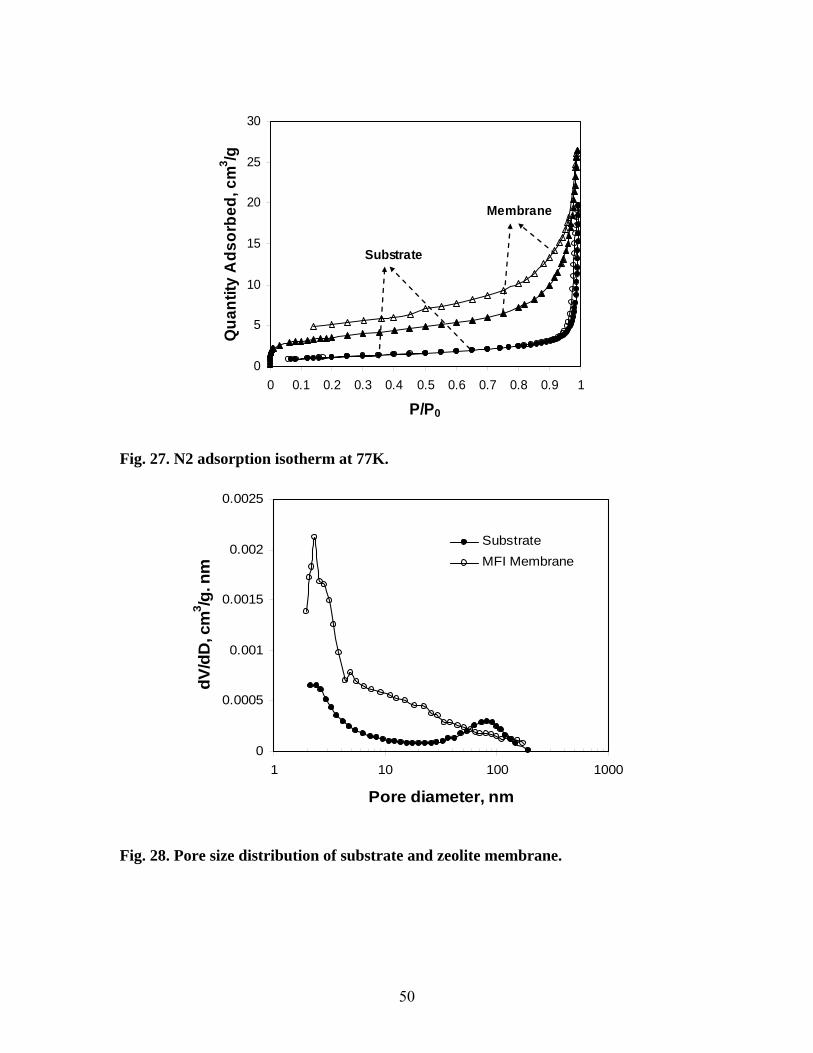
50
0
5
10
15
20
25
30
0 0.1 0.2 0.3 0.4 0.5 0.6 0.7 0.8 0.9 1
P/P0
Qua
ntity
Ads
orbe
d, c
m3 /g
Membrane
Substrate
Fig. 27. N2 adsorption isotherm at 77K.
0
0.0005
0.001
0.0015
0.002
0.0025
1 10 100 1000
Pore diameter, nm
dV/d
D, c
m3 /g
. nm
SubstrateMFI Membrane
Fig. 28. Pore size distribution of substrate and zeolite membrane.

51
5. ELIMINATION OF ZEOLITE INTERCRYSTALLINE PORES BY
POST-SYNTHESIS AL3+ OLIGOMER DEPOSITION
As confirmed by the N2 adsorption and desorption investigation, all the
polycrystalline zeolite membranes contain permselective zeolitic pores and
intercrystalline microdefects, which contribute to the ion leakage and weak performance
in ion separation. To eliminate the intercrystalline nano- or subnano pores, Al3+ oligomer
deposition was performed for post-synthesis modification. The oligomers are deposited
into the intercrystal pore region by a counter-diffusion process, in which the oligomer
precursor solution flows on one side of the membrane and a 0.05M NaOH solution flows
on the other side. The polyhydroxy-cation precursor ([Al13]n+) with small oligomer size
(~0.84nm) meets the alkali solution (OH−) in the intercrystal pores to form higher
oligomeric clusters ([Al13~24]9+~12+) [55]. These large ionic oligomers are deposited in the
intercrystal pores by strong electrostatic sorption to the zeolite surface, thus significantly
reducing the intercrystal space. The ionic oligomers also make the intercrystal space
strongly charged that restrict the cations to enter and transport. Figure 29 shows
schematically the counter-diffusion apparatus employed for the membrane modification.

52
Fig. 29. Schematic diagram of the apparatus for membrane modification.
The Al3+ oligomer precursor solutions were prepared following a procedure
developed by Pinnavaia, et al. [56]. A 0.20M NaOH solution was added dropwise into a
0.10M AlCl3 solution under vigorous stirring at 55°C. The volumetric ratio of the NaOH
and AlCl3 solutions was controlled to give a hydrolysis ratio (OH−/Al3+) of 2.0 in the
final mixture to ensure a relatively small oligomer size (<0.84nm). The mixture was then
stirred for 12 hr at the same temperature. The resultant Al3+ oligomer precursor solution
was refrigerated at 5°C before use.
The oligomer precursor and the 0.05M NaOH solutions flowed over the two sides
of the membrane at a flow rate of 2.0 ml/min. The water bath temperature was controlled
at 55°C to enhance diffusion and facilitate the oligomerization. After modification, the
membrane was rinsed thoroughly with deionize water and then dried at 100°C in an air
flow for 12 hr.
5.1. Tests of the modified membranes
The membrane was tested by nitrogen permeation and RO desalination for NaCl
solutions with different concentrations before and after the modification. Nitrogen gas
permeation was conducted by the Wicke-Kallenbach method at 50oC using helium as
Water bath Oligomer
precursor solution
0.05M NaOH
Zeolite membrane
Pump
Pump
Preheat coil

53
sweeping gas on the permeate side. The RO experiments were performed on a cross-flow
system. The membrane cell was immersed in a water bath for temperature control
(±0.2oC, RDL 20, GCA). The RO desalination was performed for NaCl solutions with
concentrations of 0.01M, 0.03M, 0.10M, 0.30M and 1.00M, respectively. For each feed
solution, the RO experiment lasted for more than 120 hr to obtain stabilized flux and ion
rejection rates. The membrane was rinsed and then immersed in 500 mL DI water for
overnight to extract the residual solution before switching to the next solution of different
concentration.
The nitrogen permeance (defined as flux normalized by transmembrane pressure)
of the MFI membrane decreased from 2.80×10⁻⁸ mol/m2⋅s⋅Pa before modification to
1.94×10⁻⁸ mol/m2⋅s⋅Pa after modification. The decrease in the nitrogen permeance was
caused by the reduction of intercrystalline pores by the oligomer deposition since the
ionic oligomers, as well as the hydrated Al3+ , are too large to enter the zeolite channels.
The RO tests for all the NaCl solutions were conducted at 30°C with atmospheric
pressure (0.086MPa in the lab) on the permeate side. The feed pressure for the 1.0M
NaCl solution was 4.13MPa. For all the other solutions, the feed pressure was 2.75MPa.
The results of the RO tests are shown in Table 3.
Table 3. Results of reverse osmosis for NaCl solutions with different concentrations.
Feed concentration
(M)
Before modification After modification Fw,
mol/m2.h ri, % Fw, mol/m2.h ri, %
0.01 39.4 84.1 22.6 91.7 0.03 40.0 73.8 20.9 89.7 0.10 37.4 61.5 20.4 88.4 0.30 36.9 55.4 16.1 81.3 1.00 36.1 44.6 14.1 60.2

54
Both the water flux and ion rejection rates exhibited general trends to decrease
with increasing the ion concentration from 0.01 to 0.30M for the MFI membrane before
and after the modification. The decline of water flux for high feed concentration is caused
by (1) the increased osmosis pressure which lowered hydraulic pressure difference (ΔP)
across the membrane thickness and (2) the enhanced ion sorption to the internal and
external surface of the zeolite which increased the resistance for water transfer. Similar
phenomena were observed on other zeolite membranes synthesized with different
methods.
After modification, the water flux of the membrane became significantly lower
compared to that measured before modification. This was caused by the reduced
intercrystalline pore volume and enhanced charge density in the intercrystalline space by
ionic oligomer deposition. It is possible that electrostatic sorption of the ionic oligomer
also occurred at the membrane surface, which could have further hindered water transport
through the membrane.
The concentration-dependent ion rejection is caused by the diminishing of the
double layer in the high-concentration solution in which the intercrystalline pores will
open up for free ions to transport. The water flux in RO membranes increases
proportionally with ΔP, while the ion flux depends primarily on the gradient of chemical
potential, which is virtually independent of pressure in liquid phases. The mechanisms of
ion and water transport during reverse osmosis have been discussed in our previous
report. Figure 30 shows the ion rejection rates as a function of feed concentration or
estimated double layer thickness, i.e. the Debye screening length (κ −1) [57], to compare
the membrane RO performance before and after modification.

55
0%
10%
20%
30%
40%
50%
60%
70%
80%
90%
100%
0 0.5 1 1.5 2 2.5 3 3.5Debye length (nm)
Ion
reje
ctio
n (%
)
BeforeAfter
0.3700.090 0.040 0.0100.0150.020Feed Concentration (M)
.
0.00
0.050.10
0.15
0.20
0.250.30
0.35
0 0.2 0.4 0.6 0.8 1 1.2Feed concentration (M)
Ion
Flux
(mol
/m2 .h
) Before
After
Fig. 30. Ion rejection as functions of feed concentration and double layer thickness (inset: ion flux as a function of the feed concentration).
The ion rejection rates on the modified membrane were significantly higher than
those obtained before modification. However, the ion rejections for the 0.01 M solution
were similar for the membrane before and after modification. In the dilute solutions, the
charged double layers were able to overlap in all the intercrystal spaces to limit the ion
transport even without modification. Thus, for dilute solutions, the membrane
modification is less effective to improve the ion rejection but causes significant loss of
water flux.
The enhancement in ion rejection by the membrane modification became more
significant as the feed concentration increased. This indicates that the relatively large
intercrystalline pores were reduced and modified effectively by the deposition of ionic
oligomers. The double layer thickness drops from 3.0nm for the 0.01M NaCl solution to
0.30nm for the 1.0M solution. Therefore, the charged double layer diminishes and the

56
intercrystalline pores open up gradually for ion transport in the unmodified membrane as
the feed concentration increases, leading to a fast decrease in ion rejection rate starting
from the lowest concentration. On the contrary, the ion rejection rate decreased only
slightly when the feed concentration increased from 0.01 M to 0.1 M. This indicates that
most of the intercrystal pores with sizes larger than ~2nm were modified effectively.
However, the ion rejection rate on the modified membrane started to drop rapidly for feed
concentrations higher than 0.1 M, suggesting that the modification was inefficient for
pores with relatively small sizes (i.e. <2nm). The highly charged Al3+ oligomers may
carry a large number of bonded water molecules that makes the oligomeric clusters too
large to enter the small intercrystallline pores.
5.2. Long-term stability of modified membranes
Desalination of real produced water on a modified zeolite membrane was
performed for over 500 hr to investigate the stability of metal oligomers at produced
water environment and necessity for reinforcement. The produced water sample obtained
from local gas field in Farminton, NM was pretreated by filtering through a 2 μm-
Whatman® filter paper for removing of particulates. The pretreated produced water was
forced to flow across the membrane surface and the permeate samples were collected and
analyzed by IC for ion concentration analysis. Then the membrane was rinsed with DI
water and treated by Al3+-oligomer modification. Finally, permeation of the produced
water was carried out on the modified membrane for the elapsed time for stability testing.
Table 4 gives the chemical composition of the produced water sample together with the
ionic compositions in the permeate solution after permeating through the zeolite
membrane.
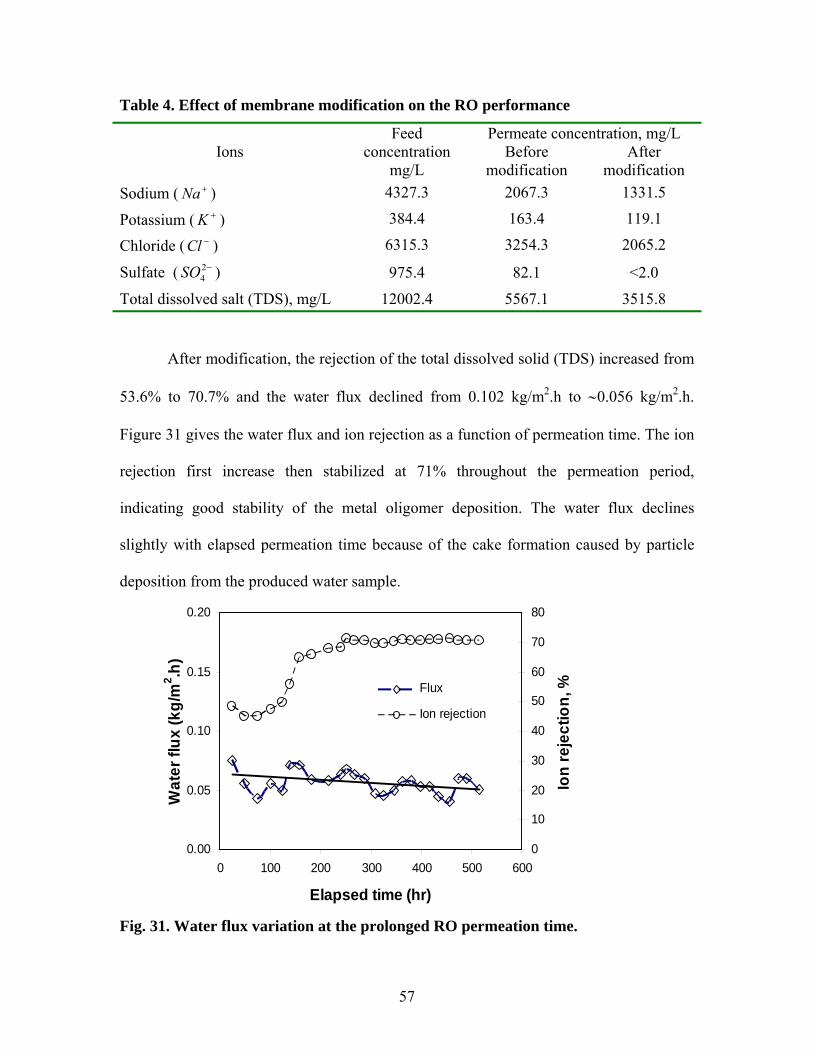
57
0.00
0.05
0.10
0.15
0.20
0 100 200 300 400 500 600
Elapsed time (hr)
Wat
er fl
ux (k
g/m
2 .h)
0
10
20
30
40
50
60
70
80
Ion
reje
ctio
n, %Flux
Ion rejection
Table 4. Effect of membrane modification on the RO performance
Ions Feed
concentration mg/L
Permeate concentration, mg/L Before
modification After
modification Sodium ( +Na ) 4327.3 2067.3 1331.5
Potassium ( +K ) 384.4 163.4 119.1
Chloride ( −Cl ) 6315.3 3254.3 2065.2
Sulfate ( −24SO ) 975.4 82.1 <2.0
Total dissolved salt (TDS), mg/L 12002.4 5567.1 3515.8
After modification, the rejection of the total dissolved solid (TDS) increased from
53.6% to 70.7% and the water flux declined from 0.102 kg/m2.h to ∼0.056 kg/m2.h.
Figure 31 gives the water flux and ion rejection as a function of permeation time. The ion
rejection first increase then stabilized at 71% throughout the permeation period,
indicating good stability of the metal oligomer deposition. The water flux declines
slightly with elapsed permeation time because of the cake formation caused by particle
deposition from the produced water sample.
Fig. 31. Water flux variation at the prolonged RO permeation time.

58
6. ION SEPARATION PERFORMANCE ON ZEOLITE
MEMBRANES
Zeolite membranes, specifically LTA (pore size ~0.4 nm) and MFI (pore size ~0.56
nm) type, can separate ions from aqueous solution by reverse osmosis [58]. The separation
mechanism involves size exclusion of hydrated ions [54, 58] and electrostatic repulsion
(Donnan exclusion) at intercrystalline pore entrance. Such a combination allows zeolite
membranes to be unique in separations of both organics and electrolytes from aqueous
solutions by reverse osmosis process [5].
A considerable amount of experimental work and theoretical modeling studies
have been carried out for understanding the transport of water and ion in microporous
media [10, 21, 59]. The ionic mobility of hydrated ions in cylindrical pores of radius less
than 1.1 nm was reported to be considerably lower than that in bulk solution [13]. The
factors governing the structure and diffusion of ion and water in microchannel include
surface charge [12], hydrophilicity [14], and pore wall roughness [15]. The fundamental
study of ion permeation through zeolite membranes is crucial to understand the ion
separation mechanism in zeolite membranes. In addition, ion permeation behavior in
microporous channels can help us to better understand the microstructure of zeolite thin
film.
Ion separation by zeolite membranes was performed by cross-flow experiments,
as shown in Fig. 32. Membranes with different configuration were mounted in a cross-
flow cell in which orginal produced water was forced to flow across the membrane
surface. The disc-shaped zeolite membrane was mounted facing the feed stream in a

59
stainless steel cell sealed by silicone O-rings. Both the feed chamber and permeate
chamber of the cell had small volumes of about 0.5 cm3. Tubular membranes were
assembled by inserting the membrane tube into a lab-designed Nylon cell. Both ends of
the tubular membranes were sealed by O-rings. The feed solution flows through the
internal and the outer cylinder of the Nylon cell retains the effluent, where it is removed
through a port and collected in an 8.0 mL-Tyflon bottle. In this design, membranes can
be easily replaced for permeation testing. For commercial application, a large number of
tubular membranes could be packed into a pipe and ends of tubes could all be capped
with injection-molded plastic caps that can seal both ends of the tubular membranes and
the outer cylinder. It should be noted that the membranes used in this study include both
pure silicalite membranes and ZSM-5 membranes, which show considerable difference in
water flux.
Fig. 32. Schematic diagram of the RO system.
The feed pressure was maintained by a nitrogen cylinder, and the feed flow rate
was controlled by a needle valve located at the feed chamber exit. A very stable feed
Water bottle to prevent sample evaporation Sample collector
Feed outlet
Feed tank Sample analysis
Membrane cell
Feed pressure control and pressure gauge
High pressure N2 from cylinder
Flow control valve
Feed solution

60
pressure was maintained throughout the experimental process. The feed flow rate was
maintained at 0.5 mL/min at the outlet, while the permeate flow rate was less than 1% of
the feed flow rate so that the feed side concentration could be considered constant at inlet
and exit. The liquid permeate was collected by a small Teflon sample bottle at ambient
pressure (86 kPa in Socorro, New Mexico). The sample bottle was connected to the gas
phase of a water flask through a capillary tube to prevent evaporation of the received
liquid. Both the feed solution and the collected permeate solution were diluted to
appropriate concentrations (~0.0025 M) and analyzed by a dual-column ion
chromatograph (IC, DX120, Dionex), equipped with a computer data acquisition and
analysis system. Rejection of ion i, ri, is defined by equation (1),
%100)(
)()(×
−=
feedi
permifeedii C
CCr (1)
where (Ci)feed and (Ci)perm are concentrations of ion i in the feed and permeate solutions,
respectively. The water flux (Fw) and permeance (Pa) are defined as follows:
tAQ
Fm
ww ⋅
= (2)
πΔ−−=
Δ=
pf
wwa PP
FP
FP (3)
MwRT
CC
CC
Permeates
s
Feeds
s
⎥⎥⎦
⎤
⎢⎢⎣
⎡⎟⎟⎠
⎞⎜⎜⎝
⎛−
−⎟⎟⎠
⎞⎜⎜⎝
⎛−
=Δ100100
π (4)
where Cs is the total ion concentration, mol/L; Δπ is the difference in osmotic pressures
between the feed and permeate solutions; Qw is the quantity of water collected in a time
period t; Am is the effective membrane area, 2.5x10⁻⁴ m2 for the disc-shaped membranes

61
and 1.24x10⁻³ m2 for the tubular membranes; T is the temperature; R is the gas constant;
and Mw is the molecular weight of the ion.
6.1 Influence of operation condition and solution chemistry on ion separation
performance
The influence of operatiing parameters on the separation performance of zeolite
membranes is critical to understand water and ion transport in microporous systems. Also
these basic understandings give important information for improving the synthesis
process and modification technique. The influences of ion valence, ion concentration,
temperature and trans-membrane pressure on the ion separation performance of zeolite
membranes were investigated through cross-flow RO permeation tests.
6.1.1 Ion valence
Influence of ion valence on desalination by zeolite membranes was studied
through RO permeation tests of 0.10 M metal chloride solutions including 0.10 M NaCl,
0.10 M MgCl2, and 0.10 M AlCl3. Figure 33 compares the ion and water flux of the metal
chloride solutions. Both ion and water fluxes decreased and the ion rejection increased in
the order of NaCl, MgCl2, and AlCl3. The reduction of ion transport with an increase in
ion valence is caused by the increasing charge density, which enhances the interactions
between the ions and the pore wall and the double layers. Moreover, the apparent
dynamic hydration number also increases with the charge density in the order of Al3+ >
Mg2+ > Na+. Since the intercrystalline pores have a size distribution, the number of
intercrystalline pores permeable for ions is inversely proportional to the hydrated ion size
or ADHN. Therefore, ion rejection increases in the order of Na+<Mg2+<Al3+.

62
0
2
4
6
8
10
0.1M NaCl 0.1M MgCl2 0.1M AlCl3Solution
Wat
er F
lux,
mol
/m2 .h
0
0.004
0.008
0.012
0.016
Cat
ion
flux,
mol
/m2 .hWater flux
Ion flux
Fig. 33. Effect of cation valance on water and ion fluxes.
The mobility of water molecules neighboring the ions decreases with increasing
ion-water bond strength and with dielectric friction, which enhances ion charge density
and the inverse ion radius [7, 11, 60−61]. In the micropores, free water molecules are
much fewer than in the bulk solution because the hydrated ions interact directly with the
charged double layers, especially when the double layers tend to overlap in a small space
[62]. Thus, the mobility of water molecules inside the pores is lower than that in the bulk
solution because of the joint motion of water and ions [7] under the influence of charged
double layers. Therefore, water and ion fluxes decrease with increasing ion valence in an
order of Na+> Mg2+>Al3+.
6.1.2 Ion radius In the same column of periodic table, crystallographic ion size increases with
increase of molecular weight. RO permeation tests with ions in the first column of
periodic table (K+ and Na+) and in the second column (Ca2+ and Mg2+) were performed to
study the influence of ion size on membrane separation performance. All ions existed as

63
0.10 M metal chloride solutions in water. Figure 34 shows the comparison between ion
and water flux for these metal chloride solutions.
0.0
2.0
4.0
6.0
8.0
10.0
12.0
Solution
Wat
er fl
ux, m
ol/m
2 .h
0.000
0.004
0.008
0.012
0.016
0.020
Cat
ion
ion
flux,
mol
/m2 .h
NaCl KCl MgCl2 CaCl2
Fig. 34. Effects of cation size on water and ion flux.
The ion and water flux of 0.10 M KCl solution were higher than those of the 0.10
M NaCl solution. This can be explained by the fact that, for alkali metal ions in aqueous
solutions, the diffusion coefficient increases and the friction coefficient decreases with
increasing crystallographic ion size [8, 9]. The diffusion rate of ions in aqueous solution
is governed by ion and water interactions. As ion crystallographic size increases, the
distance between ion charge center and surrounding water is enlarged, resulting in
weaker interaction between ion and water, thus reducing the friction coefficient [63]. The
rejections of Na+ and K+ were close because they have similar hydrated ion sizes (with
ADHN). Similar results were obtained by comparison of the ion and water flux between
the MgCl2 and CaCl2 0.10 M solutions. However, the rejection of Mg2+ was much higher

64
than that of Ca2+ because the former has a stronger polarization effect on the surrounding
water molecules [64] and thus possesses a higher ADHN [65].
6.1.3 Ion concentration Sequences of metal chloride solutions containing cations of Na+, Mg2+ and Ca2+
were tested for RO separation on zeolite membranes. The solutions studied here have
total dissolved solids (TDS) ranging from 856 to 8.56×10⁴ mg/L. The cations (Na+, Mg2+
and Ca2+) in all solutions have identical molar ratio of 86:2:1, a typical concentration
ratio in CBM produced water of NM [66]. The RO separations were carried out on a
tubular membrane at room temperature (∼20°C) and trans-membrane pressure of 2.75
MPa. Figure 35 gives the individual ion rejection as a function of feed concentration. The
influence of ion concentration on the overall performance of the zeolite membrane is
shown in Figure 36.
0
10
20
30
40
50
60
70
80
90
100
1.0E+02 1.0E+03 1.0E+04 1.0E+05 1.0E+06
TDS in feed solution, mg/L
Ion
reje
ctio
n, %
Na+
Mg2+
Ca2+
Fig. 35. Influence of ion concentration on individual ion rejection.

65
0
10
20
30
40
50
60
70
80
90
100
1.0E+02 1.0E+03 1.0E+04 1.0E+05 1.0E+06
TDS, mg/L
Tota
l ion
reje
ctio
n, %
0
0.05
0.1
0.15
0.2
0.25
Wat
er fl
ux, k
g/m
2 .h
Ion rejectionWater flux
Fig. 36. Influence of ion concentration on overall ion rejection and water flux.
Both ion rejection and water flux decreased progressively with increase of ion
concentration. The ion rejection of Na+ declined rapidly from 85.3 to 22.1% as the TDS
increased from 856 to 8.56×10⁴ mg/L while the ion rejections of Ca2+ and Mg2+ were less
affected by ion concentration. The decline of solute rejection with an increase in ion
concentration was explained by the decrease of double layer thickness with ionic strength
[67] that resulted in opening of more intercrystalline pores through which ions could
penetrate. Separation through intracrystalline zeolitic pores was less affected by ion
concentration because the sizes of hydrated ions are virtually constant as ion
concentration changes [68]. At low ion concentration, both zeolitic pores and
intercrystalline zeolite pores show ion rejection through the mechanisms of size exclusion
and the overlapping of the double layer. As ion concentration increased, the majority of
intercrystalline pores were opened up for Na+ transport, but were still small enough to
restrict the transport of multivalent ions such as Mg2+ and Ca2+ due to their large ADHN

66
and high charge density [7]. As ion concentration increases further, the ion rejection of
Mg2+ and Ca2+ started to decline, as shown in Fig. 35.
The decline of water flux with an increase in ion concentration was explained by
the reduced numbers of free water molecules and narrowed transport pathways in the
zeolite layer. Water molecules in electrolyte solution exist as free water or hydrated
water. The number of free water molecules decreases as ion concentration increases
because the hydration number of ions is almost constant as ion concentration changes
[68]. Moreover, as ion concentration increased, more ions were trapped in zeolitic pores
and adsorbed onto the surface of intercrystalline pores that reduced the effective pore
size, resulting decline in water flux.
6.1.4 Transmembrane pressure RO permeations of 0.10 M NaCl solution on a tubular zeolite membrane were
conducted at differential pressures ranging from 1.03 MPa to 2.76 MPa. Figure 37 gives
the ion rejection and water flux as a function of operation pressure.
70.0%
75.0%
80.0%
85.0%
90.0%
95.0%
100.0%
0.00 0.50 1.00 1.50 2.00 2.50 3.00 3.50
Pressure, MPa
Ion
reje
ctio
n
0.00
0.05
0.10
0.15
0.20
0.25
0.30W
ater
flux
, Kg/
m2 .hRejection
Flux (water)
Fig. 37. Influence of operation pressure on membrane performance.

67
The water flux increased almost linearly from 0.072 Kg/m2.h at operating
pressures of 1.03 MPa to 0.241 Kg/m2.h at 2.76 MPa. This is consistent with the classical
solution-diffusion theory in which the driving force for water permeation is the
differential pressure across the membrane. The ion rejection was found to increase from
72.7% to 80.5% as operating pressure increased from 1.03 MPa to 2.07 MPa and
remained stable at ∼80%, as differential pressure increased further from 2.07 MPa to 2.76
MPa.
Figure 38 gives the water flux variation as a function of transmembrane pressure.
All the feed solutions with increasing NaCl concentration from 0.001M to 0.7M showed
the same trend where water flux increased nearly linearly with the increase of the driving
force (transmembrane pressure).
0
0.5
1
1.5
2
2.5
3
3.5
4
4.5
0 1 2 3 4 5 6
Transmembrane pressure, MPa
Wat
er fl
ux, k
g/m
2 .h
DI0.001 M0.01 M0.1 M0.3 M0.5 M0.7 M
Fig. 38. Water flux variation as a function of transmembrane pressure.
Transmembrane pressure also showed considerable influence on the salt rejection
efficiency, as shown in Fig. 39. Water transported across the zeolite membrane under the

68
driving force of effective transmembrane pressure, defined as πΔ−−=Δ pf PPP . Pf and
Pp are pressures (Pa) of the feed and permeate sides, respectively. Δπ ( ][ ,, pifi CCRT −≈ )
is the osmosis pressure difference (Pa) between the feed and permeate solutions.
Increasing the feed-side pressure increases the water transport driving force and thus the
water flux. Fast water flux usually results in concentration polarization at the interface of
the membrane, resulting in an increase in net driving force for ion diffusion. As a result,
both water flux and ion permeation increased with increasing transmembrane pressure.
However, the magnitude of increase in the water flux was much greater than that in the
ion flux, resulting in an increase in ion rejection efficiency.
0
10
20
30
40
50
60
70
80
90
100
0.00 1.00 2.00 3.00 4.00 5.00 6.00
Transmembrane pressure, MPa
Ion
reje
ctio
n, %
0.01 M0.1 M0.3 M0.5 M0.7 M
Fig. 39. Ion rejection changes as a function of transmembrane pressure.
6.1.5 Sweeping flow rate
Figure 40 shows the influence of water flow rate on membrane performance. As
the sweeping flow rate increased from 0.01m/s to 0.1m/s, water flux increased from
12.1kg/m2.h to 13.4kg/m2.h and ion rejection increased from 85.0% to 88.9%. The

69
enhancement in both water flux and ion rejection at high water flow rate is explained by
the influence of sweeping flow rate on the concentration polarization. Water diffusivity in
zeolite membranes is at one or two orders of magnitude of that of ions [69], resulting in
ion accumulation at the zeolite pore entrance. The concentration polarization at the
membrane surface showed considerable influences on the membrane performance:
reducing both water flux and ion rejection efficiency. One advantage of zeolite
membranes compared to conventional polymeric membranes is that the zeolite membrane
has excellent mechanical stability. Thus, strong turbulent flow can be deployed for
breaking up the concentration polarization and enhancing the ion separation performance.
707274767880828486889092949698
100
0 0.02 0.04 0.06 0.08 0.1 0.12
Feed flow rate, m/s
Ion
reje
ctio
n (r i
, %)
0
2
4
6
8
10
12
14
F w, k
g/m
2 .hriFw
Fig. 40. Influence of feed water flow rate on the membrane separation performance.
6.1.6. Temperature
Figure 41 shows the ion rejection and water flux of a zeolite membrane at
different operating temperatures. As water temperature increased from 297K to 318K,

70
water flux increased from 3.19 kg/m2.h to 4.31 kg/m2.h while ion rejection decreased
from 98.7% to 95.1%. Water and ion diffusion through zeolite membranes follow the
Arrhenius relation: increasing temperature will increase the water and ion diffusivities
simultaneously. It was revealed that raising temperature increases the kinetic energy of
ion and water that facilitates molecular collision at the zeolite pore entrances [69]. As a
result, the permeation activation energies for ions (ΔEi) are larger than those for water
(ΔEw), meaning that water flux increases more significantly at increasing temperatures
compared to that of water. In the circumstances of produced water desalination,
increasing the feed water temperature is desirable for the enhancement in water flux
while the ion rejection is essentially the same.
50556065707580859095
100
295 300 305 310 315 320
Temperature, K
ri, %
2
3
4
5
6
7
8
F w, k
g/m
2 .hriFw
Fig. 41. Influence of temperature on water flux and ion rejection of zeolite membrane.
6.2 Mechanism of ion separation through zeolite membranes
In this part of work, we present our view of the mechanism of ion separation
through polycrystalline zeolite membranes based on the microstructure of zeolite
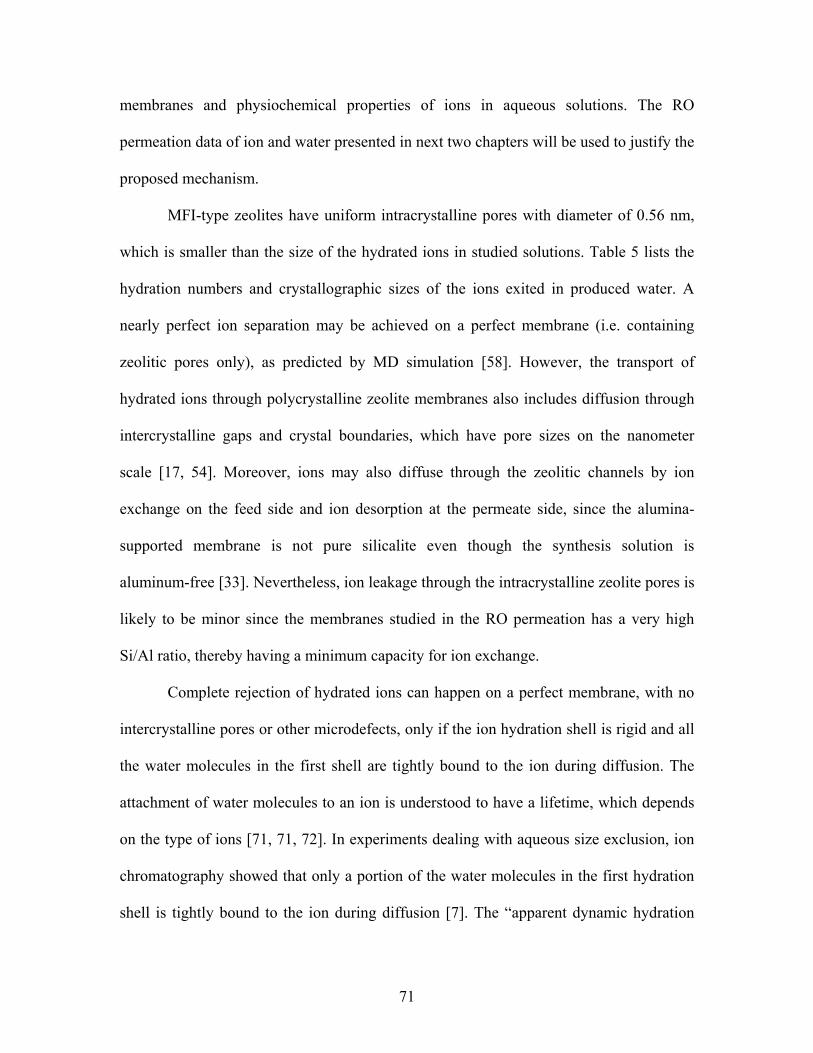
71
membranes and physiochemical properties of ions in aqueous solutions. The RO
permeation data of ion and water presented in next two chapters will be used to justify the
proposed mechanism.
MFI-type zeolites have uniform intracrystalline pores with diameter of 0.56 nm,
which is smaller than the size of the hydrated ions in studied solutions. Table 5 lists the
hydration numbers and crystallographic sizes of the ions exited in produced water. A
nearly perfect ion separation may be achieved on a perfect membrane (i.e. containing
zeolitic pores only), as predicted by MD simulation [58]. However, the transport of
hydrated ions through polycrystalline zeolite membranes also includes diffusion through
intercrystalline gaps and crystal boundaries, which have pore sizes on the nanometer
scale [17, 54]. Moreover, ions may also diffuse through the zeolitic channels by ion
exchange on the feed side and ion desorption at the permeate side, since the alumina-
supported membrane is not pure silicalite even though the synthesis solution is
aluminum-free [33]. Nevertheless, ion leakage through the intracrystalline zeolite pores is
likely to be minor since the membranes studied in the RO permeation has a very high
Si/Al ratio, thereby having a minimum capacity for ion exchange.
Complete rejection of hydrated ions can happen on a perfect membrane, with no
intercrystalline pores or other microdefects, only if the ion hydration shell is rigid and all
the water molecules in the first shell are tightly bound to the ion during diffusion. The
attachment of water molecules to an ion is understood to have a lifetime, which depends
on the type of ions [71, 71, 72]. In experiments dealing with aqueous size exclusion, ion
chromatography showed that only a portion of the water molecules in the first hydration
shell is tightly bound to the ion during diffusion [7]. The “apparent dynamic hydration
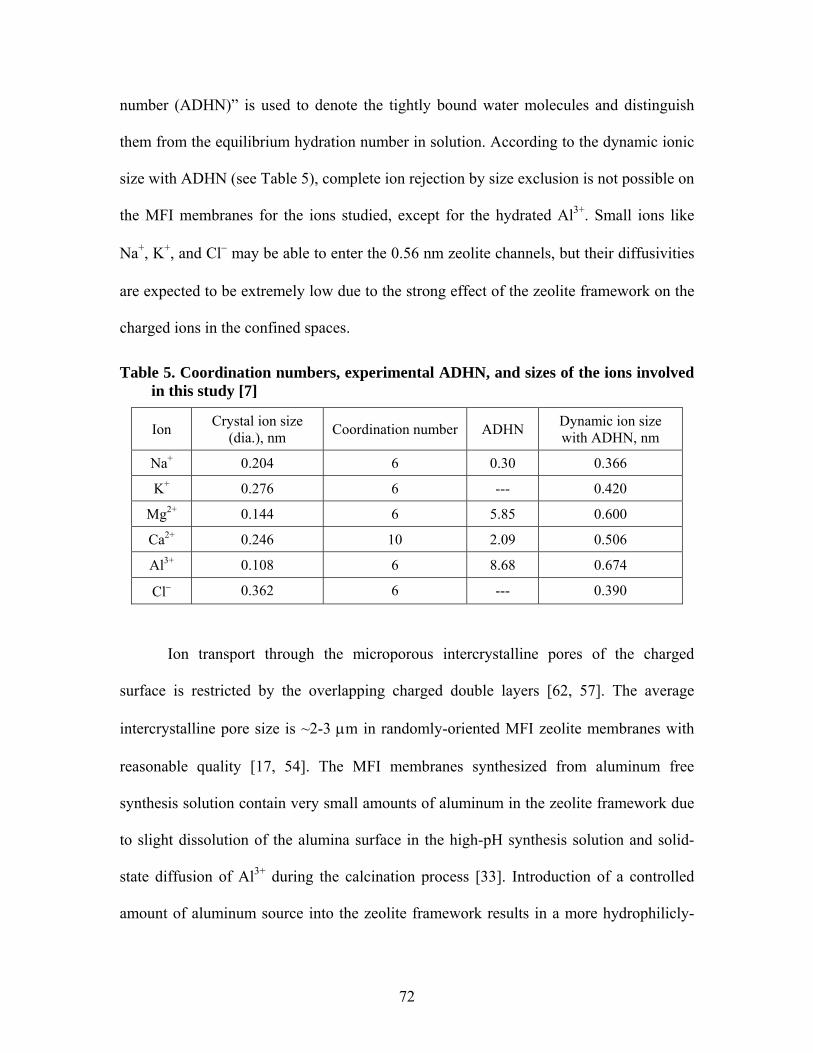
72
number (ADHN)” is used to denote the tightly bound water molecules and distinguish
them from the equilibrium hydration number in solution. According to the dynamic ionic
size with ADHN (see Table 5), complete ion rejection by size exclusion is not possible on
the MFI membranes for the ions studied, except for the hydrated Al3+. Small ions like
Na+, K+, and Cl− may be able to enter the 0.56 nm zeolite channels, but their diffusivities
are expected to be extremely low due to the strong effect of the zeolite framework on the
charged ions in the confined spaces.
Table 5. Coordination numbers, experimental ADHN, and sizes of the ions involved in this study [7]
Ion Crystal ion size (dia.), nm Coordination number ADHN Dynamic ion size
with ADHN, nm
Na+ 0.204 6 0.30 0.366
K+ 0.276 6 --- 0.420
Mg2+ 0.144 6 5.85 0.600
Ca2+ 0.246 10 2.09 0.506
Al3+ 0.108 6 8.68 0.674
Cl− 0.362 6 --- 0.390
Ion transport through the microporous intercrystalline pores of the charged
surface is restricted by the overlapping charged double layers [62, 57]. The average
intercrystalline pore size is ~2-3 μm in randomly-oriented MFI zeolite membranes with
reasonable quality [17, 54]. The MFI membranes synthesized from aluminum free
synthesis solution contain very small amounts of aluminum in the zeolite framework due
to slight dissolution of the alumina surface in the high-pH synthesis solution and solid-
state diffusion of Al3+ during the calcination process [33]. Introduction of a controlled
amount of aluminum source into the zeolite framework results in a more hydrophilicly-

73
charged surface, favorable for water permeation and ion exchange. The substitution of
Si4+ with Al3+ ions produces negative charges on the zeolite surface, which forms charged
double layers in the porous structure when contacting liquid water. For a specific
membrane, the ion rejection and water flux depend not only on the size and charge
density of the solute ion but also on the double layer thickness, which is a function of the
ionic strength and temperature of the aqueous solution [34].
The zeolite intracrystalline zeolitic pores and intercrystalline pores are parallel to
each other [73]. Water and ions can transport through both the zeolitic pores and the
intercrystalline gaps, with most ion permeation occurring through intercrystalline gaps.
Ion and water transport through intercrystalline and intracrystalline zeolite pores where
overlapping double layers exist is illustrated in Fig. 42.
Fig. 42. Schematic illustration of water and ion transport through the MFI zeolite membranes.
In summary, ion and water transport through molecular sieve zeolite membranes
is strongly dependent on operating pressure, feed ion concentration and solution chemical

74
compositions. Water flux of both single-salt solution and DI water increases linearly with
the increase of net driving force while the ion permeation is essentially independent on
the operating pressure, indicating desirable high hydraulic pressures for enhancement in
separation performance. Increasing feed ion concentration results in an exponential
increase of ion flux because both the driving force for ion transport and effective pore
size increases with increase of ion concentration due to the diminishing of the electric
double layer at increased ion concentration. Reverse osmosis permeation of 0.01 M NaCl
solutions in the presence of other multivalent ions indicated that counter-cations have
notable effects on water flux and Na+ rejection of zeolite membranes, whereas counter-
anions have minimal influence on the permeation and sodium ion retention. The drastic
decline in Na+ rejection and water flux in the presence of multivalent cations (eg. Ca2+
and Al3+) is explained by the surface adsorption of multivalent cations and the strong
screen effect on membrane surface charge.

75
7. EXPERIMENTAL STUY OF ION AND WATER FLUXES
THROUGH ZEOLITE MEMBRANES
Previous studies have indicated that zeolite membranes synthesized on α-alumina
substrate have a negatively charged surface via several mechanisms including ion
substitution in the zeolite framework during membrane synthesis [17], dissociation of
surface hydroxyl hydrogen [33], and/or ionization of surface hydroxyl groups [18]. When
in contact with liquid water or aqueous solutions, an electrically charged double layer
forms at the surface of the zeolite pore walls and restricts ion entrance and permeation, if
the double layers are thick enough to overlap at the pore opening. The thickness of the
double layer decreases with an increase in ion concentration or in the presence of the
membrane’s high-valence counter ions (ions with opposite charge as the membrane
surface) [19]. The electrostatic exclusion governing ion transport will therefore be
strongly dependent on the surface charge of zeolite and the chemistry of the feed
solution.
This section reports on project findings concerning the influence of counter-ions
on the permeation of NaCl solution when it is permeating through zeolite membranes.
Also, the contribution of operating pressure and ion concentration on the water flux and
overall ion rejection is investigated through RO permeation tests. The experimental work
and results described here will be field-tested using oilfield produced waters.
The ion permeation tests were performed with a crossflow RO permeation setup
described in our previous work, but modified to use a tubular separation cell machined in

76
our laboratory for the RO permeation tests. Figure 43 gives a schematic diagram of the
RO separation cell.
Fig. 43. Schematic diagram of separation cell for tubular membranes
The feed side was connected to a pressured solution tank with a volume of 2.4
liters and the desired transmembrane pressure was maintained by a high-pressure
nitrogen cylinder. A constant feed flow rate of 1.5 mL/min was controlled through a
needle valve located at the concentrate side. The permeate, defined as the solution
permeating through the zeolite membrane, was collected every 8 hr and stored at 5°C in a
refrigerator for further composition analysis by ion chromatograph. At these experimental
conditions, ion and water permeation reached stabilization in about 48 hr.
Prior to the experiments of RO separation on different salt solutions, the
permeation of DI water was tested first at increased operating pressure from 0.69 to 2.76
MPa. Reverse osmosis separations of NaCl solutions were performed with varying
operating pressures (0.69 – 2.76 Mpa) and salt concentrations (0.005 – 0.3 M). The NaCl
solutions with different concentrations were prepared by dissolving sodium chloride into
DI water. Each permeation test lasted for ~80 hr for achievement of stabilized water flux
and ion rejection. Both water flux (Jw) and ion rejection (ri) of a standard 0.01 M NaCl
solution were determined periodically throughout the permeation test to evaluate whether
Feed
Permeate O-ring
Nylon tube Tubular membrane
Concentrate

77
the properties of the membrane had changed due to fouling or were damaged in a
previous permeation test.
Figure 44 gives ion rejection and water flux of 0.01 M NaCl solution obtained at
different transmembrane pressures. The permeation performance of NaCl solutions at
varying salt concentration from 0.005 M to 0.3 M is shown in Fig. 45.
90
92
94
96
98
100
0 0.5 1 1.5 2 2.5 3
Operating pressure, MPa
r i, %
0.0
5.0
10.0
15.0
20.0
25.0
30.0
J w, m
ol/m
2 .h
Ion rejection
Water flux
Fig. 44. Effect of operating pressure on RO permeation of 0.01 M NaCl.

78
60
65
70
75
80
85
90
95
100
0.001 0.01 0.1 1
Ion concentration in feed, mol/L
r i, %
0
5
10
15
20
25
J w, m
ol/m
2 .h
Ion rejectionWater flux
Fig. 45. Influence of ion concentration on water flux and ion rejection (P=2.07 MPa).
A typical produced water sample contains high concentrations of NaCl and other
cations and anions such as K+, Ca2+, Mg2+, and SO42- [74]. The presence of these high
ions will show their influence on the separation efficacy. Therefore, we investigated how
the transport of Na+ in 0.01 M NaCl solution could be affected by the presence of other
counter-ions such as K+, Ca2+, and Al3+ and Cl- rejection in the presence of Br-, SO42-.
Six salt solutions were prepared by adding sodium chloride and another salt having the
same cation (Na+) or anion (Cl-) into DI water. Each solution was forced to flow through
the membrane surface and the permeate solutions were collected every 8 hr for water flux
and ion rejection measurement. The chemical composition of the six solutions and the
RO permeation results of these multicomponent solutions are given in Table 6. All
permeation tests were carried out at a transmembrane pressure of 2.07 MPa.
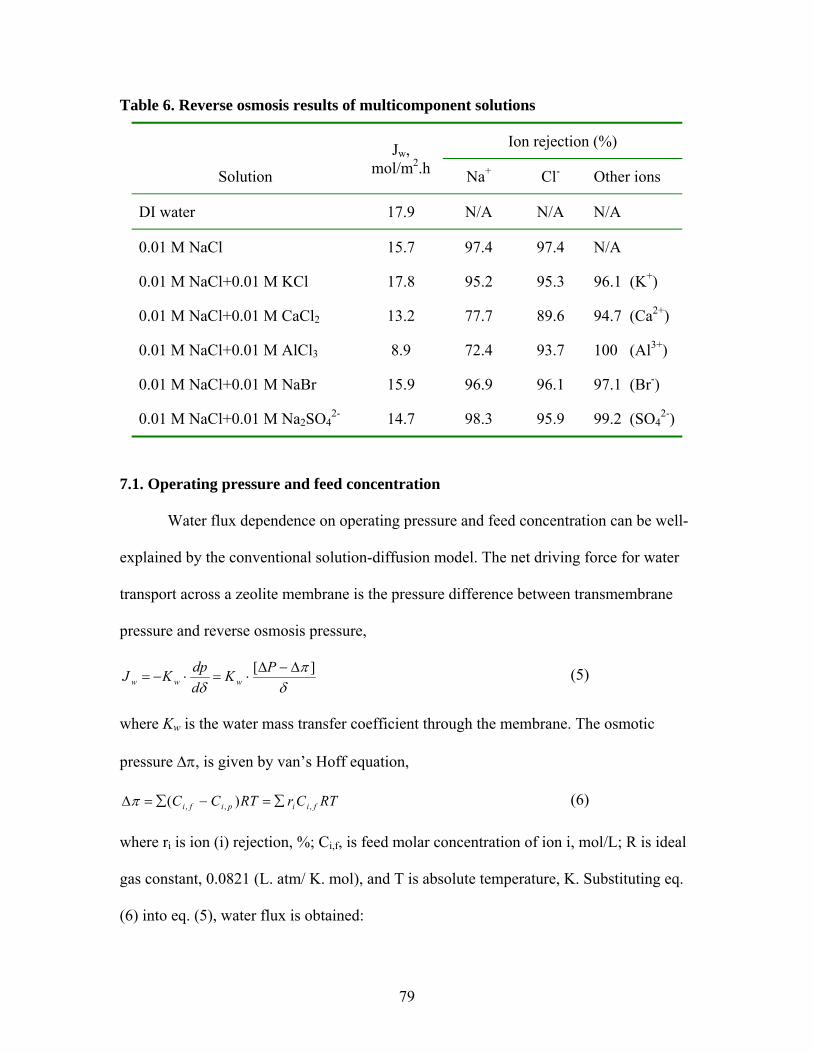
79
Table 6. Reverse osmosis results of multicomponent solutions
Jw, mol/m2.h
Ion rejection (%)
Solution Na+ Cl- Other ions
DI water 17.9 N/A N/A N/A
0.01 M NaCl 15.7 97.4 97.4 N/A
0.01 M NaCl+0.01 M KCl 17.8 95.2 95.3 96.1 (K+)
0.01 M NaCl+0.01 M CaCl2 13.2 77.7 89.6 94.7 (Ca2+)
0.01 M NaCl+0.01 M AlCl3 8.9 72.4 93.7 100 (Al3+)
0.01 M NaCl+0.01 M NaBr 15.9 96.9 96.1 97.1 (Br-)
0.01 M NaCl+0.01 M Na2SO42- 14.7 98.3 95.9 99.2 (SO4
2-)
7.1. Operating pressure and feed concentration
Water flux dependence on operating pressure and feed concentration can be well-
explained by the conventional solution-diffusion model. The net driving force for water
transport across a zeolite membrane is the pressure difference between transmembrane
pressure and reverse osmosis pressure,
δπ
δ][ Δ−Δ
⋅=⋅−=PK
ddpKJ www (5)
where Kw is the water mass transfer coefficient through the membrane. The osmotic
pressure Δπ, is given by van’s Hoff equation,
RTCrRTCC fiipifi ,,, )( ∑=−∑=Δπ (6)
where ri is ion (i) rejection, %; Ci,f, is feed molar concentration of ion i, mol/L; R is ideal
gas constant, 0.0821 (L. atm/ K. mol), and T is absolute temperature, K. Substituting eq.
(6) into eq. (5), water flux is obtained:
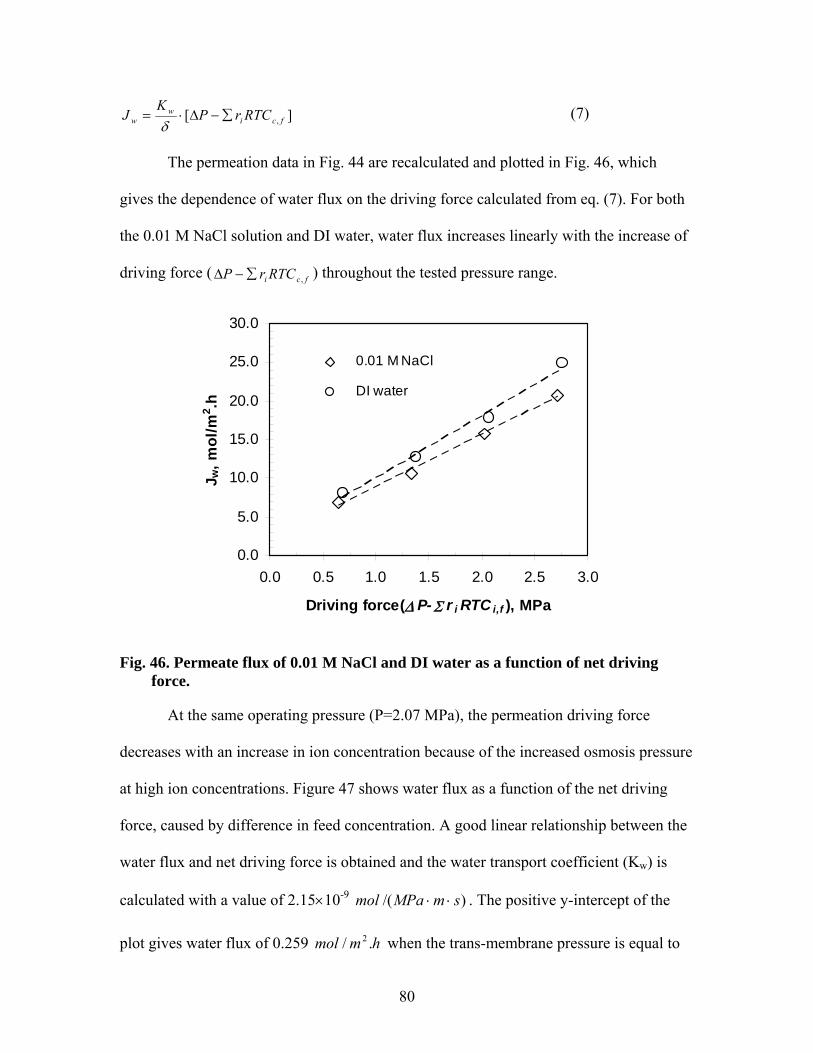
80
][ , fciw
w RTCrPK
J ∑−Δ⋅=δ
(7)
The permeation data in Fig. 44 are recalculated and plotted in Fig. 46, which
gives the dependence of water flux on the driving force calculated from eq. (7). For both
the 0.01 M NaCl solution and DI water, water flux increases linearly with the increase of
driving force ( fci RTCrP ,∑−Δ ) throughout the tested pressure range.
0.0
5.0
10.0
15.0
20.0
25.0
30.0
0.0 0.5 1.0 1.5 2.0 2.5 3.0
Driving force(Δ P- Σ r i RTC i,f ), MPa
J w, m
ol/m
2 .h
0.01 M NaCl
DI water
Fig. 46. Permeate flux of 0.01 M NaCl and DI water as a function of net driving force.
At the same operating pressure (P=2.07 MPa), the permeation driving force
decreases with an increase in ion concentration because of the increased osmosis pressure
at high ion concentrations. Figure 47 shows water flux as a function of the net driving
force, caused by difference in feed concentration. A good linear relationship between the
water flux and net driving force is obtained and the water transport coefficient (Kw) is
calculated with a value of 2.15×10⁻⁹ )/( smMPamol ⋅⋅ . The positive y-intercept of the
plot gives water flux of 0.259 hmmol ./ 2 when the trans-membrane pressure is equal to

81
the reverse osmosis pressure. Conventional RO theory suggests that no water flux exists
at zero net driving force [75]. The polycrystalline zeolite membranes contain both unique
zeolitic pores with uniform pore size of 0.56 nm and intercrystalline pores with a size
distribution ranging from subnanometer to a few nanometers [34]. A perfect zeolite
membrane (single crystal with only zeolitic pores) shows nearly 100% ion rejection, as
revealed by computer simulation [58]. However, a small amount of ions could leak from
the non-selective intercrystalline pores in real polycrystalline zeolite membranes during
RO permeation tests, resulting in water permeation at zero net driving force.
Jw= 7.728(Δ P-Σ r i RTC i,f ) + 0.259R2 = 0.9828
0
2
4
6
8
10
12
14
16
18
0.00 0.50 1.00 1.50 2.00 2.50
Driving force(Δ P-Σ r i RTC i,f ), MPa
J w, m
ol/m
2 .h
Fig. 47. Water flux of NaCl solutions as function of driving force, varying with ion concentration.
The concentration gradient across the membrane is the driving force for ion
permeation through zeolite membranes. Unlike the linear relationship for polymeric
membranes usually observed [75], ion flux in zeolite membranes increases exponentially
with the concentration gradient across the membrane, as shown in Fig. 48. Our previous
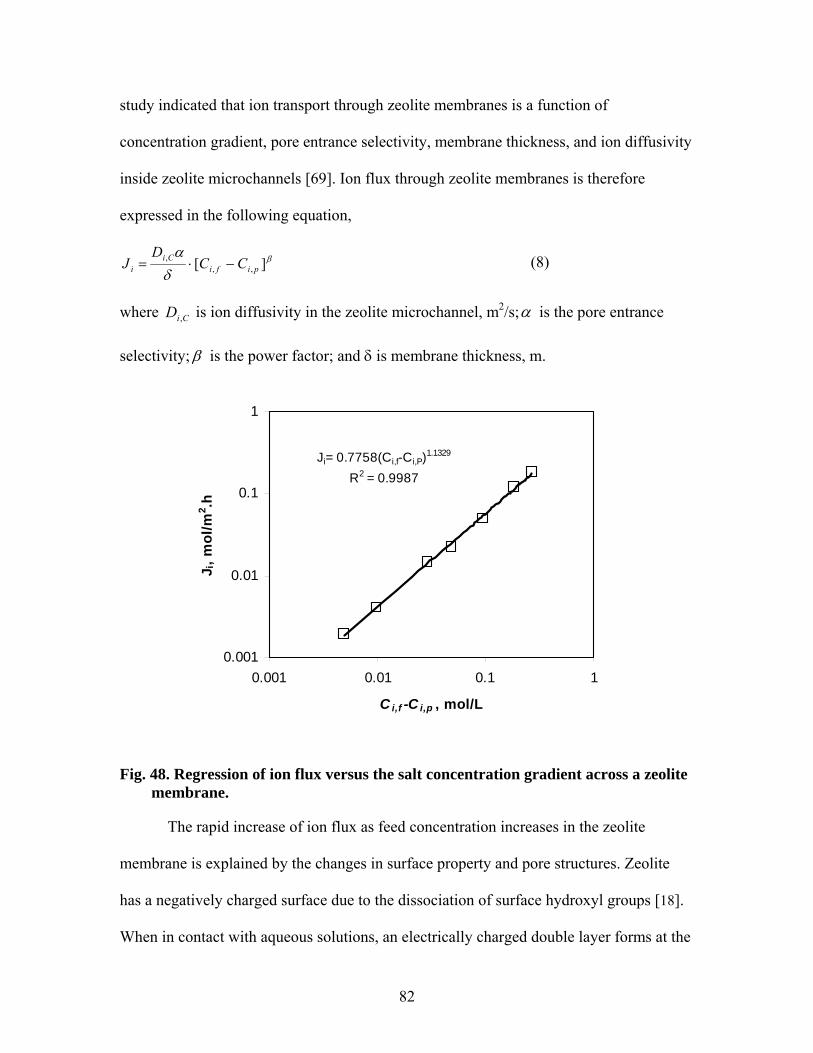
82
study indicated that ion transport through zeolite membranes is a function of
concentration gradient, pore entrance selectivity, membrane thickness, and ion diffusivity
inside zeolite microchannels [69]. Ion flux through zeolite membranes is therefore
expressed in the following equation,
β
δα
][ ,,,
pifiCi
i CCD
J −⋅= (8)
where CiD , is ion diffusivity in the zeolite microchannel, m2/s;α is the pore entrance
selectivity; β is the power factor; and δ is membrane thickness, m.
Ji= 0.7758(Ci,f-Ci,P)1.1329
R2 = 0.9987
0.001
0.01
0.1
1
0.001 0.01 0.1 1
C i,f -C i,p , mol/L
J i, m
ol/m
2 .h
Fig. 48. Regression of ion flux versus the salt concentration gradient across a zeolite membrane.
The rapid increase of ion flux as feed concentration increases in the zeolite
membrane is explained by the changes in surface property and pore structures. Zeolite
has a negatively charged surface due to the dissociation of surface hydroxyl groups [18].
When in contact with aqueous solutions, an electrically charged double layer forms at the

83
surface of the zeolite crystals. With increase in ion concentration, the double layer
shrinks due to the screening effect of counter ions on the surface charge [76], resulting in
an increase of the “effective” pore size for ion transport [77] and an exponential increase
in ion flux. Increasing operating pressure increases the ion rejection efficiency because
the water flux increases linearly with increase of operating pressure, while ion
permeation is only a function of feed concentration and is independent of the operating
pressure.
7.2. Influence of counter ions
Figure 49 gives the water flux of DI water and multicomponent solutions as a
function of the net driving force ( fci RTCrP ,∑−Δ ). Each solution contains equimolar
sodium chloride and another salt with identical co-anions or cations such as KCl, CaCl2,
AlCl3, NaBr, or Na2SO4. We choose K+, Ca2+, and SO42- as co-ions to study their
influences on the transport of NaCl because these ions are usually present in produced
water [74]. Other co-ions such as Br- and Al3+ were also studied for the comparison of the
ion valences. Remarkable changes in water flux are observed for the solutions having the
same anion but different cations such as NaCl/KCl, NaCl/CaCl2 and NaCl/AlCl3. The
different slope of water flux versus net driving force suggests that the water flux of
electrolyte solutions in zeolite membranes is also dependent on the solution chemistry.

84
0.0
2.0
4.0
6.0
8.0
10.0
12.0
14.0
16.0
18.0
20.0
1.90 1.92 1.94 1.96 1.98 2.00 2.02 2.04 2.06 2.08
Driving force(Δ P- Σ r i RTC i,f ), MPa
J w, m
ol/m
2 .h
Single saltco-anion
co-cation
0.01 M NaCl
DI water
NaCl/KClNaCl/NaBr
NaCl/Na2SO4
NaCl/CaCl2
NaCl/AlCl3
Fig. 49. Permeate flux of multicomponent solution as function of driving force.
In dilute solutions, the solvation of Na+ is independent of the solution chemistry
because the ion-ion interactions are negligible [7]. The Na+ and water mobility in the
zeolite microchannel should therefore be invariable in the presence of other counter-ions.
However, it was observed that both water flux and Na+ rejections in the multicomponent
solutions are strongly dependent on the counter-ions, as shown in Figs. 50–51. It is very
likely that the presence of other cations or anions in the NaCl solution changes the
surface charge or micropore structure of zeolite membranes, with the resulting variation
in water flux and Na+ rejection. The presence of the counter-anion (ions with a similar
charge to the membrane’s) in 0.01 M NaCl solution hardly affects the water flux, whereas
the presence of the counter-cation (Ca2+ and Al3+) results in a considerable decline in
water flux from 15.7 mol/m2.h for a single 0.01 M NaCl solution to 8.9 mol/m2.h for a
mixed-salt solution containing 0.01 M NaCl+0.01 M AlCl3. It is also observed that the
addition of KCl into 0.01 M NaCl solution results in a considerable increase of water flux
from 15.7 to 17.8 mol/m2.h. Apparently, decline in net operating pressure is not sufficient

85
to explain such a variation in water flux. Besides the dissociation of surface hydroxyl
groups, [18] atom substitution of Si4+ in zeolite framework by Al3+ from the dissolution
of α-alumina substrate in the strong basic synthesis solution also results formation of
charged surface [33]. When in contacting with electrolyte solution, cations will be
absorbed on the internal and external surfaces, resulting in a considerable decline in
effective pore size and decrease in water flux [69], while the anions (Br- and SO42-) show
minimum influence on water permeation. On the other hand, the transport of electrolyte
solution in microchannels with pore radii close to the MFI-type zeolite is not a single-file
movement [13], which means the water molecules overtake the ions in zeolite pores
during the permeation process. The water mobility in a zeolite-like microchannel is
therefore dependent on the ion mobility and ion-water bonding strength [14, 77]. As ion-
water bonding strength decreases, the water flux increase in an order of +3,AlwJ < +2,CawJ
< +NawJ , < +KwJ , .
0.0
5.0
10.0
15.0
20.0
25.0
Counter ion valence
J w, m
ol/m
2 .h
Co-anionCo-cation
0.01 MNaCl
K+
Al3+
Ca2+
SO42-
Br-
1 2 3
pure water flux
Fig. 50. Dependence of permeate water flux on counter-ions with different valences.

86
Simultaneously measured Na+ rejection as a function of counter-ions with
different valences is shown in Fig. 51. Similar to the influence of counter-ions on water
flux, only a minor variation of Na+ rejection is observed in the presence of counter-
anions. A considerable decline in Na+ rejection, from 97.4% to 72.4%, was observed
when high valence cation (Al3+) was present in the 0.01 M NaCl solution. This
observation is different with regard to the permeation of a single-salt solution, in which
salt rejection increases with increase of valence of both cation and anions.
50
60
70
80
90
100
Counter ion valence
Na+ re
ject
ion,
%
Co-anionCo-cation
K+
Al3+
Ca2+
SO42-Br-
1 2 3
0.01 MNaCl
Fig. 51. Dependence of Na+ rejection on counter-ions with different valences
High rejection of Na+ in the presence of the multivalent anion (SO42-) is explained
by the classical Donnan exclusion theory, which suggests that negatively-charged
membranes show higher ion rejection for those having an identical charge and higher
valence [78]. In the presence of multivalent cations (Ca2+, and Al3+), the charged double
layer diminishes to the “Helmholtz” layer because of the strong screening effect of
multivalent cations on the surface potential of zeolite membranes, resulting in the
87
opening of intercrystalline pores for small ion (i.e. Na+, dia. ~ 3.66 Å) transport.
However, for large multivalent cations (i.e. Ca2+, dia. ~ 5.06 Å, and Al3+, dia. ~6.74 Å)
[7], the openings of the intercrystalline pores are not sufficiently large for these ions to
enter and transport, leading to high ion rejection for the multivalent cations such as Ca2+
as well as Al3+.
Ion and water transport through molecular sieve zeolite membranes is strongly
dependent on operating pressure, feed ion concentration and solution chemical
compositions. Water flux of both single-salt solution and DI water increases linearly with
the increase of net driving force while the ion permeation is essentially independent on
the operating pressure, indicating desirable high hydraulic pressures for enhancement in
separation performance. Increasing feed ion concentration results in an exponential
increase of ion flux because both the driving force for ion transport and effective pore
size increases with increase of ion concentration due to diminishing of the electric double
layer at increased ion concentration.
Reverse osmosis permeation of 0.01 M NaCl solutions in the presence of other
multivalent ions indicated that counter-cations have notable effects on water flux and Na+
rejection of zeolite membranes whereas counter-anions have minimal influence on the
permeation and sodium ion retention. The drastic decline in Na+ rejection and water flux
in the presence of multivalent cations (eg. Ca2+ and Al3+) is explained by the surface
adsorption of multivalent cations and the strong screen effect on membrane surface
charge.
The results of this experiment suggest that MFI-type zeolite membranes can be
used for desalination of produced water and other radioactive wastewater in which

88
polymeric membranes cannot be applied. The presence of high valence cations will
reduce the ion rejection rate and also cause a decline in the water flux.

89
8. COMPETITIVE DIFFUSION OF ION/WATER THROUGH
ZEOLITE MEMBRANES
In this study, ion rejection and water flux of the alkali metal ions have been
measured through RO onto a good-quality silicalite membrane as a function of
temperature. The ion and water transport behavior in the MFI membrane are discussed
below, and the experimental data was used to develop a phenomenological mass transfer
model for the RO process. Chemicals used in this work include lithium chloride (LiCl)
(>99%, ACROS), sodium chloride (NaCl) (analytical reagent, Riedel-deHaen®),
potassium chloride (KCl) (‘Baker Analyzed’® reagent, J.T. Baker), rubidium chloride
(RbCl) (>99.0%, ACS reagent, ACROS), and cesium chloride (CsCl) (>99.0%, ACS
reagent, ACROS). All the metal chloride solutions used here have a concentration of
0.10M.
8.1. RO permeation tests of alkali metal ions
Reverse osmosis experiments were first carried out for 0.10 M LiCl solution in a
temperature range of 10 to 60°C to study the effect of temperature on ion and water
transport behavior. Li+ was used in the beginning instead of Na+ because the residual Na+
trapped in the membrane and support during the synthesis process was difficult to
remove. The same membrane was then used for RO experiments with 0.10 M single-salt
solutions of other alkali metal chlorides including NaCl, KCl, RbCl and CsCl at 50 °C.
The RO experiments for different ions were performed at 50°C so as to increase the
amount of permeate samples collected in 12 hr for more reliable IC analysis. Finally,
experiments for 0.10 M NaCl solution were conducted in a temperature range of 10 –
50°C on this membrane.

90
During the experiments, both cation and anion (Cl−) concentrations were
measured for the permeate solutions. The cation/anion molar ratio in the permeate
solution was found to be consistent with the stoichiometric ratio of the chlorides (M+:Cl-=
1:1), indicating cation-anion paired permeation through the membrane that maintained
the electrical neutrality. The concentration of the feed solution was treated as constant in
data processing because the permeate flow rate was less than 1.0% of the feed flow rate.
Table 7 summarizes the RO results for 0.10 M LiCl and 0.10 M NaCl single-salt
solutions at different temperatures. The experimental data for ion and water fluxes are
corrected by the volume porosity (φ=30%) of the substrate, i.e. )( tA
QJ
m Δ⋅⋅=
φ. Here, Q
is the quantity of water or ions collected in a time period of Δt; and Am is the
straightforward membrane area, m2. For both LiCl and NaCl solutions, raising
temperature increased the water and ion fluxes. The ion rejection rate, however, was only
slightly affected by temperature in the tested temperature range because the ion hydration
numbers do not vary much with a modest change of temperature [9].
Table 7. Water and ion fluxes and ion rejection by reverse osmosis on the MFI
zeolite membrane at applied trans-membrane pressure of 2.75 MPa
T, °C 0.10 M LiCl 0.10 M NaCl
ri, % FW,
mol·m-2·h-1 ri, %
FW, Mol·m-2·h-1
10 99.3 3.57 97.2 3.90
30 99.0 3.84 98.0 5.67
50 98.8 5.91 98.7 6.45
60 98.7 7.17

91
Figure 52 presents the ion rejection versus the crystallographic sizes of alkali
metal ions at 50°C, and Fig. 53 compares the water and cation fluxes for 0.10 M alkali
chloride solutions at the same temperature. The ion rejection decreased with increasing in
crystallographic ion size in the order of +++++ >>>>CsRbKNaLi
rrrrr . The ion flux
increased monotonically with ion crystallographic size from +LiF (4.26×10⁻⁴ mol/m2⋅h)
to +CsF (1.90×10⁻³ mol/m2⋅h). The water flux exhibited a trend of increasing, then
decreasing as a function of ion (size) in the solutions, with a maximum flux appearing for
the KCl solution.
90
91
92
93
94
95
96
97
98
99
100
0.6 0.8 1 1.2 1.4 1.6 1.8 2
Crystallographic radius, Angstrom
r i, %
Li+ Na+ K+ Rb+ Cs+
Fig. 52. Alkali ion rejection on the MFI-type zeolite membrane as a function of ion
size at 50°C.

92
0.0
5.0
10.0
15.0
20.0
25.0
30.0
35.0
0.6 0.8 1.0 1.2 1.4 1.6 1.8 2.0
Crystallographic radius of ion, Angstrom
F w, m
ol.m
-2.h
-1
0.0E+00
1.0E-03
2.0E-03
3.0E-03
4.0E-03
5.0E-03
Fi, m
ol.m
-2.h
-1
watersolute ion
Li+ Na+ K+ Rb+ Cs+
Fig. 53. Ion and water fluxes in 0.10 M alkali metal chloride solutions on the MFI
membrane as functions of ion size at 50 °C.
8.2. RO models for dilute ionic solutions
The water permeation through zeolite membranes can be obtained through the
classical solution-diffusion model. For dilute systems, RTnV ww =π , the water flux and
water diffusivity are given by
δπ
δ][
,
Δ−−⋅=⋅−= pf
wwDw
ppK
ddpKJ (9)
⎟⎟⎠
⎞⎜⎜⎝
⎛ −⋅⋅≈⋅⋅=
RTE
RTKVRTvKD DW
ww
wWw,0 exp)( (10)
where vw is the molar volume of water, m3/mol; fP and pP are operating pressures in the
feed and permeate sides respectively, Pa; Δπ is the osmotic pressure of the tested
93
solution, Pa; and DWE , is the overall activation energy for water permeation in zeolite
membranes, J/mol.
A three-step mass transfer model is proposed for ion transport through the zeolite
membrane, as depicted in Fig. 54. Step 1 is the entry of ions into zeolitic pores from the
bulk feed, assuming concentration polarization is negligible due to the low water flux;
Step 2 is the diffusion of ions from the feed-side end of the zeolite channel to the
permeate-side end; and Step 3 is the exit of ions from the zeolite channel to the permeate
stream. This model also assumes that ion leakage through the intercrystalline pores is
negligible for dilute solutions, because ion rejection at nanoscale intercrystalline pores is
well above 90%, and the area fraction of the intercrystalline pores is below 1% in a good-
quality MFI membrane. Obviously, the key to quantitative utilization of the proposed
model is the calculation of x1 and x2, the ion concentrations or mole fractions in the two
ends of a zeolite channel. The x1 and x2 values are different from those in the feed and
permeate solutions because of the selectivity at the zeolite pore openings [58, 78]. x2 can
be assumed to be the same as the composition in the permeate for a dilute feed. x1 can be
obtained in two different ways based on different ion-surface interactions: (1) inert
membrane surface as assumed in the MD simulations where x1 is determined by the
probability of ion-surface collision and success in entering the pores [79]; and (2)
electrostatic sorption of ions on the MFI surface (SiO2) [18, 80]. In the following
sections, phenomenological ion transport models will be derived for each mechanism.
The two models constructed for the two different mechanisms were found to have
identical mathematical form.

94
Fig. 54. Schematic showing the three-step molecular transport through a zeolitic channel.
(1) Inert zeolite surface and size-selectivity at zeolitic pores. In the first step of RO
permeation, hydrated ions first overcome the energy barrier at the zeolite pore entrance
and enter the zeolite channel. The energy barrier could be imposed by partial dehydration
of the hydrated ion upon collision at the pore entrance [78]. Thus, the rates of ions
entering the zeolite pores are dependent on the numbers and energy profiles of ion
molecules in the feed/zeolite interface zone. Also, to maintain electrical neutrality in the
zeolite and on the two sides of the membrane at steady state, a cation-anion coupled flow
is assumed. This assumption can be justified by experimental observation of the M+/Cl-
ratio in the permeate. The second step is the ion/water competitive molecular diffusion in
zeolite microchannels. The driving force for the ion diffusion is the ion concentration
gradient inside the channel, dx/dδ, rather than the straightforward chemical potential
gradient calculated from the concentration difference between the feed and the permeate
solutions, (Ci,f-Ci,p)/δ. The third step occurs when the molecules exit the channel to the
permeate solution. The mass transfer resistance of the third step is expected to be
insignificant compared to Steps 1 and 2 [81].

95
At the membrane/feed interface region, only those hydrated ions with energy
higher than the energy barrier at the pore entrance can enter the zeolite channel. The
number of ions with such high energy is given by ⎟⎠⎞
⎜⎝⎛ −
=RT
ECKn fii1
,10 exp according to
the Boltzmann distribution. Here, )( ,1 fiCK is the total number of ions in the interface
region and Ci,f is the feed concentration. E1 is the threshold energy. The frequency of ion
collision with the pore entrance depends on the energy of the ions; and thus can be
expressed by ⎟⎠⎞
⎜⎝⎛ −
=RTEff 2
0 exp , where 0f is the pre-exponential factor. E2 is the
average energy of the ions. Thus, the rate of ion entering the zeolite pores, Ji,1, can be
obtained by:
⎟⎠⎞
⎜⎝⎛ −
=⎟⎠⎞
⎜⎝⎛ +−
=
⋅⎥⎦
⎤⎢⎣
⎡⎟⎠⎞
⎜⎝⎛ −
⋅⎥⎦
⎤⎢⎣
⎡⎟⎠⎞
⎜⎝⎛ −
==
RTE
CKRT
EEfCK
RTEf
RTECKfnJ
fifi
fiii
3,
'1
210,1
20
1,1
01,
exp)(exp)(
expexp
η
ηη
(11)
where η is the probability for an ion to successfully enter the zeolite pores during a
collision; E3 = E1+E2; and '1K =K1f0η. Similarly, the rate of water molecules entering the
zeolite pores can be expressed by:
⎟⎠⎞
⎜⎝⎛ −
=RTECKJ ww
4'21, exp (12)
where Cw is the concentration of water (mol/m3); '
2K has the same physical meaning as
'1K ; and E4 is the energy for water molecules to enter the zeolite pores. For dilute
solutions, the ion concentration in the zeolite channel on the feedside:

96
⎟⎠⎞
⎜⎝⎛ −−
⋅⋅=≈RT
EEC
KK
CJJC fiwwifi)(
exp)/( 43,'
2
'1
1,1,', (13)
where Cw is the molar concentration of water (mol/m3). The selectivity of Step 1 is
defined as:
wfi
wi
f
wi
fffi CC
JJx
JJxx
xxxx
///
)1/()1/(
,
1,1,1,1,1111, ≈≈≈
−−
=α (14)
where xf is the mole fraction of ion in the feed solutions. Combining equations (12 ∼ 14),
one obtains the size- or shape-selectivity at the pore entrance 1,iα :
⎟⎠⎞
⎜⎝⎛ Δ−
⋅=RTEK wi
i/'
1, expα (15)
where the constant K’ = K1
’/K2’ and ΔEi/w = E3 – E4.
The ion transport rate in the zeolite channel (Step 2) can be described by the Fick’s law
equation:
δδ
',
',,0
,
'
,2, exp pificiCi
icii
CCRTE
DddCDJ
−⋅⎟⎟
⎠
⎞⎜⎜⎝
⎛ −== (16)
where δ is the length of the zeolite channel, which is approximated by the membrane
thickness, and Di,c is the ion diffusivity inside the zeolite channels. Because pifi CC ,, >> ,
it is reasonable to assume that fiC ,' >> '
, piC . Thus equation (16) is simplified as

97
δα
δ
ficii
fiwiciCiiii
CD
CRTEK
RTE
DJJJ
,,1,
,/',0,2,1, expexp
⋅⋅=
⎥⎥⎦
⎤
⎢⎢⎣
⎡⋅⎥
⎦
⎤⎢⎣
⎡⎟⎠⎞
⎜⎝⎛ Δ−
⋅⋅⎥⎦
⎤⎢⎣
⎡⎟⎟⎠
⎞⎜⎜⎝
⎛ −===
(17)
Equation (17) can be rearranged to be
⎥⎦
⎤⎢⎣
⎡⋅⎟
⎠⎞
⎜⎝⎛ Δ−
==δ
fiiii
CRT
EKFJ ,'0 exp (18)
which is the phenomenological equation for ion transport from the feed solution to the
permeate solution. Here, '0K is the overall mass transfer coefficient and ΔEi (=Ei,c+ΔEi/w)
is the overall activation energy of ion permeation.
(2) Ion sorption in zeolite. In this case, the second step of ion diffusion remains the same
as above:
)( ',
',
,, pifi
ciDi CC
DJ −⋅=
δ (19)
where δ is the length of the zeolite channel, and Di,c is the ion diffusivity inside the
zeolite channels.
Because of the limitation of the pore diameter of MFI zeolite (∼0.56 nm), the
electrostatic ion sorption interior zeolite pores cannot be multilayered. Therefore, the ion
surface coverage at the pore entrance ( fi,θ ) and at the end of the zeolite channel ( pi,θ ) are
expressed by the Langmuir equation:

98
fii
fii
MT
fifi CK
CKCC
,
,
,
',
, 1+==θ (20)
pii
pii
MT
pipi CK
CKCC
,
,
,
',
, 1+==θ (21)
where Ki represents the equilibrium constant of ions in bulk solution and inside zeolite
channel at the interface of the membrane. fiC , and piC , are the feed and permeate
concentrations respectively, mol/m3. Thus, ', fiC and '
, piC can be obtained. Substitution for
', fiC and '
, piC in equation (19) gives
)11
(,
,,
,
,,,,
pii
piiMT
fii
fiiMTciDi CK
CKCCKCKCD
J+
−+
⋅=δ (22)
MTC , is a coefficient relating to vacancy concentration in zeolite channels that can be
occupied by water, ion or other organic molecules, mol/m3. In dilute solutions, Henry’s
law is assumed to be valid, giving 1, <<fiiCK and 1, <<piiCK . Together with the
assumption of fiC ,' >> '
, piC , equation (22) is simplified to
δfi
ciMTiDi
CDCKJ ,
,,, )( ⋅⋅⋅= (23)
Equations (23) and (17) have identical mathematic forms if MTii CK ,1, =α . The
dynamics of ions to enter the zeolite pores or the behavior of ion sorption in the pure

99
silicalite is currently not clear. However, if Step 1 predominates in the overall RO
rejection, the ion diffusivity in the zeolite channels (Di,c) can be estimated by either
equation (17) or equation (23) with the same results. According to the MD simulation
[58], rejection of small ions (e.g. Na+) on small pore zeolite membranes (e.g. ZK-4) is
primarily controlled by size selectivity at the pore entrance. Although MD simulation has
also indicated that single-file diffusion cannot be observed in idealized zeolite-like
channels with subnanometer sizes [10], it is difficult, if not impossible, for water
molecules and hydrated ions to pass by each other in the MFI zeolite channels because of
the space confinement and interactions between ion and channel wall. Thus, we assume
αi,1 ≈ [Ci,p/Ci,f] in the estimation of ion diffusivity in the zeolite channels using equation
(17).
8.3. Activation energy
Figure 55 shows the Arrhenius plots of ion fluxes during the RO process. The
overall activation energies for permeation of Li+ ( +ΔLi
E ) and Na+ ( +ΔNa
E ) were 20.11
kJ/mol and 13.21 kJ/mol, respectively, as obtained from the slopes of the lines. Assuming
that step 1 predominates the overall RO rejection, i.e. αι,1≈[Ci,p/Ci,f], ion diffusivities in
the zeolite channels, Di,c, are calculated using equations (13-18) for Li+ and Na+ at
different temperatures. The results are presented in Fig. 56. The CLi
E,+ and
CNaE
,+ are
estimated to be 11.23 kJ/mol and 9.57 kJ/mol, respectively. Thus, the energies required
for Li+ (wLiE /+Δ ) and Na+ (
wNaE /+Δ ) to enter the zeolite pores are estimated to be 8.88
kJ/mol and 3.64 kJ/mol, respectively.

100
-9.0
-8.5
-8.0
-7.5
-7.0
-6.5
-6.0
0.00034 0.00036 0.00038 0.00040 0.00042 0.00044
1/RT
ln(F
i)Li+
Na+
Fig. 55. Arrhenius plots of the ion fluxes for 0.10 M LiCl and 0.10 M NaCl solutions.
-30.0
-29.6
-29.2
-28.8
-28.4
-28.0
0.00034 0.00036 0.00038 0.0004 0.00042 0.00044
1/RT
ln(D
i,C)
Li+
Na+
Fig. 56. Arrhenius plots of ion diffusivities in the zeolite channel.
101
The overall activation energy for Li+ permeation, +ΔLi
E , was much greater than
+Δ NaE because the charge density of Li+ is higher than that of Na+. The dynamic size and
dehydration energy of a hydrated ion increase with its electrical charge density [9]. As
the ratio of the effective molecular dynamic size to the pore size increases, higher
activation energies are needed for the molecule to enter and transport in subnanometer
pores [78]. Hydrated ions with large sizes may enter pores of similar or smaller sizes by
partial dehydration during collision processes [78]. The stronger bonding between Li+
and water molecules in the hydration shell [8] requires higher energy for dehydration
when entering the zeolite pores [82]. On the other hand, for small ions like Li+ and Na+,
which tend to stay in the center of the uncharged cylindrical channel in liquid water [10],
a higher charge density results in a stronger attraction to the zeolite pore wall with
oxygen atoms on the surface that decreases the ion mobility [82].
8.4. Diffusivities of ion and water in zeolite membranes
The effective water diffusivities ( WK ) in zeolite membranes were calculated from
the permeation data by means of equations (9) and (10). At the assumption of step 1
predominating the overall RO rejection, the pore entrance selectivity, 1,iα , is obtained
from the rejection data by equation αi,1 ≈ [Ci,p/Ci,f]. The effective diffusion coefficients
( CiD , ) of alkali ions inside silicalite channel at 50 °C are, therefore, calculated from
Equation (23) (Table 8).

102
Table 8. Effective diffusivities of alkali metal ions and water in the zeolite pores at 50°C
Ion Effective diffusivity Pore entrance
selectivity, 1,iα Ion ( CiD , , m2/s) Water ( WK , m2/s)
Li+ 2.96×10⁻¹³ 1.77×10⁻¹¹ 0.012 Na+ 3.23×10⁻¹³ 1.93×10⁻¹¹ 0.013 K+ 4.48×10⁻¹³ 2.68×10⁻¹¹ 0.019 Rb+ 3.44×10⁻¹³ 2.06×10⁻¹¹ 0.025 Cs+ 3.11×10⁻¹³ 1.86×10⁻¹¹ 0.051
The zeolite pore entrance selectivity ( 1,iα ) varied from 0.012 for Li+ to 0.051 for
Cs+. The pore entrance selectivity is caused by the difference between the configurational
entropy inside the pore and in the free solution. The variation of pore entrance selectivity
for different alkali metal ions is attributed to the effective size of hydrated ions and the
interaction between the ions and the zeolite pore wall. For small ions, such as Li+, the
entry of an ion into a zeolite microchannel is restricted by its large dynamic size due to
strong hydration. The large ions, such as Rb+ and Cs+, are more readily dehydrated but
have stronger interaction with the pore wall surface, resulting higher entropy variation for
ion entry from bulk solution into the zeolite cavity [7, 11].
The diffusivities of the alkali metal ions in the zeolite channels at 50°C and the
apparent diffusivities of water in the zeolite membranes during RO are replotted as a
function of ion crystallographic size in Fig. 57.

103
1.0E-11
1.5E-11
2.0E-11
2.5E-11
3.0E-11
0.6 0.8 1.0 1.2 1.4 1.6 1.8 2.0
Crystallographic size of ion, Angstrom
Wat
er d
iffus
ivity
, m2 /s
1.0E-13
3.0E-13
5.0E-13
7.0E-13
9.0E-13
Ion
diffu
sivi
ty, m
2 /s
WaterIon
Li+ Na+ K+ Rb+ Cs+
Fig. 57. Effective ion/water diffusivities of alkali metal ions inside MFI zeolite microchannel (T=50°C).
Rather than a monotonic decrease with ion crystallographic size as observed in
bulk solutions [63] and uncharged smooth channels [10], the water diffusivities inside the
zeolite channels rise to a maximum at K+ with ion crystallographic size. Such a water
permeation behavior in the zeolite membrane is explained by the polarization effect of
ions and ion–zeolite interaction. As the size of alkali metal ions increases from Li+ to Na+
to K+, the ion charge center becomes more distant from the surrounding water molecules,
resulting in weaker interactions between charged ions and the bound water, thus
increasing the water diffusivity. The large ions, such as Rb+ and Cs+, might have stronger
interaction with zeolite pore wall as observed in the uncharged cylindrical pores [10],
thus inhibiting the movement of water molecules. The variation of water diffusivities in
the alkali metal solutions followed the same trend as the cation diffusivities. This
indicates that, although single-file movement is unlikely to occur in zeolite channels for

104
the present system, transport of water molecules is strongly affected by the mobility of
ions in the solution.
8.5. Influence of dissolved organics on RO performance of zeolite membranes
Dissolved organics are major problems encountered in wastewater treatment by
RO membrane technology due to membrane degradation, fouling and strong membrane-
organic solute interactions [1, 2]. The dissolved organics in produced water such as fatty
acid and low molecule aramatic organics (benzene, toluene and xylene) [83] might show
influence on separation performance of zeolite membrane due to their strong adsorption
[84]. The influence of dissolved organics on the RO performance of the zeolite
membrane were investigated through permeation tests of DI water, 0.10 M NaCl solution,
500 ppm toluene solution and ion-organic-water system (0.10 M NaCl+500 ppm
toluene). The mathematical model for water and ion transport in zeolite membrane was
modified for depicting the more complicated solution with existence of dissolved
organics.
8.5.1 Separation of organic-ion-water system by zeolite membrane
Permeation of DI water on the zeolite membrane was first carried out to study the
water permeation without salt and organics. Then, RO separation tests on single-
component solutions of 0.10 M NaCl solution and 500 ppm toluene solution were
performed respectively. Finally, a binary solution containing 0.10 M NaCl and 500 ppm
dissolved toluene was permeated through the zeolite membrane and rejection of both Na+
and toluene were tested by measuring their concentration changes in the feed and
permeate solutions. The toluene concentration in the permeate was analyzed by total
organic carbon analyzer (TOC-VCPN) and ion concentrations were analyzed by IC and
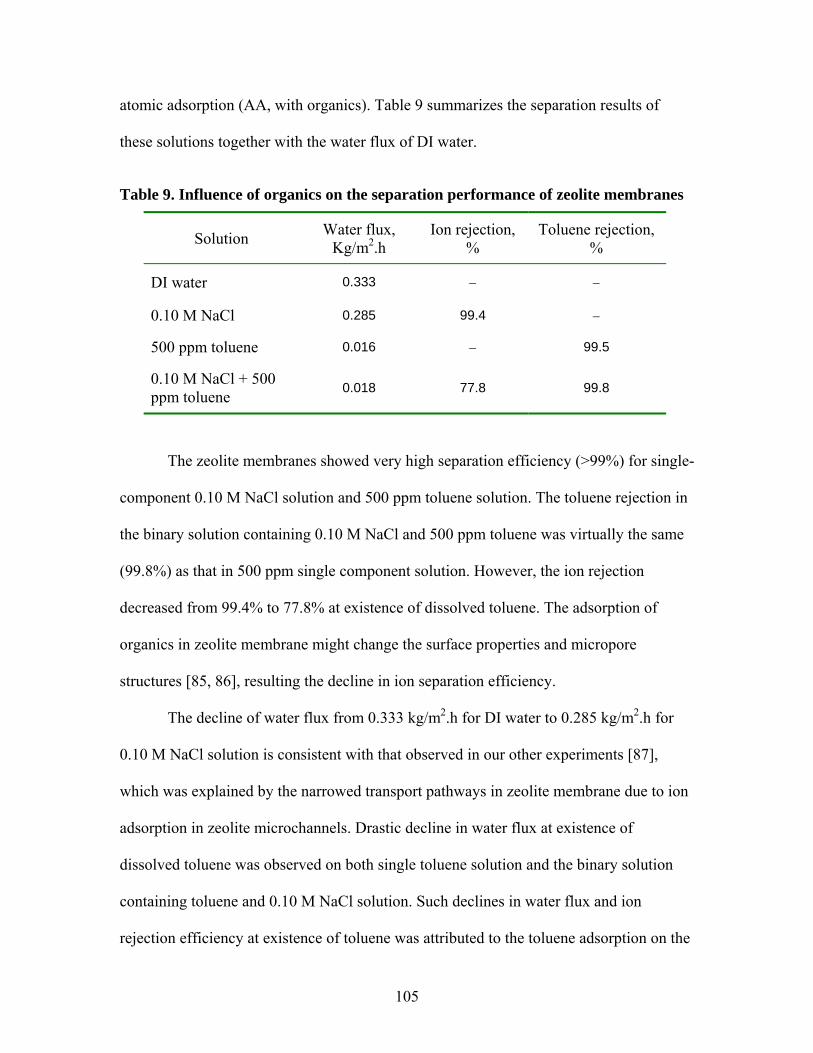
105
atomic adsorption (AA, with organics). Table 9 summarizes the separation results of
these solutions together with the water flux of DI water.
Table 9. Influence of organics on the separation performance of zeolite membranes
Solution Water flux, Kg/m2.h
Ion rejection, %
Toluene rejection, %
DI water 0.333 − −
0.10 M NaCl 0.285 99.4 −
500 ppm toluene 0.016 − 99.5
0.10 M NaCl + 500 ppm toluene 0.018 77.8 99.8
The zeolite membranes showed very high separation efficiency (>99%) for single-
component 0.10 M NaCl solution and 500 ppm toluene solution. The toluene rejection in
the binary solution containing 0.10 M NaCl and 500 ppm toluene was virtually the same
(99.8%) as that in 500 ppm single component solution. However, the ion rejection
decreased from 99.4% to 77.8% at existence of dissolved toluene. The adsorption of
organics in zeolite membrane might change the surface properties and micropore
structures [85, 86], resulting the decline in ion separation efficiency.
The decline of water flux from 0.333 kg/m2.h for DI water to 0.285 kg/m2.h for
0.10 M NaCl solution is consistent with that observed in our other experiments [87],
which was explained by the narrowed transport pathways in zeolite membrane due to ion
adsorption in zeolite microchannels. Drastic decline in water flux at existence of
dissolved toluene was observed on both single toluene solution and the binary solution
containing toluene and 0.10 M NaCl solution. Such declines in water flux and ion
rejection efficiency at existence of toluene was attributed to the toluene adsorption on the

106
zeolite surface that reduced the hydrophilicity of the membrane surface and effective
zeolite pore size.
8.5.2 Modified mathematical model for dilute organic-ion-water system
It was assumed that water flux decline at existence of organics on zeolite
membrane was mainly caused by reduced mass transport pathways. Quantitatively
analyzing the interaction between organic and zeolite surface is important for
understanding RO performance of membranes in the presence of dissolved organics. In
this case, the ion-sorption diffusion model presented in the previous chapter was
modified for application in dilute organic-ion-water system.
We assume both ion and hydrocarbons (HC) transport in zeolite membrane
through a sorption-diffusion mechanism. The driving force for ion and hydrocarbon
migration is the surface coverage of adsorbed molecules. For the same reason of space
confinement by zeolite micropores, the hydrocarbon surface coverage at the pore
entrance ( fHC ,θ ) and at the end of the zeolite channel ( pHC ,θ ) are expressed by the
Langmuir equation:
fHCHC
fHCHC
MT
fHCfHC CK
CKCC
,
,
,
',
, 1+==θ (24)
pHCHC
pHCHC
MT
pHCpHC CK
CKCC
,
,
,
',
, 1+==θ (25)
where KHC represents the equilibrium constant of dissolved hydrocarbons in bulk solution
and inside zeolite channel at the interface of the membrane. fHCC , and pHCC , are the feed

107
and permeate concentrations respectively, mol/m3. The flux of hydrocarbons through
zeolite membranes during RO permeation has a similar mathematical expression as that
of ion flux, shown in equation (22):
)11
(,
,,
,
,,,,
pHCHC
pHCHCMT
fHCHC
fHCHCMTcHCDHC CK
CKCCKCKCD
J+
−+
⋅=δ (26)
The effective zeolite pores for mass transport are partially occupied by ion
adsorption ( fi,θ ) and organic adsorption ( fHC ,θ ). Thus, the fraction of free zeolite
channels for water transport (ε) is,
fHCfi ,,1 θθε −−= (27)
The water flux is, therefore, obtained from the equations (12) and (13),
)()11
1(
)()1(
,
,
,
,
,,
πδ
δπθθ
Δ−Δ+
−+
−=
Δ−Δ−−=
PRTD
CKCK
CKCK
PRTD
J
w
fHCHC
fHCHC
fii
fii
wfHCfiw
(28)
The parameter of water diffusivity (Dw) can be determined from permeation data
of DI water ( 0, =fiθ and 0, =fHCθ ). Adsorption equilibrium constant Ki and KHC were
further obtained from the water flux of single component solutions. All the parameters
were calculated from permeation data shown in Table 9 and equation (28) and are listed
in Table 10.

108
Table 10. Parameters of water permeation in an organic-ion-water system
Dw, m2/s +NaiK , KHC, toluene
Parameters 4.62×10⁻¹¹ 0.6 4200.2
The adsorption equilibrium constant of hydrocarbon (KHC) is much larger than
that for the ions (Ki) because the former have much stronger interaction with the zeolite
surface, resulting in a significant decline in water flux.
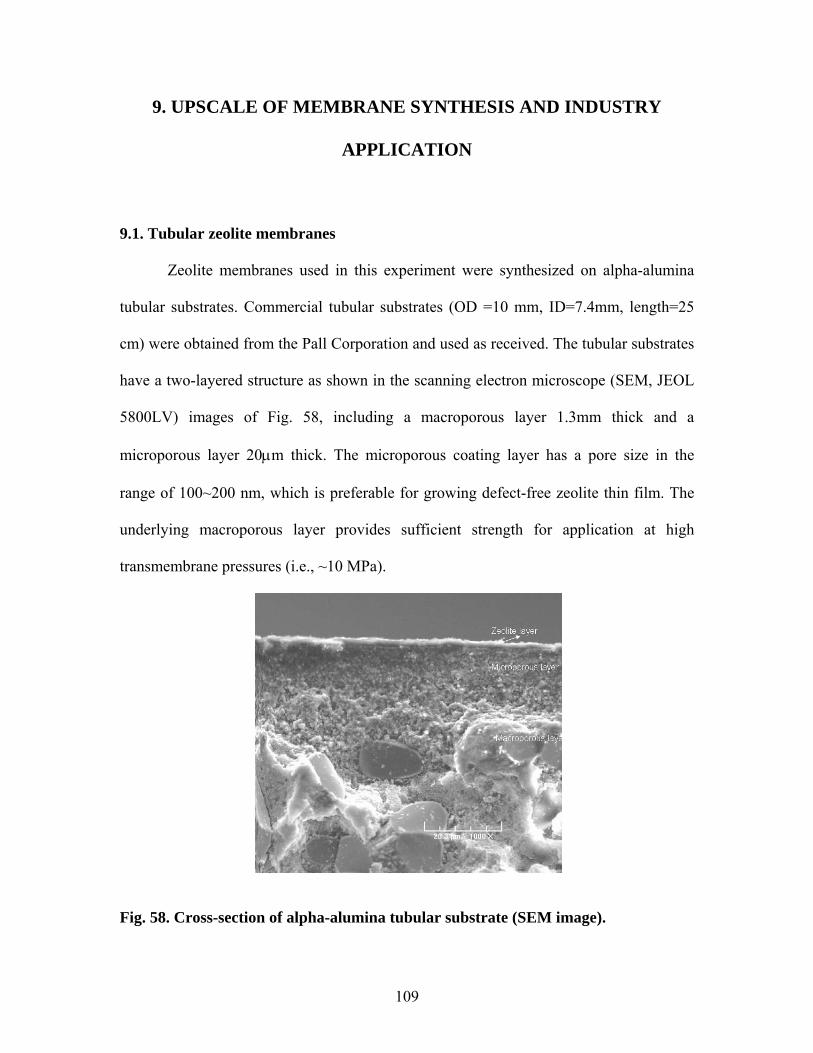
109
9. UPSCALE OF MEMBRANE SYNTHESIS AND INDUSTRY
APPLICATION
9.1. Tubular zeolite membranes
Zeolite membranes used in this experiment were synthesized on alpha-alumina
tubular substrates. Commercial tubular substrates (OD =10 mm, ID=7.4mm, length=25
cm) were obtained from the Pall Corporation and used as received. The tubular substrates
have a two-layered structure as shown in the scanning electron microscope (SEM, JEOL
5800LV) images of Fig. 58, including a macroporous layer 1.3mm thick and a
microporous layer 20μm thick. The microporous coating layer has a pore size in the
range of 100~200 nm, which is preferable for growing defect-free zeolite thin film. The
underlying macroporous layer provides sufficient strength for application at high
transmembrane pressures (i.e., ~10 MPa).
Fig. 58. Cross-section of alpha-alumina tubular substrate (SEM image).

110
A two-step crystallization was optimized for high-quality membrane fabrication.
Differing from conventional secondary growth, in-situ crystallization was used to form a
thin zeolite layer on substrate. The followed secondary growth in a synthesis solution
without an organic template will further form a permselective zeolite thin layer. The first
step of hydrothermal crystallization was carried out at 80°C by using a solution
containing 1.08 g NaOH, 15 g fumed SiO2, and 75 ml 1.0 M TPAOH. The crystallization
was carried out at 180°C for 10 hr by rotating the autoclave at constant rate of 1.5
rad/min. After washing, drying and sintering at 500°C, the second step of hydrothermal
synthesis was carried out to grow zeolite crystals into a permselective ZSM-5 layer. The
synthesis solution for the second step was prepared by dissolving silica colloid (30%,
Aldrich), NaOH pellets, aluminum sulfate and deionized water in a Teflon beaker with a
molar ratio of 1.0 SiO2: 41.5 H2O: 0.38 NaOH: 0.04Al2O3.
The rotating synthesis process was described in the previous chapters. The lab-
constructed hydrothermal synthesis equipment is shown in Fig. 59. Constant rotating is
necessary to synthesize a thin and defect-free zeolite film on a porous support. As shown
in Fig. 60, a stainless steel autoclave with Teflon liner was designed for membrane
synthesis, which was carried out at hydrothermal condition of 180°C and vapor pressure
of 1.0MPa.

111
Fig. 59. . Lab-constructed rotating equipment for tubular membrane synthesis.
Fig. 60. Teflon-lined stainless steel autoclave for tubular membrane synthesis.
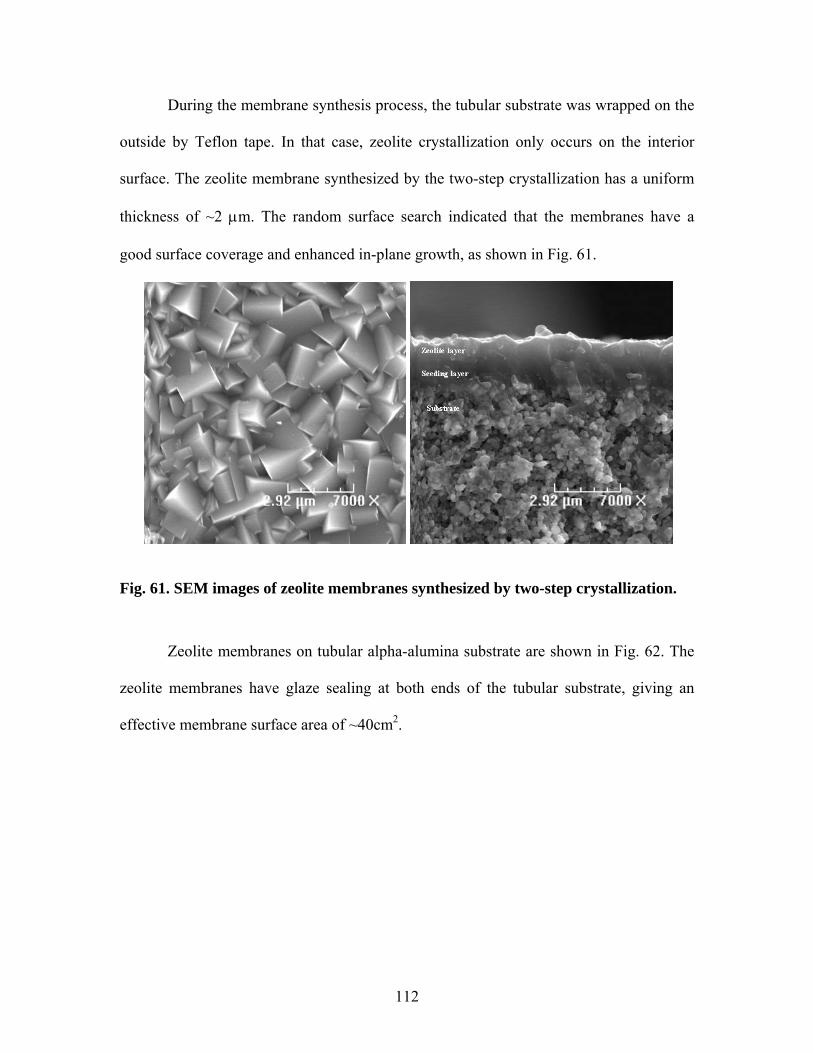
112
During the membrane synthesis process, the tubular substrate was wrapped on the
outside by Teflon tape. In that case, zeolite crystallization only occurs on the interior
surface. The zeolite membrane synthesized by the two-step crystallization has a uniform
thickness of ~2 μm. The random surface search indicated that the membranes have a
good surface coverage and enhanced in-plane growth, as shown in Fig. 61.
Fig. 61. SEM images of zeolite membranes synthesized by two-step crystallization.
Zeolite membranes on tubular alpha-alumina substrate are shown in Fig. 62. The
zeolite membranes have glaze sealing at both ends of the tubular substrate, giving an
effective membrane surface area of ~40cm2.

113
Fig. 62. Tubular zeolite membranes synthesized on commercial alpha-alumina substrate for produced water desalination.
9.2. Scale-up of zeolite membranes and desalination demonstration
To investigate reproducibility, about 80 long-tube zeolite membranes were
synthesized by the two-step hydrothermal crystallization. Each individual zeolite
membrane was tested for RO permeation on 0.1 M NaCl solution. The tubular zeolite
membrane was mounted in a Nylon RO cell in which both ends of the membranes were
sealed by O-rings. All the membranes were tested under transmembrane pressure of 3.5
MPa. The water flow rate across the surface of zeolite membrane was adjusted to above
1.0 mL/min by a needle valve located at the concentrate side. The permeate, defined as
the solution transport across the membrane, was collected every 12 hr and stored at 5°C
for further composition analysis. Ion rejection and water flux of each zeolite membrane
were obtained from the RO permeation tests. Figure 63 summarizes the reverse osmosis
permeation behavior of zeolite membranes synthesized by two-step crystallization.

114
0
20
40
60
80
100
120
0 1 2 3 4 5 6 7 8 9 10 11
Water flux, kg/m2.h
Ion
reje
ctio
n, %
0.1M NaCl
Fig. 63. Summary of RO separation performance of zeolite membranes synthesized by two-step hydrothermal crystallization.
Among the 80 tubular zeolite membranes synthesized with two-step hydrothermal
crystallization, 73 zeolite membranes have ion rejection >95%. Four zeolite membranes
have ion rejection between 85% and 95%. Three zeolite membranes have low ion
rejection with values < 85%. The overall RO performance of the ZSM-5 membranes was
investigated by assembling the tubular zeolite membranes into multichannel RO
separation cells and testing for cross-flow permeation, as shown in Fig. 64. The 0.10M
NaCl solution was pumped through zeolite membrane by a pump (Triplex Cat Pump)
with a flow rate of 3.78 L/min. Both the concentrate and the permeate solution are
collected and sent back to the feed tank to maintain a constant feed concentration.

115
Fig. 64. Schematic diagram of RO demonstration.
9.3. Membrane modules
The process of produced water desalination by tubular zeolite membranes
includes a feed stream sweeping across the interior surface of the zeolite membrane and
clean water permeating across the membrane under transmembrane pressure. A multiple
tube vessel was thus designed for achieving the separation objective. The RO separation
vessel has a cylindrical multichannel body and tubular zeolite membranes. The tubular
zeolite membranes are fixed into the pipes in the cylindrical vessel body by O-ring
sealing at both ends. The inside diameter of the module device is 1.0 mm larger than the
outside diameter of the tubular zeolite membranes, providing a gap between the inner
surfaces of the module and outside surface of the zeolite membrane for permeate

116
collection. Figure 65 gives the drawing of a module device together with a tubular zeolite
membrane.
Fig. 65. Schematic diagram of multichannel membrane vessel.
The inlet and outlet are connected to the interior space of the zeolite membranes
in which fluid sweeps across the membrane surface. The permeate side is connected to a
small area between the membranes’ outside surface and the vessel body wall, which is
separated from the feed stream by O-rings at both ends of the membrane. Under
hydrostatic transmembrane pressure, water transports across the zeolite membrane and
accumulates in the permeate side while large ions and organic species are excluded. The
material for preparation of the module body is nylon which shows sufficient strength for
operating at high pressure and chemical stability in produced water environment. Figures
66 and 67 show the side and top view of the zeolite membrane module.

117
Fig. 66. Side view of separation module with and without inserting zeolite membranes.
Fig. 67. Top view of separation module with and without inserting zeolite membranes.

118
9.4. Reverse osmosis desalination unit
A reverse osmosis desalination unit with cross-flow configuration was assembled
for testing produced water desalination. Each multichannel vessel with tubular zeolite
membranes was tested individually for leakage and separation performance evaluation.
The RO separation cells were assembled in parallel so that feed water flowed across the
interior surface and the permeate could be collected together for an overall evaluation. A
back pressure controller was deployed to maintain constant transmembrane pressure. A
bypass loop was used to control the water flow rate on the surface of zeolite membranes.
Both water flow rate and the transmembrane pressure were carefully monitored by digital
flow meter and pressure sensor. The permeate was collected through a sample bottle
connecting to the gas phase of a water flask. Purified water collected over a specific
period of time was weighted for flux measurement and a small amount of purified water
sample was diluted to appropriate concentrations (~0.0025 M) and analyzed by IC.
The demonstration unit was constructed in a trailer with dimension of 36 in. ×25
in. ×36 in. A Triplex pump with a flow rate of 3.78 L/min was used to drive the
desalination process. Figure 68 shows the reverse osmosis zeolite membrane unit. The
overall zeolite membrane area is ~0.3 m2. The reverse osmosis demonstration gave an ion
rejection of 96.9% and water flux of 2.23 kg/m2.h for 0.1M NaCl solution at an operating
pressure of 3.5 MPa.

119
Feed water
Water pump
RO unit
Fig. 68. Desalination demonstration of zeolite RO membranes.

120
10. LONG-TERM DESALINATION OF PRODUCED WATER BY
ZEOLITE MEMBRANES
The purpose of long-term reverse osmosis desalination of produced water by
zeolite membrane is to evaluate the membrane stability and potential fouling caused by
dissolved organics and scale precipitation. An actual coalbed methane produced water
from the San Juan Basin was used in the long-term permeation test. The desalination test
was carried out at ambient temperature and transmembrane pressure of 500Psi. Both
water flux and ion rejection were recorded every 12 hr. The foulants formed on the
membrane surface were studied by scanning electron microscopy (SEM) with an EDS.
To unravel the mechanisms of organic fouling and chemical regeneration, fouling
experiments were performed with organics that simulate organic species in produced
water, such as fatty acid, phenol, and toluene solutions. The cleaning experiments for
membrane regeneration after organic fouling were performed with diluted H2O2 solution
under specified experimental conditions.
The water samples were diluted to desirable concentrations (~50 mg/L) and
manually injected for cation and anion analysis. A sterilizing filter (0.2μm, Fisher) was
deployed to remove any suspended particulates before the IC analysis. Concentrations of
dissolved organics were represented by the TOC and analyzed by a TOC analyzer
(Shimadzu, TOC-V). Particle size distribution of the produced water was analyzed by
dynamic light scattering particle analyzer (Nanotrac NPA 150). Metal ions were analyzed
by the flame atomic absorption (Varian Model 110). The surface properties of zeolite

121
membrane after oxidative treatment with H2O2 solution was studied by XPS together with
FTIR (Kratos Axis Ultra spectrometer).
10.1. Chemistry of produced water
The CBM produced water used in this study has a total dissolved solid (TDS) of
2.17×10⁴ mg/L and total organic carbon (TOC) of 329.2 mg/L. The original produced
water contains large number of suspended particulates, floating oil droplets and dissolved
components. A dynamic light scattering particle analyzer was deployed for study of
particle size distribution of the produced water. Figure 69 gives the particle size
distribution of the produced water. Most of fine coal powders in the CBM produced
water have a particle size in the range of 1.6−6.5μm. Pretreatment by microfiltration or
centrifuge is thus necessary to remove the coal fine particles before deploying the RO
system for produced water purification.
0.00
2.00
4.00
6.00
8.00
10.00
12.00
14.00
16.00
18.00
6540
5500
4620
3890
3270
2750
2312
1944
1635
Size (nm)
Chan
(%)
Fig. 69. Particle size distribution of suspensions in produced water.
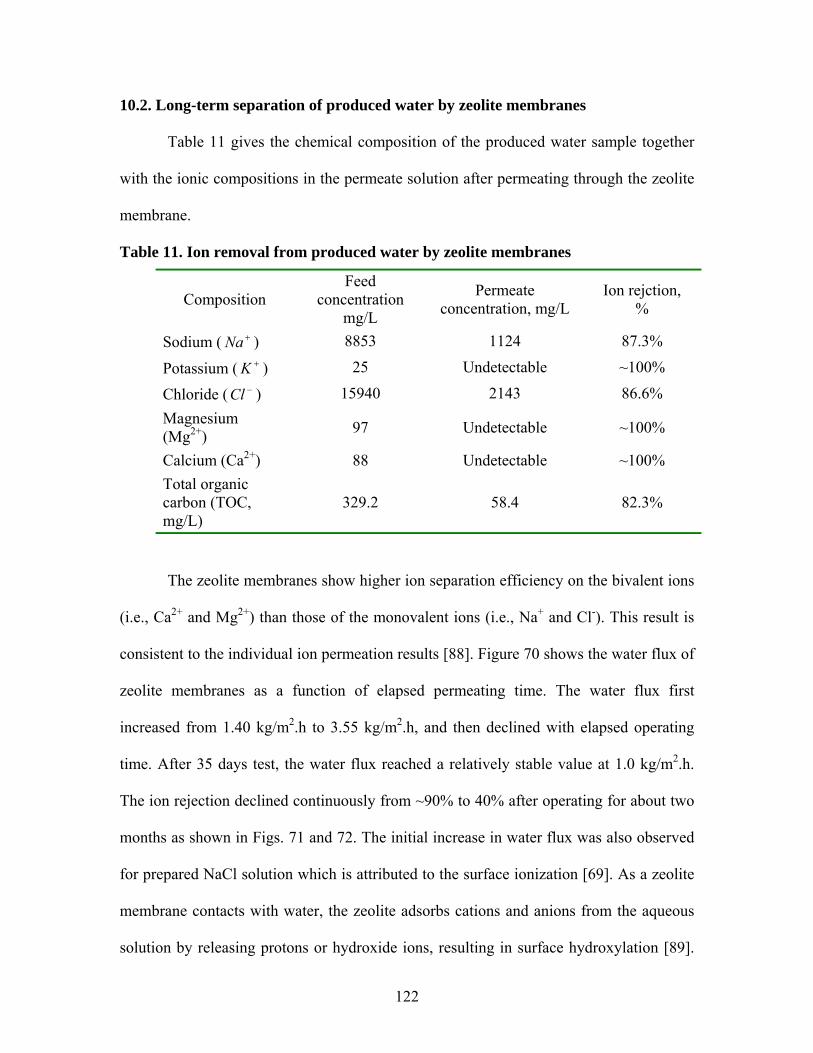
122
10.2. Long-term separation of produced water by zeolite membranes
Table 11 gives the chemical composition of the produced water sample together
with the ionic compositions in the permeate solution after permeating through the zeolite
membrane.
Table 11. Ion removal from produced water by zeolite membranes
Composition Feed
concentration mg/L
Permeate concentration, mg/L
Ion rejction, %
Sodium ( +Na ) 8853 1124 87.3%
Potassium ( +K ) 25 Undetectable ~100%
Chloride ( −Cl ) 15940 2143 86.6% Magnesium (Mg2+) 97 Undetectable ~100%
Calcium (Ca2+) 88 Undetectable ~100% Total organic carbon (TOC, mg/L)
329.2 58.4 82.3%
The zeolite membranes show higher ion separation efficiency on the bivalent ions
(i.e., Ca2+ and Mg2+) than those of the monovalent ions (i.e., Na+ and Cl-). This result is
consistent to the individual ion permeation results [88]. Figure 70 shows the water flux of
zeolite membranes as a function of elapsed permeating time. The water flux first
increased from 1.40 kg/m2.h to 3.55 kg/m2.h, and then declined with elapsed operating
time. After 35 days test, the water flux reached a relatively stable value at 1.0 kg/m2.h.
The ion rejection declined continuously from ~90% to 40% after operating for about two
months as shown in Figs. 71 and 72. The initial increase in water flux was also observed
for prepared NaCl solution which is attributed to the surface ionization [69]. As a zeolite
membrane contacts with water, the zeolite adsorbs cations and anions from the aqueous
solution by releasing protons or hydroxide ions, resulting in surface hydroxylation [89].

123
The formation of a group consisting of a large quantity of hydroxyls on a zeolite surface
contacted with produced water results in considerable enhancement in surface
hydrophilicity as well as water flux. Unfortunately, the adsorbed ion species also increase
the ion concentration gradient across zeolite membranes, resulting in considerable
increase in ion diffusion. As a result, ion separation efficiency will decrease. The
subsequent severe declines in water flux and ion rejection are attributed to the organic
fouling and scale deposition on the membrane surface.
0.00
0.50
1.00
1.50
2.00
2.50
3.00
3.50
4.00
1 5 9 13 17 21 25 29 33 37 41 45 49 53 57 61 65
Elapsed time (day)
Wat
er fl
ux (k
g/m
2 .h)
Fig. 70. Water flux variation as a function of elapsed RO permeation time.

124
0.0010.0020.0030.0040.0050.0060.0070.0080.0090.00
100.00
1 5 9 13 17 21 25 29 33 37 41 45 49 53 57 61 65
Elapsed time (day)
Na+ re
ject
ion
(%)
Fig. 71. Ion rejection (Na+) as a function of elapsed RO permeation time.
0.00
10.00
20.00
30.00
40.00
50.00
60.00
70.00
80.00
90.00
100.00
1 5 9 13 17 21 25 29 33 37 41 45 49 53 57 61 65
Elapsed time (day)
Cl- re
ject
ion
(%)
Fig. 72. Ion rejection (Cl-) as a function of elapsed RO permeation time.
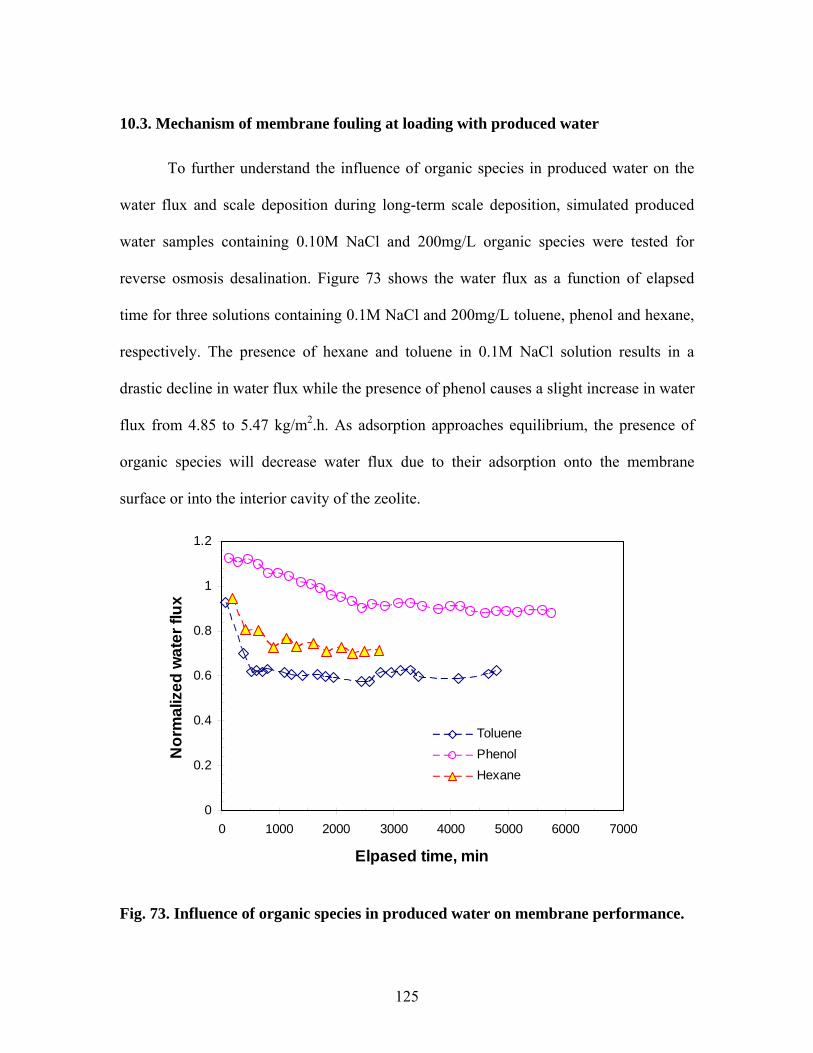
125
10.3. Mechanism of membrane fouling at loading with produced water
To further understand the influence of organic species in produced water on the
water flux and scale deposition during long-term scale deposition, simulated produced
water samples containing 0.10M NaCl and 200mg/L organic species were tested for
reverse osmosis desalination. Figure 73 shows the water flux as a function of elapsed
time for three solutions containing 0.1M NaCl and 200mg/L toluene, phenol and hexane,
respectively. The presence of hexane and toluene in 0.1M NaCl solution results in a
drastic decline in water flux while the presence of phenol causes a slight increase in water
flux from 4.85 to 5.47 kg/m2.h. As adsorption approaches equilibrium, the presence of
organic species will decrease water flux due to their adsorption onto the membrane
surface or into the interior cavity of the zeolite.
0
0.2
0.4
0.6
0.8
1
1.2
0 1000 2000 3000 4000 5000 6000 7000
Elpased time, min
Nor
mal
ized
wat
er fl
ux
ToluenePhenolHexane
Fig. 73. Influence of organic species in produced water on membrane performance.

126
The zeolite membranes, after permeation with CBM produced water for two
months, were washed thoroughly by using DI water and dried at 120°C for further SEM
and EDS analysis. Figure 74 shows SEM images of the cross-section of a zeolite
membrane after permeation with produced water for two months. The membrane with
scale deposition has a thickness of 12−15μm. Further random surface searching and EDS
analysis indicated that the chemical composition of the scale is mainly CaCO3 and SrCO3
crystals, as shown in Fig. 75. The fouled zeolite membrane was further cleaned with
0.1M HCl solution for 2 hr. The surface morphology and thickness of the zeolite
membrane, after washing and drying, is shown in Figs. 76 and 77, respectively.
Fig. 74. Cross-section of fouled zeolite membrane after produced water desalination.

127
Fig. 75. Surface SEM image of zeolite membrane with foulant and EDS result for chemical composition.
Fig. 76. SEM images (cross-section) of zeolite membrane before and after acid cleaning with 0.1M HCl solution.

128
Fig. 77. SEM surface images of zeolite membrane before and after acid cleaning with 0.1M HCl solution.
10.4. Membrane regeneration by H2O2 solution
Severe scale precipitation and organic adsorption were observed on zeolite
membrane surfaces after a long-term RO desalination test with CBM produced water.
Periodic cleaning is suggested to maintain the membrane performance during long-term
operation. The carbonate scale can be removed by acid solution but the adsorbed organic
species is difficult to clean by regular solvent washing. In this work, an oxidative-
regeneration for organic removal was studied for membrane regeneration after organic
fouling. In the same permeation system, the feed tank was loaded with diluted H2O2
solution. Under transmembrane pressure of 100 psi, H2O2 solution was forced to
permeate through zeolite membranes at very low flow rate. The oxidant in the micropore
of zeolite membranes decomposed adsorbed organics.
Figure 78 shows the water flux and ion rejection before and after H2O2 oxidative
regeneration. The zeolite membrane has a water flux of 4.86 kg/m2.h and ion rejection of

129
97.9% for 0.1 M NaCl solution. The water flux gradually declined to 3.71 kg/m2.h while
the ion rejection slightly decreased to 97.2% when 200mg/L toluene was added into the
0.1M NaCl feed solution. The organic fouled membrane was followed by a treatment
with 15% H2O2 solution at ambient temperature for 2 hr for organic decomposition. The
water flux was recovered to 4.60 kg/m2.h while the ion rejection decreased to 94.1%.
0
10
20
30
40
50
60
70
80
90
100
0 1000 2000 3000 4000 5000Time, min
ri, %
0
1
2
3
4
5
6
7
F w, k
g/m
2 .h
riFw
Initial ri
Initial Fwi
oxidative regeneration
Fig. 78. Oxidative regeneration of zeolite membranes after organic fouling.
XPS measurements were performed on a Kratos Axis Ultra spectrometer using an
AlK α 1486 eV monochromatic X-ray source. An electron flood gun for charge
neutralization and hemispherical analyzer with an eight-multichannel photomultiplier
detector was employed for analysis. Three large areas (300μm × 700 μm) per sample ere
analyzed for (1) low resolution survey spectra at 80 eV PE, and (2) high resolution O 1s,
Na 1s, C 1s and Si 2p spectra at 20 eV. Figures 79 and 80 show the low resolution survey

130
spectra and high resolution C1s respectively. Two types of O were detected for – SiO2
and CxOy species. The C=O species may also contribute to 532.4 eV, making O not
suitable for concluding on chemical composition. Three types of carbons were detected ,
C-C, C-O and C=O (COOH). Significant increase in C-C and C=O for the treated sample
suggested increase in –COOH group on the zeolite surface after oxidative regeneration.
The enhancement in surface hydrophilicity due to the presence of large amounts of
−COOH group might be the reason for enhanced water flux.
Fig. 79. Low resolution survey spectra of zeolite before and after H2O2 oxidative treatment.

131
Fig. 80. High resolution C 1s spectra for zeolite membrane before and after oxidative H2O2 oxidation.
Despite the rigorous efforts to reduce membrane fouling, such as surface
modification and pretreatment, fouling is essentially inevitable, particularly for produced
water containing large amounts of fine coal powder and dissolved organics. In addition,
CBM produced water contains high concentrations of bicarbonate ions that promote scale
deposition on membrane surface during a RO process. Thus, development of effective
chemical cleaning, i.e., in-situ oxdative regeneration, is a necessary process to ensure
sustainable operation for the long-term CBM produced water desalination.

132
11. ENGINEERING ASPECT AND ECONOMICS
Currently, only a few types of zeolite membranes have been commercialized or
demonstrated for industry application. A typical example of the commercial application
of zeolite membranes includes alcohol dehydration by LTA zeolite membranes and CO2
separation by DDR-type zeolite membranes [90]. Recent research efforts focus on MFI-
type and FAU-type zeolite membranes, which have larger pore sizes at 0.56nm and
0.74nm, respectively, and enhanced chemical stability. However, the commercialization
of these zeolite membranes have not been reported. Caro and coworkers [90] summarized
the engineering difficulties for upscaling the fabrication of zeolite membranes, from the
laboratory to commercial application.
First, zeolite membranes usually have an asymmetric cross-section with a
multilayer structure for the purpose of reducing mass flow resistance. Unfortunately, the
membranes with layered structure have to be fired at each step of synthesis, considerably
increasing the production costs.
Secondly, at least 70% of the zeolite membrane price comes from the fabrication
of ceramic support. Thus, tremendous efforts are being devoted to searching for cheaper,
automated production of membrane supports that can be used as support for coating thin
zeolite layers. Defect-free zeolite membranes have been successfully synthesized on
porous supports including α-alumina and stainless steel.
Thirdly, module design needs to meet the requirement of application under harsh
conditions. Advantages of inorganic membranes include high stability at elevated
temperatures and in the presence of strong organic solvents. The module and seal should

133
be applicable for the specific environment and in-situ oxidative regeneration. A solution
provided by the auther is potting the membranes into a stainless steel module by a
ceramic binder. But, the seeding and zeolite layer fabrication must be laid down after
completion of the housing.
The major disadvantage of the zeolite membranes is that the zeolite membranes
are about 10–50 times more expensive than the equivalent polymeric membranes. But,
the unique application of this membrane in produced water purification might be able to
overcome the disadvantages. Specifically, the zeolite membranes have advantages
including tolerance to dissolved organics in produced water, high mechanical strength,
and easy regeneration by in-situ oxidation. Tactics that were deployed to reduce the
membrane cost and upscale the fabrication process include:
(1) Selecting appropriate substrates for high-quality zeolite fabrication.
Three-type of inorganic supports were investigated for MFI-type zeolite
fabrication: α-alumina, stainless steel, and Zr-coated stainless steel. Figure 81 shows
these substrates that we studied in our laboratory.
(a) Stainless steel (Mott Metallurgical Corporation, Farmington).

134
(b) α-alumina (Pall Process Filtration Co.)
(c) Zr-coated stainless steel (Pall Process Filtration Co.)
Fig. 81. Inorganic substrates tested for zeolite membrane fabrication.

135
From the perspective of ion rejection, water flux, and membrane reproducibility,
the sequence of membrane quality on different substrate are: α-alumina>stainless
steel>Zr-coated stainless steel. In addition, the zeolite layer formed on stainless steel is
not stable during long-term permeation testing, which was explained by corrosion of
stainless steel in high concentration produced water.
(2) New zeolite coating process for defect-free zeolite membrane synthesis.
Fabrication of thin and defect-free thin zeolite layer on porous support is the
primary objective of a membrane synthesis. High temperature sintering (i.e., 450°C) for
template removal and low repeatability of membranes are the major cost of membrane
synthesis. In this work, high quality zeolite membranes were synthesized by a two-step
crystallization process. First, porous substrate was dipped into a synthesis solution
containing high concentration template (TPAOH solution) for seeding layer formation. A
thin zeolite layer (∼1.0 μm) was crystallized on porous support. Permeation tests have
indicated that zeolite layer formed by this process shows a high density of microdefects
and has very low ion rejection efficiency. Secondly, the zeolite layer formed by in-situ
crystallization was sintered at 450°C for template removal. Finally, defect-free zeolite
membranes were formed by treating the seeded substrates in a template-free solution at
hydrothermal condition: zeolite crystals grow further and form a dense layer on porous
support. Figure 82 shows the fabrication process of zeolite membranes. With this process,
over 90% zeolite membranes have high ion rejection efficiency (>95%) and high water
flux (>1.0 kg/m2.h).

136
Fig. 82. Membrane synthesis process by two-step crystallization.
(3) Design of module compatible with the ceramic membranes and produced water
characteristics.
Advantages of the inorganic membranes compared to polymeric membranes are
the tolerance in organic solution and in-situ oxidative regeneration. Corrosion resistance

137
for long-term application in produced water environment also needs to be considered. To
retain these advantages, the module of the 0.3 m2 membrane area is equipped with
tubular zeolite membranes in a cross-flow configuration.
The zeolite RO system, which employs zeolite membranes instead of
conventional polymeric membranes, has a layout similar to that used in other RO
processes. The produced water will be pretreated first by filtration or centrifuging for
particulate removal. A high-pressure pump will then be employed to drive water
molecules to pass through a semipermeable membrane and produce clean water. Several
factors including quantity of produced water and plant capacity are believed to be critical
for unit production costs. Major elements of economic calculation include: (1) direct
capital cost; (2) indirect capital cost; and (3) annual operating cost.
The direct capital cost includes purchase of equipment, land use, building
constructions, and membrane unit. The indirect cost includes insurance, construction
overhead and owner’s costs. The operating costs include electricity, labor, membrane
replacement, maintenance and amortization charges. Figure 83 gives the major elements
of RO cost evaluation [91].

138
Fig. 83. Elements used for cost analysis of RO desalination.
For a RO unit with desalination capacity of 1,000 m3/d, the capital cost and
operating cost of the conventional RO process is listed in Table 12 [92].
Table 12. Overall cost of a RO unit with capacity of 1,000 m3/d
Capital cost, $
Unit capital cost, $/m3/d
Energy cost, $/Yr
Unit energy cost, $/m3
Unit chemical cost, $/m3
Water cost, $/m3
924,000 924 1,710,000 0.52 0.11 1.51
The above cost calculation is based on seawater desalination, in which the
membrane replacement rate varies between 5%−20% per year. Produced water contains
• Land • Process equipment • Buildings • Membranes • Concentrated brine
• Insurance • Construction overhead • Owner’s cost
• Electricity • Labor • Maintenance • Membrane replacement • Chemicals • Amortization
Direct Capital Cost Indirect Capital Cost
Operating Cost
Clean water cost, $/barrel

139
large quantities of waste such as suspended solids, iron, and organic and inorganic
contaminants. The frequency of membrane replacement will be much higher than it is for
the desalination of seawater. The polymeric RO membranes tested for produced water
desalination show considerable decline within 3 months due to serious fouling,
suggesting a short lifetime and high replacement rate [93]. The zeolite membrane has
been developed for attacking organic fouling in produced water, due to its extremely
stable chemical and mechanical properties. With a water flux of 5 kg/m2.h, zeolite
membranes with a surface area of 8332 m2 are needed to generate a capacity of 1000
m3/d. Table 13 compares the membrane cost and replacement rate of polymer membranes
and the zeolite membranes developed in this research.
Table 13. Membrane cost and replacement rate
Membrane flux, kg/m2.h
Membrane surface area, m2
Membrane cost
Membrane life time
Membrane replacement, $/yr
Polymer membrane
30 1388 20,000 3 months $267,300 at 20% per year
Zeolite membrane
5−10 8332 916,520 5 years $429,540 at 20% per year
Note: zeolite membrane price is estimated as $110/m2.
At the assumption of: (1) same land, equipment and building cost, (2) same
insurance, labor and maintenance, the variation of unit water cost when applied to
produced water is summarized in Table 14. Periodically cleaning the zeolite membrane
by H2O2 oxidant (once every month) is suggested for recovering the water flux.
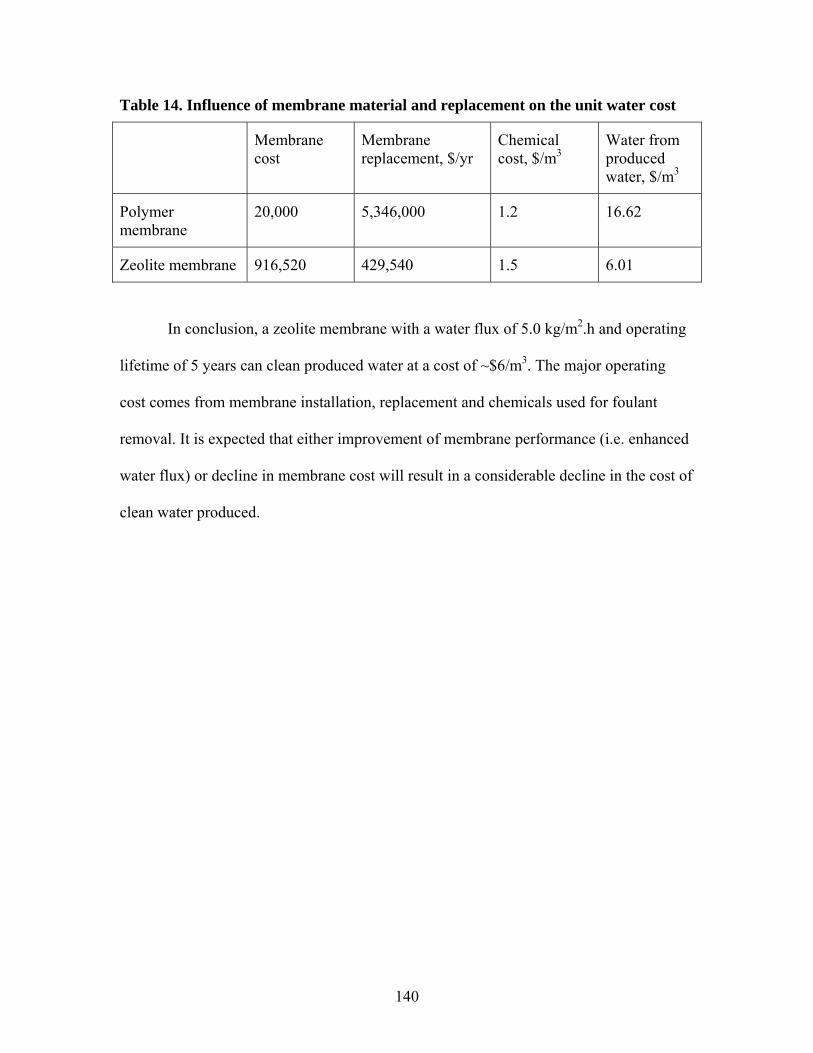
140
Table 14. Influence of membrane material and replacement on the unit water cost
Membrane cost
Membrane replacement, $/yr
Chemical cost, $/m3
Water from produced water, $/m3
Polymer membrane
20,000 5,346,000 1.2 16.62
Zeolite membrane 916,520 429,540 1.5 6.01
In conclusion, a zeolite membrane with a water flux of 5.0 kg/m2.h and operating
lifetime of 5 years can clean produced water at a cost of ~$6/m3. The major operating
cost comes from membrane installation, replacement and chemicals used for foulant
removal. It is expected that either improvement of membrane performance (i.e. enhanced
water flux) or decline in membrane cost will result in a considerable decline in the cost of
clean water produced.

141
12. CONCLUSION AND RECOMMENDATIONS
The main objective of this research is to demonstrate the desalination capacity of
zeolite membranes and to evaluate technical and economic potential of zeolite
membranes for application in produced water desalination. For achieving the research
objectives, a module of ~0.3 m2 membrane area with tubular zeolite membranes has been
produced. The zeolite membranes show excellent chemical and mechanical stabilities
where high operation pressure (>10MPa) and strong turbulent flow can be applied for
breaking the organic fouling and concentration polarization. Under the preferable
operating conditions, microporous structure of zeolite membranes were investigated by
different techniques including cross-flow permeation, BET, and XPS of FTIR.
1. The MFI zeolite membranes are capable of removing ions from aqueous solutions
via reverse osmosis. In the reverse osmosis process, both ion and water fluxes can
be enhanced by increasing the temperature or the transmembrane pressure (ΔP).
However, changing temperature and pressure have different impacts on the ion
rejection rate. Raising temperature has a greater influence on the ion permeation
than on the water permeation, resulting in a decline of the ion rejection. On the
contrary, increasing the transmembrane pressure can enhance both the water flux
and ion rejection rates because the ion flux is much less affected by pressure
compared to the water flux. Operating at elevated temperatures and high hydraulic
pressures is desirable for enhancing the separation efficiency.
2. Ion separation performance of zeolite membranes can be improved by
incorporating Al3+ ions into zeolite framework. The enhancement in RO

142
performance of the ZSM-5 membranes is explained by strong water affinity on
the zeolite surface and a high surface charge caused by ion substitution.
3. A module of 0.3m2 zeolite membrane area is equipped with 80 tubular zeolite
membranes produced in this research. The zeolite membranes have >95% ion
rejection and large variation in water flux from 0.6 to 10.0 kg/m2.h. These
findings suggest that for RO, zeolite membranes, which possess excellent thermal
and mechanical stabilities, have the potential for use in severe environments.
However, the zeolite membranes are not competitive with polymer membranes in
seawater desalination due to the high cost of membrane substrate. It is suggested
that in specific conditions where polymeric membranes fail, i.e., produced water,
strong solvents and radioactive environments, zeolite membranes could be an
alternative option for water purification.
4. A post-synthesis modification method by using Al3+-oligomers was developed for
repairing the undesirable nano-scale intercrystalline pores. The undesirable
intercrystalline pores can be effectively reduced by means of depositing metal ion
oligomers with considerable enhancement in ion rejection but less influence on
water flux. This new method of zeolite membrane modification is particularly
useful for enhancing the efficiency of ion separation from aqueous solutions
because the modification does not require high-temperature operation and may be
carried out online during the RO operation.
5. A gradual decline in both water flux and ion rejection was observed during long-
term operation in produced water desalination, which was attributed to scale
deposition and organic fouling. An in-situ oxidative regeneration experiment was
143
carried out for organic decomposition. Zeolite membranes treated by 15% H2O2
show >90% recovery in both water flux and ion rejection. Pretreatment for
divalent ion removal and periodic regeneration by strong oxidant treatment are
suggested for long-term produced water purification.
In summary, the research conducted in this project has resulted in eight papers
published in peer-reviewed journals, a pending patent, and six conference preceedings.
144
REFERENCES
[1] Veil, J.A., M.G. Puder, D. Elcock, P.J. Redweik, A White Paper Describing Produced
Water from Production of Crude Oil, Natural Gas, and Coal Bed Methane, DOE
Report, W-31-109-Eng-38, National Energy Technology Laboratory, (2004).
[2] Tao, F.T., S. Curtice, R.D. Hobbs, J.L. Sides, J.D. Wieser, C.A. Dyke, D. Tuohey, and
P.F. Pilger, Oil Gas J. 91 (1993), 88-91.
[3] Van Veen, H.M., Y.C. Van Delft, C.W.R. Engelen, and P.P.A.C. Pex, Sep. Purif.
Technol. 22-3 (2001), 361-366.
[4] Visvanathan, C., N. Boonthanon, A. Sathasivan, and V. Jegatheesan, Desalination 153
(2003), 133-140.
[5] Kumakiri, I., T. Yamaguchi, and S. Nakao, J. Chem. Eng. Jpn. 33 (2000), 333-336.
[6] Li, L.X., J.H. Dong, T.M. Nenoff, and R. Lee, Desalination 170 (2004), 309-316.
[7] Kiriukhin, M.Y., and K.D. Collins, Biophys. Chem. 99 (2002), 155-168.
[8] Chong, S.H., and F. Hirata, J. Chem. Phys. 111 (1999), 3654-3667.
[9] Chowdhuri, S., and A. Chandra, J. Chem. Phys. 118 (2003), 9719-9725.
[10] LyndenBell, R.M., and J.C. Rasaiah, J. Chem. Phys. 105 (1996), 9266-9280.
[11] Hubbard, J., and L. Onsager, J. Chem. Phys. 67 (1977), 4850-4857.
[12] Bluhm, E.A., E. Bauer, R.M. Chamberlin, K.D. Abney, J.S. Young, and G.D.
Jarvinen, Langmuir 15 (1999),8668–8672.
[13] Hartnig, C., W. Witschel, and E. Spohr, Ber. Bunsen-Ges. Phys. Chem. Chem. Phys.
102 (1998), 1689-1692.
[14] Allen, T.W., S. Kuyucak, and S.H. Chung, J. Chem. Phys. 111 (1999), 7985–7999.
[15] Holt, J.K., H.G. Park, Y.M. Wang, M. Stadermann, A.B. Artyukhin, C.P.
Grigoropoulos, A. Noy, and O. Bakajin, Science 312 (2006), 1034-1037.
[16] Li, L.X., Liu, N., McPherson, B., and Lee, R. Desalination. In press, 2008.
145
[17] Dong, J.H., Y.S. Lin, M.Z.C. Hu, R.A. Peascoe, and E.A. Payzant, Microporous
Mesoporous Mat. 34 (2000), 241-253.
[18] Nikolakis, V., M. Tsapatsis, and D.G. Vlachos, Langmuir 19 (2003), 4619-4626.
[19] Chau, J.L.H., C. Tellez, K.L. Yeung, and K.C. Ho, J. Membr. Sci. 164 (2000) 257–
275.
[20] Majumder, M., N. Chopra, R. Andrews, and B.J. Hinds, Nature 438 (2005), 44-44.
[21] Olson, D.H., W.O. Haag, and W.S. Borghard, Microporous Mesoporous Mat. 35-36
(2000), 435-446.
[22] Coronas, J., J.L. Falconer, and R.D. Noble, AICHE J. 43 (1997), 1797-1812.
[23] Noack, M., P. Kolsch, J. Caro, M. Schneider, P. Toussaint, and I. Sieber,
Microporous Mesoporous Mat. 35-36 (2000), 253-265.
[24] Jareman, F., J. Hedlund, and J. Sterte, Sep. Purif. Technol. 32 (2003), 159-163.
[25] Auerbach, S.M., K.A. Carrado, and P.K. Dutta, Handbook of Zeolite Science and
Technology, Marcel Dekker, Inc. New York, 2003.
[26] Van de Graaf, J.M., E. van der Bijl, A. Stol, F. Kapteijn, and J.A. Moulijn, Ind. Eng.
Chem. Res. 37 (1998), 4071-4083.
[27] Hedlund, J., J. Sterte, M. Anthonis, A.J. Bons, B. Carstensen, N. Corcoran, D. Cox,
H. Deckman, W. De Gijnst, P.P. de Moor, F. Lai, J. McHenry, W. Mortier, and J.
Reinoso, Microporous Mesoporous Mat. 52 (2002), 179-189.
[28] Uguina, M.A., A. Delucas, F. Ruiz, and D.P. Serrano, Ind. Eng. Chem. Res. 34
(1995), 451-456.
[29] Lai, R., and G.R. Gavalas, Microporous Mesoporous Mat. 38 (2000), 239-245.
[30] Lai, Z.P., G. Bonilla, I. Diaz, J.G. Nery, K. Sujaoti, M.A. Amat, E. Kokkoli, O.
Terasaki, R.W. Thompson, M. Tsapatsis, and D.G. Vlachos, Science 300 (2003),
456-460.
[31] McDonnell, A.M.P., D. Beving, A.J. Wang, W. Chen, and Y.S. Yan, Adv. Funct.
Mater. 15 (2005), 336-340.

146
[32] Oonkhanond, B., and M.E. Mullins, J. Colloid Interface Sci. 284 (2005), 210-215.
[33] Dong, J.H., K. Wegner, and Y.S. Lin, J. Membr. Sci. 148 (1998), 233-241.
[34] Huheey, J. E., E.A. Keiter, and R.L. Keiter, Inorganic chemistry: Principles of
Structure and Reactivity. HarperCollins College Publisher, New York (1993).
[35] Bandini, S., and D. Vezzani, Chem. Eng. Sci. 58 (2003), 3303-3326.
[36] Williams, M.E., J.A. Hestekin, C.N. Smothers, and D. Bhattacharyya, Ind. Eng.
Chem. Res. 38 (1999), 3683-3695.
[37] Zhou, W.W., and L.F. Song, Environ. Sci. Technol. 39 (2005), 3382-3387.
[38] Bowen, T.C., R.D. Noble, and J.L. Falconer, J. Membr. Sci. 245 (2004), 1-33.
[39] Mon, K.K., J.K. Percus, J. Chem. Phys. 117 (2002), 2289-2292.
[40] Bowen, T.C., J.C. Wyss, R.D. Noble, and J.L. Falconer, Ind. Eng. Chem. Res. 43
(2004), 2598-2601.
[41] Nomura, M., T. Yamaguchi, and S. Nakao, J. Membr. Sci. 187 (2001), 203-212.
[42] Gu, X.H., J.H. Dong, and T.M. Nenoff, Ind. Eng. Chem. Res. 44 (2005), 937-944.
[43] Buelna, G., and Y.S. Lin, Microporous Mesoporous Mat. 30 (1999), 359-369.
[44] Zhao, D.Y., Q.S. Huo, J.L. Feng, B.F. Chmelka, and G.D. Stucky, J. Am. Chem. Soc.
120 (1998), 6024-6036.
[45] Brunauer, S., L.S. Deming, W.E. Deming and E. Teller, J. AM. Chem. Soc. 62
(1940), 1723-1732.
[46] Storck, S., H. Bretinger, and W.F. Maier, Appl. Catal. A-Gen. 174 (1998), 137-146.
[47] Horvath, G., and K. Kawazoe, J. Chem. Eng. Jpn. 16 (1983), 470-475.
[48] Saito, A., H.C. Foley, Microporous Mater. 3 (1995), 531-542.
[49] Groen, J.C., L.A.A. Peffer, and J. Perez-Ramirez, Microporous Mesoporous Mat. 60
(2003), 1-17.
[50] Tsuru, T., Sep. Purif. Methods 30 (2001), 191-220.

147
[51] Zhao, D.Y., J.L. Feng, Q.S. Huo, N. Melosh, G.H. Fredrickson, B.F. Chmelka, and
G.D. Stucky, Science 279 (1998), 548-552.
[52] Caro, J., M. Noack, P. Kolsch, and R. Schafer, Microporous Mesoporous Mat. 38
(2000), 3-24.
[53] Wang, Z.B., and Y.S. Yan, Chem. Mat. 13 (2001), 1101-1107.
[54] Li, S., X. Wang, D. Beving, Z.W. Chen, and Y.S. Yan, J. Am. Chem. Soc. 126
(2004), 4122-4123.
[55] Hsu, P.H., Clays Clay Min., 36 (1988) 25-30.
[56] Pinnavaia, T.J., Science 220 (1983), 365-371.
[57] Ishiguro, M., T. Matsuura, and C. Detellier, J. Membr. Sci. 107 (1995), 87-92.
[58] Lin, J., and S. Murad, Mol. Phys. 99 (2001), 1175-1181.
[59] Jamnik, B., and V. Vlachy, J. Am. Chem. Soc. 115 (1993), 660–666.
[60] Pavlov, M., P.E.M. Siegbahn, and M. Sandstrom, J. Phys. Chem. A 102 (1998), 219-
228.
[61] Biswas, R., and B. Bagchi, J. Chem. Phys. 106 (1997), 5587-5598.
[62] Yang, K.L., S. Yiacoumi, and C. Tsouris, J. Chem. Phys. 117 (2002), 8499-8507.
[63] Lee, S.H., and J.C. Rasaiah, J. Phys. Chem. 100 (1996), 1420-1425.
[64] Bak, I., J. Hutter, and G. Palinkas, J. Chem. Phys. 117 (2002), 9838-9843.
[65] King, A.J., G.C. Lillie, V.W.Y. Cheung, S.M. Holmes, and R.A.W. Dryfe, Analyst
129 (2004), 157-160.
[66] Li, L.X., Molecular Sieve Zeolite Membrane and Micro/mesoporous Clay
Membranes for Liquid and Gas Separation. Ph.D Dissertation, New Mexico Institute
of Mining and Technology, 2005.
[67] Ishiguro, M., T. Matsuura, and C. Detellier, Sep. Sci. Technol. 31 (1996), 545-556.
[68] Chowdhuri, S., and A. Chandra, J. Chem. Phys. 115 (2001), 3732-3741.
[69] Li, L.X., J.H. Dong, and T.M. Nenoff, Sep. Purif. Technol. 53 (2007), 42-48.
148
[70] Impey, R.W., P.A. Madden, and I.R. McDonald, J. Phys. Chem. 87 (1983), 5071-
5083.
[71] Neilson, G.W., and J.E. Enderby, Adv. Inorg. Chem. 34 (1989), 195-218.
[72] Helm, L., and A.E. Merbach, Coord. Chem. Rev. 187 (1999), 151-181.
[73] Scott M. Auerbach, Kathleen A. Carrado and Prabir K. Dutta, Handbook of Zeolite
Science and Technology, Marcel Dekker, Inc., New York, 2003.
[74] Hansen, B.R., and S.R.H. Davies, Chem. Eng. Res. Des. 72 (1994), 176-188.
[75] Wijmans, J.G., and R.W. Baker, J. Membr. Sci. 107 (1995), 1-21.
[76] Labbez, C., P. Fievet, A. Szymczyk, A. Vidonne, A. Foissy, and J. Pagetti, Sep.
Purif. Technol. 30 (2003) 47–55.
[77] Huisman, I.H., G. Tragardh, C. Tragardh, and A. Pihlajamaki, J. Membr. Sci. 147
(1998) 187–194.
[78] Andersen, O.S., and S.W. Feldberg, J. Phys. Chem. 100 (1996), 4622-4629.
[79] Murad, S., K. Oder, and J. Lin, Mol. Phys. 95 (1998), 401-408.
[80] Schreier, M., and J.R. Regalbuto, J. Catal. 225 (2004), 190-202.
[81] Giaya, A., and R.W. Thompson, J. Chem. Phys. 117 (2002), 3464-3475.
[82] Rempe, S.B., L.R. Pratt, G. Hummer, J.D. Kress, R.L. Martin, and A. Redondo, J.
Am. Chem. Soc. 122 (2000), 966-967.
[83] Santos, S.M., and M.R. Wiesner, Water Environ. Res. 69 (1997), 1120-1127.
[84] Zhang, J., J.H. Dong, M. Luo, H. Xiao, S. Murad, and R.A. Normann, Langmuir 21
(2005), 8609-8612.
[85] Xomeritakis, G., S. Nair, and M. Tsapatsis, Microporous Mesoporous Mat. 38
(2000), 61-73.
[86] Xomeritakis, G., Z.P. Lai, and M. Tsapatsis, Ind. Eng. Chem. Res. 40 (2001), 544-
552.

149
[87] Li, L.X, A. Ryan, Tina, M. Nenoff, J. Dong, and R. Lee. Paper SPE 89892, presented
at the SPE Annual Technical Conference and Exhibition held in Houston, Texas, 26-
29 September 2004.
[88] Li, L.X., J.H. Dong, T.M. Nenoff, and R. Lee, J. Membr. Sci. 243 (2004), 401-404.
[89] Tamura, H., K. Mita, A. Tanaka, and M. Ito, J. Colloid Interface Sci. 243 (2001),
202-207.
[90] Caro, J., M. Noack, and P. Kolsch, Adsorpt.-J. Int. Adsorpt. Soc. 11 (2005), 215-227.
[91] Ettouney, H.M., H.T. El-Dessouky, R.S. Faibish, and P.J. Gowin, Chem. Eng. Prog.
98 (2002), 32-39.
[92] Matz, R., and U. Fisher, Desalination 36 (1981), 137-151.
[93] Visvanathan, C., P. Svenstrup, and P. Ariyamethee, Water Sci. Technol. 41 (2000),
117-123.