treasury management mid-year report for 2021/22
TRANSCRIPT
Treasury Management Mid-Year Report for 2021/22
SUMMARY This report advises members of the Treasury Management Service performance for 2021/22 as at 30th September 2021 and illustrates the compliance to-date with the Treasury Management Indicators for 2021/22.
Portfolio - Finance
Wards Affected All
Recommendation The Executive is advised to NOTE and COMMENT on the report.
1. Executive Summary
1.1 This report sets out the performance of the Council’s investments and borrowing
for the first six months of the year. It is also intended to demonstrate that the Council is complying with the Treasury Management Indicators set by Full Council as part of the Treasury Management Strategy.
1.2 The Council is complying with all the Treasury Management Indicators set for
2021/22 as at the 30th September 2021.
2. Resource Implications
2.1 None directly as a result of this paper, but the investment income and borrowing costs do impact the revenue budget.
3. Key Issues
Background
3.1 The Chartered Institute of Public Finance and Accountancy’s Treasury Management Code (CIPFA’s TM Code) requires that authorities report on the performance of the treasury management function at least twice yearly (mid-year and at year end).
3.2 The Council’s Treasury Management Strategy for 2021/22 was approved by Executive on 16th February 2021.
3.3 The 2017 Prudential Code includes a requirement for local authorities to provide a
Capital Strategy, a summary document approved by full Council covering capital expenditure and financing, treasury management and non-treasury investments.

The Council’s Capital Strategy, complying with CIPFA’s requirement, was approved by Full Council on 26th February 2021.
3.4 Through investment, the Council is potentially exposed to financial risks including
the loss of invested funds and the revenue effect of changing interest rates. The Council is also exposed to increases in revenue costs on its borrowing due to changes in interest rates. The Council seeks to moderate this impact by following the advice of its treasury advisers. This report covers treasury and borrowing activity and the associated monitoring and control of risk.
Local Context
3.5 At 31 March 2021, the Council’s underlying need to borrow for capital purposes as
measured by the Capital Financing Requirement (CFR) was £214m (2019/20 - £196m), an increase of £18m from 2019/20. The Council must not borrow in excess of its CFR requirement and indeed at the 30th September total borrowing was £175m.
4. Treasury Performance Borrowing Activity to 30th September 2021 4.1 At 30 September 2021 the Council held £175m of borrowing, (an decrease of £5m
on 31/3/2021) as part of its strategy for funding previous and current year’s capital programmes.
The borrowing position is shown in the table below:
Borrowing Position - 30.09.2021
31.03.21 Movement 30.09.21 30.09.21
Balance £m Balance Weighted average rate
£m £m %
Public Works Loan Board 78 0 78 2.43%
Local authorities (long-term) - - - -
Local authorities (short-term) 102 (5.00) 97 0.05%
Total Borrowing 180.00 (5.00) 175 0.74%
4.2 At 30th September 2021, the Council had an upper operational limit of borrowing
of £230m. 4.3 The Council’s chief objective when borrowing continues to be striking an
appropriately low risk balance between securing low interest costs and achieving cost certainty over the period for which funds are required, with flexibility to renegotiate loans should the Council’s long-term plans change being a secondary objective. With short term rates remaining much lower than long term rates, on the
advice of its treasury advisers, the Council considered it to be more cost effective in the near term to borrow short term loans instead.
4.4 In order to reduce risk the Council entered into £50million of forward starting loans
during 2017/18 with forward starting dates. In 2020/21 a loan of £25million with a fixed interest rate of 2.853% was advanced to the Council and a further £25m will be advanced in 2021/22 with a fixed interest rate of 2.908% was advanced. Both loans will be repayable over 40 years.
Investment Activity to 30th September 2021
4.5 The Council held invested funds, representing income received in advance of
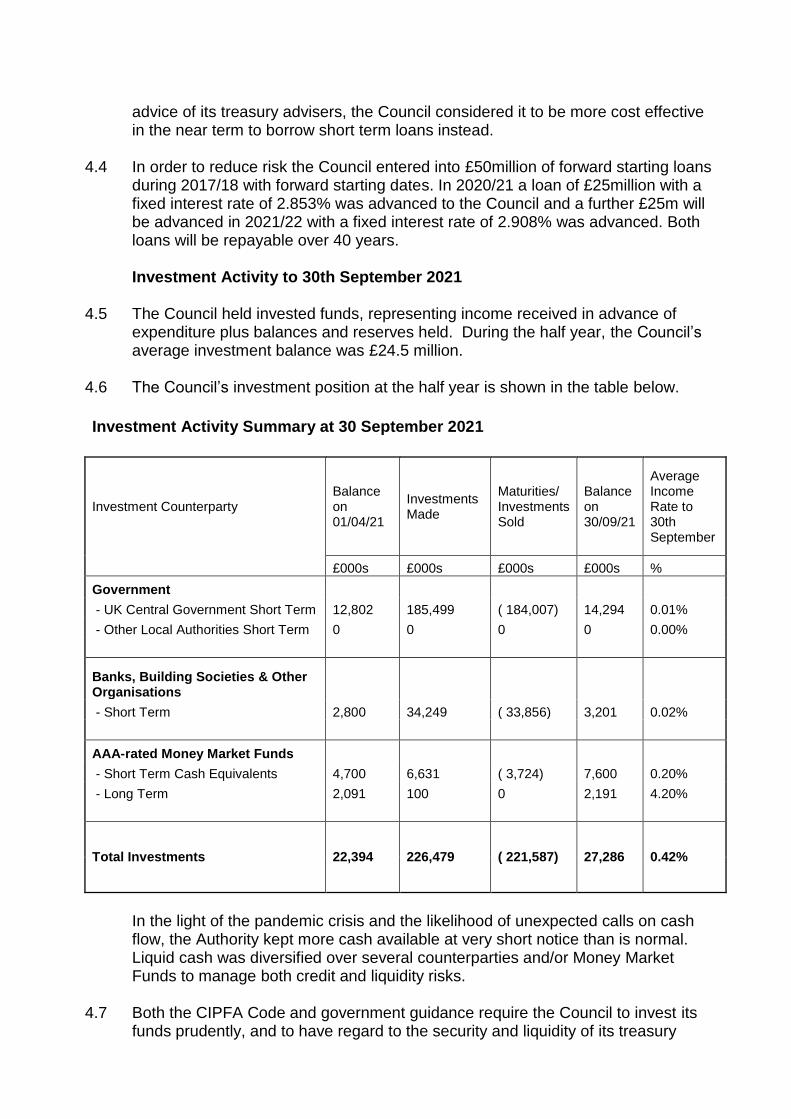
expenditure plus balances and reserves held. During the half year, the Council’s average investment balance was £24.5 million.
4.6 The Council’s investment position at the half year is shown in the table below.
Investment Activity Summary at 30 September 2021
Investment Counterparty Balance on 01/04/21
Investments Made
Maturities/ Investments Sold
Balance on 30/09/21
Average Income Rate to 30th September
£000s £000s £000s £000s %
Government
- UK Central Government Short Term 12,802 185,499 ( 184,007) 14,294 0.01%
- Other Local Authorities Short Term 0 0 0 0 0.00%
Banks, Building Societies & Other Organisations
- Short Term 2,800 34,249 ( 33,856) 3,201 0.02%
AAA-rated Money Market Funds
- Short Term Cash Equivalents 4,700 6,631 ( 3,724) 7,600 0.20%
- Long Term 2,091 100 0 2,191 4.20%
Total Investments 22,394 226,479 ( 221,587) 27,286 0.42%
In the light of the pandemic crisis and the likelihood of unexpected calls on cash flow, the Authority kept more cash available at very short notice than is normal. Liquid cash was diversified over several counterparties and/or Money Market Funds to manage both credit and liquidity risks.
4.7 Both the CIPFA Code and government guidance require the Council to invest its
funds prudently, and to have regard to the security and liquidity of its treasury
investments before seeking the optimum rate of return, or yield. The Council’s objective when investing money is to strike an appropriate balance between risk and return, minimising the risk of incurring losses from defaults and the risk of receiving unsuitably low investment income.
4.8 The Council maintained its investment of £2m in the CCLA Property Fund whilst
the remainder of investments were invested in money market funds. Since 30th September 2020, this £2m longer term investment over the past 12 months has generated a total return of 15.22% (capital return of 10.82% and an income return of 4.40%). Since investing into the CCLA Property Fund back in 2014, the Fund has generated a total return of 44.68% (capital return of 11.87% and an income return of 32.82%).
4.9 Because these funds have no defined maturity date, but are available for
withdrawal after a notice period, their performance and continued suitability in meeting the Council’s investment objectives are regularly reviewed. Strategic fund investments are made in the knowledge that capital values will move both up and down on months, quarters and even years; but with the confidence that over a three- to five-year period total returns will exceed cash interest rates. In light of their performance the Council’s investment in these funds has been maintained.
4.10 In 2021/22 the Authority expects to receive significantly lower income from its cash and short-dated money market investments and from its externally managed funds than it did in 2020/21 and earlier years. Dividends and income paid will ultimately depend on many factors including but not limited to the duration of COVID-19 and the extent of its economic impact, the fund’s sectoral asset allocation, securities held/bought/sold and, in the case of equities, the enforced or voluntary dividend cuts or deferral.
4.11 Annex A lists the Council’s investments as at the 30th September 2021.
Credit Risk
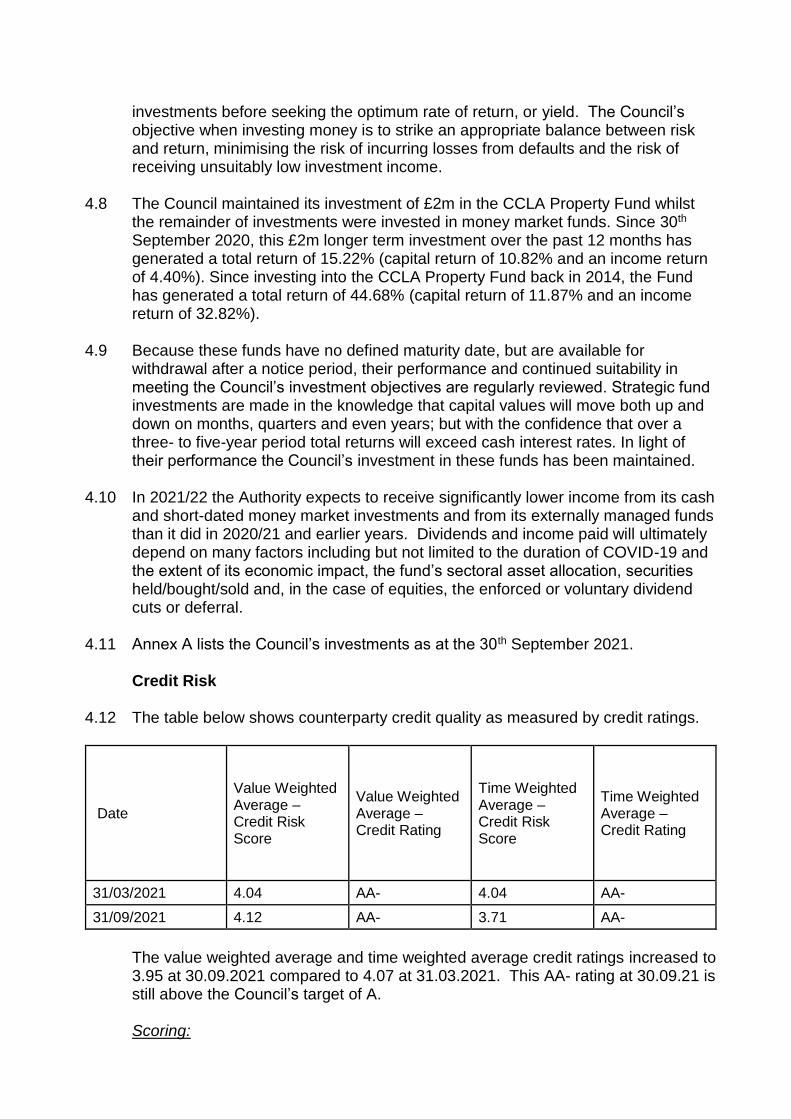
4.12 The table below shows counterparty credit quality as measured by credit ratings.
Date
Value Weighted Average – Credit Risk Score
Value Weighted Average – Credit Rating
Time Weighted Average – Credit Risk Score
Time Weighted Average – Credit Rating
31/03/2021 4.04 AA- 4.04 AA-
31/09/2021 4.12 AA- 3.71 AA-
The value weighted average and time weighted average credit ratings increased to 3.95 at 30.09.2021 compared to 4.07 at 31.03.2021. This AA- rating at 30.09.21 is still above the Council’s target of A.
Scoring:

-Value weighted average reflects the credit quality of investments according to the size of the deposit -Time weighted average reflects the credit quality of investments according to the maturity of the deposit -AAA = highest credit quality = 1 -B- = lowest credit quality = 16 -Aim = A- or higher credit rating, with a score of 7 or lower, to reflect current investment approach with main focus on security
Budgeted Income and Outturn
4.13 The average cash balance was £24.5m during the half year. The Council’s best performing investment was its £2m of externally managed pooled (property) fund.
4.14 The balance of the Council’s investments were kept in short-term money markets.
4.15 The Council’s investment income for the first six months was £52k compared to an annual budgeted figure of £140k. The estimated return at year end is £115k which will show a shortfall of £25k due to currently low interest rates as per Annex D of this report (Outlook for the remainder of 2021/22). Compliance with Treasury Management Indicators
4.16 The Council confirms compliance with its Treasury Management Indicators in the period to 30th September 2021. These were set in February 2021. Details of these indicators are shown in Annexes B and C. Economic Review and Outlook for the remainder of the year
4.17 The Council’s advisers Arlingclose have provided an Economic Review of the year so far and an outlook for Quarters 3 and 4. This is included in Annex D.
5. Proposals 5.1 It is proposed that the Executive note and comment on the report.
6. Corporate Objectives and Key Priorities
6.1 The Treasury Management processes support the Council’s objective of ‘Delivering services efficiently, effectively and economically’ through the Council’s new 5 year strategy.
7. Policy Framework 7.1 The Council fully complies with the requirements of the CIPFA Code of Practice
on Treasury Management. The current relevant criteria and constraints incorporated into the Treasury Management Policy Statement are:
New borrowing is to be contained within the limits approved by the Council, in accordance with the CIPFA Prudential Code for Capital Finance in Local Authorities, and the Council’s prudential indicators.
Investments to be made in accordance with the MHCLG guidance on Local Council Investments, on the basis of credit ratings agencies and as detailed in the Treasury Management Policy statement and approved schedules and practices.
Sufficient funds to be available to meet the Council’s estimated outgoings for any day.
Investment objectives are to maximise the return to the Council balanced
against the risks to protect reserves.
8. Legal Issues 8.1 The report demonstrates that the Council is complying with the Prudential
Framework.
9. Risk Management 9.1 Weak returns on investments could lead to a reduction in income generated to
support the revenue budget.
9.2 The limits in this report in respect to counterparties and investments are the overall limits for agreement by Council. However from time to time these may be tightened temporarily by the Strategic Director for Finance and Customer Service in consultation with the Portfolio Holder for Finance to reflect increased uncertainty and increase in perceived risk in financial institutions and the economy. This will usually be at the cost of lower returns.
9.3 The Council has taken and acted on advice from its advisers in relation to increasing returns albeit at increased risk and its borrowing strategy. There are risks that interest rates can change and that any investment is not guaranteed.
9.4 The investments ratings provided by credit ratings agencies are only a guide and do not give 100% security. There is always a risk that an institution may be unable to repay its loans whatever the credit rating. However this can be mitigated by spreading investments amongst a number of institutions.
Annexes
Annex A – Investments as at 30th September 2021 Annex B – Treasury Management Performance Indicators
Background papers
CIPFA code on Treasury Management
Author/contact details
Robert Kern [email protected]

Head of service
Amanda Fahey [email protected] Interim Strategic Director of Finance and Customer Service

Annex A
INVESTMENTS as at 30th September 2021
£
Debt Management Office 14,294,000
Other Local Authorities Short Term 0
Total Government 14,294,000
Money Market Fund - Aberdeen Standard 3,000,000
Money Market Fund – CCLA 700,000
Money Market Fund – Federated 3,000,000
Money Market Fund - Legal and General 900,000
Total Money Market Funds 7,600,000
CCLA Property Fund 2,192,156
Total Longer Term Investments 2,192,156
NatWest Bank Accounts 3,200,458
Total Invested 27,286,614

Annex B Treasury Management Indicators as at the 30th September 2021
The Council measures and manages its exposures to treasury management risks using the following indicators.
Debt Limits: Since the operational boundary is a management tool for in-year monitoring it is not significant if the operational boundary is breached on occasions due to variations in cash flow, and this is not counted as a compliance failure.
30.09.21 Actual £m
2021/22 Operational Boundary £m
2021/22 Authorised Limit £m
Complied? Yes/No
Borrowing 175 230 235 Yes
Maturity Structure of Borrowing: This indicator is set to control the Council’s exposure to refinancing risk. The upper and lower limits on the maturity structure of fixed rate borrowing will be:
30.09.20 Upper Lower Actual £000s
Not over 1 year 100% 0% 69% 117.64
Over 1 but not over 2 years 100% 0% 1% 1.09
Over 2 but not over 5 years 100% 0% 2% 3.30
Over 5 but not over 10 years 100% 0% 3% 5.60
Over 10 but not over 15 years 100% 0% 4% 7.25
Over 15 but not over 20 years 100% 0% 3% 5.23
Over 20 but not over 30 years 100% 0% 3% 5.43
Over 25 but not over 30 years 100% 0% 2% 3.18
Over 30 but not over 40 years 100% 0% 6% 10.80
Over 40 years 100% 0% 6% 10.94
Total 100% 170.45
Time periods start on the first day of each financial year. The maturity date of borrowing is the earliest date on which the lender can demand repayment. Principal Sums Invested for Periods Longer than a year: The purpose of this indicator
is to control the Council’s exposure to the risk of incurring losses by seeking early
repayment of its investments. The limits on the total principal sum invested to final
maturities beyond the period end will be:

2021/22 2022/23 2023/24
Limit on principal invested beyond year end
£2.5m £2.5m £2.5m
Actual £2.0m
Security: The Council has adopted a voluntary measure of its exposure to credit risk by
monitoring the value-weighted average [credit rating] or [credit score] of its investment
portfolio. This is calculated by applying a score to each investment (AAA=1, AA+=2, etc.)
and taking the arithmetic average, weighted by the size of each investment.
Target Actual 30/09/2021
Portfolio average credit rating A AA-
Liquidity: The Council has adopted a voluntary measure of its exposure to liquidity risk
by monitoring the amount of cash available to meet unexpected payments within a rolling
three month period, without additional borrowing.
Target Actual 30/09/2021
Total cash available within 3 months £5m £9m
Interest Rate Exposures: This indicator is set to control the Council’s exposure to interest rate risk. The Council has set the limit on one-year revenue impact of a 1% rise in interest rates at £1m. The Council complied with this indicator as the interest payable for the half year was £860k. The Council has sufficient reserves in an Interest Equalisation Reserve to mitigate the impact of an interest rate rise for 2021/22.

Annex C Additional Compliance Information The Council reports that all treasury management activities undertaken during complied fully with the CIPFA Code of Practice and the Council’s approved Treasury Management Strategy. Compliance with specific investment limits is demonstrated in the table below: Investment Limits
2021/22 30.09.21
Complied
Limit Actual
Any single organisation, except the UK Government
£3m each 0 Yes
UK Central Government Unlimited £14.294m Yes
UK Local Authorities £3m each 0 Yes
Any group of organisations under the same ownership
£3.5m per group
£3.2m Yes
Any group of pooled funds under the same management
£5m per manager
£2.2m Yes
Negotiable instruments held in a broker’s nominee account
£10m per broker
0 Yes
Limit per non-UK country £2m per country
0 Yes
Registered providers £5m in total 0 Yes
Unsecured investments with building societies
£5m in total 0 Yes
Loans to unrated corporates £2m in total 0 Yes
Money Market Funds £10m in total £7.6m Yes

Annex D Economic Review provided by the Council’s Treasury Advisors, Arlingclose Economic background: The economic recovery from coronavirus pandemic continued
to dominate the first half of the financial year. By the end of the period over 48 million
people in the UK had received their first dose of a COVID-19 vaccine and almost 45
million their second dose.
The Bank of England (BoE) held Bank Rate at 0.1% throughout the period and maintained its Quantitative Easing programme at £895 billion, unchanged since the November 2020 meeting. In its September 2021 policy announcement, the BoE noted it now expected the UK economy to grow at a slower pace than was predicted in August, as the pace of the global recovery had shown signs of slowing and there were concerns inflationary pressures may be more persistent. Within the announcement, Bank expectations for GDP growth for the third (calendar) quarter were revised down to 2.1% (from 2.9%), in part reflecting tighter supply conditions. The path of CPI inflation is now expected to rise slightly above 4% in the last three months of 2021, due to higher energy prices and core goods inflation. While the Monetary Policy Committee meeting ended with policy rates unchanged, the tone was more hawkish. Government initiatives continued to support the economy over the quarter but came to an end on 30th September 2021, with businesses required to either take back the 1.6 million workers on the furlough scheme or make them redundant. The latest labour market data showed that in the three months to July 2021 the unemployment rate fell to 4.6%. The employment rate increased, and economic activity rates decreased, suggesting an improving labour market picture. Latest data showed growth in average total pay (including bonuses) and regular pay (excluding bonuses) among employees was 8.3% and 6.3% respectively over the period. However, part of the robust growth figures is due to a base effect from a decline in average pay in the spring of last year associated with the furlough scheme. Annual CPI inflation rose to 3.2% in August, exceeding expectations for 2.9%, with the largest upward contribution coming from restaurants and hotels. The Bank of England now expects inflation to exceed 4% by the end of the calendar year owing largely to developments in energy and goods prices. The Office of National Statistics’ (ONS’) preferred measure of CPIH which includes owner-occupied housing was 3.0% year/year, marginally higher than expectations for 2.7%. The easing of restrictions boosted activity in the second quarter of calendar year, helping push GDP up by 5.5% q/q (final estimate vs 4.8% q/q initial estimate). Household consumption was the largest contributor. Within the sector breakdown production contributed 1.0% q/q, construction 3.8% q/q and services 6.5% q/q, taking all of these close to their pre-pandemic levels. The US economy grew by 6.3% in Q1 2021 (Jan-Mar) and then by an even stronger 6.6% in Q2 as the recovery continued. The Federal Reserve maintained its main interest

rate at between 0% and 0.25% over the period but in its most recent meeting made suggestion that monetary policy may start to be tightened soon. The European Central Bank maintained its base rate at 0%, deposit rate at -0.5%, and asset purchase scheme at €1.85 trillion.
Financial markets: Monetary and fiscal stimulus together with rising economic growth and the ongoing vaccine rollout programmes continued to support equity markets over most of the period, albeit with a bumpy ride towards the end. The Dow Jones hit another record high while the UK-focused FTSE 250 index continued making gains over pre-pandemic levels. The more internationally focused FTSE 100 saw more modest gains over the period and remains below its pre-crisis peak. Inflation worries continued during the period. Declines in bond yields in the first quarter of the financial year suggested bond markets were expecting any general price increases to be less severe, or more transitory, that was previously thought. However, an increase in gas prices in the UK and EU, supply shortages and a dearth of HGV and lorry drivers with companies willing to pay more to secure their services, has caused problems for a range of industries and, in some instance, lead to higher prices. The 5-year UK benchmark gilt yield began the financial year at 0.36% before declining to 0.33% by the end of June 2021 and then climbing to 0.64% on 30th September. Over the same period the 10-year gilt yield fell from 0.80% to 0.71% before rising to 1.03% and the 20-year yield declined from 1.31% to 1.21% and then increased to 1.37%. The Sterling Overnight Rate (SONIA) averaged 0.05% over the quarter. Outlook for the remainder of 2021/22
Arlingclose expects Bank Rate to rise in Q2 2022. We believe this is driven as much by the Bank of England’s desire to move from emergency levels as by fears of inflationary pressure. Investors have priced in multiple rises in Bank Rate to 1% by 2024. While Arlingclose believes Bank Rate will rise, it is by a lesser extent than expected by markets.
The global economy continues to recover from the pandemic but has entered a more challenging phase. The resurgence of demand has led to the expected rise in inflationary pressure, but disrupted factors of supply are amplifying the effects, increasing the likelihood of lower growth rates ahead. This is particularly apparent in the UK due to the impact of Brexit. While Q2 UK GDP expanded more quickly than initially thought, the ‘pingdemic’ and more latterly supply disruption will leave Q3 GDP broadly stagnant. The outlook also appears weaker. Household spending, the driver of the recovery to date, is under pressure from a combination of retail energy price rises, the end of government support

programmes and soon, tax rises. Government spending, the other driver of recovery, will slow considerably as the economy is taken off life support.
Inflation rose to 3.2% in August. A combination of factors will drive this to over 4% in the near term. While the transitory factors affecting inflation, including the low base effect of 2020, are expected to unwind over time, the MPC has recently communicated fears that these transitory factors will feed longer-term inflation expectations that require tighter monetary policy to control. This has driven interest rate expectations substantially higher.
The supply imbalances are apparent in the labour market. While wage growth is currently elevated due to compositional and base factors, stories abound of higher wages for certain sectors, driving inflation expectations. It is uncertain whether a broad-based increased in wages is possible given the pressures on businesses. Government bond yields increased sharply following the September FOMC and MPC minutes, in which both central banks communicated a lower tolerance for higher inflation than previously thought. The MPC in particular has doubled down on these signals in spite of softer economic data. Bond investors expect higher near-term interest rates but are also clearly uncertain about central bank policy. The MPC appears to be playing both sides, but has made clear its intentions to tighten policy, possibly driven by a desire to move away from emergency levels. While the economic outlook will be challenging, the signals from policymakers suggest Bank Rate will rise unless data indicates a more severe slowdown.