mid & small - june 2021
TRANSCRIPT

www.sabafgroup.com

FINANCIAL PRESENTATION
Mid & Small 2021
Milan, 15th - 17th June 2021
I. COMPANY PROFILE
II. I QUARTER 2021 RESULTS
III. 2021 OUTLOOK
IV. BUSINESS PLAN 2021 - 2023
Table of contents

COMPANY PROFILE

Sabaf GroupTimeline and history
1950 1998 2000 2001 2012 2015 2016 2018 2019
THE FOUNDATION
THELISTING
ACQUISITION
Hinges
SABAF DO BRASIL
GreenfieldGas components
SABAF TURKEY
GreenfieldGas components
SABAFCHINA
GreenfieldGas components
ACQUISITION
Professional Burners
ACQUISITION
Electronic components
ACQUISITION
Hinges
5

6
Sabaf GroupBusiness diversification in three divisions
GAS
ELECTRONICCOMPONENTS
HINGESWidening product
range
Sales by division
EBITDA by division
Diversification of profitability
I Q

7
Sabaf GroupProduct range
GAS ELECTRONIC COMPONENTSHINGES• Standard Burners• Special Burners • Professional Burners• Oven and Grill Burners• Gas Valves• Gas Oven Thermostats• Microswitches & Accessories
• Cooker Hoods• Ovens• Cookers and hobs• Air Curtain• Refrigerators/freezers• Other products
• Ovens• Dishwashers• Washing machines• Special applications• Small compartments• Catering appliances
8
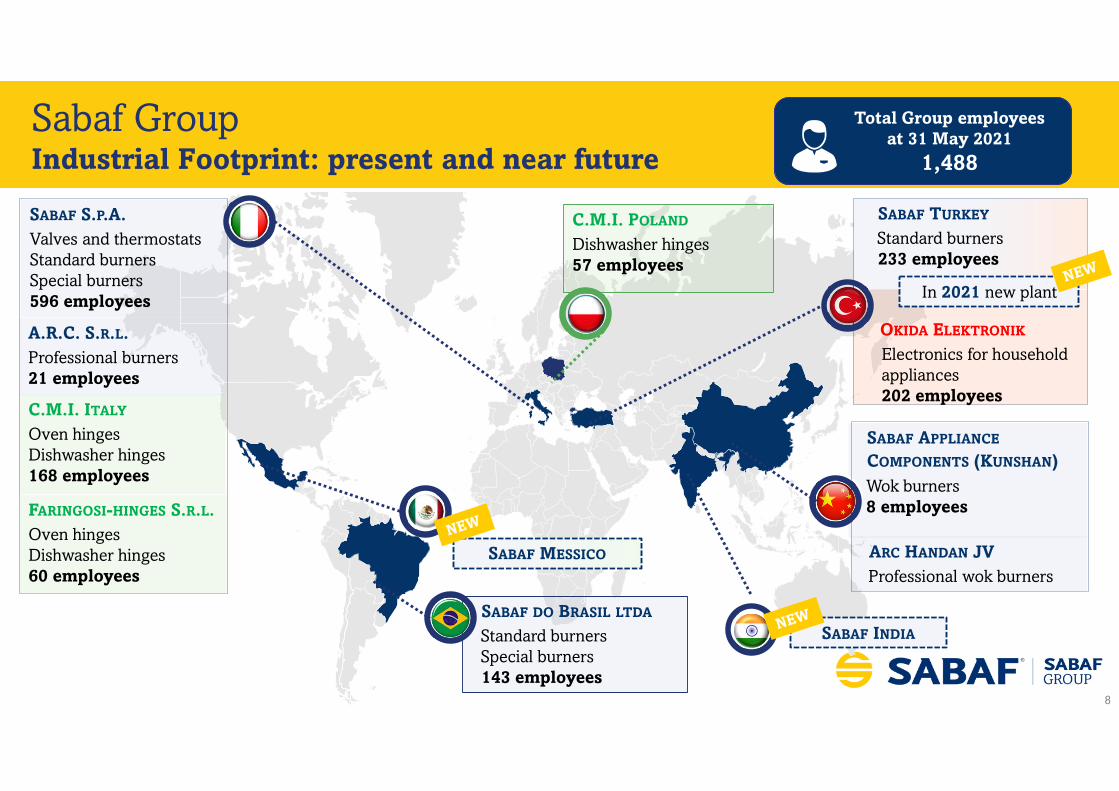
SABAF S.P.A.Valves and thermostatsStandard burnersSpecial burners596 employees
FARINGOSI-HINGES S.R.L.Oven hingesDishwasher hinges60 employees
A.R.C. S.R.L.Professional burners21 employees
SABAF TURKEY
Standard burners233 employees
SABAF APPLIANCE
COMPONENTS (KUNSHAN)Wok burners8 employees
SABAF DO BRASIL LTDA
Standard burnersSpecial burners143 employees
ARC HANDAN JV Professional wok burners
OKIDA ELEKTRONIK
Electronics for householdappliances 202 employees
C.M.I. ITALY
Oven hingesDishwasher hinges168 employees
C.M.I. POLAND
Dishwasher hinges57 employees
SABAF MESSICO
SABAF INDIA
Sabaf GroupIndustrial Footprint: present and near future
Total Group employeesat 31 May 2021
1,488
In 2021 new plant
9
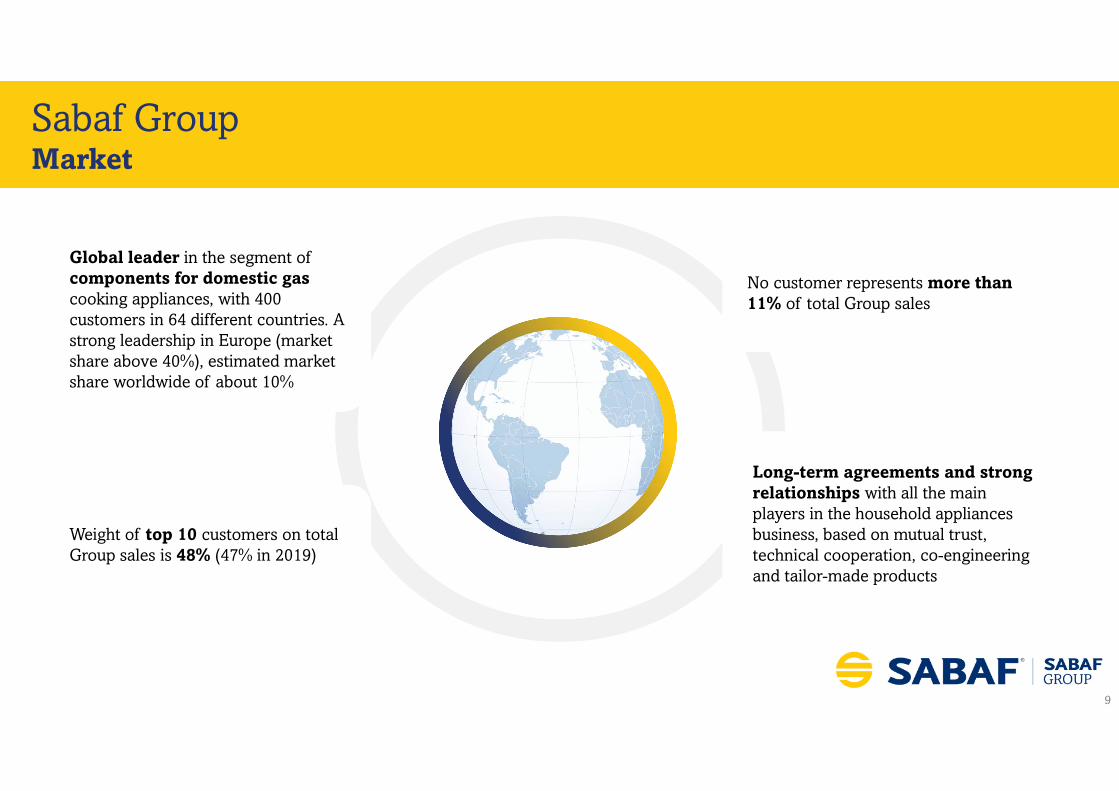
Long-term agreements and strong relationships with all the main players in the household appliances business, based on mutual trust, technical cooperation, co-engineering and tailor-made products
Global leader in the segment of components for domestic gas cooking appliances, with 400 customers in 64 different countries. A strong leadership in Europe (market share above 40%), estimated market share worldwide of about 10%
Weight of top 10 customers on total Group sales is 48% (47% in 2019)
No customer represents more than 11% of total Group sales
Sabaf GroupMarket

10
Intellectual capital: highly specialized and qualified staff (50+ R&D engineers)
Strong operational leverage: great flexibility in production volumes growth, ready to satisfy customers requests
Know-how:
Mechanical: forefront process technology -internal development of special machinery, high performance molds for robotic die-casting, high speed and high precision tools not available on the market
Electronic: strong skills in new product development
Product Innovation: about 88 active patents
Sabaf GroupProduct & technology

11
Market
% OF SHARE CAPITAL % OF VOTING RIGHTS
39.97 %
20.94 %
20.00 %
7.66 %
4.95 %
3.01 %
Cinzia Saleri S.a.p.a.
Quaestio SGR
Paloma Rheem Investments
Fintel S.r.l.
Treasury Shares
Market32.85 %
30.57 %
11.49 %
3.78 %
Cinzia Saleri S.a.p.a.
Quaestio SGR
Fintel
3.47 % Fidelity5.30 % Fidelity
Paloma Rheem Investments
16.01 %
Sabaf GroupMain Shareholders
Pietro Iotti, CEO of Sabaf, owns 1.5%

12
12 MONTHS
Market cap: € 313 mn at June 10th, 2021
Sabaf GroupStock price
Sept 20
Jan 21
24
22
20
18
16
14
12
10
Sabaf FTSE MIB Index
2021 DIVIDEND € 0.55 per share Ex-date: 31st May 2021 Dividend yield: 2.4% Payout ratio: 45.4%
Sabaf performance
Change
1-month (%) +27.2%
3-month (%) +32.8%
6-month (%) +85.6%
12-month (%) +145.9%
YTD (%) +80.1%Jan 20 May 20
I QUARTER 2021FINANCIAL PERFORMANCE
14
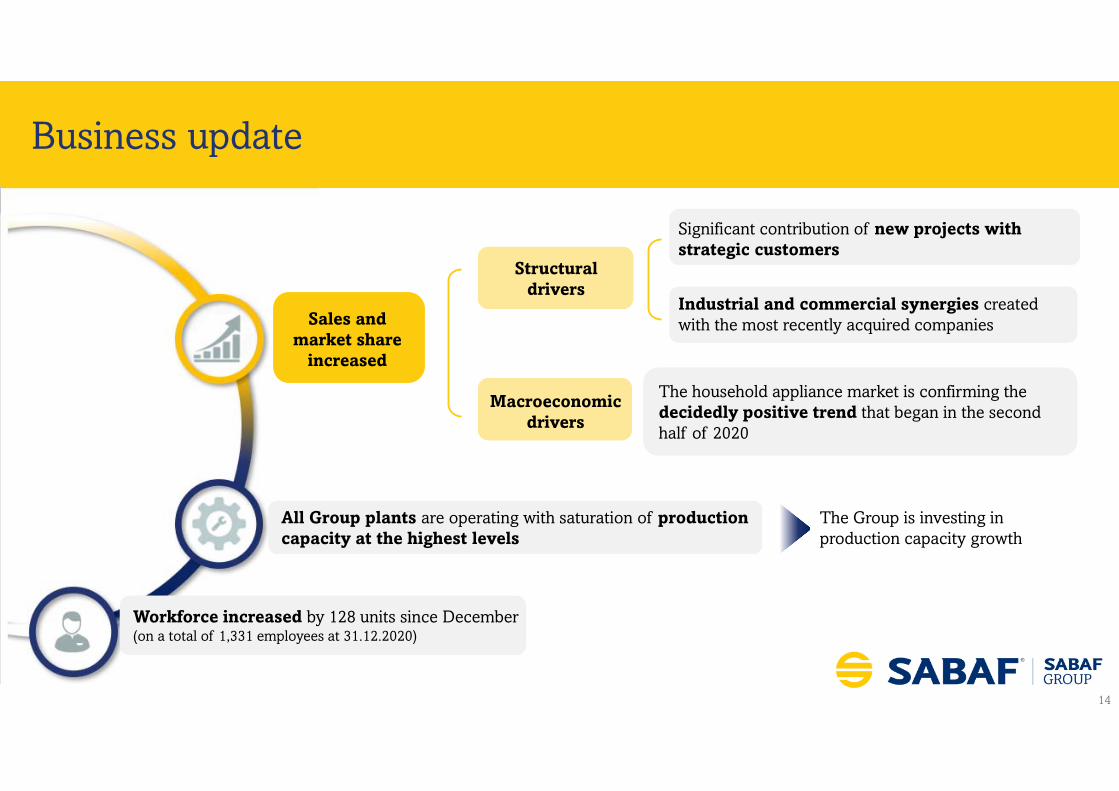
Macroeconomic drivers
Structural drivers
Significant contribution of new projects with strategic customers
Industrial and commercial synergies created with the most recently acquired companies
Workforce increased by 128 units since December (on a total of 1,331 employees at 31.12.2020)
Sales and market share
increased
All Group plants are operating with saturation of production capacity at the highest levels
Business update
The household appliance market is confirming the decidedly positive trend that began in the second half of 2020
The Group is investing in production capacity growth
15
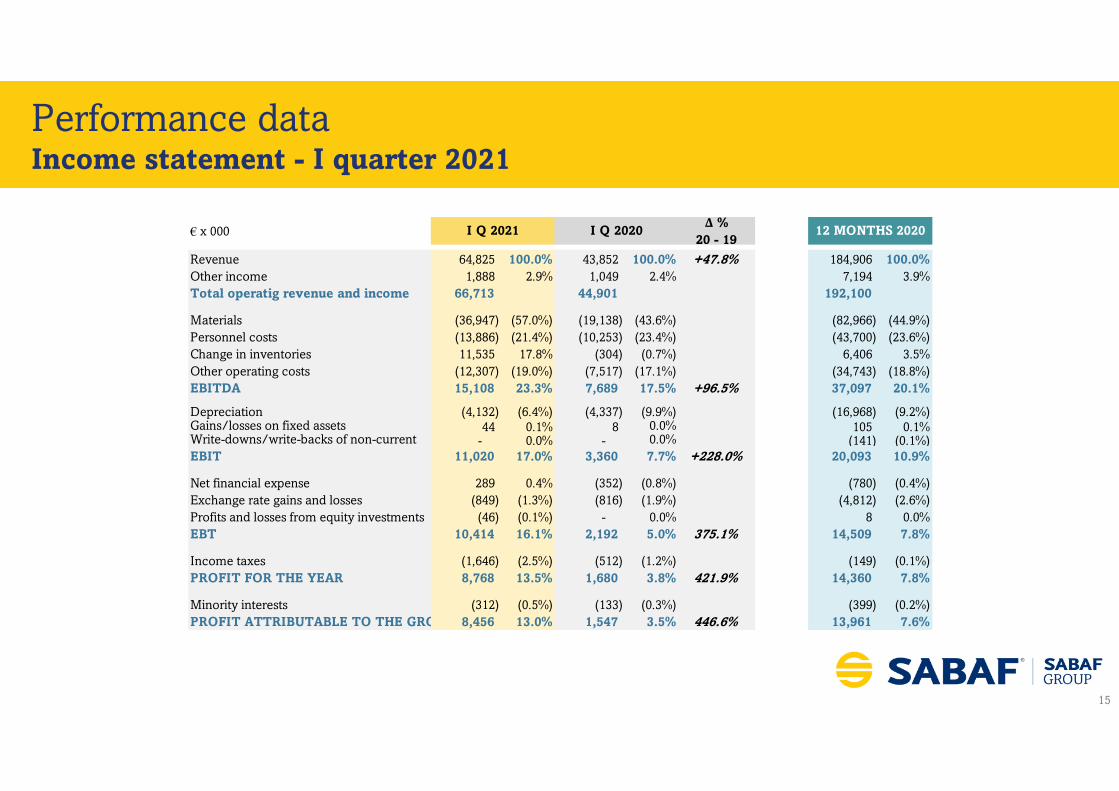
Performance dataIncome statement - I quarter 2021
€ x 000Δ %
20 - 19
Revenue 64,825 100.0% 43,852 100.0% +47.8% 184,906 100.0%Other income 1,888 2.9% 1,049 2.4% 7,194 3.9%Total operatig revenue and income 66,713 44,901 192,100
Materials (36,947) (57.0%) (19,138) (43.6%) (82,966) (44.9%)Personnel costs (13,886) (21.4%) (10,253) (23.4%) (43,700) (23.6%)Change in inventories 11,535 17.8% (304) (0.7%) 6,406 3.5%Other operating costs (12,307) (19.0%) (7,517) (17.1%) (34,743) (18.8%)EBITDA 15,108 23.3% 7,689 17.5% +96.5% 37,097 20.1%
Depreciation (4,132) (6.4%) (4,337) (9.9%) (16,968) (9.2%)Gains/losses on fixed assets 44 0.1% 8 0.0% 105 0.1%Write-downs/write-backs of non-current - 0.0% - 0.0% (141) (0.1%)EBIT 11,020 17.0% 3,360 7.7% +228.0% 20,093 10.9%
Net financial expense 289 0.4% (352) (0.8%) (780) (0.4%)Exchange rate gains and losses (849) (1.3%) (816) (1.9%) (4,812) (2.6%)Profits and losses from equity investments (46) (0.1%) - 0.0% 8 0.0%EBT 10,414 16.1% 2,192 5.0% 375.1% 14,509 7.8%
Income taxes (1,646) (2.5%) (512) (1.2%) (149) (0.1%)PROFIT FOR THE YEAR 8,768 13.5% 1,680 3.8% 421.9% 14,360 7.8%
Minority interests (312) (0.5%) (133) (0.3%) (399) (0.2%)PROFIT ATTRIBUTABLE TO THE GRO 8,456 13.0% 1,547 3.5% 446.6% 13,961 7.6%
12 MONTHS 2020I Q 2021 I Q 2020

16
Performance dataSales - Quarter Analysis
Figures in euro million

17
Performance dataSales by market
Europe (excluding Turkey) 24,052 16,587 +45.0%
Turkey 16,276 11,099 +46.6%
North America 7,301 5,543 +31.7%
South America 9,890 6,778 +45.9%
Africa and Middle East 3,908 2,329 +67.8%
Asia and Oceania 3,398 1,516 +124.1%
Total 64,825 43,852 +47.8%
€ x 000 I Q 2021 I Q 2020

18
Performance dataSales by Division
Gas 44,589 30,722 +45.1%
Hinges 14,319 9,931 +44.2%
Electronic components
5,917 3,199 +85.0%
Total 64,825 43,852 +47.8%
€ x 000 I Q 2021 I Q 2020
19
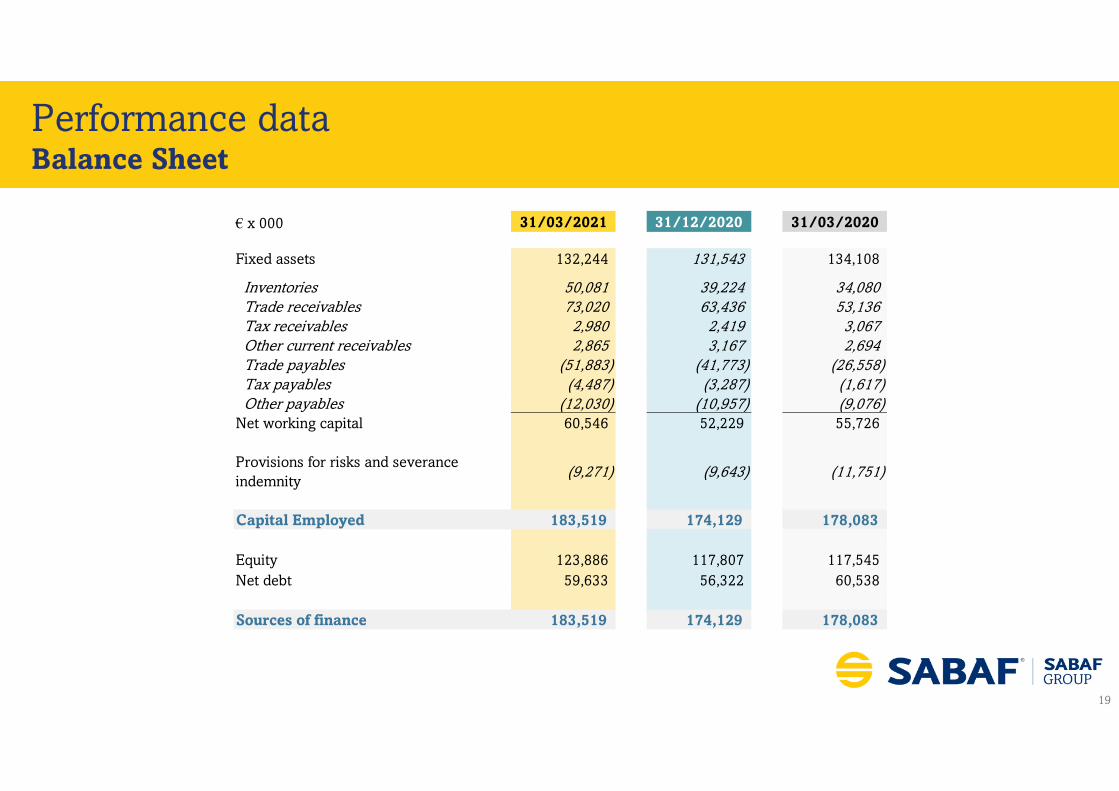
Performance dataBalance Sheet
€ x 000 31/03/2021 31/12/2020 31/03/2020
Fixed assets 132,244 131,543 134,108
Inventories 50,081 39,224 34,080 Trade receivables 73,020 63,436 53,136 Tax receivables 2,980 2,419 3,067 Other current receivables 2,865 3,167 2,694 Trade payables (51,883) (41,773) (26,558) Tax payables (4,487) (3,287) (1,617) Other payables (12,030) (10,957) (9,076) Net working capital 60,546 52,229 55,726
Provisions for risks and severance indemnity
(9,271) (9,643) (11,751)
Capital Employed 183,519 174,129 178,083
Equity 123,886 117,807 117,545 Net debt 59,633 56,322 60,538
Sources of finance 183,519 174,129 178,083

20
Performance dataCash flow statement
€ x 000 I Q 2021 12 MONTHS 2020 I Q 2020
Cash at the beginning of the period 13,318 18,687 18,687
Net profit 8,768 14,360 1,680 Depreciation 4,132 16,968 4,337 Other income statement adjustments 1,087 1,873 1,116 Change in net working capital - Change in inventories (10,857) (3,881) 1,263 - Change in receivables (9,584) (16,507) (6,207) - Change in payables 10,110 14,213 (902)
(10,331) (6,175) (5,846) Other changes in operating items 324 (1,959) (1,041)
Operating cash flow 3,980 25,067 246
Investments, net of disposals (6,718) (17,296) (3,339) Free Cash Flow (2,738) 7,771 (3,093)
Cash flow from financial activity 1,637 (2,136) (991) Own shares buyback - (2,073) (722) Dividends - (3,924) - CMI Acquisition - (3,063) - Forex (374) (1,944) (925) Net financial flow (1,475) (5,369) (5,731)
Cash at the end of the period 11,843 13,318 12,956
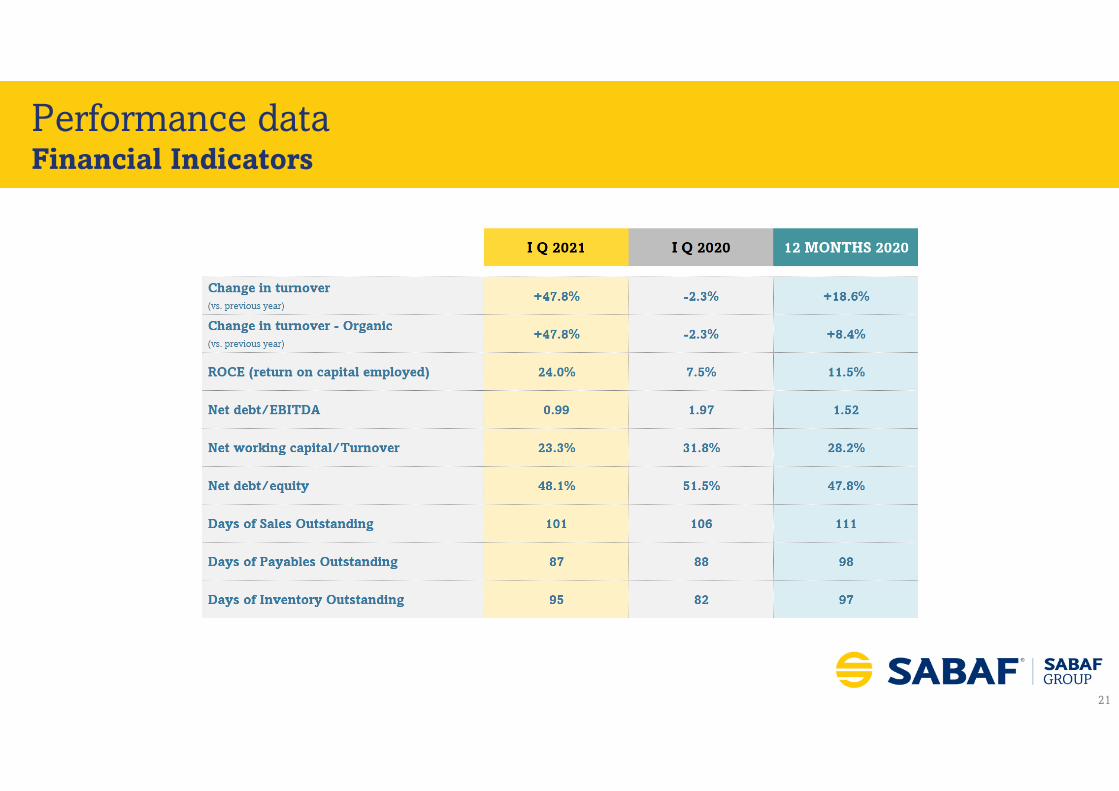
Working capital
• Increase in working capital due to the increase in inventories, as a result of the need to ensure continuity of supplies and to limit the impact of changes in raw material prices
• Nevertheless lower incidence of NWC on turnover: 23.3% compared to 31.8% at 31 March 2020 and 28.2% at 31 December 2020
Investments
The high levels of activity led the Group to bring forward to 2021 some investments originally planned for 2022, where growth is considered structural, in order to be able to guarantee continuity in supplies to customers and full production efficiency
21
Performance dataFinancial Indicators
2021 OUTLOOK

2323
These forecasts assume a macroeconomic scenario not affected by unpredictable events. If the economic situation were to change significantly, actual figures might diverge from the forecasts.
more than 21%EBITDA
more than€240 mn SALES
TOTAL 2021 SALES: >30% on 2020 (€184.9 mn) and > 54% on 2019 (€155.9 mn)
Previous forecast released on 23rd March 2021: €210 million (+14% on 2020)
I QUARTER 2021 Activity remaining on the high side, in line with that of the first months of the year, with all markets continuing to show a very strong demand
II HALF 2021 Trend expected to continue
Operating profitability (EBITDA %) of more than 21% of sales (previous forecast: at least 20%)
EBITDA 2021
• Diversification of Group's offer• Favorable trend in sales prices • Full utilization of production capacity
Will balance unfavorable raw materials
Outlook 2021

24
Sales expected to be higher than €240 million
> 30% vs. 2020
Revenues: 2019 – 2021E
REVENUESeuro mn
EBITDA% on revenues
155.9
184.9
240
17.3%
20.1%
21%
E

BUSINESS PLAN 2021 - 2023

26
Business plan 2021 – 2023
around
€300 mnSALES
TOTAL SALES by 2023+62% vs. 2020 CAGR > 17.5%
• Organic CAGR >10%: around € 250 mn sales by 2023
• M&A: € 50 mn sales by 2023
EBITDA at least 19% on sales
€130 mn INVESTMENTS in 3 years• Organic: € 58 mn capex,
of which € 46 mn for growth and € 12 mn in maintenance
• M&A: up to € 72 mn investment
€ 20 mn
DIVIDENDS in 3 years• Total amount higher than previous years
(2018 - 2020: € 16 mn) • Lower payout to support future growth
FINANCIAL LEVARAGE Net debt/EBITDA around 2.0~ 2.0
FINANCED with:
• OPERATING CASH FLOW € 85 mn in 3 years
• NEW FINANCIAL DEBT up to € 65 mn by 2023
ROI 12.5%Compared to 11.5% in 2020
at least +100 bps
€57 mnEBITDAby 2023
KE
Y P
OIN
TS

27
Business plan 2021 - 2023Organic growth
Figures in euro million
CAGR: +10.6%

28
Business plan 2021 - 2023Organic growth - Market development
MARKET 2020 2021 2022 2023 Var % 2023 vs. 2020 CAGR
EUROPE (excl. Turkey) 69.6 76.3 80.3 86.6 +24.5% 7.6%
TURKEY 44.8 51.6 55.6 56.6 +26.3% 8.1%
NORTH AMERICA 22.7 27.5 32.2 37.2 +63.6% 17.8%
SOUTH AMERICA 27.6 29.0 30.4 32.9 +18.9% 5.9%
AFRICA AND MIDDLE EAST 12.2 14.1 14.1 16.1 +32.5% 9.8%
CHINA AND FAR EAST 6.8 10.3 11.5 14.2 +101.1% 28.1%
INDIA 1.2 1.7 4.3 6.9 +468.0% 78.4%
TOTAL 184.9 210.5 228.4 250.5 +35.5% 10.6%
Growth vs. previous year +13.9% +8.5% +9.7%
Figures in euro million
29
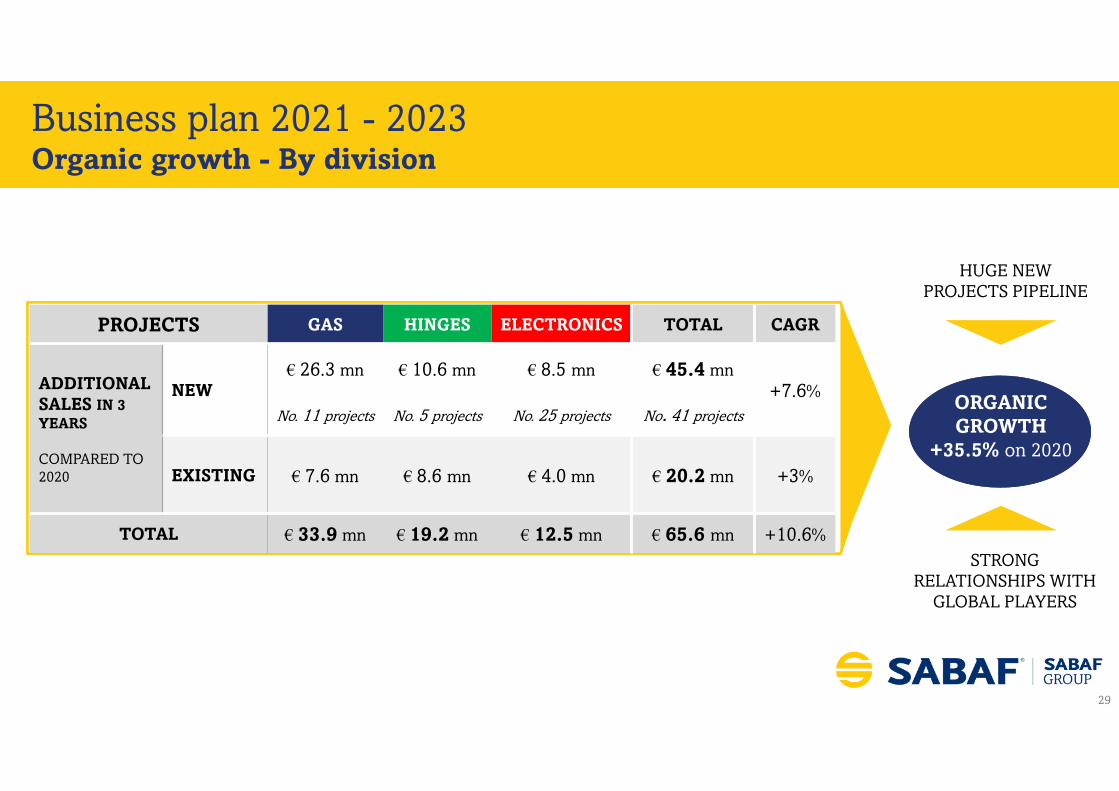
Business plan 2021 - 2023Organic growth - By division
ORGANIC GROWTH
+35.5% on 2020
HUGE NEW PROJECTS PIPELINE
PROJECTS GAS HINGES ELECTRONICS TOTAL CAGR
ADDITIONAL SALES IN 3 YEARS
COMPARED TO 2020
NEW€ 26.3 mn € 10.6 mn € 8.5 mn € 45.4 mn
+7.6%No. 11 projects No. 5 projects No. 25 projects No. 41 projects
EXISTING € 7.6 mn € 8.6 mn € 4.0 mn € 20.2 mn +3%
TOTAL € 33.9 mn € 19.2 mn € 12.5 mn € 65.6 mn +10.6%
STRONG RELATIONSHIPS WITH
GLOBAL PLAYERS

30
RESEARCH & DEVELOPEMENT
R&D activities will focus on ad hoc solutions to meet the needs of individual markets and on the design of customized products
More than 50 R&D engineers in force
Product innovation will be oriented to the following areas:
GAS Premium flame valves High performances burners for better combustion efficiency New burners for North America market New models of professional burners
HINGES Hinges for top load washers Customized hinges for specific markets and customers Motorized hinges
ELECTRONICS Development of new oven controls Vitroceramic hobs control cards Completion of product range for cooker hood controls Feasibility study of induction cooking Development of products for new business sectors like medical
appliances, dishwashers, dryers, heaters, etc.
Business plan 2021 - 2023Organic growth - R&D

31
Business plan 2021 - 2023Organic growth - New facilities
3 NEW PRODUCTION
FACILITIES
MEXICO
INDIA
TURKEY
Production: burners and hinges for North and Central America markets
Investments: € 5 mn in 3 years Expected capacity: € 11 mn Start of production: end of 2022
Production: valves and burners for local market and potential export
Investments: € 5.2 mn in 3 years Expected capacity: € 6 mn Start of production: second half of 2021
Production: hinges and electronic components Investments: € 6 mn in 3 years Expected capacity: € 11 mn Start of production: June 2021
Total capacity increase: € 28 mn by 2023
Countries with strong prospective growth

32
Business plan 2021 - 2023Organic growth - Industrial footprint
• 14 Companies• 10 Production plants as of 2020• 13 Production plants by 2022
(5 in Italy and 8 abroad)
3 new production plants by 2022(Turkey, Mexico and India)

33
Business plan 2021 - 2023Organic growth - Sustainability
Sabaf's strategy and governance model are aimed towards ensuring long-term sustainable growth.For Sabaf, sustainability is primarily based on sharing values with its stakeholders; compliance with common
values increases mutual trust and encourages knowledge development.
“ “
1
BUSINESS PLAN KPI
Area KPI
Development ofresources and skills
Hours of training per capita
Health and safetyAccident frequency rate
Accident severity rate
Eco-efficiency and Emissions into the atmosphere
tCO2eq emissions on sales
SABAF GROUP VISION
«We believe in a world in which all
people’s basic needs, such as home,
food and reliable energy, are fulfilled in
an environmentally sustainable way.
We promote a company that improves
the quality of the environment and the
communities where we live and work»
SDGs
2
3

34
Business plan 2021 - 2023Growth by acquisitions - M&A Strategy
1
2
3
4
INVESTMENT SECTORS
Preservation of the identity of acquired companies, which maintain their brand,local supply chain and workforce
Preferably seller is taken onboard as a director and/or minority shareholder
From an entrepreneurial to an industrial approach
Joint effort for growth and positives influence on margins
Retention of talents and soft skills
Achievement of significant commercial and industrial synergies
M&A as a tool for achieving long-term targets through:
• the acquisition of know-how and technologies
• the expansion of the product offer• the opening to new markets• the risk diversification• the ability to scale the business
quickly
Growth of the competitive advantage by differentiating the
Sabaf value proposition from competitors
COMPONENTS FORHOUSEHOLD APPLIANCES
ELECTRONICS
HEATING
PROFESSIONAL COOKING

35
Business plan 2021 - 2023Growth by acquisitions - Target profile
TARGET PARAMETERS
SHAREHOLDING
TURNOVER
EBITDA
EBITDA MULTIPLES Non-dilutive
M&A TEAMDedicated to scouting and development of business contacts, creation of an internalData Base, analysis and evaluation of opportunities, management of negotiations
Preference for entrepreneurial ownership
Steady positive results over past yearsNo turnarounds
€ 5 - 70 mn sales

36
Around € 300 mn sales
Total growth: 62% by 2023 vs. 2020 (Organic and by acquisitions growth)(CAGR 17.5%)
HIGH PROFITABILITY(EBITDA AT LEAST 19%)HIGH PROFITABILITY
(EBITDA AT LEAST 19%)
NET DEBT/EBITDA~ 2.0
NET DEBT/EBITDA~ 2.0
Investments and dividends, for a total amount of € 150 mn financed with: Operating cash flow: € 85 mn New financial debt: € 65 mn
Dividends: € 20 mn
Total investments € 130 mn of which: € 58 mn organic growth € 72 mn growth by acquisitions ROI > 12.5%
COMPARED TO 11.5% IN 2020ROI > 12.5%
COMPARED TO 11.5% IN 2020
Sustainability targets: Hours of training per capita Accident frequency and severity rates CO2 emissions reduction
Business plan 2021 - 2023Summary - Targets

DISCLAIMERCertain information included in this document is forward looking and is subject to important risks and uncertainties that could causeactual results to differ materially.The Company’s business is in the domestic appliance industry, with special reference to the gas cooking sector, and its outlook ispredominantly based on its interpretation of what it considers to be the key economic factors affecting this business. Forward-looking statements with regard to the Group’s business involve a number of important factors that are subject to change, including:the many interrelated factors that affect consumer confidence and worldwide demand for durable goods; general economicconditions in the Group’s markets; actions of competitors; commodity prices; interest rates and currency exchange rates; politicaland civil unrest; and other risks and uncertainties.Pursuant to Article 154/2, paragraph 2 of the Italian Consolidated Finance Act (Testo Unico della Finanza), the company’s FinancialReporting Officer Gianluca Beschi declares that the financial disclosure contained in this financial presentation corresponds to thecompany's records, books and accounting entries.
For further information, please contact Gianluca Beschi - [email protected]