trb webinar - biomedical engineering and mechanics · trb webinar: practical structural health...
TRANSCRIPT

TRB Webinar:Practical Structural Health Monitoring
for Bridge Owners
October 22, 20142:00 PM – 3:30 PM ET

Today’s Panelists and Moderator• Marybeth Miceli, Miceli Infrastructure Consulting
• Steven Lovejoy, Oregon DOT [email protected]
• Nicolas Betancur, Geocomp Corporation [email protected]
• John Duke, Virginia Tech / FHWA [email protected]
2

Miceli Infrastructure Consulting, LLC
A PROGRESSIVE DIAGNOSTICS APPROACH TO SHM OF BRIDGES
Marybeth MiceliMiceli Infrastructure Consulting, LLC

Miceli Infrastructure Consulting, LLC
Where Are We Going?
• The Medical Analogy– Symptoms– Diagnosis and the Law– Monitoring During &After Treatment/Remediation
• Triaging Your Bridge – Symptoms– Diagnosis– Monitoring– 8 SHM Determining Factors
• Developing a Scope of Work– NJTA Case Study
• OBJECTIVE: Outline how to use SHM in an economic& technically sound and efficient manner

Miceli Infrastructure Consulting, LLC
Diagnosis for Having Chest Pains• Triage – standard of care vs. negligence:
– Look at patient (coloring)– Take pulse– Take blood pressure– Perform EKG within minutes
• Root cause not obvious?– More testing – Decision Tree
1. EKG (irregularity?)2. Echocardiagram (ultrasound of heart)3. Stress Test4. Long-term Heart Monitoring
Only proceed with next test when current test does not help indicate root cause Would you want heart surgery delayed by more testing???
Once root cause is found, repair/treatment can begin Monitor patient during treatment and then periodically
afterwards

Miceli Infrastructure Consulting, LLC
Triaging Your “Weak” Bridge
• Visually inspect the bridge• Is the bridge showing symptoms of weakness?• If yes, less expensive and more conventional testing
begins:– NDT – VT, MT, PT, UT, ET– Where the problem is and what type of problem dictates
appropriate testing and whether more advanced testing is needed
• EX: Bridge pins – potential cracking – Subsurface– UT or RT (RT not practical due to closures)– May want to use PAUT to get full picture even though conventional UT is
required but does not give the full picture
• NDT determines there is a problem but…– Is it ongoing?– Can it be fixed?
• Is remediation feasible or is replacement the only option?– When can it be fixed?
• Do we need assurance in the interim?
Miceli Infrastructure Consulting, LLC
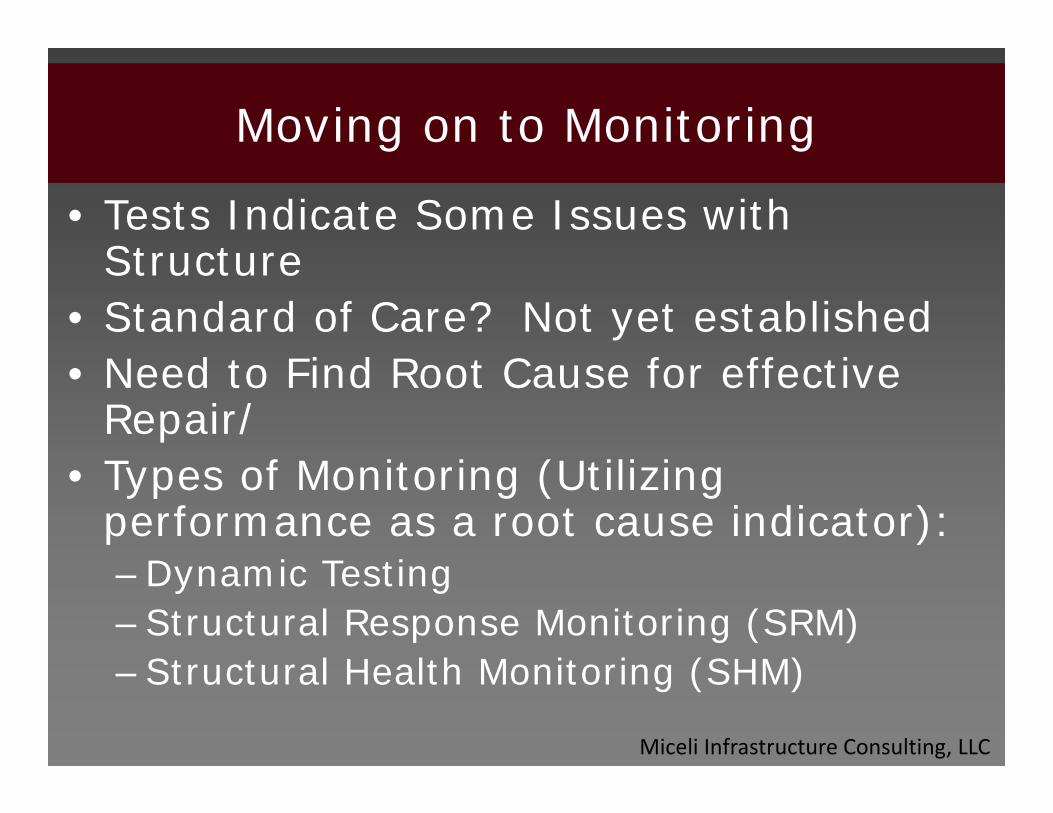
Moving on to Monitoring
• Tests Indicate Some Issues with Structure
• Standard of Care? Not yet established• Need to Find Root Cause for effective
Repair/• Types of Monitoring (Utilizing
performance as a root cause indicator):– Dynamic Testing – Structural Response Monitoring (SRM)– Structural Health Monitoring (SHM)

Miceli Infrastructure Consulting, LLC
Monitoring Categories
– Dynamic Testing – further diagnosis for root cause• Monitoring various materials and structural responses of
the structure under known loads (e.g. truck weight and load patterns) with sensors (strain, vibration, etc.) – very short term – (load rating boundary conditions)
– Structural Response Monitoring (SRM)• Monitoring response of structural components over time
under live load conditions (e.g. actual truck loads, temp., weather conditions, etc.) to look for changes – short term
– Structural Health Monitoring (SHM)• Monitoring a structure (one of concern or new) as it
degrades over time (e.g. cable stay filament breakage, facture critical bridge steel stress over long term corrosive conditions)
But what is right for MY Structure???

Miceli Infrastructure Consulting, LLC
8 Determining Factors1. Severity and condition of structure
Is your bridge “feeling weak” or does it clearly have “head trauma”?
2. Type of problemEasily monitored through biennial inspection?
3. Budget constraints What kind of insurance does your “patient” have?
4. Life extension requirements CBA – age vs. costs
5. Criticality of structureFC, SC, and also within the system
6. Access to the structure Remoteness or difficult closures sometimes warrant
monitoring vs. periodic testing7. Availability of monitoring technologies8. Reliability of technology for given situation
Consider your structure’s lifestyle

Miceli Infrastructure Consulting, LLC
When Formulating an RFP –Questions to Keep in Mind
No need to throw every form of testing at the bridge if root cause is obvious from the beginning• Do we know the root cause already?• Can it be repaired successfully? • Can we use less expensive testing before
moving on to monitoring?• Can we use less expensive monitoring before
implementing dense, long-term monitoring?• Do we need to monitor through the
repair/retrofit contract?• Is the problem recurring? (ex: impacts)

Miceli Infrastructure Consulting, LLC
Case Study - NJTA1. Severity and condition
of structure – FCM cracking at Category E
details, FCM section loss due to corrosion of the weathering steel at the joints, fractured anchor bolts on sign structures, cracking of light standard supports.
– Categorized as “fair”
2. Types of problems– FCM cracking = 148 upper girder web cracks (4 new, no growth indicated
with visual inspection from last inspection)– FCM Section Loss – D‐Meter (UT) – continuing at joint problems– “Excessive Vibrations” causing auxiliary structures to crack at bases

Miceli Infrastructure Consulting, LLC
Is SHM the Right Choice? Where Do We Start?
3. Criticality of structure– Critical to the system – detours difficult and expensive– Potential revenue impact– Fracture critical members within the structure some with pin and
hanger assemblies4. Access to the structure
– Very difficult closures – must keep in mind system reliability5. Budget constraints
– This can be less of an issue if the criticality of the structurewarrants it – both within the system and on a fracture criticalmember basis
6. Life extension requirements – No plans for replacement; opened in 1970– Life extension is the plan for the foreseeable future– Some stiffener welding has been performed but overall the
structure is wholly unchanged since construction7. Availability of technologies – Keep in Mind – No silver bullet!8. Reliability of technology for given situation
– Excessive vibrations noted, limited access, marine and train
Miceli Infrastructure Consulting, LLC
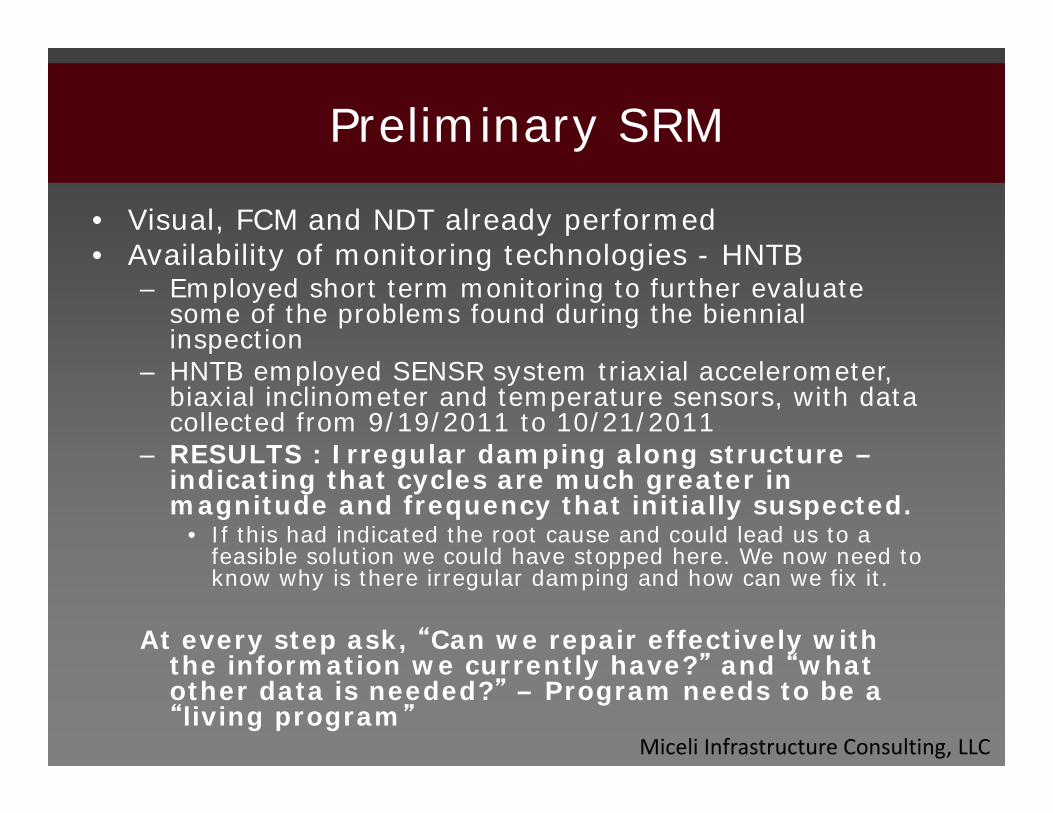
Preliminary SRM
• Visual, FCM and NDT already performed• Availability of monitoring technologies - HNTB
– Employed short term monitoring to further evaluate some of the problems found during the biennial inspection
– HNTB employed SENSR system triaxial accelerometer, biaxial inclinometer and temperature sensors, with data collected from 9/19/2011 to 10/21/2011
– RESULTS : Irregular damping along structure –indicating that cycles are much greater in magnitude and frequency that initially suspected.
• If this had indicated the root cause and could lead us to a feasible solution we could have stopped here. We now need to know why is there irregular damping and how can we fix it.
At every step ask, “Can we repair effectively with the information we currently have?” and “what other data is needed?” – Program needs to be a “living program”

Miceli Infrastructure Consulting, LLC
Getting More Quantitative• At same time – many SHM technologies introduced to owners
– Led to technologies overview report – by HNTB
• Plan was to “try out” technologies on this problem structure• Revamped to progressive diagnostics approach• Determined that a model was needed in order to simulate appropriate
repair options before implementing, due to criticality of the structure and access restrictions (toll too) – can’t use the common “wait and see” method
• Use only the monitoring needed for model – Keep in mind your END GOALS!
• How is the structure behaving under these “Excessive Vibrations”? How is the damping being achieved? What is causing these vibrations? Can we eliminate them?
– Trucks - Known vs. WIM (no weigh stations in system)
– Modeling – obtaining realistic boundary conditions – prelim SRM showed that assumed cycles in past models were not conservative

Miceli Infrastructure Consulting, LLC
The Plan
• Devised plan to determine boundary conditions –materials, modeling, monitoring– Behavior – SG, plus accel., crack monitoring
• Wrote scope – priced out – listed possible providers– Must be able to scope out exactly what you want with
the precision and DELIVERABLE that will give you the information you can USE *****
– Not just data overload• Quantifying Loads with WIM and the structural
components’ reaction – locally (SG and crack monitoring) and globally (through accelerometers)
• Turned it from research to a project with actionable data to use for bridge management/retrofit decisions

Miceli Infrastructure Consulting, LLC
The Economic Result
• Progressive Diagnostics + 8 determining factors = Ownersaving $$ & getting better/actionable data
• Original “try out” 5 different technologies plan at averageof more than $100,000 for each technology = $600,000
• New progressive diagnostics plan for SHM (w/o WIM)portion of this project is less than $300,000(anticipated).
• Monitoring should only continue until the root cause canbe found and the boundary conditions can be establishedto calibrate the model properly.
End goal: Find repair that works without having to go backand redo repairs through calibrated modeling with “real”boundary conditions.
Miceli Infrastructure Consulting, LLC
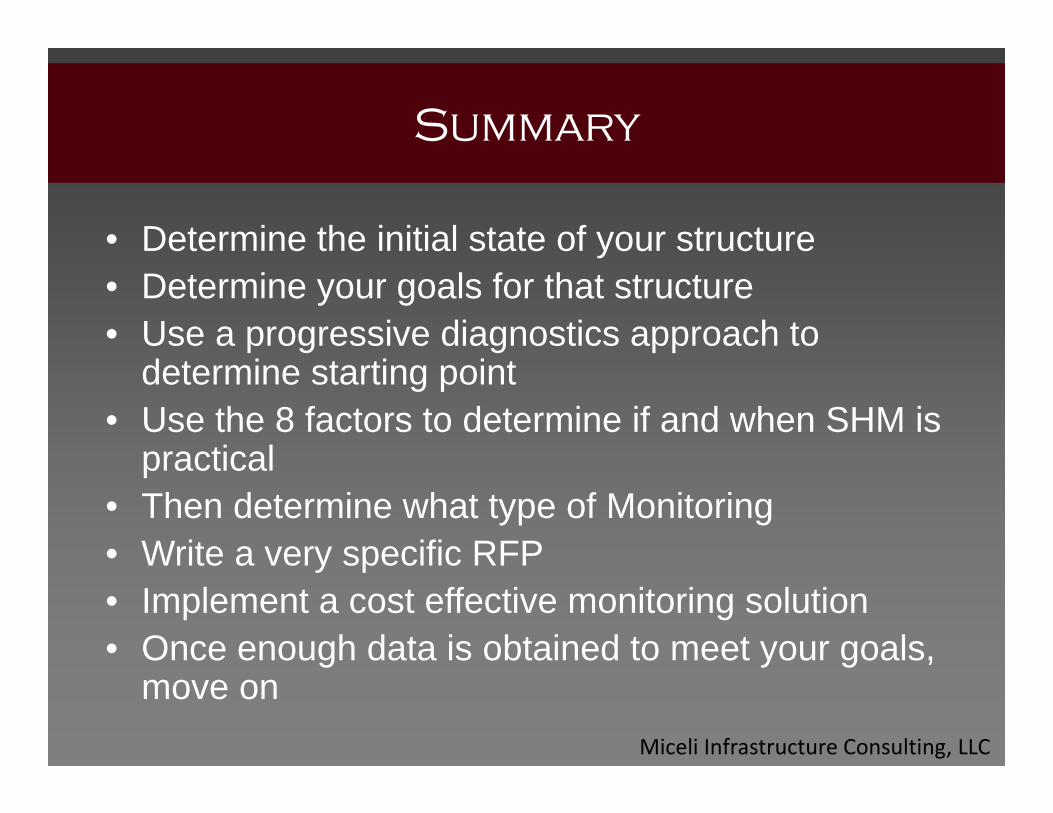
Summary
• Determine the initial state of your structure• Determine your goals for that structure• Use a progressive diagnostics approach to
determine starting point • Use the 8 factors to determine if and when SHM is
practical • Then determine what type of Monitoring• Write a very specific RFP• Implement a cost effective monitoring solution• Once enough data is obtained to meet your goals,
move on

LTBPP 2014
Steven Lovejoy
LTBPP 2014
Steven Lovejoy
ODOT’s Structural Health Monitoring Program
ODOT’s Structural Health Monitoring Program

What is the purpose of SHM?
• Detection of sudden or progressive damage to the structure
• Monitor performance under normal and extreme loading events
• Provide real-time evaluation of the effects of damage and the current serviceability of the structure

How does SHM benefit ODOT?
• Enhances the ability to extend the service life of an aging infrastructure
• Provides feedback to the structure design/load rating/retrofit process
• Enhances mobility by allowing owners to safely increase service demand on structures
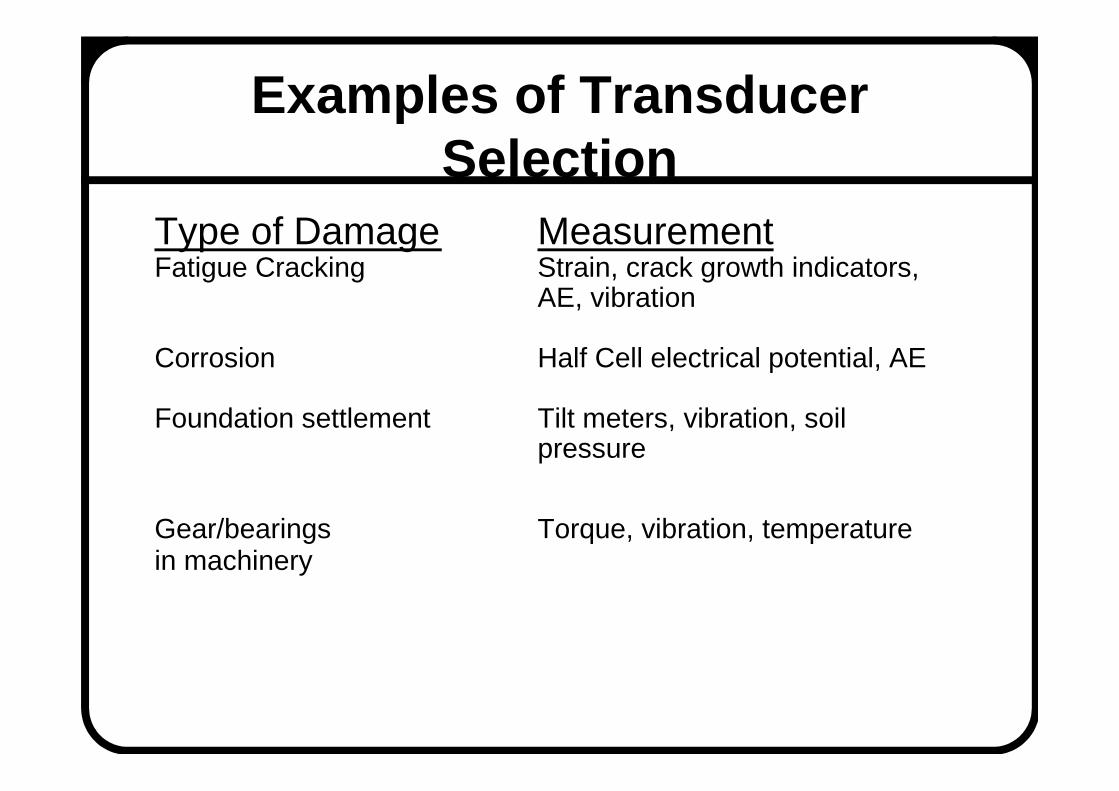
Examples of Transducer Selection
Type of Damage MeasurementFatigue Cracking Strain, crack growth indicators,
AE, vibration
Corrosion Half Cell electrical potential, AE
Foundation settlement Tilt meters, vibration, soil pressure
Gear/bearings Torque, vibration, temperaturein machinery

Fatigue Cracking
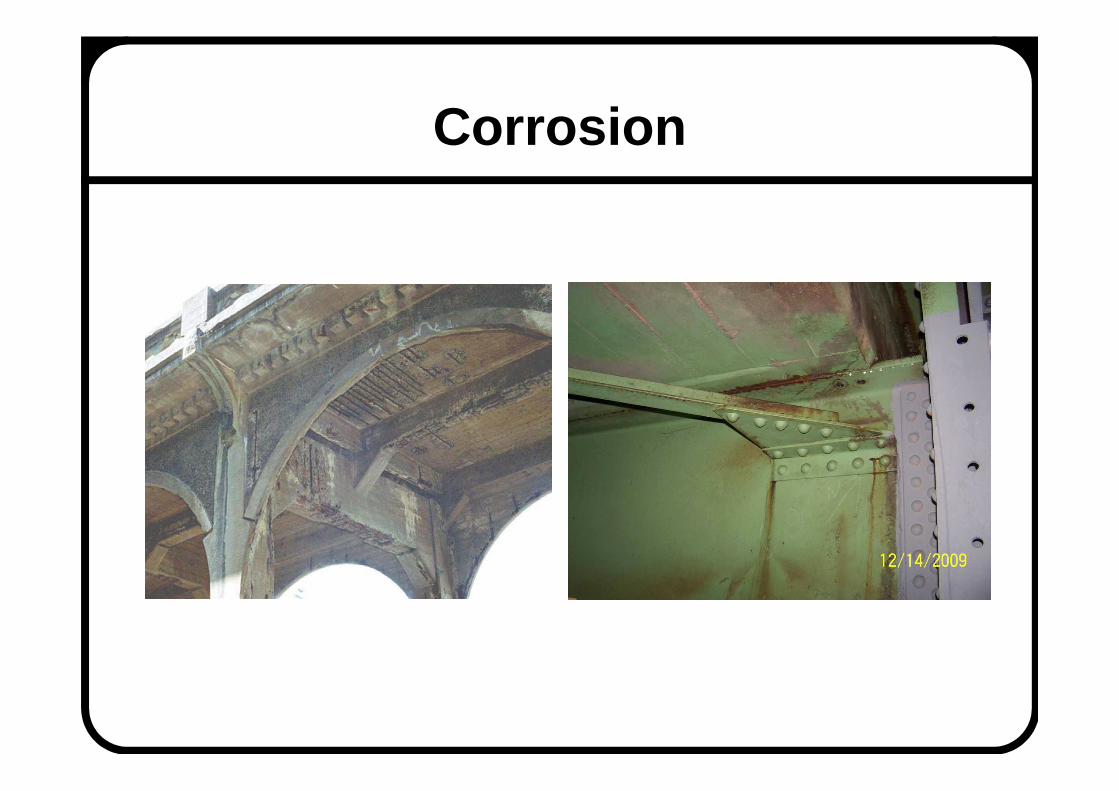
Corrosion

Machinery

Damage Identification Problem Hierarchy 1.
1) Existence (Detection)2) Location3) Type (Classification)4) Extent (Assessment)5) Prognosis (Prediction)
1. Rytter, A. (1993). Vibration based inspection of Civil Engineering structures. PhD Thesis, Department of Building Technology and Structural Engineering, University of Aalborg, Denmark.
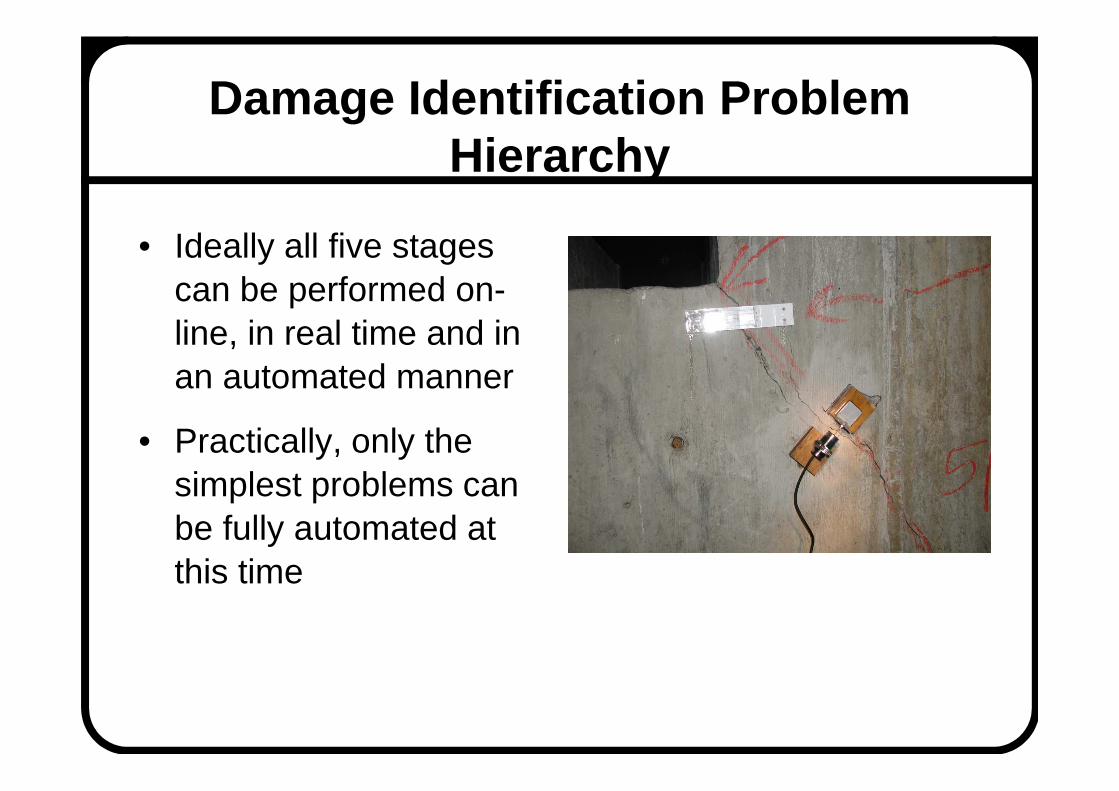
Damage Identification Problem Hierarchy
• Ideally all five stages can be performed on-line, in real time and in an automated manner
• Practically, only the simplest problems can be fully automated at this time

Damage Identification Problem Hierarchy
ODOT’s approach automates the stages that can be practically and reliably automated and performs the remaining stages manually or off-line
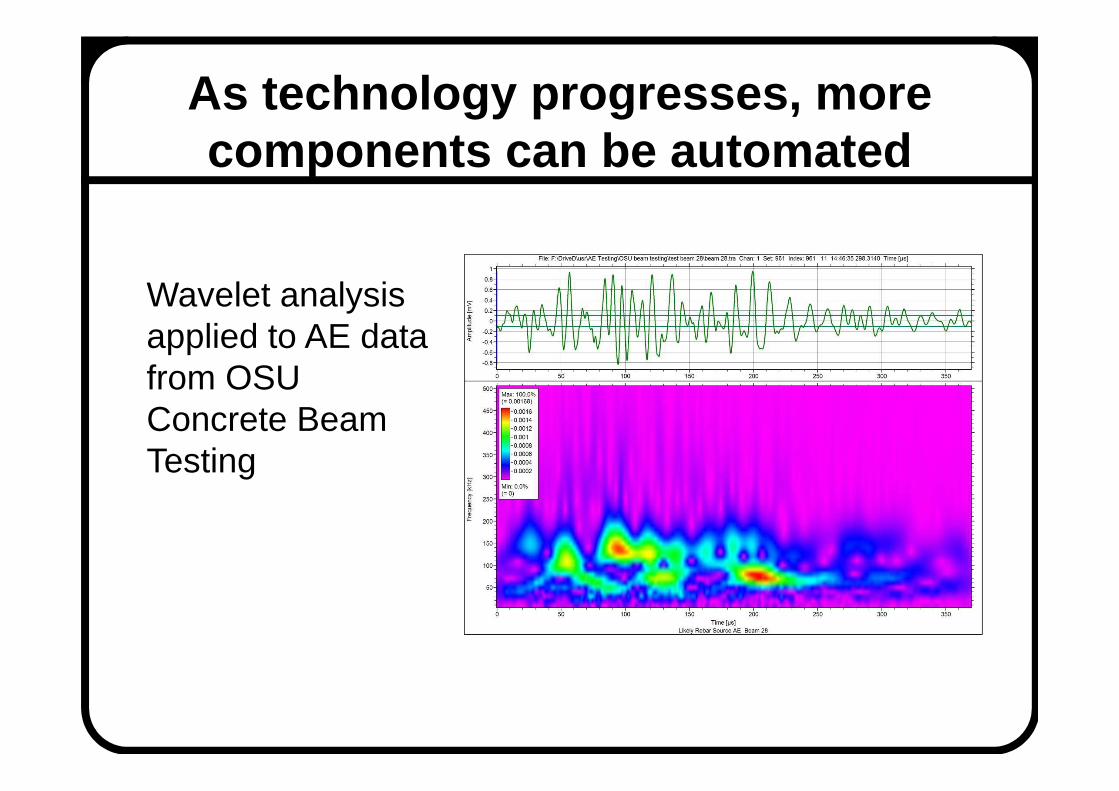
As technology progresses, more components can be automated
Wavelet analysis applied to AE data from OSU Concrete Beam Testing

Outcome of SHM
The end result of the analysis of the SHM data can have several outcomes:
1) Improved understanding of the nature of the damage mechanisms
2) Assessment of repairs or retrofits
3) Forecasting of remaining service life
4) Provide warning of serious problems to owners
5) Activate automated shut down systems ( petroleum industry) or active motion control systems ( active seismic protection systems)
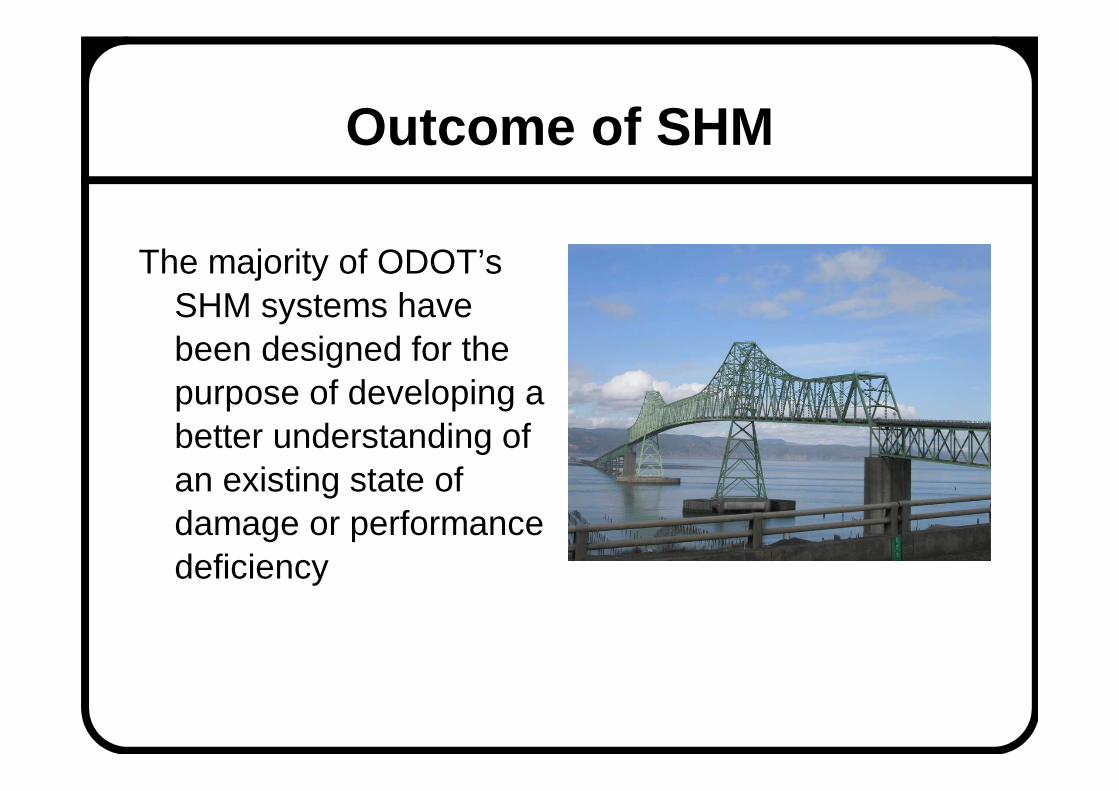
Outcome of SHM
The majority of ODOT’s SHM systems have been designed for the purpose of developing a better understanding of an existing state of damage or performance deficiency
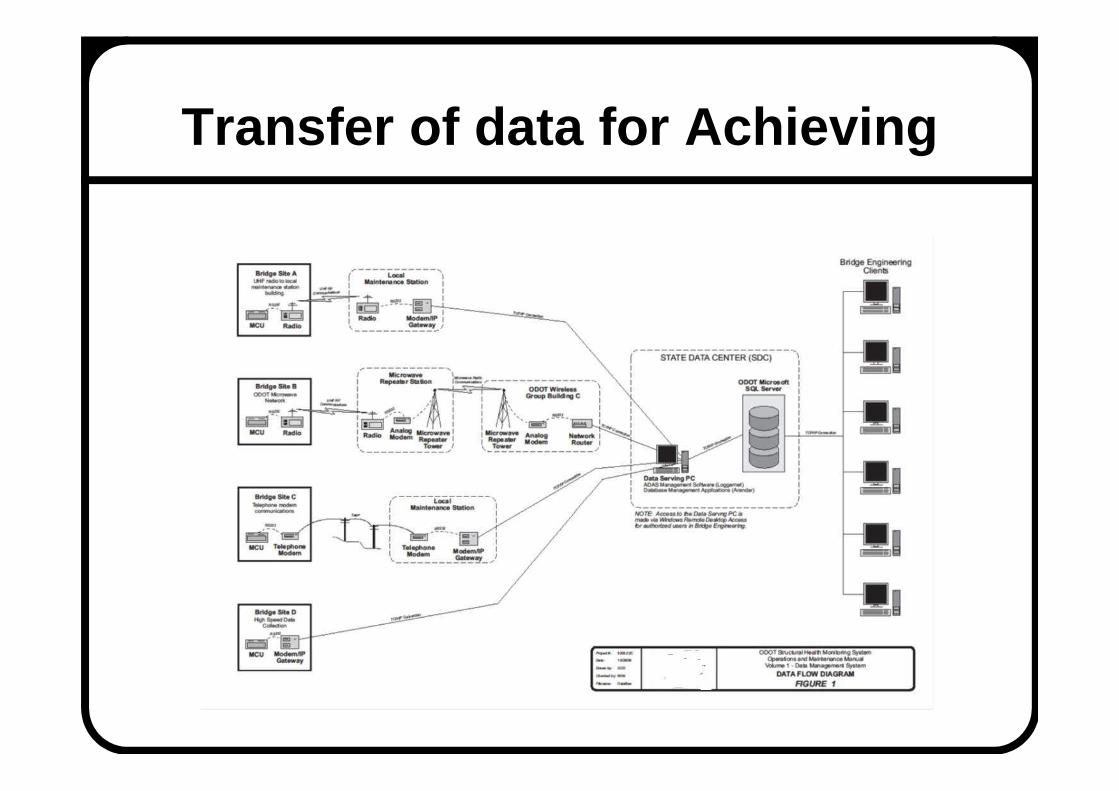
Transfer of data for Achieving

Archiving SHM data
Data are stored on a dedicated central computer server located in Salem into a common data base application
A Graphic Users Interface (GUI) provides the front end of the data base software which allows easy to find an convenient to access data management
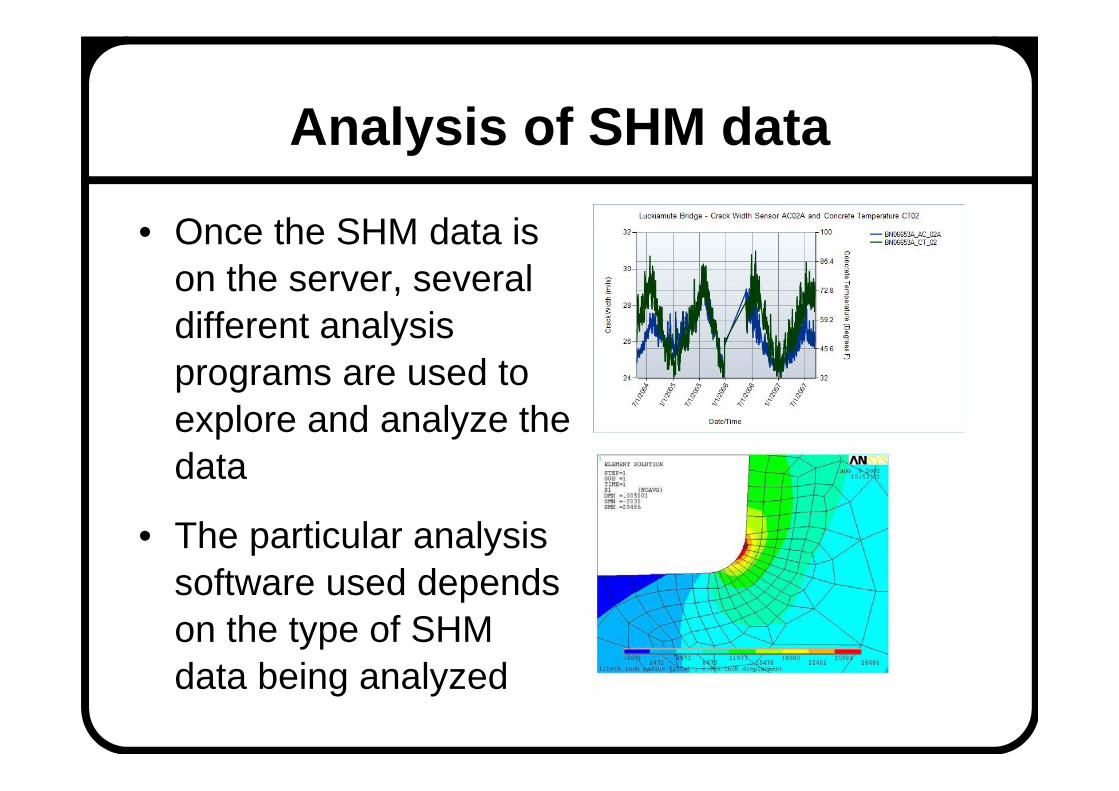
Analysis of SHM data
• Once the SHM data is on the server, several different analysis programs are used to explore and analyze the data
• The particular analysis software used depends on the type of SHM data being analyzed

ODOT Bridges with SHM
• 10 bridges with SHM systems installed
• 6 bridges have structural monitoring
• 3 bridges have mechanical monitoring
• 1 bridges have foundation monitoring

Example SHM System
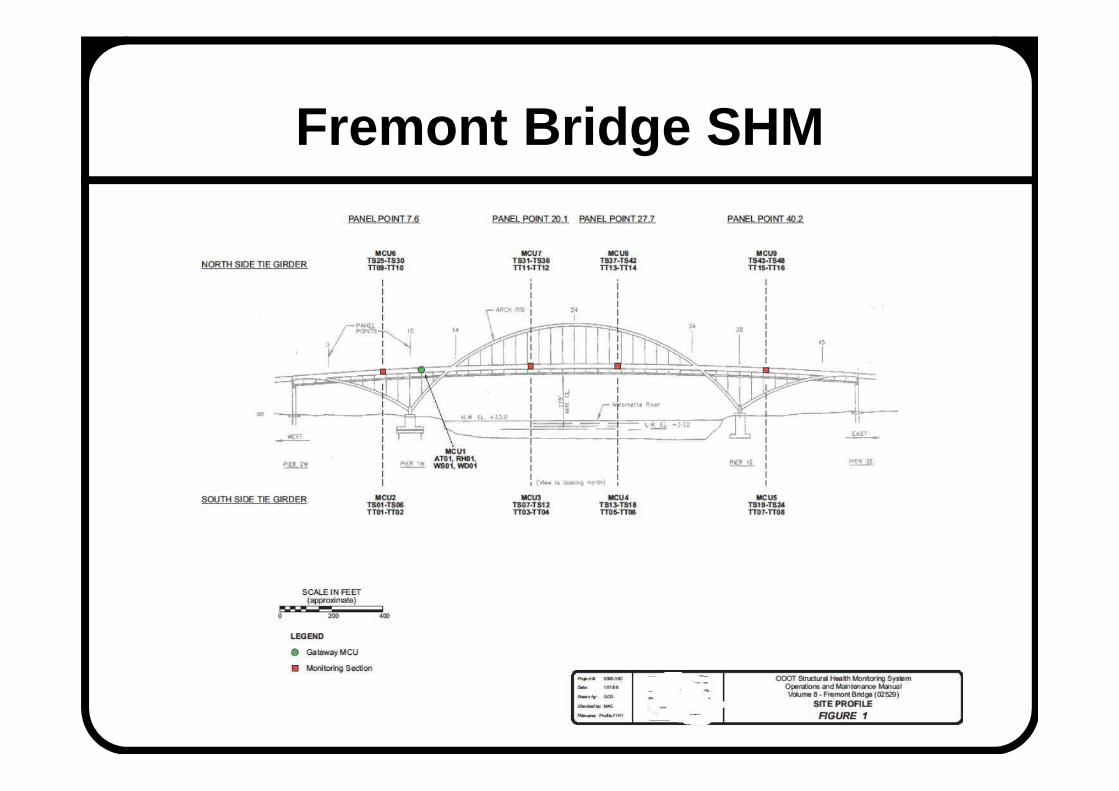
Fremont Bridge SHM

Fremont Bridge SHM

Fremont Bridge SHM

Fatigue Sensitive Details in Tie Girder

Retrofitted details
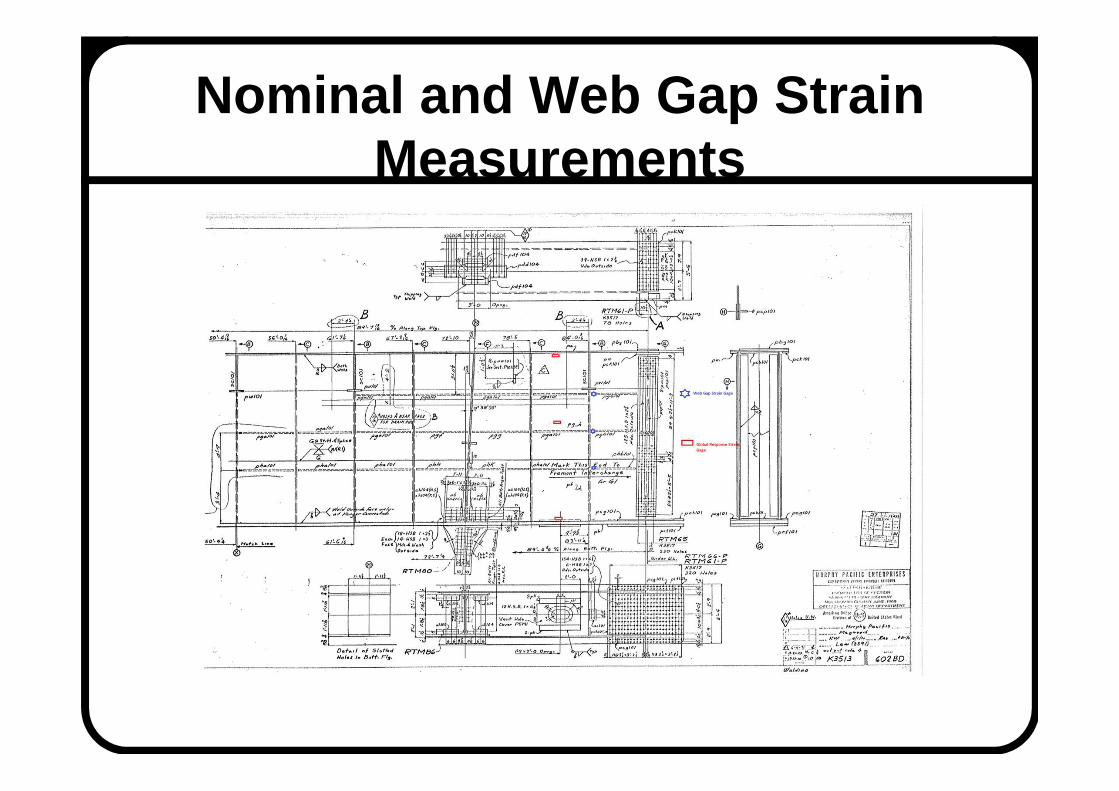
Nominal and Web Gap Strain Measurements

Maximum Strain Histogram
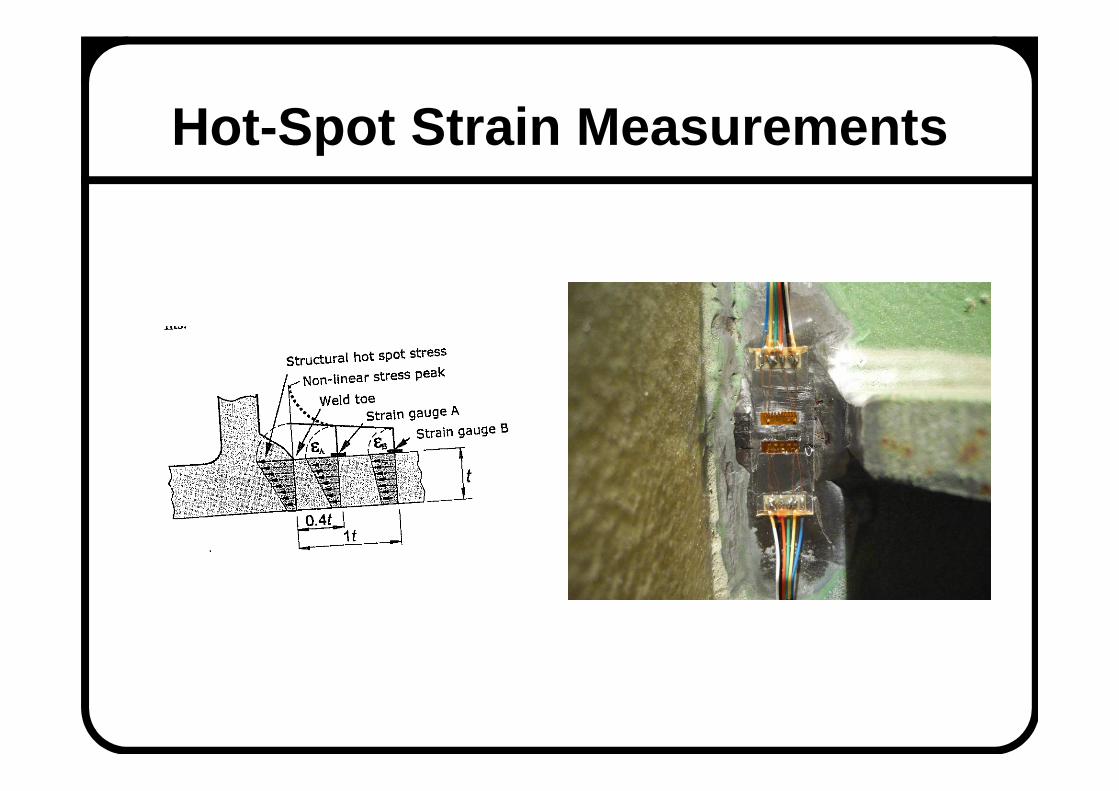
Hot-Spot Strain Measurements

AASHTO S-N Fatigue Approach
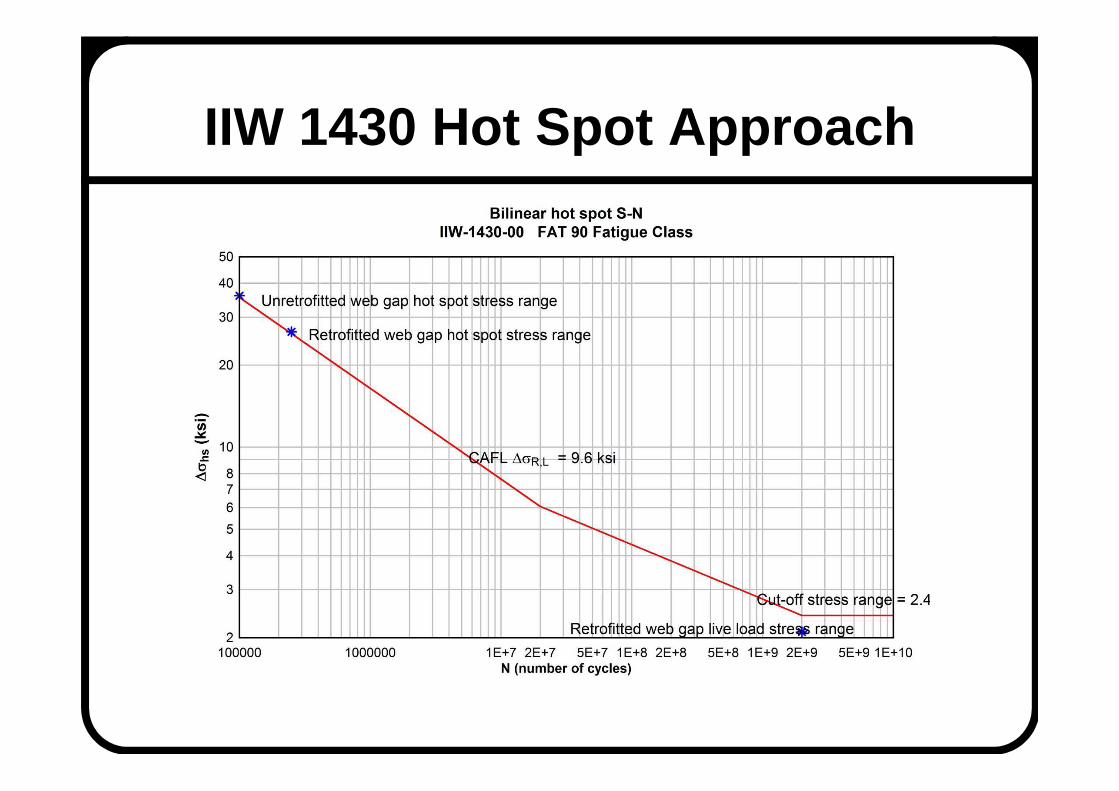
IIW 1430 Hot Spot Approach

Fracture Mechanics Approach

Conclusions
• Retrofitting of the 10,000+ fatigue details significantly increases reliability and extends fatigue life
• Only thermal loading contributes to fatigue damage
• Remaining fatigue life is on the order of 100’s of years
• Periodic visual inspection can assure safe service

Axioms of SHM
The Fundamental Axioms of Structural Health Monitoring
authored by Keith Worden, Charles Farrar, et al.
Proceedings of the Royal Society
A 2007 vol. 463 pp. 1639-1664

Axiom I
All materials have inherent flaws or defects
� Material defect size starts at the microstructural level (microns)
� Fabrication defect size are on the orders of 1 to 10 mm
� Damage can progress to 10 to 100 cm or more

Axiom I continued
• Flaws and defects can progress to damage
• Damage occurs when the structure is no longer operating in its optimal condition, but still serviceable
• A fault can progress from damage in which the structure is no longer functioning in a satisfactory or acceptable manner
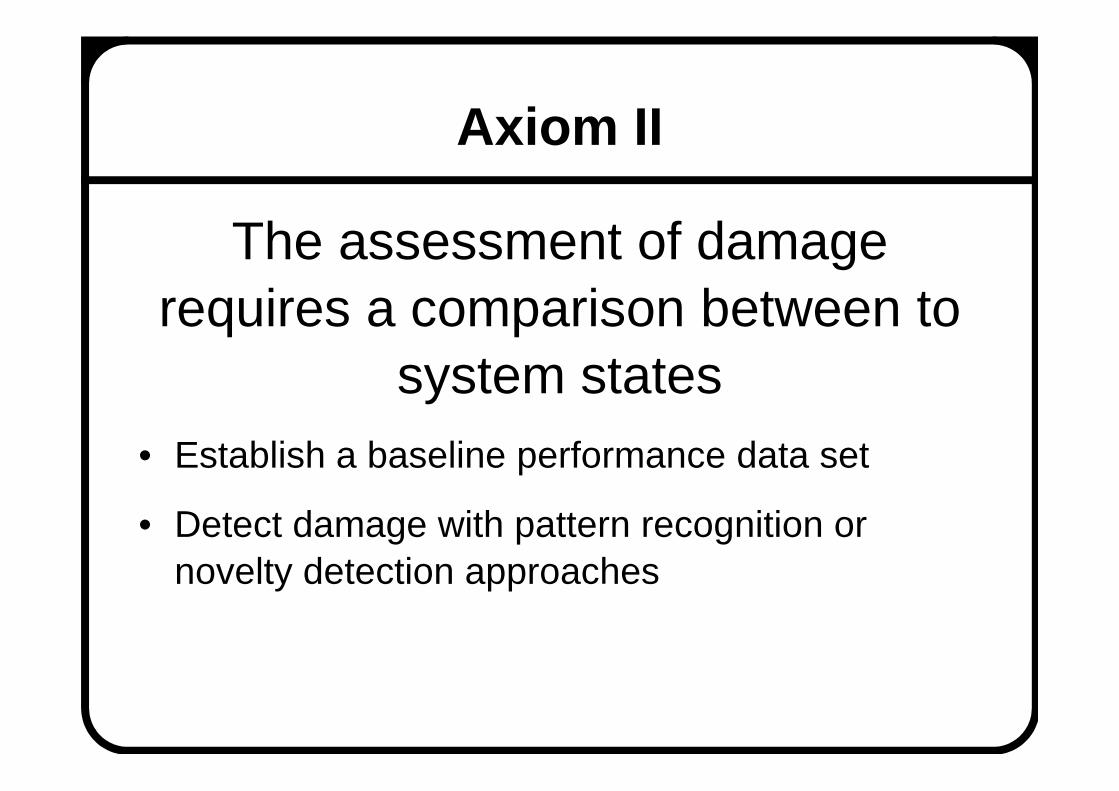
Axiom II
The assessment of damage requires a comparison between to
system states• Establish a baseline performance data set
• Detect damage with pattern recognition or novelty detection approaches
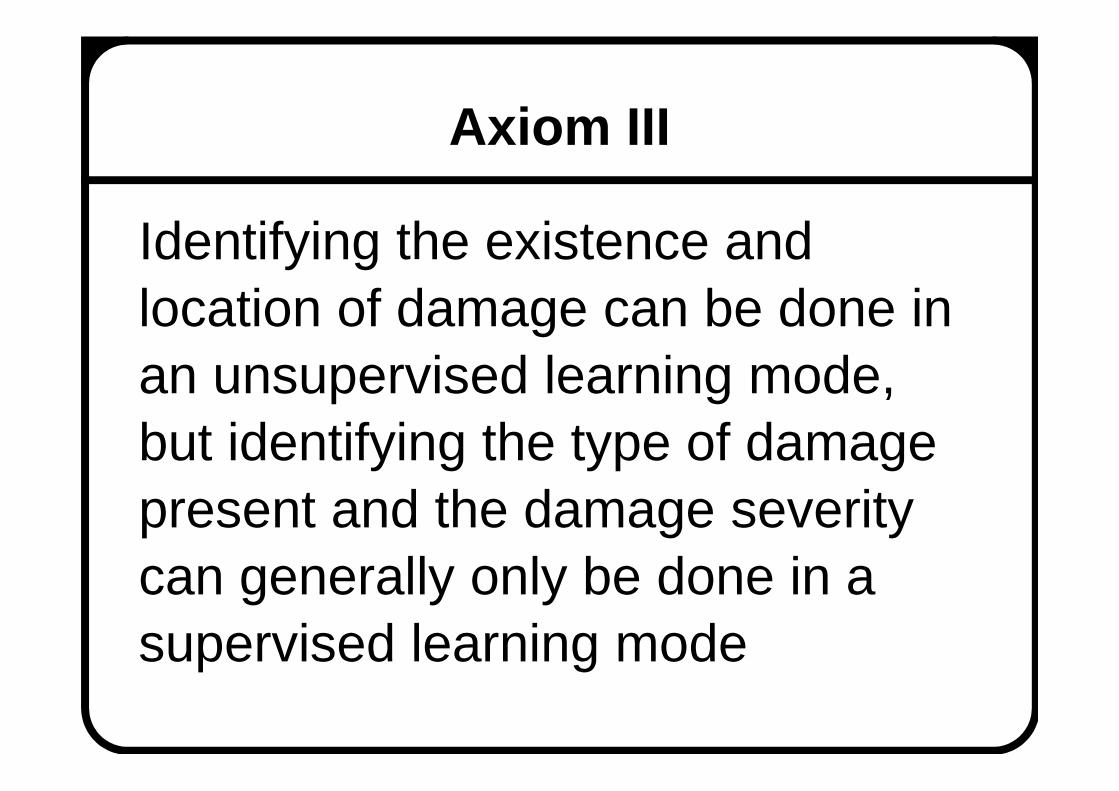
Axiom III
Identifying the existence and location of damage can be done in an unsupervised learning mode, but identifying the type of damage present and the damage severity can generally only be done in a supervised learning mode

Axiom III continued
• Algorithms which use data from both the undamaged and damaged states incorporate pattern recognition approaches and are an example of supervised learning
• Unsupervised learning refer to algorithms that are applied to data not containing examples of the damage state and utilize outlier or novelty detection approaches

Axiom IVa
Sensors cannot measure damage. Feature extraction through signal
processing and statistical classification is necessary to
convert sensor data to damage information.
Axiom IVa continued
• Sensors measure the response of a system to the operational and environmental input.
• The relationship between sensor output and system damage has to be determined with physical and/or statistical models

Axiom IVb
Without intelligent feature extraction, the more sensitive a measurement is to damage, the more sensitive it is to changing operational and environmental conditions.
Axiom IVb (continued)
• The challenge is to develop damage measurement methods that are very sensitive to damage and yet not overly effected by operational and environmental noise or false interpretation of damage.

Axiom V
The length- and time-scales associated with damage initiation and evolution dictate the required
properties of the SHM sensing system
Axiom V continued
• Length Scales are determined by the amount of required coverage from small component based system to large full structure system
• Time scale are determined by both the time scale of damage evolution and accumulation
• On these length and time scales how does the operational and environmental conditions effect the damage measurement data?

Axiom VI
There is a trade-off between the sensitivity to damage of an
algorithm and its noise rejection capability
• Care must be taken to achieve a high signal to noise ratio for damage detection in real systems.

Axiom VII
The size of damage that can be detected from changes in system dynamics is inversely proportional
to the frequency range of excitation.

Axiom VII continued
• Structural vibration analysis typically involves measuring frequencies less than 1000 Hz
• This will only detect large changes in stiffness or mass in a typical highway bridge
• To detect damage on the order of a few inches ( fatigue crack) you must interrogate at MHz, e.g. Acoustic Emission

Conclusions
An aging infrastructure has forced owners to use new technologies to extend the service life of bridge structures
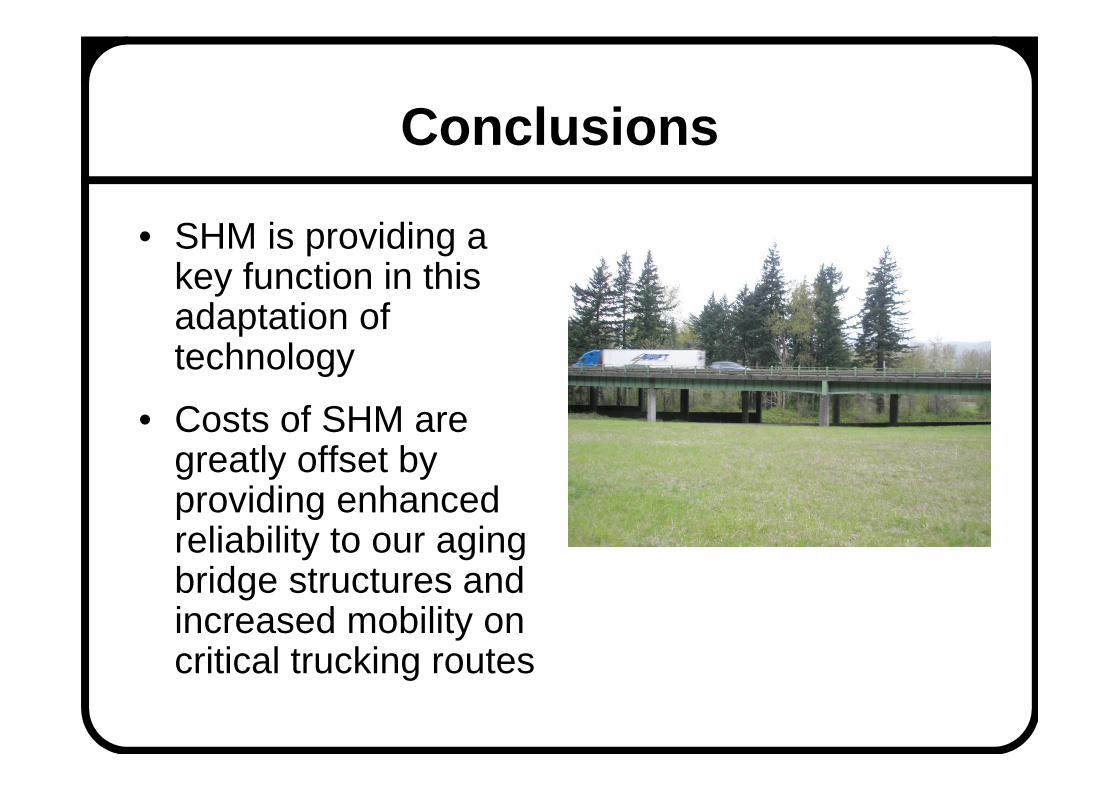
Conclusions
• SHM is providing a key function in this adaptation of technology
• Costs of SHM are greatly offset by providing enhanced reliability to our aging bridge structures and increased mobility on critical trucking routes

Conclusions
ODOT has found applying SHM to specific problems opposed to general monitoring to be the most effective and efficient use of limited resources

Questions?

I-91 Springfield ViaductStructural Health Monitoring
Case Study
Presented to:Transportation Research Board
Present By:Nicolas Betancur
October 22, 2014 Geocomp Corporation
Presentation Organization
I-91 Springfield Viaduct The problem Initial Investigation Instrumentation Plan Structural Health Monitoring System Dynamic Response Data Accomplishments Q&A

I-91 Springfield Viaduct

Built in 1960’s. Located in Springfield, MA Critical part of Interstate Highway System serving
western MA and CT I-91 NB+I-291 EBR 67 spans, 321,000 SF of
bridge deck I-91 SB+I-291 WBR 62 spans, 293,000 SF of
bridge deck Approximately 4,400 feet in length 3 Lanes per direction Traffic Volumes:
I-91 Springfield Viaduct
72,000 veh on weekdays 54,000 veh on weekends
AM Peak: 4,500 vph PM Peak: 5,700 vph

The Problem
MassDOT annual maintenance cost $2M and increasing
Full replacement or relocation would take too long to put in place
Need for bridge deck replacement due to poor condition
Structural Life Extension Accelerated Bridge Construction (ABC) Two parking structures exist within bridge limits Estimated full superstructure replacement $800M

Initial Investigation by CME Associates
Satisfactory substructure condition
Viable full deck replacement with precast panels from structural capacity standpoint
Fatigue investigation:
85 spans contain girders with partial length cover plates (766 total girders w/ plates) Infinite Fatigue Life Threshold Limit: 2.6 ksi Calculated Fatigue I Stress: 3.4 ksi
Virtually every span contains fracture critical cap girders
Bending stress in bottom flange of cap girders Infinite Fatigue Life Threshold Limit: 12.0 ksi Calculated Fatigue I Stress: 9.1 ksi

Bridge Rehabilitation Options
Girders with partial length cover plates: Bolted splice plates for bottom flanges Peening of cover plate welds Strain gauging of girders at cover plates for
accurate measure of live load stresses
Fracture critical steel cap girders: Bolt angles between connection plate and
bottom flange to eliminate out-of-plane distortion
Attached connection plate to bottom flange with fillet welds

Bridge Rehabilitation Options
Bending Stress in bottom flange of cap girders: Strain gauging of girders for accurate measure
of live load stresses Install cover plates on bottom flanges of cap
girders Post-tensioning systems as redundant load path
systems Make cap girders composite with concrete deck

Instrumentation Plan Hanger Plates and Floor Beams

Installation of Strain Gages Hanger Plates
Spot weldablestrain gages on Hanger Plates to measure stresses induced by frozen or corroded pins.
48 SG total on 6 hanger sets 24 on NB 24 on SB
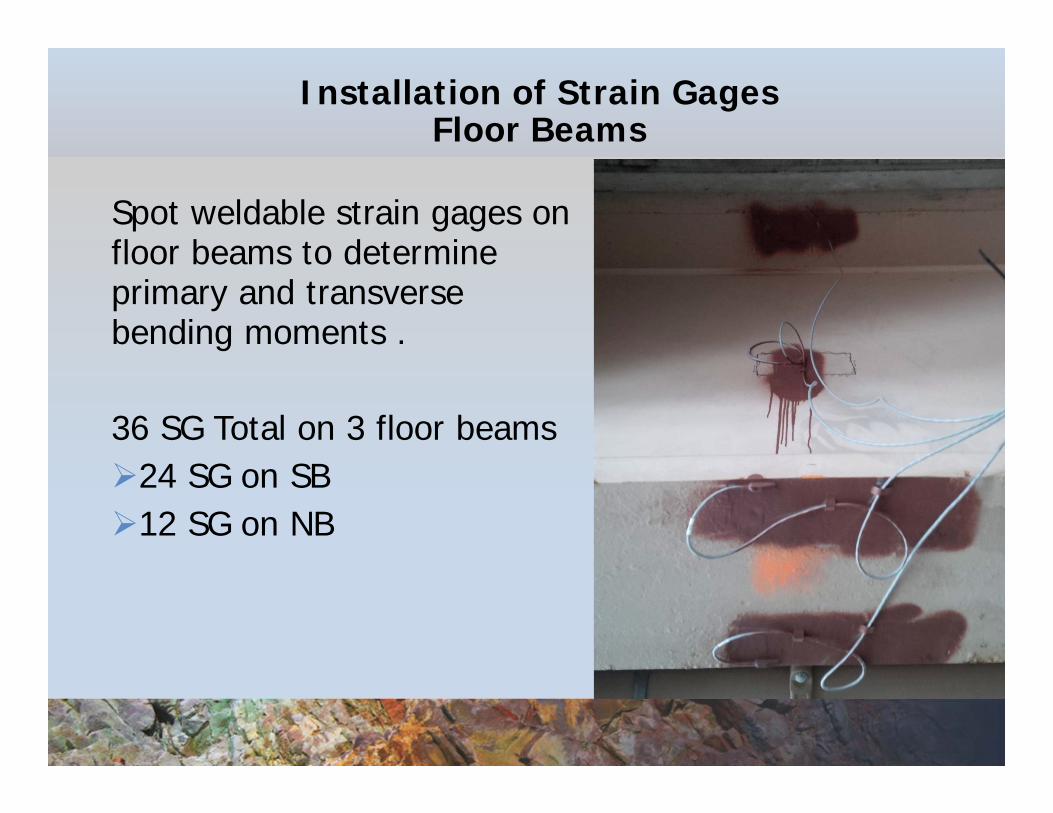
Installation of Strain Gages Floor Beams
Spot weldable strain gages on floor beams to determine primary and transverse bending moments .
36 SG Total on 3 floor beams24 SG on SB12 SG on NB

Instrumentation Plan Girders

Installation of Strain Gages Girders
Spot weldable SG on girders with partial length cover plates to determine remaining fatigue life of girders
32 SG total on 16 girders16 on girder mid span16 at cover plate end
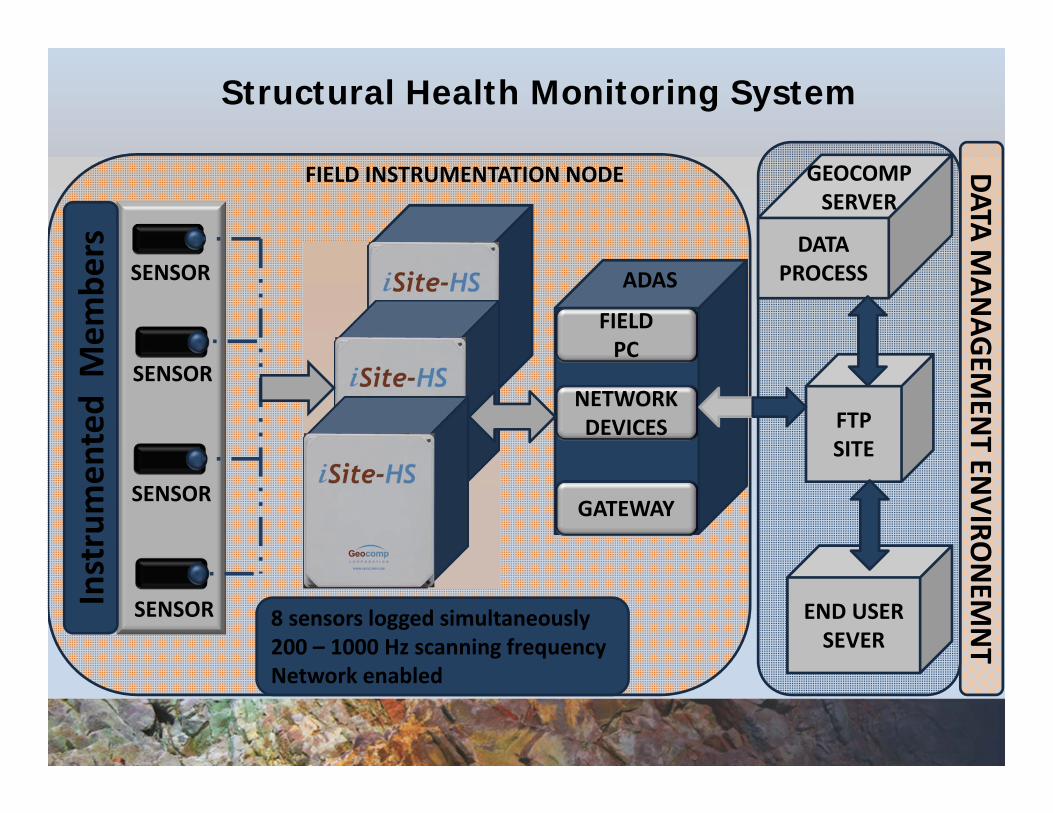
Structural Health Monitoring SystemInstrumen
ted M
embe
rs
SENSOR
SENSOR
SENSOR
SENSOR 8 sensors logged simultaneously200 – 1000 Hz scanning frequencyNetwork enabled
FIELDPC
NETWORKDEVICES
GATEWAY
ADAS
FIELD INSTRUMENTATION NODE
DATA PROCESS
FTP SITE
END USER SEVER
DATA MAN
AGEM
ENT EN
VIRONEM
NT
GEOCOMPSERVER

Hanger Plate / Girder 6-16 (5 min)

Hanger Plate/Girder 6-16

Rainflow Analysis – Stress Range Count
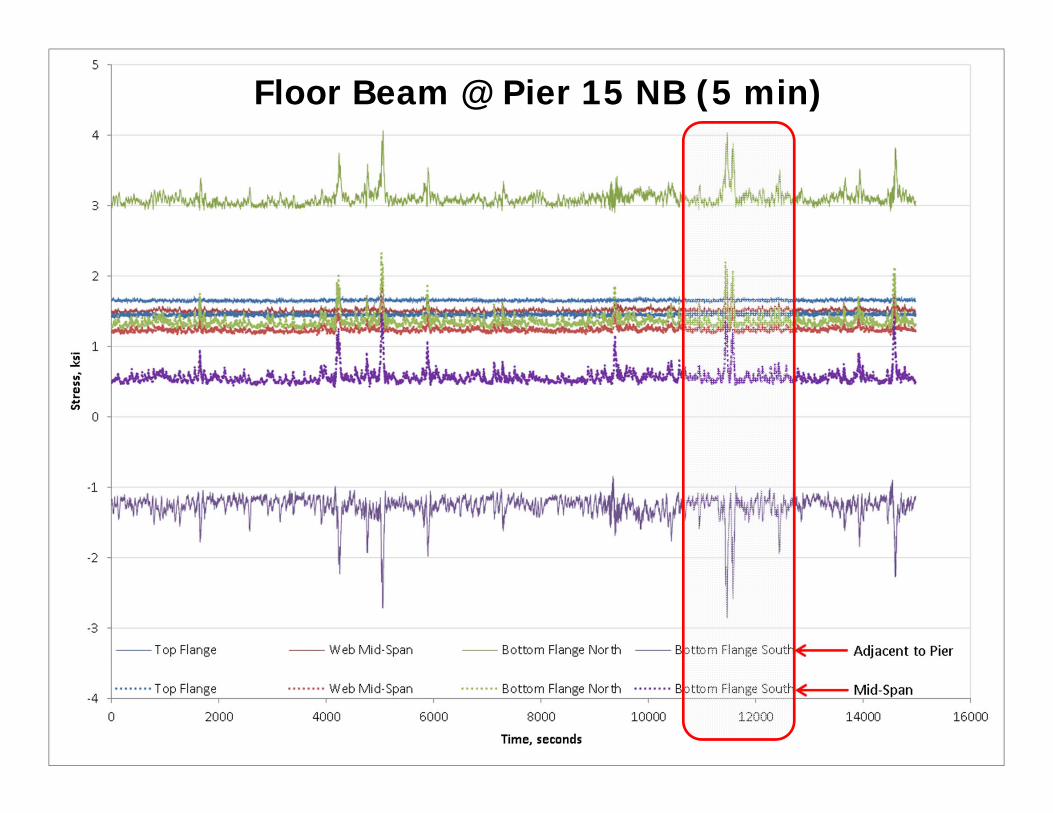
Floor Beam @ Pier 15 NB (5 min)

Floor Beam @ Pier 15 NB

Rainflow Analysis – Stress Range Count

Girder with Partial Length Cover Plate (5 min)
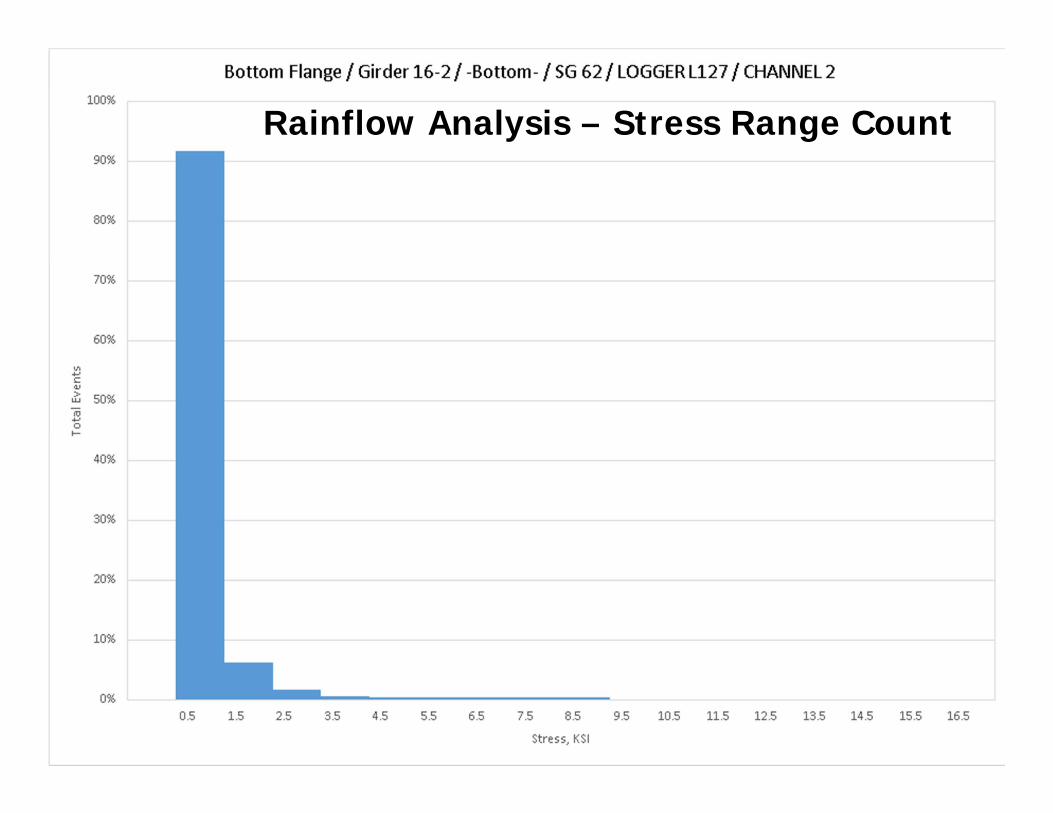
Rainflow Analysis – Stress Range Count

Structural Health Monitoring SystemCounting Cyclic Loads
Variable-amplitude loads on structureCount loads in amplitude “blocks”
Use Miner’s rule to relate number of loads in different amplitude blocks to overall life and tolerances

Structural Health Monitoring System Counting Cyclic Loads
ASTM Standard E1049
Breaks counting method into logical, loop steps
Algorithm to process large volumes of data
Fully automated process for daily analysis of incoming data
Output provides frequency distribution of stress cycles

Accomplishments
Reduced cost of rehabilitation from estimated $800M to $260M by implementing a $180K SHM program
Determined fatigue details after analysis were below threshold for infinite life
Allow CME Associates to arrive at a structure design with a service life of at least 75 years
SHM program removed conservatism inherent to AASHTO’s fatigue life formulation
Accomplishments (ctd)
Results used to prioritize asset management
Accurate determination of live load stresses
Validation of structural models to assess fatigue life of critical members
Optimize bridge rehabilitation alternatives

Questions?
27
Thank you!