transportation management and technologies
TRANSCRIPT

CHAPTER 3
Transportation Managementand Technologies
Photo credit:American Consulting Engineers Council

ContentsPage
Transportation Issues . . . . . . . . . . . . . . . . . . . . . . 79Intermodal Transport . . . . . . . . . . . . . . . . . . . . . 81Physical Condition . . . . . . . . . . . . . . . . . . . . . . 83Capacity . . . . . . . . . . . . . . . . . . . . . . . . . . . . . . . . 83Environmental Issues . . . . . . . . . . . . . . . . . . . . 85System Management and Financing, . . . . . . 85Technology and Management Tools . . . . . . . 86
Surface Transportation Networks:Highways and Bridges . . . . . . . . . . . . . . . . . 86
Management and Financing: Who Owns,Pays for, and Operates What . . . . . . . . . . . 86
Issues . . . . . . . . . . . . . . . . . . . . . . . .*.*.... . . . 88Technologies for Highways and Bridges. . . 91
Surface Transportation Networks:Mass Transit ● ....*.. ..*..*..* .*.,...** 97
Transit Management and Financing .,..... 97Issues +*..*.. . . . . . . . . . . . . . . . . ...*.,.. ,.. 99Technologies for Transit . . . . . . . . . . . . . . . . . . 100
Surface Transportation Networks: Railroads. . 103Railroad Management and Financing . . . . . . 103Rail Issues ● . . . . . . . . . . . . . . . . . . . . . . . . . . . . . 105Rail Technologies . . . . . . . . . . . . . . . . . . . . . . . . 105
Federally Managed Infrastructure: Waterwaysand Airways . . . . . . . . . . . . . . . . . . . . . . . . . . 110
Ports and Waterways . . . . . . . . . . . . . . . . . . . . . 11OFederal Infrastructure: Aviation . . . . . . . . . . . 118
Conclusions and Policy Options . . . . . . . . . . . . 129Financing and Investment . . . . . . . . . . . . . . . . 130Management Framework . . . . . . . . . . . . . . . . . 132Transportation Technologies . . . . . . . . . . . . . . 132
BoxesBox Page3-A. Intermodal Transportation Improvements
in Southern California . . . . . . . . . . . . . . . . . 843-B. Video Technology and Pavement
Management . .+,.,.*..,,*..*,..**.+,*. 923-C. Bridge Inspections . . . . . . . . . . . . . . . . . . . . . 933-D. The Automated Traffic Surveillance and
Control System . . . . . . . . . . . . . . . . . . . . . . . 953-E. Fast ToII Collection in Dallas. . . . . . . . . . . 963-F. Oregon’s Growth Management
Program . . . . . . . . . . . . . . . . . . . . . . . . . . . . . . 1003-G. Magnetic Levitation Research . . . . . . . . . . 106
Box Page3-H. High-Speed Rail , ...... +..... +.....,... 1083-I. The Massachusetts Port Authority . . . . . . . 124
FiguresFigure Page
3-1. Passenger and Freight Travel, by Mode.. 813-2. U.S. Department of Transportation ....,. 873-3. Characteristics of the Nation’s Road
System .,, . * . ., * . ., * ., . * . . . * . ..***,.,. 883-4. Physical Condition of U.S, Bridges . . . . . 903-5. Federal Obligations for Interstate, 4R,
primary, Secondary, and Urban Programs,by Improvemtmt Type ... +.,..,.,.,.... 91
3-6. Amtrak’s National Rail Passengersystem ● ,.. *.+. ... **. *********+* 104
3-7. The Navigation Systems of theContinental United States .......... +.... 112
Table Page
3-1. Transportation System Characteristics.. 803-2. Major Issues and Problems in
Transportation Public Works . . . . . . . . . . 823-3. Federal Transportation Trust Fund
summary . . . . . . . . . . . . . . . . . . . . . . . . . . . . 853-4. Highway Mileage and Funding
Statistics ., *,**.****,.*..**.+,*,,.,., 893-5. Characteristics of Mass Transit . . . . . . . . 983-6. Traffic and Operations and Maintenance
Costs on Inland Waterways, 1986 . . . . . . 1143-7. Federal Port Operations and Maintenance
Outlays per Ton of Cargo, 1974-84 . . . . 1143-8. Passenger Enplanements at 25 U.S.
Airports, 1988 .......,.,.,..., . . . . . . . . 1193-9. Congested Airport Rankings and
Expansion Plans . . . . . . . . . . . . . . . . . . . . . . 1213-10. Enhancing the Performance of Existing
Airports and Airways . . . . . . . . . . + ...,,, 1263-11. Traffic Congestion Increases in 15 Major
Cities . . . . . . 4 . . . . . , , . . . , . . . , . . . , , . , . , 1293-12. Federal Expenditures and User-Fee
Revenue for Transportation, 1989 . . . . . . 1313-13. Impacts of Surface Transportation
Measures , . + . . . . . , . . . . , . . . . . . , , . . . , . , 134

CHAPTER 3
Transportation Management and Technologies
We’re repairing everything at once because they all need it.1
Passengers and goods can move virtually any-where on the transportation networks in the UnitedStates. But much of the basic transportation infra-structure has been in place for at least 20 to 40years-long enough to need substantial repair orrehabilitation, especially in heavily traveled corri-dors. In jurisdictions where maintenance has beenneglected, deteriorated and congested rail, highway,water, and air facilities slow travel, hinder nationalproductivity, and increase costs. In many metropoli-tan areas, complete corridor reconstruction or majormodification will be required to ensure safety,alleviate congestion, and improve intermodal con-nections.
Federal responsibility for transportation rests onthe government’s constitutional mandate to supportinterstate commerce and provide for the publicsafety. Transportation infrastructure includes high-ways, bridges, rail and bus transit systems, freightand passenger railroads, ports, waterways, airports,and airways. Federal assistance for this infrastruc-ture has always been modally oriented, with separateprograms providing assistance for intercity passen-ger rail; mass transit; bridges, highways, and high-way safety; water; maritime shipping; and aviation.The Federal agencies that oversee transportationprograms are, for the most part, in the Department ofTransportation (DOT), although the U.S. ArmyCorps of Engineers has primary responsibility forharbor dredging and the condition of inland water-ways.
Most State DOTS were originally formed toadminister Federal highway programs during the1960s. During the 1980s, State DOTS expanded anddiversified, taking on additional responsibilities asFederal infrastructure programs shrank. State spend-ing for transportation rose from $22 billion to $39billion,2 and many DOTS took on some responsibil-ity for airports and mass transportation; some Statesnow aid ports and railroads as well. (See table 3-1 for
the major transportation components and figure 3-1for the share of passenger and freight transportationfor each mode.) However, highway departments stilldominate State DOTS, and almost all administer andfinance transportation programs by separate modesto be compatible with Federal grant programs.Counties and local governments are also importantplayers in operating, managing, and financing trans-portation infrastructure, particularly roads and air-ports. Finally, quasi-public, independent, regionalauthorities operate many major ports and airports.
With so many different entities responsible fordifferent aspects of transportation infrastructure, it isunderstandable that the transport system does notalways function smoothly. This chapter outlines theissues and problems that characterize the presentnational transportation system and describes thestatus of management and technologies specific toeach transportation mode. It also identifies changesto Federal programs and other approaches that couldmake the system work more efficiently and produc-tively.
Transportation IssuesFast, convenient travel for passengers and cargo
depends on a well-maintained, smoothly functioningintermodal system with the capacity to handle mostof the demands placed on it. Yet, historically,Federal planning, funding, regulation, and policysupport in the United States have fostered competi-tive, modal systems. Modal interdependence, ine-qualities in maintenance practices, and traffic bottle-necks (capacity problems) that affect total systemperformance are not addressed in Federal grantprograms. Intermodal data collection, planning, andcoordination are largely ignored, and successfulefforts to integrate land-use planning and transporta-tion requirements are rare.
Because institutional frameworks and fundingpolicies vary for each mode, substantially different
ILucius J. Ricc@ New York Civ transportation commissioner, ss quoted ~ An&eW L. Y~ow, “Late Repairs Increase Tmfllc Jams in Regionj”New York Times, Sept. 24, 1990, p. A-1.
%J.S. Department of Transportation Economic Studies Divisioq Federal, State and Local Transportation Financial Statistics, Fiscal Years1978-1988 (Washington, DC: March 1990), p. 24.
–79–

Table 3-l—Transportation System Characteristics
Traffic volume
Passengers (billions of InterCity freightMode Major components Facilities Vehicles passenger-miles) (billions of ton-miles)
Highways . . . . . . . . . . . . . .
Airports and airways . . . . .
Mass transit systems . . . .
Railroads . . . . . . . . . . . . . .
Waterborne . . . . . . . . . . . .
InterStatesPrinciple arterialsTotal public roads
Public airportsPrivate airportsAirwaysMotor busRapid and light railCommuter railDemand response
class IRegionalLocalSwitching/terminal linesAmtrak
Ports
HarborsInland waterways
43,000 miles 144,375,000 cars and taxis 1,445 712138,000 miles 42,524,338 trucks
3,874,000 miles 615,669 buses
5,680 airports 5,028 commercial aircraft 351 911,647 airports 209,500 private aircraft
384,691 miles2,671 systems 60,388 buses 41
27 systems 11,370 railcars12 systems 4,649 raiicars
2,582 systems 16,100 vans, minibuses, etc.141,000 miles Freight: 13
16,000 miles 1,239,000 freight cars15,000 miles 19,647 locomotives4,000 miies Amtrak:
700 miiesa 1,742 passenger cars312 locomotives
177 deepwater ports 754 U.S. flag vessels175 shallow pOrtS 5,188 tows and tugs757 commercial harbors 31,089 barges178 loals
25,777 miles
N/A
N/A
1,048
a~r~ ~SO indties 23,000 miles of based t-.b~m=t~ ton-mi~ only; about 2 billion tons of cargo transfer through U.S. PO*.
SOURCE: Office of Technology Assessment, 1991, based on a variety of data summaries.

Chapter 3—Transportation Management and Technologies . 81
Figure 3-l-Passenger and Freight Travel, by Mode
Intercity passenger travel(passenger-miles)
.3%
1.1%
Truck 60
Intercity freight transport(ton-miles)
Freight revenue by mode
— R a i l 2 6 . 0 %
)Water 1.0%
Oil pipeline
Air 7.0%
6.0%
21.2%
SOURCE: Office of Technology Assessment, 1991, baaed on information provided by the U.S. Department of Transportation and the Eno Foundation.
infrastructure problems characterize each modelportion of the transportation system (see table 3-2).Details relating to these difficulties are providedlater in this chapter in the appropriate modalsections. However, a number of issues are applicableto the system as a whole.
Intermodal Transport
Efficient intermodal operations have becomecritical to shippers, many of whom rely on ‘just-in-time” deliveries made possible by speedier andmore consistent door-to-door service. Freight trans-fers between ship, truck, rail, and barge involvephysical challenges, such as loading, unloading, andstorage of cargo, as well as complex intercompany,interjurisdictional, and even international agree-ments. Industry has addressed many of these chal-lenges through innovations. Containers permit cargotransfer between modes without repackaging, andautomatic equipment identification, electronic datainterchange, electronic fund transfers, and com-puter-aided operations all speed freight movements.
Intercity travelers and urban commuters also usemultiple modes for daily commutes, business trips,and vacations. Because passengers and freightmoving through airports, marine ports, and railstations rely on trucks and automobiles for mostconnections, traffic jams on local roads are often keysources of delay.
Congestion problems increase personal trip times,hurt productivity, and add to industry and individualcosts. However, the fractured transportation man-agement framework makes successful programs tocombat congestion extremely difficult to developand implement. To a large extent, surface trafficcongestion problems are products of decisions madeby governments and individuals and are outside thecontrol of a single industry or level of government.During the 5-year period from 1982 to 1987, trafficcongestion in our major cities, as measured byvolume of traffic per lane of travel, increased by anaverage of 17 percent.3
More effective, comprehensive regional transpor-tation and land-use planning spanning modes andjurisdictions is essential to efficient intermodal
3oT.q ~c~ation based on lkxas Transportation hMhute, “Roadway Congestion in Major Urban Areas 1982 to 1987,” Research Report 1131-2,1989.
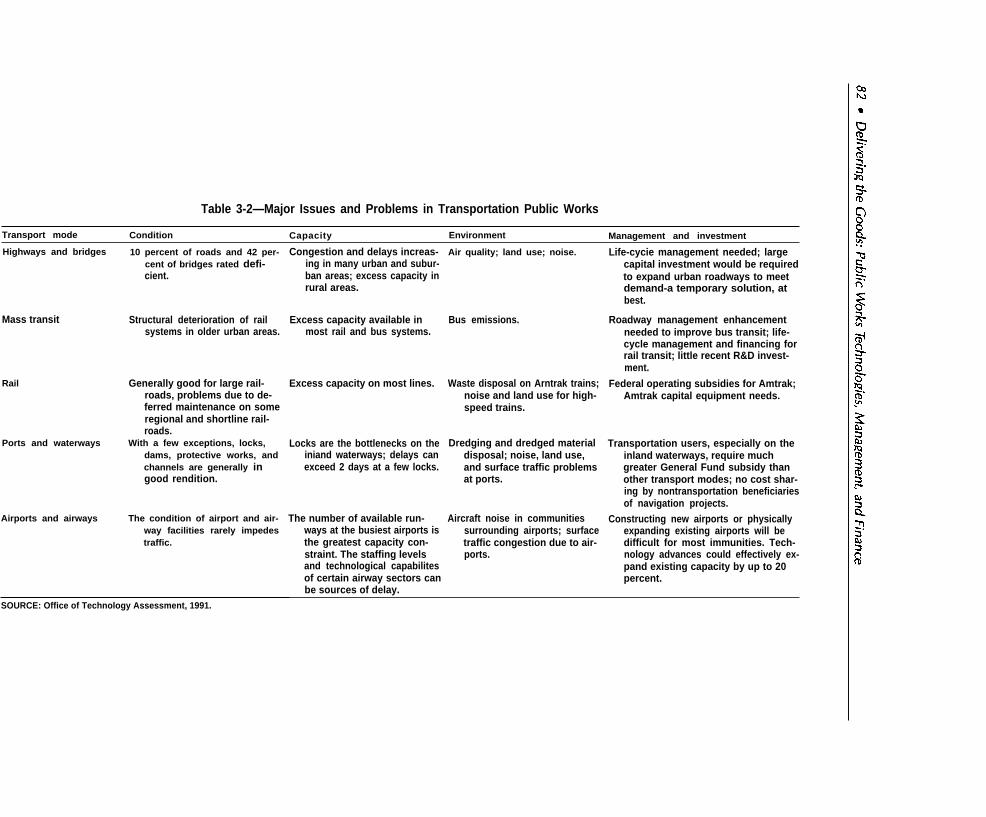
Table 3-2—Major Issues and Problems in Transportation Public Works
Transport mode Condition Capacity Environment Management and investment
Highways and bridges 10 percent of roads and 42 per-cent of bridges rated defi-cient.
Mass transit Structural deterioration of railsystems in older urban areas.
Rail Generally good for large rail-roads, problems due to de-ferred maintenance on someregional and shortline rail-roads.
Ports and waterways With a few exceptions, locks,dams, protective works, andchannels are generally ingood rendition.
Airports and airways The condition of airport and air-way facilities rarely impedestraffic.
Congestion and delays increas-ing in many urban and subur-ban areas; excess capacity inrural areas.
Excess capacity available inmost rail and bus systems.
Excess capacity on most lines.
Locks are the bottlenecks on theiniand waterways; delays canexceed 2 days at a few locks.
The number of available run-ways at the busiest airports isthe greatest capacity con-straint. The staffing levelsand technological capabilitesof certain airway sectors canbe sources of delay.
Air quality; land use; noise.
Bus emissions.
Waste disposal on Arntrak trains;noise and land use for high-speed trains.
Dredging and dredged materialdisposal; noise, land use,and surface traffic problemsat ports.
Aircraft noise in communitiessurrounding airports; surfacetraffic congestion due to air-ports.
Life-cycie management needed; largecapital investment would be requiredto expand urban roadways to meetdemand-a temporary solution, atbest.
Roadway management enhancementneeded to improve bus transit; life-cycle management and financing forrail transit; little recent R&D invest-ment.
Federal operating subsidies for Amtrak;Amtrak capital equipment needs.
Transportation users, especially on theinland waterways, require muchgreater General Fund subsidy thanother transport modes; no cost shar-ing by nontransportation beneficiariesof navigation projects.
Constructing new airports or physicallyexpanding existing airports will bedifficult for most immunities. Tech-nology advances could effectively ex-pand existing capacity by up to 20percent.
SOURCE: Office of Technology Assessment, 1991.

t ravel . Using double-deck ra i lcars or increasingvehicle frequency to expand mass transit capacity isuseless unless intermodal connections, such as busfeeder l ines and suburban park-and-ride lots, areprovided. The program described inbox 3-A typifiesthe kinds of major improvements needed to facilitateintermodal transportation.
P h y s i c a l C o n d i t i o n
T h e cond i t i on o f any pa r t o f t r anspo r ta t i oninfrastructure reflects management and investmentdecis ions-p lanning, design, construct ion, opera-tions, maintenance, and rehabilitation--that span asystem’s lifetime, or “life cycle. ” The waterwayand airway systems are generally in good conditionbecause the Federal Government has primary re-sponsibility for them and manages and maintains thesystems as investments. Systems for which a numberof separate governmental or private entities shareresponsibility, such as highways, bridges, and rail-roads, are much more likely to have major segments
in poor condition, usually because of neglect due tofiscal constraints felt by one or more of the owners.
C a p a c i t y
The present transportation system in the UnitedStates has plenty of excess capacity-but it is n o tavailable on the busiest routes and at terminals at thetimes most people want to travel. Transportationdemand fluctuates across time and location, andperiods of heavy demand create what are called“peaking” problems. To ensure adequate capacity,infrastructure must be designed and built to accom-modate t raf f ic volumes somewhat greater thanaverage, However, since facilities can rarely be builtto be both cost-effective and large enough to handlesmoothly the greatest “peaks, ’ designs ref lect atrade-off between costs of delay and congestion andcosts to build, operate, and maintain the infrstruc-ture.
Most infrastructure for transportation is suppliedand managed by the public sector. When demandexceeds supply, delays and safety problems occur

84 . Delivering the Goods Public Works Technologies, Management, and Finance
Box 3-A—lntermodal Transportation Improvements in Southern California
The proposed Alameda Corridor Transportation Authority (ACTA) project in southern California is a$500-million program1 of highway and railroad improvements that will facilitate freight movement between thePorts of long Beach and Los Angeles and downtown Los Angeles, where rail yards of three major carriers--theUnion Pacific, Southern Pacific, and Santa Fe Railroads-are located TIM project is intended to improve port accessand mitigate the impacts of port-related traffic on highway congestion, air pollution, grade crossing delays, and trainnoise in residential areas. It will involve construction of double tracks for the main rail line between the ports anddowntown, grade separations, and street widening along a route running parallel to the rail line. On-dock,ship-to-rail container loading facilities will be expanded to reduce truck traffic out of the ports. ACTA officialsestimate that the rerouting of trains of all three carriers onto a single double-track corridor and the elimination ofgrade crossings will bring a 90-percent reduction in train-related traffic delays, or a total of about 6,300vehicle-hours per day.
The improvements will be carried out under ACTA, a joint powers authority that consists of representativesof some 13 local, regional, and State agencies. Over $300 million of the total cost will be sought from Federalhighway funds. State contributions, totaling $80 million in bond issues, and funds from the Los Angeles CountyTransportation Commission, the railroads, and the ports will cover the balance of the cost of the project.2
The Port of Long Beach’s $80-million Intermodal Container Transfer Facility (ICTF), whose sole operator isthe Southern Pacific Railroad, provides a fine example of technology’s role in making freight transport moreefficient. The ICTF brings together elements of electronic data interchange and computer control of rail yards toexpedite the movement of containers and the makeup of stack trains, and nearly every facet of the facility’soperations is overseen by computers. Computers in the control tower are linked with those of ocean vessels, so thatthe yard’s computer receives information about each container before it arrives at the Long Beach or Los AngelesPorts. As containers are trucked into the yard from the ports, drivers are directed to the proper areas for containerinspection and parking. Yard tractors are equipped with mobile computer units to allow location and status updatesfor containers and ensure that time-sensitive stack trains are efficiently assembled and dispatched.
IMuchof the information on the Alameda Corridor Transportation AuthotitY~ k derivedfrom “SouthemCalifomia ConsolidatedTransportation Corridor” informational dooment, May 1990.
2~~d R. ~, mana~ dilIXt~, R- & “~g~ Pofi of ~% B*h personal communication Nov. 16, 19$)().
and congestion (especially on highways) is likely tocreate air quality problems. If the delays worsen andpersist, officials look for a way to expand capacity.Building new structures to meet growing demandhas been an attractive cost-effective option, in termsof direct costs for land, materials, and labor.However, this is no longer true in many of thecountry’s largest urban areas, where congestion ismost severe. For a variety of reasons-large upfrontcapital expenses, insufficient land where the need isgreatest, and community opposition to the expectedimpacts on the environment and quality of life—States and localities plan to build few new highways,airports, or waterways.
About 20 percent more traffic capacity could besqueezed out of the existing roadways, airports, andwaterways 4 by implementing near-term technologydevelopments, discussed later in this chapter. How-ever, traffic demand at many busy airports and
highways is expected to outpace the capacity gainspossible through technology.
Managing Demand
Better management is another way to increase thecapacity of the existing system. Reducing peak-hourtrips, minimizing the inefficient mixing of vehicletypes; and carrying more passengers or cargo per tripby increasing the average vehicle capacity are allpossibilities. These changes could be encouraged byenhancing alternative networks to draw traffic awayfrom busy facilities, by rationing access to over-crowded facilities during peaks, and by chargingdifferential prices to reflect more closely the fullcosts of congestion and delay.
Shifting demand away from peaks to underusedtimes, locations, or other transport modes is a firststep toward reducing delays due to overcrowding; incongested areas, where the network is close to
4~e -y COWS of E@=rs est~tes a ~ge of cq~i~ inmeases of 5 to 10 percent for small-scale improvements to 30 percent or more. ‘ee
U.S. Army Corps of Engineers, Institute for Water Resources, “The U.S. Waterway System: A Review, ” unpublished report, April 1989, p. 26.
Chapter 3—Transportation Management and Technologies ● 85
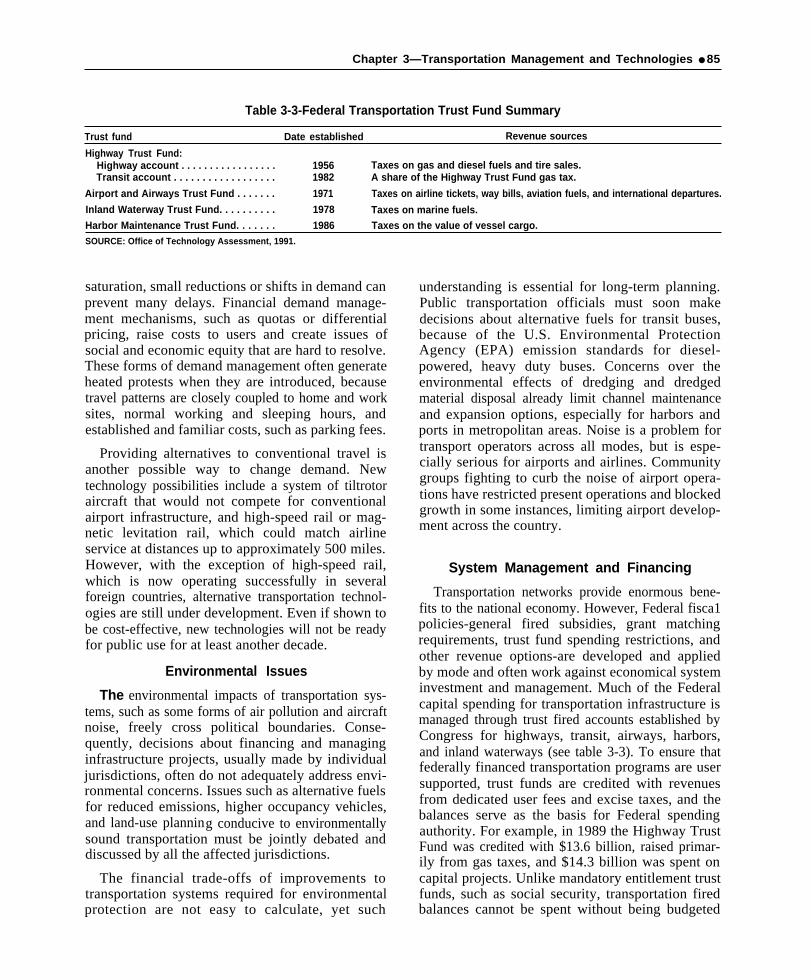
Table 3-3-Federal Transportation Trust Fund Summary
Trust fund Date established Revenue sources
Highway Trust Fund:Highway account . . . . . . . . . . . . . . . . . 1956 Taxes on gas and diesel fuels and tire sales.Transit account . . . . . . . . . . . . . . . . . . 1982 A share of the Highway Trust Fund gas tax.
Airport and Airways Trust Fund . . . . . . . 1971 Taxes on airline tickets, way bills, aviation fuels, and international departures.
Inland Waterway Trust Fund. . . . . . . . . . 1978 Taxes on marine fuels.Harbor Maintenance Trust Fund. . . . . . . 1986 Taxes on the value of vessel cargo.SOURCE: Office of Technology Assessment, 1991.
saturation, small reductions or shifts in demand canprevent many delays. Financial demand manage-ment mechanisms, such as quotas or differentialpricing, raise costs to users and create issues ofsocial and economic equity that are hard to resolve.These forms of demand management often generateheated protests when they are introduced, becausetravel patterns are closely coupled to home and worksites, normal working and sleeping hours, andestablished and familiar costs, such as parking fees.
Providing alternatives to conventional travel isanother possible way to change demand. Newtechnology possibilities include a system of tiltrotoraircraft that would not compete for conventionalairport infrastructure, and high-speed rail or mag-netic levitation rail, which could match airlineservice at distances up to approximately 500 miles.However, with the exception of high-speed rail,which is now operating successfully in severalforeign countries, alternative transportation technol-ogies are still under development. Even if shown tobe cost-effective, new technologies will not be readyfor public use for at least another decade.
Environmental Issues
The environmental impacts of transportation sys-tems, such as some forms of air pollution and aircraftnoise, freely cross political boundaries. Conse-quently, decisions about financing and managinginfrastructure projects, usually made by individualjurisdictions, often do not adequately address envi-ronmental concerns. Issues such as alternative fuelsfor reduced emissions, higher occupancy vehicles,and land-use planning conducive to environmentallysound transportation must be jointly debated anddiscussed by all the affected jurisdictions.
The financial trade-offs of improvements totransportation systems required for environmentalprotection are not easy to calculate, yet such
understanding is essential for long-term planning.Public transportation officials must soon makedecisions about alternative fuels for transit buses,because of the U.S. Environmental ProtectionAgency (EPA) emission standards for diesel-powered, heavy duty buses. Concerns over theenvironmental effects of dredging and dredgedmaterial disposal already limit channel maintenanceand expansion options, especially for harbors andports in metropolitan areas. Noise is a problem fortransport operators across all modes, but is espe-cially serious for airports and airlines. Communitygroups fighting to curb the noise of airport opera-tions have restricted present operations and blockedgrowth in some instances, limiting airport develop-ment across the country.
System Management and Financing
Transportation networks provide enormous bene-fits to the national economy. However, Federal fisca1policies-general fired subsidies, grant matchingrequirements, trust fund spending restrictions, andother revenue options-are developed and appliedby mode and often work against economical systeminvestment and management. Much of the Federalcapital spending for transportation infrastructure ismanaged through trust fired accounts established byCongress for highways, transit, airways, harbors,and inland waterways (see table 3-3). To ensure thatfederally financed transportation programs are usersupported, trust funds are credited with revenuesfrom dedicated user fees and excise taxes, and thebalances serve as the basis for Federal spendingauthority. For example, in 1989 the Highway TrustFund was credited with $13.6 billion, raised primar-ily from gas taxes, and $14.3 billion was spent oncapital projects. Unlike mandatory entitlement trustfunds, such as social security, transportation firedbalances cannot be spent without being budgeted

86 ● Delivering the Goods: Public Works Technologies, Management, and Finance
and appropriated. 5 Thus the annual transportationspending agendas must compete with other Federalpriorities. Over the last decade, the highway, transit,and airways accounts have built up substantialbalances, which transportation supporters claimshould be appropriated now to address the Nation’slarge backlog of needs. However, despite recentincreases in Federal fuel taxes and other transporta-tion user fees, expenditures from these trust ac-counts, which are part of the unified Federal budget,will be limited by the domestic spending ceilingsimposed in the 1990 deficit reduction package.
Federal program management does little to pro-mote efficient use of transportation systems. In itsalmost quarter century of existence, DOT has neversuccessfully transcended the autonomy of its sepa-rate modal divisions (see figure 3-2) to establish aleadership or coordinating role for multimodal,system-based programs. System-based, State andlocal investment and management policies andinstitutions are lacking too. As one example of thetypes of problems that result, ports both contributeto and suffer from surface traffic congestion, airpollution, and disputes caused by oversize andoverweight container shipments. But ports are oftenindependent authorities, and their shipments usuallyinvolve interstate commerce, making it hard forState or local governments to affect them. Fewexamples of successful intergovernmental mecha-nisms for setting policies or developing and fundingprograms to address such problems can be found.
Technology and Management Tools
A number of technologies are available formanaging infrastructure maintenance and rehabilita-tion, alleviating traffic congestion and increasingcapacity, and prolonging structure life. Many ofthese technologies are described in chapter 5. Thosewith the most promise for transportation includecomputerized inventory management and decisionsupport tools, sensors for condition assessment andtransponders for communication and flow control,and a variety of materials for construction andrehabilitation and construction techniques. Despite
their availability, however, new technologies are notin widespread use in public works, and technicaladvances in equipment and software far outstrip theskills and financial resources available to most Stateand local public works operators.
Surface Transportation Networks:Highways and Bridges
Roads and bridges are key to moving people andgoods; indeed every traveler and freight item travelsby highway for at least part of almost every trip.Motor vehicles account for roughly 10 times asmany person-miles of travel as all other transporta-tion modes combined, and trucking accounts forover 80 percent of all domestic freight revenues and25 percent of all the ton-miles of domestic freight.6
Management and Financing: Who Owns,Pays for, and Operates What
Counties and local jurisdictions own and managethe lion's share of roads and bridges, while Statesown and administer Interstates, most arterial roads,and one-third of collector roads. The few Federalroads are almost exclusively on Federal property,such as national parks and forests.7 About one-halfof total national spending for roads (about $69billion in 1988)8 is provided by States and aboutone-quarter by local governments. More than three-quarters of the almost 3.9 million miles of publicroads that now lace the country had been built by1920, although less than 15 percent were paved.Even today, 1.7 million miles of road remainunpaved.
All Interstate miles and 97 percent of other arterialroute-miles are considered part of the Federal-aidsystem and are eligible for Federal funding aid fordevelopment and maintenance. See figure 3-3 andtable 3-4 for further information about funding androad characteristics. Federal-aid funding from theHighway Trust Fund, about $14 billion annually,represents around one-quarter of total road spending.Of the nearly 577,000 bridges in the United States,
SJOhKI Hom~~ Tra~o~tion Trust Funds: Econonu”c and Policy Issues (’wdlhlgtOIli m: Cowssioti R~~h S*CO, SCP* 19$@~p. 2.
6Natio~ COUnCiI On Public Works I.mprovemen~ Highways, Streets, Roads and Bridges (W_Or4 DC: WY 1987), P. 55.~.S. Department of llansportatio~ Federal Highway A&mm“ ‘stmtion, Highway Functional Classification-Concepts, Cn”ten”a, and Procedures
(%k@iX@OQ DC: March 1989).$U.S. Department of lkmspomtiom Federal Highway A6ministratiow Highway Statistics 1988 (WashingtoxL DC: 1989), p. 38.

Figure 3-2—US. Department of Transportation
Secretary
Deputy Secretary1
Office ofCivil Rights DBoard of
Contract Appeals
L25c_JBBSOURCE: U.S. Department of Transportation, 1990.
I
Assistant Secretaryfor Governmental
Assistant Secretary Assistant Secreta~ Office of
Affairsfor Administration for Public Affairs Inspector GeneraI
3National HighwayTraffic SafetyAdministration
I
~ r-----t! I Urban Mass Saint LawrenceFederal Railroad Seaway Maritime Research and
Administration Transportation Development Administration Special ProgramsAdministration Corporation Administration

88 ● Delivering the Goods: Public Works Technologies, Management, and Finance
Figure 3-3-Characteristics of the Nation’s Road System
Road mileage Vehicle-miles traveled(by road type) (by road type)
OtherIs
Iectors21%
Interstate1%
Minor
Collectors
- arterials19%
69%
Secondary11%
Primary
Other arterials28%
Road mileage(by funding classification)
7%
1%Federal
6%
te
SOURCE: Office of Technology Assessment, 1991, based on information from the U.S. Department of Transportation,
almost 275,000 are on Federal-aid roads, with theremainder on off-system roads.9
State highway officials administer a wide varietyof State-funded programs and, with the FederalHighway Administration (FHWA), the Federal-AidHighway Program. States allocate about 60 percentof all highway outlays, construct and maintain about22 percent of the Nation’s highway mileage and43 percent of the bridges,l0 disperse Federal andState funds to local jurisdictions, and enforceconstruction standards and grant conditions. AllStates levy motor fuel taxes; in 1990, the average gastax was 16 cents per gallon. During the 1980s, 47States increased their levies—some more than once.Most, but not all, States dedicate this revenue totransportation purposes, and their officials view the
large balances in the Federal Highway Trust Fundwith anger, believing the Federal Government iswithholding these dedicated highway user fees forgeneral budget balancing purposes.
Issues
Local governments design, construct, and main-tain the vast majority of the Nation’s roads andbridges,ll and virtually every jurisdiction has a largebacklog of road and bridge maintenance and repairneeds. These are particularly acute in large, oldercities where infrastructure is heavily used and manystructures have long since reached the end of theirdesign lives; in New York City, for example, moretraffic lanes will be closed for repairs than will bereopening under a rehabilitation program that will
p. 134.
of Counties, Linking America P. 8. Figures DC:
1987), p. 4.

Chapter 3—Transportation Management and Technologies ● 89
Table 3-4-Highway Mileage and Funding Statistics
Capital MaintenanceRoad classification Miles Jurisdiction funding funding
Interstate Systema . . . . . . . . . . . . . . 44,000 State 90% Federal 1OO% State10% State
Federal-Aid Primary Systemb
(excluding lnterstate) . . . . . . . . . . 260,000 State 75% Federal 1OO% State25% State
Federal-Aid Secondary Systemc. . 400,000 State 75% Federal 100?40 State25% State
Federal-Aid Urban Systemd . . . . . . 125,000 State 75% Federal 100% State25940 State
Local roadse . . . . . . . . . . . . . . . . . . 2,751,000 Counties, Not eligible for Local and Statemunicipalities, Federal aidand townships
Federal roadsf . . . . . . . . . . . . . . . . . 226,000 Federal 100% Federal 100% Federala R~ut~ that~nn~t pfindpal metrop[itan ar~, serve the national defense, or~fln~t fith mutes of COntiflelltal
importance in Mexico or Canada (subsystem of the Federal-Aid Primary System).b Intemnn=ting roaa important to interstate, statewide, and regional travel.c Mqor ~ml ~l[a~rs that assemble traffic and feed to the afierials.d Urban ~~ena[ ad ~[leetors mutes, excluding the urban extensions of the major primary artedab.e Residential and [-l $tr$etsof ROa~ in national forests and parks; roads on military and Indian r$SenfatkmS.SOURCE: U.S. Department of Transportation, Federal Highway Administration, Highway Statistics 1988(Washington,
DC: 1989); and U.S. Department of Transportation, Federal Highway Administration, Our Nation’sHighways: Se/eoted Faots andl?gures (Washington, DC: 1987)
Over 10 percent of the Nation’s roads have enoughpotholes, cracks, ragged shoulders, ruts, and wash-board ridges to be classified as deficient; heavy axleweights, such as those of large trucks, and thestresses caused by freezing and thawing of harshweather are the major causes of pavement damage.13
Nearly 42 percent of the Nation’s bridges are ratedas unable to handle traffic demand or structurallydeficient (see figure 3-4); costs for repairing andreplacing these are estimated at $67.6 billion.14
Maintenance is an easy budget item to defer inevery jurisdiction when resources are low. However,if maintenance is put off for too long, simpleprocedures are no longer adequate, and more exten-sive and costly work becomes necessary. FHWAadministers five major highway grant programs(interstate, interstate 4R, primary, and urban andsecondary), which can provide up to 75 percent ofthe funds for construction/reconstruction andrehabilitation of Federal-aid highways. Despite thisavailability, less than 25 percent of Federal highwayobligations have been used for these purposes (see
12YSHOW, op. cit., footnote 1.
lsTr~ofitionRese~h Board, Truck WeightLimits: Issues and Options, Special Report 225 (Washington, ~: 1990), P. 27.ldu.s. Co-ss, House COmmittW on public work and Transportation, The Status of the Nation’s Highways and Bridges: Co?tditions ad
Pe~ormance and Bridge Replacement and Retibilitation Program, Report of the Seeretiuy of Transportation to the United States Congress~-ou ~: U.S. Govment Printing CMke, June 1989), p. 121.
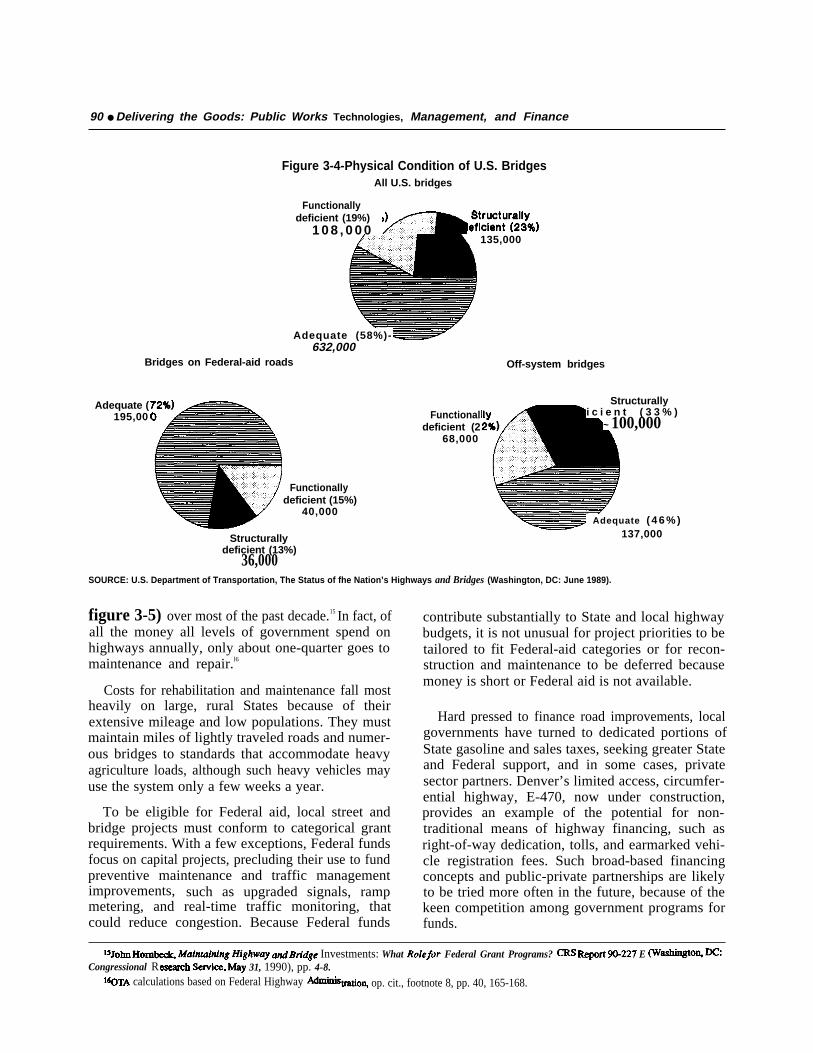
90 ● Delivering the Goods: Public Works Technologies, Management, and Finance
Figure 3-4-Physical Condition of U.S. BridgesAll U.S. bridges
Functionally
1 0 8 , 0 0 0 deficient (19%)
135,000
Adequate (58%)-632,000
Bridges on Federal-aid roads
Adequate (195,00
Functionallydeficient (15%)
40,000
Structurallydeficient (13%)
36,000
Functionaldeficient (2
68,000
Off-system bridges
Structurally— d e d e f i c i e n t ( 3 3 % )
~ 100,000
Adequate ( 4 6 % )137,000
SOURCE: U.S. Department of Transportation, The Status of fhe Nation’s Highways and Bridges (Washington, DC: June 1989).
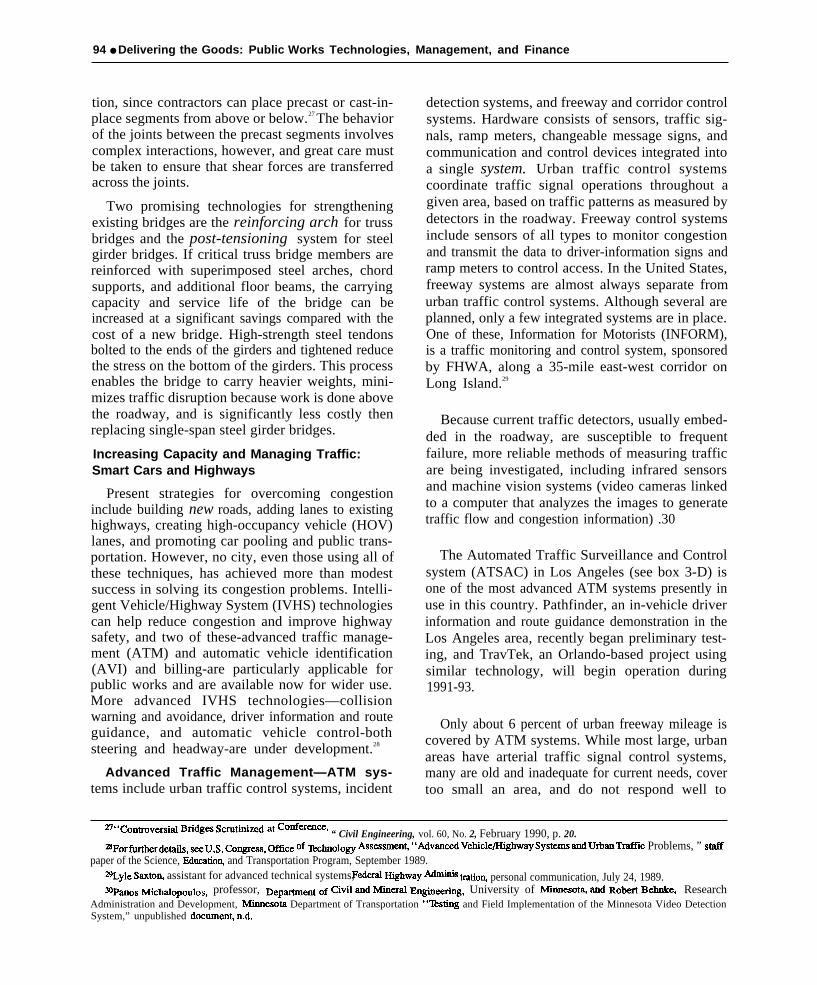
figure 3-5) over most of the past decade.15 In fact, ofall the money all levels of government spend onhighways annually, only about one-quarter goes tomaintenance and repair.l6
Costs for rehabilitation and maintenance fall mostheavily on large, rural States because of theirextensive mileage and low populations. They mustmaintain miles of lightly traveled roads and numer-ous bridges to standards that accommodate heavyagriculture loads, although such heavy vehicles mayuse the system only a few weeks a year.
To be eligible for Federal aid, local street andbridge projects must conform to categorical grantrequirements. With a few exceptions, Federal fundsfocus on capital projects, precluding their use to fundpreventive maintenance and traffic managementimprovements, such as upgraded signals, rampmetering, and real-time traffic monitoring, thatcould reduce congestion. Because Federal funds
contribute substantially to State and local highwaybudgets, it is not unusual for project priorities to betailored to fit Federal-aid categories or for recon-struction and maintenance to be deferred becausemoney is short or Federal aid is not available.
Hard pressed to finance road improvements, localgovernments have turned to dedicated portions ofState gasoline and sales taxes, seeking greater Stateand Federal support, and in some cases, privatesector partners. Denver’s limited access, circumfer-ential highway, E-470, now under construction,provides an example of the potential for non-traditional means of highway financing, such asright-of-way dedication, tolls, and earmarked vehi-cle registration fees. Such broad-based financingconcepts and public-private partnerships are likelyto be tried more often in the future, because of thekeen competition among government programs forfunds.
Investments: What Federal Grant Programs? E Congressional R 31, 1990), pp. 4-8.
calculations based on Federal Highway “ “ op. cit., footnote 8, pp. 40, 165-168.

Chapter 3—Transportation Management and Technologies ● 91
Figure 3-5-Federal Obligations for Interstate, 4R,Primary, Secondary, and Urban Programs, by
Improvement100%
7 5 %
50%
25%
o%
Type
I I I I 100%
75%
50%
25%
o%80 81 82 83 84 85 86 87 88 89
~ New construction= Capital replacement
= Maintenance m Other
SOURCE: Congressional Research Service from Federal Highway Admin-istration. See Congressional Research Service, MaintainingHighway and Bridge Investments: What Role for Fe&al GrantPrograms? (Washington, DC: 1989.)
Loca1 roads serving regional needs frequently fallvictim to differing local, State, or Federal manage-ment goals and responsibilities, or their planningand financing become stalled by interjurisdictionalsquabbles.17 Furthermore, because Federal and Stategrants are allocated by mode, communities havelittle incentive to seek intermodal solutions toareawide transportation problems. Weak land-useplanning and development controls further com-pound congestion problems. While new technologycan bring some short-term solutions, changes inland-use management and development patterns,lifestyles, and institutional arrangements are likelyto be required for long-term solutions in regionswhere congestion problems are severe.
Technologies for Highways and Bridges
Technologies can make substantial contributionsto addressing congestion and capacity problems andto bringing the physical condition of the highwaysystem to a satisfactory level. If money is availableto purchase equipment, and personnel are trained tooperate and maintain them, the technologies de-scribed below can bring major benefits.
Keeping the System in Good Condition
Keeping pavements and bridges in good conditionrequires collecting information, careful manage-ment, investment in appropriate and durable equip-ment and materials, and adequately trained person-nel. Management and information systems areessential planning and resource allocation tools.Decisions about materials and construction are alsokey to maintaining a healthy road system.
Pavement and Bridge Management Systems-The essential components of any pavement or bridgemanagement system include data collection andprocessing, techniques or models for pavementperformance prediction, and setting priorities forresource allocation. Most current State pavementmanagement systems resemble that used in NorthCarolina and its municipalities. This includes visualpavement inspection by trained professional evalu-ators of the entire paved street system, from a vehicletraveling at about 10 miles per hour. Both State andlocal evaluators record pavement condition accord-ing to the same, well-defined levels of distress.18
Municipalities use the results to set priorities forengineering investigation, testing, maintenance, andresurfacing. The system helps to set priorities forlimited funds and facilitates exchange of technol-ogy, information, and training programs.
A somewhat more automated pavement manage-ment system, developed by the Army Corps ofEngineers, has the capability to store inventory andinspection data, analyze pavement condition, predictfuture pavement condition, compare costs of mainte-nance and repair, and plan budgets. It is available foruse by public works officials.19
Advances in electronic sensors and system man-agement software permit automated data collectionand analysis, and these technologies have greatpotential to speed up and standardize the conditionassessment process and help set priorities for repair.Several States have programs utilizing them (seebox 3-B). However, when more data are collected,more powerful data management tools and special-
lyJohII tiyOW ci~ fiice offixr, -eapolia, MN, personal communidom Jme 21, IWO.lSJSm= B. _ “pavement Management for North Carolina Municipalities,” Transportation Research Record1200 (Washington DC: National
Research Council, 1988).1~.s. ~y CoWs of m~~, Construction hgineering ~e-h LS~rStOIY* “Micro Paver Pavement Management System,” informational
document MSy 1989.

92 . Delivering the Goods: Public Works Technologies, Management, and Finance—
Box 3-B—Video Technology and Pavement Management
Since the early 1980s, the Connecticut Department of Transportation has used a pavement survey van equippedwith a movie camera to record images at regular distance intervals (100 pictures per mile) on all 7,600 miles ofState-maintained road. This process, known as photologging, produces a film of the entire road network which isthen developed, producing some 760,000 images, and transferred to videotape. Images from the videotape are thentransferred onto 15 double-sided laser videodiscs. Connecticut has developed an image retrieval system that allowsany desired stretch of road to be examined on a video monitor to determine pavement distress. When correlated withroad geometry and roughness data which is collected simultaneously with the same pavement survey van, thisinformation provides highway engineers with a complete database to use in setting priorities for road maintenance.
Connecticut’s surveys are conducted annually and take about 4 months to complete. The State has found thatphotologging saves gas, makes more efficient use of labor, eliminates much of the need for field inspections, andprovides better pavement ratings than its previous method, which consisted of 4’. . . two people riding in a seal@at 40 miles per hour jotting down general impressions. . .“ of pavement quality.1 Other States pursuing videodisctechnology for pavement data acquisition and retrieval include Minnesota, Iowa, Utah, Texas, and Wisconsin.Future efforts will focus on eliminating the need to use movie cameras or video cameras and writing data directlyonto disc.
IJohn Hudson, photolog supervisor, and Richard Hanky, transportation sefi~ W@=$ co-ti~t w-e~t of T’~~‘o%personal cwxummications, Nov. 8, 1990.
ized personnel and expertise become necessary,20 Thermal Mapping—An extension of pavementand these are beyond the resources of many StateDOTS.
Bridge lnventories—Investigations into the col-lapse in 1967 of the Silver Bridge between WestVirginia and Ohio, which killed 46 people, revealeda lack of uniform reporting standards for bridges anda need for a national inventory of bridges, improvedinspection standards, and inspection training proce-dures. While a national bridge inventory that in-cludes condition ratings is now in place, recentbridge failures have demonstrated that significantinspection, maintenance, and repair issues must stillbe addressed (see box 3-C).
Computerized bridge inventory systems can coor-dinate bridge condition analyses, set priorities, andbudget for maintenance and repair. For example, thebridge inventory for Texas is a database thatincludes 140 different entries for each bridge. Thedata help the engineers determine a sufficiencyrating for every bridge in the State, and those that areclassified as deficient are eligible for FHWAfunds.21
management for deicing and ice prediction applica-tions, thermal mapping requires mounting infraredthermometers on vehicles to measure pavementtemperatures along stretches of road. Thermal map-ping can be used to position permanent sensors in theroad, to determine how many sensors are needed toprovide adequate temperature profiles, and to rede-sign salting routes. Thermal mapping trials havebeen carried out in several counties in England.22
Paving Materials-Composites, ceramics, plas-tics, and higher strength cements, are graduallybeing used more frequently in bridges and highways.They can provide faster curing, weight, and durabil-ity advantages over steel and concrete when properlyused and in the right conditions. Quick-curingconcrete can produce a road ready for vehicle trafficinside of 24 hours, minimizing the need for reroutingtraffic, an inconvenience that can last for weeksunder traditional paving operations. Though fast-track construction adds $1 to $2 per square yard tothe pavement costs, the increase is offset by reduc-tions in traffic rerouting and liability .23 Extensivetests performed on U.S. 71 in Iowa showed promise
— — — — . . — — . — . — — — — ———.20~5 KOUWOp)UIOS, ‘‘Automated Interpretation of Pavement Distress Dat%’ Cofisruction, newsletter of the Center for Construction Research and
Educatio% Massachusetts Institute of Twhnology, winter 1989, p 10.
‘lJane Mills Smith, ‘‘Middle Age Crisis, Wirdowt, Texas A&M LTniversity, summer 1988.~~en~ Mapping IntC~tlu~~], Ltd.. Birmingham, England, informatioml brochure, n.d.
~M~lin K~utson ~d Rande]l Riley, ‘ ‘Driving m the Fast Track, ’ Civil Engineertn~, vol. 58, No. 9, September 1988, p. 56.

Chapter 3—-Transportation Management and Technologies ● 93-. -- —— —...... ——— —- —.— —
Box 3-C—Bridge Inspections
The 1989 failure of the Hatchie River Bridge in Tennessee highlights some of the inadequacies of presentbridge management practices. Four passenger cars and one tractor-semitrailer fell into the river when the bridgecollapsed during a flood. The National Transportation Safety Board (NTSB) identified several contributing factors,including migration of the main river channel beneath the bridge and the failure of authorities to evaluate and correctthe resulting problems. A lack of redundancy in the bridge design also contributed to the severity of the accident,Channel migration and scour, or wear, exposed the bridge piles to as much as 10 feet of water, reducing their abilityto support the bridge. Although a 1987 onsite inspection identified the piles’ vulnerability to water, no settlementor leaning was noticed in the supports, and the bridge was given a “poor” rather than “critical” rating, thus notmaking it a priority for repair. NTSB determined that State officials did not recognize the potential for scour fromthe inspection report, and that overweight vehicles were frequently permitted to cross the bridge, further weakeningthe structure.1
After its investigation, NTSB issued 19 recommendations for improved inspection and maintenanceprocedures for the Nation’s bridges, stressing the need for dealing with the effects of channel migration and rivercourse changes, overweight traffic loads, and scour on the integrity of the bridge support structures. Therecommendations also highlight the need for raising qualification standards for evaluators of bridge inspectionreports and for the creation of a system to set priorities for bridge repairs.2
INatioml Transportation Safety BoMd, “Safety InfortnatioK” informational document, June 5, 1990.
21bid.
for quick-curing concrete technology. The StrategicHighway Research program (SHRP) has sponsoredfast-track. concrete pavement overlay experiments inMissouri on Route 67 with a pavement mixturedesigned to harden in 12 hours.24 (See chapter 5 forfurther discussion of advanced materials.)
Pavement additives for deicing, developed inEurope and tested in the United States, includeparticles of ground rubber or calcium chlorideparticles covered with linseed oil. These are mixedinto the material used for the road surface. Theseadditives can double or triple paving material costsand are not effective in all climates or under allhighway conditions. 25 Salt, currently the cheapestand most available deicer, has been widely used inthis country, although it causes extensive corrosionto unprotected pavement. (See chapter 5 for furtherdetails.) Laboratory and field tests have showncalcium magnesium acetate to be comparable to rocksalt as a deicer, while lacking many of the adverseside effects. However, its price, 15 to 20 times thatof rock salt, prevents extensive use.
loads and member strengths as if they were knownwith roughly equal certainty, rarely the case. LRFDrecognizes that some loads (the bridge’s ownweight, for instance) and material strengths can becalculated with a fair amount of certainty, whileothers (the wind load from a hurricane, for example)can only be guessed. LRFD takes uncertainty intoaccount by multiplying each load by a load factorand each member strength by a resistance factor,with both reflecting the probability that each particu-lar number is wrong. In many structures, LRFDallows the use of smaller members or lower strengthsteels, reducing the cost of the structure. Load factordesign (LFD) was adopted by the American Associ-ation of State Highway and Transportation Officials(AASHTO) in 1969 as an alternative method forboth steel and concrete bridges. Most States nowrecognize LFD as an acceptable design method,26
and by 1992, AASHTO bridge design and construc-tion specifications will be revised in the LRFDformat. However, LRFD takes time to learn andrequires educating staff and converting or replacingcomputer programs that use conventional design
Design and Construct ion—bad and resistanceformulas.
factor design (LRFD) is a promising alternative to Primarily because they can be constructedstandard allowable stress design, which treats all quickly, segmental bridges minimize traffic disrup-— ——————— —————.—. —-.——— — —
24S@ate@ Highway Research ROW, ‘ ‘FO C U S, ’ :lWSktteI’, Auglist 1990, p. ~
~Kevfi Stew@ pavement RCsearC~ ~lvlslon, ~~~ra] H]gh~ay AdnlinistratiOn, persoml Commtication, Apr 24, 1990.
26’ ‘Steel Desl~’s Reluitfi~.t Revolution+ Lnxlneering A’tws Record. VOI 2?3, No 19, NOV . 9. 1989, pp. 54-60
94 ● Delivering the Goods: Public Works Technologies, Management, and Finance
tion, since contractors can place precast or cast-in-place segments from above or below.27 The behaviorof the joints between the precast segments involvescomplex interactions, however, and great care mustbe taken to ensure that shear forces are transferredacross the joints.
Two promising technologies for strengtheningexisting bridges are the reinforcing arch for trussbridges and the post-tensioning system for steelgirder bridges. If critical truss bridge members arereinforced with superimposed steel arches, chordsupports, and additional floor beams, the carryingcapacity and service life of the bridge can beincreased at a significant savings compared with thecost of a new bridge. High-strength steel tendonsbolted to the ends of the girders and tightened reducethe stress on the bottom of the girders. This processenables the bridge to carry heavier weights, mini-mizes traffic disruption because work is done abovethe roadway, and is significantly less costly thenreplacing single-span steel girder bridges.
Increasing Capacity and Managing Traffic:Smart Cars and Highways
Present strategies for overcoming congestioninclude building new roads, adding lanes to existinghighways, creating high-occupancy vehicle (HOV)lanes, and promoting car pooling and public trans-portation. However, no city, even those using all ofthese techniques, has achieved more than modestsuccess in solving its congestion problems. Intelli-gent Vehicle/Highway System (IVHS) technologiescan help reduce congestion and improve highwaysafety, and two of these-advanced traffic manage-ment (ATM) and automatic vehicle identification(AVI) and billing-are particularly applicable forpublic works and are available now for wider use.More advanced IVHS technologies—collisionwarning and avoidance, driver information and routeguidance, and automatic vehicle control-bothsteering and headway-are under development.28
Advanced Traffic Management—ATM sys-tems include urban traffic control systems, incident
detection systems, and freeway and corridor controlsystems. Hardware consists of sensors, traffic sig-nals, ramp meters, changeable message signs, andcommunication and control devices integrated intoa single system. Urban traffic control systemscoordinate traffic signal operations throughout agiven area, based on traffic patterns as measured bydetectors in the roadway. Freeway control systemsinclude sensors of all types to monitor congestionand transmit the data to driver-information signs andramp meters to control access. In the United States,freeway systems are almost always separate fromurban traffic control systems. Although several areplanned, only a few integrated systems are in place.One of these, Information for Motorists (INFORM),is a traffic monitoring and control system, sponsoredby FHWA, along a 35-mile east-west corridor onLong Island.29
Because current traffic detectors, usually embed-ded in the roadway, are susceptible to frequentfailure, more reliable methods of measuring trafficare being investigated, including infrared sensorsand machine vision systems (video cameras linkedto a computer that analyzes the images to generatetraffic flow and congestion information) .30
The Automated Traffic Surveillance and Controlsystem (ATSAC) in Los Angeles (see box 3-D) isone of the most advanced ATM systems presently inuse in this country. Pathfinder, an in-vehicle driverinformation and route guidance demonstration in theLos Angeles area, recently began preliminary test-ing, and TravTek, an Orlando-based project usingsimilar technology, will begin operation during1991-93.
Only about 6 percent of urban freeway mileage iscovered by ATM systems. While most large, urbanareas have arterial traffic signal control systems,many are old and inadequate for current needs, covertoo small an area, and do not respond well to
2-7ttcontioversid Bridges Scruti.tdz.txl at confer~ws “ Civil Engineering, vol. 60, No. 2, February 1990, p. 20.~For~erde~s, seeu+s. coges~, ~lce of ~~olog ~s=ment, “~v~~d vehicle~ghwaysystems ~dlJrb~T~lc Problems, ” S~
paper of the Science, lllucatio~ and Transportation Program, September 1989.Z%yle &mto~ assistant for advanced technical systems, FedersI Wghway ~“ “ tratio~ personal communication, July 24, 1989.30pmos ~c~opo~o~, professor, Dep~~t of Civil ~d ~er~ EK@ee@, University of -eSo@ ~d RoM Behuke, Research
Administration and Development, Minuesota Department of Transportation “’llsting and Field Implementation of the Minnesota Video DetectionSystem,” unpublished documen~ n.d.

Chapter 3—Transportation Management and Technologies ● 95—-.———— —.... . . . . .- ————
.
Box 3-13-The Automated Traffic Surveillance and Control (ATSAC) System
One of the more advanced urban traffic control systems in place in this country is the ATSAC system, acomputerized traffic signal control system installed in Los Angeles. It is based on the Urban Traffic Control System(UTCS) software package developed by the Federal Highway Administration (FHWA) and was put into operationseveral weeks prior to the 1984 Olympic Games. Initial installation included 118 intersections and 3% detectorsin a 4-square-mile area centered at the University of Southern California and the Los Angeles Coliseum. It has sinceexpanded to include areas of the San Fernando Valley and central business district for a total of 371 intersections.The airport and Westwood areas are targeted for later implementation, and in 1991, the system is planned to include1,600 intersections. ATSAC is funded by a combination of FHWA monies, a traffic mitigation fired financed bydeveloper fees, and distributions from the Petroleum Violation Escrow Account fundi
From their workstations, ATSAC operators can monitor any portion of the surveillance area at any desired levelof resolution, from traffic flow data at intersections to traffic behavior over a region. ATSAC gives the current statusof any traffic signal in the network and gives traffic flow data for any loop detector in the network. Since it was firstinstalled, ATSAC has evolved into a signal timing system that automatically selects (and switches) timing plansby matching current traffic patterns against historical data Signal timing can be fine-tuned by manual override orautomated control to relieve local congestion. Figure D-1 depicts a typical system.
Closed-circuit television cameras,installed at important intersections assistin incident management and confirmincidents. ATSAC has improved trafficflow and economic benefits: travel time(-13 percent), number of stops (-35percent), average speed (+15 percent),fuel consumption (–12 percent), andvehicle emissions (–10 percent). Com-puterized signal control also providesrapid detection of faulty sensors andunusual traffic patterns due to incidents.Estimated cost savings to motorists(business and truck trips only) as a resultof lower operating costs and time savedrecovered the $5.6-million constructioncost of ATSAC after only 9 months ofoperation. The annual operating costs arerecovered within the first week of opera-tion every year.2
However, ATSAC relieves streetcongestion only, not freeway congestion,since freeway traffic falls under theauthority of CALTRANS. Recognizingthis limitation, the major transportationagencies in the Los Angeles area havebegun the Smart Corridor demonstrationproject, which integrates selected city-operated surface streets and State-operated freeways in a single trafficmanagement system.
Figure D-l—Typical Automated Traffic Management System
.7 Vehicle Signal
Qi\
)7I
~detector controller
Al- -—4—— – — – ~–
311L Two-way datatransmission network
. — — -Real-time computer
*
I +--- Input/output programs— —— ‘ - r — ——-– +----l
L On-line + Signal Signalopt imizers + timings
+ :::; yLJt communications Y
1
Display of traffic andsystem information
SOURCE: Ferranti Computer Systems, GEC Traffic Automation Ltd., and PlesseyControls Ltd., “Dynamic Urban Traffic Control,” SCOOT brochure, 1985.
1~~ Rowe, general maoager, Department of Transportation% City of Los Angeles, personal CtXM.llUtkiCZttiOm, Aug. 19 W 30, 1989.%Mwin Rowe et aI,, ATSAC Evaluation Study (3AM Angeles, CA: City of bs AWelf% ~P~ of Trmqmrtatiow M& 1987).
-— —.--.. .-- ——.——. .— . — . .-— .————— —.

96 ● Delivering the Goods: Public Works Technologies, Management, and Finance
nonrecurring congestion.31 Over one-half of allvehicle-hours of delay are caused by nonrecurringcongestion or incidents (vehicle accidents andbreakdowns that tie up traffic). Incident manage-ment programs use a variety of ATM tools to detectincidents, including conventional traffic surveil-lance, service patrols, closed-circuit television,roadside and mobile telephones, and citizens-bandradio.
Automatic Vehicle identification—AVI sys-tems are a promising option for automatic billing ontoll roads and bridges.32 Radio or microwave trans-ponders on a vehicle can be “read’ by equipmentplaced along a route or at a point where informationexchange or billing needs to occur, such as tollfacilities, weigh stations, and ports of entry. Addi-tional AVI technologies include optical and infraredsystems, inductive loop systems, and surface acous-tic wave systems.
Because AVI-equipped vehicles need not stop fordata transfer, widespread use would substantiallyreduce delay at these normal congestion points. AVIcould also be used to control access to facilities andto provide traffic data for travel flow and congestionmonitoring. Such systems are operating at theCoronado Bridge in San Diego, the MississippiBridge into New Orleans, the Lincoln and HollandTunnels in New York City (for buses), the Grosse IleBridge in Michigan, and the Dallas North Tollway.The Dallas (see box 3-E) and New Orleans systemsare the most heavily used, with 20,000 and 13,000subscribers, respectively .33
AVI also makes possible congestion pricing, orcharging automobile drivers for driving in congestedareas during peak hours. Congestion pricing pro-vides more funds for system improvements, and maycause some motorists to shift to public transit, makefewer trips, or plan their trips during nonpeak hours,thus reducing delays.
Weigh-in-Motion —WIM systems use road-mounted sensors to determine the weight of moving
Box 3-E—Fast Toll Collection in Dal!as
The Dallas North Tollway is one of the largestautomatic vehicle identification (AVI toll roads inthe Nation, Since August 1989, all of its toll laneshave been equipped with reading equipment capa-ble of interrogating transponders (toll tags) attachedto the inside of the windshields of subscribers’vehicles. The credit card-sized toll tags can bepurchased in $40 increments bymail or at a tag storelocated near the tollway. Tag users pay an extra5 cents per transaction over the usual toll as well asa $2 service charge for use of the transponder. Aftera successful transaction, a “valid tag-go” sign isflashed to the driver. If the toll tag credit is used up,a‘ ‘call tag store” sign is fIashed and the driver mustpay the toll in cash. Before the system beganoperation, an average of 350 vehicles per hourpassed through a toll plaza lane during rush hour.Now, 800 vehicles per hour pass through lanes fordrivers with toll tags or with exact change, andAVI-only lanes, which will be implemented in late1990, are expected to process 1,200 vehicles perhour, based on a vehicle speed of 10 miles per hour.At present, the tollway has some 30,000 AVIsubscribers, accounting for over 1 miIlion AVItransactions monthly.1
IKtXI ~C~, director of toil cO&XtiOn, Dallas No*‘IbIlway, personal commurdeatiom Nov. 7, 1990.
vehicles by taking into account axle weights, vehiclelength, and vehicle speed. By also calculating axlespacing, WIM devices can classify vehicles anddetermine their compliance with weight standards.Technologies used for WIM include piezo-electricsensors, load cell systems, shallow weighscalesystems, bending plate systems, and bridge systems.The most accurate WIM systems currently haveaccuracies within 10 percent of true vehicle weight,limiting their usefulness for enforcement purposes,34
although the information they provide about truckweights has proven useful for highway research andpavement design.— .
3*Gary Euler et al., ‘‘Final Report of the Mobility 2000 Working Group on Advanced Traft3c Management Systems (ATMS),’ unpublished report,March 1990, p. 2.
szAuto~tic vehicle idmtil~tion t~hnology is also sometimes referred to as electronic toll ~d ~~lc management.33Maureen Gallagher, director of research and member services, International Bridge, Tbnnel and Tbrnpike Association PrsO~ comm~~tio~
May 31, 1990.~Ned -OK ~~=r, Cufle Rock Consultants, personal communication Apr 28, 1989.

Chapter 3—Transportation Management and Technologies ● 97
Automatic Vehicle Location—AVL systemscurrently have their primary application in commer-cial fleet operations, since they typically identifyvehicle location and transmit it to a central facilityfor monitoring or dispatch purposes. An AVLsystem consists of equipment to locate the vehicle-usually based on dead reckoning, map matching,proximity to roadside beacons, or radio determina-tion—and mobile communications equipment,which relays this information to the central location.AVL can provide real-time information on shipmentstatus and eliminates the need for time-consumingdriver-to-control-center communication.
Surface Transportation Networks:Mass Transit
Mass transit refers to regional and municipalpassenger transportation systems, such as buses,light rail, commuter rail, trolleys, and subways (seetable 3-5). Early mass transit service was providedby private horsecar in the mid-1800s, and cable carsand electric streetcars served numerous urban ridersbetween 1880 and 1920. The versatility brought bybuses and automobiles caused rail transit ridership todecline slightly during the 1930s. During the imme-diate postwar years, transit patronage and revenuesfell again, and local governments began to takeoverthe systems from private operators. The establish-ment of a Federal grant program for transit in 1964and substantial increases in Federal support in 1970(see chapter 2 for further details) brought a largeincrease in public takeovers of transit agencies.
Transit Management and Financing
Today, most cities and towns with populationsover 20,000 have bus systems, usually operated bya municipal transit authority; over one-half (58percent) of all systems are located in towns withpopulations of less than 50,000. Local governmentsmanage transit systems as operating departments orthrough a public transit authority. Transit buses,operating on established routes on set schedules,account for over one-half of all public transitvehicles, passenger trips, and vehicle-miles oper-ated. 35 Seattle, Philadelphia, Boston, Dayton, and
San Francisco transit agencies still operate someelectric trolleys. Rail transit, rapid rail, light rail, andcommuter rail systems are usually owned by munic-ipal transit agencies, although some commuter railservices are run by State governments or operated byAmtrak.
Paratransit operators maybe municipalities, spe-cial purpose agencies, or private entities. Servicesinclude dial-a-ride, van pools, subsidized taxis, andshared rides in minibuses or vans; paratransit canprovide more direct origin-to-destination service,and operates on demand rather than on a fixedschedule. The primary residential users of paratran-sit are the elderly, handicapped, and children; airportshuttles are heavily used by business people andtravelers.
Of total transit revenues in 1988,36 percent camefrom passenger fares, 53 percent from State and localassistance, and 6 percent from Federal capital andoperating assistance, which totaled $3.3 billion (incurrent dollars) in 1988,36 down about 40 percentfrom 1980 (see chapter 2, table 2-2). Quadruplingfrom about $1 billion in 1980 to almost $4 billion in1988, State aid to local and regional transit nowsurpasses Federal aid.37 At least 40 States providelocal mass transit with some funds from generalrevenues, a dedicated portion of the general salestax, or motor fuels and vehicle taxes. States supporttransit because it is one of the few options availablefor relieving auto congestion and air pollution inurbanized regions, and seven heavily urbanizedStates contribute 80 percent of total State aid.
Federal capital grants may be used to finance busand subway car purchases, rail construction, andother capital improvements, but these programshave been criticized for not meeting communityneeds. Some cities receive more capital funds thanthey can use, encouraging large construction bud-gets, which may cause them to shortchange mainte-nance. Others, often those with older rail systems,are substantially underfunded38 and in desperateneed of capital equipment and track rehabilitation.About 70 percent of transit operating costs are labor
“39 these are not eligible for Federal assist-expenses,
ss~en~ ~blic Transit Associatio~ J989 Transit Fact Book (W-~ ~: 1989), pp. 1~13.
%~d., pp. 24-27,74-75.
37u,s. Dep~ent of Transportation op. cit., footnote 2, p. 24.3SU$S0 COWSS, Cowessiod Budget ~lce, New Directiom for t& Nation’s P@lic Works (WMh@OU ~: Nov_k 1989), p. 37.
qg~efi~ Public Transit Association op. cit., footnote 3% P. 33.

Table 3-5-Characteristics of Mass Transit
Type Right-of-way Fare collection Maximum speed Power source Places in use Funding
Bus City streets anddedicatedbus lanes
Heavy rail Dedicated under-ground, sur-face, or ele-vated
Light rail City streets and/or fully grade-separatedtracks
Commuter Railroadsrail
In vehicle or 35 mph on city internal combus- Virtually all urban areasstation streets, 55 mph tion engine
on highways
75 mph
55 mph
Third railin station New York; Chicago; Boston; Philadel-phia; Atlanta; Washington, DC; SanFrancisco; Los Angeles (under con-struction)
In vehicle or Overhead New Orleans; San Francisco; Philadel-station catenary phia; San Jose; Portland, OR; Bos-
ton; Sacramento; Buffalo; Cleve-land; San Diego; los Angeles; LongBeach
In vehicle 100 mph Diesel/electric San Francisco Bay area; New York-Iocomotive New Jersey; Boston; Philadelphia;
UMTA discretionary grants (sec.3), formula grants for operatingand capital expenses (sec. 9),and operating and capital as-sistance for rural areas (sec.18)
UMTA formula and discretionarygrants (sees. 3 and 9)
UMTA formula and discretionarygrants (sees. 3 and 9)
UMTA formula and discretionarygrants (sees. 3 and 9)
Chicago; Washington, DC-Balti-more; Miami-West Palm Beach
SOURCE: Office of Technology Assessment, 1991, based on Urban Mass Transportation Administration (UMTA) information.

ance. Cr i t ica l to urban movement , publ ic masstransit is not a profitmaking venture anywhere in theworld. In the United States, farebox revenues coverless than 40 percent of operating costs on average,and service is usually subsidized locally from Stateor local general funds and earmarked taxes. Busesreceive substant ia l ly h igher subsid ies than ra i ltransit systems.
I s s u e s
Transit agencies are not typically an integral partof local and regional transportation and land-usedecisionmaking which undermines t ransi t ’s poten-tial role in solving local and regional transportationp rob lems . Wh i l e t r ans i t i s subs id i zed i n mos tcommunities, its competitive position as a transpor-tation alternative is reduced by municipally subsi-dized parking and by Federal policies that do not taxemployees for parking benefits, but do tax most
transit allowances. Furthermore, the costs of alterna-tive capital improvements (a new highway lane, forexample) are often underestimated.
Transi t systems are important a l ternat ives forincreasing surface transportation capacity in con-gested urban corridors. However, transit must com-plement strong growth management programs, suchas those applied in Oregon (see box 3-F), if transit isto be more effective at alleviating congestion.
Bus transit systems have made major efforts toupgrade their maintenance programs, because vehi-c les in poor condi t ion break down f requent ly ,making schedules hard to keep. However, manyoperators of smaller buses, such as those used insmall communities or in paratransit, encounterproblems with brake wear, corrosion, electrical andair conditioning systems, wheelchair lifts, and vehi-cle handling.40 Maintenance costs are thus high forthese small operators.
40Charles Dickson, director of training, Community Transportation Association of America, personal Communication, May 31, 1990.

700 ● Delivering the Goods: Public Works Technologies, Management, and Finance
Box 3-F-Oregon’s Growth Management Program
Oregon is using growth management to control urban sprawl and cut public works costs. All Oregon cities mustincorporate urban growth limits and public facilities plans into their State-mandated comprehensive plans and adoptconsistent zoning ordinances. State legislation, adopted in 1973 to protect prime agricultural land from haphazardurban development, requires that comprehensive plans show an urban growth boundary, which defines the extentof urban expansion permissible over a 20-year period. The boundary is based on forecasted land-use needs, physicalcharacteristics of the land and local growth policies.1 Although it took over a decade to achieve, all cities andcounties now have State-approved comprehensive plans. State actions, including those of the Highway Department,must be compatible with local plans.
In addition to comprehensive planning requirements and urban growth boundaries, State housing policy is animportant growth management tool, because it requires cities to zone for high-density development as a means ofstimulating construction of affordable housing. To a greater extent than in most other States, development in Oregonin recent years has followed high-density patterns; in 1989 Portland had the highest percentage increase inmultifamily construction in the country and from 1985 to 1989,54 percent of all residential construction in the Statewas multifamily.2 Developers generally support the high-density zoning policy because it reduces per-unitconstruction costs and because the mandated consistency between zoning ordinances and comprehensive planseliminates lengthy and unpredictable rezoning proceedings. Local officials find compact, highdensity developmentprovides the market needed for mass transit, reduces other municipal service construction and operating costs, andincreases affordable housing. Heightened interest in light rail transit, instead of more highways, is another benefitof this policy.3
While State officials are optimistic about the long-term effectiveness of growth management to reducetransportation and other facility costs, pockets of existing development outside the urban boundary undercut theeffectiveness of growth limits. These low-density unincorporated areas, largely exempt from the strict limits ondevelopment in effect elsewhere, continue to grow. In the Portland region, they have absorbed only 5 percent ofresidential growth, but in other fast growing areas one-quarter to over one-half of residential development occursin these unregulated places, complicating regional planning and financing for highways and public utilities, Evenwithin urban growth boundaries, new development is not necessarily contiguous to old and gaps occur, whichincrease public works costs and inefficiency. The Oregon Department of Land Conservation and Development isconducting a major study to evaluate the impact of current growth management programs and how to improvethem.4
IH COwerva@n and Development Commi ssio% Oregon’s Statewide Planning Goals, 1990 (Sale~ OR: 1990), p. 14.2Jok Kelly, project manager, oregon Department of Land Conservation and Development Commission+ P@!W@ COlllllldtXt@l, Nw.
1, 1990.3J’&id,
‘%id.—
For r-ail transit systems the components most in rail transit systems to a level ‘‘. . . consistent withneed of rehabilitation or replacement are railcars, current standards of safety, reliability, and aestheticspower substations, overhead power wires, mainte- for new rail systems . . .“ have been estimated atmince facility buildings and storage yards, and $17.9 billion.41
bridges. All also require high degrees of ongoingmaintenance. Facilities and equipment in the poorest Technologies for Transitcondition are usually the oldest, such as those in Fleet and facility management and regular main-New York City, Chicago, and Philadelphia, some of tenance are of primary importance in extending thewhich are more than 50 years old. Rehabilitation and lives of mass transit vehicles, in controlling costs,modernization costs to bring the Nation’s existing and minimizing environmental effects.
. — —olGaett Fleming TrmSpO~tiOn l%gincefs, Inc. et d., Rail Jlodernization Smdj, Report No. UMTA-PA 06-MB9-86-1 (Was~@oU DC: us.
Department of Transportatio~ Urban Mass Transportation Administration, April 1987), p. 2.

Chapter 3—Transportation Management and Technologies . 101
Buses
Busways-One traffic management strategy im-plemented by many cities is the creation of exclusivebus lanes on which only buses and commuter vansmay travel. Busways have reduced travel timessignificantly and cost far less than new rail lines.They can be grade-separated, created from wideningexisting roads, or by simply dedicating existinglanes to bus traffic.
Automatic Vehicle Monitoring—AVM sys-tems can locate transit buses and communicateinformation to drivers, dispatchers, central trafficcontrol computers, and passengers. Methods forlocating buses include LORAN C, dead reckoning,satellite referencing, and roadside beacons anddetectors. (See chapter 5 for further discussion oflocation technologies.) Radio channels can providevoice communication or data transmission linksbetween the bus and the central control. To speedtravel, buses with communication links to themunicipal traffic control system (as in some Frenchand Dutch cities) can be given signal priority atintersections. AVM technologies are used by transitauthorities for automated bus-to-dispatcher commu-nication, as well as for collection of data on bustravel times, stops, and adherence to schedules, andthus can bean important source of data for planningand management.42
Communications technologies, such as cabletelevision, videotex, telephone, video screens, andspeaker phones, can provide schedule and statusinformation to passengers on the bus, at bus stops, orat home. Speaker phones and automatic telephoneinformation systems can supply patrons with busarrival information specific to each bus stop. Cabletelevision enables bus passengers to view mapdisplays of routes and bus locations, while videoscreens at bus stops give passengers bus scheduleand arrival information. Onboard systems displayupcoming stops and connections with other modesof transportation.
Electronic Control Systems-Such systems canreduce emissions, smooth shifting, increase acceler-ation, and quiet operations for engines and transmis-
sions and electronically controlled power and drivetrains. The ability to diagnose engine and transmis-sion problems electronically should reduce mainte-nance costs and allow vehicles to stay in servicelonger. 43
Bus systems in cities with serious air pollutionproblems must comply with new emissions stand-ards by 1994. Emission control equipment andreformulated (’‘clean’ diesel fuel or alternate fuelsare among the alternatives, and agencies must weighthe trade-offs between capital costs, fuel costs,maintenance, and relative reduction in emissions inmaking decisions. Regardless of the ultimate choice,different equipment and/or fuels will bring newmaintenance concerns.
Particulate Traps-These consist of a metal-cladceramic falter, which captures particulate from theexhaust stream of a diesel engine. Tests conductedin California demonstrated that particulate traps canremove some 70 percent of smoke and soot emis-sions from the engine with no sacrifice in perform-ance. However, the reliability and durability of thetraps over the life of a bus remains in question. Testsof diesel particulate trap oxidizer systems are inprogress or planned in nine North American cities.44
Methanol—This is the alternative cleaner burn-ing fuel that has been tested most thoroughly for bususe. It is producible in the United States from naturalgas, coal, and biomass. It has one-half the energycontent of gasoline, meaning that 1 gallon of M100(pure methanol) gives about one-half the mileage of1 gallon of gasoline. However methanol is toxic,corrosive, and highly flammable, so different han-dling procedures and redesigned fuel and exhaustsystems are necessary. Lastly, a distribution systemcomparable to the existing system for gasoline anddiesel fuel will be needed before methanol can beavailable for nationwide use.
Natural Gas-Used in motor vehicles sinceWorld War II, natural gas now fuels primarilylight-duty van and truck fleets. The largest currentprogram for buses is in Vienna, Austria, where 400buses run on liquefied natural gas. Compressed
4XZUMdian ur~ T-it &SOci&m, prOceed@S: The International Conference on Automatic Vehicle Location in Urban TraM-t SYste~(’lbronto, Ontario, Canada: September 1988).
da~orge Ix, Pmgm m~ger, OffIce of Engineering Evd~tioIIs, urb~ ~s ~spo~tion ~“ “stratiom personal communicatio~ May31, 199Q and “NJ Transit Gins Advantage With Electronic Engine and Transmission Control Systems,” Bus Ride, vol. 26, No. 1, March 1990, pp.48-49.
44~~x~rs of Emission con~ols &~~tio~ “’f’rap Oxiber con~ol s~~ Repo~’$ ~ubli~ed document, Novemk 1989, pp. 8-10.

102 ● Delivering the GOOdS: Public Works Technologies, Management, and Finance
natural gas (CNG) is the most common formconsidered for bus use in this country, however. Incontrast to methanol, CNG is not corrosive, causesless engine wear, and gives longer engine durability,although as for methanol, larger onboard fuel tanksand new distribution facilities would be needed.CNG vehicles can require substantially more time torefuel than methanol or diesel fuel vehicles, aparticular concern for bus fleets, which can affordlittle down time.45
Rail Transit
Track Inspection Technologies—These includeautomated track measurement systems, which oper-ate either as dedicated vehicles or measuring devicesfitted to passenger cars. The equipment uses electro-optical or electromagnetic methods to give dynamicmeasurements of track geometry under loadedconditions. It measures and records track location,gage, profile, and alignment in a fraction of the timerequired by a track walking crew. However, theautomated track geometry measurement systemdoes not detect other track characteristics such as railfatigue, tie fastener problems, or concrete cracks.Newer track geometry cars can be equipped withvideo or other equipment to record information suchas overhead clearance, third rail alignment, foliageclearance, and tie condition. Dedicated rail flawdetection cars are used to test rails ultrasonically fordefects, which usually result from fatigue. Trackdata of all kinds can be stored in computerized datamanagement systems to help in setting priorities forfurther inspection and maintenance.
New Rail Propulsion Technologies—Suchtechnologies as alternating current (AC) tractionmotors can save substantial energy costs. ACtraction motors are operating successfully on railvehicles in Europe and Japan and have beenintroduced in New York City and Philadelphia;trolley buses and light rail already use them. ACmotors can reduce energy consumed in starting,braking, and heating; reduce maintenance and repairexpenditures because they have fewer moving parts;and reduce slipping, skidding, and wheel and railwear.
Offsetting these benefits is the greater weight ofthe line filter, which must be added to smooth linecurrent and reduce signal interference. The cost of
converting existing cars to run on AC is substan-tial-about $200 million for one regional agency.%
Control Systems—Most modem train controlsystems now use pulsed currents through the trackcircuit to communicate allowable speed informationand employ cab signaling, rather than waysidesignaling, which allows quick response to changingtraffic information. While older, wayside signalingconveys information only at block entrances, cabsignaling gives signal displays within the cab of thetrain, and displays are updated continuously inresponse to the condition of the track ahead. Thisenables trains to run with a higher level of safetythan with wayside signaling (see box 3-D again).
Automated Guideway Transit—AGT typicallyprovides slow-speed continuous service along dedi-cated, isolated guideways; cars are controlled bymicroprocessors. They function automatically anddo not require onboard operators, but they do requireexclusive right-of-way and security systems, such asanti-intrusion devices at stations and on the right-of-way. They can use steel wheels on rails, rubber tireson concrete guideways, or even magnetic levitation.Fare collection takes place in the stations. Examplesof AGT include people mover systems in Detroit,Miami, Jacksonville, Tampa, Morgantown (WestVirginia), VAL in France, SkyTrain in Vancouver,British Columbia, the M-Bahn in West Germany,and numerous shuttle systems in airports, andamusement parks.
Personal Rapid Transit—Concepts for PRTsystems include new configurations of existingtechnology and feature:
small, fully automated vehicles (withouthuman operators or attendants), available forexclusive use by an individual or a small grouptraveling together; andvehicles captive to a small, dedicated guide-way, located above ground, at or near groundlevel, or underground, which provide directorigin to destination service on demand withoutstops or transfers.
PRT systems face difficult environmental hurdles inthe form of objections to above-ground guidewaysand stations, which duplicate the road network tosome extent. Security concerns center on the driver-
4SL.R. Davis, d~tor, Equipment -w-e, Southern California Rapid Transit DistricL personal comnmnicatio% w. 22, 1990.
-cials from the Washington Metropolitan Area Transit Authority, personal communication, Jan. 22, 1990.

Chapter 3—Transportation Management and Technologies . 103
less cars and unattended stations, while safety issuesinclude whether many small, closely spaced vehiclescan run safely on a single-lane guideway.
Surface Transportation Networks:Railroads
Rail service in the United States is provided by amix of public and private entities. The quasi-publicNational Rail Passenger Corporation (Amtrak), cre-ated in 1971, is the primary intercity passenger railcompany (see figure 3-6). Because of the importanceof public sector support to the continuation ofpassenger service, discussion in this section willemphasize passenger service and the Federal role.However, hundreds of private freight railroads playan equally critical part in the national transportationsystem, carrying bulk materials, such as coal andagricultural products, and about 50 percent of themarket for long-haul transportation of manufacturedcommodities. 47 Freight railroads compete withbarge lines for shipments of large bulk commoditiesand with tractor-trailer trucks for smaller bulkshipments. To counter the faster, more flexibleservice trucks can provide, rail companies haveconcentrated traffic and investment on fewer, high-density lines48 and introduced double stack andrail-highway vehicle services. The largest, or Class1, freight railroads, account for over 90 percent ofrailroad traffic and employ over 90 percent of the railwork force.49
Regional railroads are usually defined as thosewith between 250 and 1,000 miles of track, whilethose with less than 250 miles of track are classifiedas shortline or local railroads. Most of these 32regional lines are privately owned. However, 1 ofthem, and 31 of the over 400 shortline or local linesare owned and operated by State and local gover-nments (although they operate on privately ownedtrack). Since the Staggers Act (see chapter 2), the
number of shortline and regional railroads has grownsignificantly, providing continued service for manylocalities. 50
Railroad Management and Financing
The private sector owns and operates most railinfrastructure, including 97 percent of the total trackmileage, as well as most bridges, control systems,communications systems, yards, service buildings,vehicles, and support equipment.51 Amtrak ownsmuch of the track along the Northeast corridorbetween Washington and Boston (its busiest routes)and some along the Chicago-Detroit corridor, a totalof 600 miles. The Corporation contracts with 15private freight railroads to provide train dispatch andtrack maintenance services outside these corridors.Its operating fleet includes some 300 locomotivesand 1,900 passenger cars, most of which it owns. Ofits almost 39 million passengers in 1989, about 44percent rode on commuter rail systems operated byAmtrak on a contract basis; the rest were intercitypassengers. 52 In 1989, Amtrak trains carried more
travelers between Washington and New York thanany airline.53
Each year, Amtrak receives a Federal operatingsubsidy of about $500 million, which it splitsequally between its intercity long-distance routesand its shorter distance Northeast corridor opera-tions. In fiscal year 1989, the Corporation earned$1.27 billion in revenues, enabling it to cover 72percent of its operating costs from its own sources.About one-half of Amtrak’s yearly capital expensescome from internal sources, and the rest come fromFederal aid.54
States play a relatively minor role in financing,operating, or regulating railroads. Nonetheless, atleast 20 States provide assistance to local rail servicefrom earmarked taxes and general appropriations,and most maintain a State Rail Plan that includes an
dT~omtio~ material prepared for C)TA by the Association of American Railroads, J~. 31, 1990.
~Federal Railroad AdmmI“ “stratiou briefing document prepared for O’IA, 1989.4~,s. ~ner~ &cow@ ~lCe,znfo-tiOn on R~@afO~ Ref~~ Utier the sfuggerSRuilACfOf 1980 (wM~o~ DC: Aug. 17, 1983), p. 1.
WFederal Railroad Adnum“ “stration and Interstate Commerce Commission A Survey of Shipper Sati~action With Service andRates of Shoreline andRegional Railroads, joint staff study @%#dngtoq DC: August 1989), p. 1; and Association of American Raihoads, Profiles of U.S. Railroadr,supplement No. 1 (WashingtorL DC: 1990).
slFede~ ~~oad Administratio~ op. cit., footnote 48.5~omuta Semic= operated by ~~ ~clude tie ~5ach~e~ Bay Tr~it Au~ori~ ~~) ~d he -Md MI commuter SCrViCC
Wa
53Natio@ Railroad Passenger Corp., Annual Report 1989 wttdl@3% ~: 19$0.
~Natio~ ~koad p~~nger Corp., “ 1990 Legislative Report,” unpublished document, Feb. 15, 1990, pp. 5-9.

104 ● Delivering the Goods: Publ ic Works Technologies, Management, and Finance

Chapter 3—Transportation Management and Technologies . 105
inventory of facilities and a ranking of proposedprojects. A few large, urbanized States, Californiaand Pennsylvania, for example, subsidize or supplyintercity passenger train service. Other State aid isdistributed as grants or loans to small, shortlinefreight carriers. Local governments have few directresponsibilities for railroads, although commuterrailroads are major highway traffic relievers incongested metropolitan areas.
Rail Issues
Amtrak hopes to achieve full operating self-sufficiency by the year 2000, but needs to replace itsaging fleet of cars and upgrade track along severalcorridors to maintain and expand current levels ofservice. It could operate far more efficiently withnew locomotives and by using double-deck passen-ger cars on heavily traveled lines. To meet demandon sold-out long-distance routes, Amtrak plans topurchase at least 75 two-level sleeping and foodservice cars. On several routes, these cars willreplace single-level cars, which can be used on otherroutes to expand capacity.
Although Amtrak must purchase a good deal ofnew equipment to sustain revenue growth, doing sorequires large amounts of capital, which the railroadhas few means of accumulating. Yield management,higher fares, and efficient utilization of equipment,55
its current sources of increased revenue, are unlikelyto generate the dollars needed. Improved track,maintenance facilities, locomotives, and passengercars are expected to cost the Corporation about $300million annually during the 1990s and require sumsfar greater than the current Federal capital grants ofabout $30 million annually.
Rail facilities are strategically located in mostcities and offer often underutilized capacity, which,under the right circumstances, could bean economi-cal option for moving people and goods within andbetween metropolitan areas. However, funding con-straints often prevent railroads from making theinvestments necessary to keep customers. Shortlineand regional railroads that have formed from rail-road lines where maintenance was deferred and
neglected face rehabilitation needs far exceedingtheir ability to pay. A Federal Railroad Admin“ “stra-tion survey of small railroads found the one-timecosts of track and roadbed rehabilitation-replacingties and ballast and improving track surfaces-to behigher than annual revenues for many lines, about$428 million in total. Modal subsidies, embedded inFederal programs for other types of transportationassistance, provide support for other modes in waysthat would benefit railroads.
Labor issues are a final management concern forrailroads. Federal regulations requiring a supple-mental retirement system for railroad employees,raihoad-funded benefits for employees made joblessby a consolidation, line sale, or abandonment,56 andrailroad workers’ compensation statutes are particu-larly hard on shortline and regional railroads becauseof their small size and scale of operations.
Rail Technologies
Railroad technology in the United States is notcharacterized by rapid change; for instance, the airbrake system is the same conceptually as when itwas introduced, and standard track still consists ofsteel rails, spikes, and wood ties mounted on ballastof crushed stone.57 (For a potential exception, seebox 3-G.) However, new technologies for railroadoperations have developed rapidly in recent years.Electronic data information systems, radio commu-nications, advanced train control systems, and otherpropulsion innovations have enabled many railroadsto operate more efficiently and productively.
Keeping the System in Good Shape
Track condition has benefited from a new empha-sis on longer wear rail metallurgy, continuouswelded rail, profile grinding to extend rail life,concrete cross ties, new fastening systems for bothconcrete and wood ties, track geometry measure-ment systems, track maintenance planning tools,new inspection technologies, and more mechanizedand automated maintenance equipment.58
Track Maintenance Management Systems-Such systems function as decision support tools for
55W. Graham Claytor, Jr., president and chairman of the boar~ National Railroad Passenger Corp., testimony at karings before the HouseSubcommittee on Transportation and Related Agencies, Committee on Appropriations, Mar. 22, 1989, pp. 2-3.
fi’l”he hters~te Commerce Commission which has the authority to exempt line sale from kbor protection k etd ex~tions to most of *newest regional railroads.
‘7Federal Railroad Administration op. cit., foomote 48.ss~id.

106 . Delivering the Goods: Public Works Technologies, Management, and Finance
Box 3-G-Magnetic Levitation Research
The High Speed Ground Transportation (HSGT) Act, passed in 1965, establ ished the Office of High speedGround Transportation in the Department of Commerce whose objectives were to explore advanced intercityground transportation technologies. Most early work on magnetic levitation (maglev) occured around the time ofthe act’s - at Brookhaven National Laboratory the Massachusetts Institute of Technology (MIT), and anumber of private industry research facilities. However, other than feasibility studies and technical assessments,U.S. maglev work essentially ended in 1975, with the expiration of the HSGT Act.
The Department of Energy, Department of Transportation, and the Army Corps of Engineers have recentlybegun anew effort, the National Maglev Initiative, to assess the engineering, economic, and environmental aspectsof maglev and determine its feasibility for the transportation system. The budget appropriation for fiscal year 1991include $10 million for the Federal Railroad Administration an d $2 million for the Army Crops of Engineers tobegin work. A major program report planned for March 1991 will include technical and economic assessments,plans for developing U.S. capability to surpass existing foreign technologies, and recommendations on whether topursue further development.
Currently, maglev research is most active in Germany and Japan whose efforts have been underway way since thelate 1960s. Research in Germany, sponsored by the Federal Ministy of Research and Technology has focused onelectromagnetic suspension designs, while the Japanese areinvestigating both electromagnetic and electrodynamicdesigns.
One of the Japanese systems, an electrodynamic“c suspension design was originally developed by the JapaneseNational Railways (JNR). Work began in 1967, and research and development (R&D) costs through mid-1988 were$416 million. Since the priva ”tization of JNR in 1987, development of this system has come under the responsibilityof the Railway Technical Research Institute (RTRI) one of 12 offshoots of JNR. RTRI receives funds from the JapanRailways Group, a Consortium including six passenger railway companies the Japan Freight Railway Company,and the Japanese govermnent (Ministry of Transportation).l The vehicle has a top speed of over 300 miles per hour,but has been tested only over short distances at a test facility in Miyazaki. This system is the only maglev technologythat uses superconductivity. This Japanese technology require less sensitive tolerances betweentrack and train thanthe German system and thus maybe less costly to construct and maintain Although recent advances in developinghigh-ttemperature superconducting materials are not likely to affect the overall feasibility of this maglev technology,using high-temperaturee superconductors for mshlrb could bring modest gains in energy efficiency cfficiency and reliability.
railroad engineers, technicians, and planners for locomotives, which it is now evaluating in revenueidentifying physical track assets, inspecting andevaluating track, identifying work needs, and plan-ning and priority setting. Information is collectedand stored in large databases and includes installat-ion information; track segment inventory; inspec-tions, traffic levels, maintenance records, and repaircosts; and work crew history. These systems can alsohandle information about operations and store dataon planned and completed maintenance and repairwork for each track segment.
AC induction Motors-AC motors can beadapted to passenger rail and could extend the meantime between motor failures from 11/2 years to morethan 5 years.59 Amtrak has acquired two AC traction
service. The motors have fewer parts than DCmotors, require less maintenance, and are smaller,lighter, and less noisy. Amtrak has not yet deter-mined whether its future locomotives will use AC orDC traction.60
Concrete Cross Ties-Concrete ties providetrack with greater stiffness and stability than woodties and may be more durable, if track and vehicle arewell maintained. However, concrete ties are suscep-tible to cracking or fracture from impact loads, suchas those caused by irregularities in track or wheels.Widespread use of concrete ties has therefore beenprimarily on modem systems that are maintained tohigh tolerances, such as the TGV in France, and in
59K.M. Watkins, director, Motive Power, Amtrak, personal communication, May 25, 1990.60Terry Brunner, general superintendent of Iocomotives, Amtrak, personal communication Nov. 6, 1990.

Chapter 3—Transportation Management and Technologies . 107
A 27-mile test facility is under development in Yamanashi prefecture, and an extensive 4-year test of the systemis expected to commence in 1993. About $3 billion will be invested over the next 7 years for construction and testing,and the Yamanashi“ test track may become part of a possible revenue line between Tokyo and Osaka.
The other major Japanese system is the High Speed Surface Transportation (HSST) system, an electromagneticsuspension design with a top speed of 180 miles per hour. Development of this system began in 1975 by JapanAirlines, but in 1985, the technology was transferred to the HSST Corporation. Since 1981, the HSST system hasreceived no government funding; this system is still under development with no estimated completion date. HSSTmaglev has been demonstrated extensively but has never realized its top speed during these demonstrations becausetest track length has always been less than 1 mile. Because of its relatively low maximum speed in relation to othermaglev designs the HSST system will probably not compete with the RTRI system over longer routes. However,the technology is more mature, and applications could begin much sooner.
Modem maglev technology in Germany began in 1969, when the Federal Ministry for Transport commissioneda study on high-speed, track-bound, ground transportation. In 1977, the Ministry of Research and Technologydecided to concentrate development work on electromagnetic suspension designs, and between 1970 and 1980,provided funding in support to the Transrapid consortium As of mid-1988, over $800 million had been spent onthe Transrapid R&D program. The TRANSRAPID 07 vehicle has achieved a top test speed of 280 miles per hourand accommodates about 200 seated passengers. The Emsland test facility has a 19.5-mile track which has beenin operation since 1983; more than 15,000 miles of tests have been accumulated on the system. Although GermanTransrapid technology is currently the most advanced of the prototype systems many feel its precise tolerancerequirements could lead to high maintenance costs. The Transrapid is estimated to cost $20 million perdouble-track-mile, not including right-of-way acquisition and station costs.2
In December of 1989, the German government approved a 33-mile revenue route between the airports ofCologne/Bonn and Dusseldorf, later to be extended to Essen for a total of 51 miles. However, the government hasstipulated that the DM 3.6 billion in capital costs must be shared by private industry, the airports and airlines, andthe state of Northrine-“ -Westphalia and it is unclear whether this conditioncan be fulfilled.3 Recognizing the bleakoutlook for maglev in Europe because of the likely dominance of conventional high-speed rail systems-the FrenchTGV and German ICE, for examp--Transrapid is pursuing corridors and feeder routes in foreign markets, suchas the USSR, Saudi Arabia, Canada and the United States, to showcase its technology. A 13-mile route from theOrlando, Florida, airport to the Disneyworld vicinity maybe the first high-speed revenue maglev system.
this country, Amtrak’s Northeast corridor and program to identify technologies capable of retain-heavy-duty “height lines with extensive curvature.61
Rail Head Lubrication—This can increase fuelefficiency and reduce track and vehicle wear. Trainstraveling over straight sections of lubricated trackconsume between 3 and 10 percent62 less fuel thantrains traveling over unlubricated sections, andlubrication may save costs for car and locomotivewheel replacements as well.63
Passenger Waste Disposal—Criticism forreleasing untreated human waste from trains en routeled Amtrak in August 1989 to initiate a research
ing up to 72 hours of waste. Prototype systems havebeen installed on Amtrak trains, and their durabilityand the costs associated with providing and operat-ing equipment on existing trains are being assessed.
Increasing Capacity
High-speed train technology alternatives can in-crease capacity and efficiency without requiringmajor acquisition of new right-of-way (see box 3-H)in crowded intercity corridors. In the Northeastcorridor, electrifying the entire line and utilizing tilttrains could reduce travel time between New York

108 . Delivering the Goods: Public Works Technologies, Management, and Finance
Box 3-H--High-Speed Rail
With substantial government assistance, high-speed rail has become both successful and efficient in Prance,Japan, and Spain over the past several decades. The TGV France’s high-speed rail system, began operations in theearly 1980s. Construction on the newest line of the TGV, the Atlantique, began in 1985. The Y-shaped line consistsof a main trunk between Paris and Courtalam“ and two auxiliary branches. The Western Paris-Le Mans branch wascompleted in 1989, and the southwestern Paris-Tours line was completed in 1990. Total estimated cost is 16 billionfrancs ($3 billion) for construction of 163 miles of track and rolling stock. The line includes 13 miles of tunnels,2 miles of viaducts, and seven flyovers to keep trains from crossing“ existing tracks. Maximum design speed is 300kilometers per hour (km/hr) (186 miles per hour (mph)), with turnout crossing speed of 160 and 220 km/hr (100and 136 mph).1
Land belonging to the SNCF (the French national railway company), the government, or alongside existingrail or highway right-of-way was used for 60 percent of the Paris-Courtalain stretch. To avoid level crossings, thereare more than 310 structures along the line, including 164 road bridges and 139 rail bridges. Continuous weldedrail and reinforced concrete crOSS ties are used throughout. The line is electrified and uses five power Substations.A control center at Paris-Montparnasse has telemetry and remote control equipment for the crossovers, spaced atapproximately 14-mile intervals, between the two tracks. It also controls electric power feed and can interven viaradio Iinks with all trains on the line. Fifteen satellite stations house safety equipment for each crossover site. Thetrack-to-locomotive transmission system sends signaling information to the cab, where the driver reads it on thecontrol panel.2
The TGV’s power and adhesion, and “d dedicating the high-speed corridor to passenger service with its lightloads, made possible a line with gradients of up to 3.5 percent (on the Paris-Sud Est Iine--the maximum grade onthe Atlantique line is 2.5 percent), instead of the usual 0.5 to 0.8 percent gradients. As a result, the line could berouted over plateaus where large-radius curves could be easily laid out, and thus avoid valleys, which are oftensinuous, densely populated, and furrowed by waterways and roadways--all of which increase construction costs.The TGV lines are compatible with existing track, so that the trains can penetrate city centers and serve all majorstation on the way.3
The Japanese Shinkansen (Bullet Train) long -
distance high-speed railways include two groups, the Tokaidoand Sanyo Shinkansen, which run Southwest from Tokyo, and the Tohoku and Joetsu Shinkansen , which serve theregions to the northeast. The Tokaido line began service in October 1964, while the Sanyo Shinkansen began
1SNCF, Direction de la communication, ‘The TC3V Atlantique: Construction of the New Line," June 1986.2Tbid.3SNCF, Direction de la communication,“The Railways of France,” brochure, n.d.
and Boston to under 3 hours from the present 41/a data communications link. Display screens in eachhours. Equipment and right-of-way upgrades couldlower the time between Washington and New Yorkto under 2 hours 15 minutes. While requiringsubstantial public investment, these improvementsare important in the short term, because they couldrelieve traffic congestion in air and highway corri-dors.
Advanced Train Control Systems-ATCS arecomputer based and give precise data on trainposition, condition, and speed. Location and speedare determined by coupling locomotive odometerswith either in-track transponders or a satellite-basedGlobal Positioning System (GPS). Information istransmitted between the central dispatch computerand the locomotive through a UHF or VHF radio
locomotive cab show train location and speed,upcoming route profile, speed limits, and otherauthorities from the dispatch center. The dispatchercan send instructions directly to the locomotiveengineer and receive precise information on trainlocation and speed. Efficiency is improved by bettercoordination of train movements, precise meet andpass planning, and more efficient use of crews andequipment. Sensors mounted on the engine, electri-cal and air systems, and fuel tanks can collect dataand monitor locomotive performance in real time.Transmitted to dispatchers and maintenance facili-ties, these data can reduce troubleshooting times andmaintenance costs. Safety is improved, because ifthe engineer does not follow speed instructions or

Chapter 3—Transportation Management and Technologies . 109
operating in March 1972. The Tohoku Shinkansen which runs north from Tokyo, began operation in June 1982;its east-west connecting line, the Joetsu Shinkansen began service in November of the same year. Maximum speedfor the line is now 150 mph.
When the Japanese National Railways was privatized in 1987, these lines became the property of the newShinkansen Holding Corporation, which leases them to three passenger railway companies: the East, Central, andWest Japan Railway Companies. A total of 2.7 billion passengers have been carried on the Shinkansen withoutinjury. The Shinkansen’s ability to take passengers directly from city center to city center makes it competitive withairline and expressway transportation, and five additional routes are scheduled for future construction.4
Shinkansen tracks are equipped with snow-melting facilities to prevent railway switch points from freezingin cold weather. Additional steps, such as covering the lower parts of the cars and using centrifugal snow separators,,which remove snow from the intake air,s are taken for the lines that pass through areas with heavy snowfall. Trainsoperating in areas prone to earthquakes are protected by a combination of earthquake detection and control systems,including seismometers installed every 20 to 80 km along the line. If land cables are damaged by large earthquakes,a communications satellite system will be used to transmit information.6
Tilt train technology is based on car bodies capable of tilting when moving through curves to reduce passengerdiscomfort. Development of one tilting train, the Spanish TALGO, began in the 1940s. The latest TALG0 modelis designed for a maximum speed cm straight track of 125 mph and for rounding curves safely at speeds 25 percentfaster than conventional trains.7 The TALGO trainset is made up of a succession of rigid cars articulated so as topermit the train to negotiate curves without vertical or transversal displacement between cars.Acceleration felt bythe passenger due to displacement when the train rounds a curve depends on the tilt of the car and is significantlyreduced if the car is tilted in toward the center of the curve. The suspension system in TALGO cars is above thecenter of gravity; the air springs of the main suspension behave elastically, allowing the car to tilt naturally aroundcurves as a result of centrifugal force. The TALGO trains also have an automatic gage changing mechanism toaccommodate different track gages.a Other tilting train configurations are manufactured by Bombardier of Canadaand Asea Brown Boveri, a Swedish-Swiss consortium. These are active tilt systems, which employ poweredactuators to cause the desired roll.
4East Japan Railway Co., Shinkansen brochure, n.d.5Ibid.6Ibid.7R E N F E , "TALGO: An Up-to-Date Train; A Long History,” informational document, n.d.8RENFE, “TALGO Pendular,” informational brochure, n.d.
conditions along the route require emergency con- traffic in major double stack lanes fell 25 percenttrol, 64 speed can be remotely controlled.65
Perhaps the most dramatic recent development inincreasing the efficiency of rail freight transport hasbeen the introduction of double stack service.Double stack cars consist of skeleton car spines,each capable of carrying two containers. Thisreduces weight and aerodynamic drag and cuts byroughly one-half the amount of power needed tomove trains at market-competitive speeds; that is,100 containers on double stack cars require 4locomotives, the same number needed to haul 50containers on conventional cars. Double stack hasbeen a major competitive success; long-haul truck
between 1985 and 1988, even though long-haultrucking in the rest of the country grew 33 percentduring the same period.66
Fuel Efficiency Measures-Approaches includeautomatic devices to prevent or reduce fuel spillage,recovering and recycling spilled fuel for heating andair conditioning railroad sheds and buildings, im-proved aerodynamic designs of railroad equipment,and calculating the optimal mix of power, weight,and speed for maximum fuel efficiency undervarious operating conditions. Other technologiesunder study for increasing fuel efficiency include
64Steven R. Ditmeyer, “A Railroad Command, Control, and Communications System for the 21st Century,” paper presented at the InternationalConference on Technology and Technology Exchange, New York, NY, June 30, 1989.
65Association of American Railroads, op. cit., foonote 47.

110 . Delivering the Goods: Public Works Technologies, Management, and Finance
Photo credit: Port of Long Beach
Double stack cars carry almost twice as manycontainers, but use only slightly more energy than a
conventional freight train.
alternative fuels, such as mixtures of diesel fueldistillate with lower grade fuels, and the burning ofcoal in diesel engines. Rail electrification is anotherenergy alternative, but the high initial cost ofconverting to electrification might be a barrier,considering the current cost and availability of dieselfuel.67
Data Management and Transfer—These arekey to efficient operations, and Amtrak has in placea management information system that serves therailroad well. (See chapter 5 for further details onsuch systems.) Freight railroads have found manybenefits in electronic data interchange, the electronictransmission of administrative data, such as trackingmaterials and supplies, revenue, car accountingrecords, and freight loss and damage claims. Freightrailroads plan to shift to electronic data exchangerather than paper, when cars are interchanged, andsome railroads already allow shippers direct accessto their information systems.
Federally Managed Infrastructure:Waterways and Airways
In the two transportation areas where the Federalrole in operations and maintenance is large-
Photo credit: Port of Long Beach
Many operations at the Intermodal Container TransferFacility in Long Beach, CA, are computerized for speed
and efficiency. Computers in the control tower are linkedwith those of ocean vessels, and the yard receives
information about each container before it reaches port.
waterways and airways-the infrastructure has gen-
erally been kept in good physical shape and providesconvenient transport except at periods of peakdemand. With proper maintenance and rehabilita-tion, locks and dams can remain operable indefi-nitely,
68 and safety requirements help ensure t he
reliability of air traffic facilities. When facilities,such as a major lock or a runway at a busy airport,must be removed from service for rehabilitation, theFederal managers work with all concerned parties todevelop ways to minimize delays.
Ports and Waterways
Historically, communities and industries devel-oped near ocean and riverfront ports, which handledraw materials or finished goods primarily for localconsumption or from local suppliers. Today, theUnited States has the world’s largest port69 system,with about 200 major ports, each handling at least250,000 tons of cargo annually or having channels
GyAss~~tion of Americ~_~s, “when It Comes to Fuel-Elllciency, Railroads Lead the Transportation Pae~” background Paper, SOp@&r1988.
6sU.S. ~y COWS of Engineers, XnStitut.e for Water Resoumes, “The U.S. Waterway Transportation System: A Review,” unpublished repo~ April1989, p. 24.
% this sectio~ “port” means land-baaed facilities as oppo,sed to offshore, midstream, or other nontraditional transfer locations for cargo orpassengers. Commercial ports are links in a transportation network serving passengers, freight, and bulk cargo, and do not include facilities used solelyfor recreation or fishing.

Chapter 3—Transportation Management and Technologies ● 111
deeper than 20 feet.70 Critical junctures in thenational transportation network, ports often combinetruck, rail, pipeline, barge, and ship operations fortransferring most of the 2 billion tons of cargomoving into or out of the United States every year.Less than 2 percent is handled directly by offshorefacilities and pipelines.
Fifteen percent of total U.S. freight ton-miles areproduced by commercial barges and tows carryingbulk commodities, such as petroleum, grain, andcoal, on the Nation’s shallow draft (less than 14 feet)inland and intracoastal waterway system.71 TheMississippi River, its tributaries, and connectingwaterways are the Nation’s major inland watertransportation network. (See figure 3-7 for a map ofthe inland waterway system.) Waterway transportoffers the lowest ton-mile costs to shippers.
After a decline during the recession in the earlypart of the decade, total waterborne commerce in theUnited States grew at about 3 percent per year duringthe 1980s. Continued growth at that rate would placeheavy demand on certain landside facilities,72 al-though adequate port capacity exists to meet U.S.commerce needs.73 The waterways can also handlemore freight shipments, and limited traffic demandmakes system expansion unlikely.
Management and Financing
Waterside facilities are constructed, maintained,and operated primarily by the Federal Government,through the U.S. Army Corps of Engineers (theCorps), which supports virtually all U.S. ports ofnational significance.74 The U.S. Coast Guard fur-nishes communication and navigation safety facili-ties. Until the late 1980s, virtually all navigationinfrastructure costs were paid out of the FederalGeneral Fund. Port project location and size wereestablished on a project specific basis, rather than aspart of a national system. Thus, the practical effectof many harbor deepening projects has been to
maintain competition among ports rather than tomeet transportation system needs.
To support economic development, the majorityof States with navigable waterways provide grantsfor construction of landside port facilities and watercargo terminals. Currently these grants, which totalabout $500 million annually, are administeredthrough State DOTS, economic development agen-cies, or State port authorities, which coordinate thepublic works components of major improvementprojects. Most States are reluctant to take overresponsibility for inland waterways from the FederalGovernment.
The largest ocean and freshwater port facilities areowned and managed by a municipality or public orquasi-public agencies, such as the Port of Seattle orthe Port Authority of New York and New Jersey.These ports consist of bulk facilities, often privatelyowned, and general cargo facilities, many of whichare leased to private operators.75 Inland waterwayterminals are usually privately owned.
Ports raise operating funds locally from user feesand capital from revenue bonds and State appropria-tions. Since 1986, port operators have been requiredto share dredging costs with the Corps, through an advalorem tax paid by shippers into the HarborMaintenance Trust Fund on all cargo loaded orunloaded at U.S. commercial harbors. Anon-Federalsponsor, often a local government or port authority,must share up to 60 percent of the costs ofconstructing new or deeper channels. The non-Federal sponsor must finance at least 50 percent ofthe maintenance dredging costs for new channelsdeeper than 45 feet.76 The tax, which finances aportion of harbor maintenance costs, was more thantripled in the 1990 budget agreement, from 4 centsper $100 of cargo to 12-1/2 cents per $100. Since trustfund outlays are limited to 40 percent of the totalFederal expenditures attributed to commercial navi-
W.S. Army Corps of Engineers, op. cit., footnote 68, p. 2.71UOS. ~y Corns Ofm=, ~ti~te for Water Reso~es, The 19881nland Waterway Review, IWR Report 88-R-7 @. Belvoir, VA: November
1988), p. 26.72u.s. kyCoqs of Iq@eers, Institute for WaterResources, “TheUZ$. Port and Harbor System: A Review,” unpublished repo~ September 1989,
d depends lmgely on cargo volume; deepwater harbor requirements are determined by ship size.p. 6. port deman731bid., p. 13.741bid., p. 5.75Jo~ ~ pi- C{pofi Dmelowent ~ tie ufit~ s~tes: s~~s, ~~es ~d ~~oo~” paper present~ at tie six~IIti ~tiolld Association
of Ports and Harbors World Ports Conference, Miami BeaclL FL, Apr. 22-28, 1989, p. 13.T%e Water Resowes Develo@nent Act of 1986 (I%blic hw 99-662).

112 . Delivering the Goods: Public Works Technologies, Management, and Finance

Chapter 3—Transportation Management and Technologies ● 113
gation in harbors, annual increases in surplus trustfunds are likely.
Because of the tax, users are funding graduallyincreasing portions of deepwater channel opera-tions, maintenance, and new construction. Requestsfor expansion projects are fewer and scaled backsince the cost-sharing requirements became effec-tive; the Corps estimates that project size has beenreduced by two-thirds from the levels initiallyrequested or authorized.77
Waterways-The Corps has modified all com-mercial waterways with locks, dams, bank protec-tion, and dredging to allow passage of 9-foot draftvessels. The number and size of lock chambersdetermine the maximum through speed for vesselson segments of the waterway. The Corps hasstandardized lock chamber sizes, and barges havebeen designed to make the most efficient use of thiscapacity.
Perhaps because the Federal Government hasalways supported maintenance for water-relatedfacilities, waterway maintenance costs have notcompounded as locks and dams have aged.78 Site-specific conditions, such as geology, climate, waterquality, and usage, affect maintenance and replace-ment needs more than age. Most locks have beenreplaced because traffic growth has overtaken theircapacity and long backups occur at peak periods, notbecause they have physically deteriorated.79
Barge operators pay a fuel tax that feeds the InlandWaterway Trust Fund (IWTF), which finances 50percent of construction costs, and applies on the11,000 or so miles80 of waterways that account forover 90 percent of inland waterborne commerce. TheInland Waterway Users Board, a federally estab-lished body that advises on waterway priorities, hasemphasized replacement projects on the Mississippiand Ohio systems and has specifically discouragedspending user fees for new waterways or rehabilita-tion. 81
Issues
With limited fiscal resources available to main-tain and physically expand the system, Federalinvestment decisions pose important questions forwater transportation. In addition, Federal environ-mental requirements for protecting wetlands havecreated difficult and costly construction anddredged-material disposal problems. Thus, fiscaland environmental issues frame the biggest chal-lenges for decisionmakers concerned about portsand waterways.
Fiscal Concerns-Congress has chosen to appro-priate more water-related project monies from theGeneral Fund than for any other transportationmode. Presently, 60 percent of harbor maintenancecosts and 100 percent of inland waterway operationsand maintenance expenses are paid for from theGeneral Fund. In addition, the General Fund pays forroughly 50 percent of all capital costs for bothwaterways and harbors. In comparison, less than 5percent of Federal highway expenditures come fromthe General Fund. In contrast to other publictransportation networks in the country, waterwayuser fees cover no operations or maintenance expen-ditures.
Projections of future IWTF revenues indicate thatthey will support approximately five lock and damreplacement projects per decade.82 Although sched-uled increases will raise the industry contribution,83
the annual fuel tax revenue is now less than 10percent of the total annual costs (for construction,operations, and maintenance) for the portion of theinland waterway system subject to the tax. Certainsegments of the inland and deepwater systemgenerate disproportionate costs relative to theamount of traffic carried (see tables 3-6 and 3-7).Traffic levels on the Tennessee-Tombigbee Water-way, completed in 1985, are far below the projec-
77~.s. ~y corps of Engineers, Op. Cit., foomote 729 p. 14.
76U.S. ~y COWS Of Engineers, op. cit., footnote 68, p. 24.
7?Ibid., p. 24.~@er 25,OOO miles of navigable waterways exist in the United S@@S.gl~d Waterway Users Board, “The Second Annual Report to the Secretary of the Army and the United States Congress,” unpublished report,
December 1988.82L. Gorge ~fle, ~ti~te for Water Reso~~es, U*SO by corps of Engin+rs, re~~ at “mging the hvestment fiomss fOr ~ ~t
Channels and Inland Waterways,’ the 1990 Transportation Research Board Annual Meeting, Washington DC, Jan. 9, 1990.gsCoWcssio~ Budget OffIce, op. cit., footnote 38, p. *3.

114 . Delivering the Goods: Public Works Technologies, Management, and Finance
Table 3-6-Traffic and Operations and Maintenance(O&M) Costs on Inland Waterways, 1986
O&M costs O&M costsTon-miles (millions of per ton-mile
Waterways (millions) dollars) (dollars)
123456
78
9
Upper Mississippi . . 12,871.9Middle Mississippi . . 17,504.7Lower Mississippi . . 100,058.3Illinois . . . . . . . . . . . . 8,505.9Ohio . . . . . . . . . . . . . 61,603.6Gulf Intracoastal
Waterway . . . . . . . 19,119.6Mobile . . . . . . . . . . . . 5,746.2Atlantic Intracoastal
Waterway . . . . . . . 367.1Columbia-Snake-
53.516.984.212.687.2
37.823.3
15.8
0.00420,00100.00080.00150.0014
0.00200.0041
0.0430
Willamette . . . . . . 1,228.2 9.0 0.0073Total . ..............227,005.6 340.2 0.0015NOTE: Segments of each waterway have a wider range of operations and
maintenance costs per ton-mile.SOURCE: U.S. Army Corps of Engineers, institute for Water Resources,
The 1988 /n/and Waterway Rewiew, iWR Report 88-R-7 (Ft.Beivoir, VA: November 1988).
tions used to justify its construction.84 These dis-crepancies raise a number of difficult equity andaccess issues.
Despite the importance of ports to local economicdevelopment, few cities have integrated transporta-tion systems that link ports to pipeline, rail, and truckservices. Paradoxically, a port’s success and itscontribution to the local economy increasinglydepend on its intermodal transfer capabilities ratherthan solely on the local demand for its watersideservices. 85
Environmental Concerns-Few U.S. channelsand harbors have natural depths greater than 20 feet,and ship dimensions set the demand for waterwaydepth. Bulk carriers and tankers often load to depthsof 50 feet, while freighters, including moderncontainerships, can normally use 40-foot deep chan-nels. However, no minimum standards have beenestablished for ship maneuverability to guide thosewho must decide how to modify channels. Thecreation of navigation channels and structures, suchas breakwaters and jetties, changes preexisting
Table 3-7-Federal Port Operations and MaintenanceOutlays per Ton of Cargo, 1974-84 (In 1985 dollars)
Ports Average Minimum Maximum
All ports . . . . . . . . . . . . . . 0.22 0.001 270.25”Large ports (more than
10 million tonsper year) . . . . . . . . . . . 0.17 0.001 0.99
Medium ports (100,000to 10 million tonsper year) . . . . . . . . . . . 0.50 0.001 23.30
Small ports (less than100,000 tonsper year . . . . . . . . . . . 11.68 0.050 270.25
aHi@ Owrations and maintenance (O&M) COStS uslJaiiY aP@Y to f~eral~maintained harbors with little commercial service. The benef.klaries areoften fishing veseeis and recreational users, neither of whom pay fees forO&M.
SOURCE: Congressional Budget Office calculations using data from U.S.Army Corps of Engineers.
currents and sedimentation. The design and siting ofchannels and their protective works are thus crucialfactors that determine dredging and maintenancerequirements and environmental effects.
In the past, dredged material was often placedwithin a mile of the dredging site, since transporta-tion to upland or ocean disposal sites added substan-tially to total costs. However, population growth incoastal areas and wetlands protection requirementsnow limit land disposal possibilities, and aboutone-third of dredged material is disposed of in theopen ocean.86 ‘‘The most prevalent single environ-mental issue facing ports in the U.S. is the properdisposal of dredged material, without which channelimprovements would simply come to a halt. ”87
Although only a fraction of harbor bottom sedimentsmeet the contamination criteria under which dis-posal in costly containment areas is required,88
gaining approval for dredging projects from a longlist of government and environmental groups cantake years. In some cases (Gary, Indiana, harbor, forexample), maintenance restrictions have causedwaterways to become shallower and narrower,severely limiting the types of vessels they canaccommodate.
‘Ibid., p. 87.8SU.S. ky COWS of Engineers, op. cit., footnote 68, P. 16.
S6U.S. con~~s, (lffke of ‘lkchnology Assessmen4 Wastes in Marine Environments, OTA-O-334 (’Washington DC: U.S. @Vernm~t prin~office, A@ 1987), p. 237,
STW s@Orn&~, p~Siden~~ericmASSW~tion of Port Authorities, quoted inJohn M. Pissni, PotiDeveZopmentin the UnitedStates.’ St@s, ZsSUesand Outlook, prepared for the Sixteenth International Association of Porta and Harbors World Ports Conference, Miami Beach FL, Apr. 22-28, 1989(’Iokyo, Japan: The Iaph Foundatio~ 1989), p. 27.
88u.S. Army Corps of -~~, Op. cit., footnote 72, p. 31.

Chapter 3—Transportation Management and Technologies ● 115
Photo credit: Us. Army Corps of Engineers
Maintenance technologies advanocs developed by theArmy Corps of Engineers’ laboratories have helped theCorps double the lives of many of the Nation’s dams.
The lengthy process from authorization to com-pletion for channel and harbor construction (whichaverages 22 years, according to the Marine Board)has weakened the effectiveness of port and water-way planning and design. In many cases, fleetdemand and market economies change drasticallybefore a channel can open for business, making thedesign inappropriate for current use.
Technologies
The Corps has research, development, and evalua-tion projects for maintenance, construction, andrehabilitation technologies and methods ongoing ateach of its laboratories and has established aneffective technology transfer system through itsmany offices. Addressing structural problems inlocks, dams, jetties, and breakwaters, setting priori-ties among competing needs, and determiningg whenand where modification is economically appropriateare all water system activities that can benefit fromrecent technology advances. Decisionmakin“ g toolscan help industry and government alike to operatemore efficiently.
Corps Technology Aids-Nondestructive evalu-ation technologies (examination methods used
where visual inspection is impractical) can givemanagers more extensive information about struc-tural conditions and maintenance and repair needs.Although visual inspections followed by core sam-pling are the most common ways for lock and damtechnicians to find structural problems, visibledefects are often indicative of a chronic problem thatis costly to repair. Sonar is used to find defects onunderwater surfaces and electromagnetic sensorsand pulse/echo ultrasound devices are used to probeinside solid structures. (See chapter 5 for furtherdetails.)
Models and simulations of the physical andeconomic characteristics are valuable tools through-out the life cycle of a system, and can aid inplanning, design, and making investment decisionsfor infrastructure. For example, techniques forobserving and modeling local circulation and sedi-mentation can help design engineers locate andorient piers, wharves, and other pile-supportedstructures, so that a structure does not cause acceler-ated shoaling.89 The Corps has good modelingcapabilities at the Waterways Experimental Station.(For further details see chapter 6.)
Two Corps’ programs to coordinate infrastruc-ture-related work at the laboratories and in theprivate sector are the Repair, Evaluation, Mainte-nance, and Rehabilitation Research Program and theConstruction Productivity Advancement ResearchProgram (see chapter 6). Field-tested projects in-clude in situ repair of deteriorated concrete, precastconcrete for lock wall rehabilitation, and roller-compacted concrete for dams. (See chapter 5 fordetails on these technologies.)
Structural Technologies-During icy winterconditions or prolonged drought, vessel operatorsmust carry lighter loads, use higher power (whichincreases operating costs), or find an alternativeroute. The natural channels of most inland riversvary with seasonal rainfalls, and controlled releasesby the Corps from water reservoirs help maintainsuitable river stages throughout the year. However,some dredging is necessary to clear silted andshoaling channels.
Dredging-Dredging’s two major componentsare extracting material and disposing of it. Extract-
gwatio~ReW~hCo~cil, Marine Board, Dredging CoastalPorts:An Assessment of thelssues (WaahingtoxL DC: National tid~ymss, 1985),p. 103.
%bid., p. 101.

116 . Delivering the Goods: Publ ic Works Technologies, Management, and Finance
Photo credit: U.S. Army Corps of Engineers
Although dredges are now more eff icient, environmental concerns about the proper disposal of dredged material have slowed
channel dredging projects
ing techniques and technologies have benefited from exponentially with height.94 The number and size ofautomation, sensing, and positioning advances (see lock chambers, fock filling and emptying rates, andchapter 5). The same dredging equipment is em- the types of tows and other vessels determine theployed generally for both maintenance and construc- traffic flow through a waterway. A typical lock cant i on .9 1
transfer vessels between pools in a 20- to 30-minute
Bank Protection--Articulated concrete slabs andoperation. Tows too large for a lock chamber mustbe split and the two groups of barges passed through
gravel prevent channel migration and permit selfdredging channel designs. Dikes and other structures
separately and then reassembled. Such double lock-
deflect or stabilize currents within a channel.92ages take about 11/2 hours.95
L o c k a n d Dam-S lackwa te r sys tems a re used The capacity of the lock system can be increasedwhere dredging, river embankments, and flow regu- by adding locks, rehabilitating structures, or replac-lation are insufficient for commercial navigation.93 ing existing locks with larger ones. Since funds forSeveral dams are usually required to make a long new construction are very limited, smaller, afforda-waterway navigable. The higher that dams are built, ble projects with immediate benefits must be consid-the fewer are necessary, but a dam’s cost increasesered. Alternative, lower cost, vessel lift technologies
93Open channels are generally less costly to construct and operate and support much greater traffic levels than lock and dam system94U.S. Army Corps of Engineers, op. cit., footnote 92, p. B-153.95Ibid,

Chapter 3—Transportation Management and Technologies . 117
and methods have been developed, but are noteconomically feasible for the locations analyzed bythe Corps.96 Lock-based tow haulage equipmentcould increase the capacity of some locks by 30percent by pulling unpowered barge cuts (fromdouble lockages) through the chamber.97
Other relatively minor structural improvementsinclude extended guidewalls to permit recombiningdouble lockage tows outside the chamber.98 Newcoupling equipment (fixed rigging and permanentwinches for tows and barges) to permit faster doublelockages and tow work is a cost-effective option forsmaller navigation locks.99 Structural changes thatmodify river currents, as well as protect locks fromtow collision damage, can improve lock approachesand allow tows to position more quickly and safelyfor lockages.
Traffic Management Options—Although nosafety reasons require Federal control of waterwaytraffic, the low cost and wide availability of commu-nications and surveillance technologies make sys-temwide traffic management a technical option.Scheduling access to congested facilities wouldallow better planning by industry and could reduceoperating costs, since vessels often operate atinefficient fuel consumption speeds (too fast) giventhat delay at the next lock is likely. Tow breakagedelays could be reduced by a “ready-to-serve”policy; vessel operators would need an extra tow-boat in each tow, or they could combine resourcesand station helper boats near each lock. Anothertraffic management option at locations with singlelocks is to give commercial traffic priority whentraffic is heavy. Recreational vessels could beallowed transit only at scheduled times or on aspace-available basis. Safety precautions prohibitmixed lockages of tows and recreational craft.
Locks operate more efficiently when trafficmoves in a single direction, because the next tow can
be positioned while the lock is cycled. For two-waytraffic, the next tow must remain a safe distanceaway and wait for the departing tow to clear thechamber and approach area. Orderly one-way opera-tion alternates a fixed number of lock cycles(commonly three to five) in each direction, increas-ing lock flow through by up to 15 percent over arandom first come-first served policy100 and reduc-ing average delays. This method is similar to trafficmanagement on one-lane bridges or during roadconstruction.
While total system capacity will not change withbetter traffic management and scheduling, industryoperating costs will be lower. Industry initiatives,such as new coupling equipment, system schedul-ing, and better fuel monitoring equipment,l0l canachieve substantial economic benefits.
Technologies for Industry Efficiency-Systemmonitoring and performance data, such as trafficmeasurement, are essential for decision analysis,leading a number of ports to setup electronic servicecenters. Shipping documents transmitted by com-puters route and track cargo, and release importfreight. The United Nations has developed ED-IFACT (Electronic Data Interchange for Admini“ “s-tration, Commerce and Transport) as a standard forthe current disparate computer/data managementsystems.
Other alternatives for economic marine transpor-tation are vessel operating changes, new forms andlocations for ports, and vessel design modifications.Short-term alternatives include some of the operat-ing practices already in use today-calling atshallow ports with less than a maximum load, timingmovements with tides (or other conditions), andmidstream cargo/fuel transfers. These measures aremore expensive for carriers than larger vesselsoperating fully loaded without delays for the tide orlightering. l02
9@J~l Bi,lbrou~ U.S. AMly Corps of m=, “Middle Columbia Rivez Study: Ship Lift Alternatives,” Transportation Research Circu&rNumber 350: Ports, waterways, Interm&l Termi&s, and International Trade Tramiportation Issues (WAingtoq DC: Transportation ResearchBoart my 1989), pp. 66-72.
~.S. Army Corps of Engineers, op. cit., footnote 68, p, 26.~-, ~~dge & C~P~ll, “Upper Mississippi River Transportation Economics Study: Final Repo@” study sponsored by the U.S.
Department of Agricultwe et al., April 1989, p. 25.%id., p. 3.:~.s. ~y CoWs of Engineers, op. cit., fOOtnOte 68> P“ 26”
IOl~Pr, c~~dge & Campbell op. cit., footnote 98.10~o ~rge~~e, chief, N~v@tionDivisioQ ~ti~te forWa~rR~o_, U.S. ~yco~s of -~,~o~ COIIIIUUldCtiO~ July 10,1990.

118 . Delivering the Goods: Public Works Technologies, Management, and Finance
Loading additional cargo or fuel after the vesselpasses restrictive channels is considered the mostcost-effective option,103 and at present coal collierscan load in midchannel below New Orleans, whiletankers can load and unload in the Gulf offshorefrom Louisiana.l04 Alternative vessel designs in-clude a proposed jumbo barge carrier three times thesize of the largest ship today. Cargo from the maincarrier would be offloaded to barges, which couldserve ports that would not need deep-draft channelsor large load center facilities.105
Building a large “island” offshore in 80 feet ofwater in the Delaware Bay has been proposed.However, the operational feasibility of such a majoroffshore terminal would depend on multi-Stateagreements and substantial new investment in land-side infrastructure, and its economic success woulddepend on diverting much of the traffic from otherports. The potential environmental impacts of con-struction and operation have already led to strongopposition. l06
Intermodal Advances—The major recentchanges in maritime-related, intermodal operationshave occurred in the private sector—in containersand technologies that support fast vessel turnaround,including ship design, cranes, truck chassis, doublestack railcars, and electronic information manage-ment. The Shipping Act of 1984, which permittedsingle bills of lading for intermodal cargoes, spurreddemand for these technologies. Containers eliminatethe handling of individual cargo, improving loadingand unloading efficiency and transfer to railcars ortruck chassis. New container vessels called “postpanamax” ships, because they are too large to passthrough the Panama Canal, carry up to one-thirdmore containers than the previous generation. Sincethese huge vessels have high operating expenses andare designed for transferring cargo efficiently, theymust use ports that can provide fast turnarounds ifthey are to operate economically.
Federal Infrastructure: Aviation
Air transportation is truly a national system in theUnited States; the effects of a thunderstorm in an airtraffic control (ATC) sector near Chicago or a closedrunway in Denver ripple across the country indelays, missed connections, and rerouted aircraft.Airlines and the military operate under a uniform setof Federal regulations and fly in a relatively central-ized public airspace and ATC system.107 Eachelement of the system—pilots, controllers, and otheraviation personnel, aircraft, and airports-mustmeet Federal safety standards and be certified by theFederal Aviation Administration (FAA). Airportsand airways are the public works portions of thesystem.
Management and Financing
Although the routes and airspace or airwayslinking airports are defined electronically and proce-durally, they are nonetheless public works. Thefederally operated ATC system, established princi-pally for flight safety, coordinates and directs allflights to and from U.S. airports, and comprises oneof the most complex transportation operations in theworld.
For ATC purposes, the airspace above the UnitedStates is partitioned according to airport locationsand the amount of traffic into three broad categories:terminal, en route, and oceanic airspace. Terminalairspace surrounds airports, and is characterized byaircraft changing speed, direction, and altitude, asthey maneuver after taking off or prior to landing.The airways connecting airports make up the enroute airspace, while oceanic airspace begins overinternational waters, with much of it lying beyondsight of land. Costs for the system, managed andoperated by FAA, are paid out of the Federal Airportand Airways Trust Fund and the General Fund.
The National Airspace System (NAS) P!an—First published in 1981, the NAS Plan is FAA'scomprehensive program for modernizing air trafficfacilities and equipment, and consists of more than90 separate projects. Relying on advances in auto-mation that are part of the NAS Plan, FAA expects
loqNatio~ Resm~ Counci~ op. cit., footnote 89, p. 5.
l~~fle, op. cit., fooinote 102.IOS~ta A. Heel, ‘‘me and Intermoda.1 Transportation: Issues and ~exlges, ’ TR News, No. 144, September-October 1989, pp. 15-19.lm~~e, op. cit., footnote 102.107~ere me ~ge S=torS of ~con~olled ~wme amoss tie Ufited s~t~, gene~ly below 12,000 f~t, often US~ by general aviation.

Chapter 3—Transportation Management and Technologies ● 119
Table 3-8-Passenger Enplanements at 25 U.S. Airports, 1988
Totalenplanements a Cumulative
Airport Rank (in thousands) Percentageb percentage
Chicago O’Hare . . . . . . . . . . . . . . 1 28,850 5.8 5.8Atlanta Hartsfield . . . . . . . . . . . . . 2 23,573 4.8 10.6Dallas-Fort Worth . . . . . . . . . . . . . 3 23,029 4.7 15.3Los Angeles International . . . . . . 4 22,179 4.5 19.8New York JFK . . . . . . . . . . . . . . . 5 19,415 3.9 23.7
Denver Stapleton . . . . . . . . . . . . . 6 15,015 3.0 26.7San Francisco International. . . . . 7 14,683 3.0 29.7Miami . . . . . . . . . . . . . . . . . . . . . . . 8 14,316 2.9 32.6Boston Logan . . . . . . . . . . . . . . . . 9 11,802 2.4 35.0New York LaGuardia . . . . . . . . . . 10 11,790 2.4 37.4Newark International.. . . . . . . . . . 11 11,580 2.3 39.7Honolulu International . . . . . . . . . 12 11,081 2.2 41.9St. Louis International . . . . . . . . . . 13 10,139 2.1 44.0Detroit Metro . . . . . . . . . . . . . . . . . 14 10,044 2.0 46.0Phoenix Sky Harbor . . . . . . . . . . . 15 9,559 1.9 47.9Pittsburgh International . . . . . . . . 16 8,971 1.8 49.7Minneapolis-St. Paul. . . . . . . . . . . 17 8,939 1.8 51.5Houston Intercontinental . . . . . . . 18 8,142 1.7 53.2Orlando . . . . . . . . . . . . . . . . . . . . . 19 8,122 1.6 54.8Washington National ., . . . . . . . . 20 7,888 1.6 56.4Philadelphia . . . . . . . . . . . . . . . . . . 21 7,789 1.6 58.0Seattle-Tacoma . . . . . . . . . . . . . . 22 7,659 1.6 59.6Las Vegas . . . . . . . . . . . . . . . . . . . 23 7,658 1.6 61.2Charlotte . . . . . . . . . . . . . . . . . . . . 24 7,613 1.5 62.7Baltimore. . . . . . . . . . . . . . . . . . . . 25 5,363 1.1 63.8alncludes US. certifi~t~ route air carriers, foreign flag carriers, supplemental, air commuter, and dr tmis.bBX~ on 493.8 million passenger enplanemeflk.%umulative percentage is a running sum: e.g., the top five airports have 23.7 percent of total U.S. enplanements.SOURCE: U.S. Department of Transportation, Federal Aviation Administration, EAAAvktiorI /%mcasfs:Fisca/ Years
1990-2001, FAA-AP090-1 (Washington, DC: March 1990).
to address current constraints due to controller Airports—Airports, most of which are not feder-workload, computer processing capacity, hazardous ally owned, provide landing and takeoff areas forweather detection, and communications. aircraft and facilities for transferring passengers and
When it was first presented to Congress, costs forthe NAS Plan were projected to be $9 billion over 8years, but adding new projects and changing existingones may raise total costs to $25 billion by the year2000. 108 Complexities of implementing technologychanges in a large operating system have caused themajor projects within the NAS Plan to fall behindtheir original schedules by 1 to 5 years.109 FAA alsomaintains a plan for research, development, andengineering to examine technologies outside theNAS Plan. ll0
cargo to other transportation modes. The large andsmall commercial airports, which offer cargo andpassenger airline service, are owned primarily bymunicipalities or special authorities and by 13States. A relative handful of these facilities handlemost commercial airline passengers—almost one-quarter of total passengers board flights at just fiveairports (see table 3-8). Of the over 17,000 air-po r t sl l l in the United States, most are public-usegeneral aviation (GA) airports owned by municipal-ities, counties, or private groups and used primarilyby personal and business aircraft.
lo13u.s. Gener~ Accounting Offke, Continued Zmprovernents Needed in FM’s Management of the NM Plan, GAO/RCED-89-7 ~~ato% ~:November 1988), p. 3.
l%id, p. 3.1l~.so ~~ent of Transportation, Federal Aviation ~“ “stratioq “Federal Aviation Adrmm“ “stration Plan for Research Engineering, and
Developmen~” vol. I, draft manuscript, September 1989.1lIu.s. Dep~ent of Transportation Federal Aviation ~“ “ tratioq FM Statistical Handbook ofAviationfor Calendar Year 1987 (Sprin@el~
VA: National ‘Ik&nical Information Service, 1987); included in the “airport” count are heliports and seaplane bases.

120 . Delivering the Goods: Public Works Technologies, Management, and Finance
The concentration of commercial passengers atmajor airports permits them to be largely self-supporting from landing fees, airline rents, andrevenues from parking and concessions. Manage-ment and oversight of groundside facilities differsdrastically from airport to airport. Airlines typicallylease terminals and gates112 from the airport opera-tor, obtaining exclusive-use rights, and the majorlessors often gain a strong voice in decisions onwhether and how to expand ground facilities. Underthe 1990 budget agreement, airports are permitted tolevy up to $3 per passenger charge, providing anewsource of revenue, for use solely on airport improve-ments.
Medium and small airports rely on Federal orState help in meeting their funding needs. Almost allStates have airport aid programs, usually targeted tosmaller, nonmetropolitan airports, and most main-tain statewide airport development plans. Fundscome from State aviationappropriations.
Issues
Land-use, financial, and
fuel taxes and general
environmental concernsframe many governmental decisions about aviation.System capacity has become a major issue. Becausetechnological advances allow capacity increaseswithout a decline in safety, airspace capacity islimited by Federal investment decisions and tech-nology. l13
Environmental Concerns—Aircraft noise is aserious problem for airport operators and airlines,leading to measures that permit Federal funds to beused to soundproof homes and schools, and in somecases, purchase real estate in high noise areas.Community groups fighting to restrict airport opera-tions because of noise concerns have limited airportdevelopment across the country.
While the intensity of sounds can be measuredprecisely, determiningg what constitutes objection-able noise is more subjective. Currently, individual
aircraft must meet FAA noise standards, based on a24-hour average of noise energy,114 commonlyreferred to as Stage 1, 2, and 3 rules.ll5 Whiledifferences in local conditions and jurisdictionalfactors have made establishing a more definitiveFederal standard for airport noise difficult, Stage 1aircraft are already banned, and all Stage 2 aircraftare prohibited after December 31, 2000.116 Neweraircraft must meet Stage 3 requirements, the strictestones.
In each successive jetliner generation, new tech-nology has lowered noise levels, but additionalreduction through technology may be limited, pos-ing contentious issues. For example, 50 percent ofthe noise from a Boeing 757 on landing approach isaerodynamically produced, a type of noise thatexperts believe cannot be reduced much more.Nonetheless, a working group of the InternationalCivil Aviation Organization (ICAO) is studying thefeasibility of Stage 4 noise limits.117
The 1990 deficit reduction agreement requiresthat the Secretary of Transportation establish, byJuly 1, 1991, a national noise policy that considersthe economic impact on air carriers and makesrecommendations related to aircraft noise to Con-gress for changes in State and local governmentauthority and other standards, procedures, and pro-grams. No airport will be allowed to restrict Stage 3aircraft operations without forfeiting all Federalaviation grants or the right to impose passengerfacility charges, unless the program was in placebefore October 1,1990, or the Secretary of Transpor-tation approves the restrictions.
The current level of aviation operations has asmall, but significant effect on air quality. In the LosAngeles basin, aircraft exhaust and fueling emis-sions contribute about 1 percent of the total volatileorganic compounds. FAA and EPA are addressingthese air quality issues by requiring that new jetengines reduce organic compounds emissions by 60to 90 percent. EPA is considering regulations
llz~~es sometimes le~e ground space and build their own facilities.llsB=d on ~wat~ ~~c ~~ntrol ~pmation s~~ds, ~~ us~le @~e above tie con~en~ Ufiti Stites could mOmlnO&W, theomticdy,
well over 1 million aircraft at once.IM14 CFR 150, app. A.11514 ~ 36.
~~eCongressiowl Record, Oct. 16, 1990, P. 12535.
llv~chml Zwokarte, project manager, Engineering, Federal Avtition ~“ “stratioq personal communicatio~ July 1989.118Nichol~ p. ~~ ~lce of Env~~e~t ~d ~ergy, F~m~ Aviation A-s@atioU persolld collllllllllkatioQ Jdy 31, 1990.

Chapter 3—Transportation Management and Technologies ● 121
Table 3-9-Congested Airport Rankings and Expansion Plans
Airport rank by total Ranked by Plannedhours of air carrier delay total air carrier construction that will
Airport (1987 rank) in 1987 operations in 1987 increase IFR capacity
Chicago O’Hare . . . . . . . . . . . . l a
2Atlanta Hartsfield. . . . . . . . . . . Sb
1 xDallas-Fort Worth . . . . . . . . . . 3 b
4 xLos Angeles International. . . . 4C
3Denver Stapleton . . . . . . . . . . 5 xNewark International. . . . . . . . 19San Francisco International. . 7d
6New York LaGuardia . . . . . . . 8d
21New York JFK . . . . . . . . . . . . . 9 d
26Boston Logan . . . . . . . . . . . . . 10d 10St. Louis Lambert . . . . . . . . . . 11d
11Miami International. . . . . . . . . 12d 22Phoenix Sky Harbor . . . . . . . . 13d 9Washington Dunes . . . . . . . . . 14d 28Detroit Metro . . . . . . . . . . . . . . 15d 12Philadelphia . . . . . . . . . . . . . . . 16d 13Washington National , . . . . . . 17d
25Minneapolis-St. Paul . . . . . . . . 18d 18Honolulu International . . . . . . 19d 16Pittsburgh International. . . . . . 2od 20Houston International . . . . . . . 2 ld
27 x
xx
KEY: IFR = instrument flight rules.a Total air carrier delay exeeeda 100,000 hours.b Total air earrierdeiay is between 75,000 and 100,000 hours.c Total air earner delay is between 50,000 and 75,000 hours.d Total air carrier delay is between 20,000 and 50,000 hours.SOURCE: U.S. Department of Transportation, Federal Aviation Administration, Airport Cqwufy Enhancement P/an,
DOT/FAA/CP189-4 (Washington, DC: May 1989).
requiring vapor recovery systems for aircraft fuel-ing. 118
Capacity—According to recent estimates, delayscost scheduled air carriers almost $2 billion in extraoperating expenses and passengers $3 billion in losttime, excluding commuter and general aviation data,which are not available.ll9 About two-thirds of alldelays are caused by bad weather-restricted visibil-ity, thunderstorms, or snow or ice on runways—which affects airports less than 10 percent of the timeon average. Too much traffic for airports and ATCto handle during normal conditions accounts forroughly 25 percent of delays, while pavementconstruction and ATC equipment problems eachaccount for less than 5 percent.120
Annual airline travel demand depends on thestrength of the economy and generally followstrends in the GNP. Current forecasts indicate thatincreasing numbers of U.S. and foreign airports willhave traffic demand exceeding their capacity forlonger periods of time each day. Average annualgrowth of 4.2 percent in passengers enplaned onU.S. airlines and 2.1 percent in total aircraft opera-tions is projected.121 The annual delay problems thatplague 25 commercial airports are shown in table3-9. If no capacity improvements are made, esti-mates are that by 1997,122 17 airports will be in thesame delay category as Chicago O’Hare, AtlantaHartsfield, and Los Angeles International aretoday. 123
Ilw.s. Department of Transportatio~ Federal Aviation Adrmms“ “ tratioWAirport Capacity EnhancementPlan, DOT~AA/CP/88-4 (Washingto@DC:April 1988), p. 1-11.
120u.s. Department of ‘rransportatio~ Federal Aviation Adnws“ “ trstio~Aiqort Capacity EnhancementPlan, DOT/FAA/CP/89-4 (WashingtoUDC:Mlly 1989), p. 1-10.
IZIU.S. Depanment of Trsnsportatio~ Federal Avi$tion ~“ “ trationj FM Aviation Forecasts, Fiscal Years 1990-2001, FM-APO ml(wao~ DC: March 1990), pp. 5,7.
l-ederal Aviation Administration op. cit., footnote 120, p. 2-1.l~~id., table 2-2, p. 2A.

122 ● Delivering the Goods: Public Works Technologies, Management, and Finance
Airline hub-and-spoke operations can place assevere a burden on ground capabilities as on theairside, and ground access to and from airportsdepends entirely on local planning and transporta-tion management. Moreover, no single agency ororganization is responsible for research or planningfor enhancing the capacity of ground facilities;FAA's authority over landside development andmanagement is limited.l24
Building more runways and airports, which wouldprovide the greatest increase in aviation systemcapacity, requires high capital investment, and moreimportant, overcoming community opposition basedon land use and noise and air pollution concerns.These are such difficult obstacles that just six of themost congested airports are planning new runways(see table 3-9 again).
Access and Equity Concerns—When trafficdemand exceeds runway capacity, as happens regu-larly during peak periods at busy airports, eachsingle occupant aircraft imposes roughly the sameamount of system delay as an airliner with 300passengers. However, smaller aircraft almost alwayspay much less in landing fees and Federal taxes forusing the system, a policy that embodies difficultand contentious equity and access issues. Majorairlines have altered schedules and purchased largeraircraft, so they can carry more passengers and cargounder these circumstances.in
Underutilized Airports-Modifying lightly usedairports close to busy facilities to make them moreattractive to commercial or GA users is generallymore feasible than new construction. FAA hassponsored reliever or satellite airport developmentfor GA traffic by earmarking funds especially fordeveloping and upgrading these airports,126 to reducedelays at nearby, busy, commercial airports byremoving the small, slow GA aircraft. However,reliever and other GA airports face some of the samenoise and competing land-use problems as commer-
cial airports. Furthermore, any policy to divert trafficalso diverts revenue from the major airport.
Restricting Airport Access-Restricting access,at least to certain runways, for small, low-performance aircraft is one way to increase runwayavailability for large jets. However, unless suitablealternative facilities, such as reliever airports, arefound for excluded aircraft, such a policy could beconsidered discriminatory and a restriction of inter-state commerce.l27 Moreover, while quotas and re-
estrictions may be acceptable temporary measures,actions to change basic underlying demand will alsobe necessary if capacity cannot be increased.
Quota systems for all aircraft are used at severalairports where demand exceeds physical or noise-related capacity regularly for much of the day. Fourmajor airports-Chicago O’Hare, La Guardia andJFK in New York, and Washington National-arecovered by FAA’s high-density rule, established in1973, which legally caps the number of flights thatcan be scheduled for these airports. Landing andtakeoff slot quotas are established for three userclasses: air carriers, commuters, and GA. While GAslots are distributed by call-in reservations, aircarrier and commuter slots are allocated by airlinescheduling committees, which are granted antitrustimmunity to negotiate the assignments. FAA re-serves the right to distribute the slots if negotiatorsfail to reach agreement.128 During good weather,high-density airports can usually handle aircraftwithout assigned slots.
Current quota systems favor incumbent airlines,since slots are granted based on prior use, acomplaint raised frequently by airlines formed afterderegulation and currently by airlines wishing toestablish a market at the four airports. Establishedcarriers counter that since they invested in the airportand its market over many years, they should be ableto keep their slots, now worth millions of dollarsapiece to the holders at several airports.
l~Transportation Research Board, MeaWring Airport tind.m”de Capacity, Special Report 215 (WashingtorL DC: NatioM R~~ch COWICfl, 1987),p. 57.
lzjAftervwy no c-e since 1983, com.merc~ aircraft seating capacity is projected to grow by three seats per ai.rcI@ on average, fiwch of thenext 12 years. From U.S. Department of Tr~or@tioU Federal Aviation A&rums“ “ tratio&Ffi Aviation Forecasts, Fiscal Years 1990-2001, FAA-APO9G1 (Washin@orL DC: March 1990), p. 53.
lzbu.s.con~ss, Ofliceof lkchnologyAs~ssmen~ AirportSy,rtenDeveZop?nent, OTA-STI-231 (WashingtorqDC: U.S. @v ernmentPrinting Office,August 1984), p. 110.
1zTIbid., p. 114.1281bid., p. 114.

Chapter 3—Transportation Management and Technologies . 123
Market Concerns-Market pricing of positionsat congested airports raises other access and equityissues. Selling (or leasing) airport landing slotsthrough the open market is viewed by many econo-mists as the most effective way to determine thevalue of airport access and allocate these scarceresources. l29 However, competition among airlinescould potentially be limited if slots are hoarded, andsmall aircraft could be effectively excluded from theairport.
The appropriate use of the proceeds from slottransactions is a contentious issue. Although airlineshave been allowed to treat slots as private goods, theslots are created and provided by public agencies,the airport proprietor, and FAA. A strong case can bemade that slot payments belong to the agenciesproviding the services and should be used for publicpurposes.
Differential/ Pricing-At present, ATC servicesand public airspace are available at no charge to allproperly equipped and operated aircraft. Access topublic airports, except where quotas are in effect, isgenerally open to anyone willing to pay the landingfee, usually less than 2 or 3 percent of the aircraft’soperating costs.130 Landing fees offset the capital,maintenance, and operating costs for runways andother airport facilities. Fees do not generally vary bytime of day and are typically based on aircraftweight, which is roughly related to required size offacilities and the amount of wear caused by theaircraft. However, most fees fail to reflect the coststo other users of delay and congestion, and provideno incentive to shift demand to nonpeak periods.
A few airport operators have tried to managedemand by raising landing fees, but small aircraftoperators and airlines alike have successfully chal-lenged landing fees in court as unreasonable anddiscriminatory. In 1986, the Port Authority of NewYork and New Jersey successfully instituted asurcharge of $100 for GA aircraft landing at its threemajor airports from 8:00 a.m. to 9:00 p.m., reducingtraffic by 30 percent for those times.131 The Massa-chusetts Port Authority, reallocated airport costsamong all users, charging higher landing fees for GA
Photo credit: Office of Technology Assessment
Taxis and private automobiles carry the vast majority ofpassengers to and from airports.
and lower ones for airlines. However, the feestructure was challenged as discriminatory, and wasoverturned by DOT (see box 3-I).
Passenger Surcharges-Direct passenger sur-charges for flights during peak periods will probablynot be passed on to the passengers affected unlessfares are regulated in some form, not a likelyprospect. Finally, passenger charges alone do littleto divert small aircraft or encourage large aircraftuse.
Transportation to Airports-Getting to andfrom the airport, which can represent a sizableportion of total trip time, depends on the capabilitiesof the regional transportation system surroundingthe airport and on the convenience of road circula-tion, the availability of parking, and mass transitaccess at the busiest airports. Because origins anddestinations are so scattered throughout urban areas,road vehicles, especially private automobiles andtaxis, carry over 90 percent of the passengers to andfrom most airports. Airport employees, who accountfor about one-third of all access trips, usually mustalso rely on automobiles. Many major airports havesignificant air pollution problems stemming primar-ily from automobiles and surface traffic congestion,although aircraft contribute as well.132The growth of
12~.s. COw~~, ~lce of ~~OIOm A~w~me~$ S@e skies for To~wowI: Aviation Safq in u co~etitive EnVirO~nt, OIA-SET-381(Washingto~ DC: U.S. Government Printing Gf13ce, JuIy 1988), p. 38.
l~~ce of mhnolog ASSeSsmen~ op. cit., footnote 126, p. 116.131JmEo Momm, $$~actic~ Me~~s for Shif@Gme~Av~tion Tfilc Fmm Commerce service~rts to RelieverAirpor@” Transportation
Research Record 1218 (WashingtoxL DC: Transportation Research Boar& 1989), p. 13.ls2David W. Davis, executive director, Massport, personal Co-UnicatioX4 MY 2, 1~.

124 ● Delivering the Goods: Public Works Technologies, Management, and Finance
Box 3-l—The Massachusetts Port Authority
On July 1, 1988, the Massachusetts Port Authority (Massport) implemented the first phase of its Program forAirport Capacity Efficiency (PACE), a plan to reduce delays at Logan International Airport by basing landing feesmore closely on the actual airport costs for accomrnodat.ing each aircraft. Fees rose for small aircraft (the previousminimum of $25 was increased to $91) and fell for the largest airliners. The fee changes caused general aviationflights to drop by one-third and improved Logan’s on-time performance ranking, established by the U.S.Department of Transportation (DOT) for the 30 busiest commercial airports, from roughly 21st to 2nd during thelast month of the PACE program.l However, small “aircraft owners2 filed complaints with the Federal AviationAdministration soon after the PACE plan was announced and on December 22, 1988, DOT ruled that the new feestructure was “. . . unreasonable and contrary to Federal statute. Faced with the loss of millions of dollars inFederal funds for airport improvements, Massport’s Board voted to return temporarily to the previous fee scheduleand to develop another, more acceptable, pricing method. Logan’s on-time performance ranking plummeted to 29thby April 1990.4
PACE landing fees had two components: a weight-based portion to cover runway construction, maintenance,and other costs that vary with aircraft size; and a charge to recover costs linked to each flight (such as lighting,emergency services, and snow plowing), which according to Massport, had been previously subsidized bycommercial airline passengers. A second phase of PACE, never implemented, proposed peak-hour pricing and slotsales to shift traffic away from high demand periods. DOT accepted the dual-omponent landing fee concept butdisagreed with some of the ways Massport divided the costs between the two components of the fee. For example,Massport divided the costs for maintaining crash, fire, and rescue (CFR) services among all landings regardless ofaircraft size, since all flights benefit. However, since the requirements for CFR capabilities are based on the sizeof the aircraft using an airport, DOT ruled that CFR costs should be assigned on a weight-based scale. Moreover,DOT endorsed peak-hour surcharges as an acceptable pricing option for landing fees,s Massport remains committedto winning DOT approval of a landing fee schedule that uses peak-hour pricing to improve airport capacity and isdeveloping alternatives.6
1David W. Davis, executive director, Massport, personnel communication, May 2, 1990.2National Business Aircraft Association, Regional Airline Association, and Aircraft Owners and Pilots Association.3U.S. Department of Tranaportation, Office of the Secrctary, “Investigation Into Massport’s Landing Fees,’ ‘ FAA Docket 13-88-2, Dec.
22, 1988.4Davis, op. cit., footnote 1.5U.S. Court of Appeals for the First Circuit, Massachusetts Port Authority v. U.S. Department of Transportation, “Brief of
Petitioner-Appellant, Massachusetts Port Authority,” No. 88-2227, Dec. 22, 1988.6Tom Champion, special assistant to the administrator, Massport, personal communication, Nov. 8, 1990.
the rental car industry reflects the lack of suitable York and Boston, where surface arteries are veryalternate forms of transportation from many airports.Procedural and management changes, such as park-ing restrictions combined with strict enforcementand segregating private autos, taxis, limousines, andbuses, are inexpensive and effective options.
About 25 percent of airport trips are to or from thecity center,133 so dedicated surface systems such asrail transit and remote terminals are essential toground access in major metropolitan areas. Waterferries and helicopters, available for a few large,urban airports, transport relatively few passengers,but are an important alternative in cities like New
congested.
Funding landside investments involves complex,multijurisdictiona1 arrangements that vary widelyfrom airport to airport. The capital improvementssponsored by FAA are limited to on-airport road-ways, guideways, and walkways, including bypasslanes, multiple termina1 entry and exit points, curbfrontage, remote park and ride facilities, and pedes-trian overpasses or underpasses. For projects toimprove ground access off the airport property,jurisdictions must seek FHWA and Urban MassTransportation Administration grants or find Stateand local funds.
133Office of TechnologyAssessment, op. cit., footnote 126, p. %.

Chapter 3—Transportation Management and Technologies ● 125
Technologies for Enhancing System Capacityand Performance
Airports can operate close to peak capacity mostof the time. Because airport physical expansionpossibilities are constrained and runways alreadyoperate close to technologically peak efficiency, thecritical long-term limit for air travel is likely to berunway capacity. Gains in runway performance willrequire systemwide air traffic management, such asmore efficient aircraft routing, spacing, and se-quencing within queues. Technology can contributeby reducing distances necessary for safe separationbetween aircraft, increasing controller productivity,and enabling flights to continue at the maximum ratein all but the most severe weather conditions.
Analytic tools can help air traffic decisionmakersmake rational system choices under such circums-tances. FAA already has some computer-basedmodels for quantifying the effects of changes inequipment, procedures, airspace configurations, anduser demand on system performance. For example,using its NASPAC simulation model, FAA foundthat the new airport now under construction inDenver should reduce airline delays nationwide by4 percent on a moderate winter day and 18 percenton a more snowy day.
134 Plans are under way for adynamic simulation laboratory to further FAA’ssystem analysis capability, and modeling and simu-lation technologies are being incorporated into theagency’s traffic management facilities.
Some of the options for increasing the capacity ofexisting airports and runways, their current limita-tions, and the role of technology are listed in table3-10. While capacity gains from any option can bequantified, they depend on too wide a range ofparameters and conditions l35 to detail in this re-port. 136 Making runway performance under instru-
ment flight rules (IFR) closer to visual flight rules(VFR) capabilities will have the greatest effect on
current delays, and requires technology to reduce thesafe spacing between aircraft. Increasing VFR ca-pacity requires reducing the time an aircraft occupiesa runway, overcoming wake vortex hazards, andmanaging arriving traffic to eliminate gaps.
Surveillance-One of the most promising near-term technologies for improving IFR capacity atairports upgrades the secondary surveillance systemto give faster radar data updates and larger andclearer controller displays. 137 These radar systems,not a part of the NAS Plan, will permit increasedoperations on parallel and converging runways.Different systems are currently being tested atMemphis and Raleigh-Durham airports.
Civilian surveillance radars require clear lines-of-sight to monitor traffic. Over oceans or remote areas,or at low altitudes where radar coverage is notpractical, satellite technologies are available. Themost promising satellite surveillance application isdependent surveillance, under which aircraft-basedequipment determines position and relays informa-tion via satellite to a ground-based ATC facility.Automatic dependent surveillance (ADS) relies onnew applications of established communicationsand navigation technologies and will likely be usedfirst on the busiest ocean routes. Currently, control-lers track oceanic flights through position reportsfrom pilots derived from onboard navigation instru-ments and relayed by high frequency radio. Onceestablished, ADS will allow closer spacing ofoceanic flights, but no satellites yet operate in theaeronautical mobile band, which an operationalADS system must use. ICAO technical standards arestall in the process of being developed, and FAA hasnot yet established an implementation plan or policyfor ADS.138 FAA is investigating advanced satellitetechnologies that could have applications for ATC,but the potential reliability of ADS makes thecost-effectiveness of the more expensive independ-ent satellite systems questionable. l39
134The Mitre Corp., “Analysis of National Delays and Throughput Impacts of a New Denver Airport,” unpublished documen~ April 1990.135Airportcapacity depends onhow operations are split betwcxmdepartures andarrivalsandamong the mix of aircxafttypes.Furthermore,lFR capacity
is critically dependent on runway contlg-uration. For example, only one runway can be used during IFR at airports with parallel runways that are lessthan 2,500 feet apart.
136A de~i.1~ qwti~tive discussion of ah-field capacity gains resulting from potential operational improvements is presented in John E. tibro~Estimates of Potential Increases in Airport Capacity Through ATC System Improvements in the Airport and Terminal Areas, FM-DL5-87-1(Washingto~ DC: U.S. Department of Transportation, Federal Aviation Administration, October 1987).
lsTKen Byr~ project m~~er, Parallel and Converging Runway Monitoring, Federid Aviation ~1989.
“ “stratioq personnel communicatio~ Dec. 1,
lsBzWok~e, op. cit., footnote 117.
Isgclyde hliller, Rese~h and Development Servim, Federal Aviation ~“ ‘ tration, personal communication Sept. 11, 1990.

126 . Delivering the Goods: Public Works Technologies, Management, and Finance
Table 3-10-Enhancing the Performance of Existing Airports and Airways
Potential enhancement Goals Current limitations Potential technological options
Increase the maximum takeoffand landing rate possible fora runway.
Increase the maximum takeoffand landing rate possible forairports with multiple run-ways.
Increase the average takeoffand landing rate of a runwayor airport.
Reduce the time an aircraft occu-pies a runway.
Reduce wake vortex hazards,allowing closer in-trail aircraftspacing.
Reduce collision avoidance andwake vortex hazards, allow-ing closer aircraft spacing.
Reduce runway downtime.
Reduce enroute airspace-related delays.
Reduce collision avoidance andwake vortex hazards, allow-ing closer aircraft spacing,dose the IFR/VFR capacitygap.
Reduce time-wasting gaps inarrival stream.
Reduce delays due to inaccu-rate/lmpredse weather infor-mation.
No more than one aircraft al-lowed on a runway at a time.
Fast, moving, heavy aircraft takemore time to slowdown thansmaller planes.
Vortices are intrinsically linked toaerodynamic lift and cannotbe eliminated.
Vortices are usually invisible.Aircraft size difference is a large
factor in vortex hazards.
Ground- and airborne-basedsurveillance, communica-tion, and human reactiontime are presently insufficientto safely separate aircraft atthe distances necessary forsome parallel runways.
Necessary periodic mainte-nance.
Snow and ice removal.
Human capability to process andtransfer information.
Oceanic ATC capability farbelow domestic level.
ATC radar and cockpit instru-ments are not as capable ashuman vision.
Difficult for controllers to positionand sequence aircraft at opti-mal times for runway ap-proaches, especially if trafficis mixed among aircraft withdiffering sizes and speeds.
Safety margins must be keptlarge for dangerous thunder-storms and windshear, re-sulting in delays.
High speed exits from runways.
Improve aircraft decelerationcapabilities.
Make wake vortices visible topilots; reduce the strength ofthe vortices.
Improve surveillance, guidance,communication, and automa-tion.
Longer lasting materials; analyti-cal and management tools(e.g., nondestructive evalua-tion).
Snow and ice sensors; selectedpavement additives.
Automation, surveillance.
Better surveillance, communica-tions, and navigation.
Surveillance, navigation, guid-ance.
Improved strategic and tacticalmanagement technologiesfor air traffic.
More accurate weather predic-tion and detection; betterinformation transfer to con-trollers and fright crews.
KEY: ATC = air traffic control; IFR = instrument flight rulse; VFR = visual flight rules.SOURCE: Offioe of T~hnology Asessment, 1991.
Navigation and Guidance-Long-range radio- stations to allow complete coverage across thenavigation systems, LORAN and OMEGA (see continental United States.l40 Combined with anchapter 5), permit navigation in remote locations. As ADS link, LORAN or OMEGA could permitpart of the NAS Plan, FAA is providing funds to the enhanced low-altitude and remote-site traffic con-Coast Guard to install four additional LORAN trol.141
140u.s. Dep~ent of ‘rranaportatio~ Federal Aviation ~“ “ tratiow National Airspace System Plan: Facilities, Equipment, AssociatedDevelopment and Other Capital Needs (Waahingtoq DC: September 1989), p. IV-58.
141u.s. Department of Transportation, Federal Aviation ~“ “stratio% “Federal Aviation Administration Plan for Research Engineering, andDevelopment” vol. n draft manuscript, September 1989, p. 258.

Chapter 3—Transportation Management and Technologies ● 127
Satellite-based systems offer the greatest poten-tial for aviation navigation enhancement. INMAR-SAT, an international consortium that operates aglobal satellite system for maritime mobile commu-nications, plans to deploy the first satellite designedto provide civilian aeronautical service. The Depart-ment of Defense (DoD) Global Positioning System,which will provide civilian aircraft with locationdata accurate within 500 feet, is expected to beavailable for worldwide navigation in late 1993.FAA studied the integration of GPS with LORAN ina single cockpit device and determined that thiscombination may be suitable as a sole means ofnavigation, and is currently evaluating avionics.142
The NAS Plan includes replacing current instru-ment landing systems (ILS), which provide courseand glideslope guidance for landing aircraft, withmicrowave landing systems (MLS). MLS allowcurved approaches, not possible with ILS, andpotential capacity gains in locations where presentrunway approaches and departures conflict. Al-though the program has been besieged with contro-versy and is behind schedule, FAA must complywith ICAO plans to install MLS as the landing aidat international airports by 1998.
Weather Detection and Prediction-Avoidinghazardous weather-windshear,143 severe turbu-lence, lightning, inflight icing, or hail-is especiallyimportant in terminal areas, where aircraft are closeto the ground. Existing radars are able to identifyareas of heavy precipitation, often indicative ofdangerous flying conditions; however, these radarscannot see clear air turbulence or windshear. Ad-vanced weather radar systems that can measurewinds and other automated weather observing sys-tems are being deployed as part of the NAS Plan.Next generation weather radars, funded jointly byDoD, the National Weather Service (NWS), andFAA, will replace existing NWS radars. Becausethere are no meteorologists at some FAA facilities,the terminal weather radar will employ expertsystems to present weather information (such as
automatically identifying microbursts) in a usableform directly to controllers.l44
Communication-Federal aviation communi-cations systems transmit ATC and weather informa-tion through voice and digital messages over one-way and two-way radio, landline wire, and fiberoptic links. Two communications developments thatcould support increased airspace capacity are datalink and satellite relay for aircraft. The NAS Plancalls for Mode S digital links to transmit many of theATC and weather messages sent over voice chan-nels, and to provide new functions such as real-timegraphic display of weather and ATC instructionrelay and conflation. Digital communications willnot replace the current air-ground voice links as theprimary system for real-time ATC and weatherinformation until at least late in the decade.
Successful tests using existing satellites for com-munications have prompted at least five airlines toorder airborne systems for their new aircraft.145
ICAO’s Future Air Navigation Systems Committeehas stated that”. . . satellite-based communications,navigation, and surveillance will be the key toworldwide improvements. ’ ‘146
Automation and System Management—Computers are used extensively throughout the ATCsystem to process flight plans, correlate and displayradar returns, and alert controllers to hazardoustraffic situations. All traffic control decisions arenow made by controllers. However, systems cur-rently being developed will be capable of computingoptimal flight paths in real time and relayinginstructions directly to cockpits.
ATC Computers-Computers process primaryand secondary radar returns, track targets, andprovide appropriate data for each aircraft. FAA’sCentral Flow Control Facility (CFCF) already man-ages IFR traffic on a national scale. Flight planinformation and live radar data from 20 en routecenters are relayed to CFCF, where an aircraftsituation display presents national traffic data andanalyses, updated every 3 minutes, for any portion of
14~id., p. 256.ldsw~dtiis ac~e, u~ysudde~ i.nwindvelocity across anaimraft’spath. The most dangerous form of windsheaxis them.icroburs~ ar@dly
descending column of air that maybe impossible for some aircraft to escape horn when flying close to the ground.l~~ce & I&hnolo= Assessment op. cit., footnote 129, p. 158.
14s’’Tbsts Demonstrate Potential Benefits of Satellites in Air-Ground Communications,” Aviation Week & Space Technology, vol. 130, No. 2, July10, 1989, p. 57.
146’’ICAO’S ‘Ibrn-of-Century Plan Complet~” Interavia, August 1988, p. 749.

128 . Delivering the Goods: Public Works Technologies, Management, and Finance
the continental United States. The system automati-cally alerts the traffic manager when capacity isinsufficient. Under the NAS Plan and R&D pro-grams, FAA is working toward using real-timecomputer analyses to manage runway and airspaceconfigurations and to issue traffic clearances foroptimal traffic flows.
The centerpiece of the NAS Plan is the AdvancedAutomation System (AAS), a $5 billion project toreplace and consolidate computer hardware, soft-ware, and workstations at airport tower, terminal,and en route ATC facilities. FAA expects bettersafety, greater system capacity, and lower opera-tional costs, due in large part to new and expandedautomated functions. Among the most important ofthese new capabilities is automated en route airtraffic control (AERA).
AERA, to be implemented in three phases, willpredict and resolve traffic conflicts in four dimens-ions and permit more fuel-efficient and direct flightpaths. FAA plans to install the first phase in 1997.The objective for AERA 3, on program completion,is automatic monitoring and control of traffic, andremoval of the capacity limitations of the currentsystems to permit controllers to manage airspaceregions much larger than present ATC sectors.147
Many aviation safety experts view increased use ofautomation with ambivalence. While automatedsystems increase efficiency and safety in some areas,they require monitoring and accurate data entry. Therole of the human in this increasingly automatedenvironment is a critical issue that needs to bestudied extensively to establish bases for settingstandards. 148
Technologies for Enhancing Groundside Ca-pacity—An airport’s groundside 149 components—aircraft parking aprons and gates, airport terminals,
and surface transportation links-are importantfactors in total trip time for passengers and cargo.Limitations in groundside capabilities can alsorestrict air service growth.
The number of passengers and the amount ofcargo that pass through an airport are the mostcommon economic indicators applied to measuringairport capacity. However, airport operators alsomust include employees, visitors, and service andground access vehicles in their calculations, andanalytic techniques and data for measuring ground-side capacity are less developed than methods forassessing airside capacity.150
Gates and Aprons-Airport gates and aprons arethe areas where aircraft receive fuel, maintenance,and other servicing. Although fewer gates would berequired if airlines shared them, most gates arecontrolled by individual airlines. Competition be-tween airlines and widely spread facilities at thebusiest airports limit the feasibility of jointly usinggates. If airport operators had more control overgates, more efficient use would be possible,151
allowing faster aircraft turnaround and expandingthe parking spaces and terminal access available foraircraft.152 Apron geometry and level of demand alsoaffect aircraft access to gates, and for the nextgeneration B-777, Boeing plans to use folding wingsin the design to avoid gate restrictions.
Security Technology and Procedures—Todeter aircraft hijacking and sabotage, FAA requiresairlines to screen passengers, carry-on articles, andin some cases, checked baggage, and airport opera-tors to control access to the airfield and aircraft.Technology permits much faster processing thanmanual searches alone would allow, and relativelyfew significant delays due to screening occurcurrently in the United States.
147Federal Aviation A&rums“ “ tratiom op. cit., footnote 140, p. III-38; and Federal Aviation Admmt“ “stratiom op. cit., footnote 141, pp. 63-64,ldg~ce of RXhUOIOgy hwmmn~ op. cit., footnote 129, p. 125.ld9The~~@~~= “bide” ~ “gro~dside” is somewhat arbitrary. The Federal AviationA&mm“ “strationincludes aircmftgatesandparking
areas in the airside category, as aircmft in these areas are still subject to air traftic control rules and regulations. In this repom however, airsideinfrastructumare those components whose performan ceaffects airport and airspace capacity. Each gate andparkingspace is usually controlled by a singleairline, and one airline’s gate performance generally does not affect other users of the airport. Exceptions are when airlines share gates or gate backupsrestrict other taxiing aimraft.
An alternate deftition of the groundside is the fmiliti~ and pd~es involved in the p~smger’s or cargo shipment’s journey from the originatingpoint to the “amraft, aircraft-to-aircraft transfers, and from the aircraft to the final destination. (Note: once on board the aircm the passenger or cargois in the airside).
l~atio~ Re-h comc~ Trq~tion ~=ch Bo@ ~eaSw”ng A@orf~~”& cap~c@, s~~ Report 215 (wmhhgto~ D(!: 1987),p. v.
lslDavid W. Davis, ex~utive director, h4asspoK unpublished remarks, OIX Advisory p~el meeting, Apr. 18, 1~.lszRefers to passenger or cargo trip-time ludess OthetiSe smtti.
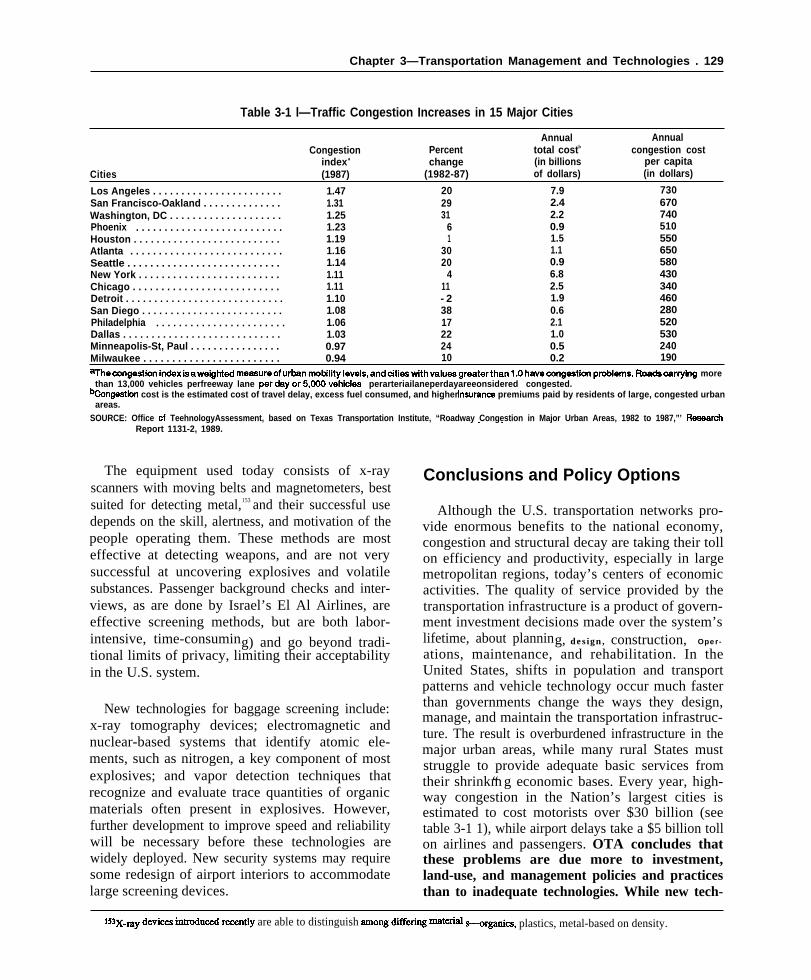
Chapter 3—Transportation Management and Technologies . 129
Table 3-1 l—Traffic Congestion Increases in 15 Major Cities
Annual AnnualCongestion Percent total costb congestion cost
index a change (in billions per capitaCities (1987) (1982-87) of dollars) (in dollars)
Los Angeles . . . . . . . . . . . . . . . . . . . . . . . 1.47 20 7.9 730San Francisco-Oakland . . . . . . . . . . . . . . 1.31 29 2.4 670Washington, DC . . . . . . . . . . . . . . . . . . . . 1.25 31 2.2 740Phoenix . . . . . . . . . . . . . . . . . . . . . . . . . . 1.23 6 0.9 510Houston . . . . . . . . . . . . . . . . . . . . . . . . . . 1.19 1 1.5 550Atlanta . . . . . . . . . . . . . . . . . . . . . . . . . . . 1.16 30 1.1 650Seattle . . . . . . . . . . . . . . . . . . . . . . . . . . . 1.14 20 0.9 580New York . . . . . . . . . . . . . . . . . . . . . . . . . 1.11 4 6.8 430Chicago . . . . . . . . . . . . . . . . . . . . . . . . . . 1.11 11 2.5 340Detroit . . . . . . . . . . . . . . . . . . . . . . . . . . . . 1.10 - 2 1.9 460San Diego . . . . . . . . . . . . . . . . . . . . . . . . . 1.08 38 0.6 280Philadelphia . . . . . . . . . . . . . . . . . . . . . . . 1.06 17 2.1 520Dallas . . . . . . . . . . . . . . . . . . . . . . . . . . . . 1.03 22 1.0 530Minneapolis-St, Paul . . . . . . . . . . . . . . . . 0.97 24 0.5 240Milwaukee . . . . . . . . . . . . . . . . . . . . . . . . 0.94 10 0.2 190~hecongestionindexisaweighted me~ureofurhnmtitityleveis,anddti~tithvalu~greaterthan l.Ohaveeongestionpmblems.Roadsearrying more
than 13,000 vehicles perfreeway lane perdayor5,000vehicles perarteriailaneperdayareeonsidered congested.~ngestion cost is the estimated cost of travel delay, excess fuel consumed, and higher insuranm premiums paid by residents of large, congested urban
areas.SOURCE: Office cf TeehnologyAssessment, based on Texas Transportation Institute, “Roadway Congestion in Major Urban Areas, 1982 to 1987,”’ Researeh
Report 1131-2, 1989.
The equipment used today consists of x-rayscanners with moving belts and magnetometers, bestsuited for detecting metal,153 and their successful usedepends on the skill, alertness, and motivation of thepeople operating them. These methods are mosteffective at detecting weapons, and are not verysuccessful at uncovering explosives and volatilesubstances. Passenger background checks and inter-views, as are done by Israel’s El Al Airlines, areeffective screening methods, but are both labor-intensive, time-consuming) and go beyond tradi-tional limits of privacy, limiting their acceptabilityin the U.S. system.
New technologies for baggage screening include:x-ray tomography devices; electromagnetic andnuclear-based systems that identify atomic ele-ments, such as nitrogen, a key component of mostexplosives; and vapor detection techniques thatrecognize and evaluate trace quantities of organicmaterials often present in explosives. However,further development to improve speed and reliabilitywill be necessary before these technologies arewidely deployed. New security systems may requiresome redesign of airport interiors to accommodatelarge screening devices.
. .
Conclusions and Policy Options
Although the U.S. transportation networks pro-vide enormous benefits to the national economy,congestion and structural decay are taking their tollon efficiency and productivity, especially in largemetropolitan regions, today’s centers of economicactivities. The quality of service provided by thetransportation infrastructure is a product of govern-ment investment decisions made over the system’slifetime, about planning, design, construction, Oper-
ations, maintenance, and rehabilitation. In theUnited States, shifts in population and transportpatterns and vehicle technology occur much fasterthan governments change the ways they design,manage, and maintain the transportation infrastruc-ture. The result is overburdened infrastructure in themajor urban areas, while many rural States muststruggle to provide adequate basic services fromtheir shrinkm“ g economic bases. Every year, high-way congestion in the Nation’s largest cities isestimated to cost motorists over $30 billion (seetable 3-1 1), while airport delays take a $5 billion tollon airlines and passengers. OTA concludes thatthese problems are due more to investment,land-use, and management policies and practicesthan to inadequate technologies. While new tech-
153x-~y &viC~ inMUWCI nxxmtly are able to distinguish among diffem ~~ri~ s-organics, plastics, metal-based on density.

130 ● Delivering the Goods: Public Works Technologies, Management, and Finance
nologies can help improve infrastructure conditionand smooth traffic flows in congested areas, theFederal Government must change its infrastruc-ture investment policies and address systemmanagement issues, if the most pressing trans-portation problems are to be resolved.
Financing and Investment
Federal fiscal policies-General Fund subsidies,grant matching requirements, trust fund spendingtargets, and revenue raising options-vary for eachtransportation mode. These policies do not alwayslead to economical system investment and manage-ment and have created substantially different infra-structure problems for each mode.
Surface Transportation
Aviation and port and waterway infrastructure(where the Federal Government plays major invest-ment and management roles in operations andmaintenance, and the rights-of-way—air andwater—require structural systems only indirectly) isin quite good physical condition. Although delaysoccur, most are amenable to management andtechnical solutions. In contrast, the Federal Govern-ment has always been an important, but minority,investment partner only in surface transportationinfrastructure-roads, bridges, mass transit, andrailroads-leaving management and operations tothe State, local, and private owners. Federal surfacetransportation funding policies have favored capitalinvestments, without a corresponding commitmentto operations and maintenance. The result is thatState and local government owners of the far-flungroad system have cut back and deferred maintenanceand rehabilitation. Most simply have not invested inbasic operational improvements, such as advancedtraffic signal systems. Private owners, primarilyrailroads, also neglected maintenance, especially onlightly used track sections, abandoning or sellingbranch lines as soon as they were able.
Changing Federal fiscal policies for surfacetransportation to allow Federal trust fund moniesto be used throughout the infrastructure life cycleand for operations and maintenance is the toppriority. Such spending discretion is of criticalimportance for rural or other economically con-strained areas facing unaffordable infrastructuremaintenance and rehabilitation needs. In someregions, local transportation grants may best be usedfor noncapital investments, such as maintenance
management systems, employee training, or ad-vanced traffic control equipment.
State matching requirements range from 10 per-cent for Interstate construction to 25 percent forprimary and secondary programs. However, a pri-mary road in poor condition can create a trafficbottleneck that has a major impact on a connectingInterstate, making rehabilitation of the primaryartery crucial to smooth interstate travel. Congresscould consider equalizing State matching re-quirements for all highway grants so that deci-sions about spending priorities reflect regionalpriorities, rather than projects tailored to fitgrant categories. Expanding State and local optionsfor raising revenue, such as tolls, on facilities builtwith Federal funds is crucial as well, to help leverageand stretch Federal dollars.
Increased flexibility in the use of Federalhighway and transit grant funds-the ability totransfer or combine them—would also helptransportation system productivity. Examples in-clude railroad improvements (for Amtrak, too, sinceover 40 percent of Amtrak passengers travel ontrains under contract to jurisdictions), park-and-ridefacilities, HOV lanes, and preferential treatment fortransit or other high-occupancy vehicles. A fundingprogram for surface transportation condition im-provement, which would include passenger rail,mass transit, roads, and bridges, might be such amechanism. Similarly, a program for surface trans-portation capacity expansion should include newcommuter rail and bus systems, new busways, newlanes, including HOV facilities, and expansion toexisting systems and facilities.
Market Pricing
Traffic congestion creates additional operatingand maintenance expenses for vehicles and infra-structure, and delay costs for users. Since the pricepaid for using the transportation system is oftenbelow real costs, the demand for frequent transportservice to many destinations encourages large fleetsof small vehicles to clog the infrastructure. Theaverage passenger and cargo capacity of vehicles isa key factor in efficient system flow. Industry useslarge vehicles—widebody jets, long, double trailertrucks, double stack trains, jumbo barges, and newcontainerships-when economics favor them andregulations allow them. User pricing policies(peak-hour tolls) that reflect vehicle costs to thesystem could favor higher capacity operations,

Chapter 3—Transportation Management and Technologies . 131
Table 3-12—Federal Expenditures and User-Fee Revenue for Transportation, 1989
Federal Federal Dedicated revenueexpenditures user-fee revenuesa as percent of
Transport mode (in millions of dollars) (in millions of dollars) expenditures
Highway . . . . . . . . . . . . . . . . . 13,898b 14,270 102Transit . . . . . . . . . . . . . . . . . . . 3,595’ 1 ,357d 37Rail . . . . . . . . . . . . . . . . . . . . . . 594’ — —Aviation . . . . . . . . . . . . . . . . . . 5,748f 3,664 63Ports and waterways . . . . . . . 1,436g 223 h
16a ~es not include interest received on trust fund balances.b ln~~es funds outlay~ for the Federal Highway Administration, the National Highway Transportation *fety
Administration, the Forest 8ervice for forest roads and trails, and the Bureau of Indian Affairs for roadconstruction.
c lnd~es capital and operating grants and limited research and development (R&D) spending.d Revenue SoUrm is 1 cent per gallon from motor fuel t= (19W).e Amtrak funding and limited Federal R&D SpSIlding.f Does n~ indu~ e~penditure~ for National Aemnauti~ and Sp=e Administration, National Transportation
Safety Board, or Department of Transportation Office of the Secretary.9 Army Corps of Engin~rso@laysforharbors watenvays. Doss not include Maritime Administration, Coast Guard,
or Panama Canal Company outlays.h lnd~es [nla~ Watemay Tmst Fund, Harbor Maintena~e Tmst Fund, and St. Lawrence 8eaway Tolk.
SOURCE: U.S. Department of Transmutation, Federa/ Trsmmortation /%anua/ Statistics. f7sca/ Years 1979-1989(Washirigton, DC: May 1990).
such as car pooling and mass transit, and possiblylower total energy use and environmental dam-age. They could also lower life-cycle costs bymatching system characteristics and long-term usepatterns. For example, a highway policy basing userfees on the pavement wear imposed by commonlyused vehicles (truck axle weights, for example) andusing the increased revenue to pay for thicker, moredurable pavements could lower long-term totalhighway costs.
Strict market pricing policies raise issues relatedto ability to pay and discrimination against certainclasses of transportation users. OTA concludes thatpricing decisions for demand management mayrequire Federal oversight to ensure affordabletransportation options to all users. A share of therevenues generated by those willing and able to payfor premium service could fund alternative transpor-tation systems for other users.
General Fund Subsidies
Tying user charges to system expenditures, espe-cially for operations and maintenance, can encour-age realistic infrastructure decisions and provide along-term revenue stream for system management.While social benefits such as defense, environ-mental protection, and economic development jus-t@ General Fund support for transportation infra-structure, these tax monies currently subsidize eachmode to different degrees (see table 3-12). On boththe inland waterways and deepwater channels, theGeneral Fund now pays roughly 50 percent of capital
costs, a reasonable amount given the multiplepurposes these structures serve, and a markedreduction from historic levels. However, watershippers and operators still pay only a minor share ofoperations and maintenance costs, in sharp contrastto other transportation modes, where users pay mostof these costs. OTA concludes that this preferen-tial treatment for port and waterway users isdifficult to justify and that it is time for anotherlook at investment and cost allocation policies fortransportation infrastructure. One option is toequalize General Fund subsidies among trans-portation modes over a 5- to 10-year period.Another is eliminating the subsidies entirely,using trust fund revenues for Federal programsand looking to new revenue sources, such ashigher State and local grant matching require-ments.
Whatever the choice, if General Fund subsidiesfor transportation are reduced, and budget con-straints prevent using trust fund balances, user feesand non-Federal funding must make up the differ-ence, or existing public networks will have to scaleback. With the exception of the inland waterwayoperators, most transport sectors would be capableof generating sufficient revenues to remain atpresent capacity. Congress could consider a long-term, gradual disinvestment of commerciallyunproductive waterways, unless regional govern-ments and recreational users are willing to meetsubstantially more of the costs. For example,hydroelectric power, drinking water, and recrea-

132 ● Delivering the Goods: Public Works Technologies, Management, and Finance
tional boating opportunities supplied by these navi-gation projects, if priced at fair market values, couldfund significant amounts of system operating andmaintenance costs.
Management Framework
Finding ways to increase system capacity andhandle increasing demand without constructing newrights-of-way poses enormous challenges. Newtechnologies can marginally increase the capacity ofinfrastructure, but they are often expensive andeventually reach structural limits. A systems man-agement approach that encourages carrying the samevolume of passengers or cargo on fewer vehicles andmakes full use of all modes could address air quality,energy use, and congestion problems.
Intermodal Transportation
While individual intermodal operators—airports,marine ports, terminals, and stations-and transpor-tation companies are investing in advanced equip-ment and electronics to speed cargo and passengertransfers, problems related to intermodal transportincreasingly hamper regional surface transportationlinks. For example, port operations both contributeto and suffer from surface traffic congestion, airpollution, and problems caused by overweightshipments. Many such issues are international andinterstate in scope and beyond the capabilities ofState and local governments to resolve.
A host of governmental agencies have regulatoryand fiscal authority over separate elements ofregional transportation, and no effective mechanismfor multimodal coordination has emerged. Federalpolicy has favored capital investment as support foreconomic development, a policy that has diminish-ing application in metropolitan areas, where im-proved system (regional) management will be thekey to future economic success. OTA concludesthat Federal incentives for addressing regionaltransportation issues, intermodal links, surfacecongestion solutions, and environmental impactsare essential.
Institutional Framework
Neither DOT nor Congress has successfullyovercome strong, separate modal interests andachieved an appropriate systems approach to solvingtransportation problems. In Congress, only theappropriations committees have sufficiently com-prehensive jurisdiction, but those committees were
never intended to set transportation policy. DOT’srecently published National Transportation Policyrecognized this and encouraged a multimodal ap-proach toward transportation problems. However,this encouragement is not enough; OTA concludesthat unless steps are taken to institutionalize amultimodal approach within DOT, the tradi-tional modally oriented structure will be perpetu-ated and the agency will not be able to addresstoday’s transportation issues effectively.
If the Federal Government is to regain a leader-ship role in transportation, changes in institutionalmanagement must be made. In the short run,consolidating several of the water managementfunctions and urban modes makes a great deal ofsense. Over the longer term, options include restruc-turing DOT in divisions by broad mode-aviation,and surface and water transportation-or by func-tion, such as metropolitan passenger and intercityfreight transportation. Reforming congressionaloversight as well, by developing a mechanism tocoordinate or concentrate transportation author-ization, will be crucial to the success of arestructured DOT.
An immediate option for Congress to consider isto shift civilian water transportation authority fromthe Army Corps of Engineers to DOT, as wasoriginally envisioned when DOT was created. Thiswould consolidate all transportation policy and trustfunds within a single agency with Cabinet-levelattention and facilitate multimodal decisionmaking.Because some of the Corps’ traditional missions arewaning, over the longer term consideration couldbe given to making the agency into a NationalCorps of Engineers with the mission of making itsengineering and water resources expertise avail-able to support a number of executive agencies ona reimbursable basis. It could remain looselyassociated with DoD and maintain its other currentresponsibilities, or these could be assigned to otherdepartments as appropriate (flood control could behoused in the Department of the Interior, forexample).
Transportation Technologies
Advanced technologies, innovative and alterna-tive multimodal delivery systems, more efficientmanagement and methods, and changes to incen-tives will be necessary to improve the Nation’stransportation system. Yet with few exceptions, data

Chapter 3—Transportation Management and Technologies ● 133
collection and research have been insufficient toidentify the best choices among the advancedconcepts vying for places in the future transportsystem. Moreover, much in the current institutionaland organizational structure acts to prevent adoptionof new technologies and management techniques.Officials, particularly at the local level, are oftenunaware of suitable new technologies, and evenwhen they do know about new tools, they oftencannot afford to buy them or to train employees touse them.
Improving Operations
Technological procedures for mitigating con-gestion and structural limitations are often ex-pensive to implement, but may be cost-effectivewhen other options are unavailable. New trafficmanagement and control technologies could poten-tially improve traffic flows on congested roadways,airways, and waterways on the order of 10 to 20percent, although when new capacity is opened in acongested corridor, it is usually fried quickly bylatent demand. Many of these options requiresignificant public investments, and in most cases,users would also need to invest in new equipment,raising issues related to ability to pay.
Roadway technologies that speed traffic flows,inform motorists of congested areas, and detect andrespond to traffic incidents promptly are beingdeveloped and tested. The backbone of all of thesesystems is an efficient, traffic-responsive signalcontrol system, a basic technology that can offerimmediate congestion improvements. Advancedtraffic control signal systems are one of the fewhighway technologies whose effectiveness dependsrimarily on actions by public agencies, and theyP
represent a vital first step in the development ofother Intelligent Vehicle/Highway Systems. In-vehicle guidance and communications systems willbe of limited benefit unless they are linked to thepublic infrastructure. Federal assistance to localjurisdictions for implementing these highwaytechnologies and ensuring coordination betweenadjacent municipalities to provide smooth inter-city and interstate traffic flow are top priorities.
Managing Demand—Additional reduction incongestion can be attained in urban areas if technol-ogy is used in conjunction with full-cost pricing.Longer term Intelligent Vehicle/Highway Systemsdevelopments, such as those that control vehiclespeed and direction as well as spacing between
vehicles, offer greater potential for faster travel andreduced delays, but these technologies are at an earlystage of development, and any possible implementa-tion is at least two to three decades away.
The top investment priorities for air are communi-cations, navigation, and surveillance technologiesthat can improve terminal ATC capabilities andincrease effective airport. capacity during inclementweather, the time when most delays occur. Satellite-based systems will be essential for gains in interna-tional traffic. However, future gains in ATC capabil-ities are likely to outpace the ability of airports tohandle takeoffs and landings, and some form ofdemand management is likely to be necessary.
At some congested inland waterway locks, traffficmanagement and equipment for pulling unpoweredtows could increase capacity by over 20 percent.Scheduling access to these facilities would allowbetter planning by industry and could reduce operat-ing costs. However, the initiative for such systemtraffic management would best come from thewaterway users, since safety issues do not justifyprecise Federal traffic control on the waterways.
Alternative Modes
Technologies leading to improvement in onetransportation mode can benefit the entire sys-tem by relieving congestion in other modes. Forexample, employing high-speed rail in heavilytraveled automobile or air corridors, such as those inthe Northeast corridor and southern California,could significantly reduce rail travel times andattract passengers away from highways and airports.Improving the attractiveness of bus transit by givingurban buses priority at traffic signals and providingdedicated lanes would similarly help alleviate roadtraffic in crowded areas. Any gain in roadwayperformance will likely enhance airport groundaccess, since most air passengers and cargo dependon road vehicles. See table 3-13 for a summary of thelikely effects of various surface transportation meas-ures.
Alternative technologies, such as tiltrotor aircraftor magnetically levitated trains, could play a role inbypassing the parallel problems of limited airportcapacity and surface transportation congestion inmetropolitan areas. Developing and implementingsuch radically new technologies will require billionsof dollars and is likely to require Federal support.However, since these technologies would serve

134 . Delivering the Goods: Public Works Technologies, Management, and Finance
Table 3-13-impacts of Surface Transportation Measures
Technology or measure Impact Governmental action required
Highways:Intelligent Vehicle/Highway Systems . . . . . .
Timely pavement and bridge construction,maintenance, and rehabilitation .....,. .
Rail:Timely right-of-way maintenance and
rehabilitation . . . . . . . . . . . . . . . . . . . . . . . .
Automatic train control. . . . . . . . . . . . . . . . . .High-speed passenger rail . . . . . . . . . . . . . .
Mass transit:Alternative fuels . . . , . . . . . . . . . . . , . . . . . . .
Automatic vehicle location and passengerinformation systems . . . . . . . . . . . . . . . . .
SOURCE: Office of Technology Assessment, 1991.
Reduced congestion (10-20%) lnstallation of integrated, traffic-responsiveImproved safety (0-20% fewer accidents) signal control systems by local govern-Less driver frustration ments ($1 to $20 million/major city)
Federal investment in R&D ($10 to $100million/year)
Reduced life-cycle cost (50%) Higher annual maintenance expenditures byIncreased life (50%) State and local governments
Reduced Iife-cycle cost (10%) None, private-sector financedIncreased productivity (higher speeds),
fewer accidents (50%)Improved service and safety None, private-sector financedImproved service (50-100% quicker travel Federal support for Amtrak capitalexpenses,
times than conventional rail) Federal support of right-of-way acquisition,Shift some traffic from airports and highways construction, and possibly maglev R&D
Reduced emissions of NOx and particulates Increased fuel and equipment expenditures(0-20% reduction in ambient air pollution if for municipal transit authoritiesthese fuels are used only on mass transitvehicles)
Improved service, increased ridership (10%) Increased equipment expenditures forleading to congestion relief municipal transit authorities
overlapping needs, choices may have to be madebetween them and other technological options, andtotal public costs projected for each system, issuesthat will need further study. Moreover, Congresswill be involved in determining the appropriatesources for funding and how the developmentprogram should be managed.
High-speed intercity ground transportation,urgently needed in congested regions such as theNortheast corridor, can ill afford to await the
development of maglev or tiltrotor technology.Proven steel-wheel technologies, such as tilt trainsand high-speed systems, are available now and canplay a key role in speeding passenger travel andrelieving congestion from other modes in crowdedurban corridors. Tiltrotor aircraft and maglev trainsshow promise for even faster travel, but requireextensive development and are at least a decadeaway from possible implementation.