transport: overview of challenges in road freight and why rtms
TRANSCRIPT

A Overview of Challenges in Road
Freight Transport and why the RTMS
Slide # 1
Paul NordengenSA RTMS National Steering CommitteeResearch Group Leader: Network Asset Management SystemsCSIR Built Environment
Road Transport ForumCape Town, 14 July 2016

Road Transport Efficiency High standard of infrastructure (capacity,
road surface, road markings, road signs,
stopping facilities, road reserve)
Minimum incidents/crashes including
breakdowns
Compliance with traffic regulations
Safety & security (effective law
enforcement)
Efficient emergency response
Seamless cross-border transit

Key Elements in Road Freight
Transport
• Road infrastructure: roads,
bridges, roadside furniture, signs,
road markings, eToll gantries
• Vehicles: design, maintenance &
operation
• Drivers: skill, health, fatigue

Key Elements in Road Freight
Transport
• Road infrastructure: roads,
bridges, roadside furniture, signs,
road markings, eToll gantries
• Vehicles: design, maintenance &
operation
• Drivers: skill, health, fatigue

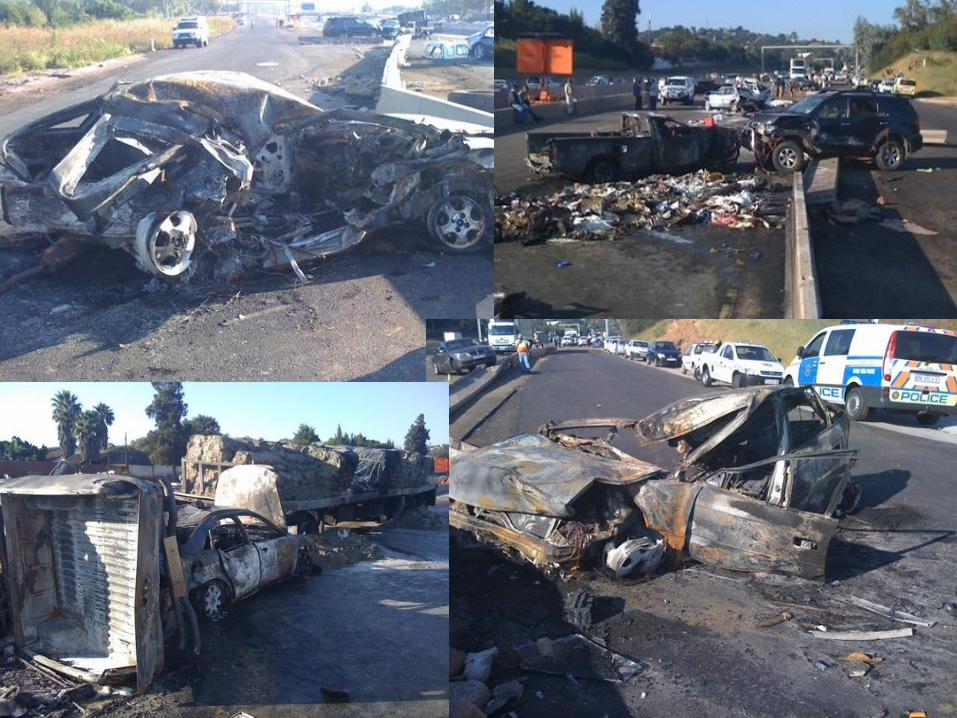
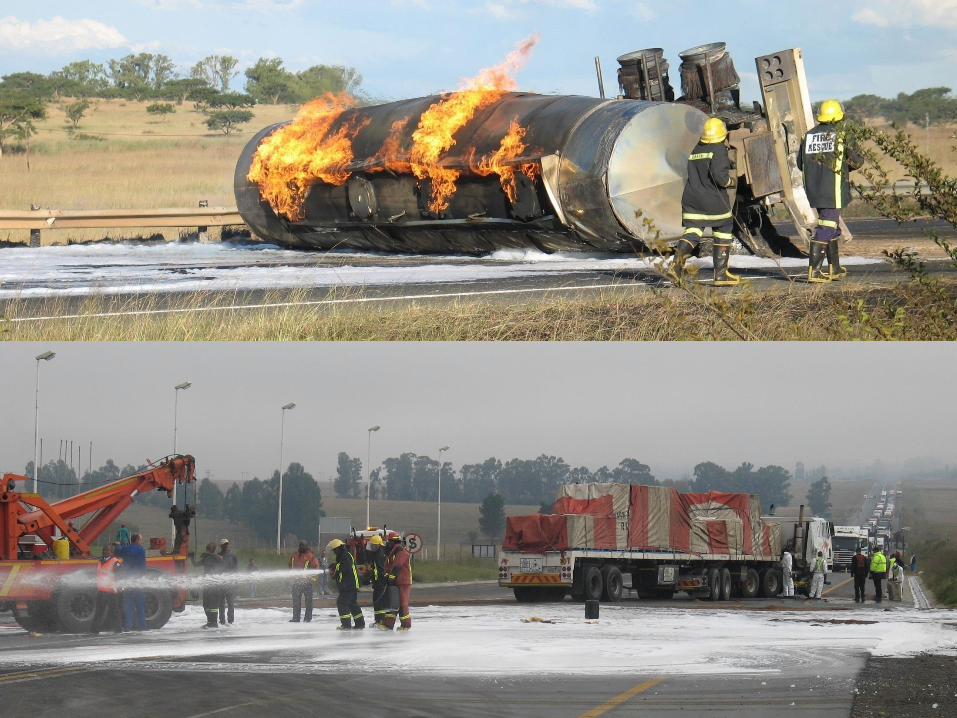
Reality Check

Reality Check

Reality Check

Reality Check

Excess heavy vehicle
maintenance and repair costs
Road
condition
Average
maintenance and
repair cost (R/km)
Average percentage
increase in the truck
maintenance and
repair cost
Average percentage
increase in company
logistics cost
Good R 0.96 - -
Fair R 1.24 30% 2.6%
Bad R 2.11 121% 10.4%

Slide # 10
North West Province, South Africa, 5 Nov 2004, 23h00
Six trucks carrying cobalt concentrate from DRC to Johannesburg (3 500 km). Overloads ranged from 30 780kg to 37 640kg (65%)


Overloading in Mozambique
0
500
1000
1500
2000
2500Weighed / Overloaded
VehiclesWeighed
#Overloaded
0%
10%
20%
30%
40%
50%
60%
70%
80%
90%
100%
% Overloads / Extra E80's
%Overloaded
%EE80's
Max Axle O/L (t)
%Max GVM
O/L (t)%
May-15 19.80 220% 44.92 134%
Jun-15 20.76 231% 44.96 130%
Jul-15 25.12 279% 52.91 125%
Aug-15

Overloading in Mozambique


Brake & Tyre Watch ResultsLocation Inspected Discontinued %
City Deep 24 21 88%
Middelburg 35 24 69%
Centurion 41 17 42%
Midway KZN 26 10 38%
Kroonstad 8 7 92%
Brackenfell, W. Cape 25 25 100%
Pietermaritzburg 12 11 92%
Port Elizabeth 15 6 40%
Rustenburg 7 5 72%
Polokwane 11 10 91%
Midway KZN 24 20 83%
Bloemfontein 24 20 83%
Nelspruit/Komati 13 12 92%
TOTAL (32 events) 666 452 68%
32 B&TW events from Feb. 2006
to date


0
2
4
6
8
10
12
2001 2002 2003 2004 2005 2006
Year
Fa
tal
cra
sh
ra
te
Aust
Can
France
Denmark
USA
South Africa
Switzerland
Fatal truck crash per 100 million vehicle kilometres travelled
Source: OECD report, Moving Freight with Better Trucks, 2010
Heavy Vehicle Fatal Crash Rates
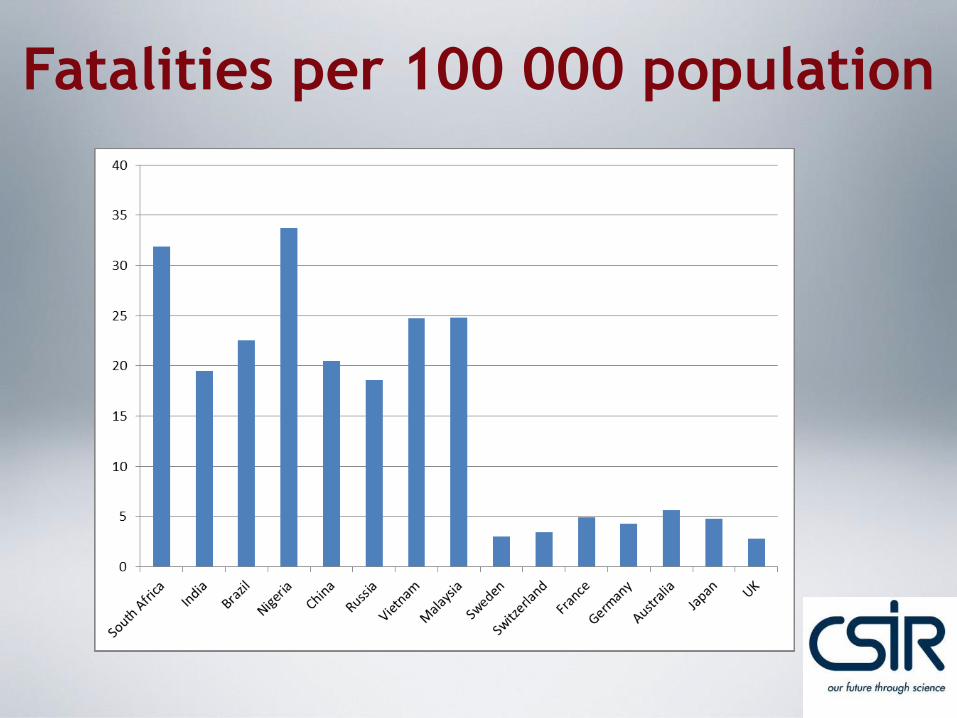
Fatalities per 100 000 population


Road Freight Challenges
The Reality: A Culture of Non-compliance
• Inputs– Overloading– Poor vehicle fitness (servicing & maintenance)– Poor driver fitness (fatigue, health, training)– Reckless driver behaviour– Border post delays– Bribery & corruption – impact on compliant and non-
compliant operators– Inadequate periodic maintenance (roads)
• Outputs– Poor road safety– High cost of road transport/logistics– Deterioration of infrastructure– High levels of emissions

Regional Road Transport Issues
HEAVY
VEHICLE
TRANSPORT
GLOBAL
COMPETETIVENESS
QUALITY
OF LIFE
SUSTAINABLE
ENVIRONMENT
Transport efficiency
Cost of logistics
Congestion
Cross-border delays
Optimum road
maintenance
Road safety
Congestion
Cost of logistics
Road condition
Transport efficiency
Road crashes
Road condition
Congestion
Energy consumption
Emissions
“maintaining and preserving
natural systems”

Slide # 31
0%
2%
4%
6%
8%
10%
12%
14%
16%
United
States
Japan Brazil South Africa
Condition of surfaced roads
0% 20% 40% 60% 80% 100%
1988
1990
1992
1994
1996
1998
2000
2002
2004
2006
2008
Very Poor Poor Fair Good Very Good

Slide # 32
Road
Safety
Fair Competition
between modes &
operators
Infrastructure
Protection
OVERLOAD CONTROL
National Overload Control Strategy
Implemented by National, Provincial and Local
Authorities
Infrastructure & Equipment
• Main routes (major facilities)
• Alternative routes (minor facilities/screening)
• Monitoring (HS-WIM)
• Alternative weighing equipment
• Private weighbridges
Information sharing &
Public Awareness
• Overload website
• Overload information booklet
Operations
• Human Resources
• PPP
• Training
• Guideline document
for law enforcement
Self-regulation
• Road Transport
Management System
(RTMS)
• Performance-Based
Standards (PBS)
Legislation
• Consignors/Consignees
• 5% Tolerance
• User charges
• Habitual Overloaders
• Public Prosecutors
• Alternative weighing equipment
• AARTO
Co-operation
• Provinces
• Local authorities
• Department of Justice
• Private sector


The Road Transport Management System
• RTMS is an industry–led, government-supported, voluntary, self-regulation scheme that encourages consignees, consignors and road transport operators to implement a management systems standard with outcomes that contribute to preserving road infrastructure, improving road safety and increasing productivity.
• Key focus areas are:- load optimisation (minimise over- and under-loading)- driver wellness- vehicle maintenance- productivity


Growth of the RTMS in SA200 fleets
representing almost 10 000 trucks & buses (In 2007 their
were 74 certified vehicles)
24 abnormal load operators:• 258 vehicles• Plant hire, construction, engineering, mobile cranes• 2 commercial A/L operators (108 vehicles)
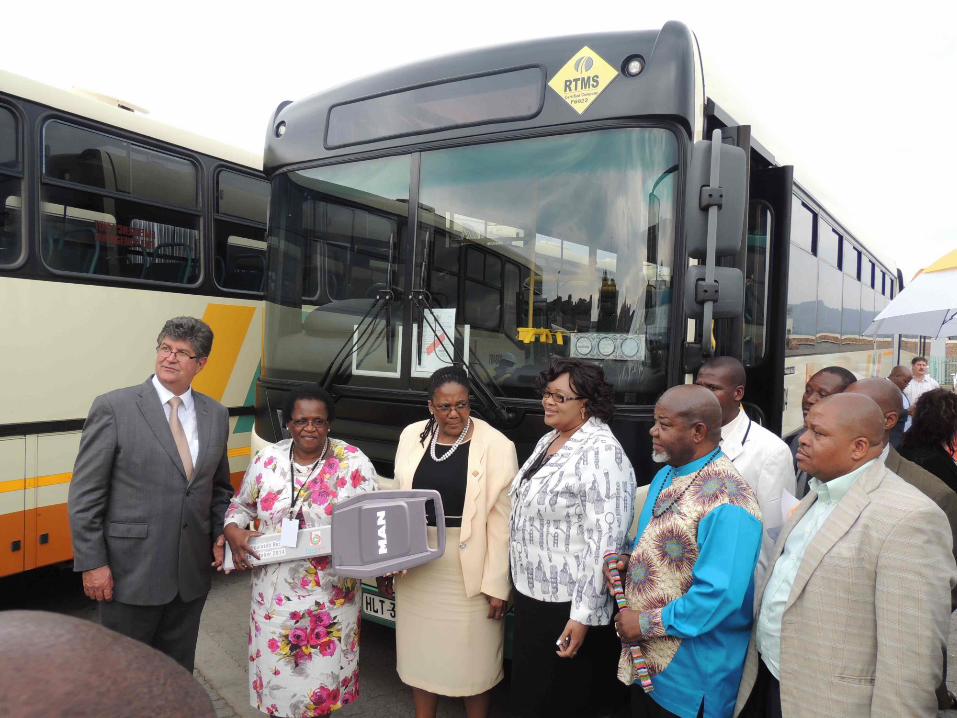
Four bus operators:
• Buscor 400 buses
• Intercape152 coaches
• GABS Over 1100 buses
• Intestate (Bloem)


RTMS: Overloading trend in forestry

RTMS: Overloading trend in sugar

Nordengen et al.
RTMS benefits: Crash reductions
Barloworld Logistics: 66% reduction in the number of crashes in 2012 (owner driver fleet);
Vehicle Delivery Services: 42% reduction in serious crashes from 2011 to 2012;
Timber Logistics Services: 50% reduction in crashes and incidents from 2009 to 2012;
The City of Cape Town, Electricity Support Services: 44% reduction in the number of crashes;
Unitrans Amatikulu: cost of crashes reduced from 5.0% of revenue to 1.3% of revenue (reduction in the frequency and severity of crashes)
STS N°12
48TRA2014 Paris 14-17 avril 2014

Case
Study:
Dawn
Logistics

POSITIVE RESULTS AND OUTCOME AFTER IMPLEMENTING RTMS
Weighbridges or weigh mats at all depots:All trucks are weighed before exiting and any defaults are fixed before trucks leave the yard• 2013 and before = unknown • 2014 = 3• 2015 = 0
Risk of breakdowns/crashes/fines:Strict daily routine inspections and regular tyre surveys, maintenance checks have improved our downtime, and any issues are repaired before trucks leave.
YEAR FINES CRASHESDRIVER ERROR
BREAKDOWNS
2013 218 37 19 57
2014 232 26 11 46
2015 56 17 5 33

0
50
100
150
200
250
300
2013 2014 2015
Accidents
Fines
Breakdowns
FLEET

Driver behaviour:Driver speeding is monitored on a daily basis through our tracking system and all events are addressed with drivers daily on debriefing•2013 = Unknown•2014 = 60 127 (164 fleet = 366 speeding events per truck per year)•2015 = 8 689 (184 fleet = 47 speeding events per truck per year)
Driver awareness and safetyHas increased due to training, educating, posters and truck information manualsDriver motivation has increased due to Driver of the Month and Driver of the Year awards. Selected by tracking system which monitors drivers behaviour and gives the drivers a monthly score.
Driver wellnessFatigue managed eliminates riskChronic conditions managed eliminates riskAlcohol testing eliminates risk

Fuel consumption:Consistent improvement. Fuel monitored on a daily basis and we are running above industry average.Since implementation, fuel consumption has improved by 20%Primarily as a result of improved driver behaviour –defensive and economical driving, reduction in harsh braking and speeding.
