transnational corporations volume 25, 2018, number 2 · 2018-09-20 · transnational corporations1...
TRANSCRIPT

Volume 25 • 2018 • Number 2
TRANSNATIONALCORPORATIONS
INVESTMENT AND DEVELOPMENT

Volume 25 • 2018 • Number 2
TRANSNATIONALCORPORATIONS
INVESTMENT AND DEVELOPMENT
Special Issue on Investment and International Taxation
Part 1
New York and Geneva, 2018
TRANSNATIONAL CORPORATIONS Volume 25, 2018, Number 2ii
© 2018, United NationsAll rights reserved worldwide
Requests to reproduce excerpts or to photocopy should be addressed to the Copyright Clearance Center at copyright.com.
All other queries on rights and licences, including subsidiary rights, should be addressed to:United Nations Publications300 East 42nd StreetNew YorkNew York 10017United States of AmericaEmail: [email protected]: un.org/publications
The findings, interpretations and conclusions expressed herein are those of the author(s) and do not necessarily reflect the views of the United Nations or its officials or Member States.
The designations employed and the presentation of material on any map in this work do not imply the expression of any opinion whatsoever on the part of the United Nations concerning the legal status of any country, territory, city or area or of its authorities, or concerning the delimitation of its frontiers or boundaries.
This publication has been edited externally.
United Nations publication issued by the United Nations Conference on Trade and Development.
UNCTAD/DIAE/IA/2018/4
ISBN: 978-92-1-112933-5eISBN: 978-92-1-047418-4
Sales no.: ETN252
iiiEditorial Board
EDITORIAL BOARD
Editor-in-Chief
Guest Editor
Deputy Editors
Guest Managing Editor
Board of Advisors
Associate Editors
James X. Zhan, UNCTAD
Jeffrey Owens, Director of the Global Tax Policy Center at the Institute of Austrian and international Tax Law, Vienna University of Economics and Business
Richard Bolwijn, UNCTADHeinz Tüselmann, Manchester Metropolitan University,
United Kingdom
Bruno Casella, UNCTAD
Olivier Bertrand, Fundação Getulio Vargas – Brazilian School of Public and Business Administration, Brazil
Peter Buckley, University of Leeds, United KingdomLorraine Eden, Texas A&M University, United StatesXiaolan Fu, University of Oxford, United KingdomGary Gereffi, Duke University, United StatesAnabel Gonzáles, Former Minister of Trade, Costa Rica Robert Koopman, World Trade Organization, SwitzerlandGabrielle Marceau, University of Geneva and World Trade
Organization, SwitzerlandTheodore Moran, Georgetown University, United StatesRam Mudambi, Temple University, United StatesPierre Sauvé, World Bank Group, SwitzerlandHarsha V Singh, Former Deputy Director-General WTO
and Executive Director Brookings India, India
Tony Addison, United Nations University, Finland
Carlo Altomonte, Bocconi University, Italy
Pádraig Carmody, Trinity College Dublin, Ireland
Maria-Alejandra Gonzales-Perez, Universidad EAFIT, Colombia
Markus Krajewski, Friedrich-Alexander-Universität Erlangen-Nürnberg, Germany
Grazia Santangelo, University of Catania, Italy
Rudolf Sinkovics, University of Manchester, United Kingdom
Tania Voon, University of Melbourne, Australia
Hinrich Voss, University of Leeds, United Kingdom
Habib Zitouna, University of Carthage, Tunisia

TRANSNATIONAL CORPORATIONS Volume 25, 2018, Number 2iv
Review Board Ilan Alon, University of Agder, NorwayUlf Andersson, Mälardalen University, SwedenKazuhiro Asakawa, Keio University, JapanAri Van Assche, University of Montreal, CanadaSnehal Awate, Indian School of Business, IndiaElitsa Banalieva, Northeastern University, USAHelena Barnard, University of Pretoria, South AfricaJonathan Beaverstock, University of Bristol, UKStephen Buzdugan, Manchester Metropolitan University, UKHuiping Chen, Xiamen University, ChinaJohn Da Silva Luiz, University of Sussex, UKJohn Dilyard, St. Francis College, USAStefano Elia, Politecnico di Milano, ItalyPeter Enderwick, University of Auckland, New ZealandDespoina Filiou, Manchester Metropolitan University, UKSusan Franck, American University Washington, USACaroline Henckels, Monash University, AustraliaMartin Hess, University of Manchester, UKJenny Hillemann, Vrije University, BelgiumRory Horner, University of Manchester, UKKevin Ibeh, Birkbeck, University of London, UKKathryn Lavelle, Cape Western Reserve University, USAAndrew Mitchell, University of Melbourne, AustraliaSinead Monaghan, Rutgers University, USAMike Morris, University of Cape Town, South AfricaKhalid Nadvi, University of Manchester, UKQuyen Nguyen, Henley Business School, UKBent Petersen, Copenhagen Business School, DenmarkJohn Ravenhill, University of Waterloo, CanadaNoemi Sinkovics, University of Manchester, UKGabrielle Suder, University of Melbourne, AustraliaMarjan Svetličič, University of Ljubljana, SloveniaXiaowen Tian, Murdoch University, AustraliaHenry Yeung, National University of Singapore, SingaporeStefan Zagelmeyer, University of Manchester, UKIvo Zander, University of Stockholm, Sweden
vEditorial Statement
EDITORIAL STATEMENT
Transnational Corporations1 is a longstanding policy-oriented refereed research journal on issues related to investment, multinational enterprises and development. It is an official journal of the United Nations, managed by the United Nations Conference on Trade and Development (UNCTAD). As such it has a global reach, a strong development policy imprint, and high potential for impact beyond the scholarly community.
Objectives and central terrain
The journal aims to advance academically rigorous research to inform policy dialogue among and across the business, civil society and policymaking communities. Its central research question – feeding into policymaking at subnational, national and international levels – is how to make international investment and multinational enterprises contribute to sustainable development. It invites contributions that provide state-of-the-art knowledge and understanding of the activities conducted by, and the impact of multinational enterprises and other international investors, considering economic, legal, institutional, social, environmental or cultural aspects. Only contributions that draw clear policy conclusions from the research findings will be considered.
Grand challenges and the need for multiple lenses
The scale and complexities of the “grand challenges” faced by the international community, such as climate change, poverty, inequality, food security, health crises, and migration – as embodied in the United Nations’ Sustainable Development Goals (SDGs) – are enormous. These challenges, combined with the impact of disruptive technologies on business, rapidly evolving trends in international production and global value chains, new emerging-market players and new types of investors and investment, make it imperative that policymakers tap a wide range of research fields. Therefore, the journal welcomes submissions from a variety of disciplines, including international business, innovation, development studies, international law, economics, political science, international finance, political economy and economic geography. However, submissions should be accessible across disciplines (as a non-specialized journal idiosyncratic research should be avoided); interdisciplinary work is especially welcomed. The journal embraces both quantitative and qualitative research methods, and multiple levels of analyses at macro, industry, firm or individual/group level.
Inclusive: multiple contributors, types of contributions and angles
Transnational Corporations aims to provide a bridge between academia and the policymaking community. It publishes academically rigorous, research-underpinned
1 Previously: The CTC Reporter. In the past, the Programme on Transnational Corporations was carried out by the United Nations Centre on Transnational Corporations (1975–1992) and by the Transnational Corporations and Management Division of the United Nations Department of Economic and Social Development (1992–1993).
TRANSNATIONAL CORPORATIONS Volume 25, 2018, Number 2vi
and impactful contributions for evidence-based policy-making, including lessons learned from experiences in different societies and economies, both in developed and developing-country contexts. It welcomes contributions from the academic community, policymakers, research institutes, international organisations, and others. Contributions to the advancement and revision of theories, frameworks and methods are welcomed as long as they are relevant for shedding new light on the investigation of investment for development, such as advancing UNCTAD’s Investment Policy Framework for Sustainable Development.
The journal publishes original research articles, perspective papers, state-of-the art review articles, point-counterpoint essays, research notes and book reviews. All papers are double blind reviewed and, in line with the aims and mission of the journal, each paper is reviewed by academic experts and experts from the policymaking community to ensure high-quality impactful publications that are both academically rigorous and policy relevant. In addition, the journal features synopses of major UN reports on investment, and periodic reviews of upcoming investment-related issues of interest to the policy and research community.
Unique benefits for authors: direct impact on policymaking processes
Through UNCTAD’s wider development community and its global network of investment stakeholders, the journal reaches a large audience of academics, business leaders and, above all, policymakers. UNCTAD’s role as the focal point in the United Nations system for investment issues guarantees that its contents gain significant visibility and contribute to debates in global conferences and intergovernmental meetings, including the biennial World Investment Forum and the Investment and Enterprise Commission. The work published in Transnational Corporations feeds directly into UNCTAD’s various programmes related to investment for development, including its flagship product, the annual World Investment Report, and its technical assistance work (investment policies reviews, investment promotion and facilitation and investment treaty negotiations) in over 160 countries and regional organisations. The journal thus provides a unique venue for authors’ academic work to contribute to, and impact on, national and international policymaking.
viiContents
CONTENTS
INTRODUCTION TO THE SPECIAL ISSUE
Jeffrey Owens and James X. Zhan 1Trade, investment and taxation: policy linkages
ARTICLES
Lorraine Eden and William Byrnes 9Transfer pricing and state aid: the unintended consequences of advance pricing agreements
Kimberly A. Clausing 37Does tax drive the headquarters locations of the world’s biggest companies?
Tommaso Faccio and Valpy Fitzgerald 67Sharing the corporate tax base: equitable taxing of multinationals and the choice of formulary apportionment
David Bradbury, Tibor Hanappi and Anne Moore 91Estimating the fiscal effects of base erosion and profit shifting: data availability and analytical issues
UNCTAD INSIGHTS 107
Richard Bolwijn, Bruno Casella and Davide RigoAn FDI-driven approach to measuring the scale and economic impact of BEPS

1
Introduction to the Special Issue
Trade, investment and taxation: policy linkages
Jeffrey Owens and James X. Zhan*
International trade, investment and tax policies are inextricably linked. Tax is a key investment determinant influencing the attractiveness of a location or an economy for international investors, particularly those heavily engaged in international trade. Taxation, tax relief and other fiscal incentives are key policy tools to increase exports and attract investors. Investors, once established, add to economic activity and the tax base of host economies, and make direct and indirect fiscal contributions. And international investors and MNEs, by the nature of their international operations and intra-firm trade, have opportunities for tax arbitrage between jurisdictions and for tax avoidance.
This last point in particular has been the focus of public debate over the last decade. Recognizing the significance of tax avoidance through trade and investment by MNEs, the international community – policymakers, international organizations, NGOs and businesses themselves – has been heavily engaged in initiatives to counter the phenomenon. The focus of attention has largely been on tax policy, accounting rules and company law, and on initiatives to improve information exchange and to increase pressure on tax havens. However, given the fundamental role of investment in building the corporate structures that enable tax avoidance, and of trade in providing the transactions and arbitrage opportunities underpinning tax avoidance, trade and investment policy are integral parts of these efforts.
In fact, while the impetus for tax reforms has to a large extent come from intense public pressures caused by growing inequalities in the distribution of income and wealth, the shape and direction of reforms have been driven by the need to adapt international tax systems to the rapidly changing global trade and investment landscape:
• A shift away from trade in goods to trade in services. Today over 70 per cent of trade among developed countries is in the services sector. This change has been accompanied by an increase in the importance of intangible assets in the wealth of large corporations.
* Jeffrey Owens – Guest Editor of this Special Issue of Transnational Corporations – is the former Director of the OECD Centre for Tax Policy and Administration, and Director of the Vienna University Global Tax Policy Center at the Institute of Austrian and international Tax Law, Vienna University of Economics and Business. James X. Zhan is the Director of UNCTAD’s Investment and Enterprise Division, and Editor-in-Chief of Transnational Corporations.
2 TRANSNATIONAL CORPORATIONS Volume 25, 2018, Number 2
• Trade patterns are also changing significantly. In 2000, 50 per cent of world merchandise trade was between developed countries and almost 90 per cent of world trade involved a developed-country partner. By 2016, trade among developed countries had dropped to 37 per cent, and South-South trade had grown to 25 per cent of the global total.
• The same applies to global investment patterns. In 2000, developed countries owned almost 90 per cent of global FDI stock. Today, their share has dropped to 75 per cent, and developing and transition economies have become important investors, accounting for almost one third of global outflows.
• The spread of global value chains (GVCs) has been one of the key developments in trade and investment over the last two decades, with MNEs operating complex GVCs across countries. Over two-thirds of global trade has been intra- and inter-firm trade by MNEs through their integrated international production networks, i.e. GVCs. These GVCs have increased the interdependency between countries: on average, about 30 per cent of countries’ exports are now composed of imported inputs or are used as inputs by others.
• The increased geographical mobility of capital and the spread of international production and trade have intensified tax competition, at a time when many governments in both developing and developed economies continue to face large budget deficits and are therefore looking for new ways to raise tax revenues.
• The inexorable march of technological advances and rapid evolution of business models across entire industries, in both the digital and the digitalized economy, are transforming international production, trade and GVCs, and they are challenging traditional norms of international taxation. Blockchain technology, fintech, cloud computing, artificial intelligence, the Internet of Things, 3D printing and Industry 4.0, among others, are disrupting modes of operation and cross-border processes, pushing the bounds of taxation. At the same time, these technologies open up new opportunities to transform the ways that tax administrations operate and interact with taxpayers.
The tax policy response of governments to these pressures has varied depending on their economic, political and social environments and on the level and structure of their tax systems.
The last point, the need to formulate an effective and coherent approach to international taxation in the digital economy, has proved to be an especially complex and divisive issue. Under the auspices of the OECD/G20 Base Erosion and Profit Shifting (BEPS) project, governments are examining the extent to which existing tax arrangements work in a digital environment. The project has outlined a number of options, but there is still no international consensus on how to move forward, with countries falling into three groups: (i) One group feels that the existing international corporate tax arrangements are still applicable, subject to minor adjustments.
3Trade, investment and taxation: policy linkages
(ii) A second group feels that the existing arrangements do not work in a digital environment and are calling for a fundamental review of the way that tax treaties divide the multinational tax base between source and residence countries. These countries recognize that such a fundamental review must not be limited to digital companies but must cover all economic activities, and that it will take a number of years to arrive at an international consensus. (iii) A third group feels that the way forward is to have specifically designed tax rules for “digital” companies. It will be a challenge to reconcile these conflicting views.
With regard to increased tax competition, governments are adopting ever more sophisticated approaches, operating within the constraints imposed by OECD/G20 BEPS Action 5, by the EU Code of Conduct and State Aid Rules, and by World Trade Organization (WTO) subsidy rules. Corporate tax rates continue to fall – a trend that is likely to accelerate as countries respond to the tax reforms in the United States. Tax incentives are increasingly focusing on intangible assets, as can be seen by the spread of patent boxes. More and more countries now have low tax regimes targeted at high earners and high-net-worth individuals. State and local governments are increasingly providing special tax exemptions in their taxation of land and buildings. The use of special economic zones is spreading. And governments now recognize that providing a business-friendly tax administration is a very effective way of attracting economic activity: one that provides certainty, consistency and predictability, and effective ways to minimize and resolve cross-border tax disputes. The expectation is that tax competition will continue to thrive.
Although the focus in international taxation is on corporate income tax, other taxes with indirect consequences for countries’ trade and investment climates are also being reviewed. For example, consumption tax systems are evolving, with countries replacing traditional sales taxes with VAT/GST, the latest examples being China, the Gulf States and India. Today over 160 countries operate these taxes, and in many they are now the major single source of tax revenue. Yet, despite the spread of these taxes there are no internationally agreed rules on how they should apply. Unlike direct taxes, for which there are the OECD/UN Model Conventions, no such instrument exists for VAT/GST, and there are no internationally agreed mechanisms for resolving cross-border VAT/GST tax disputes.
Taxes on capital, wealth and immoveable property are also being reviewed, partly reflecting pressures on government to use these taxes to reduce growing inequalities in the distribution of income and wealth, partly because the increase in tax transparency has made it more difficult to hide assets offshore and partly because new technologies such as blockchain open up new ways of tracking the ownership of assets.
More generally, the international tax community is examining how to reduce tax uncertainty. Such uncertainty risks becoming especially harmful in an environment for global investment that has already lost much growth momentum over the last
4 TRANSNATIONAL CORPORATIONS Volume 25, 2018, Number 2
decade, with knock-on effects for trade and GVCs. Global FDI flows were down again in 2017 and are still well below the 2007 peak. Greenfield investment in manufacturing – the type of investment most needed to boost the prospects of developing countries – has been structurally lower in the last five years. Foreign value added in trade, a key measure of the health of GVCs, has stalled and shifted into reverse after having grown continuously since 1990. And key indicators of international production – sales, assets and employment in foreign affiliates – are all growing at much slower rates than before.
Tax uncertainty compounds the already high levels of uncertainty in the global trade and investment environment, hampered by the rise of trade and investment tensions among major trading partners, and by the policy implications from changes to some major trade relationships, such as the United Kingdom’s impending exit from the European Union and the renegotiation of the North American Free Trade Agreement. For emerging and developing economies, a protracted period of developed-country investor uncertainty could hamper the recovery of investment flows.
Countries are considering numerous measures to reduce tax uncertainty, including greater taxpayer and stakeholder engagement and consultation in policymaking and implementation, mechanisms to ensure clearer and less ambiguous formulations in tax legislation, greater use of clarifications and public rulings, guidance to regional tax offices on the application of legislation and tax treaties, co-operative compliance programs and the elimination of discretionary tax incentives.
A key concern adding to tax uncertainty is the increased risk of cross-border disputes in a post-BEPS environment, which could lead to unresolved double taxation. This was why BEPS Action 14 set out measures to improve the existing Mutual Agreement Process, which is the main mechanism for resolving cross-border disputes. A number of countries have been pushing for the introduction of mandatory tax arbitration provisions in tax treaties. Many less developed countries and some developed countries oppose such an approach, but if a new institutional framework could be established – one that addresses their concerns and over which they have ownership – mandatory tax arbitration could become a viable option. This is an area where the international tax community can draw both positive and negative lessons from reform efforts and developments in international investment agreements, the WTO dispute mechanism and mechanisms proposed in the trans-Atlantic and trans-Pacific partnership agreement.
There is significant scope for cross-learning and synergies between the networks of bilateral investment, trade and tax agreements. There is a need for broad-based efforts to harmonize or reform the functioning of these networks of treaties, through common reform processes, such as the ones proposed by UNCTAD for investment treaties, and through multilateral instruments, as proposed by the OECD for the implementation of BEPS. A key goal is to provide greater certainty for cross-border activities and more effective mechanisms to minimize and resolve disputes.
5Trade, investment and taxation: policy linkages
These efforts are all the more important at a time when the world is experiencing a potentially toxic mixture of political and economic uncertainty, rising trade and investment protectionism, scepticism among some political segments of the benefits of a multilateral rules-based system and a popular backlash against globalization and MNEs.
This is why a better understanding is now needed of how international trade, investment and tax policies and instruments interact. The different policy areas are generally in the hands of different government departments; for example, the three treaty networks have often been negotiated by different ministries (trade, foreign affairs, finance), as well as tax administrations and investment promotion departments, with little coordination of how tax issues should be treated in non-tax treaties, or how dispute mechanisms in these agreements interact. Yet all of these agreements have a common overriding objective: to foster sustainable development by providing an enabling environment for FDI and cross-border trade. To achieve this, these agreements seek to establish principles setting out the respective responsibilities of governments and business (although much debate concerns the balance between the two) and putting in place effective mechanisms to both minimize and resolve cross-border disputes, while respecting national sovereignty and the constitutional constraints faced by governments.
Achieving the right equilibrium between the interests of government, business and citizens is not easy, especially at a time when many are questioning the benefits of globalization.
This is the context in which governments are reviewing the structures of their tax, trade and investment agreements. The G20/OECD-led tax agenda is revolutionizing tax arrangements. Tax transparency, in the form of effective exchange of information between tax administrations, country-by-country reporting by MNEs to tax administrations, mandatory disclosure of advance pricing agreements and tax rulings, and aggressive tax schemes – all require that corporations learn to operate in an environment where their tax arrangements are subject to unprecedented scrutiny and where cooperation between tax administrations has intensified.
The BEPS project is updating the international tax arrangements set out by the OECD and the UN Tax Treaty Models and Transfer Pricing Guidelines. Already many of the 15 BEPS actions have been finalized, and over 80 countries have now signed the Multilateral Investment Instrument as a way of achieving a rapid implementation of these changes. There remain, however, outstanding issues, especially in the areas of transfer pricing and how to deal with the digital economy.
Investment agreements are also subject to an intense review process, with some countries questioning whether these agreements are too favourable towards the private sector and many asking for more transparent and balanced mechanisms to resolve disputes. Also, just as in the tax arena, there are cautious moves towards
6 TRANSNATIONAL CORPORATIONS Volume 25, 2018, Number 2
a more multilateral approach – for example, through the Mauritius Convention on Transparency, the subject of one of the contributions to this Special Issue.
In the area of trade, the slow process in taking forward the multilateral trade agenda under the WTO has led to a spread of regional and bilateral agreements. There has also been a push to improve the transparency of trade dispute resolution mechanisms. More generally a number of countries have questioned whether the outcomes of these trade agreements are balanced.
This Special Issue seeks to provide new insights into the interactions and linkages between international trade, investment, and tax policies and instruments, by bringing together authors from the tax, trade and investment communities. It is divided into two parts, covering two regular issues of the Journal (volume 25, issues 2 and 3). The first part, this issue, touches on some of the technical aspects of the major themes in the international debate.
The first contribution is precisely on the overlap and interconnection between the different policy arenas comprised by international commercial relations, including trade, investment and tax, but also competition policies. Lorraine Eden and William Byrnes discuss the unintended consequences of advance pricing agreements (APAs) and their spillover effects into adjacent policy realms. They show that, in the context of European Union state aid cases, APAs can be misused by lower-tier governments to attract FDI through preferential tax deals with individual MNEs, and they recommend policy changes to reduce such negative spillovers.
In the second paper, Kimberly Clausing studies the importance of tax as a determinant of investment, and the issue of tax competition among countries for the attraction of high-value FDI, in particular headquarter functions. The author provides an analysis of the extent to which tax steers the headquarter locations of the 2000 largest global firms, and discusses the trade-off faced by policymakers between competitiveness and job creation on the one hand, and protection of the tax base on the other. She touches on a number of reform options that are being debated in the international community to make this trade-off less vexing.
One such reform option, and one on which opinions are most divided, is formulary apportionment – dividing the MNE tax base among jurisdictions on the basis of some agreed share of sales, employment and assets in order to reduce profit-shifting opportunities. In the third contribution to this issue, Tommaso Faccio and Valpy Fitzgerald discuss the possible consequences of such a fundamental reform of the international tax system, based on a case study using publicly available country-by-country reporting data for a large MNE. They show the hypothetical impact of a move to formulary apportionment on a global basis and under the European Union’s Common Consolidated Corporate Tax Base proposal, and they propose options for apportionment factors.
7Trade, investment and taxation: policy linkages
The analysis of the effects of BEPS on countries’ tax revenues that underpins the reform efforts under way in the international community, led by the OECD, has been extremely complex, mostly due to data availability problems. In the fourth contribution to this issue, David Bradbury, Tibor Hanappi and Anne Moore of the OECD provide insights into the herculean data collection and analytical efforts behind the estimates of the fiscal effects of BEPS. They explain how the Action 11 report, which considered the impacts of BEPS, arrived at its estimate of global corporate income tax (CIT) losses of between 4 and 10 per cent of global CIT revenues.
In the final paper in this issue, UNCTAD staff members explain the analytical approach behind their estimates of BEPS in the World Investment Report 2015. This approach, based on a global bilateral FDI stock matrix and the use of indirect FDI through conduit jurisdictions, was cited in the Action 11 report as one of the possible revenue loss assessment methods. A key merit of the WIR approach is that it clearly shows the direct link between investment flows and tax planning, confirming the need for a coherent approach between tax and investment policies.
The second part of the Special Issue (volume 25, number 3) looks at a number of historical and political aspects of the debate, and at some of the ways forward.
In an introductory paper, Sol Picciotto traces the history of international corporate taxation and its effect on the development of transnational corporations (TNCs). He looks at how TNCs have helped shape the system and argues for policy reforms to reduce opportunities for regulatory arbitrage, which has contributed to the growth of mega-TNCs and in some cases led to oligopolistic dominance. In so doing, he further expands on the interconnections between investment, tax, trade and competition policies.
A further historical and politically engaged perspective is provided by Alex Cobham, Petr Janský and Markus Meinzer, who study the evolution of the debate on country-by-country reporting as a mechanism for improving corporate accountability and reducing profit-shifting. They argue that the level of accountability required from MNEs has diverged ever more from that required of domestic firms, and they discuss the merits of, and possible future avenues for achieving, improved global country-by-country reporting standards.
The third contribution, by Michael Lennard, takes a closer look at the reforms currently under way, and examines them from a development perspective. It focuses in particular on the concept of value creation, which takes a central role in both the OECD/G20 BEPS process and the European Union’s initiatives, as a way of determining the taxation rights of countries. It is especially relevant in relation to the digital economy. The author looks ahead at possible directions in the consensus-building process, and argues that developing-country policymakers
8 TRANSNATIONAL CORPORATIONS Volume 25, 2018, Number 2
need to be aware that their policy space in corporate taxation based on place of consumption should not be unduly limited.
The fourth contribution adds the legal perspective, a critical dimension in this debate. Nathalie Bravo looks at the future evolution of international investment and tax treaties. The author compares the Mauritius Convention on Transparency, which aims to modify investment treaties, and the BEPS Multilateral Instrument, which modifies tax treaties, and identifies common characteristics and differences. She draws lessons for future reform efforts from her analysis of the two multilateral conventions.
The concluding paper in this double Special Issue is another contribution by UNCTAD staff, which again focuses on the investment–tax policy nexus. It aims to place the debate on aggressive tax planning by MNEs, at the centre of much of the Special Issue, in the context of the continued need for countries – and especially developing countries – to attract FDI in order to generate economic growth, productive capacity, employment and competitiveness. It shows how MNEs, despite their tax avoidance practices, are still substantial contributors to government revenues in developing countries. The paper details the technical approach followed in WIR2015 for the calculation of the fiscal contribution of MNE foreign affiliates in developing countries and presents the main results, which set a baseline for the tax avoidance debate. The authors also indicate possible avenues for further research in this area.
Taken together, it is hoped that these two issues will contribute to a better dialogue between the tax, trade and investment communities at the levels of government, business and academia.
Looking ahead, a key emerging issue that merits major efforts for research and policy analysis is the ever-growing interaction between industrial policy and trade, investment and tax policy regimes. The recent worldwide proliferation of industrial policy has intensified such interactions. According to the World Investment Report 2018, over 100 countries have put in place some sort of industrial policy package, 80 per cent of which were formulated over the past five years alone. This has triggered extensive realignments between trade, investment and tax policies, as well as with the newly established industrial policies and strategies. Although industrial policy may contribute to the sustainable development and inclusive growth of individual countries, it may also pose challenges and opportunities for the effort towards a coherent international approach to trade, investment and tax policies. This will undoubtedly exert significant and far-reaching impacts on tax regimes and tax reforms in the years to come.
9
Transfer pricing and state aid: the unintended consequences of advance pricing agreements
Lorraine Eden and William Byrnes*
An advance pricing agreement (APA) is a formal arrangement between a tax authority and a multinational enterprise (MNE) in which the parties jointly agree on the MNE’s transfer pricing methodology, estimated taxable income, and tax payments for a fixed period, thus reducing the likelihood of an income tax dispute. We argue that APAs, which were developed by governments to solve MNE-state problems in one realm (international taxation of related party transactions), have had unintended consequences for both parties due to the spillover impacts of APAs into other policy realms. We explore this argument in the European Union state aid cases where, in the context of competition policy, APAs can be viewed as hidden, discretionary policies that can be misused by lower-tier governments to attract or retain inward foreign direct investment by offering individual MNEs preferential tax treatment. Our paper contributes to this literature by analyzing the unintended consequences of APAs and recommending policy changes to reduce these negative spillovers.
Keywords: advance pricing agreement, state aid, transfer pricing, dispute settlement
1. Introduction
Relations between multinational enterprises (MNEs) and governments entered a new phase when, in February 2014, the European Commission (EC) notified three Member States that the Commission was launching investigations to determine whether their tax authorities had provided illegal state aid to an MNE through an advance pricing agreement (APA). The notified governments and MNEs were Ireland (Apple), the Netherlands (Starbucks), and Luxembourg (Fiat).
* The authors are affiliated with the Texas A&M University. Lorraine Eden is Professor of Management ([email protected]) and William Byrnes is Executive Professor and Associate Dean Special Projects, School of Law ([email protected]).
Acknowledgement: We thank Richard Bolwijn, Bruno Casella, Vladimir Starkov, Jeffrey Owens and an anonymous reviewer for their very helpful comments on earlier drafts of this paper. The views expressed here and any remaining errors are the authors’.
10 TRANSNATIONAL CORPORATIONS Volume 25, 2018, Number 2
An APA is an ex ante dispute settlement mechanism negotiated behind closed doors between an MNE and a tax administration (Byrnes and Cole, 2018; Eden, 1998; Markham, 2012). The purpose of an APA is to prevent tax disputes between the MNE and the tax authority by determining ex ante the MNE’s transfer prices and taxable income, thus providing some certainty about the MNE’s future tax payments. An APA is designed to be a neutral tax procedure that improves the overall process of determining an MNE’s taxable income within and between tax jurisdictions.
The EC notifications argued, however, that these APAs had been used for a different purpose: to stretch the law and provide a tax benefit to a specific MNE by artificially lowering its taxable profits and its tax payments. A tax benefit received by a firm from a European Union (EU) Member State, if the benefit provides a specific and discriminatory advantage to the firm, is considered a fiscal subsidy that is illegal under EU competition policy. After investigating the cases, the EC concluded in all three cases that the APA did constitute illegal state aid and demanded that the tax benefit be repaid.
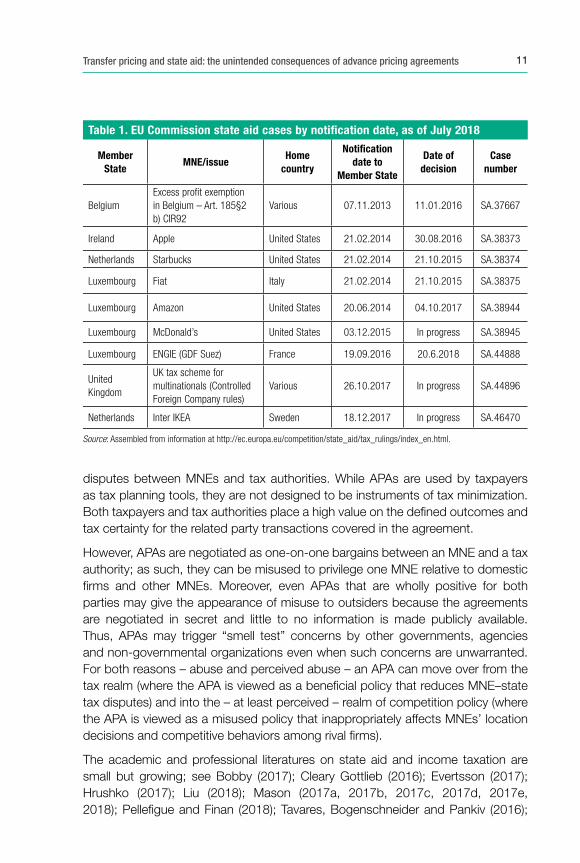
As of August 2018, the EC had three open investigations (see Table 1) of state aid involving APAs granted to IKEA by the Netherlands (EC, 2017b, December 18), McDonald’s by Luxembourg (EC, 2015, December 3), and Gibraltar companies without an adequate evaluation to grant tax exemption (EC, 2017c, October 26). The EC has determined that state aid was provided and ordered recovery of the aid in six closed investigations involving APAs: Apple by Ireland (EC, 2016c), Starbucks by the Netherlands (EC, 2015b), Fiat Finance and Trade by Luxembourg (EC, 2015a), Amazon by Luxembourg (EC, 2017a), Engie (formerly GDF Suez) by Luxembourg (EC, 2018), and Belgian taxpayers under the Belgian “excess profit” tax ruling system (EC, 2016b).
The EC’s treatment of APAs as state aid has been labelled “aggressive” and “uncharted waters for lawyers, tax planners and multinational corporations” (Bobby, 2017:191). Moreover, since several of the cases have involved MNEs headquartered in the United States, the United States government has paid close attention to the EC state aid cases. In a 2016 white paper, the United States Treasury argued that the EC’s application of state aid law to APAs was new, departed from prior EU case law and EC decisions, was inconsistent with international norms, and was undermining the international tax system and the progress made under the BEPS (base erosion and profit shifting) project of the Organization for Economic Cooperation and Development (OECD) (U.S. Treasury, 2016).
We argue in this paper that the EU state aid cases are an example of the unintended consequences of a government policy developed to handle a problem in one realm that can spill over into another realm, particularly when the policy is misused or appears to have been misused in the first realm. The purpose of APAs is to reduce the likelihood of what in practice have been extraordinarily costly and protracted
11Transfer pricing and state aid: the unintended consequences of advance pricing agreements
disputes between MNEs and tax authorities. While APAs are used by taxpayers as tax planning tools, they are not designed to be instruments of tax minimization. Both taxpayers and tax authorities place a high value on the defined outcomes and tax certainty for the related party transactions covered in the agreement.
However, APAs are negotiated as one-on-one bargains between an MNE and a tax authority; as such, they can be misused to privilege one MNE relative to domestic firms and other MNEs. Moreover, even APAs that are wholly positive for both parties may give the appearance of misuse to outsiders because the agreements are negotiated in secret and little to no information is made publicly available. Thus, APAs may trigger “smell test” concerns by other governments, agencies and non-governmental organizations even when such concerns are unwarranted. For both reasons – abuse and perceived abuse – an APA can move over from the tax realm (where the APA is viewed as a beneficial policy that reduces MNE–state tax disputes) and into the – at least perceived – realm of competition policy (where the APA is viewed as a misused policy that inappropriately affects MNEs’ location decisions and competitive behaviors among rival firms).
The academic and professional literatures on state aid and income taxation are small but growing; see Bobby (2017); Cleary Gottlieb (2016); Evertsson (2017); Hrushko (2017); Liu (2018); Mason (2017a, 2017b, 2017c, 2017d, 2017e, 2018); Pellefigue and Finan (2018); Tavares, Bogenschneider and Pankiv (2016);
Table 1. EU Commission state aid cases by notifi cation date, as of July 2018
Member State
MNE/issueHome
country
Notifi cation date to
Member State
Date of decision
Case number
BelgiumExcess pro� t exemption in Belgium – Art. 185§2 b) CIR92
Various 07.11.2013 11.01.2016 SA.37667
Ireland Apple United States 21.02.2014 30.08.2016 SA.38373
Netherlands Starbucks United States 21.02.2014 21.10.2015 SA.38374
Luxembourg Fiat Italy 21.02.2014 21.10.2015 SA.38375
Luxembourg Amazon United States 20.06.2014 04.10.2017 SA.38944
Luxembourg McDonald’s United States 03.12.2015 In progress SA.38945
Luxembourg ENGIE (GDF Suez) France 19.09.2016 20.6.2018 SA.44888
United Kingdom
UK tax scheme for multinationals (Controlled Foreign Company rules)
Various 26.10.2017 In progress SA.44896
Netherlands Inter IKEA Sweden 18.12.2017 In progress SA.46470
Source: Assembled from information at http://ec.europa.eu/competition/state_aid/tax_rulings/index_en.html.
12 TRANSNATIONAL CORPORATIONS Volume 25, 2018, Number 2
Shaviro (2016), and Sporken and Cattel (2015). Our paper contributes to this literature by analyzing the unintended spillovers of APAs and recommending policy changes to reduce these spillovers.
2. APAs in international taxation
2.1. The arm’s length standard
For nearly 100 years now, source and residence rules formalized in bilateral tax treaties between countries have been used to determine jurisdiction and allocate the income tax base among countries (Byrnes and Cole, 2018; Eden, 1998, 2009). Since the mid-1960s, most countries have followed the OECD Model Income Tax Convention and adopted the separate accounting approach, treating MNE foreign subsidiaries as independent entities whose income is taxable in the host country up to the “water’s edge”. Home countries choose to tax either on a territorial base (so foreign-source income is not taxed) or a worldwide basis (normally taxing foreign-source income only when repatriated and providing foreign-tax credits for host-country income and withholding taxes).
Transfer pricing is the setting of prices for transactions between or among firms that are commonly controlled or related parties; that is, the pricing of related-party transactions (also known as controlled or non–arm’s length transactions) (Byrnes and Cole, 2018; Eden, 1998, 2016). Eden (1996, 1998, 2009, 2016) has argued that, from an institutional perspective, an international tax transfer pricing regime exists with its own principles, norms, rules and procedures. The regime is designed to lessen the transaction costs associated with MNEs’ cross-border capital and trade flows, reduce opportunistic behaviors that could lead to over- or under taxation of MNE income, and resolve disputes between MNEs and tax authorities.
The underlying principles of the regime (e.g., equity, efficiency, neutrality, and transparency) are supported by the regime’s core norm: the arm’s length standard (ALS). Under the separate accounting approach, transfer pricing rules are used to set prices and allocate the income from related-party transactions between tax jurisdictions. To prevent MNEs from engaging in transfer mispricing, governments have adopted the ALS as outlined in paragraph 1 of Article 9 in the various editions of the OECD Model Double Taxation Convention on Income and Capital (OECD, 1963, 1977, 2008, 2014):
[Where] conditions are made or imposed between the two [associated] enterprises in their commercial or financial relations which differ from those which would be made between independent enterprises, then any profits which would, but for those conditions, have accrued to one of the enterprises, but, by reason of those conditions, have not so accrued, may be included in the profits of that enterprise and taxed accordingly.
13Transfer pricing and state aid: the unintended consequences of advance pricing agreements
In 1979, the OECD began to issue guidelines to tax authorities and MNEs on how to set transfer pricing rules to implement Article 9. The Transfer Pricing Guidelines (TPG) was first issued in 1995 and has been updated several times. The TPG is now used by more than 60 countries as the basis for their transfer pricing regulations, although there are significant differences across countries both in the specific rules and in their application (Byrnes and Cole, 2018; Eden, 2009, 2016). There are also significant differences within the EU; all but two Member States (Cyprus and Malta) have transfer pricing regulations, but their sophistication varies significantly (EC, 2016e, Appendix 8).
While the OECD has historically been the key international organization at the heart of the international tax transfer pricing regime, the United Nations (UN) has also played an important role in building the regime, particularly for tax authorities in developing countries. The UN Model Double Taxation Convention between Developed and Developing Countries also includes an article (Art. 9) on “associated enterprises” with the same arm’s length test. In 2013, the United Nations published its first set of transfer pricing guidelines for developing-country tax authorities; the second edition was issued in 2017 (United Nations, 2013, 2017). Thus, both the OECD and the UN Model Tax Conventions, which are the basis for nearly all bilateral tax treaties worldwide, endorse the ALS.
In both sets of guidelines, implementation of the ALS requires the completion of a comparability analysis that involves four steps. First, the associated enterprises in the MNE group are treated as if they were operating as separate entities and their related-party transactions are identified. Second, any conditions (including prices) for these related-party transactions that differ from the conditions that would have been obtained in uncontrolled transactions are identified and assessed in terms of their materiality. Third, whether or not the accounts of the associated enterprises need to be rewritten to ensure that the tax liabilities of the associated enterprises adhere to Model Tax Convention Article 9 is determined. Last, the profits and tax liabilities that the associated enterprises would have accrued had the conditions been obtained in uncontrolled transactions (in other words, had they been independent entities and accrued their true taxable income) are calculated.
There are five main transfer pricing methods: comparable uncontrolled price (CUP), resale price method, cost plus method, transactional net margin method, and profit split method (PSM). The first three methods are typically regarded as more direct applications of the ALS than the last two methods. The most appropriate method must be selected for each related-party transaction. When selecting the most appropriate method, these factors must be considered: the relative strengths and weaknesses of the various methods; the appropriateness of the method to the nature of the controlled transaction as determined by a functional analysis; the availability of reliable information (especially on the uncontrolled comparables) needed for the method; and the degree of comparability between the controlled and uncontrolled
14 TRANSNATIONAL CORPORATIONS Volume 25, 2018, Number 2
transactions, including the reliability of any comparability adjustments that are needed to eliminate material differences between them. Last, because transfer pricing is not an exact science, there may be a range of equally reliable prices (the arm’s length range) that can result from the application of a transfer pricing method.
2.2. Dispute settlement mechanisms
The tax transfer pricing regime has procedures by which tax authorities can settle disputes and enforce compliance with MNEs. Domestic procedures are similar across OECD member countries; for example, there are procedures for auditing MNEs, handling tax appeals, and fighting disputes in tax court. Almost all of these procedures happen behind closed doors in negotiations between the MNE and one or more tax authorities. The negotiations can take place over 10 or more years, starting with the first audit of the MNE’s financial statements and running through one or more tax court decisions if either party decides to appeal the court decision. Only at the tax court stage – after the judge has rendered a published decision – is any information typically made publicly available, and that information is heavily redacted. Thus, with the exception of court trials, none of the domestic tax procedures make their results available to the public.
2.3. Advance pricing agreements
Partly owing to problems with ex post dispute settlement procedures, many MNEs have turned to APAs to reduce their tax risk (Eden, 1998: 469-76; Markham, 2012). The APA is designed as an ex ante dispute settlement mechanism negotiated before the related-party transactions take place although, in practice, APAs may cover related-party transactions in prior years as well as in future years. The APA allows the MNE and its tax authority to reach an agreement ahead of time on a mutually acceptable transfer pricing method, which is then applied to determine taxable income in that jurisdiction for some years in the future (DiSangro, Langdon, and Wongsrikasem, 2012).
The APA process typically works as follows. An MNE (the “taxpayer”) starts the APA process by requesting an APA from its tax authority (at the “pre-filing” stage). There may be several pre-filing meetings before the two parties decide whether to pursue an APA, and either party can withdraw from the process. If the tax authority decides to approve the application, the process moves into the “due diligence” stage. The taxpayer completes a detailed APA application. If the application is approved, the taxpayer and the APA team within the tax authority work together to develop a transfer pricing policy that is mutually agreeable. The tax authority reviews the materials submitted by the taxpayer, undertakes site visits, and can request additional materials or meetings. The APA team also completes its own functional
15Transfer pricing and state aid: the unintended consequences of advance pricing agreements
analysis and comparables searches, ending with a formal position paper that accepts or recommends modifications to the MNE’s proposed transfer pricing policy.
The last stage is the documentation and signing of a binding contract between the MNE and the tax authority where the tax authority agrees not to seek a transfer pricing adjustment for a covered transaction as long as the taxpayer files its tax return for a covered year showing results (taxable income) consistent with the agreed-upon transfer pricing results. The actual agreement signed by the parties typically consists of three elements: (1) an agreement on the relevant facts and circumstances, (2) the transfer pricing method to be used, and (3) application of the method to determine an arm’s length range of results. The APA covers identified transactions for a specified number of years, and the MNE’s transfer prices over the life of the APA are expected to fall within the agreed-upon range of results.
The APA policy was first developed and introduced in the United States as IRS Revenue Procedure 91-22 in 1991, and since then has spread to more than 30 countries (EY, 2017). In 2012, only 390 APAs were in force within the EU; by 2015 the number of APAs had quadrupled to 1,252 and at the end of 2016 had nearly doubled again, to 2,053 (Ryding, 2018). The EU countries with the most extensive use of APAs in 2016, according to Ryding (2018), were Belgium (1095) and Luxembourg (599). The EU Joint Transfer Pricing Forum (2016) noted that Luxembourg had 599 APAs in place and in 2015 received 163 requests, granting 145. In the same year, the Netherlands received 261 requests and granted 236 APAs, having taken on average two years to complete each APA process. Belgium had received 522 APA requests and granted 602 APAs, having taken on average eight months, and had 1,105 APAs already in place as of 2015.
These numbers, however, represent only a very small percentage of MNE taxpayers. Estimates suggest that there are only 400 or so APAs in the United States, involving less than 4 percent of the more than 11,000 MNEs with U.S. parents and foreign affiliated entities (Stark, 2011). In addition, some MNEs will have multiple APAs addressing different product lines or entities, further reducing the percentage. Thus, APAs are rare, even in the United States, the country with the longest history and experience with this process. Part of the reason for the rarity of APAs are the large upfront costs involved for the MNE in terms of time, resources, and financial commitments (Markham, 2012). In addition, the MNE must “open the kimono” by providing large amounts of confidential information to the tax authority. Thus, the APA process has been requested primarily by large MNEs, often ones that are already in the tax appeal stage.
There are cases in which two tax authorities have negotiated a bilateral APA with an MNE that has operations in both jurisdictions. Bilateral or trilateral APAs are rare; for example, in 2016, there were 1,539 (EU) and 723 (non-EU) APAs in force in EU Member States (EU Joint Transfer Pricing Forum (2018). Of these 2,262 APAs, there
16 TRANSNATIONAL CORPORATIONS Volume 25, 2018, Number 2
were 89 (EU) and 123 (non-EU) bilateral or trilateral APAs. Since the EU agreements involve at least two EU governments, the actual number is smaller than the 212 APAs reported. The small number is clearly due to the time and effort involved in three-party bargaining over the facts and circumstances, the most appropriate transfer pricing method, and the arm’s length range of taxable results for the MNE in both jurisdictions.
In sum, although APAs may suffer from a variety of flaws, national tax authorities use them as a policy to improve the business environment for foreign direct investment (FDI) by providing greater tax certainty for MNEs. In the tax realm, APAs are viewed as an effective ex ante dispute settlement mechanism that can offer significant benefits to both parties. While APAs are negotiated in secret and no information is made publicly available, this is also true for other tax dispute settlement procedures with the limited exception of tax court decisions.
We turn now to the second realm: state aid as a component of competition policy.
3. The EU state aid policy
3.1. Goal congruence in two-tier government systems
In a two-tier system of government, state aid is defined as any form of aid granted by a lower-tier government or through the low-tier government’s resources that, by favoring certain firms or types of activities, distorts or threatens to distort competition among firms within the upper-tier government’s jurisdiction. A major concern behind a state aid policy is that firms receiving aid from a government can be induced to locate in specific sub-jurisdictions (e.g., inward FDI) or can use the funds to engage in aggressive competitive behaviors against rival firms. A state policy is designed to prevent lower-tier governments from engaging in location subsidy races, favoring “local champions”, or otherwise distorting competition among firms within national borders.
State aid cases, given their construction (i.e., an upper-tier government regulating the polices of its lower-tier governments), are found typically in institutions such as preferential trading agreements (e.g., NAFTA, Mercosur, the EU) or two-tier federal systems with national and state, provincial, or local governments. In such institutions, to achieve the goals of the upper-tier government or agency throughout its jurisdiction, the upper-tier authority must ensure goal congruence across the lower-tier governments, typically by using a system of penalties and/or rewards. Two-tier federal systems of government and customs unions normally include a state aid policy to ensure a level playing field for all firms, regardless of their geographic location in the jurisdiction of the upper-tier government.
17Transfer pricing and state aid: the unintended consequences of advance pricing agreements
3.2. TFEU article 7(1)
A state aid policy has been a major pillar of EU competition policy dating back to the EEC Treaty of 1957, which prohibited any aid that distorted or threatened to distort competition insofar as it affected trade between Member States. State aid is an upper-tier (EU) policy, not a lower-tier (Member State) policy, which is designed to prevent Member States from offering aid to firms and activities (“undertakings”) that could negatively affect the EU internal market. The EU’s official policy on state aid appears as Article 107 in the Treaty on the Functioning of the EU (TFEU), in which the first paragraph states that (EU, 2008):
Save as otherwise provided in this Treaty, any aid granted by a Member State or through State resources in any form whatsoever which distorts or threatens to distort competition by favouring certain undertakings or the production of certain goods shall, in so far as it affects trade between Member States, be incompatible with the common market.
TFEU Article 107(1) provides for a general prohibition of any aid granted by an EU Member State where the aid meets all four of the following conditions:
1. Funded directly or indirectly by a Member State or through its resources;
2. Favors specific undertakings or the production of certain goods (i.e., provided on a selective basis or has a selective character, as opposed to general measures that apply equally to all market participants in comparable circumstances);
3. Confers an advantage that could not (or not on the same terms) have been obtained from private market participants; and
4. Distorts or threatens to distort competition and affects trade between Member States.
Article 107(1) encompasses any form of government aid including direct grants or subsidies by the state to a firm; loans or guarantees by the state to a firm at below-market interest rates (e.g., capital injections or recovery of debt); purchase by the state of goods or services at above-market prices; sale of state assets at below market value (e.g., privatization) or state purchase of private assets at above market value; and reduction in the tax rate or tax preferences provided by the state to a firm.
3.3. Exceptions to TFEU article 107(1)
There are five exceptions to Article 107(1), and some have been important in the recent state aid cases. The exceptions, which appear in TFEU Articles 107(2,3), are as follows:
• Aid that meets the private market test: If a Member State intervenes on terms that would be acceptable to a private sector operator, the measure does not confer an advantage and is not state aid.
18 TRANSNATIONAL CORPORATIONS Volume 25, 2018, Number 2
• De Minimus Rule: Financial aid provided by a Member State to a private sector operator that is below €200,000 over three years is deemed to be too small to be state aid.
• Compatible Aid: Aid by a Member State that is of a social character, is provided to repair damage from natural disasters or in exceptional circumstances or is in the form of competition for the amalgamation of East Germany and West Germany, is not state aid. [TFEU Article 107(2)]
• Aid that Meets the Balancing Test: Aid that is designed to promote the development of less developed regions or certain activities (e.g. culture, heritage conservations) where the aid contributes to common interest is not state aid. [TFEU Article 107(3)]
• Aid that Is Not Selective: If no advantage is conferred on a selective basis – either there is no advantage, or the advantage applies to all firms – it is not state aid.
3.4. Selectivity and advantage
When a government provides a firm with a direct subsidy, it is relatively easy to determine whether or not the subsidy qualifies as state aid. The determination is based on two factors: (i) whether an advantage has been granted (i.e., does the subsidy have the potential to distort competition within the country’s borders) and (ii) whether the advantage is selective (i.e., is the advantage restricted to one or more particular firms or activities). The advantage needs to be both selective and liable to distort the level playing field in an internal market between certain underta-kings and their competitors in order to be classified as state aid.
This perspective follows from the wording of TFEU Article 107: “The measure must be specific or selective in that it favors certain undertakings or the production of certain goods”. Mason (2017a: 646) defines selectivity with respect to state aid cases as, “A measure is selective if it is not available on the same terms to every similarly situated undertaking”. Thus, selectivity involves discrimination.
The requirements of “advantage” and “selectivity” are also intertwined. The EC’s opinion is that no advantage can be deemed to exist if all firms that find themselves in a legally and factually comparable situation have access to and can benefit from the same treatment. Measures that are de facto available to all firms in the same legal and factual circumstances in a Member State are considered general measures and for that reason do not constitute state aid. As long as the state “held the enterprise at arm’s length” the state has not taken an action “that independent operators would not have taken” and thus the policy is not considered to be selective (Mason, 2018: 772).
19Transfer pricing and state aid: the unintended consequences of advance pricing agreements
For the purpose of assessing selectivity, the European Court of Justice (ECJ) has drawn a distinction between general schemes and individual aid measures, arguing that “the selectivity requirement differs depending on whether the measure in question is envisaged as a general scheme of aid or as individual aid”. For an individual aid scheme, “the identification of the economic advantage is, in principle, sufficient to support the presumption that it is selective”. (ECJ, 2015a: 60). The assessment of the selectivity criterion follows the outcome of the assessment regarding the existence of an advantage.
Note that whether the state’s goal or intention was to grant an advantage to an undertaking is irrelevant; what matters is whether the advantage has the potential to negatively affect competition within the country. For example, in France Telecom v. European Commission, the ECJ notes that “the nature of the objectives pursued by State measures and their grounds for justification have no bearing whatsoever on whether such measures are to be classified as State aid”; what matters is not causes or objectives but rather effects (ECJ, 2011, paragraph 17).
In addition, there is no requirement to demonstrate that competition has been negatively affected in practice; all that is required is to demonstrate that the potential exists for this to happen. Thus, the criterion of selectivity, in practice, has turned out to be more important than the criterion of conferring an advantage. As noted by the ECJ, “In matters of tax law…the decisive criterion is whether a provision is selective, because the other conditions laid down in Article 107(1) are almost always satisfied” (ECJ, 2015b, paragraph 114). The EC does not have to prove that the aid is actually distorting competition or having any real impact on trade flows, all that is needed is the possibility that it might in future have such an impact. Neither does the firm or activity have to be involved in cross-border trade; all that is needed is the possibility that in future it might be so. Thus, selectivity has become the key criterion in EU state aid cases.
3.5. The state aid policy process
The EC’s Directorate General for Competition has the responsibility to enforce the EU state aid policy. The EC has broad investigation and enforcement discretion (Mason, 2017a).
In terms of the policy process, Member States are required to report any new aid measure to the EC and must wait, with a few exceptions, for the results of a preliminary investigation by the Commission before instituting the policy (EC, 2013). Any aid that is granted without prior authorization from the EC is automatically considered by the EC to be unlawful state aid. A preliminary finding by the EC that aid has been misused triggers a formal investigation procedure under Article 108(2) of the TFEU. Formal investigations can also be triggered by third-party complaints
20 TRANSNATIONAL CORPORATIONS Volume 25, 2018, Number 2
or by the EC’s own investigations. The investigation process has no formal time limits so could go on for several years.
The EC can make a positive (no aid or compatible aid), negative (aid) or conditional (qualifies as aid/not aid if…) decision. If the decision is negative, the Member State must recover the aid from the firm that received the aid, with interest, for aid that has already been given. All decisions and procedures of the EC are subject to review by the EU General Court and can also be appealed by the Member State to the ECJ. If the Member State does not comply with the decision, the EC may refer the case to the ECJ also.
4. The unintended consequences of APAs: APAs as state aid
Having explored the role of APAs as an ex ante dispute settlement mechanism in the international taxation realm, and the role of state aid in the EU’s competition policy realm, we now bring the two together to analyze the unintended consequences of APAs. How and why did APAs move from a positively viewed component of international tax policy to a negatively viewed (or at least viewed with suspicion) component of competition policy?
4.1. Are income taxes a presumptive form of state aid?
Although Article 107(1) was written with subsidies in mind, for many years the policy has been understood to also include income taxes as a possible form of state aid. Since the early 1960s the ECJ has defined state aid as including any charges that are similar in character and effect to a subsidy (see cases cited in footnote 3, Federal Ministry of Finance, 2017: 9). Thus, both financial (e.g., subsidies) and fiscal (e.g., tax benefits) measures can be characterized as state aid. Tax benefits can provide an advantage because “the loss of tax revenue is equivalent to consumption of State resources in the form of fiscal expenditure”. (EC, 1998: paragraph 10).
The EC has argued that any tax measure that reduces a firm’s tax burden can potentially be a form of state aid, including a reduction in the tax base (e.g., special deductions), total or partial reduction in tax (e.g., tax credits or exemptions) or deferment, and cancelation or rescheduling of tax debt. In order for tax measures to not potentially qualify as state aid, “they must be effectively open to all firms on an equal access basis, and they may not be de facto reduced in scope through, for example, the discretionary power of the State to grant them or through other factors that restrict their practical effect” (EC, 1998: paragraph 13).
Within the EU, Member States have sovereignty (jurisdiction) over direct taxation (e.g., income taxes), but their sovereignty is conditional on two factors: (i) positive integration (abiding by EC Directives) and (ii) respect for the TFEU (non-discrimination
21Transfer pricing and state aid: the unintended consequences of advance pricing agreements
and list of freedoms). Therefore, any form of state income tax or tax preference that (i) can distort or threaten to distort competition and affect trade within the EU and (ii) is of a selective character, is in violation of TFEU Article 107(1). As a result, corporate income tax policies of EU Member States (lower-tier EU governments) can fall within the EC’s jurisdiction and thus within the purview of the EU upper-tier government.
As outlined earlier, whether or not a government policy qualifies as state aid under TFEU Article 107(1) requires consideration of two factors: (i) whether an advantage has been granted (i.e., whether the subsidy has the potential to distort competition within the country’s borders) and (ii) whether the advantage is selective (i.e., whether the advantage is restricted to one or more particular firms or activities). In practice, selectivity, not advantage, has become the key factor in state aid cases.
As Mason (2017a, 2018) points out, selectivity is much more difficult to determine in tax cases because only governments levy taxes; there is no organization equivalent to the state that acts an “independent market operator”. The market baseline for comparison – what an independent firm or organization would have done under the same facts and circumstances – is not available.
The EC’s response to income tax cases has been therefore to use the benchmark of the Member State’s ordinary income tax rules, following a three-step analysis to determine whether a particular tax measure is selective (EC, 2016a). First, the common or normal tax regime applicable in the Member State is identified (the so-called “reference system”). This involves consideration of items such as the tax base, the tax rates, and so on. Second, the EC must determine whether the tax measure in question constitutes a derogation from the reference system; that is, whether the tax benefit differentiates between firms that are, relative to the tax system’s objectives, in a comparable factual and legal situation. If the measure does constitute a derogation from the reference tax system, the third step is for the EC to determine whether the measure can qualify as an exemption under Article (107(2,3); for example, if the policy is based on the basic or guiding principles of the tax system and so not considered to be selective.
For income taxes, determining the answers to these questions is not as easy, and appearances can be deceiving. Consider, for example, a six-month holiday that is open to all firms as long as they meet a specific set of criteria. Waiving enforcement of a legally assessed tax by offering a tax holiday should not distort competition within the country’s borders as long as the tax benefit applies to all firms. However, the tax holiday may be deemed to be selective if the requirements can be met by only a small subset of firms; for example, when there are multiple criteria or one of them is so restrictive it can be met by only a few firms. In this situation, the tax benefit is de jure (on paper) universal but de facto (in practice) selective and is therefore classified as state aid.
22 TRANSNATIONAL CORPORATIONS Volume 25, 2018, Number 2
Moreover, the ECJ stated in France Telecom v. European Commission (Case C-81/10 P, France Telecom, ECU: EU: CD: 8 December 2011: 811, paragraphs 16-18) that identifying an advantage depends on what the normal tax regime is applicable to comparable undertakings (firms or activities). If a derogation from the normal tax regime creates a tax saving when compared with the tax owed under the normal tax regime, the tax differential can be considered as a selective benefit to that undertaking. If that selective benefit also constitutes an advantage, the two components together imply that the derogation qualifies as state aid, which the ECJ found in the 2011 France Telecom case (ECJ, 2011). In a contrary decision (Autogrill España v. European Commission; ECJ, 2014), the ECJ found that even if a tax policy was a derogation from the normal tax regime, the tax differential would not necessarily be a selective benefit, and thus found against the EC.
The lesson from the France Telecom and Autogrill España cases is that declaring that a tax policy is state aid involves determining (i) the income tax that would be paid under the normal tax regime, (ii) the tax difference due to the derogation from the regime, and (iii) whether the difference is both selective and confer an advantage to an undertaking. This first requires a determination of what is a “normal” tax regime for an undertaking in a country at a point in time, which is inherently difficult given the complexity of modern tax codes. Moreover, there are large differences in tax systems across countries and within countries (e.g., differences in tax rates and bases by activity, size, and type of firm).
Mason (2018) argues that the determination of the reference tax base has been the most problematic and controversial aspect of the EC’s APA cases. Changing the baseline reference system automatically changes the calculation and size of the tax differential, which is a key component in determining selectivity. In any Member State, there can be several possible benchmarks depending on whether only domestic income is included or whether foreign source income is included or exempted. Adding in the differences across EU Member States in their taxation of domestic- and foreign-source income in terms of bases, rates, credits, and deductions, it is not surprising that there have been legal appeals challenging the EC’s benchmark calculations. Moreover, as any state aid that has been prohibited under EU law must be paid back retroactively for ten years with interest, a considerable amount of financial risk can be created for EU taxpayers.
In sum, the answer is yes, income taxes can be a presumptive form of state aid because they can both be selective and confer an advantage. The problem is one of determining the amount of selectivity and advantage, which is difficult because the benchmark standard typically used in subsidy cases – the market test – is harder to implement when a tax benefit is the offending policy. Additional complications are created when the taxpayer is an MNE, which we address in the next section.
23Transfer pricing and state aid: the unintended consequences of advance pricing agreements
4.2. Are APAs a presumptive form of state aid?
The EC has sent EU tax authorities mixed signals about the desirability of APAs as a tax dispute settlement mechanism. On the one hand, the EC has encouraged Member States to use APAs and advance rulings as ex ante tax procedures to reduce the likelihood of MNE–state transfer pricing disputes. For example, EC (2001: 355) argues that “Member States clearly should be encouraged to provide the possibility for businesses to obtain under reasonable conditions an APA in important transfer pricing cases” because APAs effectively address the inherent uncertainty relating to the application of transfer pricing rules and methodologies. EC (2007) discusses in detail the advantages and disadvantages of APAs and how an APA program should best be established by EU Member States. Nowhere in the document is state aid mentioned as a possible problem. EC (2016a: 169) also states that APAs are an efficient tool for dispute settlement, with valuable advantages for tax administrations and taxpayers.
On the other hand, the EC has noted that APAs are almost presumptively state aid because they are opaque and flexible. Moreover, any tax benefit that is specific to an individual firm or activity can potentially be state aid if viewed by the EC as conferring an advantage. EC (1998: 22) notes specifically that, “Every decision of the administration that departs from the general tax rules to the benefit of individual undertakings in principle leads to a presumption of State aid…”. If administrative rulings “merely contain an interpretation of general rules”, they do not generate a presumption of state aid; however, given the “opacity of the decisions taken by the authorities and the room for manoeuvre which they sometimes enjoy”, a presumption of state aid is well founded.
To qualify as illegal state aid, a policy must both be selective and provide an advantage that has the potential to distort competition and trade. APAs are clearly selective policies. Whereas all MNEs have the right to apply for an APA, in practice, the number of MNEs that both seek and receive an APA is very small. Moreover, APAs are negotiated behind closed doors and not made public, so there is more room for the MNE and State to engage in bargaining that leads to “special arrangements”. Even if the APA is a straightforward application of an existing transfer pricing methodology, the perception by outsiders is likely to be that the APA is a bilateral secret bargain that does not pass the “smell test”.
The EC has extracted several indicia for selectivity from its analysis of the six state aid investigations concluded to date. A first indicator is the duration of the APA. An open-ended (indefinite) duration of the APA triggers doubts as to the appropriateness of the agreed transfer pricing arrangement for later years because market conditions may change over time. According to the EC, the method accepted by the tax authorities should consider changes, if any, in the economic environment and/or in the remuneration levels required, which may occur in the
24 TRANSNATIONAL CORPORATIONS Volume 25, 2018, Number 2
years following the ruling application. In the EC’s view, an agreement between a tax authority and a taxpayer that has no end date makes less accurate any predictions as to future conditions on which that agreement is based, thereby casting doubt on the reliability of the method endorsed by that APA (EC, 2016c: 364).
The EC’s assessment of selectivity and advantage in an APA also depends on the transfer pricing methodology and arm’s length results that are the “heart” of the APA (EC, 2016d: 12). In state aid cases involving APAs, the EC refers to the TPG when determining whether transfer prices for tax purposes conform with the ALS (EC, 2017a: 64). If the EC concludes that the transfer pricing method in the APA deviates from the TPG specifically for the purpose of lowering the tax base of the applicant, the EC can use this conclusion as evidence of selectivity and advantage. In particular, the EC has raised doubts regarding the appropriateness of the Mem-ber State’s choice of a transfer pricing method or pointed out the existence of al-leged inconsistencies in the practical application of the method (Byrnes, 2016a, b).
EC (2017a: 64) states that whenever the application of the transfer pricing methodology in an APA follows the TPG, the APA itself does not amount to state aid under TFEU Article 107(1). However, the EC has also stated that the use of the most appropriate transfer pricing method does not rule out per se the existence of a state aid. The choice of method and the parameters that support its application must still be tested against the “market-based outcome” standard. EC (2016d) pointed out that the approximate nature of the ALS cannot be used to justify a transfer pricing analysis that is either methodologically inconsistent or based on an inadequate comparables selection. The EC has acknowledged that there are cases in which finding a market outcome is not straightforward and requires the use of an approximation. This is not a concern as such, as long as the approximation is as precise as it can be under the circumstances. In other words, the “search for a ‘reliable approximation of a market-based outcome’ means that any deviation from the best estimate of a market-based outcome must be limited and proportionate to the uncertainty inherent in the transfer pricing method chosen or the statistical tools employed for that approximation exercise” (EC, 2016a: 171).
EC (2016e) has also made the point that rulings based on a two-sided approach (e.g., CUP and PSM) are less likely to deviate from a market outcome. The EC approves of PSM because all sides of the transaction are allocated a share of the overall profit in a consistent manner and all jurisdictions involved divide the full amount of profits between the related parties. In support of this position, the EC (2016a, paragraph 173) cited the 2006 ECJ case Belgium and Forum 187 v. Commission (ECJ, 2006). The EC’s preference for two-sided transfer pricing methods, in particular for the profit split method, rather than the transactional net margin method (or its United States cousin, the comparable profits method) has been of particular concern to the United States Treasury because the method is regularly used in the United States (U.S. Treasury, 2016).
25Transfer pricing and state aid: the unintended consequences of advance pricing agreements
In sum, are APAs a presumptive form of state aid? The purpose of an APA is to clarify an MNE’s tax payments in the future, providing the firm with greater certainty and less likelihood of a tax dispute. As such, an APA does provide an MNE with a lower tax risk relative to MNEs that do not have an APA. Whether this advantage distorts competition and affects trade patterns is not clear, but the EU state aid policy requires only that the tax benefit could affect competition and trade, a much lower hurdle. In sum, APAs have the potential both to be selective and to provide an advantage. Thus, they are “fair game” for EC investigations, and in hindsight, it should not have been surprising to MNEs and EU tax authorities that APAs had the potential for unintended consequences in the competition policy arena. The two implicit “smell tests” identified in EC (1998) – opacity of the ruling and the state’s room for manoeuvre (flexibility) – both raise the likelihood of an investigation.
5. Policy recommendations to reduce the unintended consequences of APAs
We have argued earlier that the EC’s investigations into the use of APAs by Member States as a form of state aid should have been expected. Although the EC’s activities may have been “aggressive” and the linkages between APAs and state aid “uncharted waters”, it is nonetheless the case that government policies can and do have unintended consequences. Policies developed for one arena tend to have spillover effects in other arenas that generate second-round policy responses. In this section, we make some policy recommendations designed to reduce the unintended consequences of APAs. We look first at the APA process in the international taxation realm and then at the APA process in the state aid realm.
5.1. APA policy recommendations
APAs were developed as an ex ante dispute settlement mechanism and have been very successful in this role. However, the nature of the process – “under the table”, one-on-one bargains between an MNE and a tax authority – by their very nature lend themselves to bargaining models and opportunistic behaviors. In a world where governments are interested in creating domestic employment and attracting inward FDI, particularly in strategic or high-value industries, fiscal incentives such as tax rebates are an easy policy tool. Their lack of visibility also makes them attractive to both MNEs and governments. Thus, selectivity and advantage are two of the benefits that MNEs seek when negotiating an APA, and tax authorities are aware that the APA process can have that effect for firms. What, then, can be done if tax authorities want to continue using APAs as a dispute settlement mechanism but want to lessen the risk that the policy will be ruled to be illegal state aid?
Our first recommendation is perhaps the most radical but at the same time the most obvious: more “light” is needed in the “dark corners”. At present, only a few
26 TRANSNATIONAL CORPORATIONS Volume 25, 2018, Number 2
countries publish summary statistics on their APAs. We recommend that stylized information on individual APAs, with the names of the parties involved removed, be made publicly available in the same way that the 24-hour global trading APAs in the United States were made public in the 1990s (Eden, 1998, 2016). Tax authorities should publish “best practice” templates based on actual APA settlements, which can be suitably disguised to protect the given firm’s key information. Tax authorities should also publish stylized case studies as best-practice templates that are made available on the tax authority website where they could be analyzed and adopted by other tax authorities and MNEs. Although it is important at the same time to protect commercial secrets, greater transparency should improve the overall process and make APAs less likely to fall afoul of state aid regulations. We recognize that the cost may be that fewer MNEs are willing to apply for an APA, fearing the loss of confidentiality for key information such as trade secrets. More public information about APAs, however, should also deter their misuse.
Our second recommendation is that bilateral APAs where two or more tax authorities develop and agree to a transfer pricing arrangement involving one MNE should be encouraged where possible. Bilateral APAs mean more governments are at the table and involved in the bargaining process. The Commission itself has made this point, arguing in EC (2016d) that a bilateral APA is preferable to a unilateral APA, and that having two governments at the table should trigger less room for state aid.
While bilateral APAs do offer benefits, it is important to note that not all tax authorities have the same experience, training and resources to process and negotiate an APA. Moreover, negotiating a bilateral APA adds significantly to the resources needed and time involved relative to a unilateral APA. Collusion between two parties against the third party (e.g., the two tax authorities against the MNE) may also create problematic bargains. Still, where both tax authorities have experience with APAs the bilateral approach should reduce the risk of a state aid case. This includes situations where one of the tax authorities is in a developing country; several developing countries (e.g., China and India) now have experience with bilateral APAs.
Our third recommendation is that tax authorities need to develop clear internal documentation of their APA negotiations, methodologies, and outcomes. The TPG (OECD, 2017) provides detailed instructions on best practices for APAs; these best practices should be adopted and followed by EU Member States. This also involves the administrative level in terms of training tax auditors, economists, and lawyers in the tax authority on how to develop, implement and monitor APAs. Capacity building in the tax authority and better documentation should reduce the likelihood of the EC finding errors in an EU Member State’s APA process.
Our fourth recommendation is that tax authorities should improve and make better use of the two other main types of international dispute settlement procedures,
27Transfer pricing and state aid: the unintended consequences of advance pricing agreements
the mutual agreement procedure (MAP) and the binding arbitration process, and the way they interact with the APA process (Byrnes and Cole, 2018; Eden, 1998; Markham, 2012, 2017). The MAP and binding arbitration are ex post dispute settlement mechanisms available only to countries that have signed a bilateral tax treaty. The need for APAs would be reduced if alternative dispute settlement mechanisms were more effective; in addition, negative spillovers from APAs to the MAP and binding arbitration processes should be reduced. It is important to note also that both the MAP and binding arbitration processes are also conducted in secret with little public information.
Under the MAP, designated representatives (“competent authorities”) come together to settle a tax dispute involving an MNE located in both jurisdictions. Markham (2017) argues that the MAP process has been problematic in practice. Because the MAP only requires the two tax authorities to “endeavor” to reach a settlement, approximately one in 10 MAP cases do not settle (and so the MNE is double taxed) and the cases that do settle take on average nearly two years. In addition, the backlog of unresolved MAP cases is large and growing.
Within the EU, EU law supersedes the domestic laws of EU Member States; as a result, EU law typically trumps bilateral tax treaties negotiated between a Member State and another country (Long and Erwin, 2016). A fourth actor – the EC – in addition to the three main actors (the two tax authorities and the MNE) is thus inserted into the MAP. This creates two problems. First, bargains hammered out between tax authorities through the MAP can be overturned by an EC ruling that the transfer pricing policy constituted state aid and must be recovered by the Member State (U.S. Treasury, 2016). Second, if a foreign MNE pays the assessed back taxes plus interest to the EU Member State, the collection process raises the issue of whether the taxes can generate foreign tax credits in the home-country jurisdiction. Moreover, in some home countries (e.g., the United States) all legal remedies including appeals must have been exhausted before foreign tax credits can be paid, so that the process can take years (Long and Erwin, 2016).
Binding arbitration is a relatively new dispute settlement mechanism (Eden, 1998; Markham, 2017). Strong arguments for a binding arbitration process to handle transfer pricing disputes have been made for many years (Shoup, 1985). In 1990, the EU Arbitration Convention was adopted and ratified by the 12 Member States in 1994 (Eden, 1998: 632). Binding arbitration was also included in the 1995 Canada–United States bilateral tax treaty protocol (Eden, 1996: 82). However, it was not until 2008 that the OECD added binding arbitration to the OECD Model Tax Convention and 2011 before binding arbitration was added to the UN Model Tax Convention. Markham (2017: 169) provides a useful overview of the international diffusion of the binding arbitration procedure, concluding that “few countries have embraced mandatory binding arbitration”, which she views as “a disappointing outcome”.
28 TRANSNATIONAL CORPORATIONS Volume 25, 2018, Number 2
The situation for the MAP and binding arbitration may be improving. In November 2016, more than 100 countries concluded negotiations on a multilateral convention to prevent BEPS. Part VI of the Convention (OECD, 2016) contains detailed regulations on mandatory binding arbitration in Articles 18-26. As of 23 July 2018, the Convention has been signed by 83 countries and nine countries have ratified it (OECD, 2018b). The EU has also adopted new legislation designed to improve both the MAP and the Arbitration Convention procedures for tax disputes among EU Member States (EU, 2017). A last example of the improving situation for dispute settlement procedures is the new OECD International Compliance Assurance Programme (ICAP) pilot, launched in January 2018 by eight tax authorities, which is designed to share information among tax authorities (OECD, 2018a).
5.2. State aid policy recommendations
As all APAs involve related party transactions and the selection of a transfer pricing methodology to determine taxable income and taxes paid to a tax authority, determining selectivity and advantage in state aid cases where APAs are involved is clearly a highly complex endeavor. The EC’s interpretation of the ALS in state aid cases involving APAs has been viewed as confusing and lacking clarity (Mason, 2018). Reading the EC and ECJ decisions on state aid involving APAs (e.g., Starbucks, Apple, and Amazon) confirms this opinion.
In our view, the appropriate methodology for the comparison is as follows. First, the related party transaction must be tested against what independent enterprises would have done under the same facts and circumstances had the independent enterprises received the same tax benefit. This test must be done in terms of pre-tax operating income, not after-tax income, as required in transfer pricing comparability analyses. Second, the result must then be compared with the counterfactual of no tax benefit (the reference tax system) for independent enterprises.
In other words, the process involves two steps or stages (see Figure 1). One stage is based on the ALS, which compares the results of the related party transaction with the results of transactions undertaken (or that would have been undertaken) by independent entities operating under the same facts and circumstances as the related parties. In this step we determine whether the two related parties are at arm’s length from one another by conducting a comparability analysis between the controlled transaction and the reference transaction in terms of their pre-tax operating incomes. If a material difference is identified, we make an adjustment that in effect puts the controlled transaction “in the shoes” of the reference transaction.
The second stage is the selectivity test in state aid cases that compares the results of the hypothetical transaction by an independent entity (the results of the first stage) with the tax benefit and the results of transactions undertaken (or that would
29Transfer pricing and state aid: the unintended consequences of advance pricing agreements
have been undertaken) by independent entities operating under the reference tax system without the tax benefit. In this step we determine whether the tax authority is at arm’s length from the MNE by conducting a comparability analysis between the tax benefit system and the reference tax system. The second step follows the EC’s normal practice of determining selectivity and advantage when comparing two unrelated parties, where one has received a tax benefit and the other has not.
Completion of both arm’s length tests – valuing the transaction between the two related entities in the MNE (stage 1) and valuing the tax benefit between the state and the taxpayer (stage 2) ensures that both the ALS and the selectivity test have been appropriately applied.
Implicit in the above is a hidden question: whether the comparability analysis for ensuring the ALS is met with respect to transfer pricing (stage 1) should be done with the Member State’s own transfer pricing regulations or with the EC’s interpretation, and, if the latter, whether the EC should use the government’s transfer pricing rules or the TPG.
There are some reasons to argue for the upper-tier government being the final authority and for using the TPG rather than the Member State’s regulations. First, not all EU Member States have formal transfer pricing regulations and their quality (both in terms of regulation and enforcement) varies significantly, particularly in the context of related party transactions that are difficult to value, for example, those involving intangible assets as documented in EC (2016e). Moreover, the less detailed and more opaque the country’s transfer pricing regulations are, the greater the likelihood that the regulations can be misused or misinterpreted by the tax authority. Third, the incentives to use transfer mispricing through APAs is likely greatest for those governments attempting to attract inward FDI, which is exactly the motivation behind the EU state aid policy. The TPG also is generally accepted by almost all tax authorities worldwide, not only in EU Member States.
Yet, there are also good reasons to argue that the authority should rest with the lower-tier governments, not the EC, and that Member States should be able to use their own transfer pricing regulations, not the TPG. The principles of subsidiarity and sovereignty are strong arguments for the lower-tier government’s transfer pricing regulations being the determining factor on the grounds that “EU Member States have a sovereign right to determine their own fiscal policies and tax regulations” (Hrushko, 2017: 328). Also, transfer pricing regulations have the force of law within a country, whereas the TPG does not.
In addition, some EU tax authorities (e.g., Germany, the Netherlands, the United Kingdom) have developed detailed transfer pricing regulations and have much more experience applying the rules than do EC staff members. The EC is not a tax agency and has little experience in the arcane world of transfer pricing regulation. Many EU tax authorities have also been long-time members of the OECD committees in which
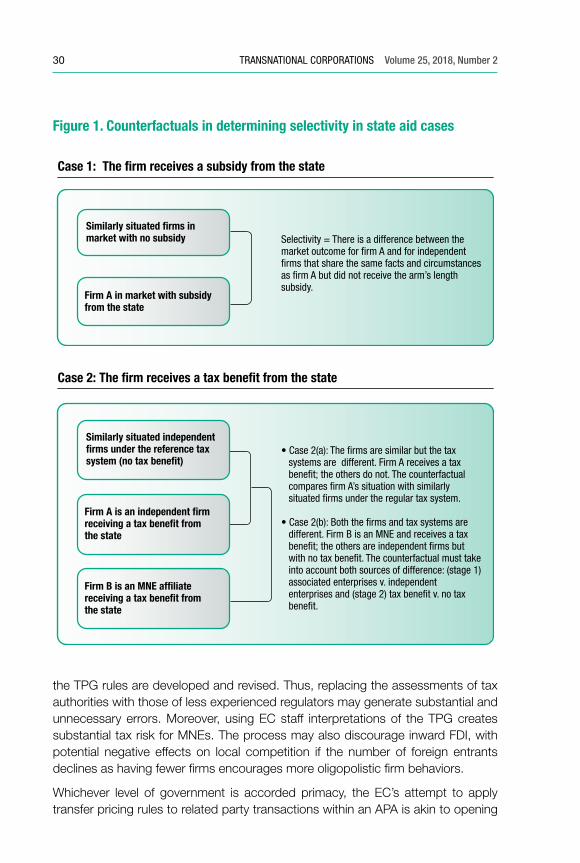
30 TRANSNATIONAL CORPORATIONS Volume 25, 2018, Number 2
the TPG rules are developed and revised. Thus, replacing the assessments of tax authorities with those of less experienced regulators may generate substantial and unnecessary errors. Moreover, using EC staff interpretations of the TPG creates substantial tax risk for MNEs. The process may also discourage inward FDI, with potential negative effects on local competition if the number of foreign entrants declines as having fewer firms encourages more oligopolistic firm behaviors.
Whichever level of government is accorded primacy, the EC’s attempt to apply transfer pricing rules to related party transactions within an APA is akin to opening
Case 1: The firm receives a subsidy from the state
Selectivity = There is a difference between the market outcome for �rm A and for independent �rms that share the same facts and circumstances as �rm A but did not receive the arm’s length subsidy.
Case 2: The firm receives a tax benefit from the state
• Case 2(a): The �rms are similar but the tax systems are different. Firm A receives a tax bene�t; the others do not. The counterfactual compares �rm A’s situation with similarly situated �rms under the regular tax system.
• Case 2(b): Both the �rms and tax systems are different. Firm B is an MNE and receives a tax bene�t; the others are independent �rms but with no tax bene�t. The counterfactual must take into account both sources of difference: (stage 1) associated enterprises v. independent enterprises and (stage 2) tax bene�t v. no tax bene�t.
Similarly situated independent firms under the reference tax system (no tax benefit)
Firm A is an independent firm receiving a tax benefit from the state
Similarly situated firms in market with no subsidy
Firm A in market with subsidy from the state
Firm B is an MNE affiliate receiving a tax benefit from the state
Figure 1. Counterfactuals in determining selectivity in state aid cases
31Transfer pricing and state aid: the unintended consequences of advance pricing agreements
Pandora’s box. In our opinion, the most sensible answer is for the EC to accept the transfer pricing methodology and results developed by the tax authority in the APA (stage 1) – unless there are clear and manifest errors in the APA process – and focus solely on stage 2: whether the state is at arm’s length from the taxpayer. We therefore recommend that the EC’s assessment of APA cases in terms of application of the ALS be restricted to procedural violations (e.g., cases where a state does not have specific, detailed transfer pricing regulations or has no to little administrative experience with transfer pricing regulation) that have a material effect, rather than start down the path of substantively redoing the APA – that way “be dragons!” and best avoided.
6. Conclusion
An APA is a formal arrangement between a tax authority and a taxpayer involved in cross-border related party transactions where the goal is to determine an appropriate transfer pricing methodology for related party transactions according to the country’s transfer pricing regulations. A key characteristic of an APA is that it is a discretionary, confidential tax ruling negotiated between the MNE and a tax authority. The MNE approaches the tax authority and requests an agreement to cover a certain activity or all activities within an MNE legal entity or entities. The agreement determines the arm’s length return on the activity or activities for a specified number of years (typically, four or five) and may be renewed if there is no change in the MNE’s material conditions and both parties agree. The benefits of an APA for the MNE include greater tax certainty, reduced transfer pricing risk, and protection against tax penalties. APAs can also help both parties resolve complex and non-routine transfer pricing issues.
However, some of the core advantages of an APA can turn out to be unintended disadvantages in a regional context such as a customs union, where competition policy is used by the upper-tier government to enforce a level playing field. In the context of competition policy, APAs can be viewed as hidden, discretionary policies used by lower-tier governments to attract or retain inward FDI by offering individual MNEs preferential tax treatment. In this situation, the APA as a dispute settlement mechanism changes and becomes a form of illegal state aid.
Our assessment is that certain changes could be made to the APA and state aid policy processes that should lessen, but probably not eliminate, the unintended consequences of APAs. We recommend that information on individual APAs be more publicly available and that tax authorities shift from unilateral to bilateral APAs when at least two tax authorities are involved. We also recommend that tax authorities’ capacity to document and administer APAs be improved. Lastly, we recommend that the EC restrict its investigations in APA cases to what we have called stage 2 issues (assessment of tax benefit). The EC should accept the APA
32 TRANSNATIONAL CORPORATIONS Volume 25, 2018, Number 2
transfer pricing methodology (stage 1), except in situations where the transfer pricing rules and procedures at the national level either did not exist or were not followed and material violations likely occurred.
References
Bobby, Christopher (2017). A Method Inside the Madness: Understanding the European Union State Aid and Taxation Rulings. Chicago Journal of International Law, 18.1: 186-215.
Byrnes, William (2016a). Application of TNMM to Starbucks Roasting Operation: Seeking Comparables Through Understanding the Market [Blog post]. July 13. http://kluwertaxblog.com/2016/07/13/application-tnmm-starbucks-roasting-operation-seeking-comparables-understanding-market/.
Byrnes, William (2016b). My Starbucks’ State Aid Transfer Pricing Analysis: Part II [Blog post]. October 31. http://kluwertaxblog.com/2016/10/31/starbucks-state-aid-transfer-pricing-analysis-part-ii/.
Byrnes, William and Robert T. Cole (2018). Practical Guide to U.S. Transfer Pricing, Third Edition. New York: Lexis Nexis.
Cleary Gottlieb (2016). Three Years of EU State Aid Review of Tax Rulings: Taking Stock. Alert Memorandum. Brussels and Frankfurt: Cleary Gottlieb Steen and Hamilton.
DeNovio, Nicholas, Elisabetta Righini, and Nicolle Nonken Gibbs (2016). State Aid: What It is and How It May Affect Multinationals and Tax Departments. Tax Executive. April 6. http://taxexecutive.org/state-aid-what-it-is-and-how-it-may-affect-multinationals-and-tax-departments/.
DiSangro, Paul A., Larry R. Lango, and Jongjit Wongsrikasem (2012). Alternative Dispute Resolution Processes in the Current U.S. Transfer Pricing Landscape. Tax Management Transfer Pricing Report, 21.5 (June 28): 1-5.
Eden, Lorraine (1996). The Emerging North American Investment Regime. Transnational Corporations 5(3): 61-98.
Eden, Lorraine (1998). Taxing Multinationals: Transfer Pricing and Corporate Income Taxation in North America. Toronto: University of Toronto Press.
Eden, Lorraine (2009). Taxes, Transfer Pricing and the Multinational Enterprise. In Alan Rugman (editor). Oxford Handbook of International Business, 2nd Edition. Oxford, UK: Oxford University Press.
Eden, Lorraine (2016). The Arm’s Length Standard: Making It Work in a 21st Century World of Multinationals and Nation States. In Thomas Pogge and Krishen Mehta, editors. Global Tax Fairness. Oxford, UK: Oxford University Press.
EC (European Commission) (1998). Commission Notice on the Application of the State Aid Rules to Measures to Direct Business Taxation. Official Journal of the European Communities. Notice 98/C 384/03. October 12.

33Transfer pricing and state aid: the unintended consequences of advance pricing agreements
EC (European Commission) (2001). Company Taxation in the Internal Market. Commission Staff Working Paper. Brussels. SEC 1681. October 23.
EC (European Commission) (2015a). Decision 2016/2326 of 21 October 2015 on State aid SA.38375 (2014/C ex 2014/NN) which Luxembourg granted to Fiat.
EC (European Commission) (2015b). Decision 2017/502 of 21 October 2015 on State aid SA.38374 (2014/C ex 2014/NN) implemented by the Netherlands to Starbucks.
EC (European Commission) (2015c). State aid: Commission Opens Formal Investigation into Luxembourg’s Tax Treatment of McDonald’s. December 3. Retrieved from http://europa.eu/rapid/press-release_IP-15-6221_en.htm.
EC (European Commission) (2016a). Commission Notice on the Notion of State Aid as Referred to in Article 107(1) of the Treaty on the Functioning of the European Union. C/2016/2946.
EC (European Commission) (2016b). Decision 2016/1699 of 11 January 2016 on the Excess Profit Exemption State Aid Scheme SA.37667 (2015/C) (ex 2015/NN) implemented by Belgium.
EC (European Commission) (2016c). Decision 2017/1283 of 30 August 2016 on State Aid SA.38373 (2014/C) (ex 2014/NN) (ex 2014/CP) Implemented by Ireland to Apple (notified under Document C (2017) 5605).
EC (European Commission) (2016d). DG Competition Working Paper on State Aid and Tax Rulings. DG Competition – Internal Working paper – Background to the High Level Forum on State Aid. June 3. http://ec.europa.eu/competition/state_aid/legislation/working_paper_tax_rulings.pdf.
EC (European Commission) (2016e). Study on the Application of Economic Valuation Techniques for Determining Transfer Prices of Cross Border Transactions Between Members of Multinational Enterprise Groups in the EU. Directorate-General for Taxation and Customs Union. December 19.
EC (European Commission) (2017a). Decision 2018/859 of 4 October 2017 on State Aid SA.38944 (2014/C) (ex 2014/NN) implemented by Luxembourg to Amazon.
EC (European Commission) (2017b). State Aid: Commission Opens In-Depth Investigation into the Netherlands’ Tax Treatment of Inter IKEA. December 8. http://europa.eu/rapid/press-release_IP-17-5343_en.htm.
EC (European Commission) (2017c). State Aid: Commission Opens In-Depth Investigation into UK Tax Scheme for Multinationals. October 26. http://europa.eu/rapid/press-release_IP-17-4201_en.htm.
EC (European Commission) (2018). State Aid: Commission Finds Luxembourg Gave Illegal Tax Benefits to Engie; Has to Recover Around €120 Million. June 20. http://europa.eu/rapid/press-release_IP-18-4228_en.htm.
ECJ (European Court of Justice) (2006). Belgium and Forum 187 ASBL v. Commission. Joined Cases C-182/03 and C-217/03 EU: C: 2006: 416.
ECJ (European Court of Justice) (2011). France Telecom v. European Commission. Case C-81/10 P, ECU: EU: CD: 8 December.
34 TRANSNATIONAL CORPORATIONS Volume 25, 2018, Number 2
ECJ (European Court of Justice) (2014). Autogrill España, SA v. European Commission. Case T-219/10, 7 November.
ECJ (European Court of Justice) (2015a). Judgment of the Court (First Chamber) of 4 June 2015, C-15/14P, Commission vs. MOL.
ECJ (European Court of Justice) (2015b). Opinion of Advocate General Kokott in Finanzamt Linz v. Bundesfinanzgericht, Aubenstelle Linz. ECLI:EU: 2015:242. Case C-66/14. April 16.
EU (European Union) (2008). Treaty on the Functioning of the European Union (TFEU). (Lisbon Treaty).
EU (European Union) (2017). EU Council Directive on Tax Dispute Resolution Mechanisms in the European Union. October 10.
EU (European Union) Joint Transfer Pricing Forum (2018). Statistics on APAs in the EU at the End of 2016. JTPF/015/2016/EN. European Commission Directorate-General Taxation and Customs Union. Brussels, March.
Evertsson, Nubia (2017). State Aid and Taxation of Transnational Companies: A Study of State-Corporate Crime. Critical Criminology, 25.4 (December): 507-522.
EY (2017). Guide to Advance Pricing Agreements (APAs), APA Programs Worldwide. https://www.ey.com/gl/en/services/tax/international-tax/guide-to-advance-pricing-agreements--apa----apa-programs-worldwide.
Federal Ministry of Finance (2017). Tax Benefits and EU State Aid Control: The Problem of and Approaches to Resolving the Conflict of Jurisdiction with Fiscal Autonomy. Report of the Advisory Board to the Federal Ministry of Finance. March. (Berlin, Germany: Federal Ministry of Finance, Public Relations Division).
Hrushko, Nina (2017). Tax in the World of Antitrust Enforcement: European Commission’s State Aid Investigations into EU Member States’ Tax Rulings. Brooklyn Journal of International Law, 43.1: 327-360.
Lellefigue, Julien and William Finan (2018). European Commission Targets Member States’ Tax Rulings as Prohibited State Aid: Where Will It Lead? Tax Management Transfer Pricing Report. January 25.
Liu, Luyang (2018). Is American Multinational Enterprises’ Honeymoon with the European Union Over? An Analysis of the European Commission’s Investigations into American Multinational Enterprises’ Tax Deals with Ireland, Luxembourg and the Netherlands. Loyola of Los Angeles International and Comparative Law Review, 41.1: 71-98.
Long, Christine and Beate Erwin (2016). EU State Aid – The Saga Continues. Insights, 3.6: 26-34. http://publications.ruchelaw.com/news/2016-06/InsightsVol3no06.pdf.
Markham, Michelle (2012). Advance Pricing Agreements: Past, Present and Future. Amsterdam, Netherlands: Kluwer Law International.
Markham, Michelle (2017). International Tax Treaty Arbitration – Fighting an Uphill Battle in the Global Arena. Australasian Dispute Resolution Journal, 28: 162-169.
Mason, Ruth (2017a). An American View of State Aid. Tax Notes Special Report, 645-662. October 30.
35Transfer pricing and state aid: the unintended consequences of advance pricing agreements
Mason, Ruth (2017b). Special Report on State Aid – Part 3: Apple. Tax Notes Special Report, 735-751. February 6.
Mason, Ruth (2017c). State Aid Special Report – Part 2: Legitimate Expectations. Tax Notes Special Report, 615-622. January 30.
Mason, Ruth (2017d). Tax Rulings as State Aid – Part 4: Whose Arm’s Length Standard? Tax Notes Special Report, 947-966. May 15.
Mason, Ruth (2017e). Tax Rulings as State Aid FAQ. Tax Notes Special Report, 451-462. January 23.
Mason, Ruth (2018). State Aid Special Report – Part 6: Arm’s Length on Appeal. Tax Notes Special Report, 771-796. February 5.
OECD (1963, 1977, 2008, 2014). Model Tax Convention on Income and Capital. Paris: OECD.
OECD (1995, 2017). Transfer Pricing Guidelines for Multinational Enterprises and Tax Administrations. Paris: OECD.
OECD (2016). Multilateral Convention to Implement Tax Treaty Related Measures to Prevent Base Erosion and Profit Shifting. Paris: OECD.
OECD (2018a). International Compliance Assurance Programme Pilot Handbook, Working Document. Paris: OECD.
OECD (2018b). Signatories and Parties to the Multilateral Convention to Implement Tax Treaty Related Measures to Prevent Base Erosion and Profit Shifting. Status as of 23 July 2018. www.oecd.org/tax/treaties/beps-mli-signatories-and-parties.pdf.
Ryding, Tove Maria (2018). Tax ‘Sweetheart Deals’ Between Multinationals and EU Countries at Record High. European Network on Debt and Development. March. www.eurodad.org/sweetheart-deals-briefing.
Shaviro, Daniel N. (2016). Friends Without Benefits? Treasury and EU State Aid. Tax Notes Special Report, 1681-1693. September 19.
Shoup, Carl S. (1985, reissued in 2017). International Arbitration of Transfer Pricing Disputes Under Income Taxation. In Alan M. Rugman and Lorraine Eden (eds.) Multinationals and Transfer Pricing, Chapter 16, pp. 291-308. London: Routledge.
Sporken, Eduard and Yves Cattel (2015). Investigations by European Commission into Transfer Pricing Underlying Certain Tax Rulings in the European Union. International Transfer Pricing Journal, May/June: 131-140.
Stark, Richard C., Hartman E. Blanchard, Jr., and Saul Mezel (2011). Consistency, Sunshine, Privacy, Secret Law and the APA Program. Tax Notes Commentary/Special Report, 655-670 (Feb. 7).
Tavares, Romero J.S., Bret N. Bogenschneider, and Marta Pankiv (2016). The Intersection of E State Aid and U.S. Tax Deferral: A Spectacle of Fireworks, Smoke, and Mirrors. Florida Tax Review, 19.3: 121-188.
United Nations (2001, 2011). Model Double Taxation Convention between Developed and Developing Countries. New York and Geneva: United Nations.

36 TRANSNATIONAL CORPORATIONS Volume 25, 2018, Number 2
United Nations (2013, 2017). Practical Manual on Transfer Pricing for Developing Countries. Geneva: United Nations.
United States Department of the Treasury (2016). The European Commission’s Recent State Aid Investigations of Transfer Pricing Rulings. U.S. Department of the Treasury White Paper. Washington, DC: August 24.
37
Does tax drive the headquarters locations of the world’s biggest companies?
Kimberly A. Clausing*
In recent years, policy-makers have given paramount attention to “competitiveness”, working to ensure that domestic economies attract investment, jobs, and tax revenues. Toward this end, countries have steadily lowered corporate tax rates in an attempt to attract mobile international businesses. This paper discusses the desirability of this policy stance in light of data on the world’s biggest companies. Using Forbes lists of the top “Global 2000” companies over the period 2003–2017, the paper analyzes companies’ headquarters locations, focusing on economic, geographic, and policy determinants. The paper then relates these findings to larger policy questions.
Keywords: multinational corporations, headquarters, international taxation, tax competition
1. Introduction
Policy-makers throughout the world frequently emphasize the importance of attracting mobile business activity. Multinational company investments may enhance the potential output of the country and the productivity of labor, leading to higher wage growth. Multinational companies are also associated with other important desiderata: innovation, large profits, a healthy tax base, and even the simple pride of viewing companies as national champions.
Companies often lobby governments, exhorting them to enact economic policies compatible with the crucial goal of competitiveness. Governments have generally been receptive to these concerns, and recent years have seen a steady reduction in the corporate tax rate across countries of the Organization for Economic Cooperation and Development (OECD) (Figure 1). One of the latest moves in that direction was the dramatic decrease of the U.S. corporate tax rate in 2018, when the statutory rate was lowered from 35 to 21 percent.1
1 Still, the impact of this change on mobile companies is more ambiguous than one would think. Prior to the change, effective tax rates were far lower than the U.S. statutory rate; indeed, U.S. multinational companies were often capable of achieving single-digit effective tax rates.
* Kimberly A. Clausing is Thormund A. Miller and Walter Mintz Professor of Economics at Reed College. Contact: [email protected].
Acknowledgement: I am thankful to Nikhita Airi for her excellent research assistance.
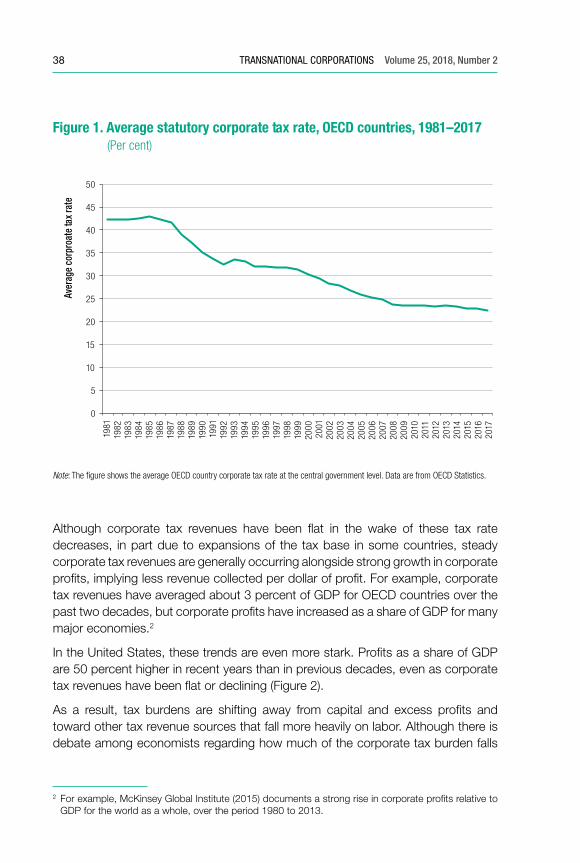
38 TRANSNATIONAL CORPORATIONS Volume 25, 2018, Number 2
Although corporate tax revenues have been flat in the wake of these tax rate decreases, in part due to expansions of the tax base in some countries, steady corporate tax revenues are generally occurring alongside strong growth in corporate profits, implying less revenue collected per dollar of profit. For example, corporate tax revenues have averaged about 3 percent of GDP for OECD countries over the past two decades, but corporate profits have increased as a share of GDP for many major economies.2
In the United States, these trends are even more stark. Profits as a share of GDP are 50 percent higher in recent years than in previous decades, even as corporate tax revenues have been flat or declining (Figure 2).
As a result, tax burdens are shifting away from capital and excess profits and toward other tax revenue sources that fall more heavily on labor. Although there is debate among economists regarding how much of the corporate tax burden falls
2 For example, McKinsey Global Institute (2015) documents a strong rise in corporate profits relative to GDP for the world as a whole, over the period 1980 to 2013.
Figure 1. Average statutory corporate tax rate, OECD countries, 1981–2017 (Per cent)
0
5
10
15
20
25
30
35
40
45
50
1981
19
82
1983
19
84
1985
19
86
1987
19
88
1989
19
90
1991
19
92
1993
19
94
1995
19
96
1997
19
98
1999
20
00
2001
20
02
2003
20
04
2005
20
06
2007
20
08
2009
20
10
2011
20
12
2013
20
14
2015
20
16
2017
Aver
age
corp
roat
e ta
x ra
te
Note: The �gure shows the average OECD country corporate tax rate at the central government level. Data are from OECD Statistics.
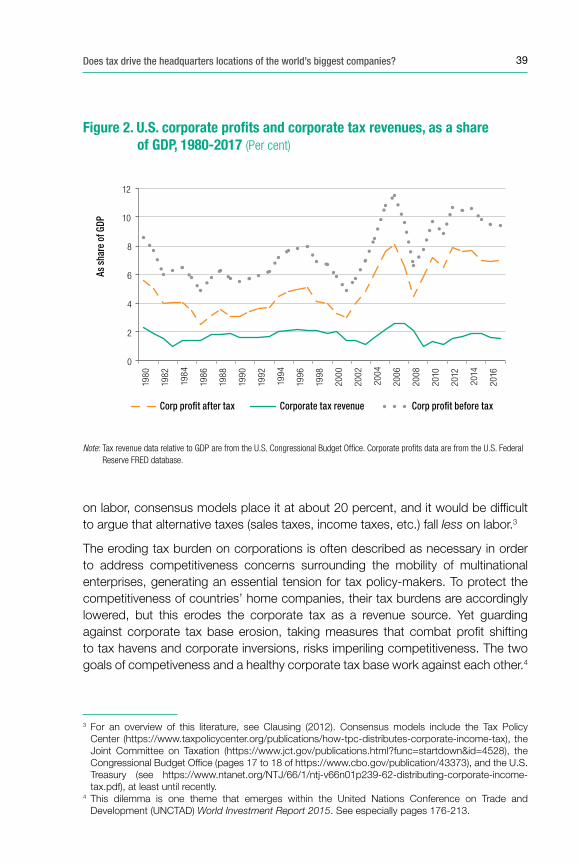
39Does tax drive the headquarters locations of the world’s biggest companies?
on labor, consensus models place it at about 20 percent, and it would be difficult to argue that alternative taxes (sales taxes, income taxes, etc.) fall less on labor.3
The eroding tax burden on corporations is often described as necessary in order to address competitiveness concerns surrounding the mobility of multinational enterprises, generating an essential tension for tax policy-makers. To protect the competitiveness of countries’ home companies, their tax burdens are accordingly lowered, but this erodes the corporate tax as a revenue source. Yet guarding against corporate tax base erosion, taking measures that combat profit shifting to tax havens and corporate inversions, risks imperiling competitiveness. The two goals of competiveness and a healthy corporate tax base work against each other.4
3 For an overview of this literature, see Clausing (2012). Consensus models include the Tax Policy Center (https://www.taxpolicycenter.org/publications/how-tpc-distributes-corporate-income-tax), the Joint Committee on Taxation (https://www.jct.gov/publications.html?func=startdown&id=4528), the Congressional Budget Office (pages 17 to 18 of https://www.cbo.gov/publication/43373), and the U.S. Treasury (see https://www.ntanet.org/NTJ/66/1/ntj-v66n01p239-62-distributing-corporate-income-tax.pdf), at least until recently.
4 This dilemma is one theme that emerges within the United Nations Conference on Trade and Development (UNCTAD) World Investment Report 2015. See especially pages 176-213.
Figure 2. U.S. corporate pro�ts and corporate tax revenues, as a share of GDP, 1980-2017 (Per cent)
As s
hare
of G
DP
0
2
4
6
8
10
12
1980
1982
1984
1986
1988
1990
1992
1994
1996
1998
2000
2002
2004
2006
2008
2010
2012
2014
2016
Corp pro�t after tax Corporate tax revenue Corp pro�t before tax
Note: Tax revenue data relative to GDP are from the U.S. Congressional Budget Of�ce. Corporate pro�ts data are from the U.S. Federal Reserve FRED database.
40 TRANSNATIONAL CORPORATIONS Volume 25, 2018, Number 2
This paper considers one facet of this dilemma, addressing the location of multinational headquarters as a possible tax policy goal. The headquarters locations of top companies are examined using Forbes data on the operations of the world’s 2000 largest companies. Together, these companies had $39 trillion in sales, $190 trillion in assets, and $57 trillion in market capitalization in 2017.5 In comparison, world GDP was about $80 trillion in the same year.6
These companies are a particularly interesting group to examine since they are the largest and most successful companies in the world. They are a desirable target for policy-makers interested in large-scale economic activity, tax base, innovation, and above-normal profits. Also, the behavior of these companies may not be identical to that of their smaller, more “perfectly” competitive, corporate counterparts.7 Further, these data allow an examination of the 15 most recent years, 2003-2017, allowing the creation of an up-to-date empirical picture; this is especially useful given the rapidly changing corporate tax policy environment.
The empirical analysis indicates that the world’s largest companies are located where we would expect, in large, rich economies. There is some evidence of tax sensitivity, particularly for small countries and in specifications without many control variables. Geographic and governance factors are important, and fundamentals related to education and technology also show strong positive statistical relationships with headquarters measures.
Beyond the behavior of these particular 2000 companies, I also examine the larger issue of whether company headquarters themselves are important, or whether they are mere symptoms of healthy economic fundamentals. Headquarters are associated with increased charitable contributions, as shown in Card, Hallock, and Moretti (2010), and may also generate other beneficial external effects. Still, it remains unclear whether corporate tax policy is the most targeted approach to achieve key policy desiderata.
Also, while the literature often emphasizes the role of tax incentives in changing marginal decisions on company organization and location, it is important to remember that economic fundamentals are a big driver of business activity. Factors such as workforce skill and education, research and development (R&D) spending, infrastructure, property rights, institutional stability, and macroeconomic indicators (inflation, unemployment, economic growth) are all important determinants of a country’s competitiveness. Large, rich economies with well-educated workforces,
5 Data are from the 2018 Forbes Global 2000 list; most data are from 2017.6 Of course, GDP is a value added concept, and none of these values is comparable in that sense.
However, world GDP is provided to give readers a sense of magnitudes.7 For example, Baldwin and Okubo (2009), discussed in the next section, find that large firms are more
tax-sensitive.
41Does tax drive the headquarters locations of the world’s biggest companies?
sound infrastructure, stable institutions, and solid macroeconomic fundamentals are likely to prove economically successful, attracting corporate headquarters in parallel.
Designing a tax system that supports this broader notion of a country’s competitiveness need not require setting corporate tax rates to zero. Instead, tax policy design should balance the conflicting goals of competitiveness and corporate tax base protection. The final sections of this paper suggest directions for future corporate tax reform to help achieve that balance.
2. Prior work
Defining the location of a corporate headquarters is no simple matter. Corporations may list their stock in one country, have legal residence in another, and be managed and controlled in a third. In some cases, management and control may even be split among multiple jurisdictions. In a world with truly globally integrated companies, no definition of headquarters location is likely to be purely satisfactory.8
Work on the determinants of corporate headquarters location comes from several literatures, including those on international business, law, accounting, economic geography, and public finance. Many studies focus on taxation, but work also points to other important causal factors. The seminal economic geography work of Krugman (1991) modeled how scale economies, transportation costs, and sector composition affect the pattern of industry. Baldwin and Krugman (2004) and Haufler and Wooten (1999) describe why agglomeration effects, emphasized in the economic geography literature, make tax competition less fierce for larger countries. Indeed, studies such as Clausing (2007) have shown that smaller countries choose lower corporate tax rates.
Studies focusing on the geographical determinants of headquarters decisions often focus on the role of distance to major markets, alongside infrastructure amenities, market size, labor market considerations, and company characteristics. Baaij and Slangen (2013) find an important role for distance, as does Defever (2012), who considers the role of distance for regions in the European Union, using firm-level data over the period 1997-2002. Distance affects patterns of multinational investment clustering, when controlling for other regional characteristics; distance has a much stronger effect for production location than for service provision. Goerzen, Asmussen, and Nielsen (2013) emphasize the role of global cities in providing interconnectedness and abundant services, showing that MNEs favor
8 For more detailed discussions of this issue, see Clausing (2010) and Desai (2009).
42 TRANSNATIONAL CORPORATIONS Volume 25, 2018, Number 2
global cities in their location decisions. Belderbos, Du, and Goerzen (2017) perform a logit analysis of location choice for over 1000 new regional headquarters over the period 2003-2012, showing how well-connected global cities make the role of distance less important; well-connected cities are those with substantial flows of people, knowledge, and services.
Several studies examine location decisions in particular regions or for particular home countries. Wang et al. (2011) consider location decisions within China, focusing on the role of path dependency, institutions, and information. Benito, Lunnan, and Tomassen (2011) consider the location decisions of Norwegian multinational companies between 2000 and 2006, documenting a large movement in headquarters functions in response to business efficiency and legitimacy factors. Baaij et al. (2015) study 58 Dutch multinationals and relate their relocation decisions to the internationalization of the company as well as the attractiveness of locations in terms of communications, capital, talent, services, and legal and regulatory environments. Birkinshaw et al. (2006) focus on a sample of large Swedish multinationals, finding evidence that headquarters relocation is related to the global nature of the company, though relocation is less likely when business climate differences are important, when interdependence between business units is high, or when ownership is concentrated.
Bloom, Sadun, and Van Reenen (2012) show that trust plays an important role in multinational companies’ willingness to decentralize decisions from corporate headquarters. Laamanen, Simula, and Torstila (2012) consider the interplay of tax incentives and business factors in determining European relocations; they find that tax considerations are important, as are labor market conditions and geographic centrality. Baldwin and Okubo (2009) consider both tax incentives and the role of firm size, and find that large firms are more likely to relocate in response to tax considerations.
Tax considerations are the focus of several studies. Becker, Egger, and Merlo (2009) consider the municipal tax sensitivity of multinational headquarters within Germany, using data on over 11,000 German municipalities and finding substantial tax effects. Barrios et al. (2012) consider the tax responsiveness of European firms during 1999-2003. They find that both home and host country tax rates influence the location decisions of multinational companies. Egger, Radulescu, and Strecker (2013) also find that labor taxation affects the location decisions of multinational headquarters.
Huizinga and Voget (2009) examine how the structure of mergers and acquisitions is affected by tax rates and systems, finding that companies avoid headquartering firms in countries with high international tax burdens; Belz et al. (2016) also focus on the tax avoidance incentives behind merger and acquisition activity. Voget (2011) examines European company data over the period 1997-2007, focusing on
43Does tax drive the headquarters locations of the world’s biggest companies?
multinational firms with headquarters relocations. Tax base protections (in the form of controlled foreign corporation laws) and increased repatriation tax burdens both increase the likelihood of multinational firm relocation.9
Dischinger and Riedel (2014a, 2014b) examine agency issues that may lead to profit-shifting toward headquarters, controlling for other variables, including tax differences among countries. Using data on European firms, they find evidence showing that profit shifting is more likely to favor headquarters countries, holding constant other factors.
Finally, Allen and Morse (2013) examine data on companies with United States initial public offerings over the period 1997-2010. They find evidence that the proportion of U.S. incorporated companies that incorporated in tax havens is quite modest, whereas companies that incorporate in China and Hong Kong (China) are more likely to incorporate in tax havens.
3. The world’s biggest companies
Every year, Forbes compiles a list of the 2000 largest publicly traded global companies worldwide. This list is compiled on the basis of four lists that rank companies by sales, profits, market value, and assets. Composite rankings of the top 2000 companies are based on equally weighted rankings of the four lists. For the 2018 list, the four lists included 3480 companies, in order to generate the top 2000 companies for the composite list.10 Most of the data for each year’s published list are based on the prior year’s information, with the exception of market value, which is calculated in the spring of the year of the published list. In what follows, I refer to years not as the publication year, but as the year when the majority of data were gathered, the year before publication. I use data over the period 2003-2017, covering the years that the list has been published; the most recent list was released in June of 2018, providing 2017 data.
Global 2000 companies have become larger and more important over the time period of this sample. The top 2000 companies in 2017 accounted for $39 trillion in sales and $57 trillion in market capitalization, over 50 percent higher than the 2003
9 Much of the prior work on the effects of tax rates and (territorial and worldwide) tax systems has focused on foreign direct investment rather than headquarters. De Mooij and Ederveen (2003, 2008) perform meta-analyses of many studies of foreign direct investment tax elasticities. A nice overview of some of the relevant mechanisms is also provided in the United Nations Conference on Trade and Development (UNCTAD) World Investment Report 2015.
10 Publicly traded subsidiaries of companies that provide consolidated financial information are excluded from the list.
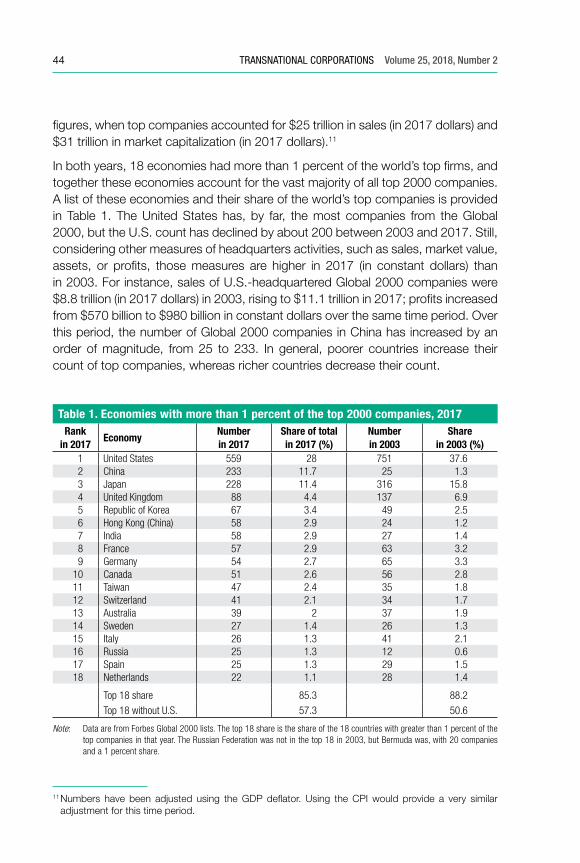
44 TRANSNATIONAL CORPORATIONS Volume 25, 2018, Number 2
figures, when top companies accounted for $25 trillion in sales (in 2017 dollars) and $31 trillion in market capitalization (in 2017 dollars).11
In both years, 18 economies had more than 1 percent of the world’s top firms, and together these economies account for the vast majority of all top 2000 companies. A list of these economies and their share of the world’s top companies is provided in Table 1. The United States has, by far, the most companies from the Global 2000, but the U.S. count has declined by about 200 between 2003 and 2017. Still, considering other measures of headquarters activities, such as sales, market value, assets, or profits, those measures are higher in 2017 (in constant dollars) than in 2003. For instance, sales of U.S.-headquartered Global 2000 companies were $8.8 trillion (in 2017 dollars) in 2003, rising to $11.1 trillion in 2017; profits increased from $570 billion to $980 billion in constant dollars over the same time period. Over this period, the number of Global 2000 companies in China has increased by an order of magnitude, from 25 to 233. In general, poorer countries increase their count of top companies, whereas richer countries decrease their count.
11 Numbers have been adjusted using the GDP deflator. Using the CPI would provide a very similar adjustment for this time period.
Table 1. Economies with more than 1 percent of the top 2000 companies, 2017Rank
in 2017Economy
Number in 2017
Share of totalin 2017 (%)
Number in 2003
Share in 2003 (%)
1 United States 559 28 751 37.62 China 233 11.7 25 1.33 Japan 228 11.4 316 15.84 United Kingdom 88 4.4 137 6.95 Republic of Korea 67 3.4 49 2.56 Hong Kong (China) 58 2.9 24 1.27 India 58 2.9 27 1.48 France 57 2.9 63 3.29 Germany 54 2.7 65 3.3
10 Canada 51 2.6 56 2.811 Taiwan 47 2.4 35 1.812 Switzerland 41 2.1 34 1.713 Australia 39 2 37 1.914 Sweden 27 1.4 26 1.315 Italy 26 1.3 41 2.116 Russia 25 1.3 12 0.617 Spain 25 1.3 29 1.518 Netherlands 22 1.1 28 1.4
Top 18 share 85.3 88.2
Top 18 without U.S. 57.3 50.6
Note: Data are from Forbes Global 2000 lists. The top 18 share is the share of the 18 countries with greater than 1 percent of the top companies in that year. The Russian Federation was not in the top 18 in 2003, but Bermuda was, with 20 companies and a 1 percent share.
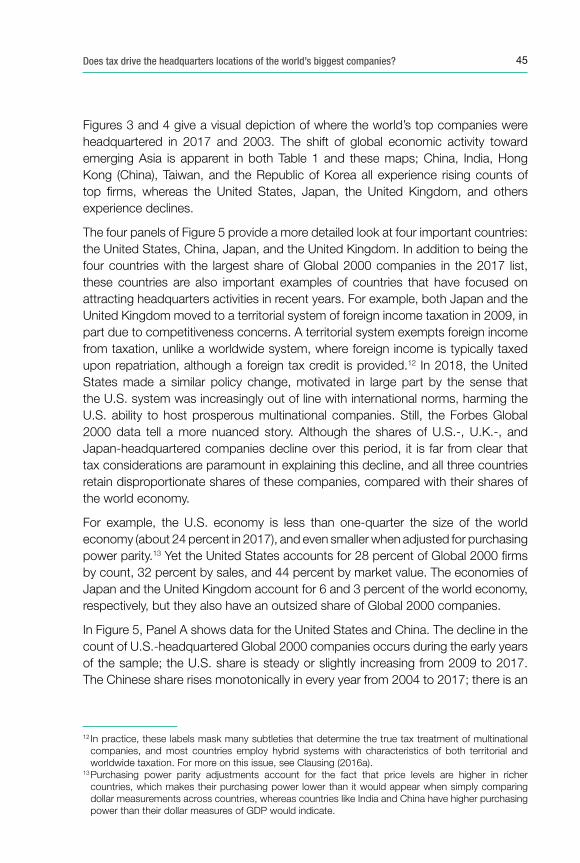
45Does tax drive the headquarters locations of the world’s biggest companies?
Figures 3 and 4 give a visual depiction of where the world’s top companies were headquartered in 2017 and 2003. The shift of global economic activity toward emerging Asia is apparent in both Table 1 and these maps; China, India, Hong Kong (China), Taiwan, and the Republic of Korea all experience rising counts of top firms, whereas the United States, Japan, the United Kingdom, and others experience declines.
The four panels of Figure 5 provide a more detailed look at four important countries: the United States, China, Japan, and the United Kingdom. In addition to being the four countries with the largest share of Global 2000 companies in the 2017 list, these countries are also important examples of countries that have focused on attracting headquarters activities in recent years. For example, both Japan and the United Kingdom moved to a territorial system of foreign income taxation in 2009, in part due to competitiveness concerns. A territorial system exempts foreign income from taxation, unlike a worldwide system, where foreign income is typically taxed upon repatriation, although a foreign tax credit is provided.12 In 2018, the United States made a similar policy change, motivated in large part by the sense that the U.S. system was increasingly out of line with international norms, harming the U.S. ability to host prosperous multinational companies. Still, the Forbes Global 2000 data tell a more nuanced story. Although the shares of U.S.-, U.K.-, and Japan-headquartered companies decline over this period, it is far from clear that tax considerations are paramount in explaining this decline, and all three countries retain disproportionate shares of these companies, compared with their shares of the world economy.
For example, the U.S. economy is less than one-quarter the size of the world economy (about 24 percent in 2017), and even smaller when adjusted for purchasing power parity.13 Yet the United States accounts for 28 percent of Global 2000 firms by count, 32 percent by sales, and 44 percent by market value. The economies of Japan and the United Kingdom account for 6 and 3 percent of the world economy, respectively, but they also have an outsized share of Global 2000 companies.
In Figure 5, Panel A shows data for the United States and China. The decline in the count of U.S.-headquartered Global 2000 companies occurs during the early years of the sample; the U.S. share is steady or slightly increasing from 2009 to 2017. The Chinese share rises monotonically in every year from 2004 to 2017; there is an
12 In practice, these labels mask many subtleties that determine the true tax treatment of multinational companies, and most countries employ hybrid systems with characteristics of both territorial and worldwide taxation. For more on this issue, see Clausing (2016a).
13 Purchasing power parity adjustments account for the fact that price levels are higher in richer countries, which makes their purchasing power lower than it would appear when simply comparing dollar measurements across countries, whereas countries like India and China have higher purchasing power than their dollar measures of GDP would indicate.
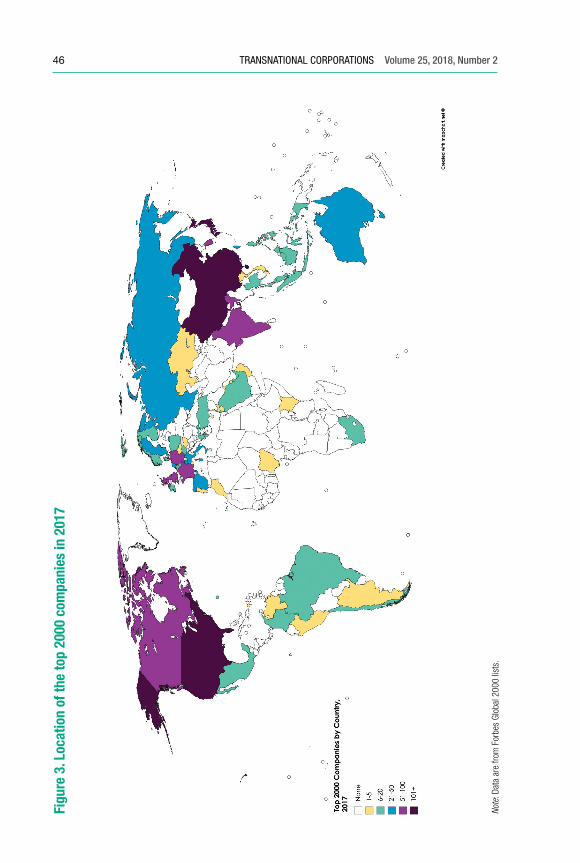
46 TRANSNATIONAL CORPORATIONS Volume 25, 2018, Number 2Fi
gure
3. L
ocat
ion
of th
e to
p 20
00 c
ompa
nies
in 2
017
Note
: Dat
a ar
e fro
m F
orbe
s Gl
obal
200
0 lis
ts.
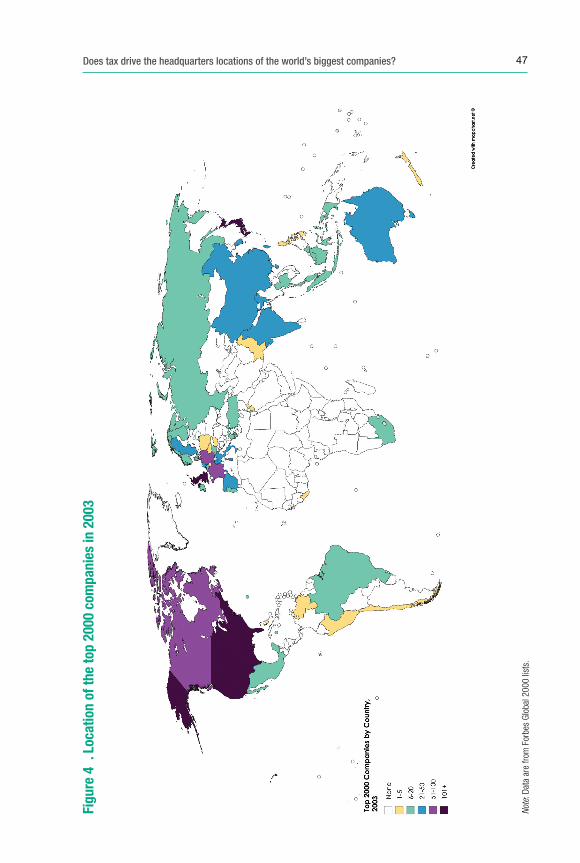
47Does tax drive the headquarters locations of the world’s biggest companies?
Figu
re 4
. L
ocat
ion
of th
e to
p 20
00 c
ompa
nies
in 2
003
Note
: Dat
a ar
e fro
m F
orbe
s Gl
obal
200
0 lis
ts.
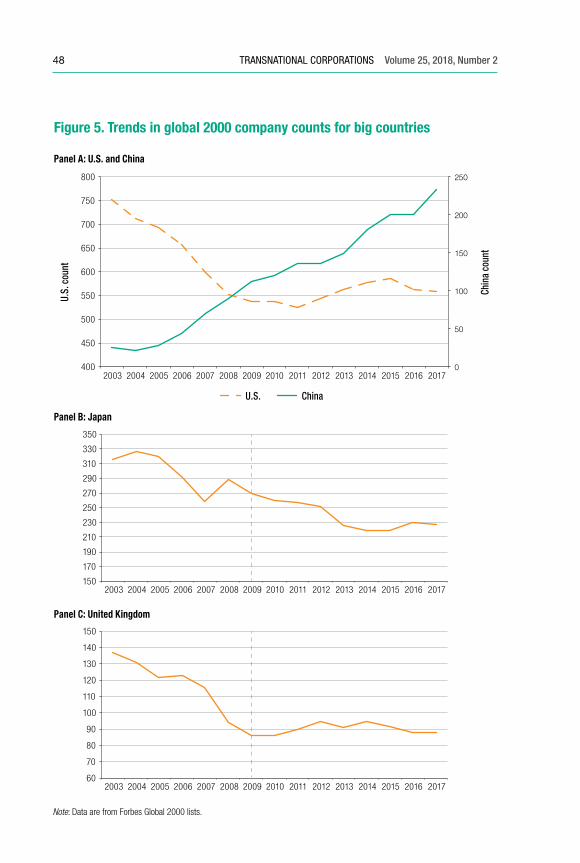
48 TRANSNATIONAL CORPORATIONS Volume 25, 2018, Number 2
Figure 5. Trends in global 2000 company counts for big countries
Note: Data are from Forbes Global 2000 lists.
Panel A: U.S. and China
U.S.
cou
nt
Chin
a co
unt
0
50
100
150
200
250
400
450
500
550
600
650
700
750
800
2003 2004 2005 2006 2007 2008 2009 2010 2011 2012 2013 2014 2015 2016 2017
U.S. China
Panel C: United Kingdom
60
70
80
90
100
110
120
130
140
150
2003 2004 2005 2006 2007 2008 2009 2010 2011 2012 2013 2014 2015 2016 2017
Panel B: Japan
150
170
190
210
230
250
270
290
310
330
350
2003 2004 2005 2006 2007 2008 2009 2010 2011 2012 2013 2014 2015 2016 2017
49Does tax drive the headquarters locations of the world’s biggest companies?
order of magnitude increase over this period. The United Kingdom and Japan show a pattern similar to that of the United States, despite their adoption of territorial tax systems in 2009, accompanied by lower tax rates in the United Kingdom. There is a steady decline in their count of the top 2000 companies in the early years of the sample, but since 2009, there is a less steady decline in Japan and a flat trend in the United Kingdom.
4. What drives headquarters locations?
There is a clear, if imperfect, relationship between the world’s largest economies and the headquarters locations of the world’s largest public companies. As the economic sizes of China and India have grown relative to those of other big economies, their share of the world’s largest companies has increased, leaving necessarily lower shares for richer countries that were more dominant earlier.
This section undertakes a brief, illustrative econometric analysis of the location of the world’s largest 2000 companies, considering how economic, geographic, and policy factors affect the activities of these important companies. Economic variables that are likely to be associated with headquarters location include GDP, which captures the market size of the local economy, and GDP per capita, which captures the relative standard of living of the economy’s citizens. All else equal, we expect both large economies and those with high standards of living to have more multinational headquarters.14
Geography is also likely to be important. As prior work has emphasized, countries that are well-connected to other economies are more likely to attract economic activity. Thus, a country’s remoteness should be negatively correlated with hosting top global companies. Other geographic factors, such as land area, the absence of ocean ports (i.e. land-locked countries), or island countries, may also be correlated with a country’s ease of market access, as emphasized in the international trade literature.15
14 For example, consider two economies with $400 billion in GDP, one of which has 10 million citizens with $40,000 of per capita income, and one of which has 100 million citizens with $4,000 of per capita income. Although both economies would be expected to have more large companies than counterparts with smaller GDPs, the former economy may have more of the world’s top companies. Richer countries are more likely to have undertaken the investments in human capital, physical capital, and technological knowledge required to generate large publicly traded companies, whereas lower per-capita income countries may be more agrarian and less industrial, and thus less likely to host major companies.
15 Gravity equation models typically include such explanatory variables. Of course, these variables do not vary over time, so they can only be included in specifications that do not utilize country-specific fixed effects.
50 TRANSNATIONAL CORPORATIONS Volume 25, 2018, Number 2
Other country characteristics can affect attractiveness for headquarters activity, including fundamental factors such as the education of the workforce, R&D spending, internet access, and the presence of top universities (which may affect company headquarters by shaping the environment for innovation and the skill levels of those at the top of the skill distribution). For example, there is a clear synergy between Silicon Valley firms and the elite California universities of the Bay Area, Stanford and UC Berkeley.
Government policy can certainly affect these factors, through the channels of education funding, basic research funding, and public infrastructure investment. In addition, other policy factors may influence global headquarters, including the perceived stability of government, the protection of property rights, the level of corruption, and regulatory quality. Finally, a policy lever that has received much attention in the literature is the statutory corporate tax rate.
In addition, other corporate tax provisions are likely important in location decisions. Still, the distinction between territorial and worldwide tax systems may be less important than it seems, once one acknowledges that neither system is a “pure” system. For example, since worldwide tax systems often do not tax foreign income until it is repatriated (and may provide special low tax rates on such occasions), it is unclear that the tax burden on foreign income is higher under such a system than it would be under a territorial system that taxed some types of foreign income currently (through either controlled foreign corporation laws or a minimum tax regime).16
Although the limits of this data set constrain a thorough investigation of all of these mechanisms, a simple regression analysis can capture many of the factors outlined here. The data set contains about 60 economies that consistently hosted top 2000 companies over a period of 15 years from 2003 to 2017. The baseline specification is as follows:
Measureit = a + b1 GDPit + b2 GDP per-capitait + Sz bz Zit
The baseline specification considers measures of headquarters presence in economies (indexed by i) and years (indexed by t), where headquarters presence is defined as the economy’s company count, or the economy’s total sales, profits, assets, or market value from top 2000 global companies. Headquarters are
16 As one clear example of this ambiguity, consider the U.S. international tax law change of 2018. The United States has officially moved from a “worldwide” to a “territorial” system; however, both systems were far from pure. Under the purportedly worldwide system, little if any tax was collected on foreign income, since companies either left earnings offshore indefinitely, or used foreign tax credits to shield foreign income, including royalty income, from U.S. taxation. Under the purportedly territorial system, foreign income of U.S. multinationals will be taxed currently if the foreign tax rate is below the global minimum tax threshold.
51Does tax drive the headquarters locations of the world’s biggest companies?
specified to depend on economies’ GDP, GDP per capita, and other variables (indicated by the vector Z) added alongside baseline controls. The data appendix discusses the sources and definitions of all variables in detail.
Table 2 shows specifications where the dependent variable is the (natural log of) the count of Global 2000 companies. In the first baseline specification, the independent variables are GDP and GDP per capita (again measured in logs) and the statutory corporate tax rate. Unsurprisingly, larger economies, measured by GDP, and richer populations, measured by GDP per capita, are statistically associated with higher counts of Global 2000 companies. This is a robust finding that is upheld in nearly all specifications. In this specification, the corporate tax rate is negatively associated with the count of Global 2000 companies; a tax rate one percentage point higher is associated with about 1.4 percent fewer top companies.
In the second specification, this relationship is modeled with more subtlety, to examine the possibility that economies with larger GDP experience less tax sensitivity, since agglomeration forces make their tax base less sensitive to tax rate differences, as suggested in the economic geography literature. Here, an interaction term between the tax rate and GDP captures this possibility. Indeed, the results in column 2 imply that the statistical relationship between the tax rate and the number of global 2000 companies is negative for economies with GDP less than about $500 billion, but for larger economies, the relationship is no longer negative. In this sample, the largest 22 economies have GDPs above the $500 billion threshold. This pattern would also hold for specifications (3) to (6) if the interaction term were included, but I return to the baseline of equation (1) as I add variables in subsequent columns.17
In equation (3), I add several geographic measures, including a measure of remoteness that is based on the GDP-weighted distance between the country and other countries. Oddly, this variable is positively associated with Global 2000 company counts. However, landlocked countries and countries with larger land areas have fewer top companies. Ceteris paribus, countries that have large land areas, such as Canada and the Russian Federation, are naturally more remote since a typical person or city is further from other nations’ people and cities. In column 3, as well as in subsequent columns (and tables), both GDP and GDP per-capita coefficients typically retain their positive statistically significant relationship with headquarters measures. Yet, the tax coefficient is no longer statistically
17 This decision was due to presumed reader interest in the baseline tax effect. However, some might argue that the nonlinear specification is more theoretically justified, if large countries are likely to experience less tax sensitivity, as suggested by the economic geography literature. The pattern of column (2) tends to be upheld in specifications with additional control variables, suggesting that for small countries (but not large ones) there is a statistically negative relationship between Forbes 2000 measures and statutory tax rates.
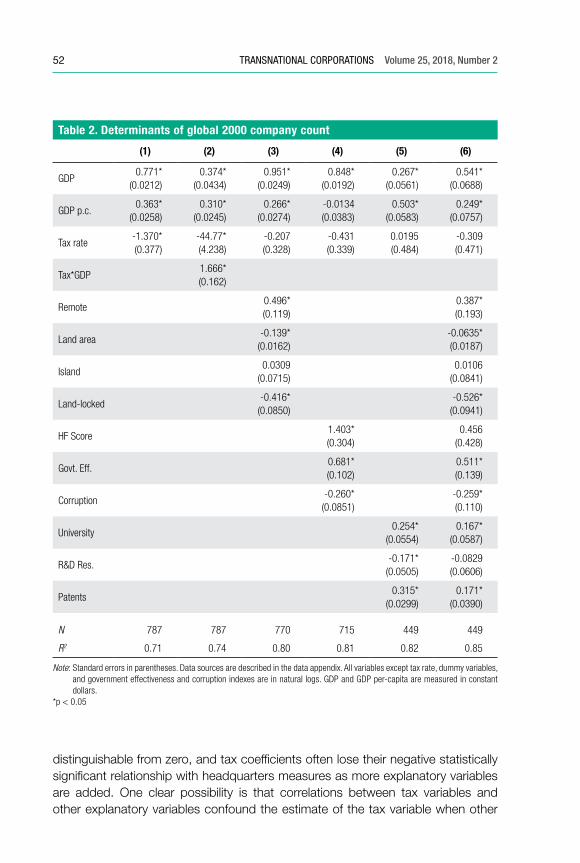
52 TRANSNATIONAL CORPORATIONS Volume 25, 2018, Number 2
distinguishable from zero, and tax coefficients often lose their negative statistically significant relationship with headquarters measures as more explanatory variables are added. One clear possibility is that correlations between tax variables and other explanatory variables confound the estimate of the tax variable when other
Table 2. Determinants of global 2000 company count
(1) (2) (3) (4) (5) (6)
GDP0.771*
(0.0212)0.374*
(0.0434)0.951*
(0.0249)0.848*
(0.0192)0.267*
(0.0561)0.541*
(0.0688)
GDP p.c.0.363*
(0.0258)0.310*
(0.0245)0.266*
(0.0274)-0.0134(0.0383)
0.503*(0.0583)
0.249*(0.0757)
Tax rate-1.370*(0.377)
-44.77*(4.238)
-0.207(0.328)
-0.431(0.339)
0.0195(0.484)
-0.309(0.471)
Tax*GDP1.666*(0.162)
Remote0.496*(0.119)
0.387*(0.193)
Land area-0.139*
(0.0162)-0.0635*(0.0187)
Island0.0309
(0.0715)0.0106
(0.0841)
Land-locked-0.416*
(0.0850)-0.526*
(0.0941)
HF Score1.403*(0.304)
0.456(0.428)
Govt. Eff.0.681*(0.102)
0.511*(0.139)
Corruption-0.260*
(0.0851)-0.259*(0.110)
University0.254*
(0.0554)0.167*
(0.0587)
R&D Res.-0.171*
(0.0505)-0.0829(0.0606)
Patents0.315*
(0.0299)0.171*
(0.0390)
N 787 787 770 715 449 449
R2 0.71 0.74 0.80 0.81 0.82 0.85
Note: Standard errors in parentheses. Data sources are described in the data appendix. All variables except tax rate, dummy variables, and government effectiveness and corruption indexes are in natural logs. GDP and GDP per-capita are measured in constant dollars.
*p < 0.05
53Does tax drive the headquarters locations of the world’s biggest companies?
explanatory variables are excluded, since tax variables pick up the influence of omitted variables in basic specifications.18
Column (4) considers three governance measures. A Heritage Foundation measure of economic freedom captures various aspects of institutional strength; this index has been widely used in other cross-country empirical analyses. I also use World Bank indicators of corruption and effective governance. Both the economic freedom and the effective governance measures are positively associated with top companies, though in fact less corrupt countries (since higher values of the index reflect better outcomes) are associated with fewer Global 2000 companies.19
Column (5) adds measures of education and innovation achievement, including the count of top 500 global universities (in natural log form), patent filings (in natural log form), and R&D researchers as a share of the population. Both patents and top universities are associated with higher Global 2000 company counts; however, R&D researchers are negatively associated with top company counts, although this finding disappears in the column (6) specification.
Column (6) includes the complete set of independent variables from columns (3) to (5), and the overall pattern of results is similar. Of some note, the number of observations is necessarily smaller as more variables are included. I also ran specifications where the sample was constrained to a uniform, and smaller, size. The tax coefficient in the first column is then statistically insignificant, but most of the other results are nearly unchanged.
Tables 3 and 4 repeat these same specifications for two other dependent variables, the amount of Global 2000 company sales of each economy, and the amount of Global 2000 company market value of each economy. Similar patterns emerge. In Table 3, both GDP and GDP per capita have larger positive associations with the dependent variable. The tax rate coefficient keeps its statistical significance in columns (5) and (6). In the column (2) specification with the tax*GDP interaction term, tax rates again have a negative relationship with the Global 2000 sales measure only for those countries with GDPs below a threshold, now $630 billion; the 20 largest countries in the sample are beyond the $630 billion threshold. Table 4 results are similar to those in Table 3, although the tax coefficient is again statistically insignificant after the first two columns. Similar specifications were run for the assets and profits headquarters measures, with similar patterns emerging.20
18 Partial correlation matrices indicate that the tax variable is positively correlated with land area, universities, and patents, and negatively correlated with the Heritage Foundation economic freedom score, the World Bank (absence of) corruption indicator, and the World Bank government effectiveness measure.
19 There were a large number of possible governance measures from both the Heritage Foundation and the World Bank; it was a judgment call regarding which variables to include. Those I omitted were often statistically insignificant; including too many measures can create problems of multicollinearity.
20 To conserve space, results are not reported here but are available from the author upon request.
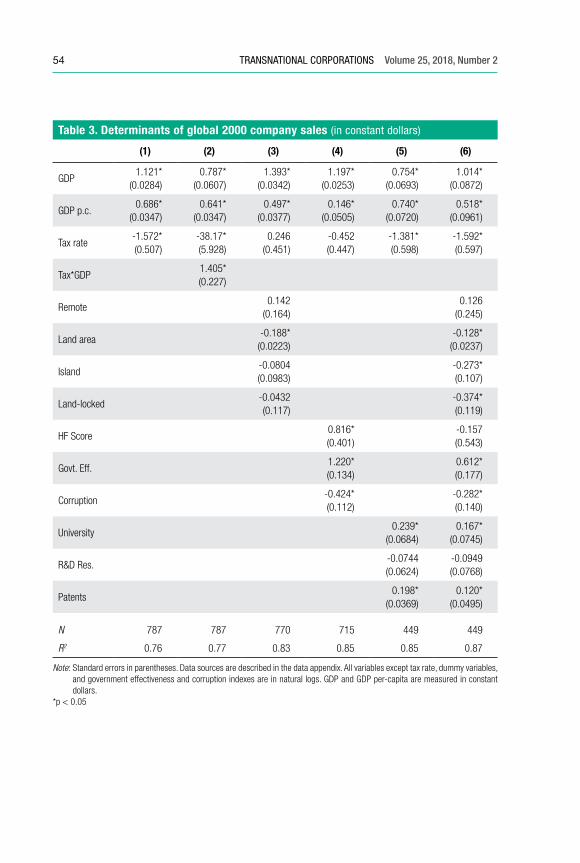
54 TRANSNATIONAL CORPORATIONS Volume 25, 2018, Number 2
Table 3. Determinants of global 2000 company sales (in constant dollars)
(1) (2) (3) (4) (5) (6)
GDP1.121*
(0.0284)0.787*
(0.0607)1.393*
(0.0342)1.197*
(0.0253)0.754*
(0.0693)1.014*
(0.0872)
GDP p.c.0.686*
(0.0347)0.641*
(0.0347)0.497*
(0.0377)0.146*
(0.0505)0.740*
(0.0720)0.518*
(0.0961)
Tax rate-1.572*(0.507)
-38.17*(5.928)
0.246(0.451)
-0.452(0.447)
-1.381*(0.598)
-1.592*(0.597)
Tax*GDP1.405*(0.227)
Remote0.142
(0.164)0.126
(0.245)
Land area-0.188*
(0.0223)-0.128*
(0.0237)
Island-0.0804(0.0983)
-0.273*(0.107)
Land-locked-0.0432(0.117)
-0.374*(0.119)
HF Score0.816*(0.401)
-0.157(0.543)
Govt. Eff.1.220*(0.134)
0.612*(0.177)
Corruption-0.424*(0.112)
-0.282*(0.140)
University0.239*
(0.0684)0.167*
(0.0745)
R&D Res.-0.0744(0.0624)
-0.0949(0.0768)
Patents0.198*
(0.0369)0.120*
(0.0495)
N 787 787 770 715 449 449
R2 0.76 0.77 0.83 0.85 0.85 0.87
Note: Standard errors in parentheses. Data sources are described in the data appendix. All variables except tax rate, dummy variables, and government effectiveness and corruption indexes are in natural logs. GDP and GDP per-capita are measured in constant dollars.
*p < 0.05
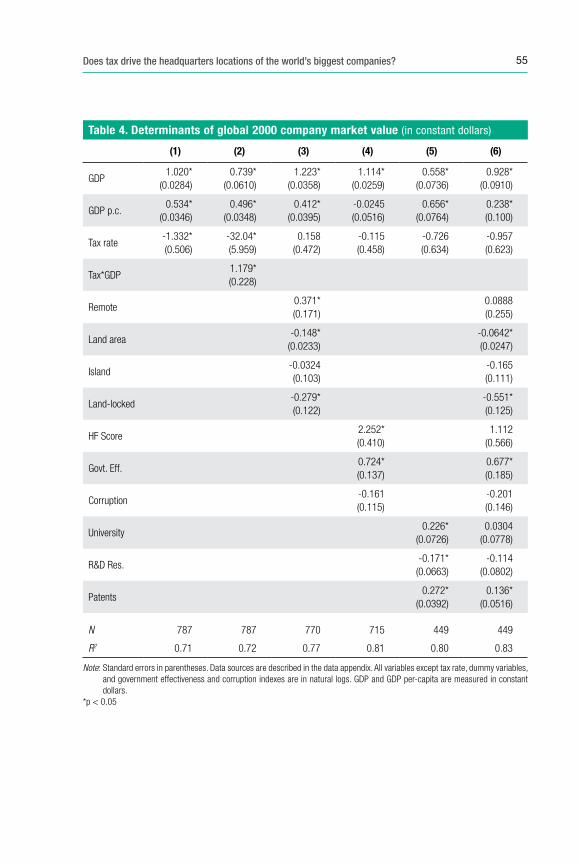
55Does tax drive the headquarters locations of the world’s biggest companies?
Table 4. Determinants of global 2000 company market value (in constant dollars)
(1) (2) (3) (4) (5) (6)
GDP1.020*
(0.0284)0.739*
(0.0610)1.223*
(0.0358)1.114*
(0.0259)0.558*
(0.0736)0.928*
(0.0910)
GDP p.c.0.534*
(0.0346)0.496*
(0.0348)0.412*
(0.0395)-0.0245(0.0516)
0.656*(0.0764)
0.238*(0.100)
Tax rate-1.332*(0.506)
-32.04*(5.959)
0.158(0.472)
-0.115(0.458)
-0.726(0.634)
-0.957(0.623)
Tax*GDP1.179*(0.228)
Remote0.371*(0.171)
0.0888(0.255)
Land area-0.148*
(0.0233)-0.0642*(0.0247)
Island-0.0324(0.103)
-0.165(0.111)
Land-locked-0.279*(0.122)
-0.551*(0.125)
HF Score2.252*(0.410)
1.112(0.566)
Govt. Eff.0.724*(0.137)
0.677*(0.185)
Corruption-0.161(0.115)
-0.201(0.146)
University0.226*
(0.0726)0.0304
(0.0778)
R&D Res.-0.171*
(0.0663)-0.114
(0.0802)
Patents0.272*
(0.0392)0.136*
(0.0516)
N 787 787 770 715 449 449
R2 0.71 0.72 0.77 0.81 0.80 0.83
Note: Standard errors in parentheses. Data sources are described in the data appendix. All variables except tax rate, dummy variables, and government effectiveness and corruption indexes are in natural logs. GDP and GDP per-capita are measured in constant dollars.
*p < 0.05
56 TRANSNATIONAL CORPORATIONS Volume 25, 2018, Number 2
I also considered country fixed- effects specifications for the main results. Since cross-section variation dominates this data set, several of the statistically significant relationships become statistically indistinguishable from zero. More tax coefficients are statistically indistinguishable from zero, and that is also true for many independent variables. GDP, at times, is no longer statistically significantly associated with greater top company activity, but GDP per capita now has a consistently larger and statistically significant positive effect. In the typical specification, a 1 percent increase in GDP per capita is associated with a 2 percent increase in Global 2000 company measures.
5. Why are headquarters important?
There are several reasons why countries seek to attract multinational activity. Additional investment can increase an economy’s potential output, worker productivity, and wages. Headquartering the world’s largest companies may attract additional benefits, including the ability to tax companies that are more likely to have excess profits, greater innovation and learning spillovers to the larger economy, and high-wage managerial jobs. Table 5 considers some of the raw correlations between headquarters measures and other measures of valued policy goals: R&D, patent and trademark applications, top universities, and educational achievement. All of these indicators are positively correlated with headquarters measures, with astonishingly high correlations between headquarters measures and top universities as well as non-resident patent applications. Of interest, non-resident patent applications are far more tightly correlated with headquarters measures than resident patent applications.21
Of course, correlation does not imply causality; that adage is important to remember when examining both raw correlations as well as the partial correlations of the prior tables. Top universities may be more likely to fuel top companies than vice versa, but there are likely symbiotic elements to their relationship, and both measures of success are likely deeply reliant on other factors that help nations prosper. A well-educated workforce; stable, inclusive institutions; and macroeconomic stability are all examples of deeply important fundamentals.
I also examined specifications that consider determinants of key indicators of innovation, such top universities, patent applications, and trademark applications. For these indicators, I ran specifications very similar to those of Tables 3-5, and similar patterns emerged.22 Large economies with rich citizens are associated with
21 For this data set, the mean of the nonresident patent variable is 13,284 and the mean of the resident patent variable is 25,581.
22 Full results are available from the author upon request.
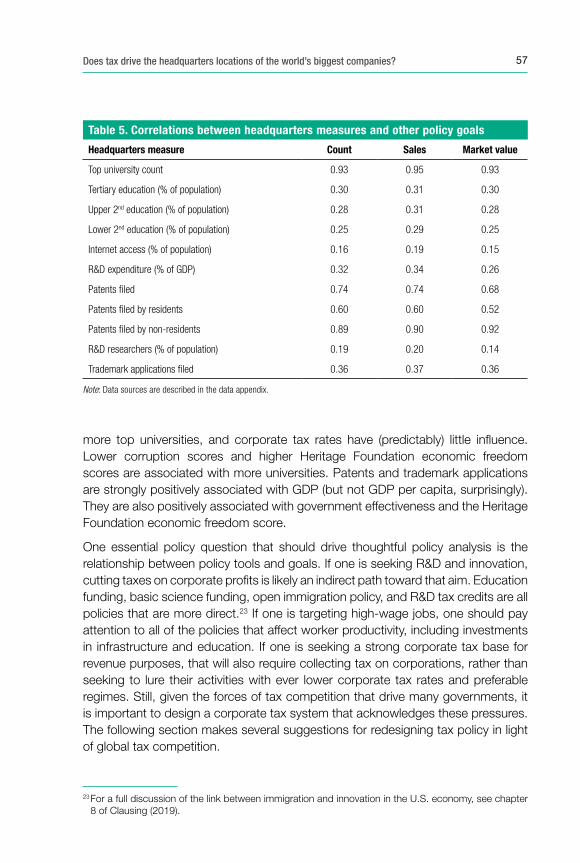
57Does tax drive the headquarters locations of the world’s biggest companies?
more top universities, and corporate tax rates have (predictably) little influence. Lower corruption scores and higher Heritage Foundation economic freedom scores are associated with more universities. Patents and trademark applications are strongly positively associated with GDP (but not GDP per capita, surprisingly). They are also positively associated with government effectiveness and the Heritage Foundation economic freedom score.
One essential policy question that should drive thoughtful policy analysis is the relationship between policy tools and goals. If one is seeking R&D and innovation, cutting taxes on corporate profits is likely an indirect path toward that aim. Education funding, basic science funding, open immigration policy, and R&D tax credits are all policies that are more direct.23 If one is targeting high-wage jobs, one should pay attention to all of the policies that affect worker productivity, including investments in infrastructure and education. If one is seeking a strong corporate tax base for revenue purposes, that will also require collecting tax on corporations, rather than seeking to lure their activities with ever lower corporate tax rates and preferable regimes. Still, given the forces of tax competition that drive many governments, it is important to design a corporate tax system that acknowledges these pressures. The following section makes several suggestions for redesigning tax policy in light of global tax competition.
23 For a full discussion of the link between immigration and innovation in the U.S. economy, see chapter 8 of Clausing (2019).
Table 5. Correlations between headquarters measures and other policy goals
Headquarters measure Count Sales Market value
Top university count 0.93 0.95 0.93
Tertiary education (% of population) 0.30 0.31 0.30
Upper 2nd education (% of population) 0.28 0.31 0.28
Lower 2nd education (% of population) 0.25 0.29 0.25
Internet access (% of population) 0.16 0.19 0.15
R&D expenditure (% of GDP) 0.32 0.34 0.26
Patents fi led 0.74 0.74 0.68
Patents fi led by residents 0.60 0.60 0.52
Patents fi led by non-residents 0.89 0.90 0.92
R&D researchers (% of population) 0.19 0.20 0.14
Trademark applications fi led 0.36 0.37 0.36
Note: Data sources are described in the data appendix.
58 TRANSNATIONAL CORPORATIONS Volume 25, 2018, Number 2
6. Policy implications
Most countries want to attract corporate headquarters, yet in their attempt to use tax policy toward this aim, they may be more successful in eroding revenue than enhancing competitiveness, thereby imperiling their ability to fund education, infrastructure, and other urgent priorities. Policy-makers face a clear tradeoff between responding to the corporate community with “competitive” corporate tax policy and protecting the corporate tax base.
In the U.S. case, the current policy environment places too much priority on competitiveness relative to tax base protection. In the United States, more than $100 billion a year is lost in tax revenue as a result of profit shifting, and the recent legislation of 2017, colloquially referred to as the Tax Cuts and Jobs Act (TCJA), actually makes the profit shifting problem slightly worse.24 As Figure 2 shows, U.S. corporate tax revenues as a share of GDP are, at best, stagnant, despite large increases in corporate profits. These trends were before the $650 billion in corporate tax cuts just enacted. Indeed, corporate tax base protection is sorely needed, but the TCJA ultimately prioritizes tax cuts over that goal.25
At the same time, there is little evidence of a competitiveness problem. The United States has a larger share of Forbes Global 2000 companies (by any measure) than of world GDP, and the U.S. count of these companies is higher in 2017 than it was in 2008. After-tax corporate profits and market valuation are at historically high levels.
Yet international tax competition presents a classic collective action problem. For each country, lowering corporate tax rates is often a dominant strategy; regardless of what peer countries are doing, they attract a larger part of the mobile tax base
24 For a study of the revenue lost due to profit shifting, see Clausing (2016b). The Joint Committee on Taxation (JCT) estimates that the international changes in the law lose revenue over the ten-year window, setting to one side the money from a one-time tax on previously unrepatriated profits.
25 In the legislation, there are several confounding influences that are difficult to separate. The lower tax rate should in theory lighten profit shifting incentives, due to the smaller tax rate difference between the United States and trading partners. However, as shown in Clausing (2016b), most profit shifting occurs with respect to the lowest tax rate havens, and there are still substantial incentives to shift profits to havens post-TCJA, since haven income is taxed at half the U.S. rate under the legislation. In addition, the adoption of a territorial regime should increase the incentive to shift profit offshore to low tax locations, since there is no fear of tax due upon repatriation. Finally, there are base protections in the legislation, with the colorful acronyms GILTI and BEAT, that attempt to combat profit shifting. Yet, when all the dust clears, the JCT estimates indicate that the provisions of the law that address the taxation of international income are revenue-losing, implying that the corporate tax base is smaller as a result of the international provisions, at the end of the ten-year window. (This ignores the tax revenue collected due to the one-time tax on prior unrepatriated earnings; while raising revenue, this provision represents a tax cut relative to prior law, and it is a one-time occurrence.)
59Does tax drive the headquarters locations of the world’s biggest companies?
with a lower rate.26 This may generate a situation where the non-cooperative outcome may be inferior to the cooperative outcome, since tax rates and revenues will be sub-optimally low. If countries had the political will and institutional capacity to negotiate an agreement, they might find it in their mutual interest to limit tax competition.
Recently, the OECD/G20 BEPS (base erosion and profit shifting) initiative attempted to respond to similar concerns, suggesting nearly 2000 pages of guidelines to limit corporate tax base erosion. Profit shifting is a huge problem; estimates in Clausing (2016b) suggest a tax revenue loss to major countries of more than $300 billion annually. This problem is more than pressure to lower corporate tax rates. There is also tax regime competition, whereby tax havens siphon off large amounts of tax revenue.
Still, although international cooperation sounds nice, in practice it can be difficult to overcome collective action problems. The OECD/G20 initiative on BEPS was an important step forward, but most feel that the overall approach suffered from undue complexity, gradualism, and discretion. In particular, the guidelines were very complicated, reforms did not address the fundamental problems, and important countries could easily forgo adoption.
However, there are still promising directions for future reforms that would ease tradeoffs between competitiveness and corporate tax base protection. For example, formulary apportionment of global income provides a useful framework for establishing how to assign taxing rights for truly global income. This framework has worked well in many subnational contexts and has been suggested as a reform in the European Union’s common consolidated corporate tax base (CCCTB) project. Under a formulary approach, tax burdens are based on a company’s global income and a formula that determines what fraction of their global profit is taxable in a particular jurisdiction, based on the real economic activities (such as sales and employment) occurring in that jurisdiction, as a share of a company’s global activities. For example, if a company has $10 billion of profit worldwide, and half of their formula factors in the United States (e.g., sales and employment), then half of their global profit would be taxable in the United States.
Under this system, profit shifting is not possible without altering the factors in the formula. And since customers and employees are far less tax-sensitive than paper profits, this system would dramatically lower the tax sensitivity of the tax base. Ideally, countries would agree on the same formula and would all adopt this system.
26 This is a classical prisoners’ dilemma problem. Consider an example with two countries. If the peer country chooses a high rate, the home country has an incentive to chose a lower rate, to lure the mobile tax base away. If the peer country chooses a low rate, the home country has an incentive to chose a low rate to avoid losing tax base. Thus, a race to the bottom in corporate tax rates ensues.
60 TRANSNATIONAL CORPORATIONS Volume 25, 2018, Number 2
However, there is a strong incentive for follower countries to become adopters if leader countries adopt, to defend their own tax base. In particular, adopting countries will become magnets for paper profit-shifting, since profits shifted to formulary countries do not affect tax liabilities in those countries but do reduce non-adopter’s tax revenues. A far more detailed discussion of formulary apportionment is found within Avi-Yonah and Clausing (2008) and Avi-Yonah, Clausing, and Durst (2009), where a sales-based formula is suggested.
A sales-based formulary apportionment system has similar economic effects as a destination-based cash flow tax, or DBCFT. In both cases, tax liabilities are based on the destination of sales, or where the customers of a company’s products are located. In the case of a DBCFT, the tax base is also redefined such that tax burdens fall only on company rents rather than the normal return to capital. (This can also be true under a classic corporate tax base, if the normal return to capital is exempt from taxation.27) A DBCFT can raise some thorny transition issues, however, due to the need for a border adjustment tax; these are discussed further elsewhere.28
For individual countries, there are also useful incremental reforms that are can be implemented unilaterally, acknowledging the starting point. For example, in the United States, the most recent corporate tax law change was accompanied by a global minimum tax at half the level of the new lower U.S. rate (21 percent). Making the minimum tax a per-country minimum tax, rather than a global one, would more effectively discourage profit shifting and support the U.S. corporate tax base. At present, companies have an incentive to earn income in both high-tax and low-tax foreign countries, relative to the United States, since those streams of income can be blended and taxed at the minimum tax rate, a rate far lower than the U.S. domestic rate. Also, raising the minimum tax rate closer to the domestic rate, while addressing the potential for corporate inversions in parallel, would help protect the U.S. corporate tax base. There are many useful policy remedies for tackling inversions, discussed extensively elsewhere.29
In short, while multinational companies come with many important desiderata, cutting tax rates on the income of corporations is not the most direct way to achieve policy aims. There are more direct ways to encourage high-wage jobs, innovation, and productivity. Further, defending the corporate tax base is important, for reasons discussed extensively in Clausing (2016c) and briefly summarized as follows. In addition to meeting revenue needs directly, the corporate tax is an important backstop to the individual tax system, in part because large amounts
27 This can arise from an allowance for corporate equity or expensing. Of note, debt-financed investments are often subsidized under many countries’ tax systems.
28 As one example, see Avi-Yonah and Clausing (2017).29 For example, see Kleinbard (2014), Shay (2014), and Clausing (2014).
61Does tax drive the headquarters locations of the world’s biggest companies?
of capital income go untaxed at the individual level. The corporate tax is also a progressive tax, much more so than other major tax instruments. Recent literature suggests that taxing capital income is no more inefficient than taxing labor income. Further, a large share of the corporate tax base is actually rents, or super-normal profits. And, it has long been understood that taxation of super-normal profits is efficient, unlike most taxes.
7. Conclusion
The world’s largest companies are often coveted by policy-makers, who value their large-scale investment and employment, their higher wages and profits, and their ability to lead markets in innovation, brand recognition, and productivity. Government policy-makers have been attentive to the needs of multinational companies, and there has been a steady downward march in corporate tax rates. Yet policy-makers face a tradeoff between attending to the competitiveness of multinational companies and protecting the corporate tax base.
This paper has considered that tradeoff in light of data on the world’s largest 2000 public companies. The composition of this group of companies has changed substantially in recent years, due in large part to the economic growth of emerging Asia. This group of companies has also become larger and more profitable; their sales totaled $39 trillion in 2017, and their profits have risen by over 200 percent in the last 15 years (in real terms).
Empirical analysis suggests that the most important determinant of a country’s Global 2000 company activity, by any measure (sales, profits, count, etc.), is the size of the economy, both in terms of sheer scale (GDP) and in terms of the average income level of its members (GDP per capita). Governance, geographic, and education variables are also important, and tax rates have a statistically significant negative relationship with headquarters measures in some specifications, especially for countries with small economies and in specifications that do not include other control variables.
The data suggest that countries that have sound fundamentals tend to have both good corporate outcomes and good education and innovation outcomes. Indeed, governments should focus on these fundamental factors, which include strong education systems and institutional strength. Tax revenue is important for addressing many fundamental needs of society, including investments in infrastructure and education. It is therefore important to protect the corporate tax, which has a key role in an efficient and equitable tax system. International tax policy design should focus on reforms that would make the tradeoff between competitiveness and corporate tax base protection less vexing. In this light, formulary apportionment, and destination-based taxation, are promising reforms.
62 TRANSNATIONAL CORPORATIONS Volume 25, 2018, Number 2
While waiting for such fundamental reforms, there are also many useful incremental policy steps that governments can take to protect their corporate tax base without sacrificing competitiveness.
References
Allen, Eric J., and Susan C. Morse. 2013. “Tax Haven Incorporation for U.S. Headquartered Firms: No Exodus Yet.” National Tax Journal 66 (2): 395–420.
Avi-Yonah, Reuven S., and Kimberly A. Clausing. 2008. “Reforming Corporate Taxation in a Global Economy: A Proposal To Adopt Formulary Apportionment.” In Path to Prosperity: Hamilton Project Ideas on Income Security, Education, and Taxes, edited by Jason Furman and Jason E. Bordoff, 319–44. Washington: Brookings Institution Press.
———. 2017. “Problems with Destination-Based Corporate Taxes and the Ryan Blueprint.” Columbia Journal of Tax Law 8: 229–55.
Avi-Yonah, Reuven S., Kimberly A. Clausing, and Michael C. Durst. 2009. “Allocating Business Profits for Tax Purposes: A Proposal to Adopt a Formulary Profit Split.” Florida Tax Review 9 (5): 497–553.
Baaij, Marc G., Tom J. M. Mom, Frans A. J. Van den Bosch, and Henk W. Volberda. 2015. “Why Do Multinational Corporations Relocate Core Parts of Their Corporate Headquarters Abroad?” Long Range Planning 48 (1): 46–58.
Baaij, Marc G., and Arjen H. L. Slangen. 2013. “The Role of Headquarters–Subsidiary Geographic Distance in Strategic Decisions by Spatially Disaggregated Headquarters.” Journal of International Business Studies 44 (9): 941–52.
Baldwin, Richard, and Paul Krugman. 2004. “Agglomeration, Integration, and Tax Harmonisation.” European Economic Review 48 (February): 1–23.
Baldwin, Richard, and Toshihiro Okubo. 2009. “Tax Reform, Delocation, and Heterogenous Firms.” Scandinavian Journal of Economics 111: 741–64.
Barrios, Salvador, Harry Huizinga, Luc Laeven, and Gaëtan Nicodème. 2012. “International Taxation and Multinational Firm Location Decisions.” Journal of Public Economics, Fiscal Federalism, 96 (11): 946–58.
Becker, Sascha O., Peter H. Egger, and Valeria Merlo. 2009. “How Low Business Tax Rates Attract Multinational Headquarters: Municipality-Level Evidence from Germany.” CESIFO Working Paper No. 2517. Munich.
Belderbos, René, Helen S. Du, and Anthony Goerzen. 2017. “Global Cities, Connectivity, and the Location Choice of MNC Regional Headquarters.” Journal of Management Studies 54 (8): 1271–1302.
Belz, Thomas, Leslie A. Robinson, Martin Ruf, and Christian Steffens. 2016. “Tax Avoidance as a Driver of Mergers and Acquisitions.” SSRN Scholarly Paper. Rochester, NY: Social Science Research Network.
63Does tax drive the headquarters locations of the world’s biggest companies?
Benito, Gabriel R. G., Randi Lunnan, and Sverre Tomassen. 2011. “Distant Encounters of the Third Kind: Multinational Companies Locating Divisional Headquarters Abroad.” Journal of Management Studies 48 (2): 373–94.
Birkinshaw, Julian, Pontus Braunerhjelm, Ulf Holm, and Siri Terjesen. 2006. “Why Do Some Multinational Corporations Relocate Their Headquarters Overseas?” Strategic Management Journal 27 (7): 681–700.
Bloom, Nicholas, Raffaella Sadun, and John Van Reenen. 2012. “The Organization of Firms Across Countries.” The Quarterly Journal of Economics 127 (4): 1663–1705.
Card, David, Kevin F. Hallock, and Enrico Moretti. 2010. “The Geography of Giving: The Effect of Corporate Headquarters on Local Charities.” Journal of Public Economics 94 (3): 222–34.
Clausing, Kimberly A. 2007. “Corporate Tax Revenues in OECD Countries.” International Tax and Public Finance 14: 115–33.
———. 2010. “Should Tax Policy Target Multinational Firm Headquarters?” National Tax Journal 63 (4): 741–63.
———. 2012. “In Search of Corporate Tax Incidence.” Tax Law Review 65 (3): 433–72.
———. 2014. “Corporate Inversions.” Washington DC: Tax Policy Center.
———. 2016a. “Competitiveness, Tax Base Erosion, and the Essential Dilemma of Corporate Tax Reform,” BYU Law Review, no. 6: 1649–80.
———. 2016b. “The Effect of Profit Shifting on the Corporate Tax Base in the United States and Beyond.” National Tax Journal 69 (4): 905–34.
———. 2016c. “Strengthening the Indispensable U.S. Corporate Tax.” Equitable Growth. September.
———. 2019. (Forthcoming.) Open: The Progressive Case for Free Trade, Immigration, and Global Capital. Cambridge: Harvard University Press.
Defever, Fabrice. 2012. “The Spatial Organization of Multinational Firms.” Canadian Journal of Economics/Revue Canadienne d’économique 45 (2): 672–97.
De Mooij, Ruud A., and Sjef Ederveen. 2003. “Taxation and Foreign Direct Investment: A Synthesis of Empirical Research.” International Tax and Public Finance 10 (November): 673–93.
———. 2008. “Corporate Tax Elasticities: A Reader’s Guide to Empirical Findings.” Oxford Review of Economic Policy 24: 680–97.
Desai, Mihir A. 2009. “The Decentering of the Global Firm.” World Economy 32 (9): 1271–90.
Dischinger, Matthias, Bodo Knoll, and Nadine Riedel. 2014a. “There’s No Place Like Home: The Profitability Gap between Headquarters and Their Foreign Subsidiaries.” Journal of Economics & Management Strategy 23 (2): 369–95.
———. 2014b. “The Role of Headquarters in Multinational Profit Shifting Strategies.” International Tax and Public Finance 21 (2): 248–71.
Egger, Peter, Doina Radulescu, and Nora Strecker. 2013. “Effective Labor Taxation and the International Relocation of Headquarters.” International Tax and Public Finance 20 (4): 631–52.
64 TRANSNATIONAL CORPORATIONS Volume 25, 2018, Number 2
Goerzen, Anthony, Christian Geisler Asmussen, and Bo Bernhard Nielsen. 2013. “Global Cities and Multinational Enterprise Location Strategy.” Journal of International Business Studies 44 (5): 427–50.
Haufler, Andreas, and Ian Wooton. 1999. “Country Size and Tax Competition for Foreign Direct Investment.” Journal of Public Economics 71: 121–39.
Huizinga, Harry, and Johannes Voget. 2009. “International Taxation and the Direction and Volume of Cross Border M&As.” Journal of Finance LXIV (June): 1217–49.
Kleinbard, Edward D. 2014. “Competitiveness Has Nothing to Do With It.” Tax Notes 144 (September).
Krugman, Paul R. 1991. Geography and Trade. Cambridge: MIT Press.
Laamanen, Tomi, Tatu Simula, and Sami Torstila. 2012. “Cross-Border Relocations of Headquarters in Europe.” Journal of International Business Studies 43 (2): 187–210.
McKinsey Global Institute. 2015. “Playing to Win: The New Global Competition for Corporate Profits.”
Shay, Stephen. 2014. “Mr. Secretary, Take the Tax Juice Out of Corporate Expatriations.” Tax Notes, July.
United Nations Conference on Trade and Development. 2015. World Investment Report 2015: Reforming International Investment Governance. Geneva: United Nations.
Voget, Johannes. 2011. “Relocation of Headquarters and International Taxation.” Journal of Public Economics 95 (9): 1067–81.
Wang, Danny T., Simon X. Zhao, Flora F. Gu, and Wendy Y. Chen. 2011. “Power or Market? Location Determinants of Multinational Headquarters in China.” Environment and Planning A: Economy and Space 43 (10): 2364–83.
65Does tax drive the headquarters locations of the world’s biggest companies?
Appendix
Data sources and definitions
Forbes provides annual rankings of the top 2000 public companies worldwide. The most recent list is provided and discussed here: https://www.forbes.com/global2000/#6e63f2b4335d.
Data on GDP, GDP per capita, and land area are from the World Bank’s World Development Indicators. Data on government effectiveness and corruption are from the World Bank’s World Governance Indicators.
Remoteness is from the UN Human Development Report. It is defined as the GDP-weighted average distance from world markets, calculated as the sum of all bilateral distances between the capitals of one country and all others, weighted by the partner country’s share in world GDP. The measure is calculated with 2012 World Bank GDP data and 2013 CEPII geographic distance data.
Statutory tax rates are from Ernst & Young’s Worldwide Corporate Tax Guides, with occasional supplementary information from the OECD Tax Database, Deloitte International Tax Source, KPMG Corporate Tax Rate Table, PricewaterhouseCoopers’ Paying Taxes Guides, and PKF International. The rates recorded generally reflect the standard statutory rate at the national level.
The annual ranking of world universities is from Shanghai Ranking Consultancy. The top 500 universities are ranked by a weighted index of Nobel Laureates and Field Medalists among alumni (10%) and faculty (20%), faculty citations (20%), faculty publications in Nature or Science (20%), the Science Citation Index-Expanded or Social Science Citation Index (20%), and per-capita academic performance (10%).
Educational attainment data, R&D expenditures, and researchers in R&D are from the UNESCO Institute for Statistics.
Patent and trademark application data are from the World Intellectual Property Organization.
Internet access data are from the International Telecommunication Union, World Telecommunication/ICT Development Report and database.
The Heritage Foundation economic freedom index comprises 12 sub-indexes organized into four broad categories: Rule of Law (property rights, government integrity, judicial effectiveness), Government Size (government spending, tax burden, fiscal health), Regulatory Efficiency (business freedom, labor freedom, monetary freedom), and Open Markets (trade freedom, investment freedom, financial freedom). Each index is graded on a 0-100 scale, and the non-weighted average of the 12 scores is the overall economic freedom score.

67
Sharing the corporate tax base: equitable taxing of multinationals and the choice
of formulary apportionment
Tommaso Faccio and Valpy Fitzgerald*
Tax avoidance by multinational enterprises (MNEs) is a global problem. Most cross-border trade occurs within MNEs, susceptible to abuse of gaps and loopholes in domestic and international tax law that allow “profit shifting” between fiscal jurisdictions in order to reduce corporate tax liability. A lack of transparency makes this kind of tax avoidance difficult to quantify – let alone to monitor and control. This paper provides a case study of profit shifting using publicly available, unique, country-by-country reporting data for Vodafone Group Plc, the first large MNE to voluntarily publish such data. We show the tax impact of a move to formulary apportionment on a global basis, and under the European Union’s Common Consolidated Corporate Tax Base proposal. We also consider the rationale for the current proposals for apportionment factors and propose an alternative.
Keywords: transfer pricing, formulary apportionment, CCCTB, developing countries, tax avoidance, horizontal equity, vertical equity, equal distribution, taxing rights
1. Introduction
The avoidance of corporation tax by multinational enterprises (MNEs) – essentially on behalf of their shareholders – is facilitated by current international tax rules, based on the separate entity and arm’s length principles. MNEs are able to exploit this system to minimise their tax liability, by shifting profits to countries with low or zero tax rates, undermining the tax base of those where real activities take place and reducing government revenues worldwide, in both developed and developing countries.
The scale of this profit shifting to low-tax jurisdictions – known to the International Monetary Fund (IMF) as “conduits” – is very large, involving as much as two-fifths of MNE profits. It has also exacerbated tax competition between countries: the global average statutory corporate tax rate has fallen by more than half over the past three decades (Zucman et al., 2018).
* Tommaso Faccio ([email protected]) is the Head of the Secretariat of the Independent Commission for the Reform of International Corporate Taxation, or ICRICT (www.icrict.com), and Lecturer in Accounting at Nottingham University Business School.
Valpy Fitzgerald ([email protected]) is one of ICRICT’s Commissioners and Emeritus Professor of International Development Finance at Oxford University.
68 TRANSNATIONAL CORPORATIONS Volume 25, 2018, Number 2
Offshore investment hubs also play a major role in global investment. Some 30% of cross-border corporate investment stocks have been routed through conduit countries before reaching their destination as productive assets, and a logical corollary of the outsized role of offshore hubs in global corporate investments is tax planning (UNCTAD, 2015).
In consequence, G20 world leaders in 2013 gave their support to the Organisation for Economic Cooperation and Development (OECD) project on base erosion and profit shifting (BEPS), calling for reform of the rules to ensure that MNEs would be taxed “where economic activities occur and value is created”.1 However, the approach taken under the BEPS project2 still relies on transfer pricing rules, which start from the independent entity principle and transactional analysis, the so called “arm’s length principle”. Unfortunately, this principle is extraordinarily difficult to apply objectively in practice.
Alternatives to the arm’s length principle do exist (Faccio and Picciotto, 2017) and a logical alternative (ICRICT, 2018) would be to assess multinationals on a worldwide basis (country-by-country reporting, or CbCR) and apportion profits (that is, the tax base) by a formula which would allocate a firm’s worldwide income across countries, based on allocation factors that reflect real economic activities (e.g. sales, employees, assets). Domestic corporate taxes would be paid on the share of the worldwide income that is allocated to each jurisdiction.
Such apportionment systems do exist, of course, within federal states. Historically, many US states have used the so-called “Massachusetts formula”, which uses equal weights on property, payroll and sales, to assess local corporate tax liability from national accounts. Canada employs a similar system, but with equal weights on gross receipts and payroll. Following a similar logic, the European Union (EU) has recently decided to relaunch a project for a Common Consolidated Corporate Tax Base (CCCTB)3 based on formulary apportionment, with a decision expected by the end of 2018.
Initial estimates by the IMF – discussed below – of the effect of such a system, using aggregate data for US firms overseas, indicate that the tax revenue gains would be large for both developed and developing countries, the impact depending on the weights used in the apportionment formula (IMF, 2014). Previous studies using firm-level data (Clausing and Lahav, 2011; Krchniva, 2014) are based on extrapolation
1 http://www.g20.utoronto.ca/2013/2013-0905-tax.html, paragraph 7. 2 http://www.oecd.org/tax/beps/beps-actions.htm.3 https://ec.europa.eu/taxation_customs/business/company-tax/common-consolidated-corporate-
tax-base-ccctb_en.
69Sharing the corporate tax base: equitable taxing of multinationals and the choice of formulary apportionment
from multinationals’ financial information available in databases or from financial statements. However, there have been no studies using publicly available CbCR data for multinational firms covering a large number of countries, both developed and developing.
The purpose of this paper is to examine in detail the scale of profit shifting and the effects of apportionment at the firm level, using CbCR recently published by Vodafone Group Plc. Vodafone is the first multinational group to voluntarily publish CbCR data, and we hope that its effort to increase transparency by publishing basic financial and qualitative information for each of the countries in which it operates will be followed by other multinational groups. Section 2 explores the tax apportionment issue and establishes three models to be applied to this data. The Vodafone data are presented in Section 3, and the results of the three apportionment models are discussed. Section 4 examines critically the logical basis for these apportionment proposals and sketches a possible alternative based on equity criteria. Section 5 concludes with some implications for future research and policy discussion.
2. Formulary apportionment
Tax avoidance by MNEs is a global problem. The greater part of cross-border commerce takes place within MNEs, with an estimated two-thirds of global trade involving related parties (UNCTAD, 2013). This type of trade is susceptible to abusive exploitation of gaps and loopholes in domestic and international tax law that allow for “profit shifting” from country to country, with the intention of reducing the taxes paid on profits. A lack of transparency makes this kind of tax avoidance difficult to quantify, let alone monitor or prevent.
Under the arm’s length principle, which underlies separate entity accounting, a multinational corporate group should price transactions with its affiliated entities as if those transactions had occurred with unrelated entities. For tax purposes, affiliated businesses should set transfer prices at levels that would have prevailed had the transactions occurred between unrelated parties.
Multinationals are therefore required to identify market-based prices for goods and services transferred within the multinational, to obtain a price that approximates the result that independent entities would reach in the market.
Transfer pricing rules attempt to construct prices for the transactions among entities that are part of MNEs as if they were independent. This is inconsistent with the economic reality of modern-day MNEs, which are unified firms run by a single management entity and organised to reap the benefits of integration across jurisdictions. This approach requires subjective, ad hoc and discretionary evaluation of each taxpayer by tax authorities in the different jurisdictions in which the taxpayer operates.
70 TRANSNATIONAL CORPORATIONS Volume 25, 2018, Number 2
This system also requires significant resources from skilled tax authorities and maintains the incentive for multinationals to create ever more complex group structures to minimise taxes (e.g. investment schemes involving offshore financial centres and special purpose entities) (UNCTAD, 2016).
Profits can be shifted between the affiliates of multinationals in many ways, through the provision of services or sale of goods (multinational groups can manipulate intra-group exports and import prices so that subsidiaries in high-tax countries export goods and services at low prices to related firms in low-tax countries and import from them at high prices; such transfer price manipulations reduce profits in high-tax countries and increase them in low-tax countries), through intra-group lending (affiliates in high-tax countries borrow money from affiliates in low-tax countries, which again reduces profits in high-tax countries and increases them in low-tax countries) and the licensing of intangible assets (e.g. proprietary trademarks, logos and patents owned by affiliates in low-tax countries are licensed to other affiliates within the group; these affiliates then receive royalties which reduce profits in high-tax countries).
An alternative to the arms-length approach, espoused by the OECD in the BEPS project, would be to tax multinationals under formulary apportionment. Under formulary apportionment, multinationals are treated as a unitary business based on the legal and economic control the parent corporation exercises over its subsidiaries. This unitary business is treated as a single taxpayer, and its income is calculated by subtracting worldwide expenses from worldwide income, based on a global common accounting system. The resulting net income is apportioned among taxing jurisdictions on the basis of a formula that takes into account various agreed factors (e.g. sales, employees). Each jurisdiction then applies its tax rate to the income apportioned to it by the formula and collects the amount of tax resulting from this calculation.
As the global profits of the multinational are distributed across different jurisdictions on the basis of an agreed formula, the multinational would not need to calculate the taxable profits earned by each entity of the group in each jurisdiction. In fact, formulary apportionment is currently adopted in the United States and Canada for the intra-country allocation of the profits of a single entity or a group of entities.
In the experience of US states, income has been allocated to state jurisdictions using a variety of formulas. Historically, many states have used the so-called “Massachusetts formula”, which employs equal weights on property, payroll and sales, although, over the years, a significant number of states have moved to a formula that gives more weight to the sales factor (Mintz, 2007). Canada uses equal weights on gross receipts and payroll, with each factor weighted by one-half.
The experience of these countries show that implementation challenges mainly hinge on the apportionment system and the lack of uniformity across states (e.g.
71Sharing the corporate tax base: equitable taxing of multinationals and the choice of formulary apportionment
how the elements of the apportionment formulae are defined) and the lack of consolidation. The importance of gaining agreement among states on a common tax base and common formula is a crucial insight from the experience in the United States and Canada (Weiner, 2005). Despite these challenges, the experience of these two countries provides a useful blueprint for the adoption of this system at the international level.
Under a proposed formulary apportionment system, firms would no longer have an artificial tax incentive to shift income to low-tax locations where their real economic activity is not located. A move to formulary apportionment would also reduce the distortionary features of the current tax system, reducing its complexity and administrative burden.
By ignoring internal arrangements that lead to BEPS, formulary apportionment would enormously simplify international tax rules, ending the need for the complex rules on hybrids, source of income, treaty abuse, and the like. It would also lead to a significant reduction in conflict and uncertainty, by dispensing with ad hoc decisions that require subjective value judgements.
A move to formulary apportionment would also be cost effective and simple for MNEs, as they would need to prepare a global tax return to be submitted to the tax authorities in each of the countries where the multinational operates. There would be an initial setup cost for the appropriate accounting system, but this would be significantly lower than the current cost of implementing, documenting and defending transfer pricing structures under the arm’s length approach.
Through formulary apportionment, tax authorities and government would have a better understanding of MNEs’ profit allocation across countries. Such a system would also be more suited to an integrated world economy and result in simplification gains and administrative savings.
Although a country could introduce formulary apportionment unilaterally, by requiring MNEs to determine what element of their global profits is taxable in that country, a shift towards formulary apportionment is likely to require coordination to facilitate a move to this system, negotiate an appropriate formula and address some of the associated technical issues (e.g. definition of a common tax base, procedure for consolidation of profits and compliance).
So far, formulary apportionment has been tested only on a country level in a limited number of countries (e.g. the United States and Canada), so a coordinated global move to formulary apportionment would likely be complex, but not more complex than the current system and, in any event, more closely aligned to the economic reality of the modern world.
72 TRANSNATIONAL CORPORATIONS Volume 25, 2018, Number 2
The EU has recently decided to relaunch a project for a Common Consolidated Corporate Tax Base (CCCTB)4, a single set of rules to calculate companies’ taxable profits in the EU based on formulary apportionment. With the CCCTB, cross-border companies would have to only comply with a single EU system for computing their taxable income, rather than many national rulebooks, and would be able to offset losses in one Member State against profits in another. The consolidated taxable profits would be shared between the Member States in which the group is active, using an apportionment formula. Each Member State would then tax its share of the profits at its own national tax rate.
It is to be expected that the redistributive effect of the re-apportionment of the tax base would be considerable, although, as yet, there are no reliable estimates of the scale. Figure 1 summarizes the estimates made by the IMF on the basis of data for US firms operating abroad in 2010 (IMF, 2014). Three elements of the apportionment model are considered separately, each allocated according to its location in the respective tax jurisdiction: sales, payroll and employment. As the Fund points out (2014, p. 38), “These are no more than illustrative, but point to large and systematic effects. Advanced economies generally gain tax base, whichever factor is used, while substantial tax base moves out of conduit countries; emerging and developing economies clearly gain base only if heavy weight is placed on employment.”
The category of “conduit” countries as defined by the IMF (2014, p. 18) “refers to countries that are widely perceived as attractive intermediate destinations in the routing of investments—whether for tax or other reasons”. The IMF (2014) identifies Bermuda, Ireland, Luxemburg, the Netherlands, Singapore and Switzerland as “conduit” countries.
Specifically, as Figure 1 indicates, conduit jurisdictions see large reductions (between 50 and 100%) in their tax bases for all four apportionment factors, as would be expected. Further, developed countries experience broadly similar increases in their tax bases under all four factors – of between 30 and 50%. In other words, as far as these two groups of countries are concerned – and assuming that US firms are representative of all MNEs – the redistributive effect would be robust to the precise apportionment formula used.
The same, however, is not true of developing countries, where each factor (and thus its weight in the formula) has a radically different effect – due essentially to the asymmetrical allocation of these factors between developed and developing countries by MNEs. Specifically, developing countries gain from employment
4 https://ec.europa.eu/taxation_customs/business/company-tax/common-consolidated-corporate-tax-base-ccctb_en.
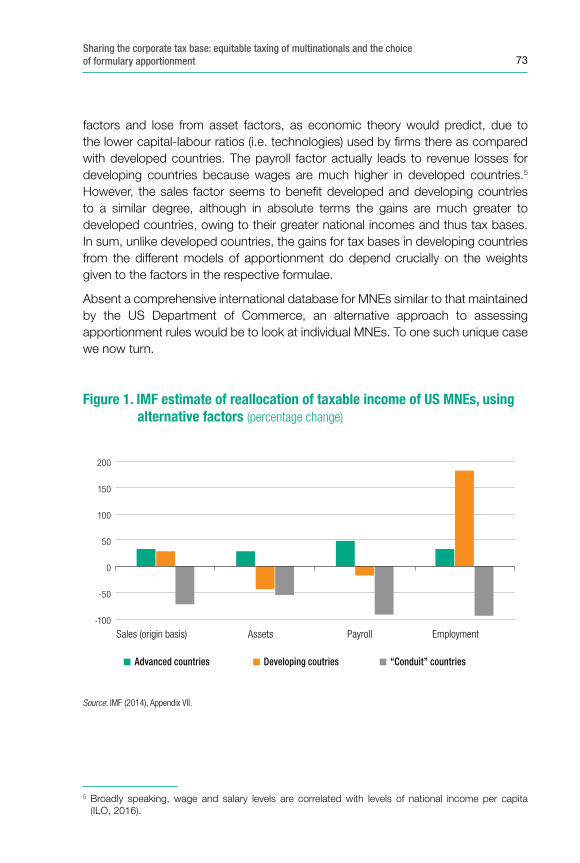
73Sharing the corporate tax base: equitable taxing of multinationals and the choice of formulary apportionment
factors and lose from asset factors, as economic theory would predict, due to the lower capital-labour ratios (i.e. technologies) used by firms there as compared with developed countries. The payroll factor actually leads to revenue losses for developing countries because wages are much higher in developed countries.5 However, the sales factor seems to benefit developed and developing countries to a similar degree, although in absolute terms the gains are much greater to developed countries, owing to their greater national incomes and thus tax bases. In sum, unlike developed countries, the gains for tax bases in developing countries from the different models of apportionment do depend crucially on the weights given to the factors in the respective formulae.
Absent a comprehensive international database for MNEs similar to that maintained by the US Department of Commerce, an alternative approach to assessing apportionment rules would be to look at individual MNEs. To one such unique case we now turn.
5 Broadly speaking, wage and salary levels are correlated with levels of national income per capita (ILO, 2016).
Figure 1. IMF estimate of reallocation of taxable income of US MNEs, using alternative factors (percentage change)
Source: IMF (2014), Appendix VII.
-100
-50
0
50
100
150
200
Sales (origin basis) Assets Payroll Employment
Advanced countries Developing coutries “Conduit” countries
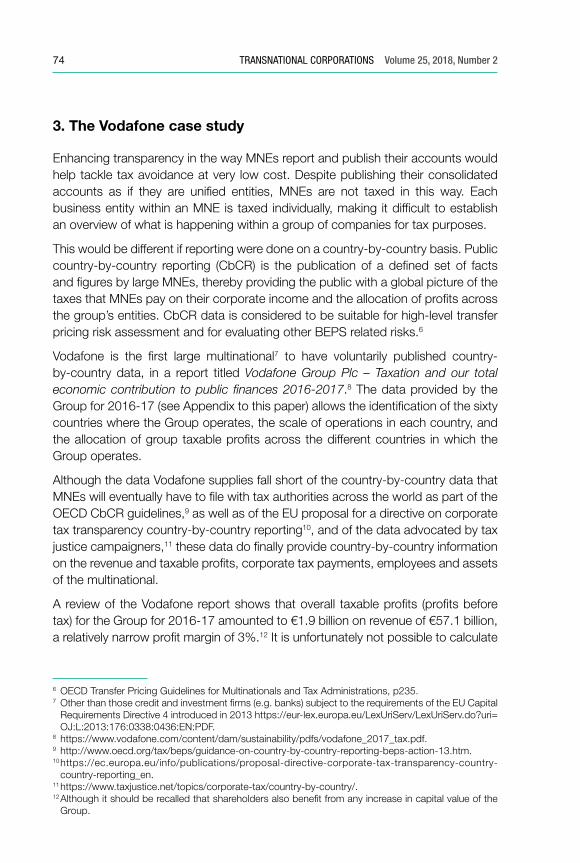
74 TRANSNATIONAL CORPORATIONS Volume 25, 2018, Number 2
3. The Vodafone case study
Enhancing transparency in the way MNEs report and publish their accounts would help tackle tax avoidance at very low cost. Despite publishing their consolidated accounts as if they are unified entities, MNEs are not taxed in this way. Each business entity within an MNE is taxed individually, making it difficult to establish an overview of what is happening within a group of companies for tax purposes.
This would be different if reporting were done on a country-by-country basis. Public country-by-country reporting (CbCR) is the publication of a defined set of facts and figures by large MNEs, thereby providing the public with a global picture of the taxes that MNEs pay on their corporate income and the allocation of profits across the group’s entities. CbCR data is considered to be suitable for high-level transfer pricing risk assessment and for evaluating other BEPS related risks.6
Vodafone is the first large multinational7 to have voluntarily published country-by-country data, in a report titled Vodafone Group Plc – Taxation and our total economic contribution to public finances 2016-2017.8 The data provided by the Group for 2016-17 (see Appendix to this paper) allows the identification of the sixty countries where the Group operates, the scale of operations in each country, and the allocation of group taxable profits across the different countries in which the Group operates.
Although the data Vodafone supplies fall short of the country-by-country data that MNEs will eventually have to file with tax authorities across the world as part of the OECD CbCR guidelines,9 as well as of the EU proposal for a directive on corporate tax transparency country-by-country reporting10, and of the data advocated by tax justice campaigners,11 these data do finally provide country-by-country information on the revenue and taxable profits, corporate tax payments, employees and assets of the multinational.
A review of the Vodafone report shows that overall taxable profits (profits before tax) for the Group for 2016-17 amounted to €1.9 billion on revenue of €57.1 billion, a relatively narrow profit margin of 3%.12 It is unfortunately not possible to calculate
6 OECD Transfer Pricing Guidelines for Multinationals and Tax Administrations, p235.7 Other than those credit and investment firms (e.g. banks) subject to the requirements of the EU Capital
Requirements Directive 4 introduced in 2013 https://eur-lex.europa.eu/LexUriServ/LexUriServ.do?uri=OJ:L:2013:176:0338:0436:EN:PDF.
8 https://www.vodafone.com/content/dam/sustainability/pdfs/vodafone_2017_tax.pdf.9 http://www.oecd.org/tax/beps/guidance-on-country-by-country-reporting-beps-action-13.htm.10 https://ec.europa.eu/info/publications/proposal-directive-corporate-tax-transparency-country-
country-reporting_en.11 https://www.taxjustice.net/topics/corporate-tax/country-by-country/.12 Although it should be recalled that shareholders also benefit from any increase in capital value of the
Group.
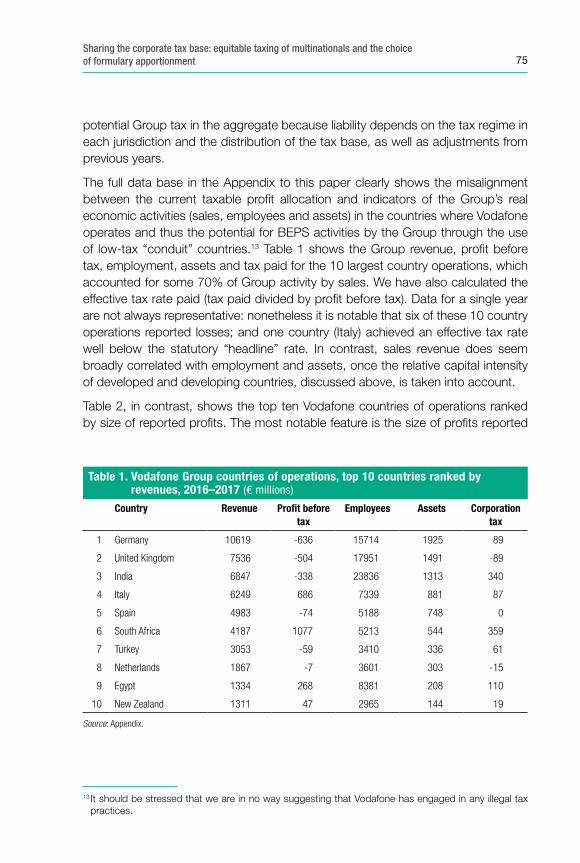
75Sharing the corporate tax base: equitable taxing of multinationals and the choice of formulary apportionment
potential Group tax in the aggregate because liability depends on the tax regime in each jurisdiction and the distribution of the tax base, as well as adjustments from previous years.
The full data base in the Appendix to this paper clearly shows the misalignment between the current taxable profit allocation and indicators of the Group’s real economic activities (sales, employees and assets) in the countries where Vodafone operates and thus the potential for BEPS activities by the Group through the use of low-tax “conduit” countries.13 Table 1 shows the Group revenue, profit before tax, employment, assets and tax paid for the 10 largest country operations, which accounted for some 70% of Group activity by sales. We have also calculated the effective tax rate paid (tax paid divided by profit before tax). Data for a single year are not always representative: nonetheless it is notable that six of these 10 country operations reported losses; and one country (Italy) achieved an effective tax rate well below the statutory “headline” rate. In contrast, sales revenue does seem broadly correlated with employment and assets, once the relative capital intensity of developed and developing countries, discussed above, is taken into account.
Table 2, in contrast, shows the top ten Vodafone countries of operations ranked by size of reported profits. The most notable feature is the size of profits reported
13 It should be stressed that we are in no way suggesting that Vodafone has engaged in any illegal tax practices.
Table 1. Vodafone Group countries of operations, top 10 countries ranked by revenues, 2016–2017 (€ millions)
Country Revenue Profi t beforetax
Employees Assets Corporation tax
1 Germany 10619 -636 15714 1925 89
2 United Kingdom 7536 -504 17951 1491 -89
3 India 6847 -338 23836 1313 340
4 Italy 6249 686 7339 881 87
5 Spain 4983 -74 5188 748 0
6 South Africa 4187 1077 5213 544 359
7 Turkey 3053 -59 3410 336 61
8 Netherlands 1867 -7 3601 303 -15
9 Egypt 1334 268 8381 208 110
10 New Zealand 1311 47 2965 144 19
Source: Appendix.
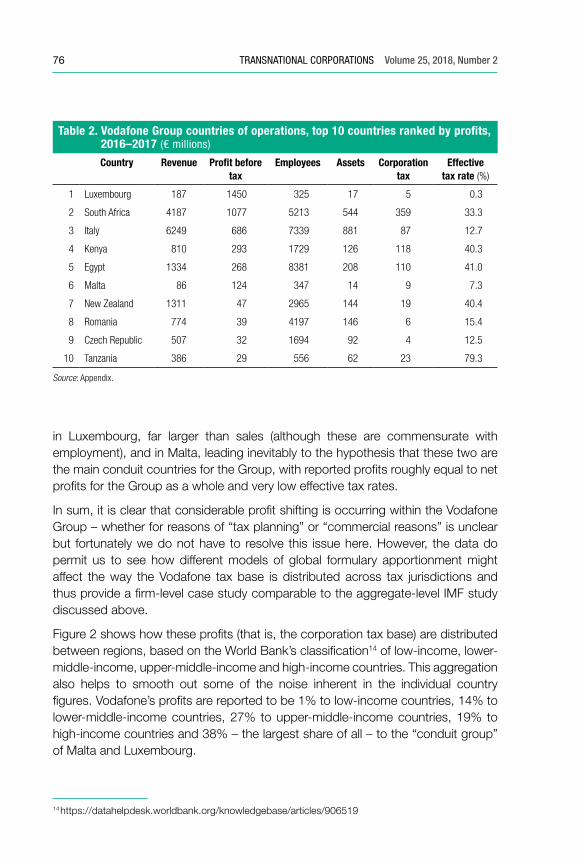
76 TRANSNATIONAL CORPORATIONS Volume 25, 2018, Number 2
in Luxembourg, far larger than sales (although these are commensurate with employment), and in Malta, leading inevitably to the hypothesis that these two are the main conduit countries for the Group, with reported profits roughly equal to net profits for the Group as a whole and very low effective tax rates.
In sum, it is clear that considerable profit shifting is occurring within the Vodafone Group – whether for reasons of “tax planning” or “commercial reasons” is unclear but fortunately we do not have to resolve this issue here. However, the data do permit us to see how different models of global formulary apportionment might affect the way the Vodafone tax base is distributed across tax jurisdictions and thus provide a firm-level case study comparable to the aggregate-level IMF study discussed above.
Figure 2 shows how these profits (that is, the corporation tax base) are distributed between regions, based on the World Bank’s classification14 of low-income, lower-middle-income, upper-middle-income and high-income countries. This aggregation also helps to smooth out some of the noise inherent in the individual country figures. Vodafone’s profits are reported to be 1% to low-income countries, 14% to lower-middle-income countries, 27% to upper-middle-income countries, 19% to high-income countries and 38% – the largest share of all – to the “conduit group” of Malta and Luxembourg.
14 https://datahelpdesk.worldbank.org/knowledgebase/articles/906519
Table 2. Vodafone Group countries of operations, top 10 countries ranked by profi ts, 2016–2017 (€ millions)
Country Revenue Profi t before tax
Employees Assets Corporation tax
Effective tax rate (%)
1 Luxembourg 187 1450 325 17 5 0.3
2 South Africa 4187 1077 5213 544 359 33.3
3 Italy 6249 686 7339 881 87 12.7
4 Kenya 810 293 1729 126 118 40.3
5 Egypt 1334 268 8381 208 110 41.0
6 Malta 86 124 347 14 9 7.3
7 New Zealand 1311 47 2965 144 19 40.4
8 Romania 774 39 4197 146 6 15.4
9 Czech Republic 507 32 1694 92 4 12.5
10 Tanzania 386 29 556 62 23 79.3
Source: Appendix.
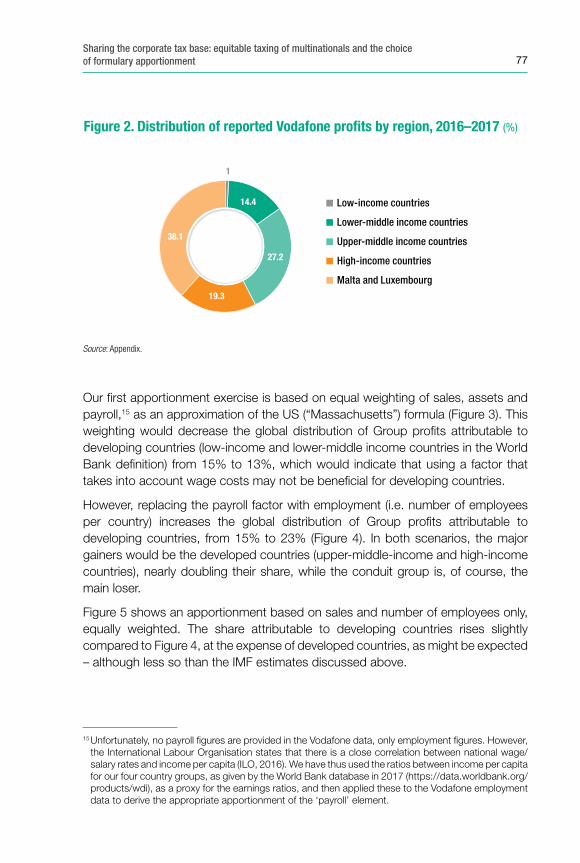
77Sharing the corporate tax base: equitable taxing of multinationals and the choice of formulary apportionment
Our first apportionment exercise is based on equal weighting of sales, assets and payroll,15 as an approximation of the US (“Massachusetts”) formula (Figure 3). This weighting would decrease the global distribution of Group profits attributable to developing countries (low-income and lower-middle income countries in the World Bank definition) from 15% to 13%, which would indicate that using a factor that takes into account wage costs may not be beneficial for developing countries.
However, replacing the payroll factor with employment (i.e. number of employees per country) increases the global distribution of Group profits attributable to developing countries, from 15% to 23% (Figure 4). In both scenarios, the major gainers would be the developed countries (upper-middle-income and high-income countries), nearly doubling their share, while the conduit group is, of course, the main loser.
Figure 5 shows an apportionment based on sales and number of employees only, equally weighted. The share attributable to developing countries rises slightly compared to Figure 4, at the expense of developed countries, as might be expected – although less so than the IMF estimates discussed above.
15 Unfortunately, no payroll figures are provided in the Vodafone data, only employment figures. However, the International Labour Organisation states that there is a close correlation between national wage/salary rates and income per capita (ILO, 2016). We have thus used the ratios between income per capita for our four country groups, as given by the World Bank database in 2017 (https://data.worldbank.org/products/wdi), as a proxy for the earnings ratios, and then applied these to the Vodafone employment data to derive the appropriate apportionment of the ‘payroll’ element.
Figure 2. Distribution of reported Vodafone pro�ts by region, 2016–2017 (%)
Low-income countries
Lower-middle income countries
Upper-middle income countries
High-income countries
Malta and Luxembourg
1
38.1
14.4
27.2
19.3
Source: Appendix.
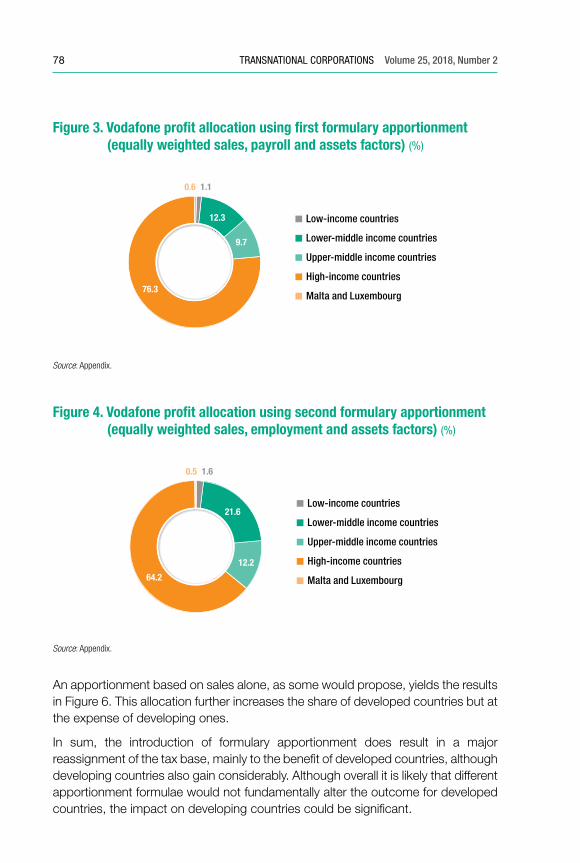
78 TRANSNATIONAL CORPORATIONS Volume 25, 2018, Number 2
An apportionment based on sales alone, as some would propose, yields the results in Figure 6. This allocation further increases the share of developed countries but at the expense of developing ones.
In sum, the introduction of formulary apportionment does result in a major reassignment of the tax base, mainly to the benefit of developed countries, although developing countries also gain considerably. Although overall it is likely that different apportionment formulae would not fundamentally alter the outcome for developed countries, the impact on developing countries could be significant.
Figure 3. Vodafone pro�t allocation using �rst formulary apportionment (equally weighted sales, payroll and assets factors) (%)
Low-income countries
Lower-middle income countries
Upper-middle income countries
High-income countries
Malta and Luxembourg
1.10.6
12.3
9.7
76.3
Source: Appendix.
Figure 4. Vodafone pro�t allocation using second formulary apportionment (equally weighted sales, employment and assets factors) (%)
Low-income countries
Lower-middle income countries
Upper-middle income countries
High-income countries
Malta and Luxembourg
1.60.5
21.6
12.2
64.2
Source: Appendix.
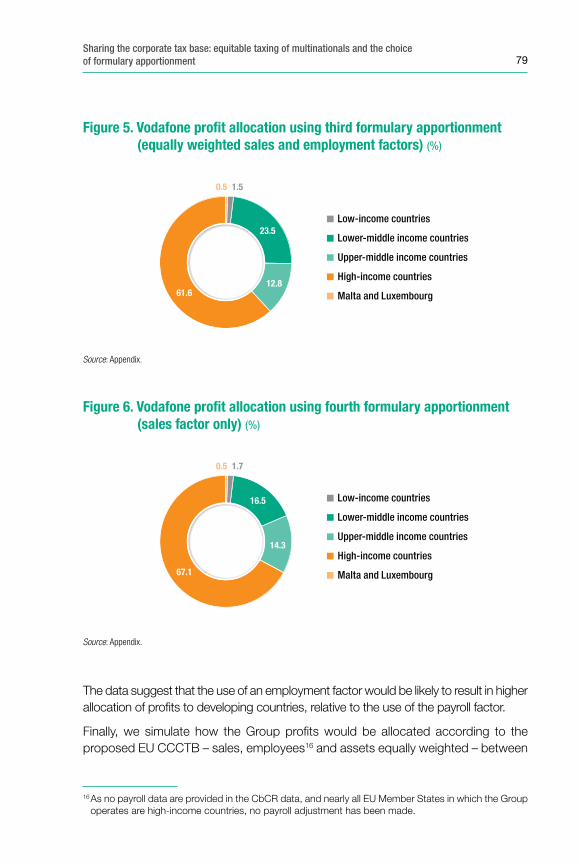
79Sharing the corporate tax base: equitable taxing of multinationals and the choice of formulary apportionment
The data suggest that the use of an employment factor would be likely to result in higher allocation of profits to developing countries, relative to the use of the payroll factor.
Finally, we simulate how the Group profits would be allocated according to the proposed EU CCCTB – sales, employees16 and assets equally weighted – between
16 As no payroll data are provided in the CbCR data, and nearly all EU Member States in which the Group operates are high-income countries, no payroll adjustment has been made.
Figure 5. Vodafone pro�t allocation using third formulary apportionment (equally weighted sales and employment factors) (%)
Low-income countries
Lower-middle income countries
Upper-middle income countries
High-income countries
Malta and Luxembourg
1.50.5
23.5
12.861.6
Source: Appendix.
Figure 6. Vodafone pro�t allocation using fourth formulary apportionment (sales factor only) (%)
Low-income countries
Lower-middle income countries
Upper-middle income countries
High-income countries
Malta and Luxembourg
1.70.5
16.5
14.3
67.1
Source: Appendix.
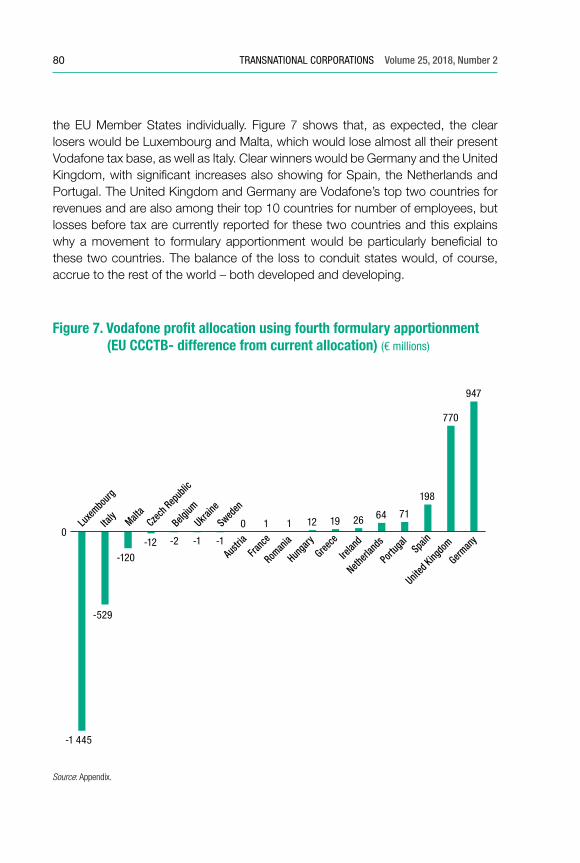
80 TRANSNATIONAL CORPORATIONS Volume 25, 2018, Number 2
the EU Member States individually. Figure 7 shows that, as expected, the clear losers would be Luxembourg and Malta, which would lose almost all their present Vodafone tax base, as well as Italy. Clear winners would be Germany and the United Kingdom, with significant increases also showing for Spain, the Netherlands and Portugal. The United Kingdom and Germany are Vodafone’s top two countries for revenues and are also among their top 10 countries for number of employees, but losses before tax are currently reported for these two countries and this explains why a movement to formulary apportionment would be particularly beneficial to these two countries. The balance of the loss to conduit states would, of course, accrue to the rest of the world – both developed and developing.
Figure 7. Vodafone pro�t allocation using fourth formulary apportionment (EU CCCTB- difference from current allocation) (€ millions)
-1 445
-529
-120
-12 -2 -1 -1
0 1 1 12 19 26 64 71
198
770
947
0 Lu
xembo
urg
Italy Malt
a Czec
h Rep
ublic
Belgium
Ukraine
Sweden
Austria
Franc
e
Roman
ia
Hunga
ry
Greece
Irelan
d
Netherl
ands
Portug
al Spa
in
United
Kingdo
m
German
y
Source: Appendix.
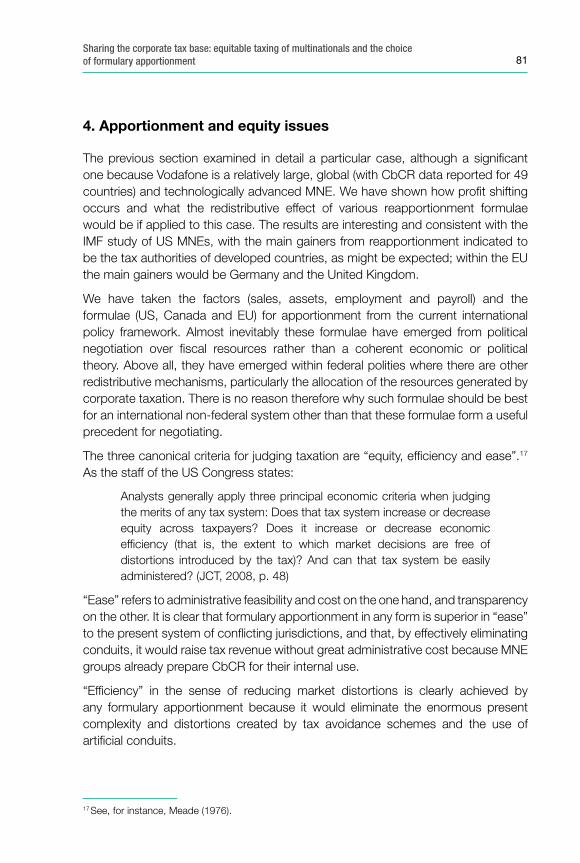
81Sharing the corporate tax base: equitable taxing of multinationals and the choice of formulary apportionment
4. Apportionment and equity issues
The previous section examined in detail a particular case, although a significant one because Vodafone is a relatively large, global (with CbCR data reported for 49 countries) and technologically advanced MNE. We have shown how profit shifting occurs and what the redistributive effect of various reapportionment formulae would be if applied to this case. The results are interesting and consistent with the IMF study of US MNEs, with the main gainers from reapportionment indicated to be the tax authorities of developed countries, as might be expected; within the EU the main gainers would be Germany and the United Kingdom.
We have taken the factors (sales, assets, employment and payroll) and the formulae (US, Canada and EU) for apportionment from the current international policy framework. Almost inevitably these formulae have emerged from political negotiation over fiscal resources rather than a coherent economic or political theory. Above all, they have emerged within federal polities where there are other redistributive mechanisms, particularly the allocation of the resources generated by corporate taxation. There is no reason therefore why such formulae should be best for an international non-federal system other than that these formulae form a useful precedent for negotiating.
The three canonical criteria for judging taxation are “equity, efficiency and ease”.17 As the staff of the US Congress states:
Analysts generally apply three principal economic criteria when judging the merits of any tax system: Does that tax system increase or decrease equity across taxpayers? Does it increase or decrease economic efficiency (that is, the extent to which market decisions are free of distortions introduced by the tax)? And can that tax system be easily administered? (JCT, 2008, p. 48)
“Ease” refers to administrative feasibility and cost on the one hand, and transparency on the other. It is clear that formulary apportionment in any form is superior in “ease” to the present system of conflicting jurisdictions, and that, by effectively eliminating conduits, it would raise tax revenue without great administrative cost because MNE groups already prepare CbCR for their internal use.
“Efficiency” in the sense of reducing market distortions is clearly achieved by any formulary apportionment because it would eliminate the enormous present complexity and distortions created by tax avoidance schemes and the use of artificial conduits.
17 See, for instance, Meade (1976).
82 TRANSNATIONAL CORPORATIONS Volume 25, 2018, Number 2
There is less clarity about the first criterion, that of “Equity”. Internationally (and indeed between federal states) this concept in the present context relates not so much to individual taxpayers but rather to equity in distribution between tax jurisdictions. This of course is the rationale behind the three formulae discussed above, which aim to achieve a more equitable distribution of tax base (and thus revenue) between countries.
The somewhat scarce policy literature on the subject appears to be based on a concept of taxing profits “where economic activities occur and value is created”. The OECD intergovernmental agreements on BEPS refer to the need for the tax base to “reflect the underlying economic reality”18 without explicitly stating how this is to be defined; while the Independent Commission on the Reform of International Corporate Taxation states that
“… these factors, such as employment, sales, resources used, fixed assets, etc., should be chosen to reflect the MNE’s real economic activity in each jurisdiction” (page 6) and that “It is the Commission view that global formulary apportionment is the only method that allocates profits in a balanced way using factors reflecting both supply (e.g., assets, employees, resources used) and demand (sales). Neither can create value without the other.” (ICRICT, 2018, p. 7)
However, while such an approach to the creation of “value” has some appeal in terms of political economy, there is little economic theory to underpin it. The so-called “Massachusetts Formula” apparently has become accepted through precedent (i.e. political negotiation between states) rather than as the result of economic analysis or research into the impact. A line of argument might be derived from the “contribution of factors of production” approach with, say, the location of “land”, “labour” and “capital”; but this would exclude sales and extend the definition of assets.
Moreover, from a textbook standpoint, profits are attributable to capital alone because the other factors are rewarded according to their marginal productivity; and, of course, in the standard neoclassical model (with no scale economies), profits are the marginal productivity of capital itself plus the reward to entrepreneurship. On this basis, apportionment should be based on the true location of real fixed capital, technology and management or entrepreneurship.
In neither approach does sales come into the economic argument. The case for including sales seems to be based more on ease of administration than anything else. However, the attraction of this case is that it ultimately implies replacing direct with indirect taxation – which in turn has undesirable consequences for equity (IMF,
18 http://www.oecd.org/ctp/beps-frequentlyaskedquestions.htm.
83Sharing the corporate tax base: equitable taxing of multinationals and the choice of formulary apportionment
2013). Corporation tax is, in essence, a withholding tax on dividends and is thus strongly progressive, reducing income inequality; sales taxes on the other hand are usually regressive.
Moreover, the “value creation” approach seems to misunderstand the fact that large firms’ profits arise from market power (including intellectual property and the like) and specifically from their multinational nature – or to put it another way, these are spatially unlocated rents that should be taxed. As Avi-Yonah and Clausing (2007, p. 13) explain:
multinational firms exist in large part because these interactions generate more income than would separate domestic firms interacting at arms-length; thus requiring firms to allocate this additional income among domestic tax bases is necessarily artificial and arbitrary, because it would by definition disappear if the related entities operated at arm’s length.
Finally, assessment of the distributive effects of different apportionment schemes should take into account not only the direct impact on different countries’ revenues but also the response of companies to the new rules. For instance, a company could sub-contract its labour inputs in any one jurisdiction and thus could shift its tax liability under formulary apportionment. What this illustrates is the problem of effectively assessing value chains that stretch across sectors and countries, where effective control may be exercised not only by ownership but also by contracts, technology, franchising and other means.
In addition, we have already seen how apportionment systems would necessarily benefit developed countries most (at the expense of conduit countries, some of them developing countries) because this is where most sales, capital and high wages are to be found.
There is a case therefore for examining what other criteria might be used to underpin the formula for international apportionment. Here we will briefly sketch just one19 in outline, the application of an apportionment principle of equity between countries that is based on income per capita.
When designing personal income taxation it is conventional to include an element of progressivity on the grounds of the greater “ability to pay” of richer strata of the population – or in economic terms, the declining marginal utility of money with income. This is normally called “vertical equity” in contrast to “horizontal
19 There are other possibilities, of course. For instance, apportionment might be linked to the need to finance global public goods, and thus involve some fraction being allocated directly to global funds for the environment, epidemics, natural disasters and so on. Again, to the extent that corporation tax can be seen as a ‘service charge’ for the use of national public facilities, apportionment might reflect the extent of these facilities.
84 TRANSNATIONAL CORPORATIONS Volume 25, 2018, Number 2
equity”, which ensures that taxpayers at similar income levels pay similar amounts, independently of the source of income.
By extension, we could argue that current apportionment proposals are mainly concerned with horizontal equity between jurisdictions, but that, logically, an element of vertical equity should also be introduced. In other words, the apportionment weights should be based on – or at least include – the level of per capita national income, to ensure a more equal distribution of taxing rights (i.e. how the multinational’s tax base is shared between developed and developing countries).
This may appear to be a radical proposal, but it does have indirect precedents. On the one hand, within federal polities (upon which the current formulae are based) there does exist – implicitly – a strong redistributive element insofar as federal direct taxation is “returned” in the form of fiscal transfers on a notionally per capita basis. On the other, the current system of international development cooperation (“aid”) is essentially fiscal, involving the raising of taxation in the donor country and the support of public expenditure20 in the recipient country.
A somewhat more conventional form of this proposal would parallel the special provisions in trade agreements for less developed participants. In terms of formulary apportionment this could take the form of an agreed adjustment factor for the three developing-country groupings discussed in the previous section.
A move to formulary apportionment, either based on existing apportionment formulae or on our proposal would have effect both on the tax revenue generated and investment decisions by MNEs.
Whilst taxation is only one of the factors on which investment decisions are based, in addition to eliminate opportunities for base erosion and profit shifting, a system of formulary apportionment could remove the inherent subjectivity of the current system of international tax rules thereby providing greater economic certainty to taxpayers and governments, and this should in turn encourage cross-border investment.
The risk of double taxation in the current system is high, with multiple countries asserting taxing rights on the same tax base. However, under a system of formulary apportionment investors will be able to predict in advance of the investment decision the effective rates at which each country will impose its tax, therefore increasing tax certainty.
20 Most expenditure by international non-governmental organizations in developing countries is fiscally funded too, and although ‘privately spent’ is usually in support of or a replacement for provision of public welfare.

85Sharing the corporate tax base: equitable taxing of multinationals and the choice of formulary apportionment
5. Conclusion
The analytical and empirical evidence in this paper shows that a move to formulary apportionment is likely to minimise the allocation of MNEs’ profits to low-tax jurisdictions, where multinationals have limited economic activities. The profits currently allocated to these jurisdictions would be reallocated to both developed and developing countries.
Research on this subject has been constrained by the lack of firm-level data. However, the results from a detailed examination in this paper of the CbCR data of Vodafone Group Plc, the first large multinational to voluntarily publish such data, allow us to demonstrate the profit-shifting process and to estimate the effect of formulary apportionment for a major MNE based in the United Kingdom, which supports the aggregate analysis of US corporations overseas by the IMF.
We also suggest that the current formula proposals are limited by a lack of clear economic rationale, on the one hand, and insufficient attention to the equitable treatment of developing countries, on the other.
The policy implications of this paper are four. First, clearly much more research covering a longer time period is needed at the firm level. Ideally this would be comprehensive, but if not possible then a representative selection should be made of MNEs in distinct sectors and based in distinct countries. In particular, MNEs based outside the US and EU (particularly those from emerging-market economies) should be well covered.
Second, policy debate should move on from the need for formulary apportionment to the nature of the formula and participation in its determination, with particular attention to low-income countries. There appears to be some current momentum towards basing apportionment on sales, driven in good part by concerns about e-commerce, but this may not be helpful to developing countries.
Third, although formulary apportionment does not require a global body to collect or redistribute tax, it does require a multilateral forum where rules can be established, methodology approved and disputes arbitrated. These rules would cover not only the apportionment formula as such but also the reconciliation of national and regional differences in accounting criteria and tax expensing. Whether the OECD (which has already made progress on these topics) or the UN (which has representational legitimacy) should be the locus for such an initiative is an open question.
Fourth, a clear linkage should be established between debates on international taxation and other global debates on income inequality, sustainable development and multilateral institutions. Fiscal coordination is not just an issue of financing for development but rather one of the bases for global economic cooperation as such. In these debates, developing countries should have both voice and vote.
86 TRANSNATIONAL CORPORATIONS Volume 25, 2018, Number 2
References
Avi-Yonah, R. S., and Clausing, K. A. (2007). A Proposal to Adopt Formulary Apportionment for Corporate Income Taxation: The Hamilton Project. University of Michigan Public Law Working Paper No. 85.
Clausing, K. A., and Lahav, Y. (2011). Corporate tax payments under formulary apportionment: Evidence from the financial reports of 50 major U.S. multinational firms. Journal of International Accounting, Auditing and Taxation 20(2), pp. 97-105.
Faccio, T., and Picciotto, S. (2017). Alternatives to the Separate Entity/Arm’s Length Principle for Taxation of Multinational Enterprises [online] available at: https://www.icrict.com/resources/icrict-documents.
ICRICT (2018). A roadmap to improve rules for taxing multinationals. A fairer future for global taxation. [online] available at: https://www.icrict.com/resources/icrict-documents.
ILO (2016). Global Wage Report 2016/17 Geneva: International Labour Organization, [online], available at: https://www.ilo.org/global/research/global-reports/global-wage-report/2016/lang--en/index.htm.
IMF (2013). Fiscal Monitor 2013. DataMapper, [online], available at: https://www.imf.org/en/Publications/FM/Issues/2016/12/31/Taxing-Times.
IMF (2014). Spillovers in International Corporate Taxation. IMF Policy Paper, [online] available at: https://www.imf.org/external/np/pp/eng/2014/050914.pdf.
JCT (2008). A Reconsideration of Tax Expenditure Analysis Prepared by the Staff of the Joint Committee on Taxation. JCX-37-08, US Congress, Washington, DC.
Krchniva, K. (2014). Comparison of European, Canadian and U.S. formula apportionment on real data. Procedia Economics and Finance 12, pp. 309–318.
Meade, J.E. (1978). The Structure and Reform of Direct Taxation: Report of a Committee Chaired by Professor James. E. Meade. London: Allen and Unwin, London.
Mintz, J., (2007). Europe Slowly Lurches to a Common Consolidated Corporate Tax Base: Issues at Stake. In Lang, M., et al., A Common Consolidated Corporate Tax Base for Europe. Berlin, Heidelberg: Springer.
UNCTAD (2013). Global Value Chains: Investment and Trade for Development. World Investment Report 2013. New York and Geneva: United Nations, p. 136.
UNCTAD (2015). Reforming International Investment Governance. World Investment Report 2015. New York and Geneva: United Nations, pp. 188-190.
UNCTAD (2016). Investor Nationality: Policy Challenges. World Investment Report 2016. New York and Geneva: United Nations, p. 150.

87Sharing the corporate tax base: equitable taxing of multinationals and the choice of formulary apportionment
Weiner, J. M. (2005). Formulary Apportionment and Group Taxation in the European Union: Insights from the United States and Canada. Taxation Papers, WP no.8.
Zucman, G., Tørsløv, T., and Ludvig, W. (2018). The Missing Profits of Nations. NBER Working Paper No. 24701.
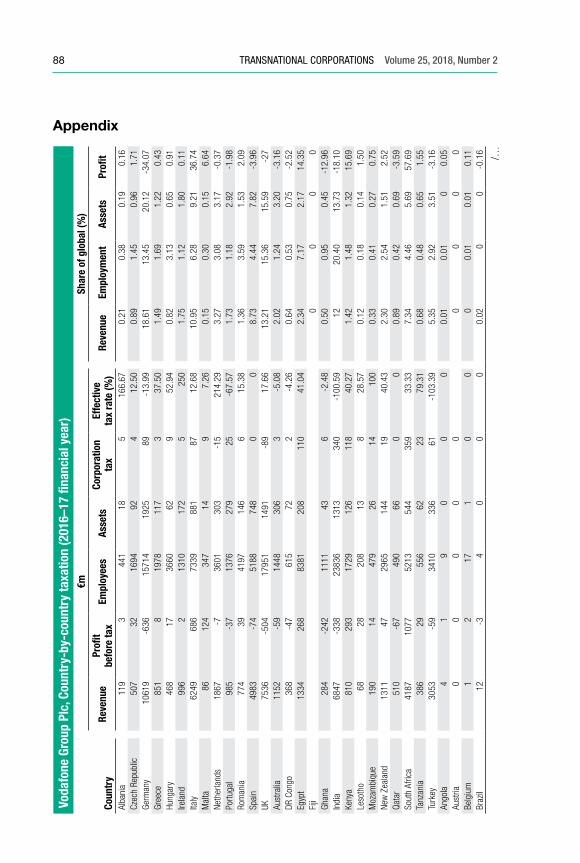
88 TRANSNATIONAL CORPORATIONS Volume 25, 2018, Number 2Vo
dafo
ne G
roup
Plc
, Cou
ntry
-by-
coun
try
taxa
tion
(201
6–17
fina
ncia
l yea
r)
Coun
try
€mSh
are
of g
loba
l (%
)
Reve
nue
Profi
t be
fore
tax
Empl
oyee
sAs
sets
Corp
orat
ion
tax
Effe
ctiv
e ta
x ra
te (%
)Re
venu
eEm
ploy
men
tAs
sets
Profi
t
Alba
nia
119
344
118
516
6.67
0.21
0.38
0.19
0.16
Czec
h Re
publ
ic50
732
1694
924
12.5
00.
891.
450.
961.
71Ge
rman
y10
619
-636
1571
419
2589
-13.
9918
.61
13.4
520
.12
-34.
07Gr
eece
851
819
7811
73
37.5
01.
491.
691.
220.
43Hu
ngar
y46
817
3660
629
52.9
40.
823.
130.
650.
91Ire
land
996
213
1017
25
250
1.75
1.12
1.80
0.11
Italy
6249
686
7339
881
8712
.68
10.9
56.
289.
2136
.74
Mal
ta86
124
347
149
7.26
0.15
0.30
0.15
6.64
Neth
erla
nds
1867
-736
0130
3-1
521
4.29
3.27
3.08
3.17
-0.3
7Po
rtuga
l98
5-3
713
7627
925
-67.
571.
731.
182.
92-1
.98
Rom
ania
774
3941
9714
66
15.3
81.
363.
591.
532.
09Sp
ain
4983
-74
5188
748
00
8.73
4.44
7.82
-3.9
6UK
7536
-504
1795
114
91-8
917
.66
13.2
115
.36
15.5
9-2
7Au
stra
lia11
52-5
914
4830
63
-5.0
82.
021.
243.
20-3
.16
DR C
ongo
368
-47
615
722
-4.2
60.
640.
530.
75-2
.52
Egyp
t13
3426
883
8120
811
041
.04
2.34
7.17
2.17
14.3
5Fi
ji0
00
0Gh
ana
284
-242
1111
436
-2.4
80.
500.
950.
45-1
2.96
Indi
a68
47-3
3823
836
1313
340
-100
.59
1220
.40
13.7
3-1
8.10
Keny
a81
029
317
2912
611
840
.27
1.42
1.48
1.32
15.6
9Le
soth
o68
2820
813
828
.57
0.12
0.18
0.14
1.50
Moz
ambi
que
190
1447
926
1410
00.
330.
410.
270.
75Ne
w Z
eala
nd
1311
4729
6514
419
40.4
32.
302.
541.
512.
52Q
atar
510
-67
490
660
00.
890.
420.
69-3
.59
Sout
h Af
rica
4187
1077
5213
544
359
33.3
37.
344.
465.
6957
.69
Tanz
ania
386
2955
662
2379
.31
0.68
0.48
0.65
1.55
Turk
ey30
53-5
934
1033
661
-103
.39
5.35
2.92
3.51
-3.1
6An
gola
41
90
00
0.01
0.01
00.
05Au
stria
00
00
00
00
0Be
lgiu
m1
217
10
00
0.01
0.01
0.11
Braz
il12
-34
00
00.
020
0-0
.16 /…
Appendix
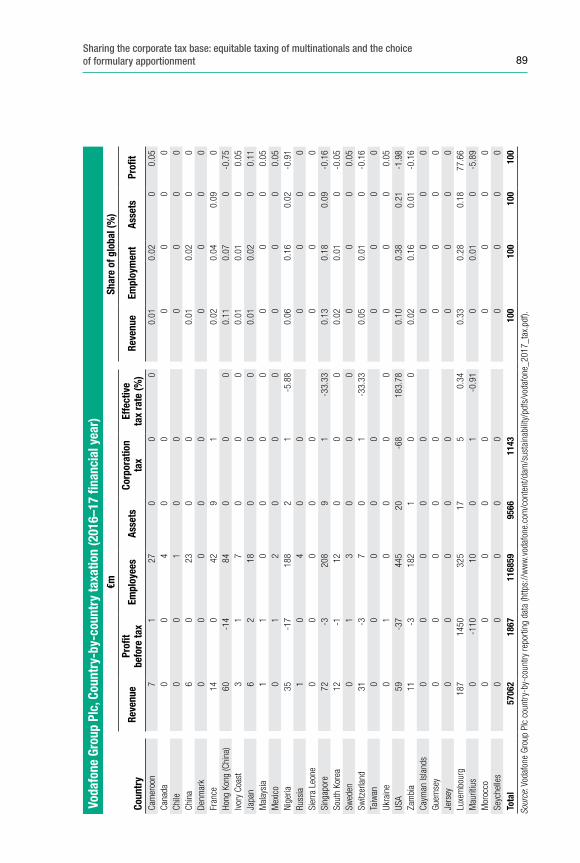
89Sharing the corporate tax base: equitable taxing of multinationals and the choice of formulary apportionment
Voda
fone
Gro
up P
lc, C
ount
ry-b
y-co
untr
y ta
xatio
n (2
016–
17 fi
nanc
ial y
ear)
Coun
try
€mSh
are
of g
loba
l (%
)
Reve
nue
Profi
t be
fore
tax
Empl
oyee
sAs
sets
Corp
orat
ion
tax
Effe
ctiv
e ta
x ra
te (%
)Re
venu
eEm
ploy
men
tAs
sets
Profi
t
Cam
eroo
n7
127
00
00.
010.
020
0.05
Cana
da0
04
00
00
00
Chile
00
10
00
00
0Ch
ina
60
230
00.
010.
020
0De
nmar
k0
00
00
00
00
Fran
ce14
042
91
0.02
0.04
0.09
0Ho
ng K
ong
(Chi
na)
60-1
484
00
00.
110.
070
-0.7
5Iv
ory
Coas
t3
17
00
00.
010.
010
0.05
Japa
n6
218
00
00.
010.
020
0.11
Mal
aysi
a1
10
00
00
00
0.05
Mex
ico
01
20
00
00
00.
05Ni
geria
35-1
718
82
1-5
.88
0.06
0.16
0.02
-0.9
1Ru
ssia
10
40
00
00
0Si
erra
Leo
ne0
00
00
00
00
Sing
apor
e72
-320
89
1-3
3.33
0.13
0.18
0.09
-0.1
6So
uth
Kore
a12
-112
00
00.
020.
010
-0.0
5Sw
eden
01
30
00
00
00.
05Sw
itzer
land
31-3
70
1-3
3.33
0.05
0.01
0-0
.16
Taiw
an0
00
00
00
00
Ukra
ine
01
00
00
00
00.
05US
A59
-37
445
20-6
818
3.78
0.10
0.38
0.21
-1.9
8Za
mbi
a11
-318
21
00
0.02
0.16
0.01
-0.1
6Ca
yman
Isla
nds
00
00
00
00
0Gu
erns
ey
00
00
00
00
0Je
rsey
00
00
00
00
0Lu
xem
bour
g18
714
5032
517
50.
340.
330.
280.
1877
.66
Mau
ritiu
s0
-110
100
1-0
.91
00.
010
-5.8
9M
oroc
co0
00
00
00
00
Seyc
helle
s0
00
00
00
00
Tota
l57
062
1867
1168
5995
6611
4310
010
010
010
0
Sour
ce: V
odaf
one
Grou
p Pl
c co
untry
-by-
coun
try re
porti
ng d
ata
(http
s://
ww
w.vo
dafo
ne.c
om/c
onte
nt/d
am/s
usta
inab
ility
s/vo
dafo
ne_2
017_
tax.
pdf).

91
Estimating the fiscal effects of base erosion and profit shifting: data availability and analytical issues
David Bradbury, Tibor Hanappi and Anne Moore*
The multilateral efforts, led by the Organisation for Economic Cooperation and Development (OECD), to address base erosion and profit shifting (BEPS) have attracted much attention from tax policy makers, practitioners and academics. In 2012, the OECD/G20 BEPS Project was launched to address BEPS through a range of international tax policy measures. A key part of the BEPS package was the Action 11 report, which considered the fiscal and economic impacts of BEPS and produced an empirical estimate of the global corporate income tax (CIT) revenue losses arising from BEPS of between 4 per cent and 10 per cent of global CIT revenues. This research note highlights some of the data-related and methodological challenges facing researchers attempting to estimate the fiscal impacts of BEPS, discusses some of the methodological approaches that have recently been applied to this end, and provides a preview of the forthcoming release of the first edition of the OECD Corporate Tax Statistics.
Keywords: international taxation, corporate income tax, base erosion and profit shifting, BEPS
1. Introduction
Recent efforts by the Organisation for Economic Cooperation and Development (OECD) to address corporate tax base erosion and profit shifting (BEPS) have been driven by the common understanding that a major renovation of the international tax rules was necessary to bring them into line with ongoing structural changes in the global economy arising from globalisation, digitalisation and the increased reliance on intangible assets. As part of the OECD/G20 BEPS Project launched in 2012, an action plan was developed to address BEPS through a range of international tax policy measures. The work undertaken under Action 11 of the OECD/G20 BEPS Project was directed towards gaining an understanding of the adverse fiscal and economic impacts of BEPS and the development of new tools and data to improve the measurement and monitoring of BEPS into the future.
* The authors of this note are staff of the OECD’s Centre for Tax Policy and Administration: David Bradbury (Head of the Tax Policy and Statistics Division), Tibor Hanappi (Economist), and Anne Moore (Advisor). This note should not be regarded as the officially endorsed views of the OECD or the Inclusive Framework on BEPS or of its member countries and jurisdictions.
92 TRANSNATIONAL CORPORATIONS Volume 25, 2018, Number 2
The Action 11 report (OECD, 2015a), published in 2015, built on a review of the academic literature on profit shifting and produced an empirical estimate of the global corporate income tax (CIT) revenue losses due to BEPS of between 4 per cent to 10 per cent of global CIT revenues or the equivalent of between US$100 billion and US$240 billion (based on 2014 figures). These results have attracted much attention from tax policy makers, practitioners and academics.
This research note builds on the analysis presented in the Action 11 report. It provides a more concise discussion of the data-related and methodological issues to be addressed by any study producing fiscal estimates of the scale of BEPS. It also includes a review of the most significant studies published in this area since the release of the Action 11 report. More specifically, it aims (i) to outline recent developments in international taxation, especially in the context of the OECD/G20 BEPS Project and the establishment of the Inclusive Framework on BEPS; (ii) to highlight some of the data-related and methodological challenges facing researchers attempting to estimate the global scale of BEPS; (iii) to provide an overview of some of the methodological approaches that have been applied by researchers to obtain empirical estimates of the fiscal impacts of BEPS; and (iv) to provide a preview of the forthcoming release of the first edition of the OECD Corporate Tax Statistics.
2. Recent developments in international taxation
2.1 The BEPS package
The OECD report Addressing Base Erosion and Profit Shifting (OECD, 2013) noted that no single rule or provision could be identified as the cause of BEPS, and that adverse fiscal impacts resulted from a series of weaknesses in the international tax rules as well as gaps and mismatches arising from the interplay of domestic laws and a lack of coordination across borders. Organised on three pillars, the stated objectives of the BEPS Project were to (i) reinforce the coherence of the corporate income tax rules at the international level; (ii) realign the taxation of profits with the location where the economic activities generating those profits occurred; and (iii) improve transparency. The OECD/G20 BEPS package, which was endorsed by the G20 leaders at the end of 2015, consisted of 13 reports addressing the 15 action points of the BEPS Action Plan (Figure 1); it included a comprehensive package of new and reinforced international standards as well as concrete measures to help countries tackle BEPS.
Under the BEPS package, countries agreed to a comprehensive set of measures and committed to their consistent implementation. Among the measures agreed were four minimum standards, involving measures to fight harmful tax practices (Action 5); prevent treaty shopping (Action 6); introduce Country-by-Country
93Estimating the fiscal effects of base erosion and profit shifting: data availability and analytical issues
Reporting (Action 13); and improve dispute resolution (Action 14). The minimum standards were agreed in particular to tackle avoidance in cases where no action by some countries would have created negative spillovers on other countries, with broader implications for the level and distribution of welfare across nations. The package also involved updated standards relating to tax treaties (e.g., Action 7) and transfer pricing (Actions 8–10), recommendations on hybrid mismatch arrangements (Action 2) and interest limitation rules (Action 4), as well as guidance on controlled foreign company (CFC) legislation (Action 3) and mandatory disclosure initiatives (Action 12). In addition to these specific tax policy measures, the BEPS package also focused on the measurement and monitoring of BEPS (Action 11). The Action 11 report reviewed empirical evidence on the scale and economic impact of BEPS through different tax planning strategies, outlined a dashboard of indicators of BEPS, and produced an estimate of the global CIT revenue losses arising from BEPS. The work undertaken under Action 11 will be the main focus of this note.
In addition, the BEPS package also included a number of analytical reports, including one that assessed the feasibility and recommended the development of a multilateral instrument – known as the Multilateral Convention to Implement Tax Treaty Related Measures to Prevent Base Erosion and Profit Shifting – to provide a concrete means by which governments can incorporate the measures agreed as part of the BEPS package into their bilateral tax treaties (Action 15). As part of the work on digitalisation (Action 1), another analytical report was published: Addressing the Tax Challenges of the Digital Economy. This report provided the basis for ongoing work, which was further advanced in the recent Interim Report to G20 Finance Ministers, Tax Challenges Arising from Digitalisation (OECD, 2018).
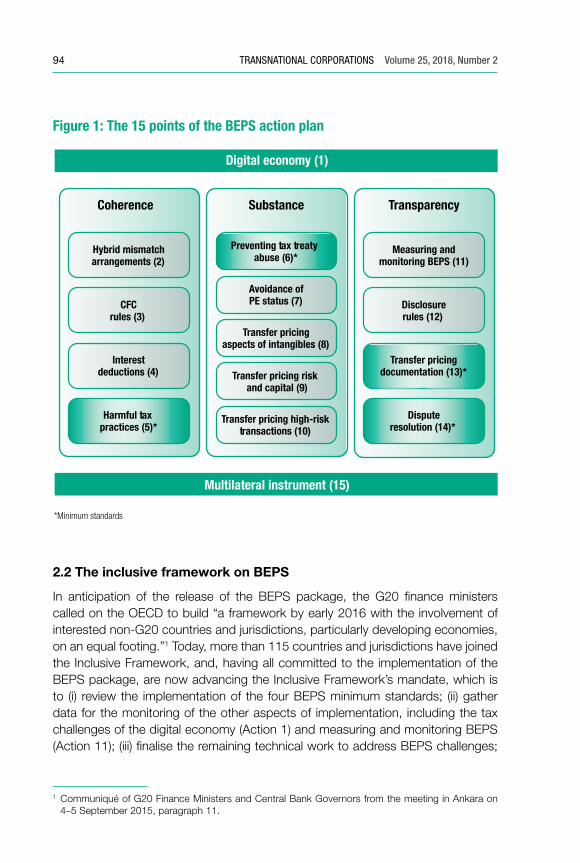
94 TRANSNATIONAL CORPORATIONS Volume 25, 2018, Number 2
Figure 1: The 15 points of the BEPS action plan
2.2 The inclusive framework on BEPS
In anticipation of the release of the BEPS package, the G20 finance ministers called on the OECD to build “a framework by early 2016 with the involvement of interested non-G20 countries and jurisdictions, particularly developing economies, on an equal footing.”1 Today, more than 115 countries and jurisdictions have joined the Inclusive Framework, and, having all committed to the implementation of the BEPS package, are now advancing the Inclusive Framework’s mandate, which is to (i) review the implementation of the four BEPS minimum standards; (ii) gather data for the monitoring of the other aspects of implementation, including the tax challenges of the digital economy (Action 1) and measuring and monitoring BEPS (Action 11); (iii) finalise the remaining technical work to address BEPS challenges;
1 Communiqué of G20 Finance Ministers and Central Bank Governors from the meeting in Ankara on 4–5 September 2015, paragraph 11.
Digital economy (1)
Multilateral instrument (15)
Hybrid mismatch arrangements (2)
CFC rules (3)
Interest deductions (4)
Harmful tax practices (5)*
Coherence Substance
Measuring and monitoring BEPS (11)
Disclosure rules (12)
Dispute resolution (14)*
Transparency
Avoidance of PE status (7)
Transfer pricing aspects of intangibles (8)
Transfer pricing risk and capital (9)
Transfer pricing high-risk transactions (10)
Preventing tax treaty abuse (6)*
*Minimum standards
Transfer pricing documentation (13)*
95Estimating the fiscal effects of base erosion and profit shifting: data availability and analytical issues
and (iv) support jurisdictions in their implementation of the BEPS package, including by providing further guidance on the standards and by developing tool kits for low-income countries.
3. Measuring BEPS: data availability and analytical issues
The 2015 BEPS Action 11 report focused on the measurement and monitoring of the fiscal impacts arising from the tax planning strategies of multinational enterprises (MNEs), including through the various profit-shifting channels outlined in the BEPS Action Plan. In presenting an extensive literature review of the most relevant profit-shifting studies, the report presented evidence of more than 100 studies confirming the existence of BEPS. The Action 11 report also outlined a dashboard of BEPS indicators and produced an original empirical analysis leading to an estimate of the total amount of CIT revenue losses at the global level arising from BEPS, as well as some recommendations for better data and tools to measure BEPS. The net revenue loss was estimated to amount to between 4 per cent and 10 per cent of global CIT revenues or between US$100 billion and US$240 billion, in 2014 figures.
The Action 11 report highlights the inherent difficulties associated with such an estimation task. In particular, the report notes the considerable data and methodological limitations that any such endeavour encounters. As with many other complex policy issues, analysts wanting to inform policy making must choose between several imperfect approaches depending on the precise question that they are seeking to answer and the available data. For this reason, the remainder of this research note discusses some of the key issues relating to data availability and the analytical issues to be addressed to estimate BEPS.
3.1 Currently available data
The data currently available for BEPS analysis ranges from highly aggregated data such as those in national accounts to more granular information available in company financial statements, and very detailed, country-specific and firm-specific data revealed through media reporting and parliamentary and congressional enquiries. The Action 11 report considers the various data sources available for analysing BEPS and assesses the strengths and limitations of these data sources. It identified national accounts, balance of payments, foreign direct investment, trade and customs data as well as aggregate CIT revenues as the main sources of macroeconomic data. All these data sources are publicly available through national statistical offices or international organisations.
Whereas macroeconomic data have the advantage of being readily available with broad coverage, many recent academic studies of profit shifting (e.g., reviewed
96 TRANSNATIONAL CORPORATIONS Volume 25, 2018, Number 2
by Heckemeyer and Overesch, 2017, as well as in the Action 11 report, OECD, 2015a) make use of the growing availability of firm-level microeconomic data. This development has enabled academics to go beyond aggregate country-level analyses to study profit-shifting behaviours at the level of individual MNE affiliates. The most relevant macroeconomic and microeconomic data sources are listed in Table 1.
As Dharmapala (2014) points out, the move towards affiliate-level microeconomic data has significantly improved the ability to analyse multiple dimensions of profit shifting, in particular because many studies are now able to draw on panel data. This development has enabled researchers to control for observable and unobservable determinants of an MNE affiliate’s income, such as, unreported intangible assets or quality of infrastructure or labour force, by including fixed effects in their econometric specifications.
Despite the advantages of microeconomic data, especially when investigating specific BEPS channels, it has some drawbacks when attempting to derive global fiscal estimates of BEPS. For example, commercial databases of firm financial statements such as Orbis or Amadeus contain non-random samples of MNEs. The sample selection may affect the estimate of profit shifting, and then, to arrive at a global fiscal estimate, it may be necessary to adjust for types of firms and countries not covered in the original data set. Alternatively, if the data set builds on the complete population of firms in a country, such as tax return data or financial information collected by governments, it may be better suited to estimating semi-elasticities of profit shifting in that country. A global estimate would require making the assumption that firms elsewhere behave similarly to those observed in the data.
One final shortcoming of almost all available data sources is the underrepresentation of developing countries. This may lead to underestimates of global profit shifting, especially given the significance of BEPS in developing countries found by some recent studies (UNCTAD, 2015; Crivelli et al., 2016; and Reynolds and Wier, 2016.
3.2 Analytical and methodological issues
In addition to issues associated with data availability, there are several key methodological issues to consider when undertaking empirical analysis of BEPS or evaluating existing studies. In this note, we focus on two of the most significant issues: the challenge of separating BEPS from real activity and the choice of the tax rate to use.
These are significant issues because almost all empirical studies examine differences in corporate profits across countries or firms, and most studies look at correlations between measures of corporate profits and taxation. Empirical studies of BEPS must attempt to separate high profits linked to BEPS and high profits linked to non-tax factors, such as high amounts of capital, skilled labour, or high-quality
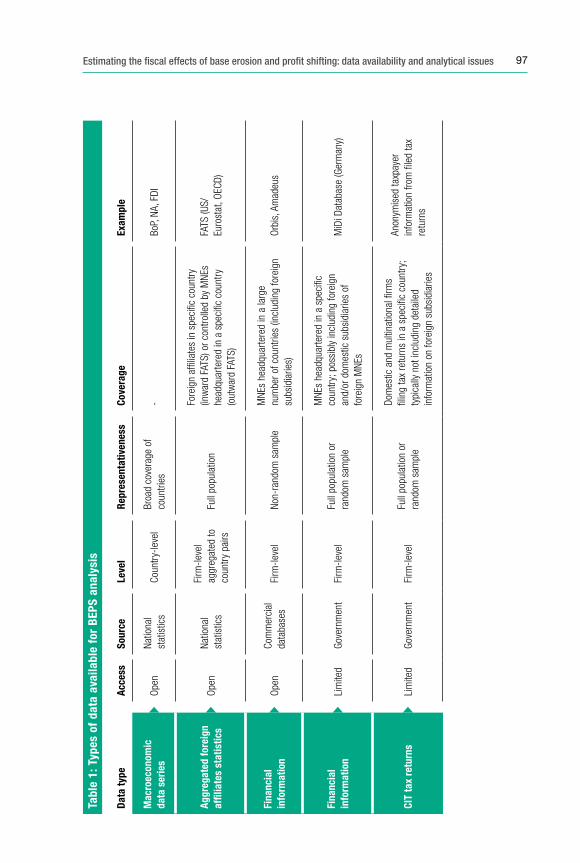
97Estimating the fiscal effects of base erosion and profit shifting: data availability and analytical issues
Tabl
e 1:
Typ
es o
f da
ta a
vaila
ble
for
BEP
S an
alys
is
Data
type
Acce
ssSo
urce
Leve
lRe
pres
enta
tiven
ess
Cove
rage
Exam
ple
Mac
roec
onom
ic
data
ser
ies
Ope
nNa
tiona
l st
atis
tics
Coun
try-le
vel
Broa
d co
vera
ge o
f co
untri
es-
BoP,
NA,
FDI
Aggr
egat
ed fo
reig
n af
fi lia
tes
stat
istic
sO
pen
Natio
nal
stat
istic
s
Firm
-leve
l ag
greg
ated
to
coun
try p
airs
Full
popu
latio
n
Fore
ign
af� l
iate
s in
spe
ci� c
cou
ntry
(in
war
d FA
TS) o
r con
trolle
d by
MNE
s he
adqu
arte
red
in a
spe
ci� c
cou
ntry
(o
utw
ard
FATS
)
FATS
(US/
Euro
stat
, OEC
D)
Fina
ncia
l in
form
atio
nO
pen
Com
mer
cial
da
taba
ses
Firm
-leve
lNo
n-ra
ndom
sam
ple
MNE
s he
adqu
arte
red
in a
larg
e nu
mbe
r of c
ount
ries
(incl
udin
g fo
reig
n su
bsid
iarie
s)O
rbis
, Am
adeu
s
Fina
ncia
l in
form
atio
nLi
mite
dGo
vern
men
tFi
rm-le
vel
Full
popu
latio
n or
ra
ndom
sam
ple
MNE
s he
adqu
arte
red
in a
spe
ci� c
co
untry
; pos
sibl
y in
clud
ing
fore
ign
and/
or d
omes
tic s
ubsi
diar
ies
of
fore
ign
MNE
s
MiD
i Dat
abas
e (G
erm
any)
CIT
tax
retu
rns
Lim
ited
Gove
rnm
ent
Firm
-leve
lFu
ll po
pula
tion
or
rand
om s
ampl
e
Dom
estic
and
mul
tinat
iona
l � rm
s � l
ing
tax
retu
rns
in a
spe
ci� c
cou
ntry
; ty
pica
lly n
ot in
clud
ing
deta
iled
info
rmat
ion
on fo
reig
n su
bsid
iarie
s
Anon
ymis
ed ta
xpay
erin
form
atio
n fro
m �
led
tax
retu
rns
98 TRANSNATIONAL CORPORATIONS Volume 25, 2018, Number 2
infrastructure. Analysts also face the difficult task of separating high reported profits due to BEPS from other corporate activity motivated by taxation, since taxation plays a role in the location of investment regardless of any opportunities for BEPS. The choice of an appropriate tax rate indicator in empirical studies is important in capturing firms’ incentives to engage in BEPS and in accurately measuring the relationship between profits and tax costs faced by firms.
a. Separating BEPS from real economic activity
BEPS refers to tax avoidance strategies that exploit gaps and mismatches in tax rules to artificially shift profits to low or no-tax locations. How to define BEPS and how to separate it from real economic activity is one of the major challenges in measuring BEPS. The mere fact that an MNE or its affiliates take advantage of different countries’ tax rates does not, in itself, amount to BEPS. For example, an MNE that decides to locate real economic activities such as a plant or factory in a jurisdiction on account of that jurisdiction’s tax rate is not engaging in BEPS.
It is, therefore, important to disentangle BEPS behaviours from real economic activities. However, this results in both a conceptual challenge of deciding which economic activities to take into account and a measurement challenge of determining which variables best reflect the chosen economic activities. The challenge of defining and measuring economic activity has become even more difficult with the increasing importance of intangible assets and risk management in global value chains. Intangible assets are clearly an important driver of value creation, but they are also highly mobile and difficult to value, and the ability of MNEs to separate intangible assets from other economic activity may be viewed as one factor exacerbating BEPS.
The analytical challenges flow from the fact that there is neither agreement on how to define real economic activity nor agreement on what economic activities generate profits. The current international tax rules generally use a fact-specific approach that addresses a company’s functions, assets and risks. However, without access to the detailed data necessary to engage in a more granular transfer pricing analysis, empirical studies must rely on much broader measures of economic activity. Many economic studies rely on capital (through assets) and labour (through number of employees or levels of staff compensation) as the factors of production, to measure economic activity. Other studies suggest that the location of sales should also be used.
Even if there was agreement on which economic activities should be taken into account, there are many measurement challenges. For example, intangible assets are defined, for accounting purposes, as identifiable non-monetary assets without physical substance that are controlled by an entity and from which future economic benefits can be expected. This definition includes all forms of intellectual property
99Estimating the fiscal effects of base erosion and profit shifting: data availability and analytical issues
such as patents, copyrights, trademarks, utility models, and software or web pages. In addition, certain intangible commercial assets, such as brands, fall into this definition.
However, the value of total assets typically underestimates the value of intangible capital assets. First, this definition excludes certain intangible assets that are often important value drivers, such as know-how or human capital, because they cannot be separately identified from the firm. Second, below certain cost thresholds, investments in internally generated intangible assets, such as research and development (R&D) expenditures, are generally deducted or expensed in the year of the investment for financial statement accounting, and thus intangibles are not included in the value of total assets. Third, there are often considerable challenges associated with the valuation of intangible assets acquired in an acquisition or purchase, especially where it may be difficult to find suitable comparables.
There are also difficulties with measuring labour. Using the number of employees may not distinguish between full-time and part-time employees. The number of employees also does not take into account employees’ differing skill levels and productivity. Measuring labour by reference to employee compensation should better account for differences across employees; however, issues are still likely to arise where employees work across multiple jurisdictions, which may not be adequately accounted for in the data. However, at a time when firms are increasingly shifting from human labour to automated processes, reliance on labour as the principal metric of a firm’s economic activities may also be misleading.
The location of sales may also be difficult to measure. Sales are often measured in the countries where the sales originated (i.e., origin or production location) rather than where the final consumers are located (i.e., market perspective). In addition, the digitalisation of the economy and the growth of business models that rely upon multi-sided markets – especially where one side of the market involves barter-like transactions – presents challenges as to whether the location of sales fully captures other user-based contributions that may be made as part of transactions that do not involve the payment of any financial consideration.
b. Choice of countries’ tax rate
Another major analytical issue is the appropriate tax rate to use when analysing BEPS. In general, analysts would prefer to use a tax rate that captures the marginal tax rate applicable to the shifted income.
Statutory corporate tax rates are often used in empirical studies of BEPS, and, in the absence of other provisions in the tax code, statutory rates should capture the marginal incentive to shift profits between countries. For example, if €100 of taxable income is shifted from a country with a 25 per cent statutory tax rate to a country
100 TRANSNATIONAL CORPORATIONS Volume 25, 2018, Number 2
with a 0 per cent statutory tax rate, then the MNE’s tax liability would be reduced by €25. However, headline statutory corporate tax rates may not fully capture the tax incentives to shift income. Some countries may legislate lower tax rates on certain types of income or may offer lower negotiated rates to some taxpayers. Therefore, MNEs may still face incentives to shift income into countries with high headline statutory tax rates. In the same way, statutory corporate tax rates do not capture the impact of withholding taxes, which may also have a significant impact on an MNE’s incentives to shift income from one jurisdiction to another.
Another type of tax rate used in BEPS analysis is the backward-looking average effective tax rate. It is generally calculated as the ratio of tax paid over pre-tax profits. Depending on the data being used, this may be calculated for individual firms, from financial statement or tax return data, or at a more aggregate level, such as from data from foreign affiliate statistics (FATS). Compared with statutory corporate tax rates, backward-looking average effective tax rates may better reflect the tax burden that companies actually face, by taking into account the various aspects of the corporate tax system, including concessionary rates and instances where the base has been deliberately narrowed by legislated incentives. However, some of the provisions captured by backward-looking effective tax rates may not be related to the profit-shifting incentives faced by MNEs. Backward-looking rates may reflect the historical behaviour of firms and capture the tax effects of depreciation from prior investments and loss deductions carried forward from previous years. They also capture non-BEPS tax incentives, such as R&D credits and energy tax credits. In addition, backward-looking effective tax rates calculated from financial statement data may not accurately reflect the tax burden a firm faces in a specific country. A firm’s country of incorporation may differ from its country of tax residence, and the tax expense reported on financial statements may include tax paid in multiple countries.
Some studies of BEPS have also used forward-looking effective average tax rates (EATRs) and effective marginal tax rates (EMTRs) calculated for hypothetical firms. The chief difference between these effective tax rates and the statutory corporate tax rate is that these rates account for the tax base as defined by country-specific corporate tax provisions, such as fiscal depreciation rules, interest deduction limitation rules, and investment tax credits. EMTRs measure the extent to which taxation increases the pre-tax rate of return required by investors to break even, which may be used to assess how taxes affect the incentive to expand investment. EATRs measure the effect of taxation on investment projects earning economic rents, which may be used to assess choices along the extensive margin, such as a firm’s location decision or technology choice. However, because these tax rates are calculated for hypothetical firms with assumptions about the asset mix and use of debt, they will not be representative of all firms across the economy. They are also generally calculated for domestic investment and may not capture important aspects of the international corporate tax rules. Furthermore, they may
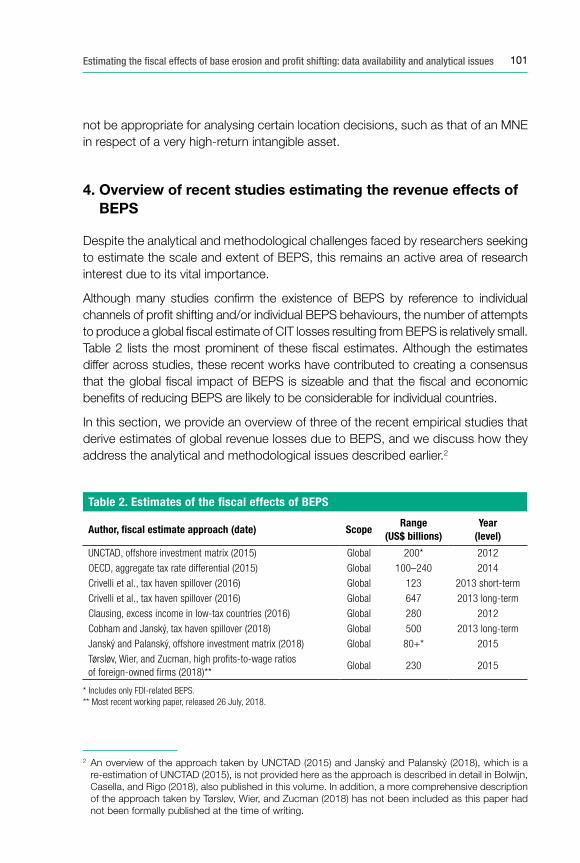
101Estimating the fiscal effects of base erosion and profit shifting: data availability and analytical issues
not be appropriate for analysing certain location decisions, such as that of an MNE in respect of a very high-return intangible asset.
4. Overview of recent studies estimating the revenue effects of BEPS
Despite the analytical and methodological challenges faced by researchers seeking to estimate the scale and extent of BEPS, this remains an active area of research interest due to its vital importance.
Although many studies confirm the existence of BEPS by reference to individual channels of profit shifting and/or individual BEPS behaviours, the number of attempts to produce a global fiscal estimate of CIT losses resulting from BEPS is relatively small. Table 2 lists the most prominent of these fiscal estimates. Although the estimates differ across studies, these recent works have contributed to creating a consensus that the global fiscal impact of BEPS is sizeable and that the fiscal and economic benefits of reducing BEPS are likely to be considerable for individual countries.
In this section, we provide an overview of three of the recent empirical studies that derive estimates of global revenue losses due to BEPS, and we discuss how they address the analytical and methodological issues described earlier.2
2 An overview of the approach taken by UNCTAD (2015) and Janský and Palanský (2018), which is a re-estimation of UNCTAD (2015), is not provided here as the approach is described in detail in Bolwijn, Casella, and Rigo (2018), also published in this volume. In addition, a more comprehensive description of the approach taken by Tørsløv, Wier, and Zucman (2018) has not been included as this paper had not been formally published at the time of writing.
Table 2. Estimates of the fi scal effects of BEPS
Author, fi scal estimate approach (date) ScopeRange
(US$ billions)Year
(level)
UNCTAD, offshore investment matrix (2015) Global 200* 2012
OECD, aggregate tax rate differential (2015) Global 100–240 2014
Crivelli et al., tax haven spillover (2016) Global 123 2013 short-term
Crivelli et al., tax haven spillover (2016) Global 647 2013 long-term
Clausing, excess income in low-tax countries (2016) Global 280 2012
Cobham and Janský, tax haven spillover (2018) Global 500 2013 long-term
Janský and Palanský, offshore investment matrix (2018) Global 80+* 2015
Tørsløv, Wier, and Zucman, high pro� ts-to-wage ratios of foreign-owned � rms (2018)**
Global 230 2015
* Includes only FDI-related BEPS.** Most recent working paper, released 26 July, 2018.
102 TRANSNATIONAL CORPORATIONS Volume 25, 2018, Number 2
4.1 The BEPS action 11 report
The fiscal estimate in the 2015 Action 11 report incorporates revenue losses due to BEPS through two channels: (i) profit shifting and (ii) mismatches between tax systems and preferential treatment. The main part of the analysis was undertaken using firm-level financial accounts micro-data from the Orbis database. Although Orbis has many gaps in coverage, it continues to be one of the most comprehensive databases of company financial information available.3
The analysis is based on two key empirical findings. First, the analysis estimates the sensitivity of the reported profitability of MNE affiliates to tax rate differentials. Here, the tax rate differential is the difference between the statutory tax rate of the country of an MNE affiliate and the average statutory tax rate of the countries of the rest of the affiliates in the MNE group. Profitability is measured as the ratio of reported profits to total assets in the main specification; the study also measures profitability as the ratio of reported profits to the number of employees in a robustness check. Regressors, such as GDP growth and the location of the affiliate within the group, are included to control for other drivers of profitability.
The second part of the analysis measures the extent to which large entities belonging to MNE groups had lower backward-looking effective tax rates than comparable entities that were part of domestic-only groups. This difference could be due to the ability of MNEs to exploit mismatches between tax systems, such as hybrid mismatch arrangements, and could also reflect a greater ability to take advantage of preferential treatment to reduce their tax liability.
After estimates of these two effects were obtained through regression analysis of the Orbis micro-data, they were used to derive an estimate of tax revenue losses due to BEPS. In order to arrive at a global estimate, some adjustments were made to take into account firms not covered by Orbis, and the revenue effect was calculated using global CIT revenues rather than the total taxes paid as reported in Orbis. Adjustments were also made to take into account the effect of tax credits on CIT payments.
4.2 Crivelli, De Mooij and Keen (2016)
Crivelli et al. (2016) set forth an approach making use of country-level CIT revenue data and tax rate information which, unlike most data used to study BEPS, is available for many developing countries. This approach was re-estimated by Cobham and Janský (2018). The analysis in Crivelli et al. (2016) sets out to measure
3 For a more detailed assessment of the strengths and weaknesses of the Orbis database, see the Action 11 report (OECD, 2015a).
103Estimating the fiscal effects of base erosion and profit shifting: data availability and analytical issues
two channels through which tax rates may affect tax bases: tax-motivated real investment decisions, where real activity is relocated to low-tax countries, and pure profit shifting, where part of the CIT base is shifted to low-tax countries but real activity is not moved.
Crivelli et al. (2016) estimate how a country’s CIT base depends on its own statutory tax rate and the average statutory tax rate of other countries. They use a few measures of other countries’ tax rates. In order to measure tax-motivated real capital movement, they use a GDP-weighted average of the tax rates of all other countries, with the assumption being that changes in real investment will depend on the economic size of other countries. In order to measure BEPS, they estimate the response of CIT bases to the unweighted average tax rate of countries classified as tax havens, taking the tax haven classification from a paper by Gravelle (2013). In this case, the assumption behind using an unweighted average is that, since profit shifting can be undertaken with minimal relocation of real activity, the size of tax havens’ economies is not important with regard to profit shifting.
Crivelli et al. (2016) and its re-estimation by Cobham and Janský (2018) are good examples of the different tax rate measures that have been used in the literature. In addition to statutory tax rates, Crivelli et al. (2016) use forward-looking EATRs as a tax rate measure in their study. However, they do not attempt to measure pure profit shifting using EATRs since they do not have EATRs available for enough tax havens. Cobham and Janský (2018), in their re-estimation of this study, substitute backward-looking EATRs as a tax rate measure. These are computed at the country level from both the Orbis database and United States FATS. These might be expected to be better measures of the incentives to shift profits into tax havens since some tax havens have high headline rates, with lower rates available through special regimes. However, Cobham and Janský (2018) tend to find less statistically significant results with sometimes unexpected signs using these rates instead of the statutory rate.
4.3 Clausing (2016)
Clausing (2016) uses outward FATS for the United States to estimate the fiscal loss to the United States arising from BEPS. The United States compiles very comprehensive FATS, and the net income and foreign taxes of foreign affiliates of United States MNEs are available at the country level. In this study, the data are used to estimate the relationship between profits reported in foreign countries by United States MNEs and the countries’ backward-looking EATRs, which are calculated from the income and tax data available in FATS. To control for real economic activity, macroeconomic variables (GDP and population) are included, as well as the number of employees and the value of plant, property, and equipment.
104 TRANSNATIONAL CORPORATIONS Volume 25, 2018, Number 2
After estimating this semi-elasticity of profits with respect to tax rates, the study calculates what the profits would have been in the countries of operation of United States foreign affiliates in the absence of differences in tax rates among foreign countries and the United States. Some of the profits in low-tax countries are then allocated to the United States on the basis of the share of intrafirm transactions that occur between foreign affiliates and United States parents relative to all intrafirm transactions undertaken by affiliates. The study assumes that these profits would be taxed at the United States statutory CIT rate less 5 per cent, allowing for some degree of tax base narrowing.
The United States is the only country that compiles and publishes such extensive data on the activities of MNEs, and thus a similar exercise cannot be performed for all countries. Using her findings from the United States data, Clausing extends her analysis to estimate a speculative global revenue loss from BEPS. The study takes the overall profits of the world’s 2,000 largest corporations and makes the simplifying assumption that corporations have affiliates in two types of countries: high-tax countries (those with tax rates greater than 15 per cent) and low-tax countries (those with tax rates less than 15 per cent). The study assumes that the share of income booked in low-tax countries is proportionate to the share of United States MNE foreign income that is booked in low-tax countries. The study also assumes that the profit-shifting elasticity is the same as that calculated for the United States and allocates profits back to high-tax countries on the basis of their GDP. A revenue effect is calculated under the assumption that these profits would be taxed at the countries’ statutory CIT rates less 5 per cent.
5. New OECD Corporate Tax Statistics
It is evident from the short discussion in the preceding sections that any attempt to produce an empirical estimate of the global revenue impacts of BEPS faces a range of significant challenges. On the one hand, any empirical approach is constrained by the fact that currently available data sources suffer from various shortcomings. Although increased use of firm-level data and related econometric methods have allowed researchers to produce more detailed profit-shifting estimates, these developments have not entirely overcome many of the hurdles faced by researchers seeking to derive an estimate of the global revenue losses arising from BEPS. As highlighted in the preceding discussion, a large number of assumptions are necessary, depending on the types of data used in the econometric analysis. On the other hand, a number of analytical issues remain.4 This note has focused on
4 The BEPS Action 11 report noted a number of future areas of economic research, including the factors contributing to group and affiliate profitability of transnational corporations; see page 122.
105Estimating the fiscal effects of base erosion and profit shifting: data availability and analytical issues
two of these analytical issues: First, empirical strategies should aim at disentangling BEPS from real economic activity; however, this raises issues of delineation and measurement, especially in the context of intangibles. Second is the issue of which tax rate variable is best suited to capturing the incentives to engage in BEPS. Both of these analytical issues must be addressed, regardless of the data relied upon and the econometric approach adopted.
As noted in the preceding section, the BEPS Action 11 report included an assessment of currently available data sources and methodologies, and concluded both that data limitations severely constrain economic analysis of the scale and economic impact of BEPS and that improved data and methodologies are required. Recognising the lack of relevant and currently available data, the report included a series of recommendations designed to improve the quality of available data to support ongoing measurement and monitoring of BEPS.
In particular, the BEPS Action 11 report recommended that the OECD work with the members of the Inclusive Framework on BEPS to compile a new data set, Corporate Tax Statistics. For the first release in November 2018, the data set will contain three main categories of data: tax revenues, tax rates, and tax incentives, especially in relation to R&D-related incentives. Future editions, from 2019 onwards, will also include aggregated and anonymised statistics from the Country-by-Country Reports (CbCRs), which are being filed by MNE groups with a turnover above €750 million.
The Corporate Tax Statistics data set will bring together, in an internationally consistent format, a range of aggregate country data relevant to the analysis of BEPS and the taxation of corporations generally. Although these newly collected data will not relieve researchers of the need to make the difficult methodological and analytical choices described earlier, the development of this new data set will mark a significant step forward in ensuring that improved data and statistics on MNEs will be available to researchers, policy makers, and the broader public in the future.
106 TRANSNATIONAL CORPORATIONS Volume 25, 2018, Number 2
References
Bolwijn Richard, Bruno Casella, and Davide Rigo. (2018). “An FDI-driven approach to measure the scale and economic impact of BEPS”. Transnational Corporations 25 (2).
Clausing, Kimberly A. (2016). “The effect of profit shifting on the corporate tax base in the United States and beyond”, National Tax Journal 69 (4), pp. 905-934.
Cobham, Alex, and Petr Janský. (2018). “Global distribution of revenue loss from tax avoidance: re-estimation and country results”, Journal of International Development 30 (2), pp. 206-232.
Crivelli, Ernesto, Ruud de Mooij, and Michael Keen. (2016). “Base erosion, profit shifting and developing countries”, FinanzArchiv: Public Finance Analysis 72 (3), pp. 268-301.
Dharmapala, Dhammika. (2014). “What do we know about base erosion and profit shifting? A review of the empirical literature”, Fiscal Studies 35(4), pp. 421-448.
Gravelle, Jane. (2013). “Tax havens: International tax avoidance and evasion.” (United States: Congressional Research Service).
Heckemeyer, Jost H. and Michael Overesch. (2017). “Multinationals’ profit response to tax differentials: effect size and shifting channels.” Canadian Journal of Economics/Revue canadienne d’économique 50(4), pp. 965-994.
Janský, Petr and Miroslav Palanský. (2018). “Estimating the scale of profit shifting and tax revenue losses related to foreign direct investment”, WIDER Working Paper 2018/21. (Helsinki: UNU-WIDER).
OECD. (2013). Addressing Base Erosion and Profit Shifting, OECD/G20 Base Erosion and Profit Shifting Project. (Paris: OECD Publishing).
OECD. (2015a). Measuring and Monitoring BEPS, Action 11 – 2015 Report, OECD/G20 Base Erosion and Profit Shifting Project. (Paris: OECD Publishing).
OECD. (2015b). Transfer Pricing Documentation and Country-by-Country Reporting, Action 13 – 2015 Final Report, OECD/G20 Base Erosion and Profit Shifting Project. (Paris: OECD Publishing).
OECD. (2018). Tax Challenges Arising from Digitalisation – Interim Report 2018: Inclusive Framework on BEPS, OECD/G20 Base Erosion and Profit Shifting Project. (Paris: OECD Publishing).
Reynolds, Hayley and Wier, Ludvig. (2016). “Estimating profit shifting in South Africa using firm-level tax returns”, WIDER Working Paper 2016/128. (Helsinki: UNU-WIDER).
Tørsløv, Thomas, Ludvig Wier, and Gabriel Zucman. (2018). “The Missing Profits of Nations”, unpublished working paper.
UNCTAD. (2015). World Investment Report 2015: Reforming International Investment Governance. New York and Geneva: United Nations.
107
An FDI-driven approach to measuring the scale and economic impact of BEPS†
Richard Bolwijn, Bruno Casella and Davide Rigo*
This paper explores the link between foreign direct investment (FDI) and the BEPS (base erosion and profit shifting) practices of multinationals (MNEs). It puts the spotlight on the outsize role of offshore investment hubs as major players in global corporate investment, a role that is largely due to MNEs’ tax planning, although other factors contribute. The paper shows that tax avoidance practices enabled by FDI through offshore hubs are responsible for significant leakage of development financing resources. In policy terms, these findings call for enhanced cooperation and synergies between international tax and investment policymaking.
Keywords: multinational enterprise, BEPS, revenue losses, developing countries, offshore investment
1. Introduction: an investment perspective on international taxation
MNEs build their corporate structures through cross-border investment. They construct those corporate structures in the most tax-efficient manner possible, within the constraints of their business and operational needs. The size and direction of FDI flows are thus often influenced by MNE tax considerations, because the structure and modality of the underlying investments enable tax avoidance opportunities on subsequent investment income. In tackling tax avoidance, most notably in the BEPS approach, the attention of policymakers focuses naturally on tax rules, company law and transparency principles – i.e. on accounting for income. The fundamental role of investment as the enabler of tax avoidance warrants a complementary perspective.
† This paper draws on the technical background paper accompanying the World Investment Report 2015, chapter V, “International Tax and Investment Policy Coherence”, prepared under the guidance of James X. Zhan. The authors benefited from comments provided by David Bradbury, Krit Carlier, Steve Clark, Alex Cobham, Lorrain Eden, Martin Hearson, Jan Loeprick, Ruud de Mooij and Thomas Neubig. The authors are responsible for all the remaining errors.
* Richard Bolwijn and Bruno Casella are at the United Nations Conference on Trade and Development. Davide Rigo is at the Graduate Institute of International and Development Studies, Geneva. The corresponding author is Bruno Casella ([email protected]). The views expressed in this article are solely those of the authors and do not necessarily represent the views of the United Nations.
108 TRANSNATIONAL CORPORATIONS Volume 25, 2018, Number 2
This paper aims to provide a new perspective on corporate international taxation and MNE tax avoidance schemes. It integrates the mainstream approach of the BEPS project with an investment-based approach emphasizing the relevance of corporate structures set up by channelling FDI through offshore investment hubs and offshore financial centres (OFCs), notably tax havens and jurisdictions offering so-called special purpose entities (SPEs), as these are the enablers of many BEPS schemes. In essence, corporate structures built through FDI can be considered “the engine” and profit shifting “the fuel” of MNE tax avoidance schemes.
In order to analyse the scope, dimensions and effects of tax-efficient corporate structures (“fuel-efficient engines”), this paper looks at FDI flowing through OFCs or conduit jurisdictions (transit FDI). It is important to emphasize from the outset that the notion of transit FDI does not equate to non-productive FDI. FDI designed as part of tax planning strategies of MNEs may or may not have a real economic impact on the countries involved. For example, an investment by a North American firm in Asia to start a new production plant may be channelled through Europe for tax reasons (potentially penalizing tax revenues in both home and host countries) but still carry the productive-asset-creating effects of a greenfield investment. By contrast, transit FDI tends to have very little real economic impact in countries that act as investment hubs in MNE tax planning schemes.
It should be also noted that the conduit countries discussed in this paper are not alone in offering certain tax benefits to foreign investors; a degree of tax competition has led many other countries to adopt similar policies. No policy implications are implied by the scope of the perimeter for offshore investment hubs used in this paper. In fact, the analysis will show that any action on tax avoidance practices needs to address policies across all jurisdictions – in base (home) countries, conduit (transit) countries and source (host) countries alike.
The policy implications of this study are significant. In particular, the interdependence between the international tax and investment dimensions calls for an integrated policy approach. UNCTAD’s World Investment Report 2015 (WIR15) established 10 guidelines for coherent international tax and investment policies (figure 1), addressing the most pressing issues at the intersection between the international tax and investment domains: removing aggressive tax planning opportunities as investment promotion levers (guideline 1); considering the potential impact on investment of anti-avoidance measures (2); leveraging national investment policies to prevent and combat tax avoidance (3, 4); managing the interaction between international investment and tax agreements (5, 6); taking a partnership approach in recognition of shared responsibilities between investor host, home and conduit countries (7); strengthening the role of both investment and fiscal revenues in sustainable development as well as the capabilities of developing countries to address tax avoidance issues (8, 9); and enhancing transparency of investment and ownership information, as a tool to
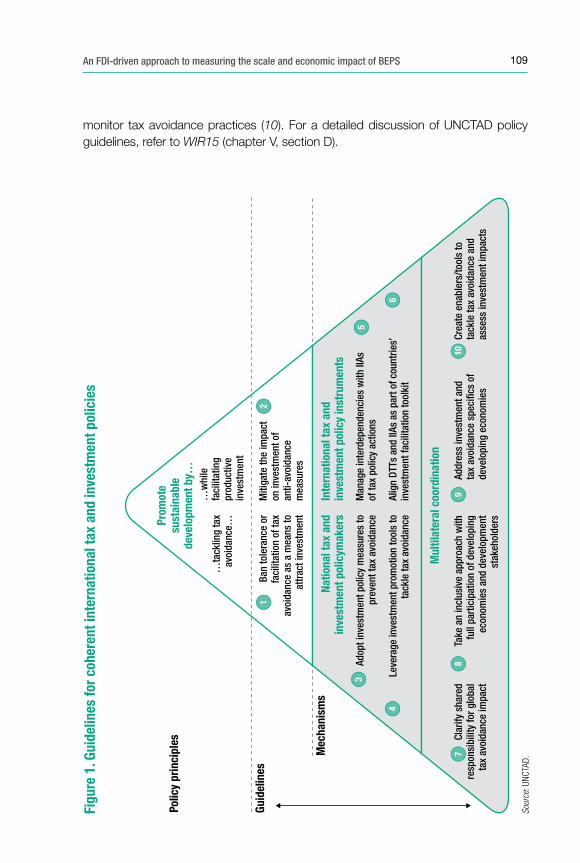
109An FDI-driven approach to measuring the scale and economic impact of BEPS
Sour
ce: U
NCTA
D.
Figu
re 1
. Gui
delin
es fo
r coh
eren
t int
erna
tiona
l tax
and
inve
stm
ent p
olic
ies
Mec
hani
sms
Prom
ote
sust
aina
ble
deve
lopm
ent b
y…Po
licy
prin
cipl
es
Guid
elin
es
…ta
cklin
g ta
x av
oida
nce…
Natio
nal t
ax a
nd
inve
stm
ent p
olic
ymak
ers
Adop
t inv
estm
ent p
olic
y m
easu
res
to
prev
ent t
ax a
void
ance
Leve
rage
inve
stm
ent p
rom
otio
n to
ols
to
tack
le ta
x av
oida
nce
Inte
rnat
iona
l tax
and
in
vest
men
t pol
icy
inst
rum
ents
Man
age
inte
rdep
ende
ncie
s w
ith II
As
of ta
x po
licy
actio
ns
Mul
tilat
eral
coo
rdin
atio
n
Alig
n DT
Ts a
nd II
As a
s pa
rt o
f cou
ntrie
s’
inve
stm
ent f
acili
tatio
n to
olki
t
Clar
ify s
hare
d re
spon
sibi
lity
for g
loba
l ta
x av
oida
nce
impa
ct
Take
an
incl
usiv
e ap
proa
ch w
ith
full
part
icip
atio
n of
dev
elop
ing
econ
omie
s an
d de
velo
pmen
t st
akeh
olde
rs
Addr
ess
inve
stm
ent a
nd
tax
avoi
danc
e sp
eci�
cs o
f de
velo
ping
eco
nom
ies
Crea
te e
nabl
ers/
tool
s to
ta
ckle
tax
avoi
danc
e an
d as
sess
inve
stm
ent i
mpa
cts
…w
hile
fa
cilit
atin
gpr
oduc
tive
inve
stm
ent
Miti
gate
the
impa
ct
on in
vest
men
t of
anti-
avoi
danc
e m
easu
res
Ban
tole
ranc
e or
fa
cilit
atio
n of
tax
avoi
danc
e as
a m
eans
to
attr
act i
nves
tmen
t
12
3
6
78
910
4
5
Sour
ce: U
NCTA
D.
monitor tax avoidance practices (10). For a detailed discussion of UNCTAD policy guidelines, refer to WIR15 (chapter V, section D).
110 TRANSNATIONAL CORPORATIONS Volume 25, 2018, Number 2
The rest of this paper focuses instead on the analytic background of WIR15. It integrates material both from chapter V of WIR15 and its annex (annex II), the latter being the main source. Our objective is to provide a comprehensive and self-contained account of UNCTAD’s analysis of the scale and economic impact of BEPS, one of the two analytic pillars of UNCTAD research in the broad area of investment and international taxation (the other pillar is the “contribution analysis” presented in Bolwijn et al., 2018).
This paper consists of two building blocks. The first part (section 2) presents a methodology for analysing investment through OFC jurisdictions. The key outcome is the Offshore Investment Matrix, an analytical tool to map and quantify corporate investment patterns through such jurisdictions. The second building block, in section 3, uses the results from the matrix to estimate the profit shifting and tax revenue losses generated by investment through OFCs. We empirically show that countries with greater exposure to OFCs tend to underreport profits from foreign investment, and we interpret this effect as an indicator of profit-shifting practices enabled by FDI through OFCs. The relationship between FDI through OFCs and profit shifting is then used to estimate potential tax revenue losses for host countries exposed to investment from OFCs. The estimation of revenue losses primarily focuses on developing countries, but the methodology can be easily applied to developed countries as well (box 1).
From a methodological perspective, the approach presented in this paper is characterized by the central role of FDI statistics from the balance of payments (BoP), either stock data from capital accounts or their income counterparts (FDI income) from current accounts. In this context, FDI statistics provide information on the international presence and operations of MNEs, a key input to any empirical study on corporate tax avoidance and a very difficult one to find. Despite some known limitations (Lipsey, 2007; Beugelsdijk et al., 2010; Leino and Ali-Yrkko, 2014), FDI statistics benefit from greater coverage and country cross-comparability than other sources of information on MNEs’ activity, such as firm-level or survey data (see, for example, the discussion in Casella, 2018). Recently, Cobham and Loretz (2014) and Tørsløv et al. (2018) also discussed the limitations of firm-level data from ORBIS Bureau Van Dijk for the analysis of BEPS, primarily stemming from the lack of reported financials at the subsidiary level. Interestingly, Tørsløv et al. (2018) show that only 17% of MNEs’ consolidated profits as reported by ORBIS are reflected at the subsidiary level. Acknowledging some key limitations of firm-level data, this study was the first to fully leverage FDI statistics for the analysis of BEPS. Later studies have followed the same (Janský and Palanský, 2018) or similar approaches (Tørsløv et al., 2018). Yet, we believe that there remains substantial unexploited information on BEPS embedded in FDI statistics. Section 4 discusses some new ideas to further push the frontier in this research area.
111An FDI-driven approach to measuring the scale and economic impact of BEPS
2. Mapping corporate investment patterns through OFCs
2.1. The Offshore Investment Matrix
The objective of this first analysis is to estimate the share of international corporate investment stock routed through OFCs and conduits, either tax havens or other entities (in particular SPEs) operating in jurisdictions providing favourable legal and financial treatment for foreign investors. The key objective is to quantify to what extent tax and other financial (non-business) factors affect global corporate investment patterns.
The idea to use investment data for the analysis of offshore financial patterns is not new; there are studies alluding to this approach both by international organizations and in the academic literature. In its report on BEPS (OECD, 2013; page 17), the Organization for Economic Cooperation and Development (OECD) acknowledges FDI statistics as one of the potential sources of data on profit-shifting practices by MNEs (together with data on corporate income tax revenues), stating that “an analysis of the available data on FDIs may give useful indications in relation to the magnitude of BEPS”, and provides some anecdotal supporting evidence from data reported on FDI through tax havens. Two studies by non-governmental organizations (NGOs) (Christian Aid, 2013; ActionAid, 2013) notice the “unusual” FDI patterns related to some locations. Haberly and Wojcik (2014) resort to the notion of “offshore FDI” in a study aimed at investigating the determinants of FDI routed through tax havens. The International Monetary Fund (IMF) (2014), after identifying a number of countries with disproportionately high FDI stock, acknowledges that (page 15) “Such lists ... confirm the impression that taxation plays a key role in shaping the structure of international capital flows: jurisdictions known for attractive tax regimes and extensive treaty networks commonly feature prominently as ‘conduits’ through which investments pass”.
However, this is the first paper that provides an analytical framework for a systematic and comprehensive investigation of FDI offshore patterns at a global scale. The key analytical tool to achieve this goal is the Offshore Investment Matrix, which provides a comprehensive mapping of FDI through OFCs and offshore investment hubs (figure 2). More specifically, the matrix classifies investor and recipient countries in a bilateral FDI setting according to three classifications: tax havens, SPEs or non-OFCs. The first two represent the offshore or conduit component of global corporate investment stock, while the third represents the standard FDI stock. Analytical and methodological issues related to the definition and quantification of the three components are discussed in detail in the next section.
The Offshore Investment Matrix provides two main ways to analyse corporate investment through offshore hubs.
112 TRANSNATIONAL CORPORATIONS Volume 25, 2018, Number 2
One-sided analysis (figures 2.a and 2.b) shows the extent to which investment to and from standard jurisdictions is routed through hubs as direct partners. More specifically, inward one-sided analysis (figure 2.a) provides the size and share of investment stock into non-OFCs originating from either tax havens or SPEs; outward one-sided analysis (figure 2.b) provides the size and share of investment stock from non-OFCs invested into tax havens or SPEs.
Two-sided analysis (figure 2.c) takes a more comprehensive view, looking at all corporate investment links involving offshore investment hubs, either as investors or as recipients. It also maps investment between tax havens and SPEs, often a substantial component of tax-driven investment schemes (such as the “Double Irish–Dutch Sandwich”; see WIR15, chapter V, section B.2).
Clearly, the outcome of the Offshore Investment Matrix critically depends on the perimeter of the OFC component (tax havens and SPEs) in global investment stock: concretely, which jurisdictions are included in the perimeter of OFCs? And, for each jurisdiction of interest, which share of FDI should be qualified as “offshore”? Two options are presented here.
• A baseline conservative approach with a restricted perimeter of offshore investment hubs, including tax havens and self-declared SPE countries (section 2.2).
• An extended approach that widens the OFC perimeter beyond self-declared SPE countries (section 2.3).

113An FDI-driven approach to measuring the scale and economic impact of BEPS
Recipients
a. One-sided inward
Non-
OFCs
SPEs
Non-OFCs SPEs
Tax
have
ns
Taxhavens
Inve
stor
s
Figure 2. The Offshore Investment Matrix
= 100%
Recipients
b. One-sided outward
Non-
OFCs
SPEs
Non-OFCs SPEs
Tax
have
ns
Taxhavens
Inve
stor
s
= 100%
c. Two-sided
Non-
OFCs
SPEs
Non-OFCs SPEs
Tax
have
ns
Taxhavens
= 100%
Conduit role
Poten
tial a
rea of
“dou
ble-co
untin
g”
Recipients
Inve
stor
s
Recipients
a. One-sided inward
Non-
OFCs
SPEs
Non-OFCs SPEs
Tax
have
ns
Taxhavens
Inve
stor
s
Figure 2. The Offshore Investment Matrix
= 100%
Recipients
b. One-sided outward
Non-
OFCs
SPEs
Non-OFCs SPEs
Tax
have
ns
Taxhavens
Inve
stor
s
= 100%
c. Two-sided
Non-
OFCs
SPEs
Non-OFCs SPEs
Tax
have
ns
Taxhavens
= 100%
Conduit role
Poten
tial a
rea of
“dou
ble-co
untin
g”
Recipients
Inve
stor
s
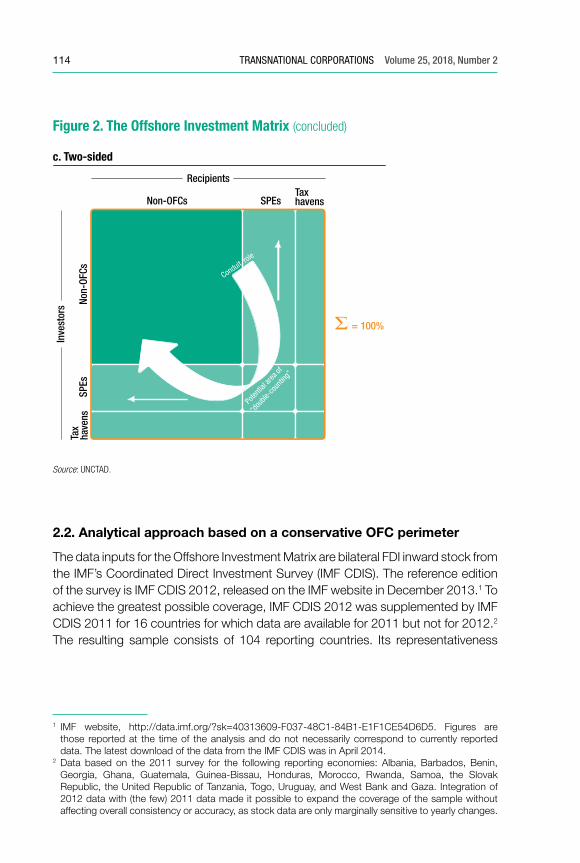
114 TRANSNATIONAL CORPORATIONS Volume 25, 2018, Number 2
2.2. Analytical approach based on a conservative OFC perimeter
The data inputs for the Offshore Investment Matrix are bilateral FDI inward stock from the IMF’s Coordinated Direct Investment Survey (IMF CDIS). The reference edition of the survey is IMF CDIS 2012, released on the IMF website in December 2013.1 To achieve the greatest possible coverage, IMF CDIS 2012 was supplemented by IMF CDIS 2011 for 16 countries for which data are available for 2011 but not for 2012.2 The resulting sample consists of 104 reporting countries. Its representativeness
1 IMF website, http://data.imf.org/?sk=40313609-F037-48C1-84B1-E1F1CE54D6D5. Figures are those reported at the time of the analysis and do not necessarily correspond to currently reported data. The latest download of the data from the IMF CDIS was in April 2014.
2 Data based on the 2011 survey for the following reporting economies: Albania, Barbados, Benin, Georgia, Ghana, Guatemala, Guinea-Bissau, Honduras, Morocco, Rwanda, Samoa, the Slovak Republic, the United Republic of Tanzania, Togo, Uruguay, and West Bank and Gaza. Integration of 2012 data with (the few) 2011 data made it possible to expand the coverage of the sample without affecting overall consistency or accuracy, as stock data are only marginally sensitive to yearly changes.
Recipients
a. One-sided inward
Non-
OFCs
SPEs
Non-OFCs SPEs
Tax
have
ns
Taxhavens
Inve
stor
s
Figure 2. The Offshore Investment Matrix
= 100%
Recipients
b. One-sided outward
Non-
OFCs
SPEs
Non-OFCs SPEs
Tax
have
ns
Taxhavens
Inve
stor
s
= 100%
c. Two-sided
Non-
OFCs
SPEs
Non-OFCs SPEs
Tax
have
ns
Taxhavens
= 100%
Conduit role
Poten
tial a
rea of
“dou
ble-co
untin
g”
Recipients
Inve
stor
s
Source: UNCTAD.
Figure 2. The Offshore Investment Matrix (concluded)
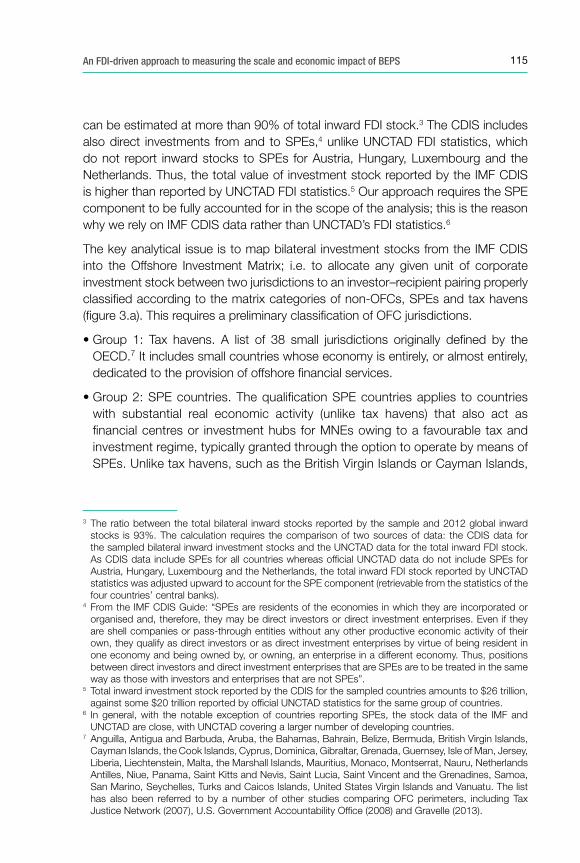
115An FDI-driven approach to measuring the scale and economic impact of BEPS
can be estimated at more than 90% of total inward FDI stock.3 The CDIS includes also direct investments from and to SPEs,4 unlike UNCTAD FDI statistics, which do not report inward stocks to SPEs for Austria, Hungary, Luxembourg and the Netherlands. Thus, the total value of investment stock reported by the IMF CDIS is higher than reported by UNCTAD FDI statistics.5 Our approach requires the SPE component to be fully accounted for in the scope of the analysis; this is the reason why we rely on IMF CDIS data rather than UNCTAD’s FDI statistics.6
The key analytical issue is to map bilateral investment stocks from the IMF CDIS into the Offshore Investment Matrix; i.e. to allocate any given unit of corporate investment stock between two jurisdictions to an investor–recipient pairing properly classified according to the matrix categories of non-OFCs, SPEs and tax havens (figure 3.a). This requires a preliminary classification of OFC jurisdictions.
• Group 1: Tax havens. A list of 38 small jurisdictions originally defined by the OECD.7 It includes small countries whose economy is entirely, or almost entirely, dedicated to the provision of offshore financial services.
• Group 2: SPE countries. The qualification SPE countries applies to countries with substantial real economic activity (unlike tax havens) that also act as financial centres or investment hubs for MNEs owing to a favourable tax and investment regime, typically granted through the option to operate by means of SPEs. Unlike tax havens, such as the British Virgin Islands or Cayman Islands,
3 The ratio between the total bilateral inward stocks reported by the sample and 2012 global inward stocks is 93%. The calculation requires the comparison of two sources of data: the CDIS data for the sampled bilateral inward investment stocks and the UNCTAD data for the total inward FDI stock. As CDIS data include SPEs for all countries whereas official UNCTAD data do not include SPEs for Austria, Hungary, Luxembourg and the Netherlands, the total inward FDI stock reported by UNCTAD statistics was adjusted upward to account for the SPE component (retrievable from the statistics of the four countries’ central banks).
4 From the IMF CDIS Guide: “SPEs are residents of the economies in which they are incorporated or organised and, therefore, they may be direct investors or direct investment enterprises. Even if they are shell companies or pass-through entities without any other productive economic activity of their own, they qualify as direct investors or as direct investment enterprises by virtue of being resident in one economy and being owned by, or owning, an enterprise in a different economy. Thus, positions between direct investors and direct investment enterprises that are SPEs are to be treated in the same way as those with investors and enterprises that are not SPEs”.
5 Total inward investment stock reported by the CDIS for the sampled countries amounts to $26 trillion, against some $20 trillion reported by official UNCTAD statistics for the same group of countries.
6 In general, with the notable exception of countries reporting SPEs, the stock data of the IMF and UNCTAD are close, with UNCTAD covering a larger number of developing countries.
7 Anguilla, Antigua and Barbuda, Aruba, the Bahamas, Bahrain, Belize, Bermuda, British Virgin Islands, Cayman Islands, the Cook Islands, Cyprus, Dominica, Gibraltar, Grenada, Guernsey, Isle of Man, Jersey, Liberia, Liechtenstein, Malta, the Marshall Islands, Mauritius, Monaco, Montserrat, Nauru, Netherlands Antilles, Niue, Panama, Saint Kitts and Nevis, Saint Lucia, Saint Vincent and the Grenadines, Samoa, San Marino, Seychelles, Turks and Caicos Islands, United States Virgin Islands and Vanuatu. The list has also been referred to by a number of other studies comparing OFC perimeters, including Tax Justice Network (2007), U.S. Government Accountability Office (2008) and Gravelle (2013).
116 TRANSNATIONAL CORPORATIONS Volume 25, 2018, Number 2
the scoping of SPE countries and the assessment of their offshore component are more controversial. In order to minimize arbitrary classification, our baseline approach is conservative and limits the scope of this group to self-declared SPE countries, a limited set of jurisdictions that (at the time of the analysis) explicitly report the share of inward and outward investment into and from their SPEs. The group includes Austria, Hungary, Luxembourg and the Netherlands. The number of jurisdictions publishing SPE investment data is increasing rapidly as more countries are aligning to the OECD BD4 and IMF BPM6 reporting standards. However, the countries used here have a long record of publishing SPE data and account for the bulk of global SPE stock (especially the Netherlands and Luxembourg).
If the investor or recipient from the bilateral data is a country in the scope of the SPE countries (Austria, Hungary, Luxembourg and the Netherlands), only a given share of the stock is allocated to an investor or recipient classified as SPEs, while the remaining part is allocated to an investor or recipient classified as non-OFCs. This seems reasonable as SPE countries are sizable economies with significant real economic activity, and therefore the treatment of their entire investment as offshore or conduit investment (as in other studies)8 would lead to an overstatement in the estimation of the offshore component. The shares of the SPE component depend on the country and the investment direction (inward or outward) and are derived immediately using the share of investment stock to and from SPEs in total inward and outward investment stock as reported by national central banks. When non-SPE countries (tax havens and non-OFCs) are involved, the procedure is more straightforward as 100% of the FDI stock is allocated to the corresponding category in the matrix (figure 3.b).
8 See, for example, ActionAid (2013) and Christian Aid (2013).
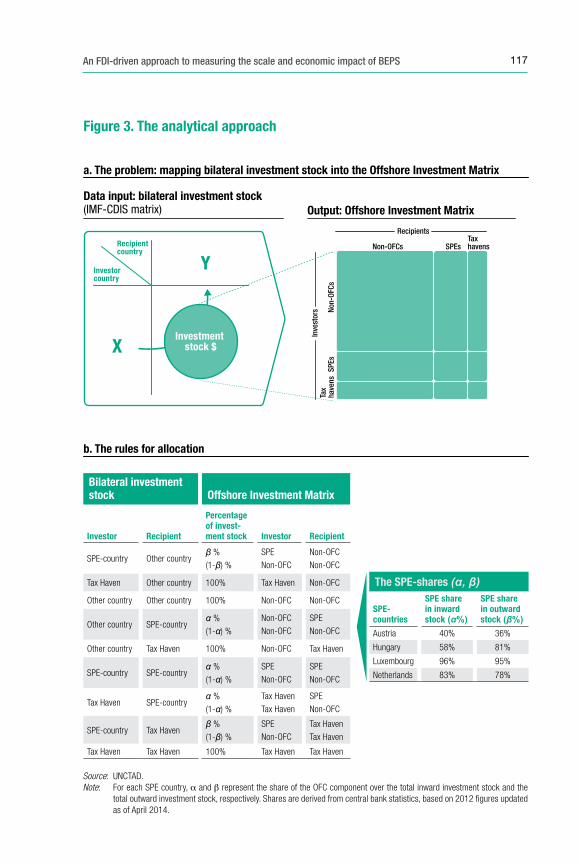
117An FDI-driven approach to measuring the scale and economic impact of BEPS
Output: Offshore Investment Matrix
Figure 3. The analytical approach
Non-
OFCs
SPEs
Non-OFCs SPEs
Tax
have
ns
Taxhavens
Recipients
Inve
stor
s
Data input: bilateral investment stock (IMF-CDIS matrix)
b. The rules for allocation
a. The problem: mapping bilateral investment stock into the Offshore Investment Matrix
Recipientcountry
Investorcountry
X
Y
Investment stock $
Source: UNCTAD.Note: For each SPE country, α and β represent the share of the OFC component over the total inward investment stock and the
total outward investment stock, respectively. Shares are derived from central bank statistics, based on 2012 figures updated as of April 2014.
Bilateral investment stock Offshore Investment Matrix
Investor Recipient
Percentage of invest-ment stock Investor Recipient
SPE-country Other countryβ %
(1-β) %
SPE
Non-OFC
Non-OFC
Non-OFC
Tax Haven Other country 100% Tax Haven Non-OFC
Other country Other country 100% Non-OFC Non-OFC
Other country SPE-countryα %
(1-α) %
Non-OFC
Non-OFC
SPE
Non-OFC
Other country Tax Haven 100% Non-OFC Tax Haven
SPE-country SPE-countryα %
(1-α) %
SPE
Non-OFC
SPE
Non-OFC
Tax Haven SPE-countryα %
(1-α) %
Tax Haven
Tax Haven
SPE
Non-OFC
SPE-country Tax Havenβ %
(1-β) %
SPE
Non-OFC
Tax Haven
Tax Haven
Tax Haven Tax Haven 100% Tax Haven Tax Haven
The SPE-shares (α, β)
SPE-countries
SPE share in inward stock (α%)
SPE share in outward stock (β%)
Austria 40% 36%
Hungary 58% 81%
Luxembourg 96% 95%
Netherlands 83% 78%
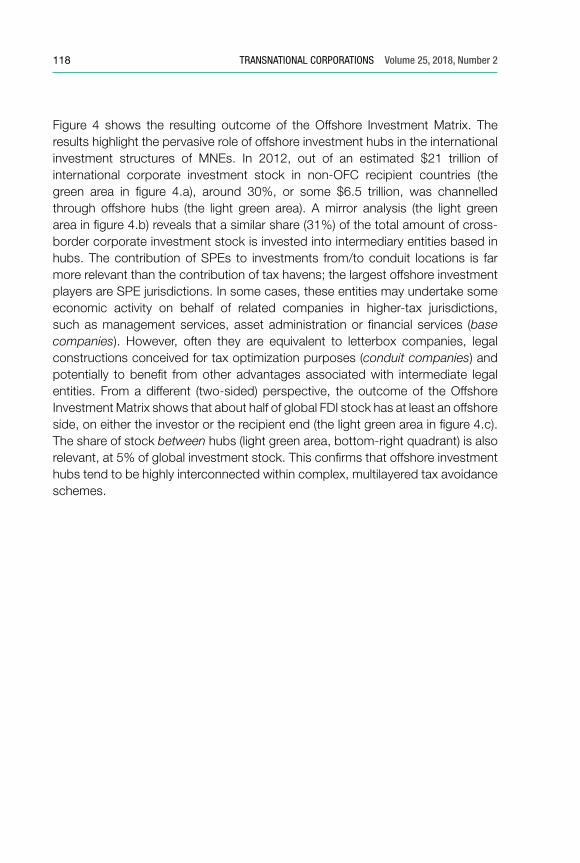
118 TRANSNATIONAL CORPORATIONS Volume 25, 2018, Number 2
Figure 4 shows the resulting outcome of the Offshore Investment Matrix. The results highlight the pervasive role of offshore investment hubs in the international investment structures of MNEs. In 2012, out of an estimated $21 trillion of international corporate investment stock in non-OFC recipient countries (the green area in figure 4.a), around 30%, or some $6.5 trillion, was channelled through offshore hubs (the light green area). A mirror analysis (the light green area in figure 4.b) reveals that a similar share (31%) of the total amount of cross-border corporate investment stock is invested into intermediary entities based in hubs. The contribution of SPEs to investments from/to conduit locations is far more relevant than the contribution of tax havens; the largest offshore investment players are SPE jurisdictions. In some cases, these entities may undertake some economic activity on behalf of related companies in higher-tax jurisdictions, such as management services, asset administration or financial services (base companies). However, often they are equivalent to letterbox companies, legal constructions conceived for tax optimization purposes (conduit companies) and potentially to benefit from other advantages associated with intermediate legal entities. From a different (two-sided) perspective, the outcome of the Offshore Investment Matrix shows that about half of global FDI stock has at least an offshore side, on either the investor or the recipient end (the light green area in figure 4.c). The share of stock between hubs (light green area, bottom-right quadrant) is also relevant, at 5% of global investment stock. This confirms that offshore investment hubs tend to be highly interconnected within complex, multilayered tax avoidance schemes.
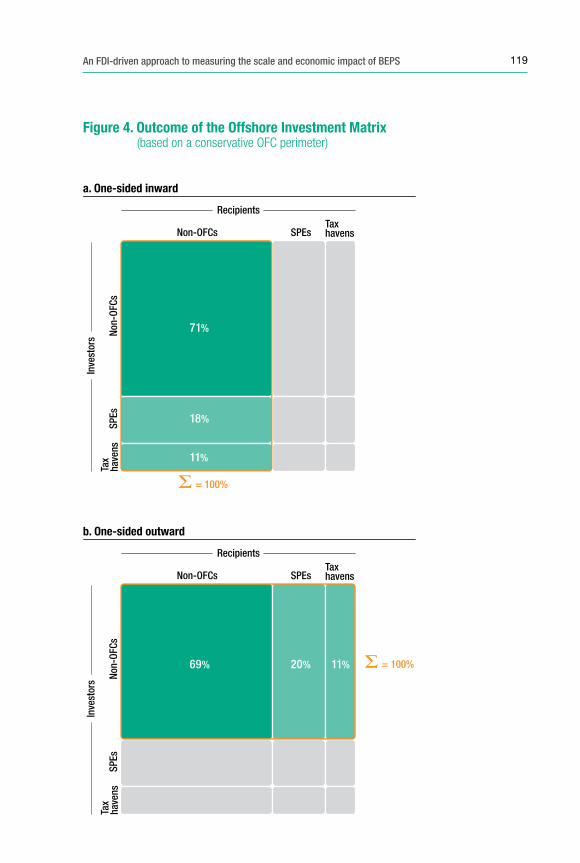
119An FDI-driven approach to measuring the scale and economic impact of BEPS
Recipients
a. One-sided inward
Non-
OFCs
SPEs
Non-OFCs SPEs
Tax
have
ns
Taxhavens
Inve
stor
s
Figure 4. Outcome of the Offshore Investment Matrix (based on a conservative OFC perimeter)
= 100%
Recipients
b. One-sided outward
Non-
OFCs
SPEs
Non-OFCs SPEs
Tax
have
ns
Taxhavens
Inve
stor
s
= 100%
c. Two-sided
Non-
OFCs
SPEs
Non-OFCs SPEs
Tax
have
ns
Taxhavens
= 100%
71%
69% 20% 11%
51% 15% 8%
13% 3% 1%
8% 1% 0%
18%
11%
Recipients
Inve
stor
s
Recipients
a. One-sided inward
Non-
OFCs
SPEs
Non-OFCs SPEs
Tax
have
ns
Taxhavens
Inve
stor
s
Figure 4. Outcome of the Offshore Investment Matrix (based on a conservative OFC perimeter)
= 100%
Recipients
b. One-sided outward
Non-
OFCs
SPEs
Non-OFCs SPEs
Tax
have
ns
Taxhavens
Inve
stor
s
= 100%
c. Two-sided
Non-
OFCs
SPEs
Non-OFCs SPEs
Tax
have
ns
Taxhavens
= 100%
71%
69% 20% 11%
51% 15% 8%
13% 3% 1%
8% 1% 0%
18%
11%
Recipients
Inve
stor
s
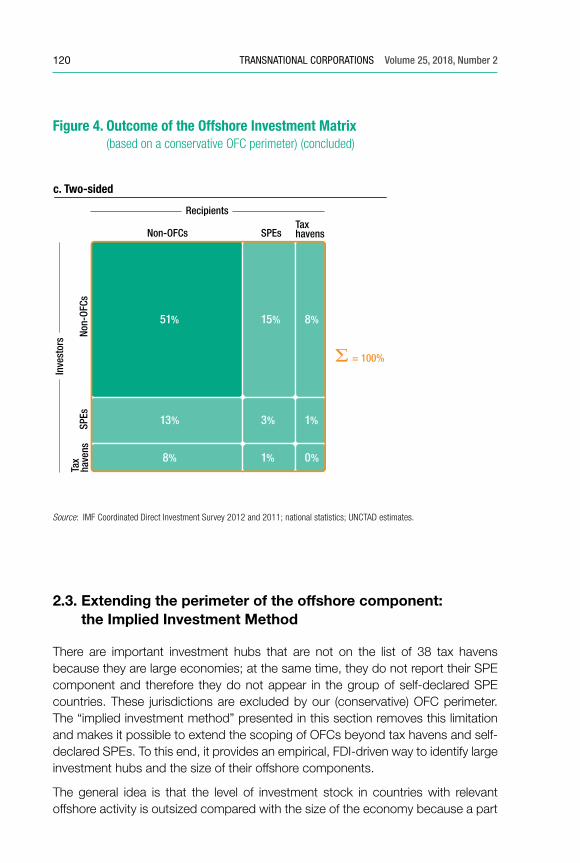
120 TRANSNATIONAL CORPORATIONS Volume 25, 2018, Number 2
2.3. Extending the perimeter of the offshore component: the Implied Investment Method
There are important investment hubs that are not on the list of 38 tax havens because they are large economies; at the same time, they do not report their SPE component and therefore they do not appear in the group of self-declared SPE countries. These jurisdictions are excluded by our (conservative) OFC perimeter. The “implied investment method” presented in this section removes this limitation and makes it possible to extend the scoping of OFCs beyond tax havens and self-declared SPEs. To this end, it provides an empirical, FDI-driven way to identify large investment hubs and the size of their offshore components.
The general idea is that the level of investment stock in countries with relevant offshore activity is outsized compared with the size of the economy because a part
Source: IMF Coordinated Direct Investment Survey 2012 and 2011; national statistics; UNCTAD estimates.
Figure 4. Outcome of the Offshore Investment Matrix (based on a conservative OFC perimeter) (concluded)
Recipients
a. One-sided inward
Non-
OFCs
SPEs
Non-OFCs SPEs
Tax
have
ns
Taxhavens
Inve
stor
s
Figure 4. Outcome of the Offshore Investment Matrix (based on a conservative OFC perimeter)
= 100%
Recipients
b. One-sided outward
Non-
OFCs
SPEs
Non-OFCs SPEs
Tax
have
ns
Taxhavens
Inve
stor
s
= 100%
c. Two-sided
Non-
OFCs
SPEs
Non-OFCs SPEs
Tax
have
ns
Taxhavens
= 100%
71%
69% 20% 11%
51% 15% 8%
13% 3% 1%
8% 1% 0%
18%
11%
Recipients
Inve
stor
s
121An FDI-driven approach to measuring the scale and economic impact of BEPS
of that stock is routed through SPEs as transit investment and driven by financial rather than real operational considerations.
a. Identification of major offshore investment hubs
The goal is to identify countries acting as global offshore investment hubs with exceptionally large inward and outward investment (transit investment). This method is not designed to collect a comprehensive list of jurisdictions offering favourable offshore services to MNEs (many countries do so to some extent); instead, it focuses on those that have been particularly successful in becoming major global investment hubs. This identification can be established on the basis of two conditions:
i. They host a relevant amount of FDI stock (including SPEs); and
ii. The amount of inward FDI stock is disproportionately high compared with the size of the economy, as measured by GDP.
The first dimension ensures the relevance of the group from an FDI perspective; the second signals the presence of significant offshore financial activity (beyond real investment operations). Clearly, the actual perimeter of this set depends on how the two conditions are translated into selection criteria. A large number of countries have a certain degree of offshore activity; adopting a more or less restrictive perimeter is a methodological and analytical decision.
Notice that the four countries in the group of self-declared SPE countries also rank high according to conditions (i) and (ii). In particular, the Netherlands and Luxembourg rank first and third globally in terms of inward FDI stock and (respectively) third and first in terms of the ratio of inward FDI stock to GDP.
b. Sizing of the offshore component
The idea is to first estimate an expected amount of international corporate investment stock as implied by the size of the economy (measured by GDP), and then, by difference, the SPE component, i.e. the residual investment not explained by real economic drivers.
Figure 5 illustrates the procedure for the inward side (i.e. estimation of the share of SPEs in the inward corporate stock) and compares the SPE estimate against actual data for the four countries for which SPE information is available from official statistics. As desired, the estimated outsized portion of the investment stock that is not explained by the size of the economy is largely captured by the reported SPE component. An identical procedure can be applied to the outward side (estimation of the share of SPEs in the outward corporate stock) with similar results.
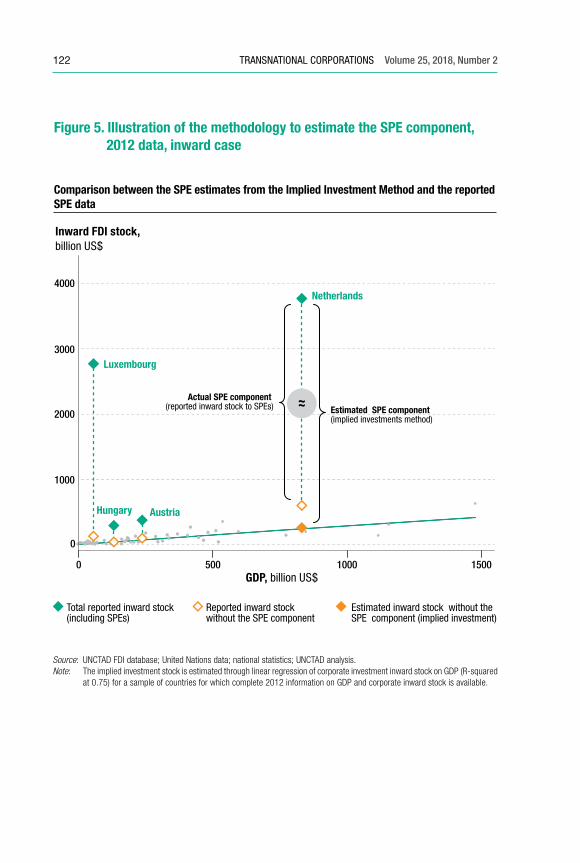
122 TRANSNATIONAL CORPORATIONS Volume 25, 2018, Number 2
Figure 5. Illustration of the methodology to estimate the SPE component, 2012 data, inward case
0
0 500 1000 1500
1000
2000
3000
4000
Inward FDI stock,billion US$
GDP, billion US$
Luxembourg
Hungary Austria
Netherlands
Actual SPE component (reported inward stock to SPEs) Estimated SPE component
(implied investments method)
Comparison between the SPE estimates from the Implied Investment Method and the reported SPE data
Total reported inward stock(including SPEs)
Reported inward stockwithout the SPE component
Estimated inward stock without the SPE component (implied investment)
Source: UNCTAD FDI database; United Nations data; national statistics; UNCTAD analysis.Note: The implied investment stock is estimated through linear regression of corporate investment inward stock on GDP (R-squared
at 0.75) for a sample of countries for which complete 2012 information on GDP and corporate inward stock is available.
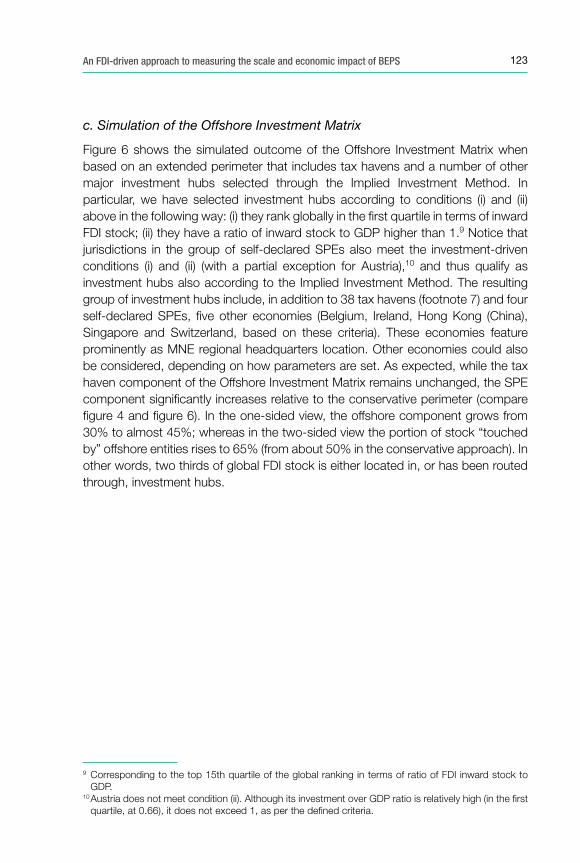
123An FDI-driven approach to measuring the scale and economic impact of BEPS
c. Simulation of the Offshore Investment Matrix
Figure 6 shows the simulated outcome of the Offshore Investment Matrix when based on an extended perimeter that includes tax havens and a number of other major investment hubs selected through the Implied Investment Method. In particular, we have selected investment hubs according to conditions (i) and (ii) above in the following way: (i) they rank globally in the first quartile in terms of inward FDI stock; (ii) they have a ratio of inward stock to GDP higher than 1.9 Notice that jurisdictions in the group of self-declared SPEs also meet the investment-driven conditions (i) and (ii) (with a partial exception for Austria),10 and thus qualify as investment hubs also according to the Implied Investment Method. The resulting group of investment hubs include, in addition to 38 tax havens (footnote 7) and four self-declared SPEs, five other economies (Belgium, Ireland, Hong Kong (China), Singapore and Switzerland, based on these criteria). These economies feature prominently as MNE regional headquarters location. Other economies could also be considered, depending on how parameters are set. As expected, while the tax haven component of the Offshore Investment Matrix remains unchanged, the SPE component significantly increases relative to the conservative perimeter (compare figure 4 and figure 6). In the one-sided view, the offshore component grows from 30% to almost 45%; whereas in the two-sided view the portion of stock “touched by” offshore entities rises to 65% (from about 50% in the conservative approach). In other words, two thirds of global FDI stock is either located in, or has been routed through, investment hubs.
9 Corresponding to the top 15th quartile of the global ranking in terms of ratio of FDI inward stock to GDP.
10 Austria does not meet condition (ii). Although its investment over GDP ratio is relatively high (in the first quartile, at 0.66), it does not exceed 1, as per the defined criteria.
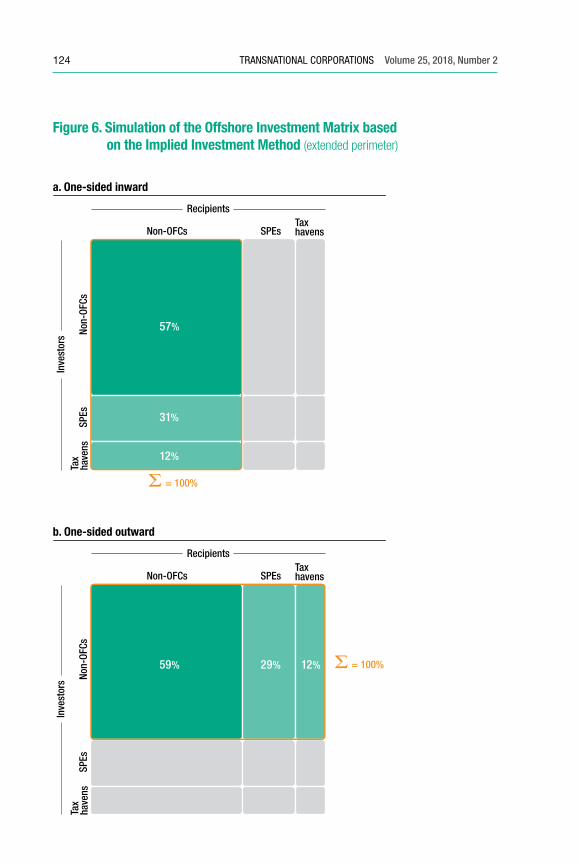
124 TRANSNATIONAL CORPORATIONS Volume 25, 2018, Number 2
Recipients
a. One-sided inward
Non-
OFCs
SPEs
Non-OFCs SPEs
Tax
have
ns
Taxhavens
Inve
stor
s
Figure 6. Simulation of the Offshore Investment Matrix based on the Implied Investment Method (extended perimeter)
= 100%
Recipients
b. One-sided outward
Non-
OFCs
SPEs
Non-OFCs SPEs
Tax
have
ns
Taxhavens
Inve
stor
s
= 100%
c. Two-sided
Non-
OFCs
SPEs
Non-OFCs SPEs
Tax
have
ns
Taxhavens
= 100%
57%
59% 29% 12%
35% 17% 7%
19% 9% 3%
7% 3% 0%
31%
12%
Recipients
Inve
stor
s
Recipients
a. One-sided inward
Non-
OFCs
SPEs
Non-OFCs SPEs
Tax
have
ns
Taxhavens
Inve
stor
s
Figure 6. Simulation of the Offshore Investment Matrix based on the implied investment method (extended perimeter)
= 100%
Recipients
b. One-sided outward
Non-
OFCs
SPEs
Non-OFCs SPEs
Tax
have
ns
Taxhavens
Inve
stor
s
= 100%
c. Two-sided
Non-
OFCs
SPEs
Non-OFCs SPEs
Tax
have
ns
Taxhavens
= 100%
57%
59% 29% 12%
35% 17% 7%
19% 9% 3%
7% 3% 0%
31%
12%
Recipients
Inve
stor
s
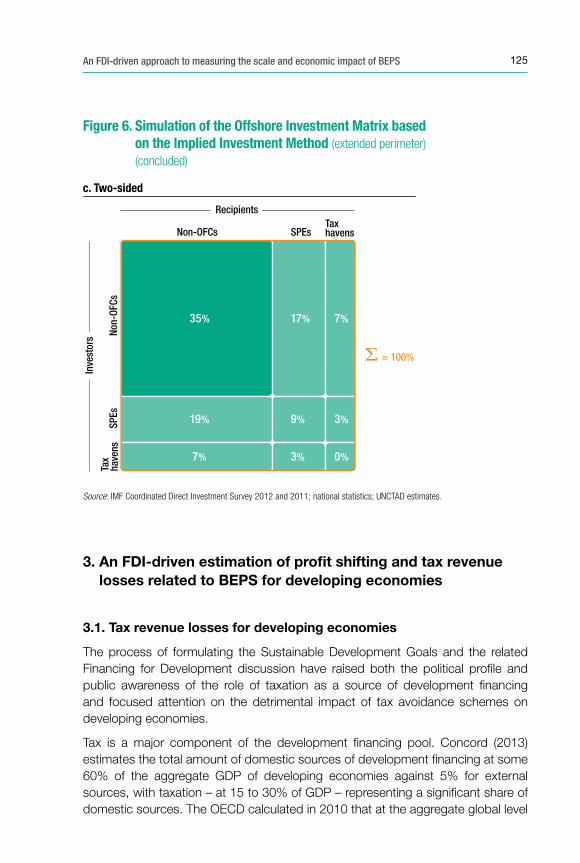
125An FDI-driven approach to measuring the scale and economic impact of BEPS
3. An FDI-driven estimation of profit shifting and tax revenue losses related to BEPS for developing economies
3.1. Tax revenue losses for developing economies
The process of formulating the Sustainable Development Goals and the related Financing for Development discussion have raised both the political profile and public awareness of the role of taxation as a source of development financing and focused attention on the detrimental impact of tax avoidance schemes on developing economies.
Tax is a major component of the development financing pool. Concord (2013) estimates the total amount of domestic sources of development financing at some 60% of the aggregate GDP of developing economies against 5% for external sources, with taxation – at 15 to 30% of GDP – representing a significant share of domestic sources. The OECD calculated in 2010 that at the aggregate global level
Figure 6. Simulation of the Offshore Investment Matrix based on the Implied Investment Method (extended perimeter) (concluded)
Source: IMF Coordinated Direct Investment Survey 2012 and 2011; national statistics; UNCTAD estimates.
Recipients
a. One-sided inward
Non-
OFCs
SPEs
Non-OFCs SPEs
Tax
have
ns
Taxhavens
Inve
stor
s
Figure 6. Simulation of the Offshore Investment Matrix based on the implied investment method (extended perimeter)
= 100%
Recipients
b. One-sided outward
Non-
OFCs
SPEs
Non-OFCs SPEs
Tax
have
ns
Taxhavens
Inve
stor
s
= 100%
c. Two-sided
Non-
OFCs
SPEs
Non-OFCs SPEs
Tax
have
ns
Taxhavens
= 100%
57%
59% 29% 12%
35% 17% 7%
19% 9% 3%
7% 3% 0%
31%
12%
Recipients
Inve
stor
s
126 TRANSNATIONAL CORPORATIONS Volume 25, 2018, Number 2
up to half of annual additional resources needed to achieve the (first six) Millennium Development Goals (MDGs) could be recovered just by improving tax revenue collection in developing economies (Atisophon et al., 2011). The situation will be similar for the SDGs.
The concerns of development organizations and NGOs related to BEPS practices in developing countries centre on two issues: (i) developing economies are less equipped than developed economies to counter corporate tax avoidance, so therefore their exposure may be greater; and (ii) the impact in terms of resource losses for developing economies is significant, especially against the background of the scarcity of available local resources and the development financing gap.
The FDI-based analytical toolkit presented in this section provides a methodology to estimate the tax revenue losses for developing economies related to MNEs’ tax avoidance schemes. The distinctive feature and to some extent also the limitation of the approach is to focus specifically on the role and the impact of FDI from offshore hubs into developing economies. It is important to point out that a direct investment link to an offshore hub is not a prerequisite for profit shifting. However, such links enable some important forms of profit shifting, and they are usually part of the tax planning strategy of MNEs (see the more extensive discussion in WIR15, chapter V and its annex II).
The quantification of profit shifting and related revenue losses is a challenging exercise. First, tax avoidance options can be numerous. MNEs employ highly sophisticated and creative combinations of individual tax avoidance levers. Second, by the nature of the phenomenon, the available data and information are limited. In particular the profits shifted to offshore locations are difficult to track as they typically do not appear in any official reporting: not, obviously, in the financial reporting of the foreign affiliates where the value is generated and not in that of the foreign affiliates where it is shifted, owing to often lax reporting requirements.
Empirical literature on corporate profit shifting relates broadly to two main research streams.
One, older and more established, investigates the phenomenon of profit shifting by MNEs per se. It addresses such questions as, Do MNEs shift profits for tax purposes? What are the main profit-shifting strategies? The major contribution of these studies has been to provide solid empirical evidence of the occurrence of profit shifting, mainly by showing how tax rate differentials across jurisdictions affect the distribution of pre-tax profit within multinational groups. Examples of this literature include Hines Jr. and Rice (1994), Huizinga and Laeven (2008), Dharmapala and Riedel (2013) and, more recently, Johannesen et al. (2017). An exhaustive literature review in this area appears in Dharmapala (2014).
This study instead belongs to the second main research stream, which attempts
127An FDI-driven approach to measuring the scale and economic impact of BEPS
to estimate the effects of profit shifting on the economic environment and on the development prospects of countries. Key questions here are, for example, what is the total amount of profit shifting taking place at the global level due to MNEs’ tax avoidance? And, more importantly, what does this imply in terms of lost tax revenues for governments, at the global level or for groups of countries (e.g. developing countries)? In this context, analytical efforts focus on sizing the phenomenon or, using a terminology that has become quite common in this area, on identifying the “big number”, i.e. an order of magnitude that realistically represents the value at stake. This is an exceptionally challenging exercise, both for empirical reasons (the availability of key information on MNEs’ international activities is poor) and methodological ones (e.g. the lack of any realistic counterfactuals).11 Yet, analytical efforts to estimate revenues losses have seen a remarkable acceleration in the last three years.
Until 2015, attempts to estimate tax revenue losses on a global scale have been confined to some pioneering efforts, with limited analytical ground (for example, Oxfam, 2000, and ChristianAid 2008 and 2009; for a review, see also Fuest and Riedel, 2009 and 2010). Since then, a new generation of empirical studies on global profit shifting and revenue losses has been thriving (UNCTAD, 2015b; Crivelli et al., 2016; OECD, 2015; Clausing, 2016; Cobham and Janský, 2017; Cobham and Janský, 2018a; Janský and Palanský, 2018; Tørsløv et al., 2018), significantly pushing the exploration of available data and techniques. Not only have these studies expanded the range of analytic options, but they have also contributed to create some consensus on the orders of magnitude involved.
Interestingly, the initial impetus to this generation of estimates came from three independent but almost simultaneous studies by international organizations at the forefront of the research and policy debate on MNEs’ international taxation: UNCTAD (2015a; 2015b), the IMF’s Crivelli et al. (2015; 2016) and OECD (2015).12 These studies, by means of completely different analytical strategies, have proposed alternative, yet somehow comparable, estimates of tax revenue
11 Namely, what the tax base would be in the absence of profit shifting.12 The UNCTAD analysis was published as a working paper for review and feedback in March 2015
(UNCTAD, 2015a) and then in final form in June 2015 as part of the World Investment Report 2015 (UNCTAD, 2015b). IMF’s work from Crivelli et al. first appeared as an IMF Working Paper in May 2015 (Crivelli et al., 2015), before publication in a refereed journal in 2016 (Crivelli et al., 2016). Finally, the OECD analysis was published in October 2015 as part of the BEPS Action 11 Report (OECD, 2015).
128 TRANSNATIONAL CORPORATIONS Volume 25, 2018, Number 2
losses.13 It is generally acknowledged that these results, while necessarily relying on some strong assumptions and thus being far from perfect, have marked a methodological step-change and have contributed critically to stimulating further research developments.
Subsequent research work has further added to the credibility of this research avenue by validating some of the original approaches. Cobham and Janský (2018a) have tested for robustness and refined IMF methodology, including country-level estimates; Janský and Polanský (2018) have done a similar exercise for the UNCTAD approach. Research momentum has led to other relevant contributions, notably Clausing (2016), Cobham and Janský (2017), and Tørsløv et al. (2018), developing alternative yet related approaches to the estimation of revenue losses. The availability of several techniques and estimates has heated up the academic and policy debate on the big numbers and motivated a number of critical reviews of the different methodologies (OECD, 2015 and Bradbury et al., 2018;14 Cobham and Janský, 2018b). We refer to these excellent overviews for detailed descriptions and comparisons of the methodologies.
3.2. UNCTAD approach: relationship between offshore FDI and investment profitability
The UNCTAD methodology for the estimation of profit shifting and tax revenue losses builds on the assumption of a negative relationship at country level between the share of inward investment stock from offshore hubs (hereafter “offshore indicator”) and the rate of return on the total inward FDI stock (hereafter “rate of return”). The rationale underlying this assumption is that the income generated by foreign direct investments from offshore investment hubs is subject to a greater extent to profit-shifting practices with the effect of “artificially” deflating the rate of return. Figure 7 illustrates the argument.
13 The UNCTAD analysis employs statistics on FDI from countries’ BoP as the main data source (full methodological details are provided in the rest of this paper). Estimates of revenue losses at about $100 billion for developing countries and $200 billion globally target specifically BEPS practices enabled by FDI through OFCs (to be regarded as a lower bound). The IMF approach in Crivelli et al. (2016) also uses macroeconomic variables, but not from the BoP. Their main source is country data on (corporate income) tax revenues and statutory tax rates. The sizing of the BEPS impact is based on the response of countries’ tax bases to the average tax rate of countries classified as tax havens. Short-term revenue effects are estimated at $120 billion globally, and long-term effects at $600 billion ($200 billion for non-OECD countries). Unlike the UNCTAD and IMF approaches (which relied on macroeconomic statistics), the OECD approach leverages firm-level data from ORBIS. The analysis provides a range for estimates of tax revenue losses between $100 billion and $240 billion globally, as a combined effect of profit shifting due to tax rate differentials on the one side and mismatches between tax system and preferential treatment on the other.
14 Published in this volume.

129An FDI-driven approach to measuring the scale and economic impact of BEPS
Figu
re 7
. Illu
stra
tion
of th
e re
latio
nshi
p be
twee
n th
e sh
are
of in
war
d in
vest
men
t fro
m o
ffsho
re in
vest
men
t hub
s an
d
rate
of r
etur
n on
inw
ard
inve
stm
ent
0.15 0.
1
0.05 0
0.1
0.2
0.3
0.4
0.5
0.6
Offs
hore
indi
cato
r
Rate
of r
etur
n
High
er e
xpos
ure
toof
fsho
re in
vest
men
t hub
s
1%
10%
Low
er ra
te o
f re
turn
on
FDI s
tock
Sour
ce:
UNCT
AD a
naly
sis
base
d on
dat
a fro
m th
e IM
F Ba
lanc
e of
Pay
men
ts D
atab
ase
and
IMF
Coor
dina
ted
Dire
ct In
vest
men
t Sur
vey.
Note
: Sc
atte
rplo
t rep
rese
ntin
g th
e re
latio
nshi
p be
twee
n of
fsho
re h
ub e
xpos
ure
(offs
hore
indi
cato
r) an
d ra
te o
f ret
urn
on in
vest
men
t sto
ck (r
ate
of re
turn
) for
dev
elop
ing
coun
tries
. “Co
nser
vativ
e” c
ase
with
be
ta c
oeffi
cien
t at –
10%
. The
fitte
d lin
e is
mer
ely
illus
trativ
e an
d do
es n
ot re
flect
the
econ
omet
ric m
odel
ling
behi
nd th
e es
timat
ion
of th
e be
ta c
oeffi
cien
t (th
e ec
onom
etric
s re
ly o
n a
larg
er s
ampl
e of
da
ta p
oint
s, in
clud
ing
four
yea
rs, a
nd a
ccou
nts
for r
egio
nal fi
xed
effe
cts
and
time
fixed
effe
cts;
for d
etai
ls, s
ee s
ectio
n 3.
3).
130 TRANSNATIONAL CORPORATIONS Volume 25, 2018, Number 2
Formally, the target relationship is analyzed through econometric modeling of country-level data, with the rate of return as the dependent variable and the offshore indicator as the explanatory variable (see details in next section). The offshore indicator is derived as a straightforward application at the country level of the Offshore Investment Matrix illustrated in the previous section.
Once a significant relationship is established between the offshore indicator and the rate of return, then the tax revenue losses can be calculated through appropriate assumptions on the profitability gap (how much FDI income is missing due to investments from offshore hubs) and on the average corporate tax rate.
It is important to stress that the estimated profit shifting and tax revenue losses are mostly confined to those associated with tax avoidance schemes that require a direct investment relationship. Financing schemes (e.g. archetype 2 in WIR15; page 196) are an important example but other schemes also rely on FDI links to offshore hubs, including for example the well-known Double Irish-Dutch Sandwich (archetype 1 in WIR15; page 194). Hence, financing schemes do not account for the entirety of the estimated revenue loss.
3.3. Regression analysis
The relationship between the offshore indicator and the rate of return is subject to econometric estimation. The reference model is a standard linear regression model (ordinary least squares, OLS) with time and region15 fixed effects:
yi,t = α + βxi,t + δt + θk + εi,t
where x denotes the offshore indicator and y the rate of return; each data point (x, y) is recorded for a number of countries (indexed by i from 1 to N = 72), across four years (indexed by t) from 2009 to 2012; δ (indexed by t) represent the time fixed effect and θ (indexed by k from 1 to 7) represents the regional fixed effects.16
15 The following United Nations regional classifications are used: Africa, Asia, Europe, Latin America and the Caribbean, North America, Oceania, and South-East Europe and the Commonwealth of Independent States.
16 More formally, denoting by I{A} the indicator function that equals 1 if the event A realizes and 0 otherwise, the two variables δ and θ representing the fixed-effect components can be defined in the regression equation as follows:
where the event realizes if country i belongs to region .
131An FDI-driven approach to measuring the scale and economic impact of BEPS
For each country, the offshore indicator is calculated through a straightforward application of the methodology of the Offshore Investment Matrix (one-sided inward analysis). To capture the full impact of exposure to offshore hubs on investment profitability, and to ensure greater statistical validity of the relationship between offshore investment links and rates of return on investment, the econometrics are based on the extended perimeter, including tax havens, countries reporting SPEs and other important investment hubs (selected and analytically treated as explained in section 2.3). Thus, the perimeter and resulting Offshore Investment Matrix are the same as the simulation in figure 6.
The size of the sample is subject to data availability on bilateral FDI inward stock (needed to calculate the offshore indicator) and the FDI income (to calculate the rate of return). Consistently with the approach employed throughout the study, the reference source of bilateral FDI stock is the IMF CDIS database, recording bilateral investment stocks for a sample of about 100 recipient countries from 2009 to 2012. The data on the FDI income, including the further split between equity and debt components, is retrieved from balance-of-payments data as reported by the IMF BoP (current account, primary income on direct investment, debit side). Finally, the data on the FDI inward stock employed (at the denominator) in the calculation of the rate of return on FDI are from the UNCTAD FDI database.17
Since the goal of the analysis is to quantify the losses related to investment from offshore hubs, the sample includes only non-OFCs, i.e. jurisdictions that do not qualify as tax havens or SPE jurisdictions. Exploratory univariate data analysis led to the identification of nine outliers18 displaying extreme values of one variable (either the offshore indicator or the rate of return), consistently across the four years.19 The selection of the outliers is still robust with respect to a (bivariate) test heuristic based on the 95% confidence ellipses. The resulting sample consists of an unbalanced panel of 72 countries, including 27 developed economies, 34 developing economies and 11 transition economies, covering the years from 2009 to 2012 (53 countries report information for all four years).
17 All figures are those reported at the time of the analysis and do not necessarily correspond to currently reported data. The latest download of the data from IMF CDIS for the calculation of the offshore indicator was in April 2014; the latest download of the data from the IMF BoP database (FDI income) and the UNCTAD FDI database (inward FDI stock) for the calculation of the rate of return was in November 2014.
18 The countries not considered in the econometric analysis include Azerbaijan, Botswana, China, Iceland, Kazakhstan, Macao (China), Nigeria and the Russian Federation. Bhutan was also excluded for very anomalous values of rate of return.
19 A closer look at the outliers highlights the specificity of the selected countries. Outliers with a high value of the offshore indicator are characterized by special investment relations with particular offshore hubs, often in their region. In many cases these relations entail FDI round-tripping, with an impact on the source country potentially very different from the general (trans-shipping) case. The second group of outliers, characterized by an unusually high rate of return, includes countries with an investment profile heavily biased toward natural resources.
132 TRANSNATIONAL CORPORATIONS Volume 25, 2018, Number 2
The response of the rate of return on FDI to the offshore indicator is analyzed using three formulations of the dependent variable.
Model 1. A standard formulation of the rate of return on FDI as the ratio of total FDI income (income on equity and interests on debt) over FDI inward stock.
Model 2 and model 3. Two more granular formulations addressing separately the effects on the equity component and on the debt component of the FDI income. In this version, the dependent variables become, respectively, the ratio of the equity income to total FDI stock (hereafter Rate of Return_equity; model 2) and the ratio of debt income (interest payments) to total FDI stock (hereafter Rate of Return_debt; model 3).20
Performing separate analysis for the equity and the debt component has some advantages. Primarily, profit-shifting practices target the equity component of the FDI income (the foreign income) while the debt component (the interest rates paid to the foreign investors) represents a cost for the foreign affiliates, not subject to corporate income taxation (though withholding taxes may apply). In addition, some BEPS practices do not only affect the (declared) profitability of FDI but also their structure, favoring debt over equity financing (debt financing schemes). The change in the financing mix is actually one lever used by MNEs in BEPS schemes. The isolation of the equity component from the debt component makes it possible to better capture the impact on profits of this effect.21 As a consequence, the responsiveness of the equity component to exposure to offshore investment hubs is expected to be higher (more negative) than the one of the aggregate rate of return. Conversely, the debt component is expected to be positively related to exposure to offshore hubs.
All regressions account for time and regional fixed effects, and they include a dummy variable accounting for prominent shares of natural resources in exports.22 Table 1 reports the results of the regression analysis.
• Model 1: Results support the assumption of a negative relationship between the offshore indicator and the rate of return, with a significant beta-coefficient. Comparison of the estimated coefficients suggests that developing countries (β = –11.5%) are relatively more vulnerable to profit shifting than developed countries (β = –5.4%).
20 Notice here that the two ratios Rate of Return_equity and Rate of Return_debt are not strictly rates of return as they both have as denominator the total FDI stock rather than (respectively) the equity component and the debt component of the FDI stock. They should rather be interpreted as the equity component and the debt component of the FDI income rate of return.
21 In the general case where the dependent variable is the aggregate rate of return, low levels of the equity component are partially compensated by higher levels of the debt component.
22 Countries with a share of resource-based exports in total exports higher than 90% in 2012.
133An FDI-driven approach to measuring the scale and economic impact of BEPS
• Model 2: The same picture is seen when focusing only on the equity component of the rate of return (Rate of Return_Equity). The negative relationship turns out to be stronger, both in terms of the slope of the regression line (for developing economies: from –11.5% to –15.8%) and in terms of statistical significance of the OLS estimates. Also the R-squared increases (for developing economies from 22% to 24%). The improvement of the regression when focusing specifically on the equity income is consistent with the realization of BEPS practices. Finally, comparison of the results between developed and developing economies confirms the higher responsiveness of the rate of return for developing economies.23
• Model 3: As expected, for the debt component the relationship is reverted: the higher the exposure to offshore investment hubs, the higher the debt component of the rate of return (Rate of Return_Debt). In this case the relationship is also statistically significant. This evidence, together with evidence on the equity component from model 2, supports the assumption that exposure to offshore hubs enables profit-shifting practices based on debt financing, among others.
Focusing on the impact of profit shifting on developing economies (shaded columns in table 1), the result of the regression analysis can be legitimately interpreted as follows: a 10% share of inward investment stock originating from offshore investment hubs is associated with a 1-1.5 percentage point lower reported (taxable) rate of return However, interpretation of this statement in a strictly causal way (i.e. an additional 10% exposure to offshore investment hubs generates a 1-1.5 percentage point decrease in the rate of return) requires caution. As the relationship holds across countries, it is not possible to exclude that the compositional effects of specific countries may drive the results. Certainly controlling for regional fixed effects makes it possible to capture a significant part of fixed country characteristics that may influence offshore investment patterns and the rate of return on foreign investment.24 This consideration is empirically supported by the increase of R-squared (from 4% to 24%) determined by the inclusion of regional fixed effects.25 In addition to regional fixed effects, the inclusion of a number of
23 For both model 1 (Rate of Return) and model 2 (Rate of Return_Equity) the interaction term between the offshore indicator and a dummy variable that equals 1 for developing economies and 0 for developed economies is not significant, suggesting that the difference in the response to the offshore indicator between developed and developing countries is not statistically significant. However, for both models the interaction term between the offshore indicator and GDP per capita holds at the 5% level, confirming that poorer countries are more vulnerable to profit shifting than richer countries.
24 It can be argued that a country fixed-effect model would better address countries’ fixed characteristics that potentially affect the relationship. However, within-country variability of the explanatory variable (specified in terms of stocks, highly stable over time) over a time horizon of four years (from 2009 to 2012, the time horizon covered by IMF CDIS at the time of this analysis) is very limited to observe meaningful effects on the dependent variable at the level of the individual country.
25 Notice the OLS estimation of the bivariate regression (i.e. the offshore indicator on the rate of return, without fixed effects and additional control variables) returns significant (at 1%) beta-coefficients, similar in magnitude to those reported in table 1.
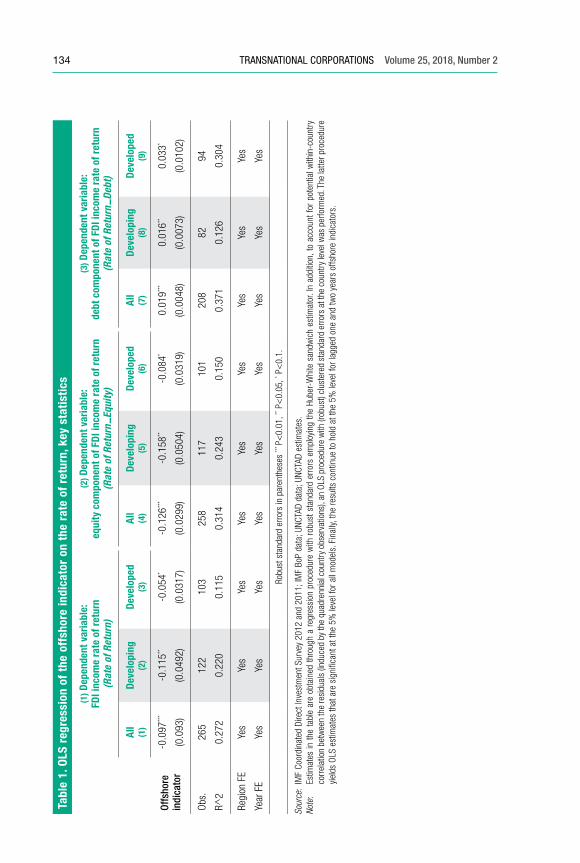
134 TRANSNATIONAL CORPORATIONS Volume 25, 2018, Number 2Ta
ble
1. O
LS r
egre
ssio
n of
the
off
shor
e in
dica
tor
on t
he r
ate
of r
etur
n, k
ey s
tatis
tics
(1) D
epen
dent
var
iabl
e:
FDI i
ncom
e ra
te o
f ret
urn
(Rat
e of
Ret
urn)
(2) D
epen
dent
var
iabl
e:
equi
ty c
ompo
nent
of F
DI in
com
e ra
te o
f ret
urn
(Rat
e of
Ret
urn −
Equi
ty)
(3) D
epen
dent
var
iabl
e:
debt
com
pone
nt o
f FDI
inco
me
rate
of r
etur
n (R
ate
of R
etur
n −De
bt)
All
(1)
Deve
lopi
ng(2
)De
velo
ped
(3)
All
(4)
Deve
lopi
ng(5
)De
velo
ped
(6)
All
(7)
Deve
lopi
ng(8
)De
velo
ped
(9)
Offs
hore
indi
cato
r-0
.097
***
(0.0
93)
-0.1
15**
(0.0
492)
-0.0
54*
(0.0
317)
-0.1
26**
*
(0.0
299)
-0.1
58**
(0.0
504)
-0.0
84*
(0.0
319)
0.01
9***
(0.0
048)
0.01
6**
(0.0
073)
0.03
3*
(0.0
102)
Obs
.
R^2
265
0.27
2
122
0.22
0
103
0.11
5
258
0.31
4
117
0.24
3
101
0.15
0
208
0.37
1
82
0.12
6
94
0.30
4
Regi
on F
E
Year
FE
Yes
Yes
Yes
Yes
Yes
Yes
Yes
Yes
Yes
Yes
Yes
Yes
Yes
Yes
Yes
Yes
Yes
Yes
Robu
st s
tand
ard
erro
rs in
par
enth
eses
*** P<
0.01
, ** P
<0.
05, * P
<0.
1.
Sour
ce:
IMF
Coor
dina
ted
Dire
ct In
vest
men
t Sur
vey
2012
and
201
1; IM
F Bo
P da
ta; U
NCTA
D da
ta; U
NCTA
D es
timat
es.
Note
: Es
timat
es in
the
tabl
e ar
e ob
tain
ed th
roug
h a
regr
essi
on p
roce
dure
with
rob
ust s
tand
ard
erro
rs e
mpl
oyin
g th
e Hu
ber-
Whi
te s
andw
ich
estim
ator
. In
addi
tion,
to a
ccou
nt fo
r po
tent
ial w
ithin
-cou
ntry
co
rrel
atio
n be
twee
n th
e re
sidu
als
(indu
ced
by th
e qu
adre
nnia
l cou
ntry
obs
erva
tions
), an
OLS
pro
cedu
re w
ith (r
obus
t) cl
uste
red
stan
dard
err
ors
at th
e co
untry
leve
l was
per
form
ed. T
he la
tter p
roce
dure
yi
elds
OLS
est
imat
es th
at a
re s
igni
fican
t at t
he 5
% le
vel f
or a
ll m
odel
s. F
inal
ly, th
e re
sults
con
tinue
to h
old
at th
e 5%
leve
l for
lagg
ed o
ne a
nd tw
o ye
ars
offs
hore
indi
cato
rs.
135An FDI-driven approach to measuring the scale and economic impact of BEPS
control variables (described in section 3.4) provides further backing to the strength of the relationship.
Thus, even though it is very challenging to irrefutably prove a direct causal relationship between exposure to offshore hubs and reduced profitability of FDI, this analysis provides sound empirical underpinning for the widespread evidence that MNEs leverage direct investment links to financial centres to enable profit-shifting practices that ultimately result in artificially lower FDI income. More importantly, the quantification of the responsiveness of the rate of return to exposure to offshore investment hubs allows simulating the potential impact of these practices on tax revenues.
3.4. Further robustness tests
This section illustrates the results of a number of tests aimed at strengthening the robustness of the econometric exercise. For ease of exposition, the outcomes are described for model 2 (rate of return on equity as dependent variable – columns 4 to 6 in table 1). Similarly, positive results are observed also for models (1) and (3).
The robustness tests address three critical areas.
a. Selection of the outliers
The selection of the outliers described in the previous section, although explained by economic considerations and supported by evidence from descriptive statistics, is prone to some degree of discretionality. In order to ensure that the selection of the outliers does not affect the main findings, two robust regression analyses are performed: the iteratively reweighted regression (IRR) and the quantile regression (QR).26 The two procedures were applied to the complete sample of developed and developing countries including the outliers (column 4 in table 1). Both the IRR and the QR return negative and statistically significant beta-coefficients (at the 1% level). The magnitude of the coefficient estimated with the IRR decreases from the baseline value of –0.126 (column 4 in table 1) to –0.086, while the estimate obtained with the QR remains substantially the same as the baseline.
b. Control variables
Since the offshore indicator could be correlated with omitted variables that may also affect the rate of return on FDI, some economic and institutional variables were
26 The goal of the two methods is to mitigate the effect of the extreme or deviant observations by assigning them a lower weight compared with “well-behaved” observations. Both methods are in practice standardized procedures to deal with outliers.
136 TRANSNATIONAL CORPORATIONS Volume 25, 2018, Number 2
added to the baseline specification. Selected controls were tailored to the group of developing economies, as they are the main focus of the analysis. Specific control variables include (i) corporate income tax rates;27 (ii) a variable measuring the level of development;28 (iii) a proxy variable for financial development;29 (iv) a proxy variable for the quality of institutions;30 (v) a variable for levels of corruption.31 With the exception of the level of corruption, all the other controls significantly explain the variation in the rate of return for developing economies. After including all (significant) controls in the regression, the beta-coefficient for the offshore indicator still holds significant (at 5%), with a magnitude decreasing from –0.158 (table 2, column 5) to –0.085 and the R-squared rising from 24% to 38%, as expected.
c. Robustness to the definition of country groups
Finally, different definitions of developing or lower-income economies were adopted to make sure that the main findings are not affected by the United Nations scoping of the group of developing economies. Two definitions of lower-income countries were used: the sample of countries with GDP per capita lower than the median value (129 observations); and the sample of low-income and lower-middle-income countries based on the World Bank classification (106 observations). For both samples, the regression returns a negative and significant (at 1%) beta-coefficient for the offshore indicator with a magnitude of –0.146 and –0.113, respectively.
3.5. Simulation of the tax revenue loss for developing economies
Given a negative relationship between the share of inward investment from offshore investment hubs and the rate of return on inward investment, the problem of estimating the tax revenue loss for developing economies boils down to (i) finding the “missing profits” due to current levels of investment from offshore hubs (estimation of the profit shifting); and (ii) translating the profit shifting into tax revenue losses.
i. It is reasonable to use the results of the regression analysis to simulate the profitability gap (i.e. the decrease in the profitability) associated with the actual exposure of developing economies to offshore investment hubs. Given an average
27 Statutory corporate tax rate from USAID, 2012. Notice that potential endogeneity follows from the fact that higher corporate income tax rates in the host country may increase the incentive to shift profits and thus the use of offshore hubs, resulting in a higher offshore indicator; at the same time it may depress the FDI income, reported net of tax, resulting in a lower rate of return.
28 GDP per capita from UNCTAD, 2009–2012. 29 The domestic credit to private sector as a fraction of GDP from the World Bank, 2009–2012.30 The regulatory quality index from the World Bank’s worldwide governance indicators, 2009–2012.31 The corruption index from the World Bank’s worldwide governance indicators, 2009–2012.
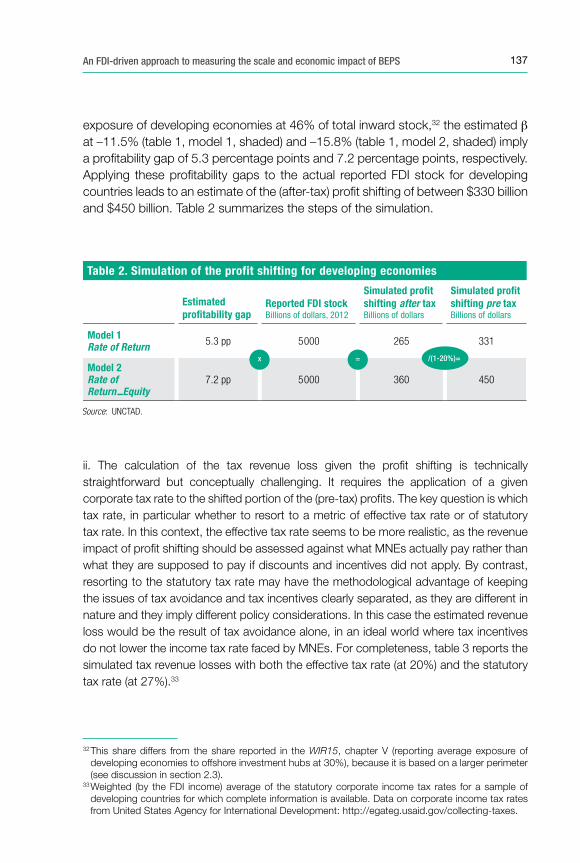
137An FDI-driven approach to measuring the scale and economic impact of BEPS
exposure of developing economies at 46% of total inward stock,32 the estimated β at –11.5% (table 1, model 1, shaded) and –15.8% (table 1, model 2, shaded) imply a profitability gap of 5.3 percentage points and 7.2 percentage points, respectively. Applying these profitability gaps to the actual reported FDI stock for developing countries leads to an estimate of the (after-tax) profit shifting of between $330 billion and $450 billion. Table 2 summarizes the steps of the simulation.
ii. The calculation of the tax revenue loss given the profit shifting is technically straightforward but conceptually challenging. It requires the application of a given corporate tax rate to the shifted portion of the (pre-tax) profits. The key question is which tax rate, in particular whether to resort to a metric of effective tax rate or of statutory tax rate. In this context, the effective tax rate seems to be more realistic, as the revenue impact of profit shifting should be assessed against what MNEs actually pay rather than what they are supposed to pay if discounts and incentives did not apply. By contrast, resorting to the statutory tax rate may have the methodological advantage of keeping the issues of tax avoidance and tax incentives clearly separated, as they are different in nature and they imply different policy considerations. In this case the estimated revenue loss would be the result of tax avoidance alone, in an ideal world where tax incentives do not lower the income tax rate faced by MNEs. For completeness, table 3 reports the simulated tax revenue losses with both the effective tax rate (at 20%) and the statutory tax rate (at 27%).33
32 This share differs from the share reported in the WIR15, chapter V (reporting average exposure of developing economies to offshore investment hubs at 30%), because it is based on a larger perimeter (see discussion in section 2.3).
33 Weighted (by the FDI income) average of the statutory corporate income tax rates for a sample of developing countries for which complete information is available. Data on corporate income tax rates from United States Agency for International Development: http://egateg.usaid.gov/collecting-taxes.
Estimated pro� tability gap
Reported FDI stockBillions of dollars, 2012
Simulated pro� t shifting after taxBillions of dollars
Simulated pro� t shifting pre taxBillions of dollars
Model 1Rate of Return 5.3 pp 5 000 265 331
Model 2Rate of Return−Equity
7.2 pp 5 000 360 450
Source: UNCTAD.
Table 2. Simulation of the profit shifting for developing economies
/(1-20%)==x
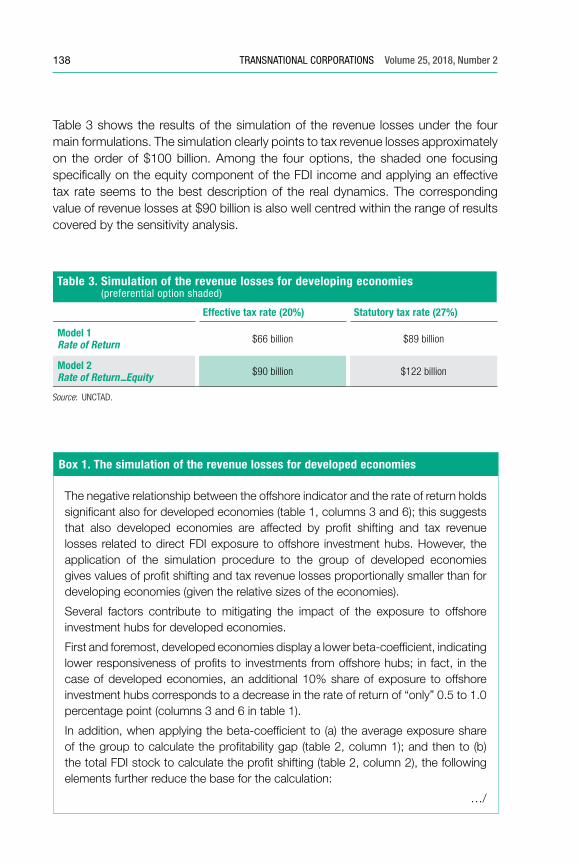
138 TRANSNATIONAL CORPORATIONS Volume 25, 2018, Number 2
Effective tax rate (20%) Statutory tax rate (27%)
Model 1Rate of Return $66 billion $89 billion
Model 2Rate of Return−Equity $90 billion $122 billion
Source: UNCTAD.
Table 3. Simulation of the revenue losses for developing economies (preferential option shaded)
Box 1. The simulation of the revenue losses for developed economies
The negative relationship between the offshore indicator and the rate of return holds significant also for developed economies (table 1, columns 3 and 6); this suggests that also developed economies are affected by profit shifting and tax revenue losses related to direct FDI exposure to offshore investment hubs. However, the application of the simulation procedure to the group of developed economies gives values of profit shifting and tax revenue losses proportionally smaller than for developing economies (given the relative sizes of the economies).
Several factors contribute to mitigating the impact of the exposure to offshore investment hubs for developed economies.
First and foremost, developed economies display a lower beta-coefficient, indicating lower responsiveness of profits to investments from offshore hubs; in fact, in the case of developed economies, an additional 10% share of exposure to offshore investment hubs corresponds to a decrease in the rate of return of “only” 0.5 to 1.0 percentage point (columns 3 and 6 in table 1).
In addition, when applying the beta-coefficient to (a) the average exposure share of the group to calculate the profitability gap (table 2, column 1); and then to (b) the total FDI stock to calculate the profit shifting (table 2, column 2), the following elements further reduce the base for the calculation:
…/
Table 3 shows the results of the simulation of the revenue losses under the four main formulations. The simulation clearly points to tax revenue losses approximately on the order of $100 billion. Among the four options, the shaded one focusing specifically on the equity component of the FDI income and applying an effective tax rate seems to the best description of the real dynamics. The corresponding value of revenue losses at $90 billion is also well centred within the range of results covered by the sensitivity analysis.
139An FDI-driven approach to measuring the scale and economic impact of BEPS
Box 1. The simulation of the revenue losses for developed economies (concluded)
(a) The average exposure to offshore investment hubs (using the extended perimeter for offshore investment hubs) for developed economies (at 35%) is lower than for developing economies (46%). For the reference model 2, this translates in a profitability gap of 3 percentage points against 7 percentage points for developing economies (column 1 in table 2).
(b) The removal of some large developed-economy offshore investment hubs from the perimeter of the calculation reduces significantly the baseline of FDI stock used for the calculation of the profit shifting (from about $14 trillion to $11 trillion, according to UNCTAD statistics).
In this context, despite the larger size of the economies, the simulation of tax revenue losses resulting from direct offshore investment links for developed countries yields an estimate similar to that of developing countries, on the order of $100 billion. In particular, for the reference option (model 2, with average effective tax rate; see table 3), assuming an average effective tax rate at 25% – higher than for developing economies – the simulation procedure returns an estimate of revenue losses at $110 billion, against $90 billion for developing economies.
Source: UNCTAD.
4. Conclusions and directions of future research
The analysis presented in this paper claims two main analytical achievements. First, it introduces a methodology to quantify FDI investment through OFCs (the Offshore Investment Matrix). The results of the analysis indicate a major role of FDI through OFCs in the global FDI network, from a (conservative) 30% of total bilateral FDI up to almost 50%, depending on the OFC perimeter. This analysis is of major interest on its own, as it measures the link between investment and taxation, but also as an input to the second main objective: the calculation of the economic impact of FDI-enabled tax avoidance. In this context, econometric analysis of the relationship between offshore FDI and investment profitability confirms that investment through OFCs is responsible for some degree of profit shifting (“FDI-enabled”), resulting in estimated revenue losses at about $100 billion annually for developing countries (and $200 billion globally).
Both analytical results are susceptible to improvements.
The analysis of the Offshore Investment Matrix is descriptive; hence, potential developments are relatively straightforward. These include a more updated and refined scoping of the OFC component, also taking into account new self-declared
140 TRANSNATIONAL CORPORATIONS Volume 25, 2018, Number 2
SPE countries.34 In the extended setting of section 2.3, the Implied Investment Method is at this stage of development an effective heuristic to identify and size the offshore component; its treatment can be refined and grounded on more solid statistical analysis. In this respect, a larger number of countries reporting SPEs provide a more robust benchmark for testing and validating the method against “real” counterfactuals. Finally, as the parameters driving the perimeter of the OFC component are quite arbitrary, it would be interesting to perform a full-fledged comparative study to analyse the results’ sensitivity to different assumptions. In the same spirit, it would also be interesting to compare the results of the Implied Investment Method with alternative approaches to the sizing of FDI through OFCs, for example, from the recent IMF’s Damgaard and Elkjaer (2017).
The second set of results, related to the estimation of the tax revenue losses, require some bolder inference steps, and thus are more prone to criticism and margins for improvement. The major objection addressed to the UNCTAD method is that it exposes the BEPS effects of investment through OFCs without fully clarifying the causes, i.e. it does not clarify the nature and the boundaries of the profit-shifting practices enabled by offshore FDI.35 Importantly, in the debate on big numbers, this limitation makes it difficult to assess how far is our final estimation of revenue losses – a lower bound by definition – from the “true” number. As a first step to address this concern, a systematic review of some of the most common BEPS schemes with a specific focus on the role of FDI and its implications on FDI patterns or data would be insightful. This could lead to an FDI-driven taxonomy of BEPS schemes, as opposed to available income-driven categorization. (Currently the efforts to understand the mechanics of MNEs’ tax planning schemes have mainly revolved around the income dimension rather than the FDI dimension.) We expect such a review to support our approach by showing that the vast majority of known BEPS schemes do use FDI links to OFCs. More analytically, one could think of splitting the explicative variable (the offshore indicator) into its equity (equity exposure) and debt component (debt exposure) and analyse separately their effects on the rate of return, and potentially also the correlation between the two components. This analysis would provide an indication of the relevance of thin capitalization (mainly related to debt exposure) in driving the relationship of interest. Finally, there is a whole set of relevant bilateral FDI data on OECD countries that have not been yet exploited for the analysis of BEPS schemes. These include, for example,
34 As of 2016, from OECD reporting, there are 29 countries reporting FDI stock to and from SPEs (though 13 of them claim a negligible presence), compared with only four jurisdictions in 2010.
35 As put by Tax Justice Network: “Their [UNCTAD] estimates (..) seem rigorous, but it is not clear that what they estimate is actually profit shifting. (..) we are not disputing that an additional 10% share of inward investment stock originating from offshore investment hubs is associate with a decrease in the rate of return of 1–1.5 percentage point and the role of offshore hubs does seem to be distinct, but we do not see what the likely channels of profit shifting associated with the lower returns might be….”
141An FDI-driven approach to measuring the scale and economic impact of BEPS
bilateral information on SPE investment, FDI income, ultimate investors and FDI components. Such detailed views cannot be directly employed in the estimation of revenue losses on a global scale due to their limited coverage, but we believe they can significantly contribute to a better understanding of how FDI-enabled profit shifting takes place.
References
ActionAid (2013). “How tax havens plunder the poor”. www.gfintegrity.org/wp-content/ uploads/2014/05/ActionAid-Tax-Havens-May-2013.pdf.
Atisophon V., J. Bueren, G. De Paepe, C. Garroway and J.P. Stijns (2011). Revisiting MDG cost estimates from a domestic resource mobilisation perspective. OECD Development Center Working Papers No 306, OECD Publishing.
Beugelsdijk, S., J.F. Hennart, A. Slangen and R. Smeets (2010). “Why and how FDI stocks are a biased measure of MNE affiliate activity”. Journal of International Business Studies, 41(9), pp. 1444-1459.
Bolwijn R., B. Casella and D. Rigo (2018). “Establishing the baseline: estimating the fiscal contribution of multinational enterprises”. Transnational Corporations 25 (3).
Bradbury D., T. Hanappi and A. Moore (2018). “Estimating the fiscal effects of base erosion and profit shifting: data availability and analytical issues”. Transnational Corporations 25 (2).
Casella, B. (forthcoming). “FDI statistics and international production: towards (re-) conciliation?” Transnational Corporations.
Christian Aid (2008). “Death and taxes: The true toll of tax dodging”, May.
www.christianaid.org.uk/images/deathandtaxes.pdf.
Christian Aid (2009). “False profits: Robbing the poor to keep the rich tax-free”, March. https://www.christianaid.org.uk/Images/false-profits.pdf.
Christian Aid (2013). “Invested interests: The UK’s overseas territories hidden role in developing countries”. www.christianaid.org.uk/Images/Invested-Interests-Christian- Aid-tax-report.pdf.
Clausing, K.A. (2016). “The effect of profit shifting on the corporate tax base in the United States and beyond”. National Tax Journal, 69(4), pp. 905-934.
Cobham, A. and S. Loretz (2014). “International distribution of the corporate tax base: Impact of different apportionment factors under unitary taxation”. ICTD Working Paper, 27, April. Brighton, United Kingdom: International Centre for Tax and Development.
Cobham, A. and P. Janský (2017). “Measuring misalignment: the location of US multinationals’ economic activity versus the location of their profits”. Development Policy Review. https:// doi.org/10.1111/dpr.12315.
Cobham, A. and P. Janský (2018a). “Global distribution of revenue loss from tax avoidance: re-estimation and country results”. Journal of International Development 30 (2), pp. 206-232.142
142 TRANSNATIONAL CORPORATIONS Volume 25, 2018, Number 2
Cobham, A. and P. Janský (2018b). Measurement of Illicit Financial Flows. Background paper prepared for UNECA.
Crivelli, E., R. de Mooij and M. Keen (2015). “Base Erosion, Profit Shifting and Developing Countries”. IMF Working Papers 15/118, International Monetary Fund, Washington, DC.
Crivelli, E., R. de Mooij and M. Keen (2016). “Base erosion, profit shifting and developing countries”. FinanzArchiv: Public Finance Analysis, 72(3), pp. 268–301.
Concord Aidwatch (2013). “Global financial flows, aid and development”, AidWatch Briefing Paper, March. Brussels: Concord. http://eurodad.org/files/integration/2013/03/2013_ AW-Briefing-paper_Global-financial-flows-aid-anddevelopment1.pdf.
Damgaard, J. and T. Elkjaer (2017). “The global FDI network: searching for ultimate investors”. IMF Working Papers, WP/17/258. Washington, DC: International Monetary Fund.
Dharmapala, D. (2014). “What do we know about base erosion and profit shifting? A review of the empirical literature”. Fiscal Studies, 35(4), 421–448. https://doi.org/10.1111/j.1475- 5890.2014.12037.x.
Dharmapala, D. and N. Riedel (2013). “Earnings shocks and tax-motivated income-shifting: Evidence from European multinationals”. Journal of Public Economics, 97, pp. 95-107.
Fuest, C. and N. Riedel (2009). “Tax evasion, tax avoidance and tax expenditures in developing countries: A review of the existing literature”. Report prepared for the UK Department for International Development (DFID). Oxford University Centre for Business Taxation, Oxford.
Fuest, C. and N. Riedel (2010). “Tax evasion and tax avoidance in developing countries: The role of international profit shifting”. Centre for Business Taxation Working Papers, 10(12). Oxford University Centre for Business Taxation, Oxford. http://eureka.sbs.ox.ac. uk/3257/1/WP1012.pdf.
Gravelle, J.G. (2013). “Tax havens: International tax avoidance and evasion”. Washington, DC: Congressional Research Service. www.fas.org/sgp/crs/misc/R40623.pdf.
Haberly, D. and D. Wojcik (2014). “Tax havens and the production of offshore FDI: An empirical analysis”, Journal of Economic Geography, 15(1), pp. 75–101. http://joeg.oxfordjournals. org/content/15/1/.
Hines, J.R. and E.M. Rice (1994). “Fiscal paradise: Foreign tax havens and American business”. The Quarterly Journal of Economics, 109(1), pp. 149-182.
Huizinga, H. and L. Laeven (2008). International profit shifting within multinationals: A multi-country perspective. Journal of Public Economics, 92(5), pp. 1164-1182.
IMF (2014). “Spillovers in international corporate taxation”. IMF Policy Paper. Washington, D.C.: International Monetary Fund.
Janský, P. and M. Palanský. (2018). “Estimating the scale of profit shifting and tax revenue losses related to foreign direct investment”, WIDER Working Paper 2018/21. Helsinki: UNU-WIDER.
Johannesen, N., T. Tørsløv, and L. Wier (2017). “Are less developed countries more exposed to multinational tax avoidance? Method and evidence from micro-data”. WIDER Working Paper, 2016(10), pp 1–30. Helsinki: UNU-WIDER.143
143An FDI-driven approach to measuring the scale and economic impact of BEPS
Leino, T. and J. Ali-Yrkko (2014). “How well does foreign direct investment measure real investment by foreign-owned companies? – Firm-level analysis”. Bank of Finland Research Discussion Paper No. 12/2014.
Lipsey, R.E. (2007). “Defining and measuring the location of FDI output”. NBER Working Paper No. 12996, National Bureau of Economic Research.
OECD (1998). “Harmful tax competition: An emerging global issue”. Paris: OECD. www. oecd.org/tax/transparency/44430243.pdf.
OECD (2000). “Towards global tax co-operation: Report to the 2000 ministerial council meeting and recommendations by the committee on fiscal affairs”. Paris: OECD.
OECD (2013). Addressing Base Erosion and Profit Shifting. Paris: OECD Publishing. http:// dx.doi.org/10.1787/9789264192744-en.
OECD (2015). Measuring and Monitoring BEPS, Action 11 - 2015 Report, OECD/G20 Base Erosion and Profit Shifting Project. (Paris: OECD Publishing).
Oxfam (2000). “Tax havens: Releasing the hidden billions for poverty eradication”, Oxfam Briefing Papers, June. Oxford: Oxfam International.
Tax Justice Network (2007). “Identifying tax havens and offshore finance centers”. Briefing paper. Chesham, Buckinghamshire, United Kingdom. www.taxjustice.net/cms/upload/ pdf/Identifying_Tax_Havens_Jul_07.pdf.
Tørsløv, T.R., L.S. Wier and G. Zucman (2018). “The Missing Profits of Nations”, Working Paper No. 24701. National Bureau of Economic Research. https://doi.org/10.3386/ w24701.
UNCTAD (2015a). “FDI, tax, and development”. UNCTAD Investment and Enterprise Division Working Paper.
UNCTAD (2015b). World Investment Report 2015: Reforming International Investment Governance. New York and Geneva: United Nations.
U.S. Government Accountability Office (2008). “Large U.S. corporations and federal contractors with subsidiaries in jurisdictions listed as tax havens or financial privacy jurisdictions”. Report to Congressional Requesters GAO-09-157. Washington, DC: GAO. www.gao.gov/new.items/d09157.pdf.


Guidelines for contributors
GUIDELINES FOR CONTRIBUTORS
Papers for publication must be in English.
Authors are requested to submit their manuscript by email to [email protected]. The manuscript should be prepared with Microsoft Word, accompanied by a statement that the text (or parts thereof) has not been published or submitted for publication elsewhere.
Original research papers, review and perspective papers should not normally exceed 10,000 words. Point-counterpoints papers should not exceed 7,000 words. Research notes should not exceed 5,000 words. All papers should include an abstract not exceeding 150 words. Book reviews should be around 1,500 words. The word count includes abstract, text, endnotes, references, tables, figures and appendices. Footnotes should be placed at the bottom of the page they refer to. An alphabetical list of references should appear at the end of the manuscript. Appendices, tables and figures should be on separate sheets of paper and placed at the end of the manuscript.
Manuscripts should be double-spaced (including references) with wide margins. Pages should be numbered consecutively. The first page of the manuscript should contain: (i) title; (ii) name(s) and institutional affiliation(s) of the author(s); and (iii) mailing address, e-mail address, telephone number of the author (or primary author, if more than one).
Transnational Corporations has the copyright for all published articles. Authors may reuse published manuscripts with due acknowledgement.
Style guide
A. Quotations should be accompanied by the page number(s) from the original source.
B. Footnotes should be numbered consecutively throughout the text with Arabic-numeral superscripts. Important substantive comments should be integrated in the text itself rather than placed in footnotes.
C. Figures (charts, graphs, illustrations, etc.) should have headers, subheaders, labels and full sources. Footnotes to figures should be preceded by lowercase letters and should appear after the sources.
145
TRANSNATIONAL CORPORATIONS Volume 25, 2018, Number 2
Figures should be numbered consecutively. The position of figures in the text should be indicated as follows:
Put figure 1 here
D. Tables should have headers, subheaders, column headers and full sources. Table headers should indicate the year(s) of the data, if applicable. The unavailability of data should be indicated by two dots (..). If data are zero or negligible, this should be indicated by a dash (-). Footnotes to tables should be preceded by lowercase letters and should appear after the sources. Tables should be numbered consecutively. The position of tables in the text should be indicated as follows:
Put table 1 here
E. Abbreviations should be avoided whenever possible, except for FDI (foreign direct investment) and MNEs (multinational enterprises)/TNCs (transnational corporations).
F. Bibliographical references in the text should appear as: “John Dunning (1979) reported that ...”, or “This finding has been widely supported in the literature (Cantwell, 1991, p. 19)”. The author(s) should ensure that there is a strict correspondence between names and years appearing in the text and those appearing in the list of references. All citations in the list of references should be complete. Names of journals should not be abbreviated. The following are examples for most citations:
Bhagwati, Jagdish (1988). Protectionism (Cambridge, MA: MIT Press).
Cantwell, John (1991). “A survey of theories of international production”, in Christos N. Pitelis and Roger Sugden, eds., The Nature of the Transnational Firm (London: Routledge), pp. 16-63.
Dunning, John H. (1979). “Explaining changing patterns of international production: in defence of the eclectic theory”, Oxford Bulletin of Economics and Statistics, 41 (November), pp. 269-295.
All manuscripts accepted for publication will be edited to ensure conformity with United Nations practice.
146
World Investment Reportworldinvestmentreport.org
Investment Policy Framework for Sustainable Developmentinvestmentpolicyhub.unctad.org/ipfsd
UNCTAD Entrepreneurship Policy Frameworkunctad.org/en/PublicationsLibrary/diaeed2012d1_en.pdf
World Investment Forumunctad-worldinvestmentforum.org
Sustainable Stock Exchanges Initiativesseinitiative.org
Investment Policy Hubinvestmentpolicyhub.unctad.org
FDI Statisticsunctad.org/fdistatistics
Investment Trends and Policies Monitorsunctad.org/diae
Internatinal Investment Agreementsunctad.org/iia
Investment Policy Reviewsunctad.org/ipr
ISAR Corporate Transparency Accountingunctad.org/isar
Transnational Corporations Journalunctad.org/tnc
Selected UNCTAD programmes onInvestment and Enterprise
Printed at United Nations, Geneva GE UNCTAD/DIAE/IA/2018/4 United Nations publicationSales ETN252 ISSN 1014-9562
ISBN 978-92-1-112933-5
147