translating risk assessment to contingency … · translating risk assessment to contingency...
TRANSCRIPT

1
Translating Risk Assessment to Contingency Planning for CO2 Geologic
Storage: A Methodological Framework
Authors
Karim Farhat a and Sally M. Benson
b
a Department of Management Science and Engineering, Stanford University, Stanford, California, USA
b Department of Energy Resources Engineering, Stanford University, Stanford, California, USA
Contact Information
Karim Farhat: [email protected]
Sally M. Benson: [email protected]
Corresponding Author
Karim Farhat
475 Via Ortega
Huang Engineering Center, 245A
Stanford, CA 94305, USA
Email: [email protected]
Tel: +1-650-644-7451
October 2015
2
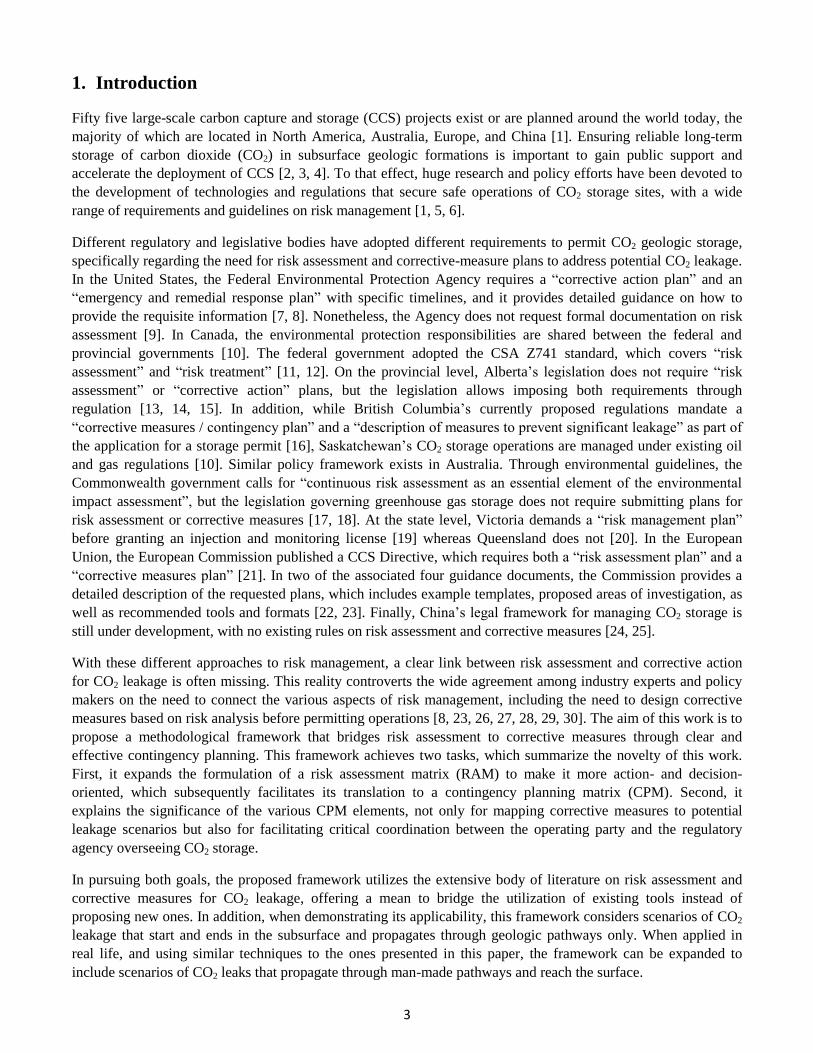
Abstract
In order to ensure safe and effective long-term geologic storage of carbon dioxide (CO2), existing regulations
require both assessing leakage risks and responding to leakage incidents through corrective measures. However,
until now, these two pieces of risk management have been usually addressed separately. This study proposes a
methodological framework that bridges risk assessment to corrective measures through clear and collaborative
contingency planning. We achieve this goal in three consecutive steps. First, a probabilistic risk assessment
(PRA) approach is adopted to characterize potential leakage features, events and processes (FEP) in a Bayesian
events tree (BET), resulting in a risk assessment matrix (RAM). The RAM depicts a mutually exclusive and
collectively exhaustive set of leakage scenarios with quantified likelihood, impact, and tolerance levels. Second,
the risk assessment matrix is translated to a contingency planning matrix (CPM) that incorporates a tiered-
contingency system for risk-preparedness and incident-response. The leakage likelihood and impact dimensions
of RAM are translated to resource proximity and variety dimensions in CPM, respectively. More likely or
frequent risks require closer resources for quick mobilization and deployment while more impactful risks require
more specialized or complex resources for leakage mitigation or remediation. In addition, the minimum and
maximum risk tolerance levels are translated to contingency thresholds, and all foreseeable risk scenarios are
categorized under three contingency tiers: Tier 1, Tier 2, and Tier 3. We highlight how the upper, lower, and inter-
tier contingency boundaries should be collaboratively pre-negotiated between the operating party and multiple
relevant stakeholders to ensure effective preparedness and response. Finally, we present a model contingency plan
to demonstrate how all newly introduced concepts integrate together. Specifically, we focus on explaining how
the designed contingency tiers facilitate important aspects of contingency planning, primarily: evaluating leakage
and initiating response; designing a corrective measures matrix (CMM) that assigns specific mitigation and
remediation measures to each leakage scenario; mobilizing, deploying, and sustaining necessary human and
equipment resources; and formulating a decision-making hierarchy, a notification protocol, and a communication
scheme to effectively administer the CO2 storage site.
Keywords
contingency planning, corrective measures, geologic storage, leakage, risk assessment
3
1. Introduction
Fifty five large-scale carbon capture and storage (CCS) projects exist or are planned around the world today, the
majority of which are located in North America, Australia, Europe, and China [1]. Ensuring reliable long-term
storage of carbon dioxide (CO2) in subsurface geologic formations is important to gain public support and
accelerate the deployment of CCS [2, 3, 4]. To that effect, huge research and policy efforts have been devoted to
the development of technologies and regulations that secure safe operations of CO2 storage sites, with a wide
range of requirements and guidelines on risk management [1, 5, 6].
Different regulatory and legislative bodies have adopted different requirements to permit CO2 geologic storage,
specifically regarding the need for risk assessment and corrective-measure plans to address potential CO2 leakage.
In the United States, the Federal Environmental Protection Agency requires a “corrective action plan” and an
“emergency and remedial response plan” with specific timelines, and it provides detailed guidance on how to
provide the requisite information [7, 8]. Nonetheless, the Agency does not request formal documentation on risk
assessment [9]. In Canada, the environmental protection responsibilities are shared between the federal and
provincial governments [10]. The federal government adopted the CSA Z741 standard, which covers “risk
assessment” and “risk treatment” [11, 12]. On the provincial level, Alberta’s legislation does not require “risk
assessment” or “corrective action” plans, but the legislation allows imposing both requirements through
regulation [13, 14, 15]. In addition, while British Columbia’s currently proposed regulations mandate a
“corrective measures / contingency plan” and a “description of measures to prevent significant leakage” as part of
the application for a storage permit [16], Saskatchewan’s CO2 storage operations are managed under existing oil
and gas regulations [10]. Similar policy framework exists in Australia. Through environmental guidelines, the
Commonwealth government calls for “continuous risk assessment as an essential element of the environmental
impact assessment”, but the legislation governing greenhouse gas storage does not require submitting plans for
risk assessment or corrective measures [17, 18]. At the state level, Victoria demands a “risk management plan”
before granting an injection and monitoring license [19] whereas Queensland does not [20]. In the European
Union, the European Commission published a CCS Directive, which requires both a “risk assessment plan” and a
“corrective measures plan” [21]. In two of the associated four guidance documents, the Commission provides a
detailed description of the requested plans, which includes example templates, proposed areas of investigation, as
well as recommended tools and formats [22, 23]. Finally, China’s legal framework for managing CO2 storage is
still under development, with no existing rules on risk assessment and corrective measures [24, 25].
With these different approaches to risk management, a clear link between risk assessment and corrective action
for CO2 leakage is often missing. This reality controverts the wide agreement among industry experts and policy
makers on the need to connect the various aspects of risk management, including the need to design corrective
measures based on risk analysis before permitting operations [8, 23, 26, 27, 28, 29, 30]. The aim of this work is to
propose a methodological framework that bridges risk assessment to corrective measures through clear and
effective contingency planning. This framework achieves two tasks, which summarize the novelty of this work.
First, it expands the formulation of a risk assessment matrix (RAM) to make it more action- and decision-
oriented, which subsequently facilitates its translation to a contingency planning matrix (CPM). Second, it
explains the significance of the various CPM elements, not only for mapping corrective measures to potential
leakage scenarios but also for facilitating critical coordination between the operating party and the regulatory
agency overseeing CO2 storage.
In pursuing both goals, the proposed framework utilizes the extensive body of literature on risk assessment and
corrective measures for CO2 leakage, offering a mean to bridge the utilization of existing tools instead of
proposing new ones. In addition, when demonstrating its applicability, this framework considers scenarios of CO2
leakage that start and ends in the subsurface and propagates through geologic pathways only. When applied in
real life, and using similar techniques to the ones presented in this paper, the framework can be expanded to
include scenarios of CO2 leaks that propagate through man-made pathways and reach the surface.

4
In the subsequent sections of this paper, we first provide a brief overview of the terminology used in the risk
management of CO2 storage, highlighting some existing literature on risk assessment methodologies and
corrective measures. Next, we discuss how to update the risk assessment matrix, introducing the concept of “risk
profiles” of CO2 leakage. As the main focus of this paper, a contingency planning matrix is then developed based
on the updated risk assessment matrix, and its tier structure is discussed. Lastly, we leverage the contingency
planning matrix to design a model contingency plan, covering multiple sections on preparing for leakage risks and
responding to leakage incidents. When discussing specific response strategies within the plan, we show how
different corrective measures can tackle different risk profiles under different contingency tiers, effectively
linking all elements of risk management for CO2 leakage from geologic storage.
2. Risk Management: Assessment, Mitigation, and Contingency Planning
Before discussing the details of the proposed framework, it is important to establish a consistent risk-management
terminology that we can refer to throughout this paper. Managing the risk of CO2 leakage from geologic storage
formations includes three essential steps: assessment of risk, mitigation and avoidance of intolerable risk, and
contingency planning for tolerable risk. A robust risk assessment involves the identification, analysis, and
evaluation of potential leakage scenarios. After identifying a comprehensive set of scenarios, each scenario is
analyzed qualitatively or quantitatively to determine its likelihood of occurrence and its impact on subsurface
formations and surface ecosystems. Leakage risks are then evaluated according to external mandates by the
regulatory agency and internal procedures by the operating party, resulting in a set of risk tolerance levels. While
risks below the minimum tolerance levels can be safely ignored, risks exceeding the maximum tolerance levels
need to be mitigated or avoided altogether through a variety of preventative measures [22, 26, 27].
On the other hand, leakage scenarios within the tolerance range are managed through contingency planning,
which aims to prepare for leakage risks and respond to leakage incidents if they occur [28, 31, 32]. Learning from
the oil and gas industry, we envision a tier-system approach to contingency planning for CO2 leakage, which
integrates five essential elements: thresholds, response initiation through triggers, response strategies that include
corrective measures, human and equipment resources, and administration and coordination schemes [23, 33, 34,
35, 36, 37]. While thresholds refer to specific levels of leakage likelihoods and impacts that bound risk-
preparedness, triggers refer to specific irregular measurements or observations that initiate incident-response.
Additionally, corrective measures cover subsurface and surface activities that aim to both mitigate (stop or
contain) the leakage and remediate its impacts [32, 38]. To that end, thresholds and triggers shape ‘when’
corrective measures should be implemented while human and equipment resources and administration and
coordination schemes define ‘what and how’ corrective measures should be implemented.
The aforementioned sequential process of risk management shows that the effective design and deployment of
corrective measures for CO2 leakage necessitates a robust contingency plan, which in turn should be based on the
findings of a comprehensive risk assessment. In our attempt to present a methodological framework that
integrates all three elements of risk management, we focus primarily on contingency planning, which has received
comparatively little attention in literature. Nonetheless, contingency planning is linked to risk assessment and
corrective measures by utilizing the large body of existing literature on both topics [39, 40, 38]. Specifically, we
use the features, events, and processes (FEP) methodology for risk identification [41] and Bayesian event trees
(BET) for risk analysis [40, 42, 43]. The RISQUE method is another valuable resource to assess impacts and elicit
informed probabilities from experts [44, 45]. Subsequently, for corrective measures, we use representative
examples of containment and remediation activities to combat leakage events in the subsurface [46, 47, 48].

5
3. Updating the Risk Assessment Matrix
A Risk Assessment Matrix (RAM) is usually represented as a two-dimensional plot of leakage impact versus
leakage likelihood. Our focus on the RAM is motivated by its application in some existing CCS policies [22, 49]
and projects [29, 50] and by its ability to visualize all three steps of risk assessment. The leakage scenarios
depicted in a RAM result from risk identification; the likelihood and impact of each scenario are the outcome of
risk analysis; and the determination of insignificant, tolerable, and intolerable scenarios emerge from risk
evaluation. When quantified, a RAM represents a leakage scenario as a single ‘risk point’ with the likelihood and
the impact calculated based on expected-average or worst-case estimates [45, 51]. Other RAMs are qualitative, so
a leakage scenario is allocated into a single high, medium, or low ‘risk zone’ [29, 52].
While helpful for visualizing and comparing risks, current applications of RAM can still be improved. For
example, a realistic leakage scenario may span more than one risk level depending on several factors, some of
which are uncertain. Such factors include the rate of leakage, the features of the storage reservoir and surrounding
geologic formations, and the vulnerability of surface ecosystems. In addition, it is hard to distinguish the relative
significance of the various risk drivers in current RAM depictions of leakage. For instance, it cannot be inferred
whether a high likelihood of leakage through a fault into a freshwater aquifer is due to the high probability that a
fault exists or due to the high probability that an aquifer is nearby the fault given that the latter exists. Adopting a
quantifiable probabilistic risk assessment (PRA) approach that combines FEP and BET offers one way to address
those issues, resulting in a more inclusive RAM and therefore facilitating the transition to a CPM.
PRA relies on systems analysis, decision analysis, and Bayesian reasoning to assess a set of mutually exclusive
and collectively exhaustive scenarios of CO2 leakage in the subsurface [53]. This approach includes four steps.
First, for risk identification, the overall subsurface ‘system’ is divided into a series of independent functional
‘subsystems’. Potential leakage scenarios are defined as trajectories that combine multiple subsystems, and FEP
guides specifically the categorization of subsystems where a CO2 leakage may start. Second, the likelihood of
each leakage scenario is assessed as a series of conditional probabilities that change as a function of a measurable
criterion, which is typically a relevant geological feature. Third, multiple ‘value models’ are developed to help
quantify the impact of leakage on the subsurface and surface ecosystems. The second and third steps cover risk
analysis, and combining the first three steps results in a BET that systematically describes all foreseeable
conjunctions of leakage events. In the fourth step, specific tolerance levels are determined for both the likelihood
and the impact of leakage in order to evaluate what risks should be mitigated and what risks can be safely ignored.
Eventually, the overall outcome of this PRA is a RAM that depicts a comprehensive set of ‘risk profiles’ of CO2
leakage with quantified likelihood, impact, and tolerance levels.
3.1. Functional Subsystems for Risk Identification
For CO2 leakage through geologic pathways, the ‘system’ is defined as the set of geologic formations in the
subsurface, above and including the storage reservoir. As depicted in Figure 1, this system can be divided into
three functional subsystems: Origin, Endpoint, and Pathway.
Origin: refers to the functional subsystem which is designated to contain the CO2 under normal conditions.
Physically, it encompasses the storage reservoir and any selected containment zones. Origin can be further
decomposed into a list of subsystems, namely, a comprehensive count of the geologic irregularities – features,
events, or processes (FEP) – through which CO2 may leak and the rest of the formation where CO2 remains safely
stored; we categorize the former subsystems as FEP and refer to the latter subsystem as Safe. Although FEPs are
site-specific, an example list is presented in Table 1.
Endpoint: refers to the functional subsystem where the leaked CO2 finally reaches. Endpoint can be further
decomposed into a list of subsystems, which we limit to three: FrW, O&G, and Other. FrW refers to all

6
subsurface aquifers containing freshwater. O&G refers to all geologic formations containing oil or gas resources.
For simplicity, freshwater, oil, and gas are assumed to be the only human-valuable subsurface assets.
Accordingly, Other includes all geologic formations that trap the leaked CO2 yet are not classified as freshwater
aquifers or oil and gas reservoirs.
Pathway: refers to the functional subsystem between the Origin and the Endpoint. Physically, this area
encompasses all subsurface formations through which CO2 migrates after leaving an Origin formation until
reaching an Endpoint formation.
Figure 1. Functional subsystems for risk identification
Table 1.Examples of Origin FEPs and their corresponding Indicators
Origin FEP Symbol {𝑂} Indicator Symbol (𝑖)
Caprock high-permeability zones O1 permeability α
Caprock-absent zones O2 size of the opening λ
Caprock fracture due to over-pressurization O3 size of fracture β
Exceeding capillary pressure due to over-pressurization O4 capillary pressure δ
Natural fault or fracture O5 size of fracture β
Induced fault or fracture due to over-pressurization O6 size of fracture β
Induced fault or fracture due to CO2 geochemical reactions O7 size of fracture β
Induced fault or fracture due to seismic activity O8 Size of fracture β
3.2. Bayesian Event Tree for Risk Analysis
For leakage to occur, the CO2 needs to leave an Origin subsystem and enter an Endpoint subsystem. The BET is
an effective way to track the likelihood and impact of the various scenarios of CO2 leakage. An example BET is
shown in Figure 2, followed by a detailed description of its various elements and the procedure to construct it.
The depicted BET and all related figures are purely hypothetical; they aim to demonstrate the concepts outlined
here and provide a roadmap for implementing them.
3.2.1. Probability of CO2 Leakage
For a leakage to occur, three uncertain events must take place sequentially. As explained below, each event is
assigned a probability, and the overall likelihood of a leakage scenario is the product of those probabilities.
Origination {𝑶}(𝒊): refers to the probability of the existence of a specific Origin, which could be an FEP or Safe.
For an FEP, this likelihood may vary with the subsystem’s exact characteristics. Therefore, {𝑂} for an FEP is
expressed a function of an Indicator 𝑖, which is a selected attribute of the analyzed FEP. Indicator attributes
should be chosen to best-match their FEP subsystems. Table 1 presents a suggested attribute for each of the listed
FEP. For instance, {𝑂1}(𝛼) is the probability of existence of a caprock high-permeability zone 𝑂1 and is a
function of permeability 𝛼. In mathematical terms, Origination {𝑂} can be represented as a step-wise function of
Indicator 𝑖, which is discretized over its total feasible range.
FEP 1 FEP 2 FEP 3 … FEP 8
FrW
Safe
O&G Other
Direction
of CO2
Leakage
Endpoint
Pathway
Origin

7
Figure 2. Example Bayesian event tree (BET) for risk analysis of CO2 leakage
8
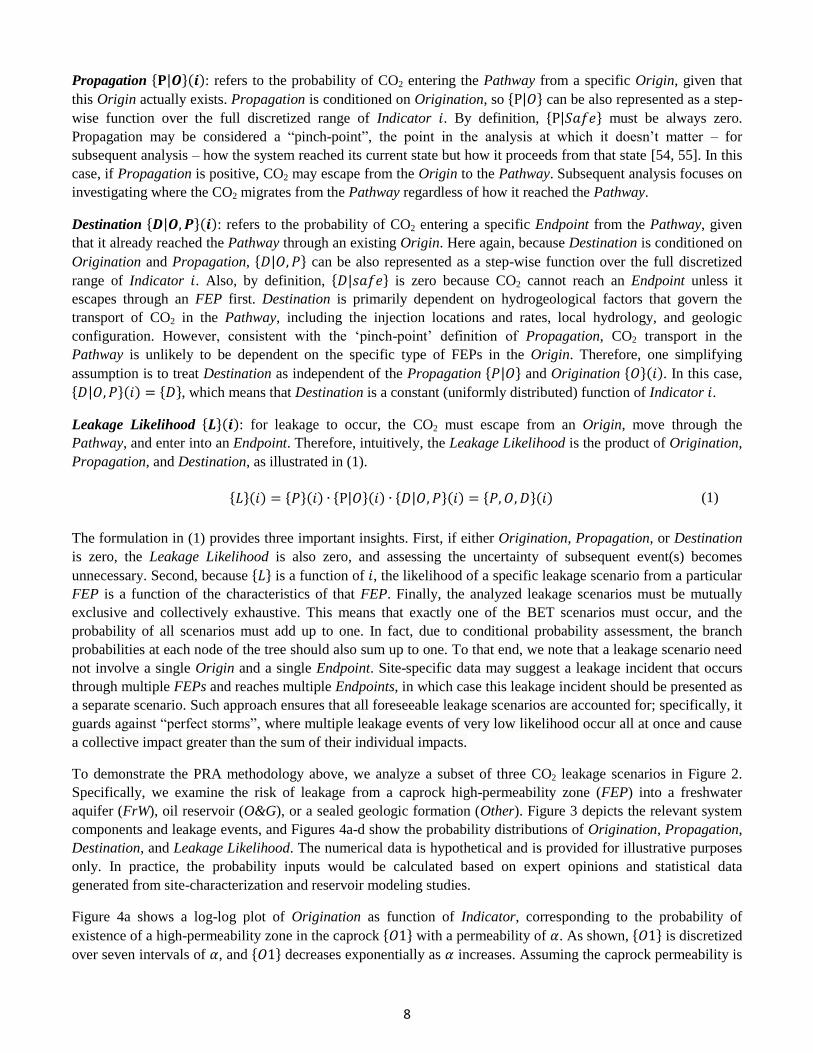
Propagation {𝐏|𝑶}(𝒊): refers to the probability of CO2 entering the Pathway from a specific Origin, given that
this Origin actually exists. Propagation is conditioned on Origination, so {P|𝑂} can be also represented as a step-
wise function over the full discretized range of Indicator 𝑖. By definition, {P|𝑆𝑎𝑓𝑒} must be always zero.
Propagation may be considered a “pinch-point”, the point in the analysis at which it doesn’t matter – for
subsequent analysis – how the system reached its current state but how it proceeds from that state [54, 55]. In this
case, if Propagation is positive, CO2 may escape from the Origin to the Pathway. Subsequent analysis focuses on
investigating where the CO2 migrates from the Pathway regardless of how it reached the Pathway.
Destination {𝑫|𝑶, 𝑷}(𝒊): refers to the probability of CO2 entering a specific Endpoint from the Pathway, given
that it already reached the Pathway through an existing Origin. Here again, because Destination is conditioned on
Origination and Propagation, {𝐷|𝑂, 𝑃} can be also represented as a step-wise function over the full discretized
range of Indicator 𝑖. Also, by definition, {𝐷|𝑠𝑎𝑓𝑒} is zero because CO2 cannot reach an Endpoint unless it
escapes through an FEP first. Destination is primarily dependent on hydrogeological factors that govern the
transport of CO2 in the Pathway, including the injection locations and rates, local hydrology, and geologic
configuration. However, consistent with the ‘pinch-point’ definition of Propagation, CO2 transport in the
Pathway is unlikely to be dependent on the specific type of FEPs in the Origin. Therefore, one simplifying
assumption is to treat Destination as independent of the Propagation {𝑃|𝑂} and Origination {𝑂}(𝑖). In this case,
{𝐷|𝑂, 𝑃}(𝑖) = {𝐷}, which means that Destination is a constant (uniformly distributed) function of Indicator 𝑖.
Leakage Likelihood {𝑳}(𝒊): for leakage to occur, the CO2 must escape from an Origin, move through the
Pathway, and enter into an Endpoint. Therefore, intuitively, the Leakage Likelihood is the product of Origination,
Propagation, and Destination, as illustrated in (1).
{𝐿}(𝑖) = {𝑃}(𝑖) ∙ {P|𝑂}(𝑖) ∙ {𝐷|𝑂, 𝑃}(𝑖) = {𝑃, 𝑂, 𝐷}(𝑖) (1)
The formulation in (1) provides three important insights. First, if either Origination, Propagation, or Destination
is zero, the Leakage Likelihood is also zero, and assessing the uncertainty of subsequent event(s) becomes
unnecessary. Second, because {𝐿} is a function of 𝑖, the likelihood of a specific leakage scenario from a particular
FEP is a function of the characteristics of that FEP. Finally, the analyzed leakage scenarios must be mutually
exclusive and collectively exhaustive. This means that exactly one of the BET scenarios must occur, and the
probability of all scenarios must add up to one. In fact, due to conditional probability assessment, the branch
probabilities at each node of the tree should also sum up to one. To that end, we note that a leakage scenario need
not involve a single Origin and a single Endpoint. Site-specific data may suggest a leakage incident that occurs
through multiple FEPs and reaches multiple Endpoints, in which case this leakage incident should be presented as
a separate scenario. Such approach ensures that all foreseeable leakage scenarios are accounted for; specifically, it
guards against “perfect storms”, where multiple leakage events of very low likelihood occur all at once and cause
a collective impact greater than the sum of their individual impacts.
To demonstrate the PRA methodology above, we analyze a subset of three CO2 leakage scenarios in Figure 2.
Specifically, we examine the risk of leakage from a caprock high-permeability zone (FEP) into a freshwater
aquifer (FrW), oil reservoir (O&G), or a sealed geologic formation (Other). Figure 3 depicts the relevant system
components and leakage events, and Figures 4a-d show the probability distributions of Origination, Propagation,
Destination, and Leakage Likelihood. The numerical data is hypothetical and is provided for illustrative purposes
only. In practice, the probability inputs would be calculated based on expert opinions and statistical data
generated from site-characterization and reservoir modeling studies.
Figure 4a shows a log-log plot of Origination as function of Indicator, corresponding to the probability of
existence of a high-permeability zone in the caprock {𝑂1} with a permeability of 𝛼. As shown, {𝑂1} is discretized
over seven intervals of 𝛼, and {𝑂1} decreases exponentially as 𝛼 increases. Assuming the caprock permeability is

9
0.001 millidarcy (mD), the permeability of a leakage-inducing FEP can only exceed this value, so {𝑂1}(𝛼 <
0.001) is zero. Eventually, we assume that it is highly unlikely to find caprock zone with permeability greater
than 100 mD, so {𝑂1}(𝛼 > 100) is set at 10-5
.
Figure 3. Sketch of CO2 leakage through caprock high-permeability zone
Figure 4. Example probability distributions of CO2 leakage scenarios
CO2
FEP
Pathway
FrW
O&G
Other
Origination
Propagation
Destination
CO2
injection well water well Oil well
1.E-08
1.E-07
1.E-06
1.E-05
1.E-04
1.E-03
1.E-02
1.E-01
1.E+00
0.00010.001 0.01 0.1 1 10 100 1000
{O1
}
α (mD)
1.E-08
1.E-07
1.E-06
1.E-05
1.E-04
1.E-03
1.E-02
1.E-01
1.E+00
0.00010.001 0.01 0.1 1 10 100 1000
{P|O
1}
α (mD)
1.E-08
1.E-07
1.E-06
1.E-05
1.E-04
1.E-03
1.E-02
1.E-01
1.E+00
0.00010.001 0.01 0.1 1 10 100 1000
{D|O
1,P
} =
{D}
α (mD)
FrW
O&G
Other
1.E-08
1.E-07
1.E-06
1.E-05
1.E-04
1.E-03
1.E-02
1.E-01
1.E+00
0.00010.001 0.01 0.1 1 10 100 1000
{L}
= {O
1,P
,D}
α (mD)
O1, FrW
O1, O&G
O1, Other
(a) (b)
(c) (d)

10
Figure 4b is a log-log plot of Propagation {𝑃|𝑂1} as a function of Indicator 𝛼, given that the high-permeability
zone exists. In this case, the likelihood of CO2 leaving through the FEP is very low under the specific
permeability threshold of 𝛼 = 1 mD. However, once this threshold is overcome, {𝑃|𝑂1} increases rapidly until
Propagation becomes almost certain at high permeability. In real life, this threshold could correspond to capillary
entry pressure; as 𝛼 increases, capillary entry pressure decreases until it finally drops below the capillary pressure
at the base of the caprock, at which point CO2 escapes through the high-permeability zone.
Figure 4c is a semi-log plot of Destination as function of Indicator. Consistent with the definition of Propagation
as a “pinch-point”, Destination is assumed to be independent of Origination {𝑂1} and Propagation {𝑃|𝑂1}.
Therefore, {𝐷|𝑂1, 𝑃} is equal to {𝐷}, which is constant across the whole feasible range of 𝛼, and the values of {𝐷}
for FrW, O&G, and Other add up to 1.
Multiplying each probability distribution function in Figure 4c by those in Figures 4a and 4b results in three
Leakage Likelihood profiles as a function of 𝛼, corresponding to the three leakage trajectories. Figure 4d shows a
log-log plot of the three {𝐿}(𝛼) profiles. As can be noticed, Leakage seems to be less likely at both very high and
very low permeability. This observation can be attributed to two conflicting factors: low Propagation but high
Origination at low permeability and low Origination but high Propagation at high permeability.
3.2.2. Value of CO2 Leakage
Value models are functions that aim to quantify the consequences of potential CO2 leakage incidents. As
explained in existing literature, these consequences may be characterized in different metrics and might span a
wide spectrum of social, environmental, economic, and public-safety issues [56, 57]. In this study, we suggest
three value models to complement the aforementioned probabilistic assessment.
Value of Flow – 𝑽𝑭(𝒊): quantifies the amount of the leaked CO2 into each Endpoint subsystem, which can be
expressed as a mass flux, mass flowrate, or total mass during a specific period of time. While site-specific, VF is
usually correlated to Indicator. This correlation can be derived from characterizing or simulating fluid-flow in the
analyzed subsurface, regardless of the leakage likelihoods. Because the flow of leaked CO2 is measurable, VF
offers a direct way to quantify the consequences of leakage.
At a particular Endpoint, higher VF signifies more severe consequences of leakage. However, a leakage of a
specific VF may lead to different consequences in different Endpoints. Therefore, while useful for characterizing
the consequences of CO2 leakage at individual Endpoints, VF cannot be used for consistent comparison of the
consequences of leakage across multiple Endpoints. Important for risk assessment and contingency planning,
performing such comparison requires translating VF into monetary terms, whose significance is the same across
all leakage scenarios; proper valuation renders a U.S. dollar spent on controlling leakage into FrW equivalent to a
U.S. dollar spent on controlling leakage into O&G. Relying on concepts and tools in decision analysis and natural
resources economics, it is possible to express the various social, environmental, economic, and safety
consequences of CO2 leakage in one monetary metric [58, 59, 60, 61]. To that end, we propose two monetary
value models that quantify the consequences of CO2 leakage in the subsurface and on the surface.
Value of Damage in the Subsurface – 𝑽𝑫𝒔𝒖𝒃(𝒊): corresponds to the cost of any leakage-induced damages to the
subsurface resources. While directly dependent on VF and therefore on Indicator, separate 𝑉𝐷𝑠𝑢𝑏 models can be
designed for FrW, O&G, and Other, influenced by regulatory requirements. For FrW, 𝑉𝐷𝑠𝑢𝑏 might be a function
of several parameters, including water pH, hardness, and salination, as well as the concentration of any trace
metals or oil and gas contaminants carried in the leaked CO2 stream [38, 57, 62]. For O&G, 𝑉𝐷𝑠𝑢𝑏 may be a
function of the quantity and quality of recovery from producing and future reservoirs, both of which may
deteriorate with CO2 leakage. Finally, since Other subsystems are assumed to have no valuable assets, their
corresponding 𝑉𝐷𝑠𝑢𝑏 may be limited to a non-compliance penalty imposed by the regulatory agency.

11
Value of Damage on the Surface – 𝑽𝑫𝒔𝒖𝒓(𝒊): corresponds to the cost of any leakage-induced damages to the
surface resources, including environmental and ecological systems and human structures, activities, and health
[56]. In other words, this model accounts for the costs of any surface damages or harms caused by diminishing the
utility of the subsurface resources. Intuitively, the higher the dependence of ecological and human systems on
underground natural resources, the higher their vulnerability to CO2 leakage, and thus the higher the 𝑉𝐷𝑠𝑢𝑟.
Similar to 𝑉𝐷𝑠𝑢𝑏, distinct 𝑉𝐷𝑠𝑢𝑟 models can be designed for FrW, O&G, and Other, and all 𝑉𝐶𝑠𝑢𝑟 models remain
dependent on VF and thus on Indicator. Examples of factors that can be accounted for in designing 𝑉𝐶𝑠𝑢𝑟 models
include the size of human population, per-capita annual income, size of agricultural activities, and number of
natural habitats and ecological species that depend on the freshwater aquifers where CO2 might leak [56, 57].
Leakage Value of Impact – 𝑽𝑰(𝒊): corresponds to the sum of 𝑉𝐷𝑠𝑢𝑏 and 𝑉𝐷𝑠𝑢𝑟, which allows expressing all
consequences of CO2 leakage in one monetary metric. Consistent with the formulation of both damage values, VI
is a function of VF and thus Indicator 𝑖, as illustrated in (2). Intuitively, a higher leakage rate (VF) leads to higher
contamination of subsurface resources (𝑉𝐷𝑠𝑢𝑏) and therefore higher disutility of these resources on the surface
(𝑉𝐷𝑠𝑢𝑟). In addition, to facilitate their representation in a BET (Figure 2), all value models are discretized over
the same ranges of Indicator 𝑖 used to discretize the conditional probabilities of leakage.
𝑉𝐼(𝑖) = 𝑉𝐷𝑠𝑢𝑏(𝑖) + 𝑉𝐷𝑠𝑢𝑟(𝑖) = 𝑉𝐷𝑠𝑢𝑏(𝑉𝐹) + 𝑉𝐷𝑠𝑢𝑟(𝑉𝐹) (2)
To complete the risk analysis for the earlier example of CO2 leakage from a high-permeability caprock zone, we
design hypothetical value models for leakage into each of the three Destination subsystems: FrW, O&G, and
Other. Assuming single-phase flow through the high-permeability zone, VF is set to be proportional to the
Indicator 𝛼, as illustrated in Figure 5a. In this example, we assume that, based on geologic data, the leakage
fluxes into FrW, O&G, and Other are comparable.
Subsequently, the VF models are translated to VI models, measured in (arbitrary) monetary terms and dependent
on Indicator 𝛼, as shown in Figure 5b. We assume a high VI for FrW; the leaked CO2 alters the aquifer’s pH and
contaminates it with trace metals (high 𝑉𝐷𝑠𝑢𝑏), and the aquifer is the primary source of freshwater for a large
town with a predominantly agricultural economy (high 𝑉𝐷𝑠𝑢𝑏). On the other hand, the VI for O&G is low; the oil
reservoir is depleting, so the leaked CO2 does not alter the quantity or quality of oil recovery (low 𝑉𝐷𝑠𝑢𝑏), and oil
revenues form a small part of the town’s income (low 𝑉𝐷𝑠𝑢𝑟). In both cases, VI is assumed to increase
proportionally with VF until it reaches a maximum, corresponding to a worst-case scenario. Also, we assume that
the regulatory agency penalizes the operating party for CO2 leakage into the Other zone. The penalty is fixed and
independent of VF and thus Indicator 𝛼. Finally, both VF and VI are discretized over the same seven intervals of
𝛼 used to discretize leakage probabilities.
Figure 5. Example value models of CO2 leakage scenarios
1.E-08
1.E-07
1.E-06
1.E-05
1.E-04
1.E-03
1.E-02
1.E-01
1.E+00
0.0001 0.001 0.01 0.1 1 10 100 1000
VF
(kg
/m2
.s)
α (mD)
O1, FrW
O1, O&G
O1, Other
1.E-03
1.E-02
1.E-01
1.E+00
1.E+01
1.E+02
1.E+03
1.E+04
1.E+05
0.0001 0.001 0.01 0.1 1 10 100 1000
VI (
mo
net
ary
valu
e)
α (mD)
O1, FrW
O1, O&G
O1, Other
(a) (b)
12
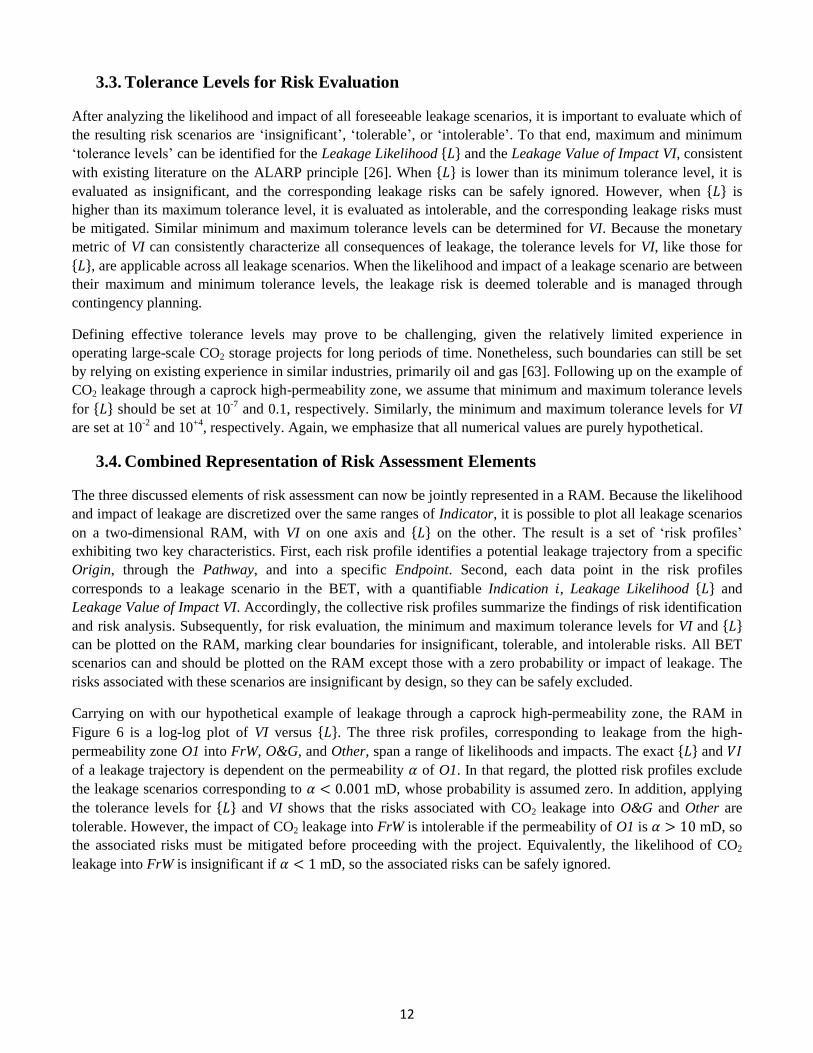
3.3. Tolerance Levels for Risk Evaluation
After analyzing the likelihood and impact of all foreseeable leakage scenarios, it is important to evaluate which of
the resulting risk scenarios are ‘insignificant’, ‘tolerable’, or ‘intolerable’. To that end, maximum and minimum
‘tolerance levels’ can be identified for the Leakage Likelihood {𝐿} and the Leakage Value of Impact VI, consistent
with existing literature on the ALARP principle [26]. When {𝐿} is lower than its minimum tolerance level, it is
evaluated as insignificant, and the corresponding leakage risks can be safely ignored. However, when {𝐿} is
higher than its maximum tolerance level, it is evaluated as intolerable, and the corresponding leakage risks must
be mitigated. Similar minimum and maximum tolerance levels can be determined for VI. Because the monetary
metric of VI can consistently characterize all consequences of leakage, the tolerance levels for VI, like those for
{𝐿}, are applicable across all leakage scenarios. When the likelihood and impact of a leakage scenario are between
their maximum and minimum tolerance levels, the leakage risk is deemed tolerable and is managed through
contingency planning.
Defining effective tolerance levels may prove to be challenging, given the relatively limited experience in
operating large-scale CO2 storage projects for long periods of time. Nonetheless, such boundaries can still be set
by relying on existing experience in similar industries, primarily oil and gas [63]. Following up on the example of
CO2 leakage through a caprock high-permeability zone, we assume that minimum and maximum tolerance levels
for {𝐿} should be set at 10-7
and 0.1, respectively. Similarly, the minimum and maximum tolerance levels for VI
are set at 10-2
and 10+4
, respectively. Again, we emphasize that all numerical values are purely hypothetical.
3.4. Combined Representation of Risk Assessment Elements
The three discussed elements of risk assessment can now be jointly represented in a RAM. Because the likelihood
and impact of leakage are discretized over the same ranges of Indicator, it is possible to plot all leakage scenarios
on a two-dimensional RAM, with VI on one axis and {𝐿} on the other. The result is a set of ‘risk profiles’
exhibiting two key characteristics. First, each risk profile identifies a potential leakage trajectory from a specific
Origin, through the Pathway, and into a specific Endpoint. Second, each data point in the risk profiles
corresponds to a leakage scenario in the BET, with a quantifiable Indication 𝑖, Leakage Likelihood {𝐿} and
Leakage Value of Impact VI. Accordingly, the collective risk profiles summarize the findings of risk identification
and risk analysis. Subsequently, for risk evaluation, the minimum and maximum tolerance levels for VI and {𝐿}
can be plotted on the RAM, marking clear boundaries for insignificant, tolerable, and intolerable risks. All BET
scenarios can and should be plotted on the RAM except those with a zero probability or impact of leakage. The
risks associated with these scenarios are insignificant by design, so they can be safely excluded.
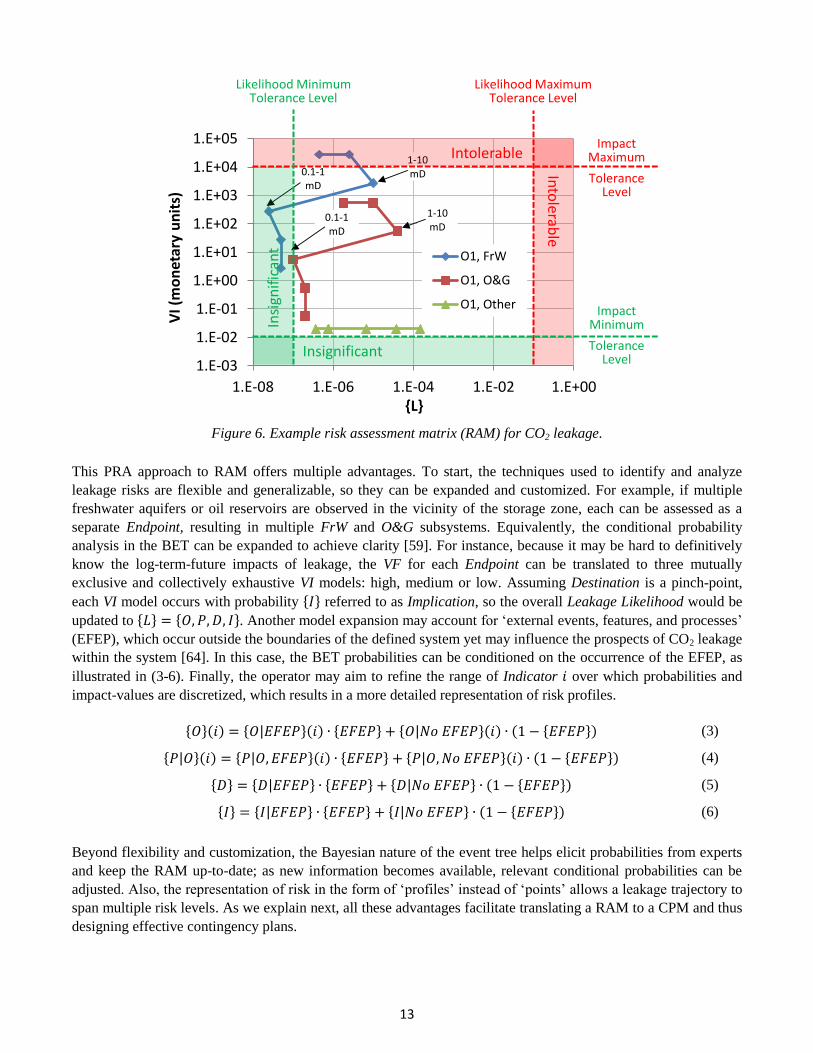
Carrying on with our hypothetical example of leakage through a caprock high-permeability zone, the RAM in
Figure 6 is a log-log plot of VI versus {𝐿}. The three risk profiles, corresponding to leakage from the high-
permeability zone O1 into FrW, O&G, and Other, span a range of likelihoods and impacts. The exact {𝐿} and 𝑉𝐼
of a leakage trajectory is dependent on the permeability 𝛼 of O1. In that regard, the plotted risk profiles exclude
the leakage scenarios corresponding to 𝛼 < 0.001 mD, whose probability is assumed zero. In addition, applying
the tolerance levels for {𝐿} and VI shows that the risks associated with CO2 leakage into O&G and Other are
tolerable. However, the impact of CO2 leakage into FrW is intolerable if the permeability of O1 is 𝛼 > 10 mD, so
the associated risks must be mitigated before proceeding with the project. Equivalently, the likelihood of CO2
leakage into FrW is insignificant if 𝛼 < 1 mD, so the associated risks can be safely ignored.
13
Figure 6. Example risk assessment matrix (RAM) for CO2 leakage.
This PRA approach to RAM offers multiple advantages. To start, the techniques used to identify and analyze
leakage risks are flexible and generalizable, so they can be expanded and customized. For example, if multiple
freshwater aquifers or oil reservoirs are observed in the vicinity of the storage zone, each can be assessed as a
separate Endpoint, resulting in multiple FrW and O&G subsystems. Equivalently, the conditional probability
analysis in the BET can be expanded to achieve clarity [59]. For instance, because it may be hard to definitively
know the log-term-future impacts of leakage, the VF for each Endpoint can be translated to three mutually
exclusive and collectively exhaustive VI models: high, medium or low. Assuming Destination is a pinch-point,
each VI model occurs with probability {𝐼} referred to as Implication, so the overall Leakage Likelihood would be
updated to {𝐿} = {𝑂, 𝑃, 𝐷, 𝐼}. Another model expansion may account for ‘external events, features, and processes’
(EFEP), which occur outside the boundaries of the defined system yet may influence the prospects of CO2 leakage
within the system [64]. In this case, the BET probabilities can be conditioned on the occurrence of the EFEP, as
illustrated in (3-6). Finally, the operator may aim to refine the range of Indicator 𝑖 over which probabilities and
impact-values are discretized, which results in a more detailed representation of risk profiles.
{𝑂}(𝑖) = {𝑂|𝐸𝐹𝐸𝑃}(𝑖) ∙ {𝐸𝐹𝐸𝑃} + {𝑂|𝑁𝑜 𝐸𝐹𝐸𝑃}(𝑖) ∙ (1 − {𝐸𝐹𝐸𝑃}) (3)
{𝑃|𝑂}(𝑖) = {𝑃|𝑂, 𝐸𝐹𝐸𝑃}(𝑖) ∙ {𝐸𝐹𝐸𝑃} + {𝑃|𝑂, 𝑁𝑜 𝐸𝐹𝐸𝑃}(𝑖) ∙ (1 − {𝐸𝐹𝐸𝑃}) (4)
{𝐷} = {𝐷|𝐸𝐹𝐸𝑃} ∙ {𝐸𝐹𝐸𝑃} + {𝐷|𝑁𝑜 𝐸𝐹𝐸𝑃} ∙ (1 − {𝐸𝐹𝐸𝑃}) (5)
{𝐼} = {𝐼|𝐸𝐹𝐸𝑃} ∙ {𝐸𝐹𝐸𝑃} + {𝐼|𝑁𝑜 𝐸𝐹𝐸𝑃} ∙ (1 − {𝐸𝐹𝐸𝑃}) (6)
Beyond flexibility and customization, the Bayesian nature of the event tree helps elicit probabilities from experts
and keep the RAM up-to-date; as new information becomes available, relevant conditional probabilities can be
adjusted. Also, the representation of risk in the form of ‘profiles’ instead of ‘points’ allows a leakage trajectory to
span multiple risk levels. As we explain next, all these advantages facilitate translating a RAM to a CPM and thus
designing effective contingency plans.
1.E-03
1.E-02
1.E-01
1.E+00
1.E+01
1.E+02
1.E+03
1.E+04
1.E+05
1.E-08 1.E-06 1.E-04 1.E-02 1.E+00
VI (
mo
net
ary
un
its)
{L}
O1, FrW
O1, O&G
O1, Other
0.1-1 mD
1-10 mD
1-10 mD
0.1-1 mD
ImpactMaximum
Tolerance Level
Impact Minimum
Tolerance Level
Likelihood MaximumTolerance Level
Likelihood Minimum Tolerance Level
Intolerable
Into
lerab
le
Insignificant
Insi
gnif
ican
t
14
4. Translating the Risk Assessment Matrix to a Contingency Planning Matrix
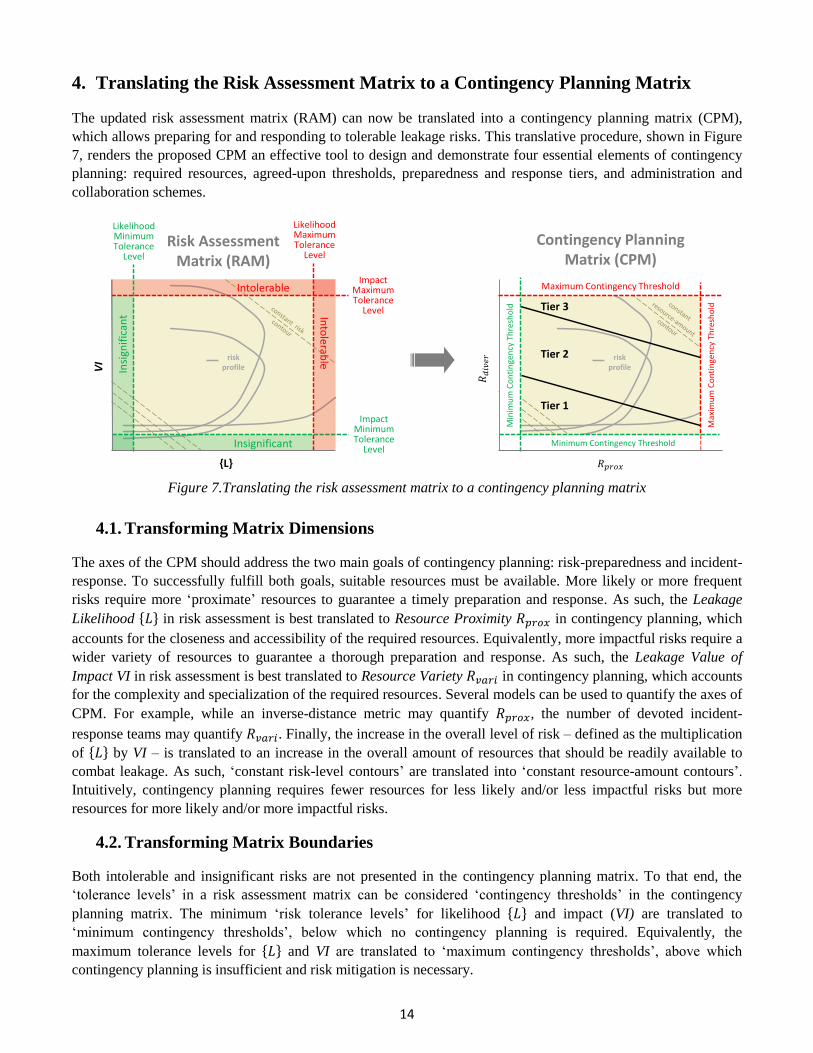
The updated risk assessment matrix (RAM) can now be translated into a contingency planning matrix (CPM),
which allows preparing for and responding to tolerable leakage risks. This translative procedure, shown in Figure
7, renders the proposed CPM an effective tool to design and demonstrate four essential elements of contingency
planning: required resources, agreed-upon thresholds, preparedness and response tiers, and administration and
collaboration schemes.
Figure 7.Translating the risk assessment matrix to a contingency planning matrix
4.1. Transforming Matrix Dimensions
The axes of the CPM should address the two main goals of contingency planning: risk-preparedness and incident-
response. To successfully fulfill both goals, suitable resources must be available. More likely or more frequent
risks require more ‘proximate’ resources to guarantee a timely preparation and response. As such, the Leakage
Likelihood {𝐿} in risk assessment is best translated to Resource Proximity 𝑅𝑝𝑟𝑜𝑥 in contingency planning, which
accounts for the closeness and accessibility of the required resources. Equivalently, more impactful risks require a
wider variety of resources to guarantee a thorough preparation and response. As such, the Leakage Value of
Impact VI in risk assessment is best translated to Resource Variety 𝑅𝑣𝑎𝑟𝑖 in contingency planning, which accounts
for the complexity and specialization of the required resources. Several models can be used to quantify the axes of
CPM. For example, while an inverse-distance metric may quantify 𝑅𝑝𝑟𝑜𝑥, the number of devoted incident-
response teams may quantify 𝑅𝑣𝑎𝑟𝑖. Finally, the increase in the overall level of risk – defined as the multiplication
of {𝐿} by VI – is translated to an increase in the overall amount of resources that should be readily available to
combat leakage. As such, ‘constant risk-level contours’ are translated into ‘constant resource-amount contours’.
Intuitively, contingency planning requires fewer resources for less likely and/or less impactful risks but more
resources for more likely and/or more impactful risks.
4.2. Transforming Matrix Boundaries
Both intolerable and insignificant risks are not presented in the contingency planning matrix. To that end, the
‘tolerance levels’ in a risk assessment matrix can be considered ‘contingency thresholds’ in the contingency
planning matrix. The minimum ‘risk tolerance levels’ for likelihood {𝐿} and impact (VI) are translated to
‘minimum contingency thresholds’, below which no contingency planning is required. Equivalently, the
maximum tolerance levels for {𝐿} and VI are translated to ‘maximum contingency thresholds’, above which
contingency planning is insufficient and risk mitigation is necessary.
VI
{L}
VI
{L}
Likelihood Minimum Tolerance
Level
Likelihood MaximumTolerance
Level
ImpactMaximumTolerance
Level
Impact MinimumTolerance
Level
Max
imu
mC
on
tin
gen
cy T
hre
sho
ld
Risk Assessment Matrix (RAM)
Contingency Planning Matrix (CPM)
Tier 3
Tier 2
Tier 1
risk profileIn
sign
ific
ant
Insignificant
Intolerable
Into
lerable risk
profile
Min
imu
m C
on
tin
gen
cy T
hre
sho
ld
Minimum Contingency Threshold
Maximum Contingency Threshold

15
4.3. Classifying Risk into Tiers
Because not all tolerable risks are equal in likelihood or impact, distinct ‘tiers’ of risk-preparedness and incident-
response must be defined to address different tolerable risks with different requirements for resources proximity
and variety. This study adopts a three-tier system for preparedness and response.
4.3.1. Scope of the Three-Tier System
The three-tier system is borrowed from the oil and gas industry where it has been extensively implemented [35,
65, 66, 67]. Table 3 lists three main criteria to properly assign a tolerable leakage risk to one of the three tiers: the
‘geographic location’ of the leakage scenario and any resulting response operations, the ‘governance structure’
among all parties involved in leakage preparedness and response, and the proximity and variety of available
‘resources’. These tiers are discussed in more detail when presenting a model contingency plan later (Section 5).
Table 2. Selection criteria for the three-tier system
Criteria Tier 1 Tier 2 Tier 3
Geographic
location operations site local vicinity of operations site regional vicinity of operations site
Governance
structure
operating party and
its contractors,
regulatory agency
operating party and
its contractors,
regulatory agency,
local stakeholders
operating party and
its contractors,
regulatory agency,
local stakeholders,
regional stakeholders
Resources
proximity and
variety
accessible at the
operations site,
least complex,
least specialized
accessible within the local
vicinity of the operations site,
moderately complex,
moderately specialized
accessible within the regional
vicinity of the operations site,
most complex,
most specialized
According to these criteria, Tier 1 is under the direct control of the party operating the storage site and its
contractors, and it addresses onsite risks that can be handled through standard low-complexity and low-
specialization resources. Tier 2 expands the scope of covered risks to include those that might affect local
communities around the operation site, might require the support and intervention of local communities and
governmental authorities, or might necessitate the deployment of more complex or specialized resources. Finally,
Tier 3 includes the most risky leakage scenarios whose effects might extend on the regional level, requiring the
support and intervention of regional authorities, or necessitating the deployment of extensive, highly complex,
and highly specialized resources. In this regard, “regional” in this analysis may refer to district-level, national-
level, or multinational-level geographic zones; the exact definition of “regional” depends on the scale and
conditions of the CO2 storage reservoir and is thus project-specific.
4.3.2. Representation of the Three-Tier System
As can be noticed in Figure 7, the three contingency planning tiers cover all tolerable risks. Tier 1 prepares for
risks and responds to incidents that require the smallest 𝑅𝑣𝑎𝑟𝑖 while Tier 3 prepares for risks and responds to
incidents that require the largest 𝑅𝑣𝑎𝑟𝑖.
The range of 𝑅𝑣𝑎𝑟𝑖 covered by Tier 1 shrinks as 𝑅𝑝𝑟𝑜𝑥 increases. Tier 1 is primarily under the control of the
operating party and is limited to preparedness and response activities within the operation site, so the amount of
resources available under this tier is relatively limited. Accordingly, as shown in Figure 8, Tier 1 covers less
various but more proximate resources relative to constant resource-amount contours. In other words, the closer the
required resources need to be located to effectively address a leakage, the less complex and specialized they
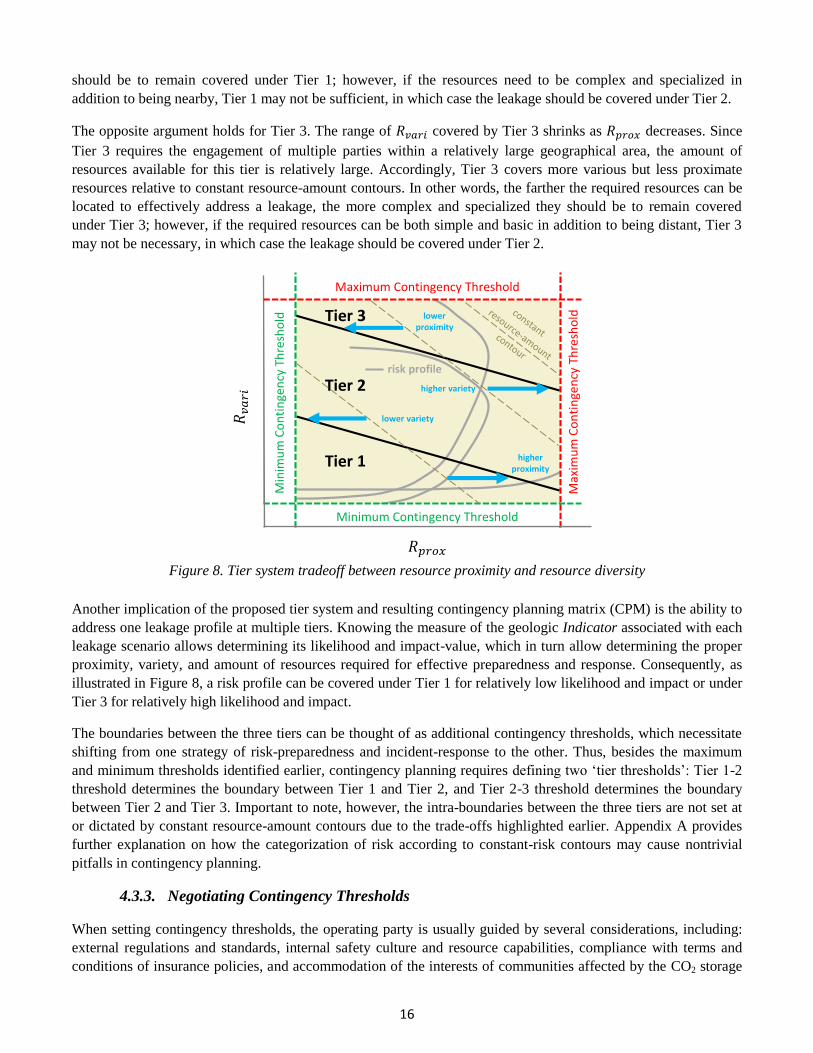
16
should be to remain covered under Tier 1; however, if the resources need to be complex and specialized in
addition to being nearby, Tier 1 may not be sufficient, in which case the leakage should be covered under Tier 2.
The opposite argument holds for Tier 3. The range of 𝑅𝑣𝑎𝑟𝑖 covered by Tier 3 shrinks as 𝑅𝑝𝑟𝑜𝑥 decreases. Since
Tier 3 requires the engagement of multiple parties within a relatively large geographical area, the amount of
resources available for this tier is relatively large. Accordingly, Tier 3 covers more various but less proximate
resources relative to constant resource-amount contours. In other words, the farther the required resources can be
located to effectively address a leakage, the more complex and specialized they should be to remain covered
under Tier 3; however, if the required resources can be both simple and basic in addition to being distant, Tier 3
may not be necessary, in which case the leakage should be covered under Tier 2.
Figure 8. Tier system tradeoff between resource proximity and resource diversity
Another implication of the proposed tier system and resulting contingency planning matrix (CPM) is the ability to
address one leakage profile at multiple tiers. Knowing the measure of the geologic Indicator associated with each
leakage scenario allows determining its likelihood and impact-value, which in turn allow determining the proper
proximity, variety, and amount of resources required for effective preparedness and response. Consequently, as
illustrated in Figure 8, a risk profile can be covered under Tier 1 for relatively low likelihood and impact or under
Tier 3 for relatively high likelihood and impact.
The boundaries between the three tiers can be thought of as additional contingency thresholds, which necessitate
shifting from one strategy of risk-preparedness and incident-response to the other. Thus, besides the maximum
and minimum thresholds identified earlier, contingency planning requires defining two ‘tier thresholds’: Tier 1-2
threshold determines the boundary between Tier 1 and Tier 2, and Tier 2-3 threshold determines the boundary
between Tier 2 and Tier 3. Important to note, however, the intra-boundaries between the three tiers are not set at
or dictated by constant resource-amount contours due to the trade-offs highlighted earlier. Appendix A provides
further explanation on how the categorization of risk according to constant-risk contours may cause nontrivial
pitfalls in contingency planning.
4.3.3. Negotiating Contingency Thresholds
When setting contingency thresholds, the operating party is usually guided by several considerations, including:
external regulations and standards, internal safety culture and resource capabilities, compliance with terms and
conditions of insurance policies, and accommodation of the interests of communities affected by the CO2 storage
VI
{L}
Maximum Contingency Threshold
Tier 3
Tier 2
Tier 1
risk profile
lower variety
higher proximity
Min
imu
m C
on
tin
gen
cy T
hre
sho
ld
Minimum Contingency Threshold
Max
imu
mC
on
tin
gen
cy T
hre
sho
ldlower proximity
higher variety

17
project. To that end, the exact specification of minimum, maximum, and tier thresholds are usually negotiated
through a collaborative effort between the operating party and multiple stakeholders.
To start, although formal minimum and maximum contingency thresholds may be dictated by regulations or
industrial standards, their implementation is usually shaped by the administrative procedures and protocols of the
legally liable party managing the CO2 storage site. To that end, the actual enforcement of these thresholds requires
clear and effective communication. The operating party has to demonstrate its ability to reduce intolerable risks
below mandated maximum contingency thresholds through insurance, safety measures, and system reinforcement.
If the operating party fails to demonstrate such capability, the regulatory agency may not permit the project.
Alternatively, the operating party may find it beneficial to adopt stricter thresholds than those dictated by
regulations. For example, insurance rates may be lower if the project deploys more frequent monitoring or more
accurate measurement tools than what is legally required. In this case, the adopted minimum and maximum
thresholds would depend on the operating party’s safety culture and resource capabilities: trading more aggressive
risk mitigation for less aggressive contingency planning, or vice versa. The regulatory agency would still need to
be consulted on such trade-offs.
Equivalently, local, national, or international laws influence how the operating party sets the boundaries between
the three contingency tiers. For example, the operating party may be legally required to notify local authorities
about small leakage incidents while giving regional authorities the right to unilaterally and directly intervene in
the case of large leakage incidents [21]. In this case, the regulatory agency would argue for keeping small leakage
incidents within Tier 1 while necessitating Tier 2 (and potentially Tier 3) for large leakage incidents. In addition,
the operating party may be legally required to engage with several stakeholders on the CO2 storage project,
including local communities and specialized emergency-response contractors. Those relationships shape the
operating party’s own preferences on how to categorize risks into different tiers. For example, upon contracting
with an international incident-response firm, a small operating company might have access to a large pool of
resources scattered around the world. In this case, the operating party would be inclined to allocate fewer risks
under Tier 1 and more risks under Tier 2 and Tier 3. Alternatively, the operating company might already have
large inventory of emergency-response equipment, guided by its established safety procedures and long history of
international operations. In this case, the operating party would be inclined to allocate more risks under Tier 1 and
fewer risks under Tier 2 and Tier 3.
5. A Model Contingency Plan
The proposed RAM and CPM are essential building-blocks in the construction of an effective and comprehensive
contingency plan. To demonstrate their role, we present an overview of the basic elements of a model contingency
plan for CO2 leakage through geologic pathways, illustrated in the exhibit “Outline of a Model Contingency
Plan.” Although the model plan should include four major sections, we devote our attention to the design of the
contingency tiers in the third section, where the various elements of RAM and CPM are mostly relevant.
Accordingly, while this paper proceeds with a detailed discussion of the elements of the contingency tiers in the
proposed model contingency plan, a brief description of the remaining three major sections of the plan is included
in the referenced exhibit.
5.1. Tiers of Risk-Preparedness and Incident-Response
5.1.1. Thresholds
As explained in the derivation of the proposed CPM, a total of six thresholds should be identified in a contingency
plan: two minimum contingency thresholds corresponding to minimum tolerance levels of risk likelihood and
impact; two maximum contingency thresholds corresponding to maximum tolerance levels of risk likelihood and

18
impact; Tier 1-2 threshold bordering between Tier 1 and Tier 2; and Tier 2-3 threshold bordering between Tier 2
and Tier 3.
5.1.2. Leakage Evaluation
Two types of leakage assessment frameworks are important to establish: one for risk-preparedness and one for
incident-response. Each framework should include a checklist to characterize the leakage and categorize it under
one of the three contingency tiers.
Directory
Introduction
Tiers of Risk-Preparedness and Incident-Response
Documentation
This section defines the purpose, scope, and relevance of the contingency plan [33]. This section should also introduce the party in-charge of designing and
updating the contingency plan document; such party may be the site-operating firm, a specific team within that firm, or a contracted team by that firm.
• ScopeA comprehensive contingency plan should cover risks associated with surface (e.g. well blowouts) and subsurface releases, through both man-made and
geologic pathways. Accordingly, in this analysis of subsurface leakage through geologic pathways only, this section should list: all possible Origins, Endpoints,
and Pathways, the surface location of Origins; and the location of major human structures (e.g. cities) and ecosystems (e.g. vulnerable habitats) at and in the
vicinity of the storage site. The use of terrestrial maps is important.
• Purpose and ObjectiveThis section defines the roles of the staff members and contractors and the procedures they should follow to prepare for risks and respond to incidents of CO2
leakage from [name] geologic storage reservoir through, in this case, geologic pathways. This section should also outline the objectives of the contingency plan,
which may include: ensuring that preparedness and response are consistent with industrial practices and in compliance with regulatory standards; ensuring a full
and effective integration and utilization of industry and government resources when needed; and prioritizing corrective-actions.
• PrioritiesThis section summarizes the main priorities of the contingency plan, which may include: securing human safety during incident-response; minimizing the
impact of leakage on human health the environment; minimizing the damage to equipment and assets used in incident-response; minimizing the likelihood of
leakage through adequate management of resources; or minimizing disruption to CO2 storage activities.
• Legal and Regulatory ComplianceThis section enlists all relevant governmental requirements, regulations, and laws; industrial standards and protocols; as well as international laws and treaties
with which the contingency plan complies. This section may also include a list of the required reporting to external stakeholders if a leakage incident occurs.
• Plan IntegrationThis section enlists other contingency plans and safety protocols by relevant internal and external stakeholders that complement the contingency plan of
concern, including: health, safety, and environment (HS&E) policies, standards, and guidelines enforced at the storage site by the operating party or its
contractors; governmental plans covering emergency response and relief (e.g. city or county emergency response plans); and industrial plans governing private
service centers for emergency response and relief (e.g. Clean Caribbean and Americas [68], Oil Spill Response and East Asia Response Limited [69]).
A directory is the first section any holder of the contingency plan should have access to in order to reach all decision-making stakeholders. The directory lists
the contact information of people that are directly involved in risk-preparedness and incident-response, including personnel from the operating company,
contractors, regulatory agency, local and regional governmental authorities, and community representatives.
• Thresholds
• Leakage Evaluation
• Response Initiation
• Response Strategies
• General Operations
• Specific Operations: Corrective Measures
• Human and Equipment Resources
• Administration and Coordination
The contingency plan should be a living document, updated as the project progresses from planning operation, and periodically thereafter as more is learned
about the performance of the storage site. To that end, the information included in the contingency plan should be reviewed regularly to incorporate any
changes in risk assessment methods, tier-based preparedness and response procedures, resources inventories and allocation, training and maintenance schedules,
or personnel directory. The operating party should maintain a detailed record of previous leakage incidents, response measures, best practices, and lessons
learned, and it should update the incident-response procedures based on the new information gained from those incidents. In addition, the operating party is
responsible for making the contingency plan available to all relevant internal departments and external stakeholders.
Outline of a Model Contingency Plan
19
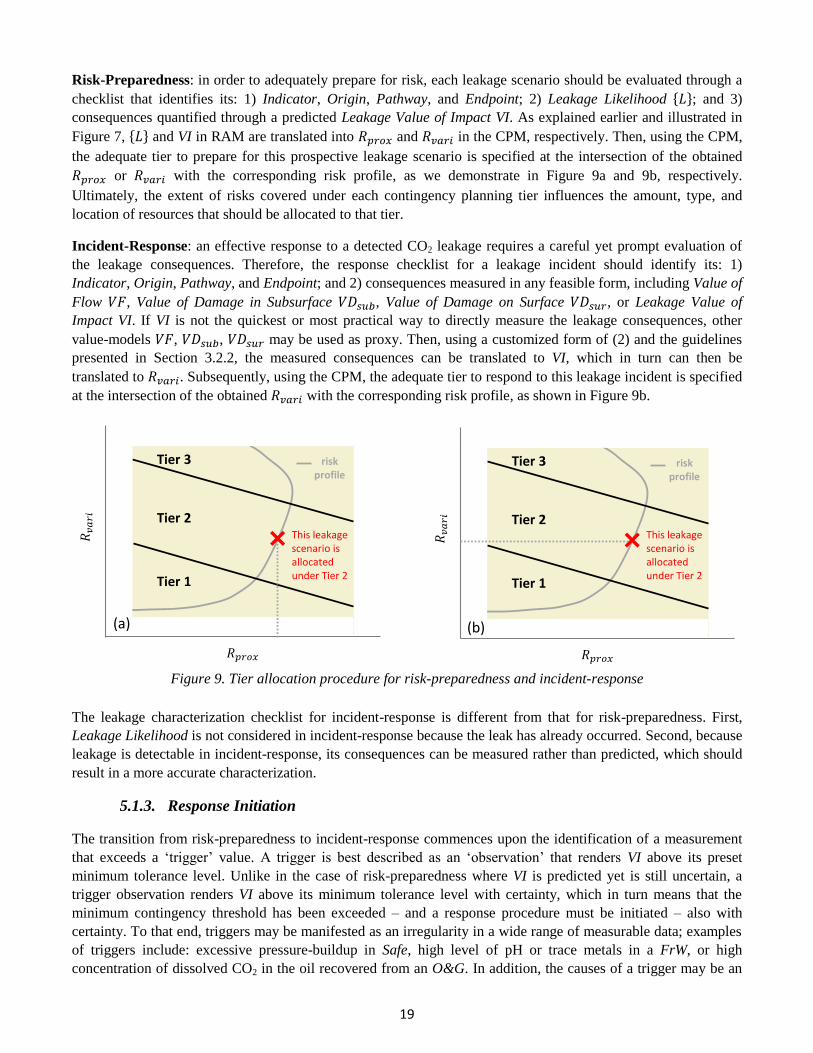
Risk-Preparedness: in order to adequately prepare for risk, each leakage scenario should be evaluated through a
checklist that identifies its: 1) Indicator, Origin, Pathway, and Endpoint; 2) Leakage Likelihood {𝐿}; and 3)
consequences quantified through a predicted Leakage Value of Impact VI. As explained earlier and illustrated in
Figure 7, {𝐿} and VI in RAM are translated into 𝑅𝑝𝑟𝑜𝑥 and 𝑅𝑣𝑎𝑟𝑖 in the CPM, respectively. Then, using the CPM,
the adequate tier to prepare for this prospective leakage scenario is specified at the intersection of the obtained
𝑅𝑝𝑟𝑜𝑥 or 𝑅𝑣𝑎𝑟𝑖 with the corresponding risk profile, as we demonstrate in Figure 9a and 9b, respectively.
Ultimately, the extent of risks covered under each contingency planning tier influences the amount, type, and
location of resources that should be allocated to that tier.
Incident-Response: an effective response to a detected CO2 leakage requires a careful yet prompt evaluation of
the leakage consequences. Therefore, the response checklist for a leakage incident should identify its: 1)
Indicator, Origin, Pathway, and Endpoint; and 2) consequences measured in any feasible form, including Value of
Flow 𝑉𝐹, Value of Damage in Subsurface 𝑉𝐷𝑠𝑢𝑏, Value of Damage on Surface 𝑉𝐷𝑠𝑢𝑟, or Leakage Value of
Impact VI. If VI is not the quickest or most practical way to directly measure the leakage consequences, other
value-models 𝑉𝐹, 𝑉𝐷𝑠𝑢𝑏, 𝑉𝐷𝑠𝑢𝑟 may be used as proxy. Then, using a customized form of (2) and the guidelines
presented in Section 3.2.2, the measured consequences can be translated to VI, which in turn can then be
translated to 𝑅𝑣𝑎𝑟𝑖. Subsequently, using the CPM, the adequate tier to respond to this leakage incident is specified
at the intersection of the obtained 𝑅𝑣𝑎𝑟𝑖 with the corresponding risk profile, as shown in Figure 9b.
Figure 9. Tier allocation procedure for risk-preparedness and incident-response
The leakage characterization checklist for incident-response is different from that for risk-preparedness. First,
Leakage Likelihood is not considered in incident-response because the leak has already occurred. Second, because
leakage is detectable in incident-response, its consequences can be measured rather than predicted, which should
result in a more accurate characterization.
5.1.3. Response Initiation
The transition from risk-preparedness to incident-response commences upon the identification of a measurement
that exceeds a ‘trigger’ value. A trigger is best described as an ‘observation’ that renders VI above its preset
minimum tolerance level. Unlike in the case of risk-preparedness where VI is predicted yet is still uncertain, a
trigger observation renders VI above its minimum tolerance level with certainty, which in turn means that the
minimum contingency threshold has been exceeded – and a response procedure must be initiated – also with
certainty. To that end, triggers may be manifested as an irregularity in a wide range of measurable data; examples
of triggers include: excessive pressure-buildup in Safe, high level of pH or trace metals in a FrW, or high
concentration of dissolved CO2 in the oil recovered from an O&G. In addition, the causes of a trigger may be an
VI
{L}
Tier 3
Tier 2
Tier 1
risk profile
VI
{L}
Tier 3
Tier 2
Tier 1
risk profile
(a) (b)
This leakage scenario is allocated under Tier 2
This leakage scenario is allocated under Tier 2

20
FEP from within the analyzed system (e.g. geochemical erosion of the caprock) or an EFEP from outside the
analyzed system (e.g. new hydrocarbons’ drilling activities in the vicinity of the storage site or a large earthquake
in the vicinity of the storage project).
Whether identified through regular or special monitoring or inspection, and regardless of the instrumentation or
methodology used, once a trigger is identified, a response procedure should be initiated to detect then mitigate or
remediate leakage. Because leakage detection through trigger identification is the first step in incident-response,
contingency plans should specify an extensive list of triggers. To that end, similar to contingency thresholds,
response triggers should be selected by mutual agreement between the operator, regulatory agencies, and other
appropriate stakeholders. The ability to respond quickly and decisively to abnormal events is one of the primary
benefits of pre-negotiating these triggers.
5.1.4. Response Strategies
For each type of leakage event, a pre-planned course of action should be developed, depending on which tier it
falls into. The response strategy should include two types of actions: general operations and specific operations. A
summary table of both operation types is presented in Appendix B.
5.1.4.1. General Operations
Because the general operations are applicable to all leakage incidents, they should be designed and deployed in a
way that reflects the priorities identified in the contingency plan. Most notably, the safety of all personnel
responding to leakage incidents should be secured; in this case, the safety of the responding teams to subsurface
leaks through geologic pathways may be jeopardized due to either leakage causes (e.g. big earthquakes) or
leakage consequences (e.g. contaminated drinking water). In addition, general response operations should focus
on recovering normal CO2 storage activities as soon as possible.
The responding teams should have a clear action-plan on how to mobilize and deploy resources. This becomes
especially important in Tier 2 and Tier 3 when some required resources are not available onsite and should be
relocated from external vendors. To that end, Tiers 2 and 3 should fulfill two additional goals through general
operations. First each local and regional stakeholder should be assigned a clear responsibility zone to prevent
conflicting decisions and delays in execution. Second, because leakage may impact local and regional
populations, the operating party should be ready to provide external support and services beyond its typical
business. Examples of such services may include: security, evacuation, accommodation, transportation, and
medical supervision for relocated communities; catering services for both the response teams and the affected
communities; and financial compensation for damages or harms caused to nearby businesses or institutes.
5.1.4.2. Specific Operations: Corrective Measures
Specific response operations involve choosing proper corrective measures to mitigate or remediate leakage.
Several corrective measures have been proposed in literature [31, 38, 46, 48, 70], an example list of which is
presented in Table 3. As shown, we envision four primary criteria affecting the feasibility and effectiveness of
each corrective measure: objective, target formation, scale of deployment, and cost of deployment. First, it is
important to identify whether the goal of the corrective action is to ‘mitigate’ (stop or contain) the leakage or to
‘remediate’ its impacts. Second, given the specifics of the leakage trajectory and subsurface configuration, a
corrective action may be carried out at the Origin of the leak, on the transport Pathway, or at the Endpoint (e.g. a
freshwater aquifer). Third, some corrective measures are best applied only in a particular location of the
subsurface formation whereas others could be applied at multiple locations throughout the formation. Finally,
depending on the chosen technique, different corrective measure will require different monetary investment and
time commitments to install and operate wells, pumps, separators, or other water-treatment systems.

21
Table 3. Example corrective measures for incident-response [31, 38, 46, 48, 70]
Corrective Actions Objective Target
Formation
Scale of
Deployment
Deployment
Components Index
Reduce CO2 injection rate to reduce
pressure-buildup mitigate Origin particular location existing wells A
Stop CO2 injection to reduce
pressure-buildup mitigate Origin particular location existing wells B
Partially extract CO2 from the storage
reservoir to reduce pressure-buildup mitigate Origin
particular
location; multiple
locations
existing wells; new
wells; pumps C
Extract CO2 at leakage point mitigate Origin particular location new wells; pumps D
Extract water from the storage reservoir
to reduce pressure-buildup mitigate Origin
particular
location; multiple
locations
existing wells; new
wells; pumps;
water treatment
E
Inject water in upper formations of the
storage reservoir as a hydraulic barrier mitigate Pathway multiple locations
existing wells; new
wells; pumps F
Inject water to dissolve the leaking CO2 mitigate Pathway particular location existing wells; new
wells; pumps G
Inject sealing material at leakage point or
pathway (e.g. cement, gels, polymers) mitigate
Origin,
Pathway particular location
new wells; pumps;
sealants H
Extract CO2 from storage reservoir and
re-inject it into another reservoir remediate Origin
particular
location; multiple
locations
existing wells; new
wells; pumps I
Extract contaminated freshwater, treat,
then re-inject remediate
Endpoint
(FrW)
particular
location; multiple
locations
existing wells; new
wells; pumps;
water treatment
J
Treat freshwater in the subsurface
(e.g. inject microbes to restore pH) remediate
Endpoint
(FrW) particular location
existing wells; new
wells; chemicals or
microorganisms
K
Extract oil or gas, treat, then use remediate Endpoint
(O&G)
particular
location; multiple
locations
existing wells; new
wells; pumps;
separators
L
Inject water to enhance recovery remediate Endpoint
(O&G) particular location
existing wells; new
wells; pumps;
water treatment
M
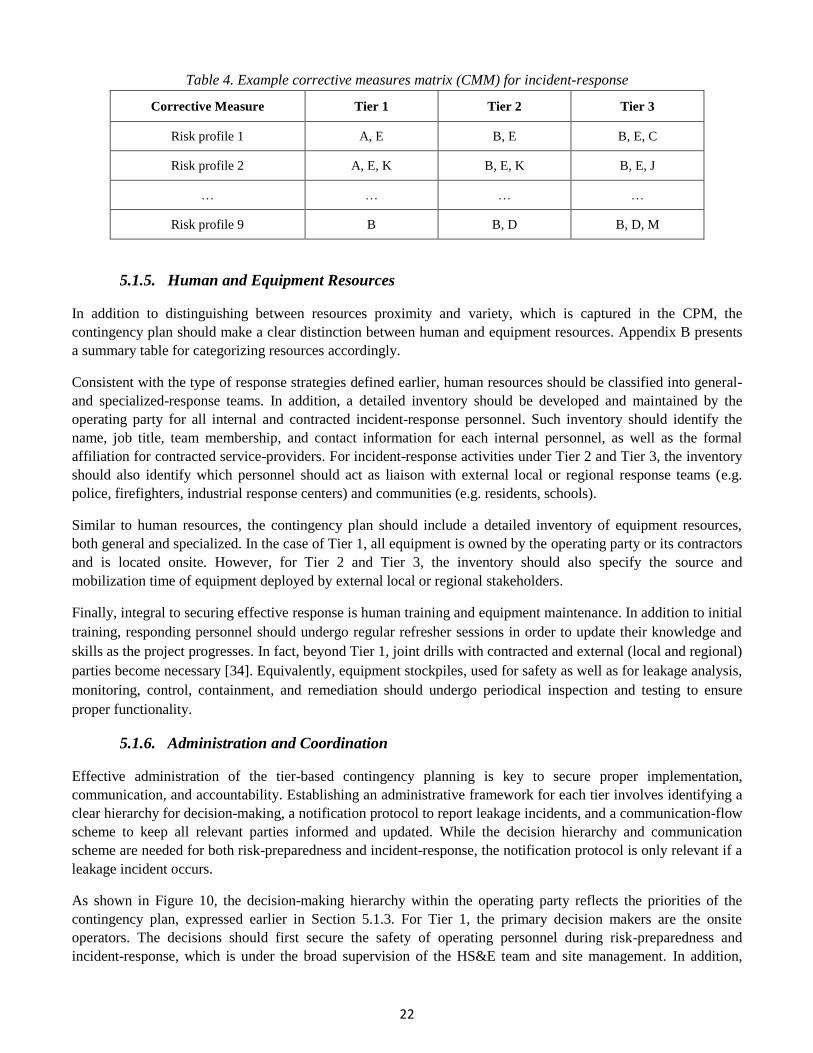
After identifying a list of feasible and effective corrective measures, the contingency plan should include a
‘corrective measures matrix’ (CMM) that matches each leakage risk profile (incorporating a group of leakage
scenarios of the same Origin-Pathway-Endpoint trajectory) with the best corrective-action techniques under each
contingency tier. Although no extensive data currently exists on the best corrective measures for each risk profile,
a template of the proposed CMM is presented in Table 4; the matrix is filled-in for illustrative purposes only. As
shown, more than one corrective technique can be assigned to each risk profile, and the methods should be listed
in order of priority.
Populating the CMM is dictated not only by the technical effectiveness of the corrective measures but also by the
economic feasibility of deploying them. To that end, the right portfolio of corrective measures for each risk
profile under each tier should balance between the cost of corrective measures and their benefits, expressed in
terms of the ‘avoided damage’ that would have occurred otherwise due to leakage. In other words, such cost-
benefit analysis compares the VI of a particular leakage scenario to the cost of the corrective measures mitigating
or remediating it, and it is a common approach in managing risks that may widely impact human and natural
ecosystems [71, 72]. Ultimately, designing such a CMM before leakage incidents occur is crucial for ensuring a
rapid response to the leakage incidents when they occur.
22
Table 4. Example corrective measures matrix (CMM) for incident-response
Corrective Measure Tier 1 Tier 2 Tier 3
Risk profile 1 A, E B, E B, E, C
Risk profile 2 A, E, K B, E, K B, E, J
… … … …
Risk profile 9 B B, D B, D, M
5.1.5. Human and Equipment Resources
In addition to distinguishing between resources proximity and variety, which is captured in the CPM, the
contingency plan should make a clear distinction between human and equipment resources. Appendix B presents
a summary table for categorizing resources accordingly.
Consistent with the type of response strategies defined earlier, human resources should be classified into general-
and specialized-response teams. In addition, a detailed inventory should be developed and maintained by the
operating party for all internal and contracted incident-response personnel. Such inventory should identify the
name, job title, team membership, and contact information for each internal personnel, as well as the formal
affiliation for contracted service-providers. For incident-response activities under Tier 2 and Tier 3, the inventory
should also identify which personnel should act as liaison with external local or regional response teams (e.g.
police, firefighters, industrial response centers) and communities (e.g. residents, schools).
Similar to human resources, the contingency plan should include a detailed inventory of equipment resources,
both general and specialized. In the case of Tier 1, all equipment is owned by the operating party or its contractors
and is located onsite. However, for Tier 2 and Tier 3, the inventory should also specify the source and
mobilization time of equipment deployed by external local or regional stakeholders.
Finally, integral to securing effective response is human training and equipment maintenance. In addition to initial
training, responding personnel should undergo regular refresher sessions in order to update their knowledge and
skills as the project progresses. In fact, beyond Tier 1, joint drills with contracted and external (local and regional)
parties become necessary [34]. Equivalently, equipment stockpiles, used for safety as well as for leakage analysis,
monitoring, control, containment, and remediation should undergo periodical inspection and testing to ensure
proper functionality.
5.1.6. Administration and Coordination
Effective administration of the tier-based contingency planning is key to secure proper implementation,
communication, and accountability. Establishing an administrative framework for each tier involves identifying a
clear hierarchy for decision-making, a notification protocol to report leakage incidents, and a communication-flow
scheme to keep all relevant parties informed and updated. While the decision hierarchy and communication
scheme are needed for both risk-preparedness and incident-response, the notification protocol is only relevant if a
leakage incident occurs.
As shown in Figure 10, the decision-making hierarchy within the operating party reflects the priorities of the
contingency plan, expressed earlier in Section 5.1.3. For Tier 1, the primary decision makers are the onsite
operators. The decisions should first secure the safety of operating personnel during risk-preparedness and
incident-response, which is under the broad supervision of the HS&E team and site management. In addition,
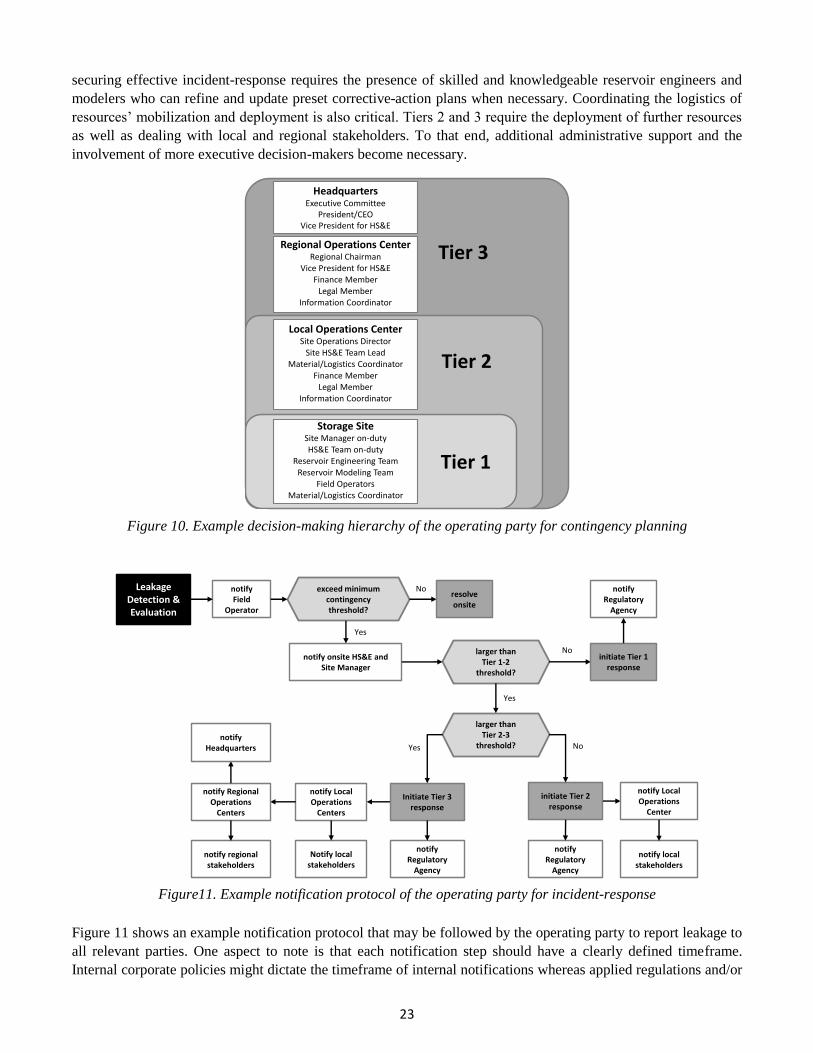
23
securing effective incident-response requires the presence of skilled and knowledgeable reservoir engineers and
modelers who can refine and update preset corrective-action plans when necessary. Coordinating the logistics of
resources’ mobilization and deployment is also critical. Tiers 2 and 3 require the deployment of further resources
as well as dealing with local and regional stakeholders. To that end, additional administrative support and the
involvement of more executive decision-makers become necessary.
Figure 10. Example decision-making hierarchy of the operating party for contingency planning
Figure11. Example notification protocol of the operating party for incident-response
Figure 11 shows an example notification protocol that may be followed by the operating party to report leakage to
all relevant parties. One aspect to note is that each notification step should have a clearly defined timeframe.
Internal corporate policies might dictate the timeframe of internal notifications whereas applied regulations and/or
Tier 3
Tier 2
Tier 1
HeadquartersExecutive Committee
President/CEOVice President for HS&E
Regional Operations CenterRegional Chairman
Vice President for HS&EFinance Member
Legal MemberInformation Coordinator
Local Operations CenterSite Operations Director
Site HS&E Team LeadMaterial/Logistics Coordinator
Finance MemberLegal Member
Information Coordinator
Storage SiteSite Manager on-dutyHS&E Team on-duty
Reservoir Engineering TeamReservoir Modeling Team
Field OperatorsMaterial/Logistics Coordinator
Leakage Detection & Evaluation
notify Field
Operator
notify onsite HS&E and Site Manager
exceed minimum contingency threshold?
resolve onsite
No
Yes
larger than Tier 1-2
threshold?
initiate Tier 1 response
No
notify Regulatory
Agency
Yes
initiate Tier 2 response
notify Local Operations
Center
notify local stakeholders
larger than Tier 2-3
threshold?
Initiate Tier 3 response
notify Local Operations
Centers
NoYes
notify Regional Operations
Centers
notify Regulatory
Agency
notify Regulatory
Agency
Notify local stakeholders
notify regional stakeholders
notify Headquarters
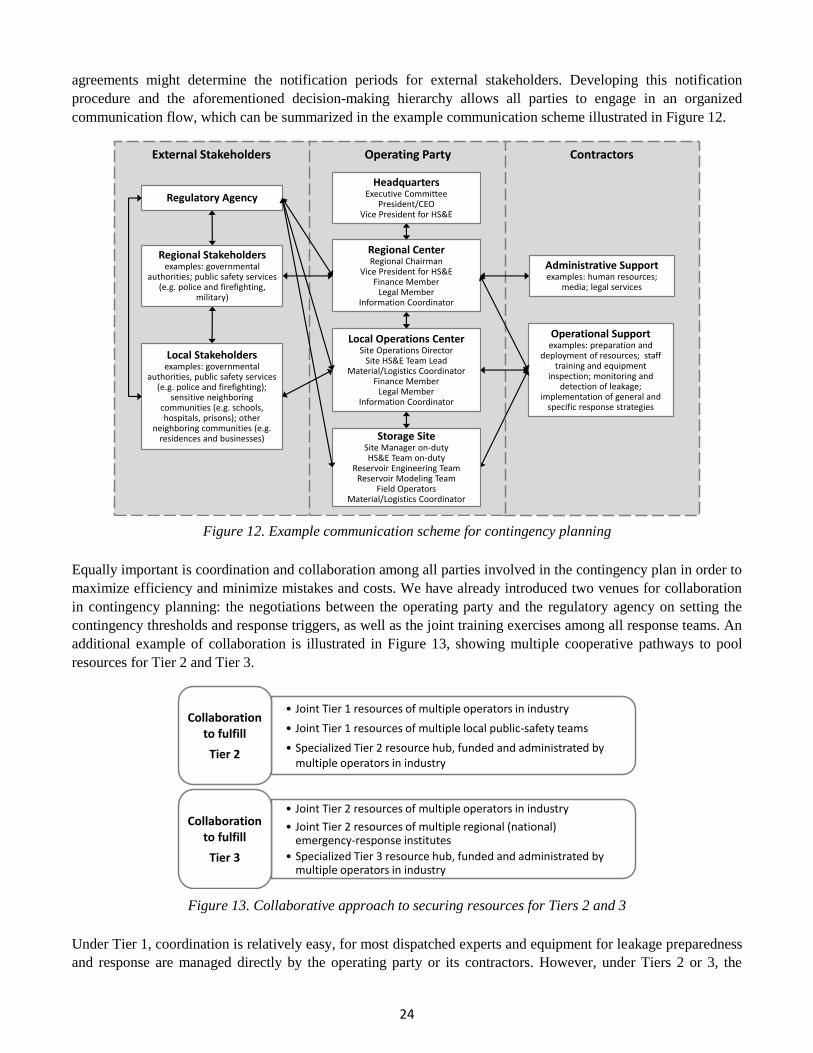
24
agreements might determine the notification periods for external stakeholders. Developing this notification
procedure and the aforementioned decision-making hierarchy allows all parties to engage in an organized
communication flow, which can be summarized in the example communication scheme illustrated in Figure 12.
Figure 12. Example communication scheme for contingency planning
Equally important is coordination and collaboration among all parties involved in the contingency plan in order to
maximize efficiency and minimize mistakes and costs. We have already introduced two venues for collaboration
in contingency planning: the negotiations between the operating party and the regulatory agency on setting the
contingency thresholds and response triggers, as well as the joint training exercises among all response teams. An
additional example of collaboration is illustrated in Figure 13, showing multiple cooperative pathways to pool
resources for Tier 2 and Tier 3.
Figure 13. Collaborative approach to securing resources for Tiers 2 and 3
Under Tier 1, coordination is relatively easy, for most dispatched experts and equipment for leakage preparedness
and response are managed directly by the operating party or its contractors. However, under Tiers 2 or 3, the
ContractorsExternal Stakeholders
Regional CenterRegional Chairman
Vice President for HS&EFinance Member
Legal MemberInformation Coordinator
Local Operations CenterSite Operations Director
Site HS&E Team LeadMaterial/Logistics Coordinator
Finance MemberLegal Member
Information Coordinator
Administrative Supportexamples: human resources;
media; legal services
Operational Supportexamples: preparation and
deployment of resources; staff training and equipment
inspection; monitoring and detection of leakage;
implementation of general and specific response strategies
Local Stakeholdersexamples: governmental
authorities, public safety services (e.g. police and firefighting);
sensitive neighboring communities (e.g. schools, hospitals, prisons); other
neighboring communities (e.g. residences and businesses)
Regional Stakeholdersexamples: governmental
authorities; public safety services (e.g. police and firefighting,
military)
Regulatory Agency
Storage SiteSite Manager on-dutyHS&E Team on-duty
Reservoir Engineering TeamReservoir Modeling Team
Field OperatorsMaterial/Logistics Coordinator
HeadquartersExecutive Committee
President/CEOVice President for HS&E
Operating Party
• Joint Tier 1 resources of multiple operators in industry
• Joint Tier 1 resources of multiple local public-safety teams
• Specialized Tier 2 resource hub, funded and administrated by multiple operators in industry
Collaboration to fulfill
Tier 2
• Joint Tier 2 resources of multiple operators in industry
• Joint Tier 2 resources of multiple regional (national) emergency-response institutes
• Specialized Tier 3 resource hub, funded and administrated by multiple operators in industry
Collaboration to fulfill
Tier 3

25
operating party’s internal and contracted teams need to further coordinate with local and regional partners. In this
case, different parties might have different priorities or be accustomed to different managerial styles, in which
case coordination becomes challenging. To that end, major contingency planning decisions will require
negotiation and compromise, and they are better handled when all affected parties have participated in the
development and approval of the contingency plan.
6. Conclusion
Although existing regulations on CO2 geologic storage require both assessing leakage risk and mitigating or
remediating leakage incidents through corrective measures, these two pieces of risk management are usually
addressed separately. This study proposes a methodological framework for contingency planning, which links risk
assessment and corrective measures. We achieve this goal in three consecutive steps: updating the representation
of the risk assessment matrix (RAM); translating the risk assessment matrix to a contingency planning matrix
(CPM) that incorporates a tier contingency system; and then using the emerging tiers as the basis for developing a
model contingency plan for risk-preparedness and incident-response, which encompasses corrective measures.
While this study focuses on the risks of leakage in the subsurface and through geologic pathways, the proposed
framework can be expanded to include other types of risks, including leakage at the surface or through man-made
pathways.
The updated RAM allows visualizing the three major steps of risk assessment: risk identification, risk analysis,
and risk evaluation, resulting in a comprehensive set of leakage risk profiles with quantified likelihood, impact,
and tolerance levels. Upon dividing the overall storage site into functional subsystems, various leakage Origins,
Pathways, and Endpoints are identified; leakage scenarios of the same Origin, Pathway, and Endpoint trajectory
form a risk profile. Subsequently, the likelihood of each leakage scenario is analyzed as a series of conditional
probabilities for leakage Origination, Propagation, and Destination, all of which change as a function of a
measurable Indicator. Equivalently, multiple value-models are developed to quantify the leakage flow and
impact, which covers the damages caused both in the subsurface and on the surface. Finally, through tolerance
levels specified for both likelihood and impact, it becomes possible to evaluate what risks are too high and should
be mitigated, and what risks are too small can be safely ignored.
The updated RAM can then be translated to a CPM. Fundamentally, preparing for leakage risk and responding to
leakage incidents requires a wide range of resources. To that end, the likelihood and impact dimensions of risk
assessment are translated to resource proximity and variety, respectively; more likely or frequent risks require
closer resources for quick mobilization and deployment while more impactful risks require more specialized or
complex resources for thorough containment, control, and remediation. In addition, the minimum and maximum
risk tolerance levels are translated to contingency thresholds, defining the upper and lower boundaries for
preparedness and response. Subsequently, to ensure the assignment of the right resources to each leakage
scenario, all foreseeable risks are categorized under three contingency tiers: Tier 1, Tier 2, and Tier 3. By design,
Tier 1 trades more impactful, less likely risks for less impactful, more likely risks while Tier 3 does the opposite.
The CPM tier system becomes the cornerstone in the development of a contingency plan. The model contingency
plan presented in this study demonstrates how the three tiers set the primary criteria for: implementing response
strategies; designing a corrective measures matrix (CMM) that assigns specific mitigation and remediation
measures to each leakage profile; obtaining, mobilizing, deploying, and sustaining the human and equipment
resources needed for incident-response; and formulating a decision-making hierarchy, a notification protocol, and
a communication scheme that allow the operating party to effectively administer the CO2 storage site. After
addressing these main topics, it becomes easy to develop the remaining sections of a contingency plan, which
include a directory of response personnel, background information on the project scope and priorities, a list of
triggers that may initiate response, and a record of previous leakage incidents, best practices, and lessons learned.

26
Ultimately, the proposed methodological framework presents a ‘dynamic’ and ‘collaborative’ approach to risk
management for CO2 geologic storage. Revised experts’ opinions, best-practices from previous leakage incidents,
and new learnings from site operations can be captured in the Bayesian probabilities of leakage likelihoods as
well as the value-models of leakage consequences, resulting in an updated set of risk profiles. This redistribution
of risk would be translated into a redistribution of resources under each tier as well as the renegotiation of
boundaries among tiers. Through transparent communications and proactive collaboration among all stakeholders,
these systematic updates ensure that the right leakage risk scenario is covered under the right contingency tier
using the right resources, and that the right corrective measure is deployed quickly and decisively if a leakage
occurs. Consequently, both technological and administrative innovations improve the preparedness for and
correction of leakage incidents.
7. Acknowledgement
The authors thank the Department of Management Science and Engineering and the Department of Energy
Resources Engineering at Stanford University for funding this work.

27
References
[1] GCCSI, "The Global Status of CCS," Global CCS Institute, Melbourne, 2014.
[2] TNS Opinion & Social, "Public Awareness and Acceptance of CO2 capture and storage," EuroBarometer, European Commission,
Brussels, 2011.
[3] P. Upham and T. Roberts, "Public Perceptions of CCS: the results of NearCO2 European Focus Groups," NearCO2, 2010.
[4] I. Wright, P. Ashworth, S. Xin, L. Di, Z. Yizhong, X. Liang, J. Anderson, S. Shackley, K. Itaoka, S. Wade, J. Asamoah and D. Reiner,
"Public Perception of Carbon Dioxide Capture and Storage: Prioritised Assessment of Issues and Concerns," CO2 Capture Project.
[5] IEA, "Regulatory Frameworks for CCS," 2015. [Online]. Available:
http://www.iea.org/topics/ccs/subtopics/permittingframeworksforccs/. [Accessed May 2015].
[6] S. Bonham and I. Chrysostomidis, "Regulatory Challenges and Key Lessons Learned From Real World Development of CCS
Projects," CO2 Capture Project, 2012.
[7] EPA, "Federal Requirements Under the Underground Injection Control (UIC) Program for Carbon Dioxide (CO2) Geologic
Sequestration (GS) Wells," Environmental Protection Agency, pp. Federal Register. Vol. 75, No. 237, 2010.
[8] EPA, "Underground Injection Control (UIC) Program Class VI Well Area of Review Evaluation and Corrective Action Guidance,"
Environmental Protection Agency. Office of Water, pp. EPA 816-R-13-005, 2013a.
[9] EPA, "Summary of EPA’s Responses to Public Comments Received on the Draft Class VI Well Testing and Monitoring Guidance,"
Environmental Protection Agency. Office of Water, pp. EPA 816-S-13-001, 2013b.
[10] K. Gagnon, "Canada Update: Select CCS Regulatory Developments," Natural Resources Canada, IEA 6th CCS Regulatory Network
Meeting. Paris, 2014.
[11] S. McCoy, "CSA Z741-12 and requirements for geologic storage," 6th International IEA CCS Regulatory Network Meeting, 2014.
[12] M. Leering, "CSA Z741 – Bi-National Standard for Geological Storage of Carbon Dioxide," CSA Standards, 2012.
[13] Bill 24, "Carbon Capture and Storage Amendment Act," The Legislative Assembly of Alberta. Third Session, 27th Legislature, 59
Elizabeth II , 2010.
[14] Alberta Energy, "Carbon Capture and Storage - Summary Report of the Regulatory Framework Assessment," Alberta Energy, 2012.
[15] Alberta, "Alberta Regulation 68/2011. Mines and Minerals Act. Carbon Sequestration Tenure Regulation," 2011. [Online]. Available:
http://www.qp.alberta.ca/. [Accessed May 2015].
[16] British Columbia, "Carbon Capture and Storage Regulatory Policy - Discussion and Comment Paper," Ministry of Natural Gas
Development. Province of British Columbia, 2014.
[17] Office of Parliamentary Counsel, "Offshore Petroleum and Greenhouse Gas Storage Act 2006," ComLaw, Canberra, 2006.
[18] Environment Protection and Heritage Council, "Environmental Guidelines for Carbon Dioxide Capture and Geological Storage,"
Commonwealth of Australia and each Australian State and Territory, 2009.
[19] The Parliament of Victoria, "Greenhouse Gas Geological Sequestration Act," The Parliament of Victoria, 2008.
[20] Queensland Parliamentary Counsel, "Greenhouse Gas Storage Act," Office of the Queensland Parliamentary Counsel, 2009.

28
[21] EC, "DIRECTIVE 2009/31/EC OF THE EUROPEAN PARLIAMENT AND OF THE COUNCILof 23 April 2009on the geological
storage of carbon dioxide," European Commission. Official Journal of the European Union, 2009.
[22] EC, "Guidance Document 1. CO2 Storage Life Cycle Risk Management Framework," European Communities, 2011a.
[23] EC, "Guidance Document 2. Characterisation of the Storage Complex, CO2 Stream Composition, Monitoring and Corrective
Measures," European Communities, 2011b.
[24] L.-C. Liu, Q. Li, J.-T. Zhang and D. Cao, "Toward a framework of environmental risk management for CO2 geological storage in
china: gaps and suggestions for future regulations," Mitigation and Adaptation Strategies for Global Change, pp. 10.1007/s11027-
014-9589-9, 2014.
[25] D. Seligsohn, Y. Liu, S. Forbes, Z. Dongjie and L. West, "CCS in China: Toward an Environmental, Health, and Safety Regulatory
Framework," World Resources Institute, Washington, DC, 2010.
[26] DNV, "Geological Storage of Carbon Dioxide," DNV, DNV-RP-J203, 2012.
[27] ISO, "Risk Management – Principles. ISO 31000:2009," International Organization for Standardization, 2009.
[28] S. Vajjhala, J. Gode and A. Torvanger, "An International Regulatory Framework for Risk Governance of Carbon Capture and
Storage," Center for International Climate and Environmental Research, Oslo, Norway, 2007.
[29] ScottishPower CCS Consortium, "UK Carbon Capture and Storage Demonstration Competition: Corrective Measures Plan - UKCCS -
KT - S7.20 - Shell - 001," UK Carbon Capture and Storage Demonstration Competition, 2011.
[30] S. C. Energy, "QUEST Carbon Capture and Storage - Risk-Based Measurement, Monitoring & Verification," in MVA/MMV
Knowledge Sharing Workshop, Mobile Alabama, 2012.
[31] V. Kuurskraa and M. L. Godec, "Remediation of Leakage from CO2 Storage Reservoirs," IEA Greenhouse Gas R&D Programme,
2007.
[32] J.-C. Manceau, D. G. Hatzignatiou, L. D. Lary, N. B. Jensen, K. Flornes, T. L. Guenan and A. Reveillere, "Methodologies and
Technologies for Mitigation of Undesired CO2 Migration In the Subsurface," IEAGHG, UK, 2013.
[33] Eni Australia, "Joseph Bonaparte Gulf Oil Spill Contingency Plan," Eni Australia B.V., 2009.
[34] C. K. Berry and J. R. Bogner, "Model Emergency Response Plan," North Carolina Department of Labor (NCDOL), Raleigh.
[35] IPIECA, "Guide to Tiered Preparedness and Response," International Petroleum Industry Environmental Conservation Association,
London, United Kingdom, 2007.
[36] NIST, "Contingency Plan Template, Appendix I-3," [Online]. [Accessed 2012].
[37] S. K. Singh and R. Ranjan, "Oil Spill Contingency Plan for Upstream Petroleum Operations in Andhra Pradesh Offshore Area,
Rajahmundry Asset," Oil and Natural Gas Corporation Ltd, Rajahmundry, India, 2007.
[38] J.-C. Manceaua, D. Hatzignatiou, d. N. J. L. de Larya and A. Réveillèrea, "Mitigation and remediation technologies and practices in
case of undesired migration of CO2 from a geological storage unit - Current status," International Journal of Greenhouse Gas
Control, vol. 22, pp. 272-290, 2014.
[39] A. Nicol and M. Gerstenberger, "Risk Assessment in CCS," Sanya China, 2011.
[40] J. Condora, D. Unatrakarna, M. Wilsona and K. Asgharia, "A Comparative Analysis of Risk Assessment Methodologies for the
Geologic Storage of Carbon Dioxide," Energy Procedia, vol. 4, p. 4036–4043, 2011.

29
[41] Quintessa, "CO2 FEP Database," 2010. [Online]. Available: http://www.quintessa.org/co2fepdb_v1.1.0/PHP/frames.php. [Accessed
2015].
[42] M. Gerstenberger, A. Nicol, M. Stenhouse, K. Berryman, M. Stirling, T. Webb and W. Smith, "Modularised logic tree risk assessment
method for carbon capture and storage projects," Energy Procedia, vol. 1, pp. 2495-2502, 2009.
[43] M. Gerstenberger, A. Christophersena, R. Buxtona and A. Nicola, "Bi-directional risk assessment in carbon capture and storage with
Bayesian Networks," International Journal of Greenhouse Gas Control, vol. 35, pp. 150-159, 2015.
[44] A. Bowden and A. Rigg, "Assessing Risk in CO2 Storage Projects," APPEA Journal, pp. 677-702, 2004.
[45] A. R. Bowden, D. F. Pershkeb and R. Chalaturnyk, "Geosphere risk assessment conducted for the IEAGHG Weyburn-Midale CO2
Monitoring and Storage Project," International Journal of Greenhouse Gas Control, vol. 16S, p. S276–S290, 2013.
[46] S. M. Benson and R. Hepple, "Prospects for Early Detection and Options for Remediation of Leakage from CO2 Sequestration
Projects," in Carbon Dioxide Capture for Storage in Deep Geologic Formations: Results from the CO2 Capture Project, Vol. 2:
Geologic Storage of Carbon Dioxide with Monitoring and Verification, UK, Elsevier Publishing, 2005, pp. 1189-1203.
[47] V. A. Kuuskraa and M. L. Godec, "Remediation of Leakage from CO2 Storage Reservoirs," Advanced Resources International, Inc,
Arlington, VA, USA, 2007.
[48] S. M. Benson, "Remediation Technologies," Storage in Saline Formations R&D Workshop, California, 2011.
[49] NETL, "Risk Analysis and Simulation for Geologic Storage of CO2," National Energy Technology Laboratory, 2009.
[50] K. Hnottavange-Telleena, E. Chabora, R. J. Finley, S. E. Greenberg and S. Marsteller, "Risk management in a large-scale CO2
geosequestration pilot project, Illinois, USA," Energy Procedia, vol. 4, p. 4044–4051, 2011.
[51] K. Edlmann, "Risk Assessment in Geologic Storage of CO2," Oxand.
[52] DNV, "CO2QUALSTORE: Guideline for Selection and Qualification of Sites and Projects for Geological Storage of CO2," DNV,
Hovik, Norway, 2009.
[53] E. Pate-Cornell, "Uncertainties in risk analysis: Six Levels of treatment," Reliability Engineering and System Safety, pp. 95-111, 1996.
[54] B. J. Garrick, "Recent Case Studies and Advancements in Probabilistic Risk Assessment," Risk Analysis, vol. 4, no. 4, pp. 267-279,
1984.
[55] E. Pate-Cornell, "Chapter 24 - Nuclear Power Plants: TheOriginalProbabilistic Risk Analysis," in MS&E250A: Engineering Risk
Analysis Class Notes, Stanford, Stanford Bookstore, 2013, p. 177.
[56] A. R. Bowden, D. F. Pershke and R. Chalaturnyk, "Biosphere risk assessment for CO2 storage projects," International Journal of
Greenhouse Gas Control, vol. 16S, pp. S291-S308, 2013.
[57] FutureGen 2.0, "Final Risk Assessment Report for the FutureGen Project Environmental Impact Statement," U.S. Department of
Energy. Contract No. DE-AT26-06NT42921, 2007.
[58] R. A. Howard, "On Making Life and Death Decisions," Societal Risk Assessment, pp. 89-113, 1980.
[59] R. A. Howard and A. E. Abbas, Foundations of Decision Analysis, Pearson, 2015.
[60] R. S. d. Groot, M. A. Wilson and R. M. Boumans, "A typology for the classification, description and valuation of ecosystem
functions, goods and services," Ecological Economics, vol. 41, pp. 393-408, 2002.

30
[61] T. Tietenberg and L. Lewis, Environmental & Natural Resource Economics, Pearson, 2015.
[62] IEA, "Potential Impacts on Groundwater Resources of CO2 Geologic Storage," International Energy Agency Greenhouse Gas R&D
Programme, 2011.
[63] R. Melchers, "On the ALARP approach to risk management," Reliability Engineering and System Safety, vol. 71, pp. 201-208, 2001.
[64] D. Savage, P. R. Mual, S. Benbow and R. C. Walke, "A Generic FEP Database for the Assessment of Long-Term Performance and
Safety of Geologic Storage of CO2," Quintessa, QRS-1060A-1 verion 1.0, 2004.
[65] ENI, "Joseph Bonaparte Gulf Oil Spill Contingency Plan," ENI Australia, West Perth, 2009.
[66] H. A. Parker, R. T. Teubner and J. C. Sawicki, "Spill Reponse Planning in the Philippines: 3-Tier Interaction between Government
and Industry," 2009. [Online]. Available: http://www.interspill.org/previous-events/2009/12-May/pdf/1630_parker.pdf.
[67] UK, "The National Contingency Plan: A Strategic Overview for Responses to Marine Pollution from Shipping and Offshore
Installations," 2014. [Online]. Available:
https://www.gov.uk/government/uploads/system/uploads/attachment_data/file/408385/140829-NCP-Final.pdf.
[68] CCA, "Clean Caribbean & Americas," [Online]. Available: http://www.cleancaribbean.org/. [Accessed 2015].
[69] Oil Spill Response , "Services," [Online]. Available: http://www.oilspillresponse.com/services-landing. [Accessed 2015].
[70] S. M. Benson, R. Hepple, J. Apps, C.-F. Tsang and M. Lippman, "Lessons Learned from Natural and Industrial Analogues for Storage
of Carbon Dioixide in Deep Geological Formations," Lawrence Berkeley National Laboratory, Berkeley, California, USA, 2002.
[71] IPCC, "Costs, benefits and avoided climate impacts at global and regional levels. IPCC Fourth Assessment Report: Climate Change
2007.," 2007. [Online]. Available: https://www.ipcc.ch/publications_and_data/ar4/syr/en/mains5-7.html. [Accessed 2015].
[72] W. D. Nordhaus, "A Review of the Stern Review on the Economics of Climate Change," Journal of Economie Literature , vol. 45, no.
3, pp. 686-702, 2007.

31
Appendix A: Drawbacks of Alternative Three-Tier Systems
Figure A1. Drawbacks of alternative tier-system approaches for contingency planning
The proposed tier system for contingency planning in Figure 8 avoids potential pitfalls in alternative tier-system
designs, as depicted in Figure A1. The ‘resource-variety’ tier system in Figure A1-a divides the tolerable risk zone
into three tiers based only on the impact of leakage and thus the variety of needed resources; it covers the least
impactful leakage scenarios under Tier 1 and the most impactful scenarios under Tier 3. The problem with this
approach is that it ignores the need for different levels of Resource Proximity to prepare for and respond to
leakage incidents of different likelihoods but of the same impact.
Conversely, the ‘resource-proximity’ tier system in Figure A1-b divides the tolerable risk zone into three tiers
based only on the likelihood of leakage and thus the proximity of needed resources; it covers the least likely and
infrequent leakage scenarios under Tier 1 and the most likely and frequent scenarios under Tier 3. The problem
with this approach is that it ignores the need for different levels of Resource Variety to prepare for and respond to
leakage incidents of different impact levels but of the same likelihood.
Additionally, the ‘resource-amount’ tier system divides the tolerable risk zone into three tiers based on the overall
level of risk, or equivalently, based on the overall amount of available resources; leakage scenarios of the lowest
risk levels (lowest likelihood and impact) are covered under Tier 1 whereas those of the highest risk levels
(highest likelihood and impact) are covered under Tier 3. This ‘resource-amount’ tier system may be designed in
two forms using continuous or discretized resource-amount contours, as illustrated in Figures A1-c and A1-d,
respectively. The problem with this approach is that it equates leakage scenarios requiring most proximate but
least various resources to those requiring least proximate but most various resources. The adopted tier system in
this study avoids this problem due to the tradeoff illustrated in Figure 8 and explained in Section 4.3.2.
VI
{L}
Maximum Contingency Threshold
Tier 3
Tier 2
Tier 1
Min
imu
m C
on
tin
gen
cy T
hre
sho
ld
Minimum Contingency Threshold
Max
imu
mC
on
tin
gen
cy T
hre
sho
ld
VI
{L}
Maximum Contingency Threshold
Tier 1 Tier 2 Tier 3
Min
imu
m C
on
tin
gen
cy T
hre
sho
ld
Minimum Contingency Threshold
Max
imu
mC
on
tin
gen
cy T
hre
sho
ld
VI
{L}
Maximum Contingency Threshold
Tier 3
Tier 2
Tier 1
Min
imu
m C
on
tin
gen
cy T
hre
sho
ld
Minimum Contingency Threshold
Max
imu
mC
on
tin
gen
cy T
hre
sho
ld
VI
{L}
Maximum Contingency Threshold
Min
imu
m C
on
tin
gen
cy T
hre
sho
ld
Minimum Contingency Threshold
Max
imu
mC
on
tin
gen
cy T
hre
sho
ld
Tier 3
Tier 2
Tier 1
9a 9b
9c 9d
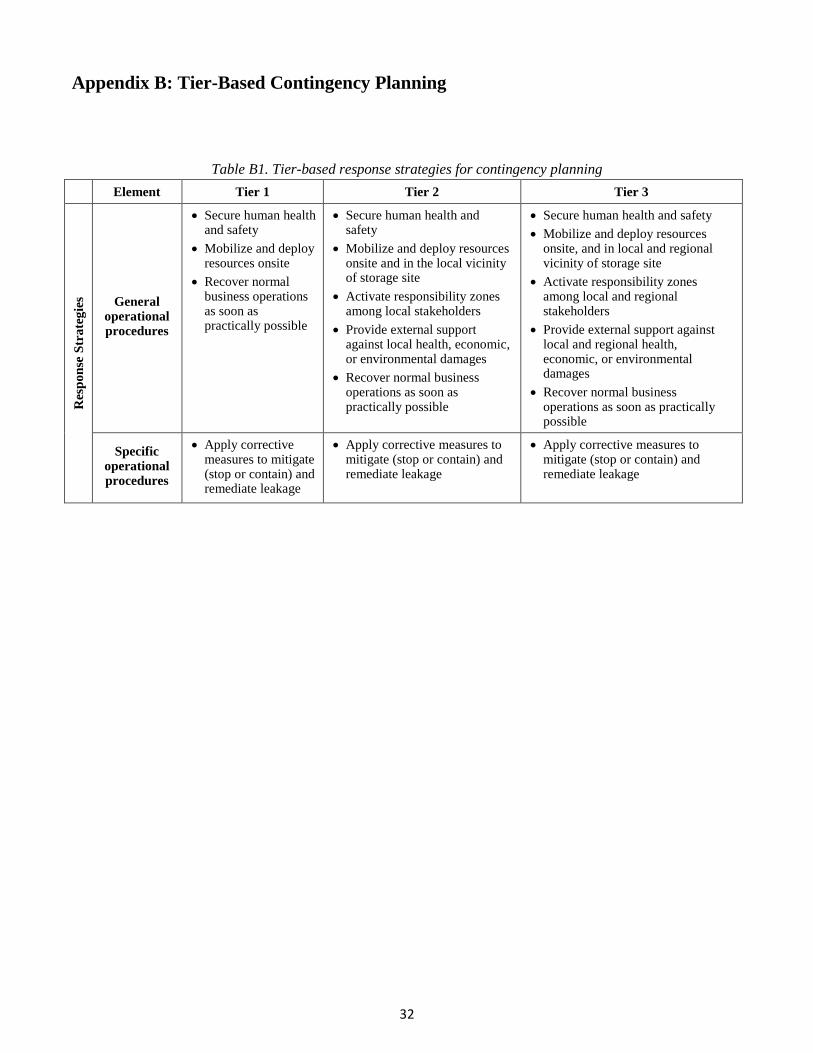
32
Appendix B: Tier-Based Contingency Planning
Table B1. Tier-based response strategies for contingency planning
Element Tier 1 Tier 2 Tier 3
Res
po
nse
Str
ate
gie
s General operational procedures
Secure human health and safety
Mobilize and deploy resources onsite
Recover normal business operations as soon as practically possible
Secure human health and safety
Mobilize and deploy resources onsite and in the local vicinity of storage site
Activate responsibility zones among local stakeholders
Provide external support against local health, economic, or environmental damages
Recover normal business operations as soon as practically possible
Secure human health and safety
Mobilize and deploy resources onsite, and in local and regional vicinity of storage site
Activate responsibility zones among local and regional stakeholders
Provide external support against local and regional health, economic, or environmental damages
Recover normal business operations as soon as practically possible
Specific operational procedures
Apply corrective measures to mitigate (stop or contain) and remediate leakage
Apply corrective measures to mitigate (stop or contain) and remediate leakage
Apply corrective measures to mitigate (stop or contain) and remediate leakage
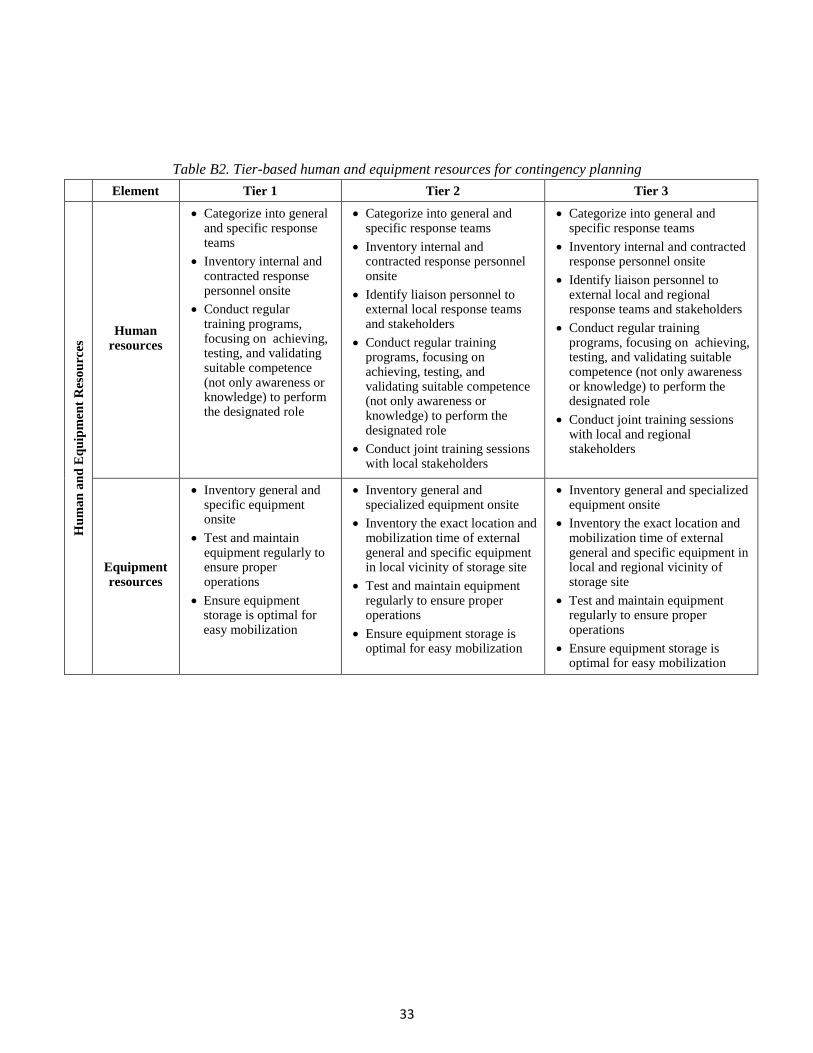
33
Table B2. Tier-based human and equipment resources for contingency planning
Element Tier 1 Tier 2 Tier 3
Hu
ma
n a
nd
Eq
uip
men
t R
eso
urc
es
Human resources
Categorize into general and specific response teams
Inventory internal and contracted response personnel onsite
Conduct regular training programs, focusing on achieving, testing, and validating suitable competence (not only awareness or knowledge) to perform the designated role
Categorize into general and specific response teams
Inventory internal and contracted response personnel onsite
Identify liaison personnel to external local response teams and stakeholders
Conduct regular training programs, focusing on achieving, testing, and validating suitable competence (not only awareness or knowledge) to perform the designated role
Conduct joint training sessions with local stakeholders
Categorize into general and specific response teams
Inventory internal and contracted response personnel onsite
Identify liaison personnel to external local and regional response teams and stakeholders
Conduct regular training programs, focusing on achieving, testing, and validating suitable competence (not only awareness or knowledge) to perform the designated role
Conduct joint training sessions with local and regional stakeholders
Equipment resources
Inventory general and specific equipment onsite
Test and maintain equipment regularly to ensure proper operations
Ensure equipment storage is optimal for easy mobilization
Inventory general and specialized equipment onsite
Inventory the exact location and mobilization time of external general and specific equipment in local vicinity of storage site
Test and maintain equipment regularly to ensure proper operations
Ensure equipment storage is optimal for easy mobilization
Inventory general and specialized equipment onsite
Inventory the exact location and mobilization time of external general and specific equipment in local and regional vicinity of storage site
Test and maintain equipment regularly to ensure proper operations
Ensure equipment storage is optimal for easy mobilization