oil spill risk analysis and contingency plan for multi
TRANSCRIPT
OIL SPILL RISK ANALYSIS AND CONTINGENCY PLAN FOR MULTI CARGO PORT BY ADANI HAZIRA PORT PRIVATE LIMITED, HAZIRA, SURAT
For
Adani Hazira Port Pvt Ltd. Hazira
Final Report
APRIL 2011
By
Environ Software (P) Ltd Electronic City, Bangalore
i
CONTENTS
Preface i Executive Summary ii Project Team vii
1. Introduction 1 1.1 Meteorological Parameters 2
1.1.1 Rainfall 2 1.1.2 Relative humidity and temperature 3 1.1.3 Visibility 4 1.1.4 Sea Conditions 5
1.2 Waves 5 1.2.1 Cyclones 5 1.2.2 Tides 6
1.3 Project Information 10
2. SCOPE OF THE WORK 12 2.1 Objectives 12
3. OIL CHARACTERISTICS AND WEATHERING PROCESSES 13 3.1 Composition of Oil 13 3.2 Properties of Oil 14 3.3 Weathering Processes 15 3.4 Effects of Marine Oil Spills 16
4. OIL SPILL CONTINGENCY PLAN 19 4.1 Scope and Content of Plans 19
5. Perceived Risks and Expected Quantities of Oil Spill 21 5.1 Introduction 21 5.2 Overview of Historical Oil Spills 21 5.3 Failure frequency of pipeline transfer and storage tank 28 5.4 Meteorological Data 29 5.5 Expected Quantities of Oil Spill at AHPPL berths 29 5.6 FO/HSD leakage from fuel tank compartments due to
collision/grounding 30 5.7 Spill due to Collision in vessel route 31 5.8 Spill due to transfer of POL products at berths 31
6. Oil Spill Modelling Studies 32 6.1 Modelling of Hydrodynamic Processes 32
6.1.1 Model description 32 6.1.2 Basic governing equations 33 6.1.3 Model diffusion coefficients 33 6.1.4 Numerical solution algorithm 34
6.2 Gulf of Khambhat 34 6.2.1 Model setup and boundary specifications 35
6.3 Bottom bed-roughness 39 6.4 Initial and boundary conditions 39 6.5 Model calibration 42 6.6 Modelling of tides and tidal currents 45 6.7 Numerical Modelling of Fate and Movement of Oil Spills 45
6.7.1 Horizontal turbulent diffusion 46

ii
6.7.2 Mechanical spreading 47 6.7.3 Evaporation 47 6.7.4 Dissolution 48 6.7.5 Emulsification 49 6.7.6 Shoreline deposition 49
6.8 Simulation of Scenario – Details 49 6.8.1 Computation Domain and Input data 50 6.8.2 Spill Locations 50
6.8.2.1 Oil type 50 6.8.2.2 Weather conditions 51 6.8.2.3 Computational scenarios 52
6.9 Results of Scenario 52 6.9.1 Post-monsoon (December 2008) 53 6.9.2 Pre-monsoon(March 2009) 54 6.9.3 Monsoon(June 2009) 54
6.10 Shore Landing and Spill Impact Areas 55 6.10.1 Post-monsoon (December 2008) 55 6.10.2 Pre-monsoon(March 2009) 56 6.10.3 Monsoon(June 2009) 56
6.11 Fate and Effects 56 6.11.1 Evaporation 56 6.11.2 Emulsification 57 6.11.3. Dissolution 57
7. CLEAN-UP STRATEGY 61 7.1 Booms 61 7.2 Skimmers 62 7.3 Sorbents 63 7.4 Dispersants 64
7.4.1 Advantages 64 7.4.2 Disadvantages 65 7.4.3 Areas where dispersants are not recommended to be used: 65 7.4.4 Application in Indian Waters 66
7.5 Spill Response Decision Guide 67 7.6 Natural Dispersion Response 68 7.7 Spill Response Options 69 7.8 Performance Efficienies for Response Techniques 70 7.9 Shoreline Booming Guidelines 70 7.10 Shoreline Clean-up Equipment Checklist 72 7.11 Resources Required for Combating Oil Spill 73
8. RESOURCES AT RISK 74
9. TEMPORARY STORAGE FACILITIES AND DISPOSAL OF OIL AND DEBRIS 75 9.1 Storage Facilities 75 9.2 Disposal Methods 77
10. OIL SPILL RESPONSE PLAN 79
10.1 INITIAL ACTIONS AND PROCEDURES 80 10.1.1 Reporting oil spill incidence 80 10.1.2 Notification information details required as follows: 80 10.1.3 Oil spill report form 81
10.2 Surveillance and Tracking of Oil at Sea 82 10.3 Notification of On-scene Co-ordinator and response team members 83

iii
10.4 Identification of Sensitive Areas 83 10.5 Development of Site Specific Response Plan 83 10.6 Operations Planning and Mobilisation Procedures 84 10.7 Deployment of Equipment 92 10.8 Storage and disposal of oil and debris 92 10.9 Control of Operations 93 10.10 Terminations of Operations 93
11. CONCLUSIONS AND RECOMMENDATIONS 100
List of Tables:
Table 1-1 Monthly Rainfall 02 Table 1-2 Relative Humidity at Surat Airport 03 Table 1-3 Air temperatures at Surat Airport 04 Table 1-4 Monthly Visibility figures 04 Table 1-5 Annual visibility figures 05 Table 1-6 Typical annual seasons 06 Table 3.1 Typical fractionation of a crude oil 17 Table 3.2 Effects of oil on marine populations and communities 18 Table 3.3 Summary of effects of oil in some major ecosystems 18 Table 5.1 Major Oil Spills Since 1967 22 Table 5.2 Some of the past accident data related to major oil spills 23 Table 5.3 Record of Oil Spills in Indian Waters 25 Table- 5.4 Number of spills over 7 tons 25 Table- 5.5 Number Quantity of Oil spilt 26 Table- 5.6 Number of oil spills occurred during 1974 to 2008 and their causes and
the spill quantity 27
Table 5.7 Incidence of spills by cause, 1974-2008 27 Table 6.1 Oil Spill Analysis at AHPPL Berth: Spill Quantity, percentage of oil
reaching the land/ domain boundaries and oiling for various seasons – Variable Winds
58
Table : 9.1 Separation and disposal of oil and debris 78
List of Figures:
Fig.0.1 Existing Layout of Port 01 Fig. 1.2 Wind Rose Diagrams 08 Fig.1.3 Study area – terrain features in and around Adani Multi-cargo Port, Hazira 09 Fig.3.1 Shows schematic diagram of weathering processes with time. 17 Fig.6.1 Terrain features of Khambhat showing EBTLdeep waterberth 36 Fig.6.2 Computational grid 37 Fig.6.3 Interpolated bathymetric depths(m) 38 Fig.6.4 Predicted tide at Navabandar (dec 2008) 40 Fig.6.5 Predicted tide at Navabandar (March 2009) 40 Fig.6.6 Predicted tide at Navabandar (June 2009) 41 Fig.6.7 Predicted tide at Dahanu (December 2008) 41 Fig.6.8 Predicted tide at Dahanu (March 2009) 42 Fig.6.9 Predicted tide at Dahanu (June 2009) 42 Fig.6.10 Comparison of measured and computed currents-V at Bhavinar 43 Fig.6.11 Comparison of measured and computed currents-U at Bhavinar 43 Fig. 6.12 Comparison of measured and computed tide at Sulthanpur Fig. 6.13 Comparison of measured and computed tide at Bhavinagar 44 Fig. 6.14 Comparison of measured and computed tide at Suvali 44 Fig. 6.15 Comparison of measured and computed tide at Dahej 45

iv
Fig.A.1.1 Terrain features of Adani Hazira Port showing water berth s 102 Fig.A.1.2 Computational mesh 103 Fig.A.1.3 Interpolated bathy depths 104 Fig.A.1.4 Simulated Currents during LLW of neap tide (18 hr of 08 th Dec 2008) 105 Fig.A.1.5 Simulated Currents during Peak Flood of neap tide (21 hr of 08th Dec
2008) 106
Fig.A.1.6 Simulated Currents during HHW of neap tide (00 hr of 09th Dec 2008) 107 Fig.A.1.7 Simulated Currents during Peak EBB of neap tide (04hr of 09 th Dec 2008) 108 Fig.A.1.8 Simulated Currents during LLW of spring tide (19 hr of 09 th Dec 2008) 109 Fig.A.1.9 Simulated Currents during Peak Flood of spring tide (22 hr of 09 th Dec
2008) 110
Fig.A.1.10 Simulated Currents during HHW of spring tide (01 hr of 10 th Dec 2008) 111 Fig.A.1.11 Simulated Currents during Peak EBB of spring tide (04 hr of 10 th Dec
2008) 112
Fig.A.2.1 Simulated Currents during LLW of neap tide (17 hr of 20th March 2009) 113 Fig.A.2.2 Simulated Currents during Peal Flood of neap tide (21 hr of 20th March
2009)March 2009) 114
Fig.A.2.3 Simulated Currents during HHW of neap tide (00 hr of 21th March 2009) 115 Fig.A.2.4 Simulated Currents during Peak EBB of neap tide (03 hr of 21th March
2009) 116
Fig.A.2. 5 Simulated Currents during LLW of spring tide (10 hr of 11 th March 2009) 117 Fig.A.2. 6 Simulated Currents during Peak Flood of spring tide (13 hr of 11 th March
2009) 118
Fig.A.2 .7 Simulated Currents during HHW of spring tide (16 hr of 11th March 2009)
119
Fig.A.2. 8 Simulated Currents during Peak EBB of spring tide (19 hr of 11 th March 2009)
120
Fig.A.3. 1 Simulated Currents during LLW of neap tide (02 hr of 14th JUN 2009) 121 Fig.A.3.2 Simulated Currents during Peal Flood of neap tide (05 hr of 14th JUN
2009) 122
Fig.A.3.3 Simulated Currents during HHW of neap tide (07 hr of 14th JUN 2009) 123 Fig.A.3.4 Simulated Currents during Peak EBB of neap tide (10 hr of 14th JUN
2009) 124
Fig.A.3.5 Simulated Currents during LLW of spring tide (11 hr of 14 th JUN 2009) 125 Fig.A.3.6 Simulated currents during HHW of spring tide (09 hr of 15 th June 2009) 126 Fig.A.3.7 Simulated Currents during HHW of spring tide (17 hr of 14th JUN 2009) 127 Fig.A.3.8 Simulated Currents during Peak EBB of spring tide (20 hr of 14th JUN
2009) 128
Fig. A. 4.1 Oil Spill trajectory due to Instantaneous spill of 100 tons FO at Cargo Berth-1 (Dec 2008 winds)
129
Fig. A. 4.2 Oil Spill trajectory due to Instantaneous spill of 100 tons FO at Cargo Berth-2 (Dec 2008 winds)
130
Fig. A.4.3. Oil Spill trajectory due to Instantaneous spill of 100 tons FO in Turning circle (Dec 2008 winds)
131
Fig. A. 4.4 Oil Spill trajectory due to Instantaneous spill of 100 tons FO at entrance of port (Dec 2008 winds)
132
Fig. A.4. 5 Oil Spill trajectory due to Instantaneous spill of 100 tons FO in approach channel (Dec 2008 winds)
133
Fig. A. 4.6 Oil Spill trajectory due to Instantaneous spill of 100 tons HSD at Berth-1 (Dec 2008 winds)
134
Fig. A. 4.7 Oil Spill trajectory due to Instantaneous spill of 100 tons HSD at Berth-2 (Dec 2008 winds)
135
Fig. A. 4.8 Oil Spill trajectory due to Instantaneous spill of 100 tons HSD in turning circle (Dec 2008 winds)
136
Fig. A. 4.9 Oil Spill trajectory due to Instantaneous spill of 100 tons HSD at entrance of the Port (Dec 2008 winds)
137
Fig.A.4.10 Oil Spill trajectory due to Instantaneous spill of 100 tons HSD in the 138

v
approach channel (Dec 2008 winds) Fig.A.4.11 Oil Spill trajectory due to Instantaneous spill of 100 tons Crude oil at
Berth-1 (Dec 2008 winds)
139
Fig.A.4.12 Oil Spill trajectory due to Instantaneous spill of 100 tons Crude oil at Berth-2 (Dec 2008 winds)
140
Fig.A.4.13 Oil Spill trajectory due to Instantaneous spill of 100 tons Crude in turning circle (Dec 2008 winds)
141
Fig.A.4.14 Oil Spill trajectory due to Instantaneous spill of 100 tons Crude at entrance of the port(Dec 2008 winds)
142
Fig.A.4.15 Oil Spill trajectory due to Instantaneous spill of 100 tons Crude in approach channel (Dec 2008 winds)
143
Fig.A.4.16 Oil Spill trajectory due to Instantaneous spill of 700 tons FO at Cargo Berth-1 (Dec 2008 winds)
144
Fig.A.4.17 Oil Spill trajectory due to Instantaneous spill of 700 tons FO at Cargo Berth-2 (Dec 2008 winds)
145
Fig.A.4.18 Oil Spill trajectory due to Instantaneous spill of 700 tons FO in Turning circle (Dec 2008 winds)
146
Fig.A.4.19 Oil Spill trajectory due to Instantaneous spill of 700 tons FO at entrance of port (Dec 2008 winds)
147
Fig.A.4.20 Oil Spill trajectory due to Instantaneous spill of 700 tons FO in approach channel (Dec 2008 winds)
148
Fig.A.4.21 Oil Spill trajectory due to Instantaneous spill of 700 tons HSD at Berth-1 (Dec 2008 winds)
149
Fig.A.4.22 Oil Spill trajectory due to Instantaneous spill of 700 tons HSD at Berth-2 (Dec 2008 winds)
150
Fig.A.4.23 Oil Spill trajectory due to Instantaneous spill of 700 tons HSD in turning circle (Dec 2008 winds)
151
Fig.A.4.24 Oil Spill trajectory due to Instantaneous spill of 700 tons HSD at entrance of the Port (Dec 2008 winds)
152
Fig.A.4.25 Oil Spill trajectory due to Instantaneous spill of 700 tons HSD in the approach channel (Dec 2008 winds)
153
Fig.A.4.26 Oil Spill trajectory due to Instantaneous spill of 700 tons Crude oil at Berth-1 (Dec 2008 winds)
154
Fig.A.4.27 Oil Spill trajectory due to Instantaneous spill of 700 tons Crude oil at Berth-2 (Dec 2008 winds)
155
Fig.A.4.28 Oil Spill trajectory due to Instantaneous spill of 700 tons Crude in turning circle (Dec 2008 winds)
156
Fig.A.4.29 Oil Spill trajectory due to Instantaneous spill of 700 tons Crude at entrance of the port (Dec 2008 winds)
157
Fig.A.4.30 Oil Spill trajectory due to Instantaneous spill of 700 tons Crude in approach channel (Dec 2008 winds)
158
Fig.A.4.31 Oil Spill trajectory due to leakage of FO (2200 m3/hr for 1 min) at Berth-1 (Dec 2008 winds)
159
Fig.A.4.32 Oil Spill trajectory due to leakage of FO (2200 m3/hr for 1 min) at Berth-2 (Dec 2008 winds)
160
Fig.A.4.33 Oil Spill trajectory due to leakage of HSD (2200 m3/hr for 1 min) at Berth-1 (Dec 2008 winds)
161
Fig. A.4.34 Oil Spill trajectory due to leakage of HSD (2200 m3/hr for 1 min) at Berth-2 (Dec 2008 winds)
162
Fig.A.4.35. Oil Spill trajectory due to leakage of Crude (2200 m3/hr for 1 min) at Berth-1 (Dec 2008 winds)
163
Fig.A.4.36 Oil Spill trajectory due to leakage of Crude (2200 m3/hr for 1 min) at Berth-2 (Dec 2008 winds) (2200 m3/hr for 1 min) at Berth-2 (Dec 2008 winds)
164
Fig.A.4.37 Oil Spill trajectory due to leakage of HSD of 100 tons for 3 days at the entrance of the Port (Dec 2008 winds)
165
Fig.A.4.38 Oil Spill trajectory due to leakage of HSD of 100 tons for 3 days In the approach channel (Dec 2008 winds)
166

vi
Fig.A.4.39 Oil Spill trajectory due to leakage of FO of 100 tons for 3 days at the entrance of the Port (Dec 2008 winds)
167
Fig.A.4.40 Oil Spill trajectory due to leakage of FO of 100 tons for 3 days In the approach channel (Dec 2008 winds)
168
Fig. A.4.41 Oil Spill trajectory due to leakage of HSD of 700 tons for 3 days at the entrance of the Port (Dec 2008 winds)
169
Fig. A.4.42 Oil Spill trajectory due to leakage of HSD of 700 tons for 3 days In the approach channel (Dec 2008 winds)
170
Fig. A.4.43 Oil Spill trajectory due to leakage of FO of 700 tons for 3 days at the entrance of the Port (Dec 2008 winds)
171
Fig. A.4.44 Oil Spill trajectory due to leakage of FO of 700 tons for 3 days In the approach channel (Dec 2008 winds)
172
Fig.A.5. 1 Oil Spill trajectory due to Instantaneous spill of 100 tons FO at Cargo Berth-1 (Mar 2009 winds)
173
Fig.A.5. 2 Oil Spill trajectory due to Instantaneous spill of 100 tons FO at Cargo Berth-2 (Mar 2009 winds)
174
Fig. A. 5. 3 Oil Spill trajectory due to Instantaneous spill of 100 tons FO in Turning circle (Mar 2009 winds)
175
Fig. A. 5. 4 Oil Spill trajectory due to Instantaneous spill of 100 tons FO at entrance of port (Mar 2009 winds)
176
Fig. A. 5. 5 Oil Spill trajectory due to Instantaneous spill of 100 tons FO in approach channel (Mar 2009 winds)
177
Fig. A. 5. 6 Oil Spill trajectory due to Instantaneous spill of 100 tons HSD at Berth-1 (Mar 2009 winds)
178
Fig. A. 5. 7 Oil Spill trajectory due to Instantaneous spill of 100 tons HSD at Berth-2 (Mar 2009 winds)
179
Fig. A. 5. 8 Oil Spill trajectory due to Instantaneous spill of 100 tons HSD in turning circle (Mar 2009 winds)
180
Fig. A. 5.9 Oil Spill trajectory due to Instantaneous spill of 100 tons HSD at entrance of the Port (Mar 2009 winds)
181
Fig.A.5.10 Oil Spill trajectory due to Instantaneous spill of 100 tons HSD in the approach channel (Mar 2009 winds
182
Fig.A.5.11 Oil Spill trajectory due to Instantaneous spill of 100 tons Crude oil at Berth-1 (Mar 2009 winds)
183
Fig.A.5.12 Oil Spill trajectory due to Instantaneous spill of 100 tons Crude oil at Berth-2 (Mar 2009 winds)
184
Fig.A.5.13 Oil Spill trajectory due to Instantaneous spill of 100 tons Crude in turning circle (Mar 2009 winds)
185
Fig. A.5.14 Oil Spill trajectory due to Instantaneous spill of 100 tons Crude at entrance of the port (Mar 2009 winds)
186
Fig. A.5.15 Oil Spill trajectory due to Instantaneous spill of 100 tons Crude in approach channel (Mar 2009 winds)
187
Fig.A.5.16 Oil Spill trajectory due to Instantaneous spill of 700 tons FO at Cargo Berth-1 (Mar 2009 winds)
188
Fig.A.5. 17 Oil Spill trajectory due to Instantaneous spill of 700 tons FO at CargoBerth-2(Mar 2009 winds)
189
Fig.A.5. 18 Oil Spill trajectory due to Instantaneous spill of 700 tons FO in Turning circle (Mar 2009 winds)
190
Fig.A.5. 19 Oil Spill trajectory due to Instantaneous spill of 700 tons FO at entrance of port (Mar 2009 winds)
191
Fig.A.5.20 Oil Spill trajectory due to Instantaneous spill of 700 tons FO in approach channel (Mar 2009 winds)
192
Fig.A.5.21 Oil Spill trajectory due to Instantaneous spill of 700 tons HSD at Berth-1(Mar 2009 winds)
193
Fig.A.5. 22 Oil Spill trajectory due to Instantaneous spill of 700 tons HSD at Berth-2(Mar 2009 winds)
194
Fig.A.5. 23 Oil Spill trajectory due to Instantaneous spill of 700 tons HSD in turning circle (Mar 2009 winds)
195
Fig.A.5. 24 Oil Spill trajectory due to Instantaneous spill of 700 tons HSD at 196

vii
entrance of the Port (Mar 2009 winds) Fig.A.5. 25 Oil Spill trajectory due to Instantaneous spill of 700 tons HSD in the
approach channel (Mar 2009 winds) 197
Fig.A.5. 26 Oil Spill trajectory due to Instantaneous spill of 700 tons Crude oil at Berth-1(Mar 2009 winds)
198
Fig.A.5. 27 Oil Spill trajectory due to Instantaneous spill of 700 tons Crude oil atBerth-2 (Mar 2009 winds)
199
Fig.A.5. 28 Oil Spill trajectory due to Instantaneous spill of 700 tons Crude in turning circle (Mar 2009 winds)
200
Fig.A.5. 29 Oil Spill trajectory due to Instantaneous spill of 700 tons Crude at entrance of the port (Mar 2009 winds)
201
Fig.A.5.30 Oil Spill trajectory due to Instantaneous spill of 700 tons Crude in approach channel (Mar 2009 winds)
202
Fig.A.5.31 Oil Spill trajectory due to leakage of FO (2200 m3/hr for 1 min) at Berth-1 (Mar 2009 winds)
203
Fig.A.5.32 Oil Spill trajectory due to leakage of FO (2200 m3/hr for 1 min) at Berth-2 (Mar 2009 winds)
204
Fig.A.5.33 Oil Spill trajectory due to leakage of HSD (2200 m3/hr for 1 min) at Berth-1 (Mar 2009 winds)
205
Fig.A.5.34 Oil Spill trajectory due to leakage of HSD (2200 m3/hr for 1 min) at Berth-2 (Mar 2009 winds)
206
Fig.A.5.35 Oil Spill trajectory due to leakage of Crude (2200 m3/hr for 1 min) at Berth-1 (Mar 2009 winds)
207
Fig.A.5.36 Oil Spill trajectory due to leakage of Crude (2200 m3/hr for 1 min) at Berth-2 (Mar 2009 winds)
208
Fig.A.5.37 Oil Spill trajectory due to leakage of HSD of 100 tons for 3 days at the entrance of the Port (Mar 2009 winds)
209
Fig.A.5.38 Oil Spill trajectory due to leakage of HSD of 100 tons for 3 days In the approach channel (Mar 2009 winds)
210
Fig.A.5.39 Oil Spill trajectory due to leakage of FO of 100 tons for 3 days at the entrance of the Port (Mar 2009 winds)
211
Fig.A.5.40 Oil Spill trajectory due to leakage of FO of 100 tons for 3 days In the approach channel (Mar 2009 winds)
212
Fig. A.5.41 Oil Spill trajectory due to leakage of HSD of 700 tons for 3 days at the entrance of the Port (Mar 2009 winds)
213
Fig. A.5.42 Oil Spill trajectory due to leakage of HSD of 700 tons for 3 days In the approach channel (Mar 2009 winds)
214
Fig. A.5.43 Oil Spill trajectory due to leakage of FO of 700 tons for 3 days at the entrance of the Port (Mar 2009 winds)
215
Fig. A.5.44 Oil Spill trajectory due to leakage of FO of 700 tons for 3 days In the approach channel (Mar 2009 winds)
216
Fig. A. 6. 1 Oil Spill trajectory due to Instantaneous spill of 100 tons FO at Cargo Berth-1 (Jun 2009 winds)
217
Fig. A. 6. 2 Oil Spill trajectory due to Instantaneous spill of 100 tons FO at Cargo Berth-2 (Jun 2009 winds)
218
Fig. A. 6. 3 Oil Spill trajectory due to Instantaneous spill of 100 tons FO in Turning circle (Jun 2009 winds)
219
Fig. A. 6. 4 Oil Spill trajectory due to Instantaneous spill of 100 tons FO at entrance of port (Jun 2009 winds)
220
Fig. A. 6. 5 Oil Spill trajectory due to Instantaneous spill of 100 tons FO in approach channel (Jun 2009 winds)
221
Fig. A. 6. 6 Oil Spill trajectory due to Instantaneous spill of 100 tons HSD at Berth-1 (Jun 2009 winds)
222
Fig. A. 6. 7 Oil Spill trajectory due to Instantaneous spill of 100 tons HSD at Berth-2 (Jun 2009 winds)
223
Fig. A. 6.8 Oil Spill trajectory due to Instantaneous spill of 100 tons HSD in turning circle (Jun 2009 winds)
224
Fig. A. 6. 9 Oil Spill trajectory due to Instantaneous spill of 100 tons HSD at 225

viii
entrance of the Port (Jun 2009 winds) Fig.A.6. 10 Oil Spill trajectory due to Instantaneous spill of 100 tons HSD in the
approach channel (Jun 2009 winds) 226
Fig.A.6. 11 Oil Spill trajectory due to Instantaneous spill of 100 tons Crude oil at Berth-1 (Jun 2009 winds)
227
Fig.A.6. 12 Oil Spill trajectory due to Instantaneous spill of 100 tons Crude oil at Berth-2 (Jun 2009 winds)
228
Fig.A.6.13 Oil Spill trajectory due to Instantaneous spill of 100 tons Crude in turning circle (Jun 2009 winds)
229
Fig.A.6. 14 Oil Spill trajectory due to Instantaneous spill of 100 tons Crude at entrance of the port (Jun 2009 winds)
230
Fig.A.6.15 Oil Spill trajectory due to Instantaneous spill of 100 tons Crude in approach channel (Jun 2009 winds)
231
Fig.A.6.16 Oil Spill trajectory due to Instantaneous spill of 700 tons FO at Cargo Berth-1 (Jun 2009 winds)
232
Fig.A.6. 17 Oil Spill trajectory due to Instantaneous spill of 700 tons FO at Cargo Berth-2 (Jun 2009 winds)
233
Fig.A.6. 18 Oil Spill trajectory due to Instantaneous spill of 700 tons FO in Turning circle (Jun 2009 winds)
234
Fig.A.6.19 Oil Spill trajectory due to Instantaneous spill of 700 tons FO at entrance of port (Jun 2009 winds)
235
Fig.A.6.20 Oil Spill trajectory due to Instantaneous spill of 700 tons FO in approach channel (Jun 2009 winds)
236
Fig.A.6. 21 Oil Spill trajectory due to Instantaneous spill of 700 tons HSD at Berth-1(Jun 2009 winds)
237
Fig.A.6. 22 Oil Spill trajectory due to Instantaneous spill of 700 tons HSD at Berth-2 (Jun 2009 winds)
238
Fig.A.6. 23 Oil Spill trajectory due to Instantaneous spill of 700 tons HSD in turning circle (Jun 2009 winds)
239
Fig.A.6. 24 Oil Spill trajectory due to Instantaneous spill of 700 tons HSD at entrance of the Port (Jun 2009 winds)
240
Fig.A.6. 25 Oil Spill trajectory due to Instantaneous spill of 700 tons HSD in the approach channel (Jun 2009 winds)
241
Fig.A.6. 26 Oil Spill trajectory due to Instantaneous spill of 700 tons Crude oil at Berth-1 (Jun 2009 winds)
242
Fig.A.6. 27 Oil Spill trajectory due to Instantaneous spill of 700 tons Crude oil at Berth-2 (Jun 2009 winds)
243
Fig.A.6. 28 Oil Spill trajectory due to Instantaneous spill of 700 tons Crude in turning circle (Jun 2009 winds)
244
Fig.A.6. 29 Oil Spill trajectory due to Instantaneous spill of 700 tons Crude at entrance of the port (Jun 2009 winds)
245
Fig.A.6.30 Oil Spill trajectory due to Instantaneous spill of 700 tons Crude in approach channel (Jun 2009 winds)
246
Fig. A.6.31 Oil Spill trajectory due to leakage of FO (2200 m3/hr for 1 min) at Berth-1 (Jun 2009 winds)
247
Fig.A.6.32 Oil Spill trajectory due to leakage of FO (2200 m3/hr for 1 min) at Berth-2 (Jun 2009 winds)
248
Fig.A.6.33 Oil Spill trajectory due to leakage of HSD (2200 m3/hr for 1 min) at Berth-1 (Jun 2009 winds)
249
Fig.A.6.34 Oil Spill trajectory due to leakage of HSD (2200 m3/hr for 1 min) at Berth-2 (Jun 2009 winds)
250
Fig. A.6.35 Oil Spill trajectory due to leakage of Crude (2200 m3/hr for 1 min) at Berth-1 (Jun 2009 winds)
251
Fig.A.6.36 Oil Spill trajectory due to leakage of Crude (2200 m3/hr for 1 min) at Berth-2 (Jun 2009 winds)
252
Fig.A.6.37 Oil Spill trajectory due to leakage of HSD of 100 tons for 3 days at the entrance of the Port (June 2009 winds)
253
Fig.A.6.38 Oil Spill trajectory due to leakage of HSD of 100 tons for 3 days In the approach channel (June 2009 winds)
254
ix
Fig.A.6.39 Oil Spill trajectory due to leakage of FO of 100 tons for 3 days at the entrance of the Port (June 2009 winds)
255
Fig. A.6.40 Oil Spill trajectory due to leakage of FO of 100 tons for 3 days In the approach channel (June 2009 winds)
256
Fig. A.6.41 Oil Spill trajectory due to leakage of HSD of 700 tons for 3 days at the entrance of the Port (June 2009 winds)
257
Fig. A.6.42 Oil Spill trajectory due to leakage of HSD of 700 tons for 3 days In the approach channel (June 2009 winds)
258
Fig. A.6.43 Oil Spill trajectory due to leakage of FO of 700 tons for 3 days at the entrance of the Port (June 2009 winds)
259
Fig. A.6.44 Oil Spill trajectory due to leakage of FO of 700 tons for 3 days In the approach channel (June 2009 winds)
260
Fig. A.7.1 Variation of oil volume, spill radius, oil density and volumes of evaporated, dissolved and emulsified oil (FO spill of 100 tons at Berth-1 during December 2008 Winds)
261
Fig. A.7.2 Variation of oil volume, spill radius, oil density and volumes of evaporated, dissolved and emulsified oil (FO spill of 700 tons at Berth-1 during December 2008 Winds)
262
Fig. A.7.3 Variation of oil volume, spill radius, oil density and volumes of evaporated, dissolved and emulsified oil (FO continuous spill of 100 tons for 3 days at approach channel during December 2008 Winds)
263
Fig. A.7.4 Variation of oil volume, spill radius, oil density and volumes of evaporated, dissolved and emulsified oil (FO continuous spill of 700 tons for 3 days at approach channel during -December 2008 Winds)
264
Fig. A.7.5 Variation of oil volume, spill radius, oil density and volumes of evaporated, dissolved and emulsified oil (Crude oil spill of 100 tons at Berth-1 during December 2008 Winds)
265
Fig. A.7.6 Variation of oil volume, spill radius, oil density and volumes of evaporated, dissolved and emulsified oil (Crude oil spill of 700 tons at Berth-1 during December 2008 Winds)
266
Fig. A.7.7 Variation of oil volume, spill radius, oil density and volumes of evaporated, dissolved and emulsified oil (Crude continuous spill of 100 tons for 3 days at approach channel during December2008Winds)
267
Fig. A.7.8 Variation of oil volume, spill radius, oil density and volumes of evaporated, dissolved and emulsified oil (HSD continuous spill of 700 tons for 3 days at approach channel during December 2008 Winds)
268
Fig. A.7.9 Variation of oil volume, spill radius, oil density and volumes of evaporated, dissolved and emulsified oil (HSD spill of 100 tons at Berth-1 during December 2008 Winds)
269
Fig. A.7.10 Variation of oil volume, spill radius, oil density and volumes of evaporated, dissolved and emulsified oil (HSD spill of 100 tons at Berth-1 during December 2008 Winds)
270
Fig. A.7.11 Variation of oil volume, spill radius, oil density and volumes of evaporated, dissolved and emulsified oil (HSD spill of 700 tons at Berth-1 during December 2008 Winds)
271
Fig. A.8.1 Variation of oil volume, spill radius, oil density and volumes of evaporated, dissolved and emulsified oil (FO spill of 100 tons at Berth-1 during March 2009 winds)
272
Fig. A.8.2 Variation of oil volume, spill radius, oil density and volumes of evaporated, dissolved and emulsified oil (FO spill of 700 tons at Berth-1 during March 2009 winds)
273
Fig. A.8.3 Variation of oil volume, spill radius, oil density and volumes of evaporated, dissolved and emulsified oil (FO continuous spill of 100 tons for 3 days at approach channel during March 2009 winds)
274
Fig. A.8.4 Variation of oil volume, spill radius, oil density and volumes of evaporated, dissolved and emulsified oil (FO continuous spill of 700 tons for 3 days at approach channel during March 2009 winds)
275
Fig. A.8.5 Variation of oil volume, spill radius, oil density and volumes of evaporated, dissolved and emulsified oil (Crude oil spill of 100 tons at Berth-1 during
276
x
March 2009 winds) Fig. A.8.6 Variation of oil volume, spill radius, oil density and volumes of evaporated,
dissolved and emulsified oil (Crude oil spill of 700 tons at Berth-1 during March 2009 winds)
277
Fig. A.8.7 Variation of oil volume, spill radius, oil density and volumes of evaporated, dissolved and emulsified oil (HSD continuous spill of 100 tons for 3 days at approach channel during March 2009 winds)
278
Fig. A.8.8 Variation of oil volume, spill radius, oil density and volumes of evaporated, dissolved and emulsified oil (HSD continuous spill of 700 tons for 3 days at approach channel during March 2009 winds)
279
Fig. A.8.9 Variation of oil volume, spill radius, oil density and volumes of evaporated, dissolved and emulsified oil (HSD spill of 100 tons at Berth-1 during March 2009 winds)
280
Fig. A.8.10 Variation of oil volume, spill radius, oil density and volumes of evaporated, dissolved and emulsified oil (HSD spill of 700 tons at Berth-1 during March 2009 winds)
281
Fig. A.9.1 Variation of oil volume, spill radius, oil density and volumes of evaporated, dissolved and emulsified oil (FO spill of 100 tons at Berth-1 during June 2009 Winds)
282
Fig. A.9.2 Variation of oil volume, spill radius, oil density and volumes of evaporated, dissolved and emulsified oil (FO spill of 700 tons at Berth-1 during June 2009 Winds)
283
Fig. A.9.3 Variation of oil volume, spill radius, oil density and volumes of evaporated, dissolved and emulsified oil (FO continuous spill of 100 tons for 3 days at approach channel during June 2009 Winds)
284
Fig. A.9.4 Variation of oil volume, spill radius, oil density and volumes of evaporated, dissolved and emulsified oil (FO continuous spill of 700 tons for 3 days at approach channel during June 2009 Winds)
285
Fig. A.9.5 Variation of oil volume, spill radius, oil density and volumes of evaporated, dissolved and emulsified oil (Crude oil spill of 100 tons at Berth-1 during June 2009 Winds)
286
Fig. A.9.6 Variation of oil volume, spill radius, oil density and volumes of evaporated, dissolved and emulsified oil (Crude oil spill of 700 tons at Berth-1 during June 2009 Winds)
287
Fig. A.9.7 Variation of oil volume, spill radius, oil density and volumes of evaporated, dissolved and emulsified oil (Crude continuous spill of 100 tons for 3 days at approach channel during June 2009 Winds)
288
Fig. A.9.8 Variation of oil volume, spill radius, oil density and volumes of evaporated, dissolved and emulsified oil (Crude continuous spill of 700 tons for 3 days at approach channel during June 2009 Winds)
289
Fig. A.9.9 Variation of oil volume, spill radius, oil density and volumes of evaporated, dissolved and emulsified oil (HSD spill of 100 tons at Berth-1 during June 2009 Winds)
290
Fig. A.910 Variation of oil volume, spill radius, oil density and volumes of evaporated, dissolved and emulsified oil (HSD spill of 700 tons at Berth-1 during June 2009 Winds)
291
Oil Spill Risk Assessment and Contingency Plan
Adani Hazira Port Private Limited, Hazira
Preface and Executive Summary
Revision No: 1
Page No: i
PREFACE
Adani Hazira Port Private Limited (AHPPL), Hazira - requested the Environ
Software (P) Ltd, Bangalore to carry out oil spill risk analysis and oil spill
contingency plan for the proposed Multi-Cargo Port at Hazira.
This report contains the Strategy Plan which describes the scope of the plan
including geographical coverage, oil spill modeling studies, perceived risks,
spill response and clean-up strategy, equipment, storage facilities,
responsibilities and action plans, communication, etc.
The report also presents the characteristics and weathering processes of oil,
the impact of oil spills on the marine environment and agencies to be informed
in case of emergency. The report elaborates on the strategy plan for the oil
spill as per IMO guidelines as well as the responsibilities of regional and
national oil spill combating agencies.
We express our gratitude to Mr. Saurabh Antani and Mr. Mehul Patel, Adani
Hazira Port Private limited, for extending full co-operation to the successful
completion of this project. We acknowledge the valuable information provided
by the officials of AHPPL, Hazira.
Dr.G. S. Reddy (Managing Director)

Oil Spill Risk Assessment and Contingency Plan
Adani Hazira Port Private Limited, Hazira
Preface and Executive Summary
Revision No: 1
Page No: ii
EXECUTIVE SUMMARY
On the basis of the issued Terms of Reference (ToR) by Ministry of
Environment & Forest, Delhi and also in compliance to the Oil Industry Safety
Directorate (OISD), who has decided that all the Ports and Oil Companies
should create Tier-I facilities to combat the oil spill, AHPPL requested Environ
Software (P) Ltd, Bangalore, to carry out oil spill risk analysis and oil spill
contingency plan for the proposed Multi-Cargo Port by Adani Hazira Port Pvt.
Limited, Hazira. AHPPL proposes to arrange the oil fighting equipment/gears
based on the oil spill response plan and recommendations given by
ENVIRON and give the overall responsibility to Adani Hazira Port Authority for
maintenance and combating oil spills.
Objectives
Risk analysis for all operations with respect to oil spills in and around the Muti-Cargo Port.
Oil spill modeling for spillage in the vicinity of the south and north break waters.
Identification of all the potential oil spill scenarios from the Port.
Quantitative assessment of the impact of each scenario.
Various spill scenarios shall be ranked based on the probability and consequence.
Prediction of trajectories of the spills in marine environment under various meteorological and hydrological conditions in different spill scenarios.
Identification of probable impact areas and magnitude of sequence.
To prepare an appropriate contingency oil spill response plan to match the perceived risk.
Preparation of guidelines for setting up Tier-1 facilities.

Oil Spill Risk Assessment and Contingency Plan
Adani Hazira Port Private Limited, Hazira
Preface and Executive Summary
Revision No: 1
Page No: iii
Approach Study
Hydrodyn-OILSOFT has been validated successfully based on the available tide and current data.
The software has been run for various seasons to study the hydraulic behaviour of the Gulf of Khambhat, in and around Multi-cargo Port in particular.
Several computational runs have been made for predicting the fate and weathering processes of HSD, Crude and Fuel Oil spills at Port and approach channel area.
The spill quantity has been selected as per Tier–I specification Fuel oils have been considered to have more impact on the environment
rather than other refined products.
Study has been carried out for operational leakage at port during loading/unloading operations as well as for accidental spills.
The details of spill volume and time taken to reach the coast and losses during its movement for various seasons have been furnished in the report
The weathering processes of HSD, Crude and Fuel Oil at Port and approach channel for three seasons have been presented graphically.
Resources such as, marine sensitive areas, tidal flats, islands and coastal areas which are likely to be threatened from oil spills have been identified.
Oil spill contingency plan has been prepared as per IMO guidelines.
Strategy and Operational plans have been discussed in detail and formulated based on the risk analysis.
Oil Spill Risk Assessment and Contingency Plan
Adani Hazira Port Private Limited, Hazira
Preface and Executive Summary
Revision No: 1
Page No: iv
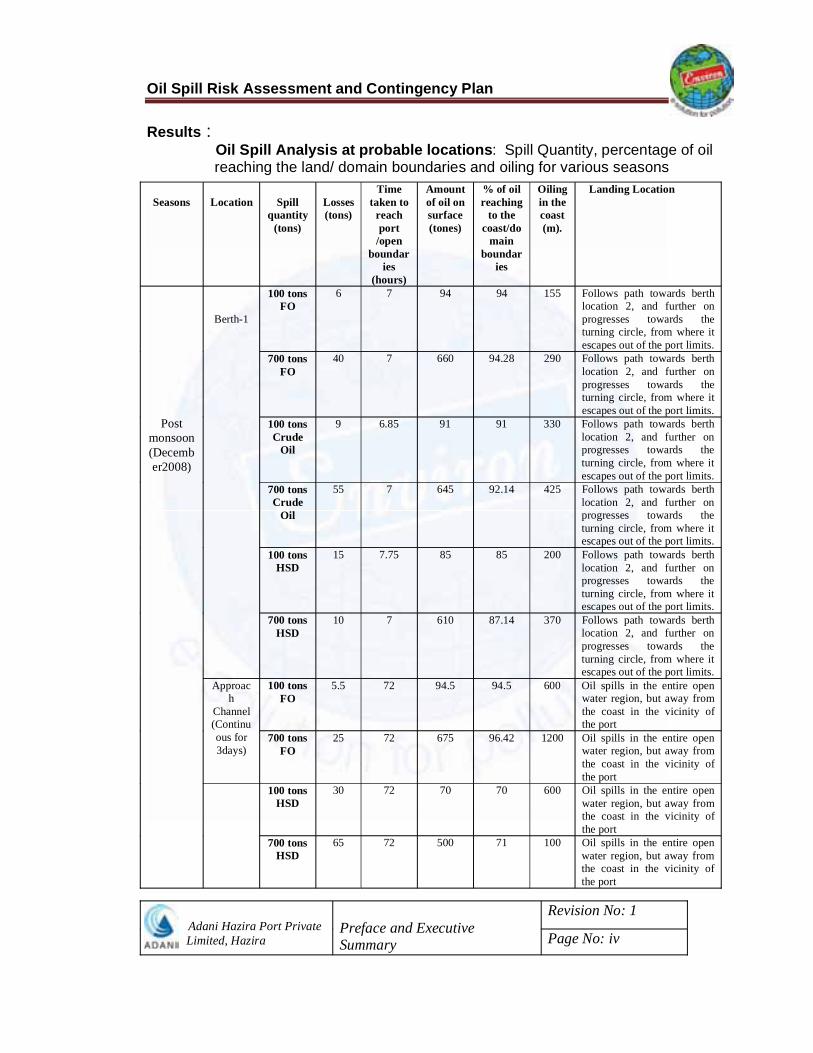
Results : Oil Spill Analysis at probable locations: Spill Quantity, percentage of oil
reaching the land/ domain boundaries and oiling for various seasons
Seasons Location Spill quantity
(tons)
Losses (tons)
Time taken to
reach port
/open boundar
ies(hours)
Amount of oil on surface (tones)
% of oil reaching
to the coast/do
main boundar
ies
Oiling in the coast (m).
Landing Location
Post monsoon (December2008)
Berth-1
100 tons FO
6 7 94 94 155 Follows path towards berth location 2, and further on progresses towards the turning circle, from where it escapes out of the port limits.
700 tons FO
40 7 660 94.28 290 Follows path towards berth location 2, and further on progresses towards the turning circle, from where it escapes out of the port limits.
100 tons Crude
Oil
9 6.85 91 91 330 Follows path towards berth location 2, and further on progresses towards the turning circle, from where it escapes out of the port limits.
700 tons Crude
Oil
55 7 645 92.14 425 Follows path towards berth location 2, and further on progresses towards the turning circle, from where it escapes out of the port limits.
100 tons HSD
15 7.75 85 85 200 Follows path towards berth location 2, and further on progresses towards the turning circle, from where it escapes out of the port limits.
700 tons HSD
10 7 610 87.14 370 Follows path towards berth location 2, and further on progresses towards the turning circle, from where it escapes out of the port limits.
Approach
Channel(Continuous for 3days)
100 tons FO
5.5 72 94.5 94.5 600 Oil spills in the entire open water region, but away from the coast in the vicinity of the port
700 tons FO
25 72 675 96.42 1200 Oil spills in the entire open water region, but away from the coast in the vicinity of the port
100 tons HSD
30 72 70 70 600 Oil spills in the entire open water region, but away from the coast in the vicinity of the port
700 tons HSD
65 72 500 71 100 Oil spills in the entire open water region, but away from the coast in the vicinity of the port

Oil Spill Risk Assessment and Contingency Plan
Adani Hazira Port Private Limited, Hazira
Preface and Executive Summary
Revision No: 1
Page No: v
Seasons Location Spill
quantity (tons)
Losses(tons)
Time taken to
reachport
/open boundari
es(hours)
Amount of oil on surface (tones)
% of oil reaching
to the coast/dom
ain boundarie
s
Oiling in the coast (m).
Landing Location
Monsoon (June-2009)
Berth-1
100 tons FO
4 2.35 96 96 115 Towards the northern side of the channel
700 tons FO
30 2.35 670 95.7 220 Towards the northern side of the channel
100 tons Crude
Oil
6 2.3 94 94 130 Towards the northern side of the channel
700 tons Crude
Oil
30 2.3 670 95.7 250 Towards the northern side of the channel
100 tons HSD
10 2.5 90 90 160 Towards the northern side of the channel
700 tons HSD
45 2 655 93.57 280 Towards the northern side of the channel
Approach
Channel(Continuous for 3days)
100 tons FO
18 55 55 78.57 380 Oil spills in the entire open water region, but towards the coast in the vicinity of the port
700 tons FO
90 55 370 74 700
Oil spills in the entire open water region, but towards the coast in the vicinity of the port
100 tons HSD
35 55 40 57 400 Oil spills in the entire open water region, but towards the coast in the vicinity of the port
700 tons HSD
190 55 320 64 800 Oil spills in the entire open water region, but towards the coast in the vicinity of the port
Oil Spill Risk Assessment and Contingency Plan
Adani Hazira Port Private Limited, Hazira
Preface and Executive Summary
Revision No: 1
Page No: vi
` Seasons Location Spill
quantity (tons)
Losses(tons)
Time taken to
reachport
/openboundari
es(hours)
Amount of oil on surface (tones)
% of oil reaching
to the coast/dom
ain boundarie
s
Oiling in the coast (m).
Landing Location
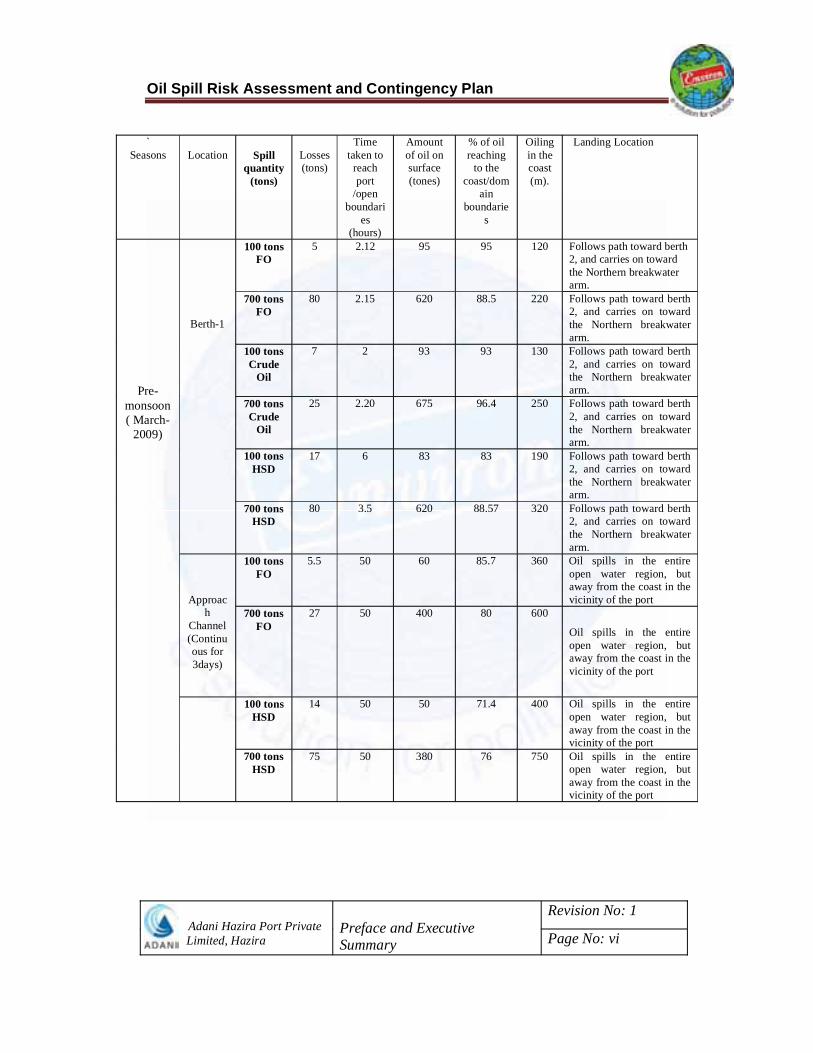
Pre-monsoon ( March-
2009)
Berth-1
100 tons FO
5 2.12 95 95 120 Follows path toward berth 2, and carries on toward the Northern breakwater arm.
700 tons FO
80 2.15 620 88.5 220 Follows path toward berth 2, and carries on toward the Northern breakwater arm.
100 tons Crude
Oil
7 2 93 93 130 Follows path toward berth 2, and carries on toward the Northern breakwater arm.
700 tons Crude
Oil
25 2.20 675 96.4 250 Follows path toward berth 2, and carries on toward the Northern breakwater arm.
100 tons HSD
17 6 83 83 190 Follows path toward berth 2, and carries on toward the Northern breakwater arm.
700 tons HSD
80 3.5 620 88.57 320 Follows path toward berth 2, and carries on toward the Northern breakwater arm.
Approach
Channel(Continuous for 3days)
100 tons FO
5.5 50 60 85.7 360 Oil spills in the entire open water region, but away from the coast in the vicinity of the port
700 tons FO
27 50 400 80 600
Oil spills in the entire open water region, but away from the coast in the vicinity of the port
100 tons HSD
14 50 50 71.4 400 Oil spills in the entire open water region, but away from the coast in the vicinity of the port
700 tons HSD
75 50 380 76 750 Oil spills in the entire open water region, but away from the coast in the vicinity of the port

Oil Spill Risk Assessment and Contingency Plan
Adani Hazira Port Private Limited, Hazira
Preface and Executive Summary
Revision No: 1
Page No: vii
PROJECT TEAM OF ENVIRON SOFTWARE (P) LTD G. S Reddy
Gourish Salgonkar
N M Anand
Lavanya
RESOURCE PERSONS OF AHPPL, HAZIRA Mr. Saurabh Antani
RESOURCE PERSONS OF NIO, RC, Mumbai
Dr. S N Gajbhiye Scientist-in-charge
R V Sarma Project Leader


Oil Spill Risk Assessment and Contingency Plan
Adani Hazira Port Private Limited, Hazira
IntroductionRevision No: 1
Page No: 1
1. INTRODUCTION
The location of the proposed Multi-cargo Port (Fig.1.1), Hazira by Adani Hazira
Port Private Limited (AHPPL) is situated on the West Side of the Hazira
Peninsula at approximately Latitude: 21o 06’ North, Longitude: 72o 37’ East.
The LNG terminal is situated in the inter-tidal zone directly west of the forest
boundary line. A corridor of 30 m width between the LNG terminal and the actual
forest boundary line is reserved for a future Northern rail link. The port layout
aims at maximum operability and expansion potential. Sufficient clearance to the
existing surroundings has been maintained, including a minimum encroachment
into the greenbelt and adequate distance to populated areas. The layout of the
complex allows space for future extension, without compromising desired safety
separation distances within the complex or to adjacent port activities.
Fig.1.1.1 Existing Layout of Port

Oil Spill Risk Assessment and Contingency Plan
Adani Hazira Port Private Limited, Hazira
IntroductionRevision No: 1
Page No: 2
1.1 Meteorological Parameters
Meteorological parameters include wind direction, rainfall, relative humidity and temperature, and visibility.
1.1.1 Rainfall The climate of the region has a regular seasonal variation determined by the
occurrence of 2 annual monsoons. The southwest monsoon period extends form
June to September. November to March is the period for the North East
monsoon. Most of the annual rainfall occurs during the south west monsoon, the
average monthly rainfall being about 45 cm. The average annual rainfall over 20
years is 193 cm.
Rainfall figures observed at Surat airport during a period of September 2007 to August 2008 are presented in Table -1.1:
Table 1-1 Monthly Rainfall Month (2007-2008) Monthly Total (mm) No. of Rainy Days
September 171.3 12October 0 0
November 0 0December 0 0January 0 0February 0 0
March 4.6 3April 0 0May 0 0June 158.5 7July 355.8 20
August 500.2 28Total 1190.4 70
The rainy season in the area extends from June to September. The mean total rainfall, during the monsoon period (June to September), has been recorded as 1190.4 mm at Surat Station. The rainfall data indicates that the rainfall is not spread through out the year since nearly 97.09 % of the total rainfall occurs during the periods from June to September.

Oil Spill Risk Assessment and Contingency Plan
Adani Hazira Port Private Limited, Hazira
IntroductionRevision No: 1
Page No: 3
1.1.2 Relative humidity and temperature
The records for Surat airport show an annual average humidity of 61.4 %, with a maximum of 100 % and a minimum of 11 %.
Table 1-2 Relative Humidity at Surat Airport Month
(2007-2008)Minimum
RH % Maximum
RH % Average
RH % September 47 100 79.8
October 17 98 68.2 November 21 88 55.6 December 20 99 60January 16 96 50.8 February 18 90 47.4
March 11 89 42.1 April 10 88 44.6 May 11 86 53.2 June 18 98 65.2July 50 96 81.7
August 49 97 87.7 Average 24 93.75 61.4
(Source: IMD)
The mean monthly average of Relative Humidity values for Surat station was recorded for 02.30 hrs, 05.30 hrs, 08.30 hrs, 11.30 hrs, 14.30 hrs, 17.30 hrs, 20.30 hrs and 23.30 hrs. Relative Humidity is generally high during the period from June to September. The diurnal variations are least during monsoon season. The diurnal variation is highest during summer period.
The information for Surat Airport on air temperatures was used for design purposes and is summarized below. The highest recorded temperature during September 2007 to August 2008 is 44.00C and the lowest recorded temperature is 9.00C.

Oil Spill Risk Assessment and Contingency Plan
Adani Hazira Port Private Limited, Hazira
IntroductionRevision No: 1
Page No: 4
Table 1-3 Air temperatures at Surat Airport Month
(2007-2008)Daily
minimum (°C) Daily
maximum (°C) Daily
Average (°C) September 21 37 29October 18 38 29November 13 35 25December 11 34 23January 9 33 21February 13 37 27March 16 40 26April 18 40 33May 21 44 36June 25 42 33July 26 40 27August 28 31 29Average 18.3 37.6
1.1.3 Visibility
Measurements taken over the last 28 years at Surat give a good overview of the visibility at the port location. The morning period, which is generally worse than the afternoon, is characterized by the figures presented in Table below:
Table 1-4 Monthly Visibility figures Month Up to 1 Km
(days) 1 to 4 Km (days)
January 0.9 4.0 February 0.4 4.0
March 0.3 3.0 April 0.0 0.7 May 0.0 0.2 June 0.0 1.0 July 0.0 2.0
August 0.1 1.9 September 0.1 1.2
October 0.1 0.7 November 0.3 1.6 December 0.6 2.0

Oil Spill Risk Assessment and Contingency Plan
Adani Hazira Port Private Limited, Hazira
IntroductionRevision No: 1
Page No: 5
Table 1-5 Annual visibility figures
1.1.4 Sea Conditions The details on sea condition parameters are as follows;
1.2 Waves Predominant waves entering the Multi-cargo Port, Hazira have periods within a
range of 6 – 10 s. These arise mainly just before and during the monsoons and
their direction of approach is mainly south-west. Waves inside the harbour are
refracted and diffracted into a constant pattern as they progress up the harbour.
They are substantially attenuated by the time they reach Multi-cargo Port, Hazira.
1.2.1 Cyclones
These may occur in the period May/ June or October/November. The last severe
cyclonic storm was experienced in 1982. Occasionally, sudden high winds also
occur during the fine weather period from N. E.
‘Climatological Tables of Observatories in India (1931-1960)’, an India
Meteorological Department publication, provided historical data of the region.
Surat is the nearest observatory of the met office. The climate at Hazira is
tropical and characterized by annual recurring seasons, as mentioned below in
Table 1.6. The long-term analysis of micro-meteorological conditions based on
30 years data, was carried out for the post-monsoon, winter and summer
seasons.
Up to 1 Km (days)
1 to 4 Km (days)
Morning 3 23Afternoon 0 3
Oil Spill Risk Assessment and Contingency Plan
Adani Hazira Port Private Limited, Hazira
IntroductionRevision No: 1
Page No: 6
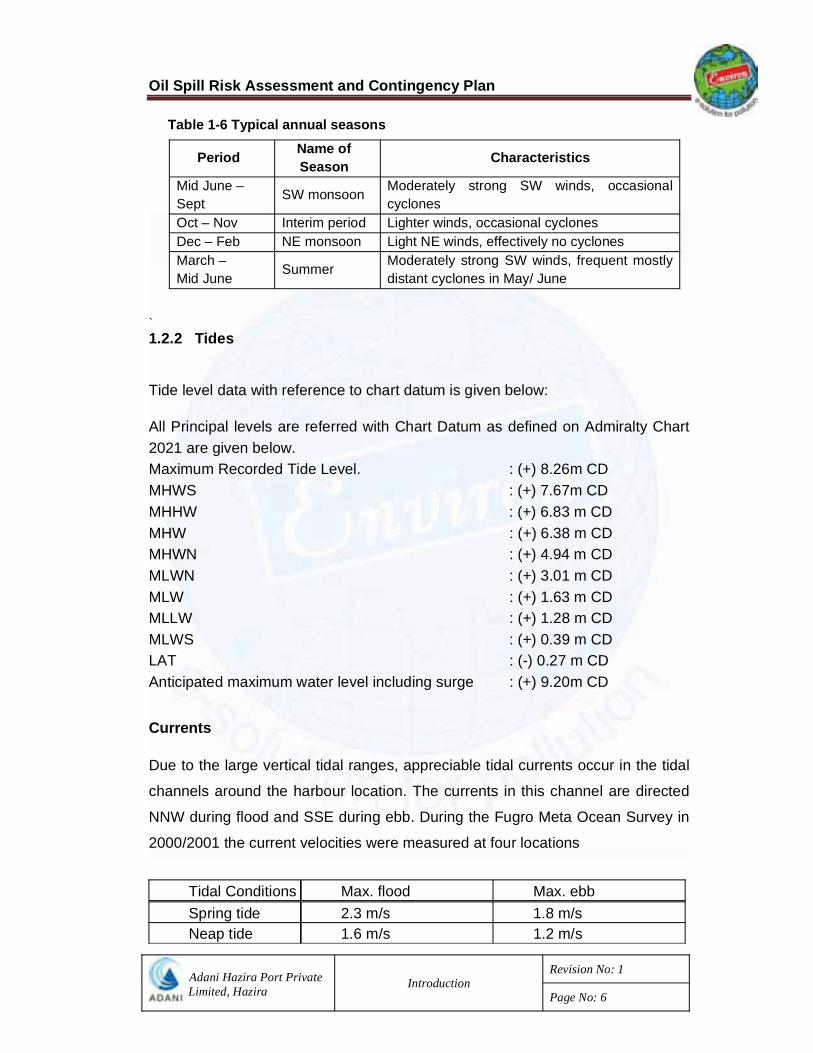
Table 1-6 Typical annual seasons
Period Name of Season Characteristics
Mid June – Sept SW monsoon Moderately strong SW winds, occasional
cyclones Oct – Nov Interim period Lighter winds, occasional cyclones Dec – Feb NE monsoon Light NE winds, effectively no cyclones March – Mid June Summer Moderately strong SW winds, frequent mostly
distant cyclones in May/ June
`1.2.2 Tides
Tide level data with reference to chart datum is given below:
All Principal levels are referred with Chart Datum as defined on Admiralty Chart 2021 are given below. Maximum Recorded Tide Level. : (+) 8.26m CD MHWS : (+) 7.67m CD MHHW : (+) 6.83 m CD MHW : (+) 6.38 m CD MHWN : (+) 4.94 m CD MLWN : (+) 3.01 m CD MLW : (+) 1.63 m CD MLLW : (+) 1.28 m CD MLWS : (+) 0.39 m CD LAT : (-) 0.27 m CD Anticipated maximum water level including surge : (+) 9.20m CD
Currents
Due to the large vertical tidal ranges, appreciable tidal currents occur in the tidal
channels around the harbour location. The currents in this channel are directed
NNW during flood and SSE during ebb. During the Fugro Meta Ocean Survey in
2000/2001 the current velocities were measured at four locations
Tidal Conditions Max. flood Max. ebb Spring tide 2.3 m/s 1.8 m/s Neap tide 1.6 m/s 1.2 m/s

Oil Spill Risk Assessment and Contingency Plan
Adani Hazira Port Private Limited, Hazira
IntroductionRevision No: 1
Page No: 7
The observed maximum flood velocities are generally higher than the ebb
velocities. This flood domination is associated with the total tidal volume. The
smaller ebb volume still produces considerable velocities, as the cross section of
the channel is also smaller during ebb, which may result from the lower water
levels and drying of large areas.
Meteorological effects
Special attention must be paid to wind driven currents. Two different situations
with respect to this phenomenon may be distinguished: persistent circulation by
monsoon winds short duration effects from storms or cyclones.
Monsoon winds and circulation
From March to September, during the SW monsoon, a clockwise circulation
persists in the Arabian Sea, south of the Gulf of Khambhat, for which the Pilot
predicts average rates of 1 knot up to 2 knots in more extreme conditions (see
figure 1). Along the West Coast of India this current will have a southerly
direction and will therefore deflect towards SE by the time it reaches the Gulf of
Khambhat. It may therefore be assumed that the coastal area in front of Hazira is
hardly influenced by this current.
In early September the SW Monsoon starts to retreat towards the SE. In October
and November there is a transitional period with light variable winds with sea and
land breezes. Occasional tropical cyclones may be experienced.
From November to January, during the NE monsoon, the circulation is reversed;
the most common sets are to NW, usually at rates of less than 0.5 knots. But
there is considerable variability particularly during the NE monsoon.
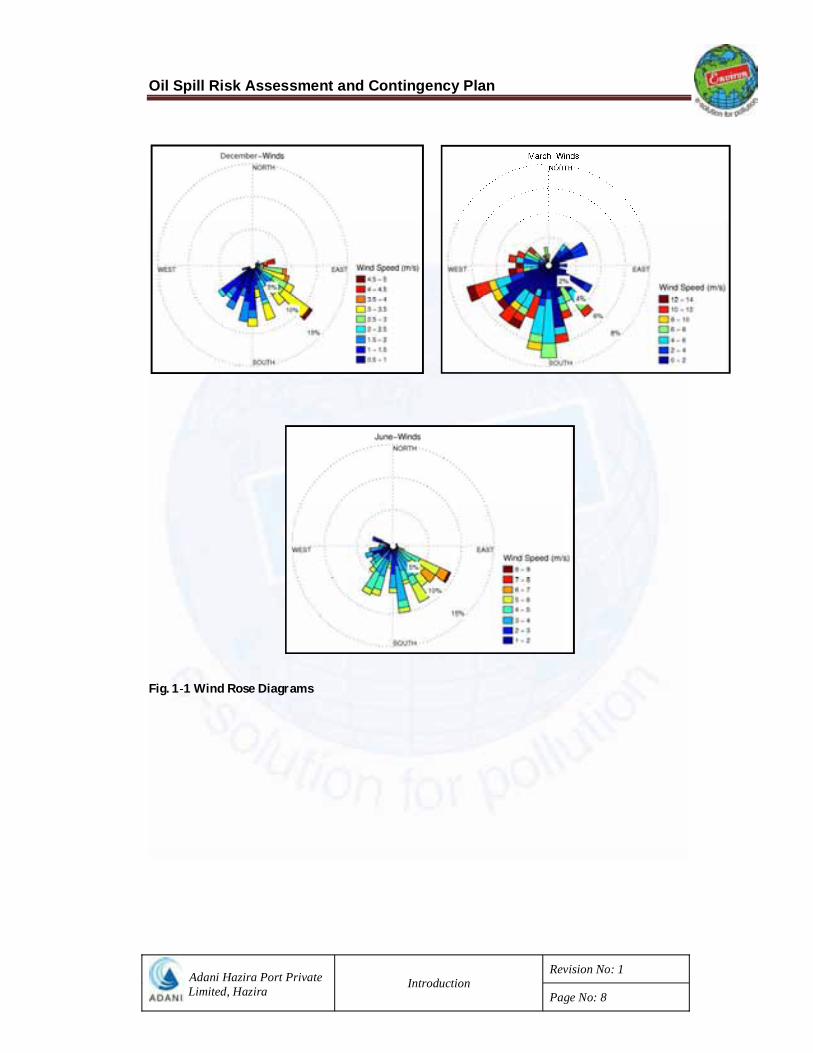
Wind conditions
Wind velocities were concluded from measured wind speed and direction at site by HPPL The prevailing wind direction is from 2400. The wind rose diagram and wind class frequency diagram for year 2009 has been shown below.
Oil Spill Risk Assessment and Contingency Plan
Adani Hazira Port Private Limited, Hazira
IntroductionRevision No: 1
Page No: 8
Fig. 1 1 Wind Rose Diagrams

Oil Spill Risk Assessment and Contingency Plan
Adani Hazira Port Private Limited, Hazira
IntroductionRevision No: 1
Page No: 9
Fig.1.3 Study area – terrain features in and around Adani Multi-cargo Port, Hazira

Oil Spill Risk Assessment and Contingency Plan
Adani Hazira Port Private Limited, Hazira
IntroductionRevision No: 1
Page No: 10
1.3 Project Information:
Adani Hazira Port Private Limited has proposed to construct Multi Cargo berths
in the Hazira Basin for loading / unloading operations. AHPPL proposes to have
general cargo construct Multi cargo terminal as well as dedicated liquid cargo
terminal as a part of its overall project development plan. It is expected that the
cargo traffic will have potential risk involved during their movement. The oil spills
would be due to collision/ grounding of the vessels while approaching the port as
well as berthing at jetty, loading and unloading of POL products etc.
The extent of damage caused by an oil spill depends upon the quantity of the oil
spilled, type of oil involved in the spillage and the oceanographic and
meteorological conditions prevailing in the location where the spill has occurred.
When the oil spills in large quantity, it temporarily effects the air-sea interaction
thus prevailing entry of oxygen from the atmosphere. Oil spills can also have a
serious economic impact on coastal activities and on those who exploit the
resources of the sea. In most cases, such damage is temporary and is caused
primarily by the physical properties of oil creating nuisance and hazardous
condition. The impact on marine life is compounded by toxicity and tainting
effects resulting from the chemical composition of oil. Other amenities that are
affected include mangrove forests, coral reefs, and several marine resources
including tourism industry.
The only challenge before any oil industry/Government agency is to tackle the
spill very efficiently and quickly so that the impact can be minimized. This can be
achieved provided there is well drawn Contingency Plan and enough resources.
Adani Hazira Port Private Limited (AHPPL), decided to carryout modeling studies
for Oil Spill Risk Assessment and Contingency planning for Adani Hazira Port,
predicting the oil weathering characteristics and spillage area at different time
Intervals and Prediction of Oil Spill trajectory due to cargo operational leakages

Oil Spill Risk Assessment and Contingency Plan
Adani Hazira Port Private Limited, Hazira
IntroductionRevision No: 1
Page No: 11
at Adani Hazira Port. In this connection AHPPL requires modeling report
describing the feasibility study in general about the present status and overall
response of the environment to the port activities pertaining to the oil spill due to
various marine facilities. Various numerical experiments have to be carried out in
the prediction of oil spill fate and weathering characteristics, trajectory and area
under various meteorological and environmental conditions.
In the present study, Hydrodyn-OILSOFT is used for prediction of fate and
transport of instantaneous or continuous oil spills and the associated risk due to
various cargo handling activities at AHPPL, Hazira.

Oil Spill Risk Assessment and Contingency Plan
Adani Hazira Port Private Limited, Hazira
Scope of the workRevision No: 1
Page No 12
2. SCOPE OF THE WORK
Adani Multi-cargo Port, Hazira Private Limited (AHPPL), Hazira - requested
the Environ Software (P) Ltd, Bangalore to carry out oil spill risk analysis and
oil spill contingency plan for proposed berths at Multi-cargo Port, Hazira.
2.1 Objectives
Risk analysis of oil spills at Adani Multi-cargo Port, Hazira and approach channel.
Oil spill modeling for spillage at Adani Multi-cargo Port, Hazira, and Cargo in the vicinity of the berths
Identification of all the potential oil spill scenarios from the oil spills.
Quantitative assessment of the impact of each scenario. Various spill scenarios shall be ranked based on the probability and
consequences. Prediction of trajectories of the spills in marine environment under various
meteorological and hydrological conditions in different spill scenarios.
Identification of probable impact areas and magnitude of sequence.
To prepare an appropriate contingency oil spill response plan to match the perceived risk.
Preparation of guidelines for setting up Tier-1 facilities.

Oil Spill Risk Assessment and Contingency Plan
Adani Hazira Port Private Limited, Hazira
Oil Characteristics and Weathering Processes
Revision No: 1
Page No: 13
3. OIL CHARACTERISTICS AND WEATHERING PROCESSES
Oil is considered as a major pollutant of the ocean. It enters the marine
environment through numerous sources. The most conspicuous source of oil
pollution is, of course, accidental spills from tankers due to collision/grounding
or from offshore drilling and production platforms.
When oil is spilled at sea, it undergoes a number of physical and chemical
changes, some of which lead to its disappearance from the sea surface.
Although spilt oil is eventually assimilated by the marine environment, the time
involved depends upon such factors as the amount of oil spilled; its initial
physical and chemical characteristics; the prevailing climatic and sea
conditions and whether the oil remains at sea or is washed ashore.
A knowledge of the process involved, and how they interact to alter the nature
and composition of the oil with time is valuable in preparing and implementing
contingency and oil spill response plan. On occasions, it may prove
unnecessary to mount a clean-up response if it can be confidently predicted
that the oil will drift away from vulnerable areas or dissipate naturally before
reaching them. Often, however, an active response will be necessary, aimed
either at accelerating the natural processes through the use of dispersants, or
limiting spreading by means of containment methods.
3.1 Composition of Oil
Crude oil is an extremely complex mixture of hydrocarbons ranging in
molecular weight from 16 (methane) to possibly 100,000. In addition to
carbon and hydrogen, these hydrocarbons may also contain small quantities
of oxygen, sulfur, and nitrogen and trace amounts of metals. The number of
individual compounds making up what is called petroleum is in the hundreds
of thousands, and may approach 1 million discrete compounds. These
materials cover a wide range of boiling points from volatile to waxy residues.
Oil Spill Risk Assessment and Contingency Plan
Adani Hazira Port Private Limited, Hazira
Oil Characteristics and Weathering Processes
Revision No: 1
Page No: 14
In addition, composition varies widely from source to source. Even refined
products, such as gasoline or fuel oils, which are processed to obtain selected
portions of crude oil, are still complicated mixtures that have not been
completely defined.
The three principal classes of hydrocarbons found in crude oil are alkanes
(paraffins), cycloalkanes (naphthenes), and aromatics. Trace quantities of
alkenes (olefins), which are unsaturated chain compounds, may also be found
in crude oil. They are often found in refined products.
In general, the toxicity of crude oil increases along the hydrocarbon series;
alkanes are less toxic than cycloalkanes and alkenes, which are less toxic
than aromatics. Within each series of hydrocarbons, the smaller molecules
are more toxic than the larger
3.2 Properties of Oil
In considering the fate of spilled oil at sea, a distinction is frequently made
between non-persistent oils, which tend to disappear rapidly from the sea
surface, and persistent oils, which in contrast dissipate more slowly and
usually require a clean-up response. Non-persistent oils include gasoline,
naphtha, kerosene and diesel whereas most crude oils and heavy refined
products have varying degrees of persistence depending on their physical
properties and the size of the spill.
Crude oils of different origin have a wide range of physical and chemical
properties, whereas refined products have well-defined properties irrespective
of the crude oil from which they are derived.
The main physical properties which affect the behavior of oil spilt at sea are
specific gravity, distillation characteristics, viscosity and pour point. Typical
fractionation of a crude oil is given in table 3.1

Oil Spill Risk Assessment and Contingency Plan
Adani Hazira Port Private Limited, Hazira
Oil Characteristics and Weathering Processes
Revision No: 1
Page No: 15
3.3 Weathering Processes
The physical and chemical changes, which spilled oil undergo are sometimes
collectively known as weathering. Although, the individual processes which
bring about these changes act simultaneously, their relative importance during
the lifetime of an oil slick varies. The main processes are as follows:
Spreading
Evaporation
Dispersion
Emulsification
Dissolution
Oxidation
Sedimentation
Biodegradation
The processes of spreading, evaporation, dispersion, emulsification and
dissolution are most important during the early stages of a spill whilst
oxidation, sedimentation and biodegradation are long term processes which
determine the ultimate fate of oil. Fig.3.1 shows schematic diagram of
weathering processes with time.
It should be appreciated that throughout the lifetime of an oil slick it continues
to drift on the sea surface, independent of these processes. The actual
mechanisms governing movement are complex but experience shows that oil
drift can be predicted by taking into account wind-induced effects and surface
water currents. These can be calculated separately and then combined using
vector diagrams to determine the resulting oil movement. The wind induced
effect is normally taken as 3% of the wind velocity, and the current effect as
100% of the current velocity. Reliable prediction of slick movement is clearly
dependent upon the availability of good wind and current data. The later is
sometimes difficult to obtain. For some areas, it is presented on charts or

Oil Spill Risk Assessment and Contingency Plan
Adani Hazira Port Private Limited, Hazira
Oil Characteristics and Weathering Processes
Revision No: 1
Page No: 16
tidal stream atlases but for many other areas, only general information is
available.
An understanding of the way in which weathering processes interact is
important in forecasting their combined effect in changing the characteristics
of different oils and the lifetime of slicks at sea. In order to predict such
interactions, numerical models have been developed, based on theoretical or
empirical considerations, or a combination of both.
3.4 Effects of Marine Oil Spills
The extent of damage caused by an oil spill depends upon the quantity of oil
spilled, type of oil involved in the spillage and the oceanographic and
meteorological conditions prevailing in the location where the spill has
occurred. When the oil spills in large quantity, it temporarily affects the air-
sea interaction, thus preventing the entry of oxygen from the atmosphere. The
first sets of organisms affected are the primary producers like phytoplankton
which is the basis of the marine food chain. The other free-swimming
organisms such as fish larvae and fish eggs also get affected. Further, when
the oil sinks during the course of time, it affects the benthic organisms such as
clams and mussels. The other amenities that are affected include mangrove
forests, coral reefs and several marine resources.
Oil spills can also have a serious economic impact on coastal activities and
resources of the sea. In most cases, such damage is temporary and is
caused primarily by the physical properties of oil creating nuisance and
hazardous conditions. The impact on marine life is compounded by toxicity
and tainting effects resulting from the chemical composition of oil, as well as
by the diversity and variability of biological systems and their sensitivity to oil
pollution. Tables 3.2- 3.3 present effects of oil on marine populations and
communities and in major ecosystem.

Oil Spill Risk Assessment and Contingency Plan
Adani Hazira Port Private Limited, Hazira
Oil Characteristics and Weathering Processes
Revision No: 1
Page No: 17
Fig.3.1 Schematic diagram of weathering processes with time.
Table 3.1 Typical fractionation of a crude oil
Fraction Approximate boiling range(oC)
Approximate molecular size
Approximate volume (%)
Refinery gases < 25 C3 – C4 2
Gasoline 40 – 150 C4 – C10 25
Naphtha 150 – 200 C10 – C12 6
Kerosene 200 – 250 C12 – C16 10
Gas oils 250 – 300 C16 – C20 15
Lubricant 300 – 400 C20 – C26 17
Residual oil > 400 >C26 25

Oil Spill Risk Assessment and Contingency Plan
Adani Hazira Port Private Limited, Hazira
Oil Characteristics and Weathering Processes
Revision No: 1
Page No: 18
Table 3.2 Effects of oil on marine populations and communities
Community or Population type
Expected degree of initial impact
Expected recovery rate
Plankton Light to moderate Fast to moderate
Benthic communities
Rocky intertidal Sandy or muddy intertidal Subtidal, offshore
Light
Moderate Heavy
Fast
ModerateSlow
Fish Light to moderate Fast to moderate
Birds Heavy Slow
Marine mammals Light Slow, if population seriously affected
Table 3.3 Summary of effects of oil in some major ecosystems
Ecosystem Expected initial impact Expected recovery
Open ocean Light Fast
Outer continental shelf Light to moderate Fast to moderate
Open estuarine areas, bays, channels and harbors
Moderate to heavy Fast to slow
Wetlands, marshes and mangroves
Heavy Moderate to slow
Coral reefs Unknown Unknown
Polar ecosystems Unknown Unknown

Oil Spill Risk Assessment and Contingency Plan
Adani Hazira Port Private Limited, Hazira
Oil Spill Contingency plan Revision No: 1
Page No 19
4. OIL SPILL CONTINGENCY PLAN
Careful planning is an essential preparation for any successful operation,
especially an emergency one. There is often concern for the effects on the
environment, fisheries, industry and recreation as well as considerations of public
health and safety. There will inevitably be conflicting interests and the news
media are always quick to expose any indecision, weakness or disagreement.
Such situations are easier to resolve when a well-prepared and tested
contingency plan is available.
Response to accidental spillage of oil is a typical example. Many people may be
affected by an oil spill and many organizations have duties to perform apart from
the task of physical clean-up. For example, an incident involving lightening of
vessel and salvage activities, all of which may impinge upon any oil spill
response.
4.1. Scope and Content of Plans
Most oil spills are small and can be dealt with locally. Should the incident prove
beyond the local capability or affect a larger area, an enhanced but compatible
response will be required. The foundation of this tiered response is the local plan
for a specific facility such as a berth or for a length of coastline at risk from spills.
These local plans may form part of a larger district or national plan. National
plans may in turn be integrated into regional response arrangements covering
two or more neighbouring countries.
In general, contingency plans should follow a similar layout irrespective of
whether they are local, national or regional in scope though their length and
content will vary with the size of the area covered and degree of risk. Similarly in
layout will enable the plans to be easily understood, will assist compatibility and
ensure a smooth transition from one level to the next.
Oil Spill Risk Assessment and Contingency Plan
Adani Hazira Port Private Limited, Hazira
Oil Spill Contingency plan Revision No: 1
Page No 20
Contingency plans are best divided into two main parts: the first should be a
descriptive policy document outlining the overall Strategy while the second forms
the Operational Plan and should be concerned with procedures to be followed
when a spill occurs. The strategy segment of the plan should define the policy
responsibilities and rationale for the operational plan which is essentially an
action checklist with pointers to information sources. A plan should be reasonably
complete in itself and should not entail reference to a number of other
publications, which causes delay. A loose-leaf format facilitates regular updating
and there should be provision for listing and dating amendments.
Strategy Plan
Modelling studies
Clean-up strategy
Resources at risk
Temporary storage facilities
Operational Plan Oil spill response plan

Oil Spill Risk Assessment and Contingency Plan
Adani Hazira Port Private Limited, Hazira
Perceived Risks and Expected Quantities of Oil Spill
Revision No: 1
Page No: 21
5 Perceived Risks and Expected Quantities of Oil Spill
5.1 Introduction
Quantitative risk analysis studies of the accidental release of HSD / Crude / Fuel
oils require several physical, chemical and thermodynamic properties of the
same. Some of the data was provided by AHPPL and rest of the data were taken
from the available literature with Cell for Industrial and Safety and Risk Analysis
(CISRA), Central Leather Research Institute (CLRI) of Council of Scientific and
Industrial Research (CSIR), Chennai etc to find the chemical and physical
properties. When a particular product was the mixture of hydrocarbons, the
properties of the constituents were suitably analysed and averaged. These
properties are essential in estimating the consequences.
Additionally, meteorological information such as temperature, wind speed, wind
direction, humidity etc. are necessary to calculate evaporation, dispersion and
combustion.
Accident scenarios for quantitative risk assessment are created based on the
inputs from AHPPL past accident information and engineering judgment.
5.2 Overview of Historical Oil Spills
Accidents do occur owing to poor memories of personnel associated with the job,
directly or indirectly. Thus, there is a continuous need to review the causes and
consequences of past accidents, which provide invaluable information for better
designs and safe operations of the plants.
Several accidents involving petroleum products have been reported in the
literature. Past accidents involving Petro-products are shown in Table-5.1 to
Table-5.7. It is clear from the table that accidents occurred due to a wide variety
of causes viz., transportation, storage, filling, etc. The releases occur from
several sources such as pipelines, tank farms, reactor vessels, refinery or

Oil Spill Risk Assessment and Contingency Plan
Adani Hazira Port Private Limited, Hazira
Perceived Risks and Expected Quantities of Oil Spill
Revision No: 1
Page No: 22
separation units, etc. Past accident data related to major oil spills worldwide and
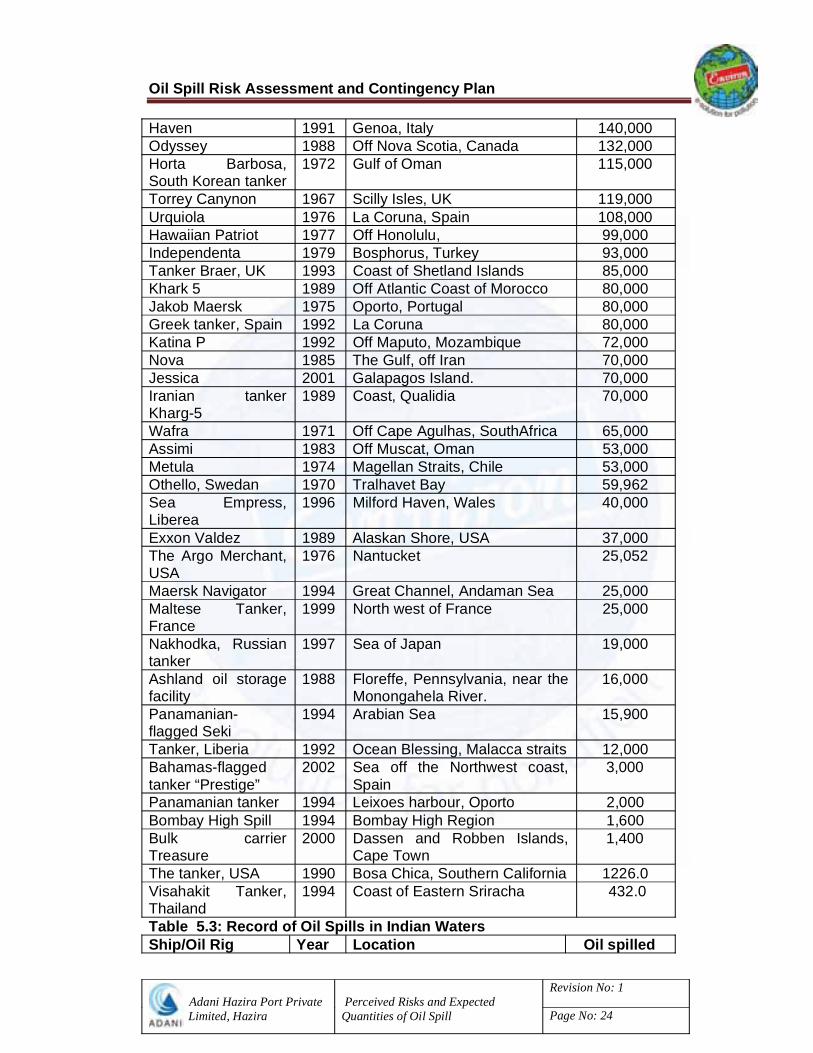
major oil spills in Indian water are presented Table –5.3.
The table (Table 5.1) gives a brief summary of 28 major oil spills since 1967. A
number of these incidents, despite their large size, caused little or no
environmental damage as the oil did not impact coastlines, hence some of the
names will be unfamiliar to the general public. The Exxon Valdez is included
because it is so well known although it is not the 21st largest spill but rather the
35th.
Table 5.1: Major Oil Spills Since 1967
Sl.No Date Location Plant/ transport
Chemical Event Deaths/ Injuries
1 1994 Nov.2
Dronka, Egypt
Fuel storage Aviation, diesel, fuel
F ~410d
2 1988 Jan.2
Floreffe, PA Storage tank Diesel fuel REL
3 1977 Sep.24
Romeoville, IL
Tank farm Diesel fuel gasoline
F
4 1969 Dec.28
Fawley, UK Hydroformer Hydrogen, Naphtha
VCE 0d
5 1975 Nov.21
Cologne, FRG
Cyclic hydroformer
Hydrogen, Naphtha
VCE 0d
6 1983 Nov.2
Dhurabar, India
Rail tank car Kerosene EX 47d
7 1955 Aug.27
Whiting, IN Hydroformer Naphtha DET 2d, 40I
8 1955 Aug.27
Whiting, IN Reformer Naphtha EX
9 1988 Oct.25
Pulua Merlimau
Storage tanks Naphtha F
10 1951 Sep.7
Avonmouth, Bristol
Storage tank Oil EX, F 2d
11 1956 Jul.29
Amarillo, TX Storage tanks Oil FB 20d, >32I
12 1970 Sep.7
Beaumont, TX
Oil F
13 1975 Mar.16
Avon, CA Refinery Oil F
14 1976 Plaquemine, Surge tank Oil IE

Oil Spill Risk Assessment and Contingency Plan
Adani Hazira Port Private Limited, Hazira
Perceived Risks and Expected Quantities of Oil Spill
Revision No: 1
Page No: 23
Aug.30 LA 15 1977
Oct.17Baton Rough, LA
Preheat furnace
Oil EX
16 1979 Dec.11
Geelong, Australia
Crude unit Oil F
17 1980 Jun.26
Sydney,Australia
Refinery furnace
Oil EX
18 1981 Aug.20
Shuaiba, Kuwait
Tank farm Oil F 1d, 1I
19 1982 Oct.4
Freeport, TX Transformer Oil F
20 1984 Dec.13
Las Piedras, Venezuela
Hyrodesulphurizer
Oil F
21 1987 Jun.2
Port Herriot, France
Storage Oil F 2d, 8I
22 1939 Dec.12
Wichita Falls, TX
Pipeline Oil film IE 0d, 1I
23 1958 May.22
Signal Hill, CA
Tank farm Oil froth F, BLEV
E
2d, 18I
24 1982 Dec.19
Caracas, Venezuela
Storage tank Oil froth F 150d, >500I
25 1968 Jan.21
Pernis, Netherlands
Slops tanks Oil slops VCE 2d, 85I
26 1975 Jan.31
Marcus Hook, PA
Oil tanker, tankship
Oil, phenol F
27 1986 Feb.24
Thessalonika, Greece
Oil terminal Oils F
28 1987 Oct.11
Fort McMurray, Alberta
Tar sand plant Tar sand, diesel fuel
F
Event Abbreviations : BLEVE - Boiling Liquid Expanding Vapour Explosion; DEL - Delayed; DET - Detonation (internal explosions only); EX - Explosion; F - Fire; IE - Internal Explosion; REL - Release; VCE - Vapour Cloud Explosion; VCF - Vapour Cloud Fire; VEEB - Vapour escape into, and Explosion in, building
Table 5.2 Some of the past accident data related to major oil spills
Ship/Oil Rig Year Location Oil spilled (tons)
Gulf Spill 1990 The Gulf, Kuwait 1,000,000 Atlantic Empress 1979 Off Tobago, West Indies 280,000 ABT Summer 1991 Off Angola 260,000 Castillo de Bellver 1983 Off Saldana Bay, South Africa 257,000 Amoco Cadiz 1978 Off Brittany, France 227,000
Oil Spill Risk Assessment and Contingency Plan
Adani Hazira Port Private Limited, Hazira
Perceived Risks and Expected Quantities of Oil Spill
Revision No: 1
Page No: 24
Haven 1991 Genoa, Italy 140,000 Odyssey 1988 Off Nova Scotia, Canada 132,000 Horta Barbosa, South Korean tanker
1972 Gulf of Oman 115,000
Torrey Canynon 1967 Scilly Isles, UK 119,000 Urquiola 1976 La Coruna, Spain 108,000 Hawaiian Patriot 1977 Off Honolulu, 99,000 Independenta 1979 Bosphorus, Turkey 93,000 Tanker Braer, UK 1993 Coast of Shetland Islands 85,000 Khark 5 1989 Off Atlantic Coast of Morocco 80,000 Jakob Maersk 1975 Oporto, Portugal 80,000 Greek tanker, Spain 1992 La Coruna 80,000 Katina P 1992 Off Maputo, Mozambique 72,000 Nova 1985 The Gulf, off Iran 70,000 Jessica 2001 Galapagos Island. 70,000 Iranian tanker Kharg-5
1989 Coast, Qualidia 70,000
Wafra 1971 Off Cape Agulhas, SouthAfrica 65,000 Assimi 1983 Off Muscat, Oman 53,000 Metula 1974 Magellan Straits, Chile 53,000 Othello, Swedan 1970 Tralhavet Bay 59,962 Sea Empress, Liberea
1996 Milford Haven, Wales 40,000
Exxon Valdez 1989 Alaskan Shore, USA 37,000 The Argo Merchant, USA
1976 Nantucket 25,052
Maersk Navigator 1994 Great Channel, Andaman Sea 25,000 Maltese Tanker, France
1999 North west of France 25,000
Nakhodka, Russian tanker
1997 Sea of Japan 19,000
Ashland oil storage facility
1988 Floreffe, Pennsylvania, near the Monongahela River.
16,000
Panamanian-flagged Seki
1994 Arabian Sea 15,900
Tanker, Liberia 1992 Ocean Blessing, Malacca straits 12,000 Bahamas-flagged tanker “Prestige”
2002 Sea off the Northwest coast, Spain
3,000
Panamanian tanker 1994 Leixoes harbour, Oporto 2,000 Bombay High Spill 1994 Bombay High Region 1,600 Bulk carrier Treasure
2000 Dassen and Robben Islands, Cape Town
1,400
The tanker, USA 1990 Bosa Chica, Southern California 1226.0 Visahakit Tanker, Thailand
1994 Coast of Eastern Sriracha 432.0
Table 5.3: Record of Oil Spills in Indian Waters Ship/Oil Rig Year Location Oil spilled

Oil Spill Risk Assessment and Contingency Plan
Adani Hazira Port Private Limited, Hazira
Perceived Risks and Expected Quantities of Oil Spill
Revision No: 1
Page No: 25
(tons)ONGC production platform
1993 Bombay High Region 1,600
Iron Ore Carrier 2005 Off Aguada coast, Goa 110 Singaporean tanker Maersk Navigator
1992 Within 10 to 15 miles of the Nicobar Islands
25000
Cargo ship- M V Chitra
2010 Mumbai Thane ~800
The incidence of large spills is relatively low and detailed statistical analysis is
rarely possible, consequently emphasis is placed on identifying trends. Thus, it is
apparent from the table below that the number of large spills (>700 tones) has
decreased significantly during the last thirty-eight years. The average number of
large spills per year during the 1990s was less than a third of that witnessed
during the 1970s. Figures further show that there has been a general decrease in
the number of spills over 7 tones and that there have been proportionally fewer
large spills (> 700 tones) than smaller ones.
The vast majority of spills are small (i.e. less than 7 tones) and data on numbers
and amounts is incomplete. However in most years it is probable that they make
a relatively small contribution to the total quantity of oil spilled into the marine
environment as a result of tanker accidents. Table 5.4 shows the data on spills 7
tones and above is held and the amounts of oil spilt during these incidents have
been added to give a series of annual estimates of the total quantity spilled for
the years 1970-2008.
Table- 5.4: Number of spills over 7 tons

Oil Spill Risk Assessment and Contingency Plan
Adani Hazira Port Private Limited, Hazira
Perceived Risks and Expected Quantities of Oil Spill
Revision No: 1
Page No: 26
It is notable from Table-5.5 that a few very large spills are responsible for a high
percentage of the oil spilt. For example, in the ten-year period 1990-1999 there
were 358 spills over 7 tones, totalling 1,138 thousand tones, but 830 thousand
tones (73%) were spilt in just 10 incidents (just under 3%). The figures for a
particular year may therefore be severely distorted by a single large incident.
This is clearly illustrated by 1979 (Atlantic Empress - 287,000 tones), 1983
(Castillo de Bellver - 252,000 tones) and 1991 (ABT Summer - 260,000t ones).
Approximately 5.65 million tones of oil were lost as a result of tanker incidents
from 1970 to 2008.
Table- 5.5: Number Quantity of Oil spilt
Table-5.6 gives the number of oil spills occurred along with quantity of oil spilled
and the operations associated during 1974 to 2008 It is found that, most spills
from tankers result from routine operations such as loading, discharging and
bunkering which normally occur in ports or at oil terminals, the majority of these
operational spills are small, with some 91% involving quantities of less than 7
tons and accidents involving collisions and groundings generally give rise to
much larger spills, with at least 84% involving quantities in excess of 700 tons.
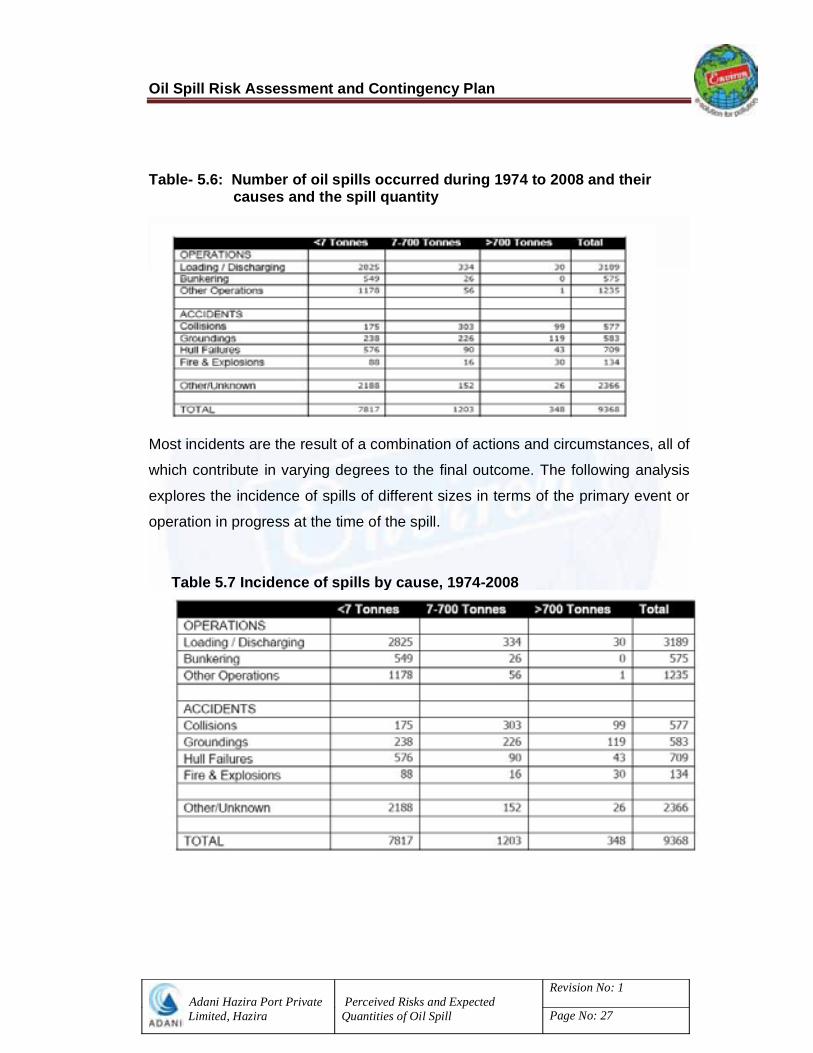
Oil Spill Risk Assessment and Contingency Plan
Adani Hazira Port Private Limited, Hazira
Perceived Risks and Expected Quantities of Oil Spill
Revision No: 1
Page No: 27
Table- 5.6: Number of oil spills occurred during 1974 to 2008 and their causes and the spill quantity
Most incidents are the result of a combination of actions and circumstances, all of
which contribute in varying degrees to the final outcome. The following analysis
explores the incidence of spills of different sizes in terms of the primary event or
operation in progress at the time of the spill.
Table 5.7 Incidence of spills by cause, 1974-2008
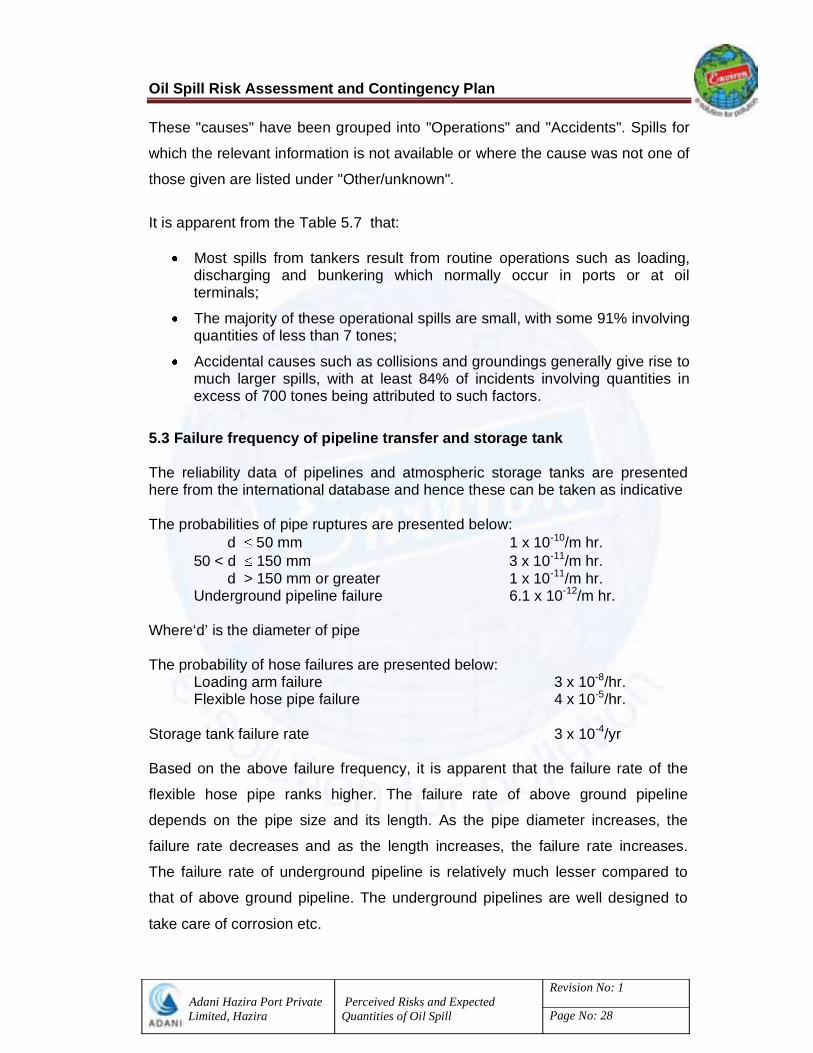
Oil Spill Risk Assessment and Contingency Plan
Adani Hazira Port Private Limited, Hazira
Perceived Risks and Expected Quantities of Oil Spill
Revision No: 1
Page No: 28
These "causes" have been grouped into "Operations" and "Accidents". Spills for
which the relevant information is not available or where the cause was not one of
those given are listed under "Other/unknown".
It is apparent from the Table 5.7 that:
Most spills from tankers result from routine operations such as loading, discharging and bunkering which normally occur in ports or at oil terminals;
The majority of these operational spills are small, with some 91% involving quantities of less than 7 tones;
Accidental causes such as collisions and groundings generally give rise to much larger spills, with at least 84% of incidents involving quantities in excess of 700 tones being attributed to such factors.
5.3 Failure frequency of pipeline transfer and storage tank
The reliability data of pipelines and atmospheric storage tanks are presented here from the international database and hence these can be taken as indicative
The probabilities of pipe ruptures are presented below: d 50 mm 1 x 10⁻¹⁰/m hr. 50 < d 150 mm 3 x 10-11/m hr. d > 150 mm or greater 1 x 10-11/m hr. Underground pipeline failure 6.1 x 10⁻¹²/m hr.
Where‘d’ is the diameter of pipe
The probability of hose failures are presented below: Loading arm failure 3 x 10⁻⁸/hr. Flexible hose pipe failure 4 x 10⁻⁵/hr.
Storage tank failure rate 3 x 10⁻⁴/yr
Based on the above failure frequency, it is apparent that the failure rate of the
flexible hose pipe ranks higher. The failure rate of above ground pipeline
depends on the pipe size and its length. As the pipe diameter increases, the
failure rate decreases and as the length increases, the failure rate increases.
The failure rate of underground pipeline is relatively much lesser compared to
that of above ground pipeline. The underground pipelines are well designed to
take care of corrosion etc.
Oil Spill Risk Assessment and Contingency Plan
Adani Hazira Port Private Limited, Hazira
Perceived Risks and Expected Quantities of Oil Spill
Revision No: 1
Page No: 29
The failure rate of loading arm is extremely low because of the sophisticated
safety systems incorporated in the design. Accidental release of any chemical
due to catastrophic rupture of tanks and ship collision are also relatively very low.
The impact due to failure of storage tanks and ship collisions on environment are
very high because of the large quantity released when compared to the pipe
failure.
5.4 Meteorological Data
Atmospheric stability is an important factor for predicting the dispersion
characteristics of spilled oil into the surrounding environment. Change in
atmospheric stability is a direct consequence of the vertical temperature
structure. The stability effects are mathematically represented through Pasquill
parameters. The following stability classification is employed:
Stability Class Atmospheric Condition A Very Unstable B Unstable C Slightly Unstable D Neutral E Stable F Very Stable
Condition of atmospheric stability is estimated by a suitable method that uses
dispersion parameters viz., vertical temperature gradient, wind profile and
roughness factor.
The following meteorological information has been taken in the calculations for the Hazira port area (GMB 2009):
Average ambient temperature 30oC Average wind speed 3 m/s
Stability condition F (Very Stable)
5.5 Expected Quantities of Oil Spill
Oil spill may vary from a few litres of oil due accidental spill to several thousands
of tons of oil during unexpected situations. No company can afford to prepare
Oil Spill Risk Assessment and Contingency Plan
Adani Hazira Port Private Limited, Hazira
Perceived Risks and Expected Quantities of Oil Spill
Revision No: 1
Page No: 30
itself for mitigating all the possible accident scenarios due to prohibitive costs
associated with the oil spill combat. In line with the standard industry practice
and being a good corporate citizen, AHPPL is planning to procure oil spill
combating equipments in case of any spills from vessel operations (<Tier-1) at
AHPPL berths, while oil spill situations of higher magnitude are to be dealt with
the assistances of Indian Coast Guard, other neighbouring industries, ports etc.
However, it is required to have a fair understanding of the risks and probability of
spills arising out of its vessel operations and their consequences due to
movement and landing along the coast.
The following scenarios are identified for probable oil spills in the vessel operations at AHPPL’s berths:
(i) FO/HSD leakage from fuel tank compartments due to collision/grounding (ii) Leakage due to Loading / unloading operations at Berths (iii) Spills due to Collision in the vessel route and in and around the port
The exact quantity from each incident is difficult to predict due to the variations in
operating conditions and the length of risk exposure. The maximum risks
associated with the events may be considered while devising the oil spill
contingency plan. The worst spill scenario is spillage on the water surface. For
the purpose of simulation, the following scenario is taken into account
considering the above spill risks
5.6 FO / HSD leakage from fuel tank compartments due to collision/ grounding
Vessels are expected to call at the berth frequently for loading and unloading
operations of vessel. These vessels may meet accidents like collision with other
vessels or grounding in the vicinity of the berth. In case of such accidents the
spillage may vary depending on the size of the vessel fuel tank, the extent of
damage and number of vessel fuel compartments ruptured. In the present study
the probable quantity of spills at the berth considered for modelling is about 100
tons and 700 tons, since the large size of vessel has 800 tons to 2000 tons of
fuel tank capacity.

Oil Spill Risk Assessment and Contingency Plan
Adani Hazira Port Private Limited, Hazira
Perceived Risks and Expected Quantities of Oil Spill
Revision No: 1
Page No: 31
As can be seen above the spill scenarios mentioned above range from extremely
negligible quantities to enormous quantities in rare catastrophic events. The
simulation of oil spills does not vary significantly in various scenarios except the
magnitude of impact zone and the quantity involved in such impacts. The
hypothetical simulations are made in this report considering the worst-case
scenarios.
5.7. Spills due to Collision in vessel route
In the present scenario, collision of a vessel enroute with another vessel can
cause partial damage to the vessel’s Cargo / fuel tanks leading to a maximum oil
spill of about 100 tons to 700 tons of FO / HSD. Hence, in the present study the
probable quantities of oil spills due collision in the vessel route is considered as
100 tons and 700 tons
5.8 Spill due to transfer of POL products at berths
Probability of loading arm failure during operations is extremely low. The loading
arms at berths are provided with Powered Emergency Release Coupling (PERC)
and Emergency Shut Down (ESD) unit. In the event of unusual tension on the
arm the PERC gets activated stopping the cargo operations automatically and
separating the arm from the vessel without draining the arm, thereby preventing
the spill of product under transfer. When PERC is activated only a few tons of oil
may spill. Normally not more than 10 t of oil may spill in such a situation.
Oil Spill Risk Assessment and Contingency Plan
Adani Hazira Port Private Limited, Hazira
Oil spill modeling studiesRevision No: 1
Page No: 32
6 Oil Spill Modelling Studies
The prediction of fate and transport of oil spill is playing major role in the
analysis of risks due to oil spills. Hence, it is computed based on the surface
resulting forces of surface water currents and wind speed. The following
sections are described about the numerical modeling of hydrodynamics for
surface water flow and Lagrangian Particle discrete model for the fate and
transport of oil spills.
6.1 Modelling of Hydrodynamic Processes
Modelling the hydrodynamic processes is an integral part of modelling of fate
and transport of oil spills. The basic oil-spill model which was used earlier
(NIO, 1999,2000,2001,2002,2008) to track the oil-spill trajectories has been
further modified and improved for use in the present work to estimate risks
due to oil spills for various weathering and meteorological conditions. In this
chapter, hydrodynamic part of the model (flow) and Oil spill model have been
described.
Khambhat is a typical semi-enclosed basin where the tidal forcing interacts
with the open ocean waters of the sea across its southern open boundary,
Valsad. The currents of the region are tidal-driven and the water column is
vertically well mixed. These features make the numerical modelling task
easier, as a 2-D hydrodynamical model is sufficient to accurately reproduce
the tides and currents of the Gulf of Khambhat at Hazira.
6.1.1 Model description
A dedicated software Hydrodyn-OILSOFT for fate and transport of oil spills in
the rivers, seas and estuaries is developed by Environ Software (P) Ltd,
Bangalore, based on the solving the hydrodynamic and oil spill equations
numerically through coupled way using the present state-of-art of technology.

Oil Spill Risk Assessment and Contingency Plan
Adani Hazira Port Private Limited, Hazira
Oil spill modeling studiesRevision No: 1
Page No: 33
The basic governing equations of flow and oil spill transport is described in the
following sections.
6.1.2 Basic governing equations
Simulation of tides and currents has been carried out by solving the two
dimensional shallow water equations of continuity and momentum. These
equations describing the flow field of the estuary are based on incompressible
flow and vertically integrated hydrostatic distribution. Hence, the vertical
acceleration of the flow is assumed to be much smaller than the pressure
gradient. After applying these conditions, the governing equations of mass
and momentum can be written in the conservation form as follows:
Continuity equation:
0yv
xu
Momentum equations:
where, t = time; x, y are cartesian co-ordinates; u, v are depth averaged
velocity components in x, y directions, respectively; f = Coriolis parameter;
g = acceleration due to gravity; Kx, Ky = diffusion coefficients in x, y
directions, respectively; h= water elevation with respect to mean water level.
6.1.3 Model diffusion coefficients The horizontal diffusion coefficients Kx and Ky are calculated as follows:
2
22
CvugK y
y
yvK
yxvK
xyhgfu
yvv
xvu
tv
yuK
yxuK
xxhgfv
yuv
xuu
tu
yx
yx

Oil Spill Risk Assessment and Contingency Plan
Adani Hazira Port Private Limited, Hazira
Oil spill modeling studiesRevision No: 1
Page No: 34
where x and y are the diffusion factors in x and y directions and C is the
Chezy coefficient.
6.1.4 Numerical solution algorithm
The transformed governing equations of flow have been discretized on a
staggered grid and solved using Leapfrog trapezoidal scheme through a
predictor and corrector step method. The scheme is fully centered in space
and time and can obtain 2nd order accuracy. The scheme consists of two
level computations predictor and corrector steps within the time step t.
F(Kn)=(K* - Kn-1)/(2 t)
F(Kn)+F(K*)=2(Kn+1 – Kn)/( t)
where, K* = predicted variable level.
Since the range of the co-ordinates in the computational plane is completely
arbitrary, the mesh increments are specified as unity for convenience.
Consequently, the geometric variables are defined on a finite difference mesh
with cell increments of 0.5. The computations have been carried out for the
next time step through predictor and corrector schemes using the above finite
difference quotients.
6.2 Gulf of Khambhat
The model domain of longitudes of 71°06’ E and 72 54E and the latitudes of
19 57’ N and 22 03’’N is selected for carrying out sensitivity analysis and
predicting the fate and transport of oil slick at AHPPL berths.
2
22
CvugK x
x

Oil Spill Risk Assessment and Contingency Plan
Adani Hazira Port Private Limited, Hazira
Oil spill modeling studiesRevision No: 1
Page No: 35
6.2.1 Model setup and boundary specifications
The region of study, tidal stations, meteorological stations and monitoring
locations are shown in Fig. 6.1. The computational domain of the model, is
selected from Navabandar to Bhavnagar between the longitudes of 71°06’ E
and 72 54E and the latitudes of 19 57’ N and 22 03 ’’N. The model
computational grid is shown in Fig. 6.2. The bathymetry is selected from the
hydrographic chart. The interpolated bathymetric depth contours of the study
region is shown in Fig.6.3. Fig A.1.1 shows the computational domain
selected for carrying out oil spill trajectory modelling for Adani Hazira Port Pvt.
Ltd., Hazira.

Oil Spill Risk Assessment and Contingency Plan
Adani Hazira Port Private Limited, Hazira
Oil spill modeling studiesRevision No: 1
Page No: 36
Fig.6.1 Terrain features of Khambhat showing Adani hazira Port Ltd.

Oil Spill Risk Assessment and Contingency Plan
Adani Hazira Port Private Limited, Hazira
Oil spill modeling studiesRevision No: 1
Page No: 37
Fig.6.2 Computational grid
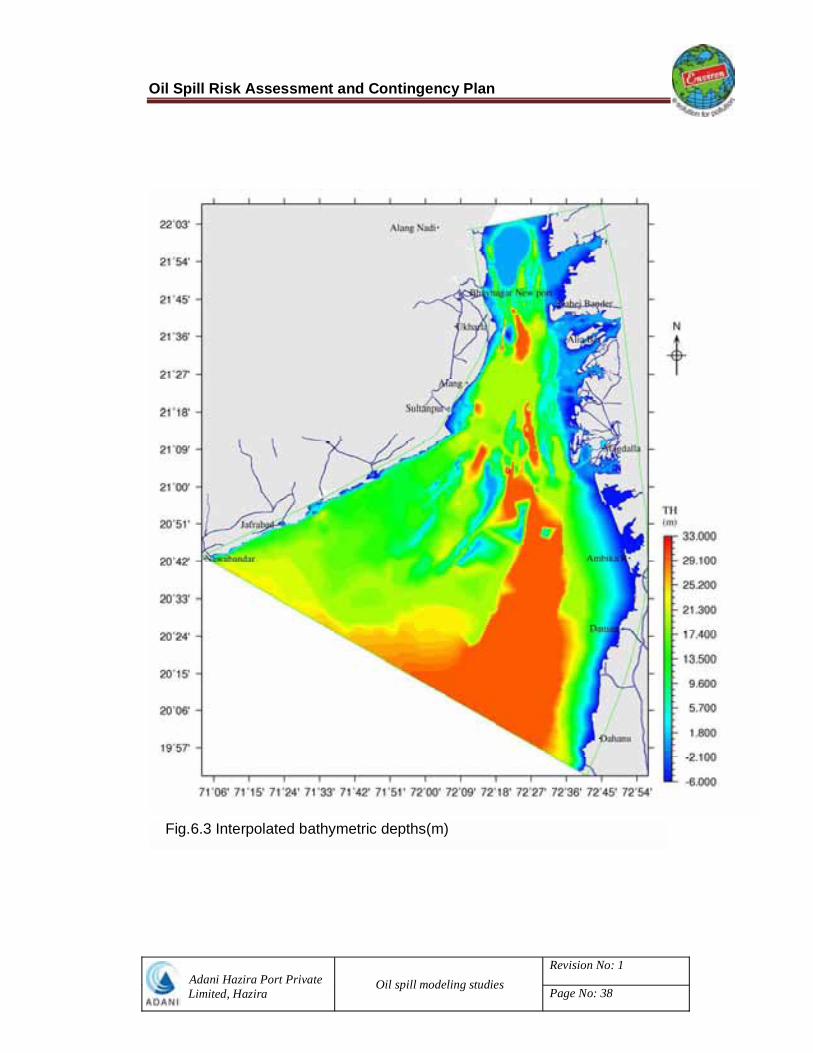
Oil Spill Risk Assessment and Contingency Plan
Adani Hazira Port Private Limited, Hazira
Oil spill modeling studiesRevision No: 1
Page No: 38
Fig.6.3 Interpolated bathymetric depths(m)

Oil Spill Risk Assessment and Contingency Plan
Adani Hazira Port Private Limited, Hazira
Oil spill modeling studiesRevision No: 1
Page No: 39
6.3 Bottom bed-roughness
The bottom roughness in the Gulf of Khambhat varies due to the variation of
bed sediment grain sizes. The bed consists of various sizes of clay, sand, silt
and rocky soils. In the present study a uniform Manning’s roughness
coefficient has been used for numerical runs of hydrodynamic processes. The
same roughness coefficient has been used to predict tides and tidal velocities
in the Gulf area for prediction of oil spill trajectory
6.4 Initial and boundary conditions
The initial conditions for the model are selected based on still water
conditions. The vertical density gradients due to salinity variation have been
neglected since the water column is well mixed and there is no sufficient
inflow into the Gulf. The BFC grid has been adopted to handle the sharp
coastal shape and make fine mesh near the coastline.
Along the northern and southern open boundaries, the boundary conditions
selected are as follows. (i) The predicted tide (using the tide cal software) at
Navabundar and Dahanu for the year 2008 and 2009 (interpolated all along
the southern boundary) (ii) no flux across the eastern and western boundary
of Gulf of Khambhat (iii) free flow across northern open boundary. In this
model, diffusion coefficients for horizontal exchange of momentum vary with
the space.
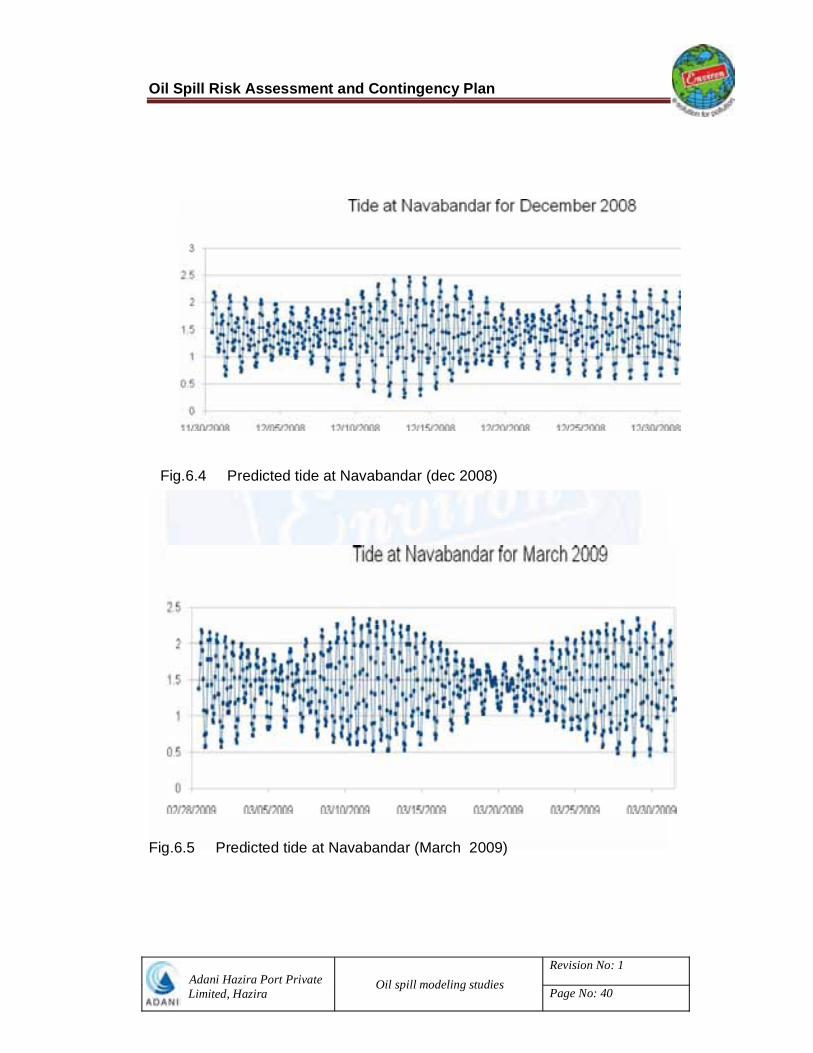
Oil Spill Risk Assessment and Contingency Plan
Adani Hazira Port Private Limited, Hazira
Oil spill modeling studiesRevision No: 1
Page No: 40
Fig.6.5 Predicted tide at Navabandar (March 2009)
Fig.6.4 Predicted tide at Navabandar (dec 2008)
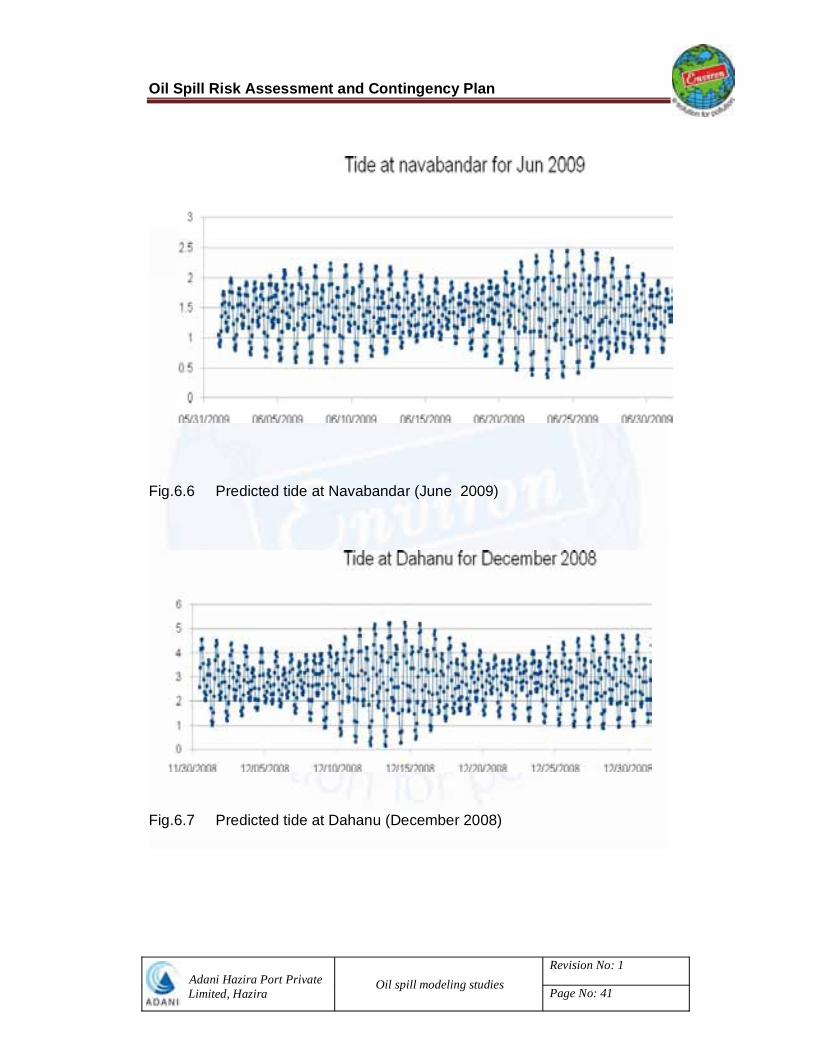
Oil Spill Risk Assessment and Contingency Plan
Adani Hazira Port Private Limited, Hazira
Oil spill modeling studiesRevision No: 1
Page No: 41
Fig.6.6 Predicted tide at Navabandar (June 2009)
Fig.6.7 Predicted tide at Dahanu (December 2008)
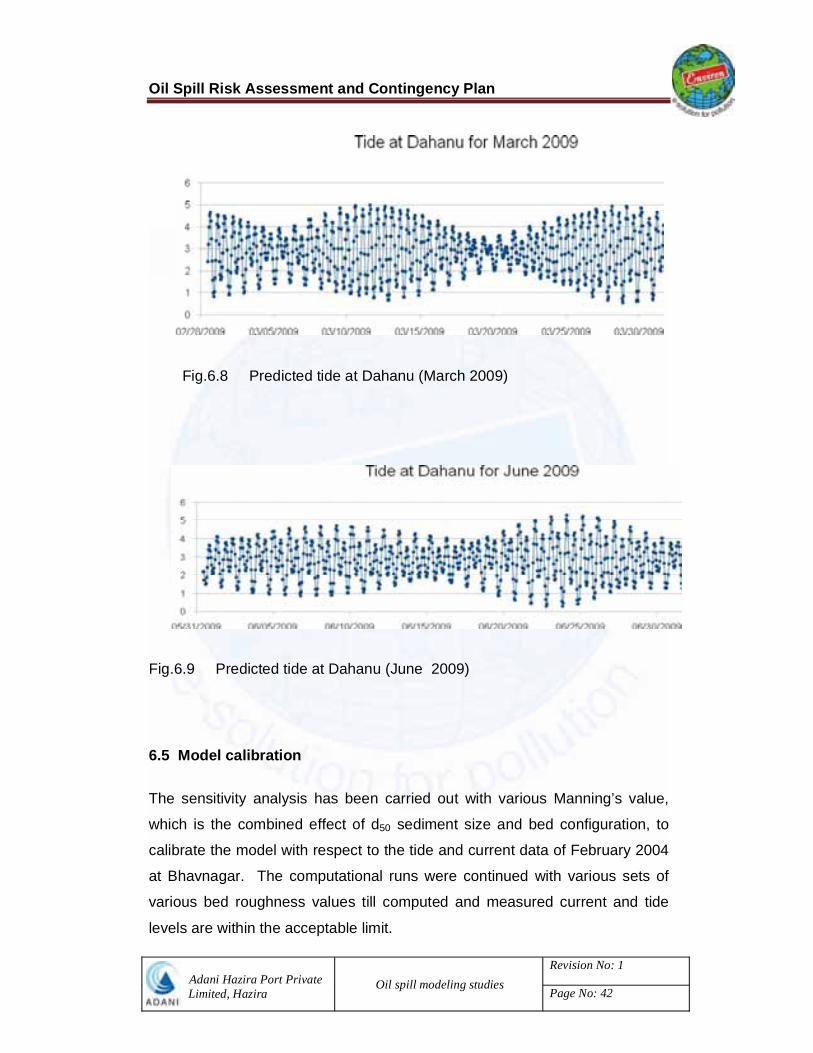
Oil Spill Risk Assessment and Contingency Plan
Adani Hazira Port Private Limited, Hazira
Oil spill modeling studiesRevision No: 1
Page No: 42
Fig.6.8 Predicted tide at Dahanu (March 2009)
Fig.6.9 Predicted tide at Dahanu (June 2009)
6.5 Model calibration
The sensitivity analysis has been carried out with various Manning’s value,
which is the combined effect of d50 sediment size and bed configuration, to
calibrate the model with respect to the tide and current data of February 2004
at Bhavnagar. The computational runs were continued with various sets of
various bed roughness values till computed and measured current and tide
levels are within the acceptable limit.
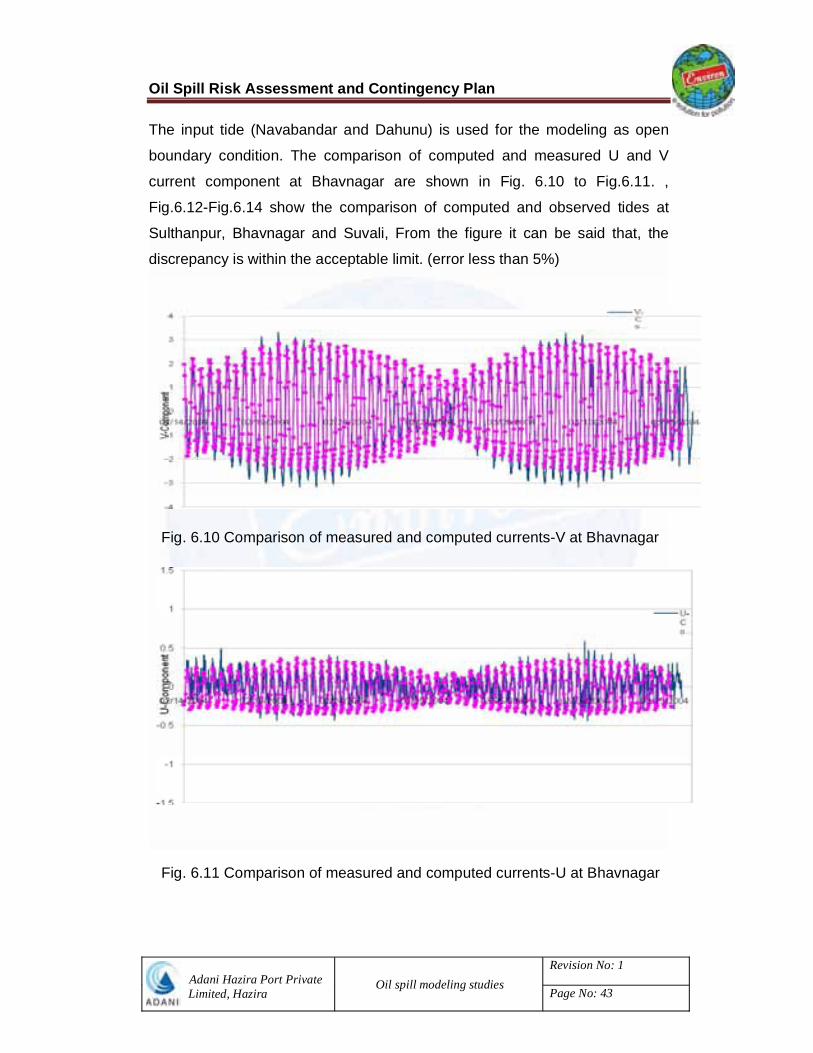
Oil Spill Risk Assessment and Contingency Plan
Adani Hazira Port Private Limited, Hazira
Oil spill modeling studiesRevision No: 1
Page No: 43
The input tide (Navabandar and Dahunu) is used for the modeling as open
boundary condition. The comparison of computed and measured U and V
current component at Bhavnagar are shown in Fig. 6.10 to Fig.6.11. ,
Fig.6.12-Fig.6.14 show the comparison of computed and observed tides at
Sulthanpur, Bhavnagar and Suvali, From the figure it can be said that, the
discrepancy is within the acceptable limit. (error less than 5%)
Fig. 6.10 Comparison of measured and computed currents-V at Bhavnagar
Fig. 6.11 Comparison of measured and computed currents-U at Bhavnagar
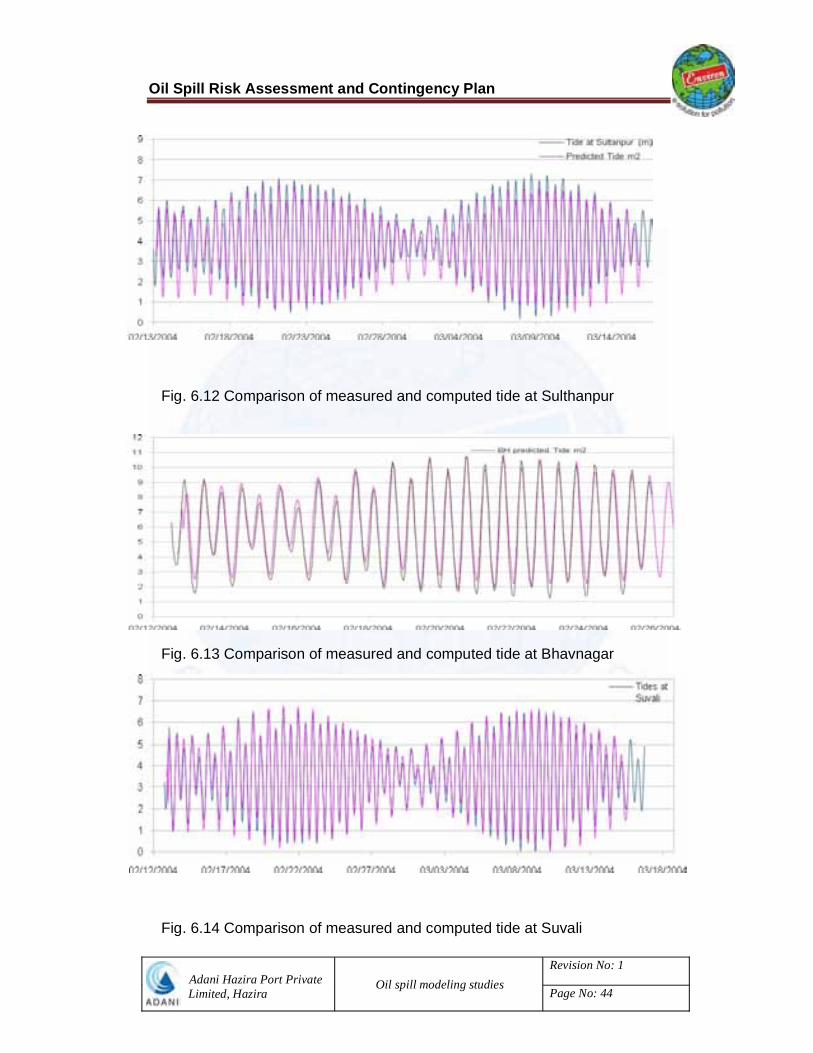
Oil Spill Risk Assessment and Contingency Plan
Adani Hazira Port Private Limited, Hazira
Oil spill modeling studiesRevision No: 1
Page No: 44
Fig. 6.12 Comparison of measured and computed tide at Sulthanpur
Fig. 6.13 Comparison of measured and computed tide at Bhavnagar
Fig. 6.14 Comparison of measured and computed tide at Suvali

Oil Spill Risk Assessment and Contingency Plan
Adani Hazira Port Private Limited, Hazira
Oil spill modeling studiesRevision No: 1
Page No: 45
A series of simulation runs have been made to obtain an insight into the basic
hydrodynamic behavior of the Gulf of Khambhat to tidal forces.
6.6 Modelling of tides and tidal currents
The computational runs in order to obtain better accuracy in the prediction of
oil spill trajectory and weathering processes, a finer mesh is adopted to
represent the study area for modeling purpose. The study domain is between
Latitude 21o 2' 59.028" N - 21 o 8' 41.039" N and Longitude 72 o 34' 30.864" N
- 72 o 38' 23.354" N shown in Fig. A.1.1. The domain is divided into 155 x 90
grids in “x” and “y” directions respectively, shown in Fig. A.1.2. Computational
runs have been made for quantitative spill at locations, to predict the spill
trajectory for a period of 15 days. Fig.A.1.3 shows the interpolated
bathymetric depths. The runs considering various seasons i.e. post-monsoon
(December 2008), Pre-monsoon(March 2009) and Monsoon(June 2009) have
been made and results are presented graphically.
The model clearly reproduces the tidal variation at various locations all along
the Gulf of Khambhat at Hazira. The typical variations of currents during LLW,
peak flood, HHW and peak ebb conditions of spring and neap tides during
post-monsoon (December 2008), Pre-monsoon(March 2009) and
Monsoon(June 2009) are shown in Figs A.1.4 - A.1.12, A.2.1-A.2.8, A.3.1-
A.3.8 respectively.
6.7 Numerical Modelling of Fate and Movement of Oil SpillsThe surface or subsurface oil spill manifests in slick floating on the water
surface, which partially dissolves in the water and partially evaporates into the
atmosphere. There is a continuous exchange between the suspended and
surface oil (floating oil). The assumption made in deriving the governing
equations is that the thickness of the oil layer is negligible in comparison with
the water depth.

Oil Spill Risk Assessment and Contingency Plan
Adani Hazira Port Private Limited, Hazira
Oil spill modeling studiesRevision No: 1
Page No: 46
In addition to the location, size, and physico-chemical properties of the spill,
and other major factors affect the fate of the oil slick which are governed by
complex interrelated transport and weathering processes. The spilled oil
spreads and moves by the forces of winds and currents. A small portions of
hydrocarbons begin to go into solution in the underlying water column, but
most of the oil is lost through evaporation into the atmosphere. In the present
model, all these processes are considered in the transport of Oil Slick.
In most of the oil spill models, drift factor approach has been used. This is
considered to be the most practical method for predicting the advection of oil
slicks. In this method, the mean drift velocity of the surface oil is considered to
be a weighted sum of the wind velocity and depth-averaged current.
ccww vvv
where, vw= the wind velocity at 10 m above the water surface, vc= the depth
averaged velocity, w= the wind drift factor, c=current drift factor. Normally,
wind-induced surface currents have been reported to vary between 1% and
6% of the wind speed, with 3% being the most widely used drift factor in oil
slick models. A value of about 1.1 is generally used for c, assuming that the
velocity distribution over the depth of flow is logarithmic.
The advective velocity of each oil parcel can be a sum of the mean and
turbulent fluctuation components of the drift velocity. The turbulent fluctuation
components are included in the simulation of horizontal diffusion.
6.7.1 Horizontal turbulent diffusion
The horizontal turbulent diffusion due to turbulent fluctuations of the drift
velocity is computed based on random walk analysis.
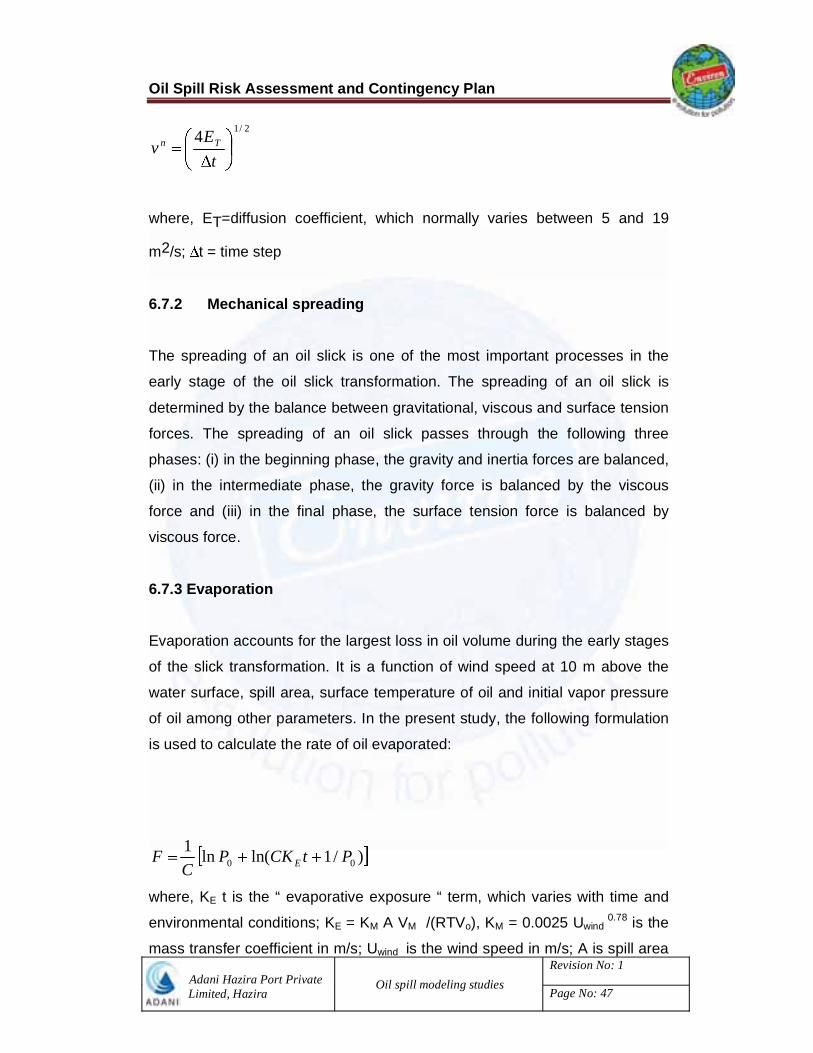
Oil Spill Risk Assessment and Contingency Plan
Adani Hazira Port Private Limited, Hazira
Oil spill modeling studiesRevision No: 1
Page No: 47
2/14t
Ev Tn
where, ET=diffusion coefficient, which normally varies between 5 and 19
m2/s; t = time step
6.7.2 Mechanical spreading
The spreading of an oil slick is one of the most important processes in the
early stage of the oil slick transformation. The spreading of an oil slick is
determined by the balance between gravitational, viscous and surface tension
forces. The spreading of an oil slick passes through the following three
phases: (i) in the beginning phase, the gravity and inertia forces are balanced,
(ii) in the intermediate phase, the gravity force is balanced by the viscous
force and (iii) in the final phase, the surface tension force is balanced by
viscous force.
6.7.3 Evaporation
Evaporation accounts for the largest loss in oil volume during the early stages
of the slick transformation. It is a function of wind speed at 10 m above the
water surface, spill area, surface temperature of oil and initial vapor pressure
of oil among other parameters. In the present study, the following formulation
is used to calculate the rate of oil evaporated:
)/1ln(ln100 PtCKP
CF E
where, KE t is the “ evaporative exposure “ term, which varies with time and
environmental conditions; KE = KM A VM /(RTVo), KM = 0.0025 Uwind 0.78 is the
mass transfer coefficient in m/s; Uwind is the wind speed in m/s; A is spill area

Oil Spill Risk Assessment and Contingency Plan
Adani Hazira Port Private Limited, Hazira
Oil spill modeling studiesRevision No: 1
Page No: 48
in square meters; Vm is the molar volume in cubic meters per mole; R is the
gas constant, 82.06*10-6 atm m3 mol -1 K -1 ; T is surface temperature of the oil
in degrees Kelvin, which is generally close to the ambient air temperature TE
in degrees Kelvin; V0 is the initial spill volume in cubic meters. The initial vapor
pressure P0 in atmosphere at the temperature TE is
)/1(6.10ln 00 ETTP
where, To is the initial boiling point in degrees Kelvin. The constant, C can be
determined by the relationship TEC =const. The values C and the initial boiling
point To are calculated at TE=283 degrees Kelvin for various types of oils.
For crude oils of different American Petroleum Institute (API) index values, C
and To at TE=283 degrees Kelvin can be calculated by the following
relationships obtained through curve fitting.
4320
1435.1
0002604.003439.0565.1275.306.5429.1158
APIAPIAPIAPITAPIC
6.7.4 Dissolution
Dissolution is an important process to be considered for the possible
biological degradation, although it only accounts for a negligible fraction of the
mass balance of the oil. It is a function of oil slick area, dissolution mass
transferability and oil solubility in water.
In the present study the method of Cohen et al. (1980) is used. In this method,
the total dissolution rate N (gm/h) of the slick is calculated by
N=KAsS
where, K is the dissolution mass transfer coefficient in meters per hour, As is

Oil Spill Risk Assessment and Contingency Plan
Adani Hazira Port Private Limited, Hazira
Oil spill modeling studiesRevision No: 1
Page No: 49
the slick area in square meters, and S is the oil solubility in water. Huang and
Monasero (1982) calculated the solubility for a typical oil as teSS 0
where, S0 is the solubility for fresh oil, is the decay constant and t is the
time after the spill.
6.7.5 Emulsification
Some quantity of the petroleum hydrocarbons entrains with water particles
increase its total volume due to turbulent fluctuations. It reaches the water
surface due to lighter in density. Emulsified oil is 7% of rate of oil evaporation.
6.7.6 Shoreline deposition
The oil slick will reach the shoreline sometime after a spill occurs. Based on
the half-life formulation, the volume of oil remaining on the beach can be
related to its original volume by
`)2(12 ttkeVVwhere, V1 and V2 are volumes of the oil on the beach at times t1 and t2,
respectively; k = -ln (1/2)/ , a decay constant and =half-life.
6.8 Simulation of Scenario - Details
In the present study, an extreme scenario has been considered for the model
study. It is assumed that oil leakages can occur in and around AHPPL Port
due to collision / grounding of cargo and spills due to loading and unloading of
POL at berths. Accordingly, the spill locations were considered at berth,
turning circle, approach channel and port entrance as shown in Fig. A.1.1. An
accidental leakage of 100 tons and 700 tons Fuel Oil, HSD and Crude oil
spills were considered for modeling.

Oil Spill Risk Assessment and Contingency Plan
Adani Hazira Port Private Limited, Hazira
Oil spill modeling studiesRevision No: 1
Page No: 50
6.8.1 Computation Domain and Input data After successful validation of the hydrodynamic model, the same was coupled
with the oil spill model to compute the oil spill trajectories of operational/
accidental/disaster spillage’s. The oil characteristics, bathymetry,
oceanographic parameters such as sea surface temperature, tides and
currents, meteorological parameters such as wind speed and direction, etc.
are given as inputs to the model. The computational grid and bathymetry
depth contours of model domain are shown in Fig. A.1.2 and Fig. A.1.3
respectively.
The meteorological data for the Hazira region for different seasons were used.
The oil characteristics, bathymetry, oceanographic parameters, etc. were
given as an input to the model. It was presumed that FO and HSD would be
as a fuel oil for Cargo Vessel. Though the oil spill undergoes different
physical and chemical changes, dissolution is the main factor to be
considered for assessing the carrying capacity of coastal waters with respect
to petroleum hydrocarbons. The modelling was carried out by coupling the oil
spill model with the hydrodynamic model. Several runs have been made and
results were stored at every hour. The computational runs were carried for the
following scenario discussed in the following sections.
6.8.2 Spill Locations
The following spill location was considered for the present study.
(i) Multi cargo Berths
(ii) Turning Circle
(iii) Entrance of the port
(iv) Approach channel

Oil Spill Risk Assessment and Contingency Plan
Adani Hazira Port Private Limited, Hazira
Oil spill modeling studiesRevision No: 1
Page No: 51
6.8.2.1 Oil type The following characteristics of oil are used for modelling study:
(a) Fuel Oil
Sp. Gr = 0.932
Surface Tension 3.0 e-03
Molar Volume =0.002
Viscosity: 275 cst at 37.8 deg C
Wax content: 12 – 19 %
Pour point of untreated crude: 30 deg C
Pour point of treated crude: 18 deg C
(b) HSD
Sp. Gr = 0.85
Surface Tension 2.8 e-03
Molar Volume =0.002
Viscosity: .8 cst at 37.8 deg C
Wax content: 12 – 19 %
Pour point: 35 deg C
c) Crude
Sp. Gr = 0.92
Surface Tension =3.0 e-03
Molar Volume =0.002
Viscosity: 275 cst at 37.8 deg C
Wax content: 12 – 19 %
Pour point of untreated crude: 30 deg C
Pour point of treated crude: 18 deg C
6.8.2.2 Weather conditions Winds - Available winds for 2009
Currents – simulated from the model
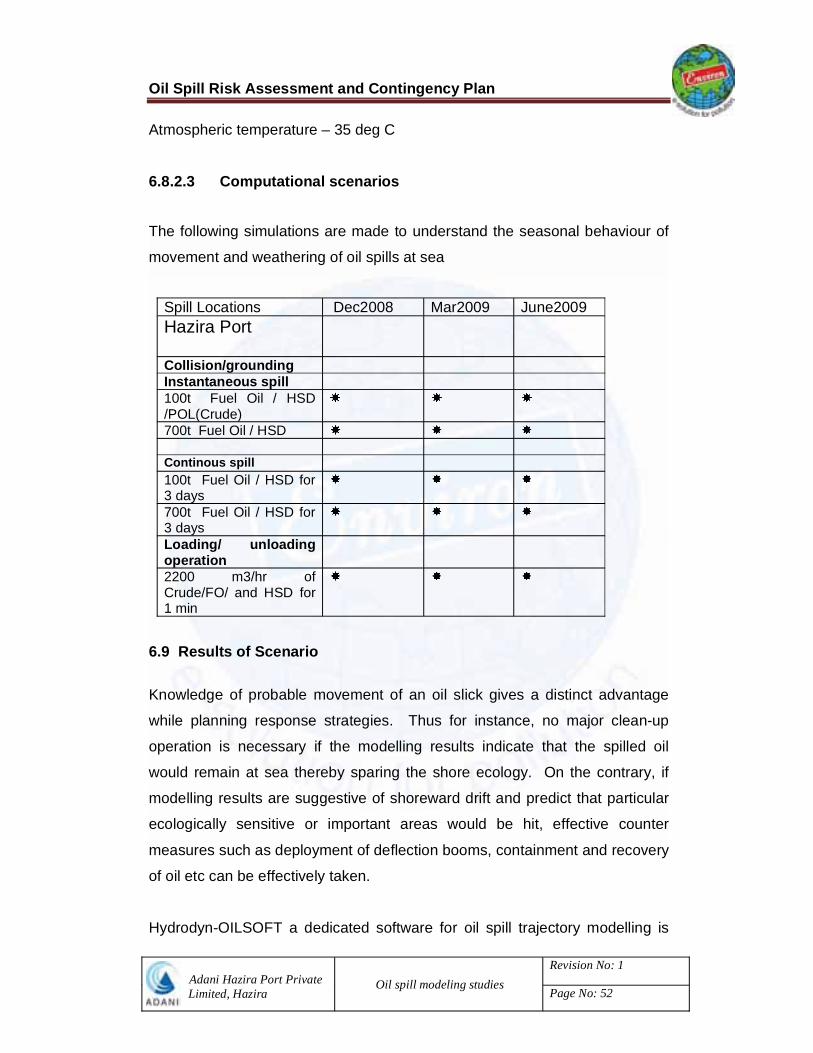
Oil Spill Risk Assessment and Contingency Plan
Adani Hazira Port Private Limited, Hazira
Oil spill modeling studiesRevision No: 1
Page No: 52
Atmospheric temperature – 35 deg C
6.8.2.3 Computational scenarios
The following simulations are made to understand the seasonal behaviour of
movement and weathering of oil spills at sea
Spill Locations Dec2008 Mar2009 June2009 Hazira Port
Collision/grounding Instantaneous spill 100t Fuel Oil / HSD /POL(Crude)700t Fuel Oil / HSD Continous spill 100t Fuel Oil / HSD for 3 days 700t Fuel Oil / HSD for 3 days Loading/ unloading operation
2200 m3/hr of Crude/FO/ and HSD for 1 min
6.9 Results of Scenario
Knowledge of probable movement of an oil slick gives a distinct advantage
while planning response strategies. Thus for instance, no major clean-up
operation is necessary if the modelling results indicate that the spilled oil
would remain at sea thereby sparing the shore ecology. On the contrary, if
modelling results are suggestive of shoreward drift and predict that particular
ecologically sensitive or important areas would be hit, effective counter
measures such as deployment of deflection booms, containment and recovery
of oil etc can be effectively taken.
Hydrodyn-OILSOFT a dedicated software for oil spill trajectory modelling is
Oil Spill Risk Assessment and Contingency Plan
Adani Hazira Port Private Limited, Hazira
Oil spill modeling studiesRevision No: 1
Page No: 53
used for prediction of oil spill scenarios at AHPPL’s berthing activities for
various meteorological and hydrological conditions. The results of various
numerical runs are discussed in the following sections.
6.9.1 Post-monsoon (December 2008)
In the initial period of this season, the resultant of surface currents and wind
currents are towards north and south. The magnitude of resultant forces of
wind and surface currents is varies from 0.0 - 2.00 m/sec depending on tidal
current and wind. The slick moves towards north or south direction based on
the wind and current forcing. The effect of wind forcing is less than surface
current drift. The spills at berths would reach the north break water within 5
hours in early December and some times the spill moves out of the port basin
depending on the tide phase. The spills at turning circle observed to be within
the turning circle for longer duration. The spills at approach channel and at the
entrance of the port move northern and southern directions based on tide
phase. The spill spread and the trajectory are influenced by the wind and
currents differently for enclosed (berths), semi-enclosed (turning circle,
entrance of the port) and open coast (approach channel). The behavior of
slick movement is more or less similar in various scenarios irrespective of
quantities of oil spilled. The area of oil spread differs depending on the
source quantities.
Figs. A.4.1 – A4.36 show the spill trajectories of 100 tons, 700 tons of Fuel oil,
HSD and Crude oil spills in the vicinity of berth, turning circle, vessel route
respectively and operational leakages of 2200 m3/hr at berths. The trajectory
of continuous leakage of FO and HSD oil spill of 100 tons and 700 tons for
three days are shown in Fig. A4.37 to A4.44. The details of spill losses during
its movement and time taken to reach the coast or crosses the model
boundary from all locations have been furnished in Table 6.1. From the table,
it can be concluded that nearly 7%-20% of oil volume has been lost due to
evaporation depending on the type of the oil.
Oil Spill Risk Assessment and Contingency Plan
Adani Hazira Port Private Limited, Hazira
Oil spill modeling studiesRevision No: 1
Page No: 54
6.9.2 Pre-monsoon(March 2009)
In the initial period of this season, the resultant of surface currents and wind
currents are towards north and south. The magnitude of resultant forces of
wind and surface currents is varies from 0.0 - 2.00 m/sec depending on tidal
current and wind. The slick moves towards north or south direction based on
the wind and current forcing. The effect of wind forcing is less than surface
current drift. The spills at berths would reach the north break water within 4 to
5 hours in early December and some times the spill moves out of the port
basin depending on the tide phase. The spills at turning circle observed to be
within the turning circle for longer duration and moves out of the port domain
depending on tidal condition. The spills at approach channel and at the
entrance of the port move southern directions based on tide phase. The spill
spread and the trajectory are influenced by the wind and currents differently
for enclosed (berths), semi-enclosed (turning circle, entrance of the port) and
open coast (approach channel). The behavior of slick movement is more or
less similar in various scenarios irrespective of quantities of oil spilled. The
area of oil spread differs depending on the source quantities.
Figs. A.5.1 – A5.36 show the spill trajectories of 100 tons, 700 tons of Fuel oil,
HSD and Crude oil spills in the vicinity of berth, turning circle, vessel route
respectively and operational leakages of 2200 m3/hr at berths. The trajectory
of continuous leakage of FO and HSD oil spill of 100 tons and 700 tons for
three days are shown in Fig. A5.37 to A5.44. The details of spill losses during
its movement and time taken to reach the coast or crosses the model
boundary from all locations have been furnished in Table 6.1. From the table,
it can be concluded that nearly 7%-20% of oil volume has been lost due to
evaporation depending on the type of the oil.
6.9.3 Monsoon(June 2009)
In the initial period of this season, the resultant of surface currents and wind
currents are towards North in outside of the port basin. The magnitude of the

Oil Spill Risk Assessment and Contingency Plan
Adani Hazira Port Private Limited, Hazira
Oil spill modeling studiesRevision No: 1
Page No: 55
resultant of wind and surface currents are about from 0.0- 1.7 m/sec
depending on tidal phase. The slick moves towards north and south direction
based on the wind and currents forcing. The effect of current forcing is
significantly higher than surface wind drift in open coast (approach channel).
The spills at berth inside the port would reach the eastern side of the quay
within 2.0 hours in early June. The behavior of slick movement is more or less
similar in various scenarios irrespective of quantities of oil spilled. The area of
oil spread differs depending on the source quantities. Fig.A.6.1 – Fig.A.6.36
show the spill trajectory of 100 tons & 700 tons leakage of Fuel oil, HSD and
Crude oil spills at Berths, Turning circle, entrance of the port and approach
channel respectively.
Figs. A.6.31– A.6.36 show the spill trajectory of 39 tons (2200 m3/hr for 1
minute spill) operation leakage of Crude oil spill at Berths. Figs. A.6.37–
A.6.44 show the spill trajectory of 100 tons and 700 tons continuous leakage
of FO and HSD for 3 days at entrance of the Port and at approach channel
respectively. The details of spill losses during its movement and time taken to
reach the coast from all locations have been furnished in Table 6.1. From the
table, it can be concluded that nearly 7% - 20% of oil volume has been lost
due to evaporation.
6.10 Shore Landing and Spill Impact Areas
The spills at different locations may reach the coast / shore / break waters
depending on the trajectory followed by the spill. Hydrodyn-OILSOFT predicts
the landing location and likely impacted stretch
6.10.1 Post-monsoon (December 2008) During this period Oil spills of approximately 80%-90% of spilled oil at berth
moves within the quay area within 1-2 hours of the spill. The details of volume
of spill are furnished in table 6.1.
Oil Spill Risk Assessment and Contingency Plan
Adani Hazira Port Private Limited, Hazira
Oil spill modeling studiesRevision No: 1
Page No: 56
6.10.2 Pre-monsoon(March 2009)
During this period Oil spills of approximately 70%-80% of spilled oil at berth
moves within the quay area within 6-7 hours of the spill. The details of volume
of spill are furnished in table 6.1.
6.10.3 Monsoon(June 2009) During this period Oil spills of approximately 78%-90% spilled oil at berth
moves within the quay area within 3-4 hours of the spill. The details of volume
of spill are furnished in table 6.1
6.11 Fate and Effects
The spilled FO, HSD and Crude oil undergoes a number of physical and
chemical changes (weathering). The major weathering processes are
spreading, evaporation, dispersion, emulsification, dissolution, oxidation,
sedimentation and biodegradation. The last three processes are long-term
processes, which determine the ultimate fate of the Fuel oil and HSD. The
remaining processes are the most important during early stages of the spill,
especially in coastal and inshore areas. Fig.A.7.1 - Fig.A.7.10 show the
variation of oil volume, spill radius, oil density and volumes of evaporated,
dissolved and emulsified oil (FO, HSD and Crude oil spill of 100 tons and 700
tons) at AHPPL Berth during December 2008. Fig.A.8.1-Fig.A.8.10 show the
variation of oil volume, spill radius, oil density and volumes of evaporated,
dissolved and emulsified oil (FO, HSD and Crude oil spill of 100 tons) at
AHPPL Berth during March 2009. Fig.A.9.1-Fig.A.9.10 show the variation of oil
volume, spill radius, oil density and volumes of evaporated, dissolved and
emulsified oil (FO, HSD and Crude oil spill of 100 tons and 700 tons) at
AHPPL Berth, during June 2009.
6.11.1 Evaporation The rate and extent of evaporation depends primarily on the volatility of the
oil. In general terms, the oil components with a boiling point below 200o C

Oil Spill Risk Assessment and Contingency Plan
Adani Hazira Port Private Limited, Hazira
Oil spill modeling studiesRevision No: 1
Page No: 57
evaporate within 5 to 6 hrs under tropical conditions. Spills of refined
products such as kerosene and gasoline evaporate completely and light crude
volume within a few hours. In contrast, Fuel oils undergo very little
evaporation. The fate and weathering processes of oil spills during various
seasons for various quantities are shown in from Figs A.7.1-A.7.10, A.8.1-
A.8.10 and A9.1 to A.9.10 for the three seasons respectively. From these
figures, it can be seen that nearly 10%-20% volume of oil will be evaporated
during its movement.
6.11.2 Emulsification Several oils have tendency to absorb water to form water-in-oil emulsions
thereby increasing the volume of the emulsified mass by a factor of 3 to 4.
Oils with asphaltene contents greater than 0.5% tend to form stable emulsions
often referred to as ‘Chocolate mousse’ while those with less asphaltene
disperse faster. The rate at which an oil is emulsified is largely a function of
sea state though viscous oils absorb water slowly. In turbulent sea conditions
low viscosity oils can incorporate as high as 80% water by volume within 2 to
3 hrs. Figs A.7.1-A.7.10, A.8.1-A.8.10 and A9.1 to A.9.10 for the three
seasons respectively show the emulsification processes of oil spill for various
spill volumes during various seasons.
6.11.3. Dissolution
The heavy components of FO are virtually insoluble in seawater while lighter
compounds, particularly aromatic hydrocarbons like benzene and toluene are
slightly soluble. Hence levels of dissolved petroleum hydrocarbons rarely
exceed 1 ppm following a spill. Evidently, dissolution does not make a
significant contribution to the removal of oil from the sea surface. Figs A.7.1-
A.7.10, A.8.1-A.8.10 and A9.1 to A.9.10 show the dissolution during the three
seasons respectively

Oil Spill Risk Assessment and Contingency Plan
Adani Hazira Port Private Limited, Hazira
Oil spill modeling studiesRevision No: 1
Page No: 58
Table 6.1 Oil Spill Analysis at AHPPL Berth: Spill Quantity, percentage of oil reaching the land/ domain boundaries and oiling for various seasons – Variable Winds
Seasons Location Spill
quantity (tons)
Losses (tons)
Time taken to
reach port
/open boundari
es (hours)
Amount of oil
on surface (tones)
% of oil reaching
to the coast/dom
ain boundarie
s
Oiling in the coast (m).
Landing Location
Post monsoon (December2008)
Berth-1
100 tons FO
6 7 94 94 155 Follows path towards berth location 2, and further on progresses towards the turning circle, from where it escapes out of the port limits.
700 tons FO
40 7 660 94.28 290 Follows path towards berth location 2, and further on progresses towards the turning circle, from where it escapes out of the port limits.
100 tons Crude
Oil
9 6.85 91 91 330 Follows path towards berth location 2, and further on progresses towards the turning circle, from where it escapes out of the port limits.
700 tons Crude
Oil
55 7 645 92.14 425 Follows path towards berth location 2, and further on progresses towards the turning circle, from where it escapes out of the port limits.
100 tons HSD
15 7.75 85 85 200 Follows path towards berth location 2, and further on progresses towards the turning circle, from where it escapes out of the port limits.
700 tons HSD
10 7 610 87.14 370 Follows path towards berth location 2, and further on progresses towards the turning circle, from where it escapes out of the port limits.
Approach
Channel(Continuous for 3days)
100 tons FO
5.5 72 94.5 94.5 600 Oil spills in the entire open water region, but away from the coast in the vicinity of the port
700 tons FO
25 72 675 96.42 1200 Oil spills in the entire open water region, but away from the coast in the vicinity of the port
100 tons HSD
30 72 70 70 600 Oil spills in the entire open water region, but away from the coast in the vicinity of the port
700 tons HSD
65 72 500 71 100 Oil spills in the entire open water region, but away from the coast in the vicinity of the port
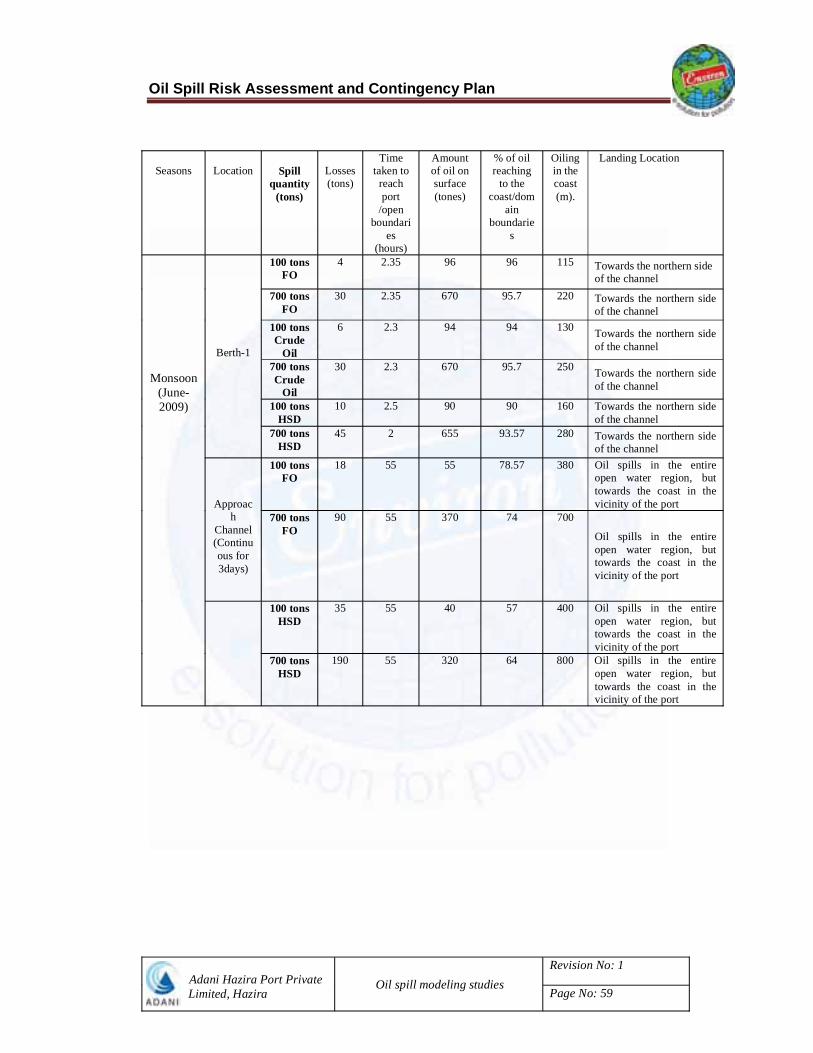
Oil Spill Risk Assessment and Contingency Plan
Adani Hazira Port Private Limited, Hazira
Oil spill modeling studiesRevision No: 1
Page No: 59
Seasons Location Spill
quantity (tons)
Losses (tons)
Time taken to
reach port
/open boundari
es (hours)
Amount of oil on surface (tones)
% of oil reaching
to the coast/dom
ain boundarie
s
Oiling in the coast (m).
Landing Location
Monsoon (June-2009)
Berth-1
100 tons FO
4 2.35 96 96 115 Towards the northern side of the channel
700 tons FO
30 2.35 670 95.7 220 Towards the northern side of the channel
100 tons Crude
Oil
6 2.3 94 94 130 Towards the northern side of the channel
700 tons Crude
Oil
30 2.3 670 95.7 250 Towards the northern side of the channel
100 tons HSD
10 2.5 90 90 160 Towards the northern side of the channel
700 tons HSD
45 2 655 93.57 280 Towards the northern side of the channel
Approach
Channel(Continuous for 3days)
100 tons FO
18 55 55 78.57 380 Oil spills in the entire open water region, but towards the coast in the vicinity of the port
700 tons FO
90 55 370 74 700
Oil spills in the entire open water region, but towards the coast in the vicinity of the port
100 tons HSD
35 55 40 57 400 Oil spills in the entire open water region, but towards the coast in the vicinity of the port
700 tons HSD
190 55 320 64 800 Oil spills in the entire open water region, but towards the coast in the vicinity of the port
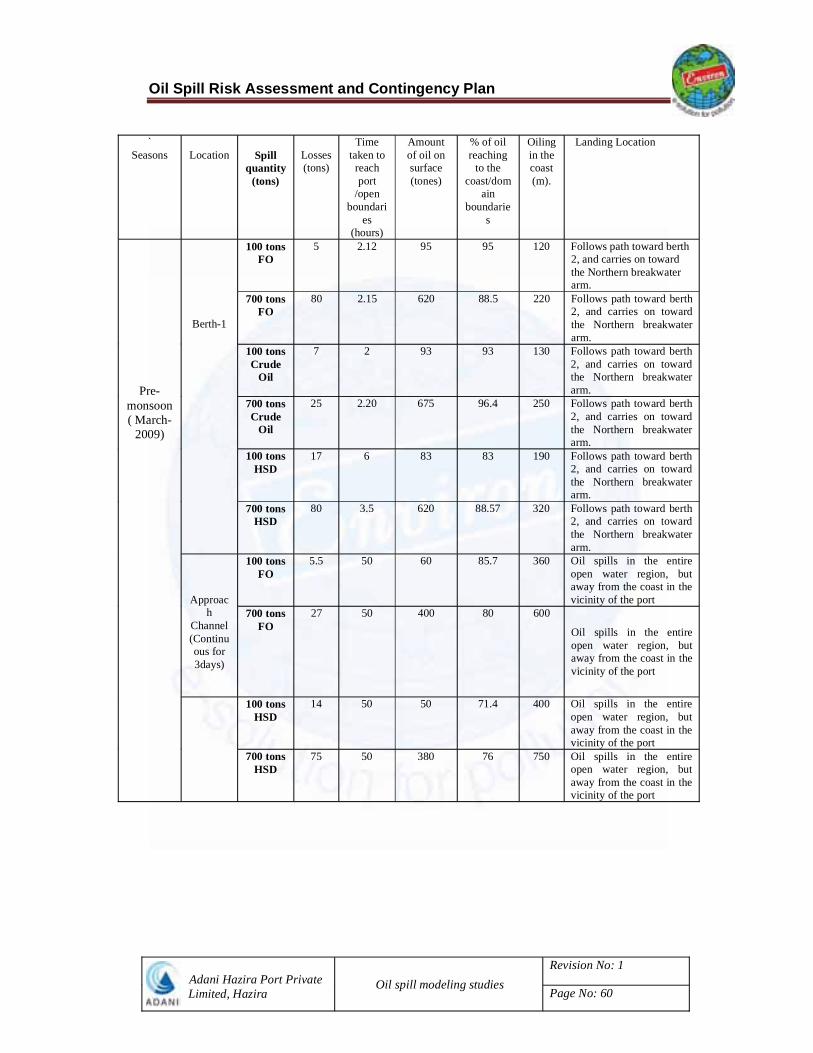
Oil Spill Risk Assessment and Contingency Plan
Adani Hazira Port Private Limited, Hazira
Oil spill modeling studiesRevision No: 1
Page No: 60
` Seasons Location Spill
quantity (tons)
Losses (tons)
Time taken to
reach port
/open boundari
es (hours)
Amount of oil on surface (tones)
% of oil reaching
to the coast/dom
ain boundarie
s
Oiling in the coast (m).
Landing Location
Pre-monsoon ( March-
2009)
Berth-1
100 tons FO
5 2.12 95 95 120 Follows path toward berth 2, and carries on toward the Northern breakwater arm.
700 tons FO
80 2.15 620 88.5 220 Follows path toward berth 2, and carries on toward the Northern breakwater arm.
100 tons Crude
Oil
7 2 93 93 130 Follows path toward berth 2, and carries on toward the Northern breakwater arm.
700 tons Crude
Oil
25 2.20 675 96.4 250 Follows path toward berth 2, and carries on toward the Northern breakwater arm.
100 tons HSD
17 6 83 83 190 Follows path toward berth 2, and carries on toward the Northern breakwater arm.
700 tons HSD
80 3.5 620 88.57 320 Follows path toward berth 2, and carries on toward the Northern breakwater arm.
Approach
Channel (Continuous for 3days)
100 tons FO
5.5 50 60 85.7 360 Oil spills in the entire open water region, but away from the coast in the vicinity of the port
700 tons FO
27 50 400 80 600
Oil spills in the entire open water region, but away from the coast in the vicinity of the port
100 tons HSD
14 50 50 71.4 400 Oil spills in the entire open water region, but away from the coast in the vicinity of the port
700 tons HSD
75 50 380 76 750 Oil spills in the entire open water region, but away from the coast in the vicinity of the port

Oil Spill Risk Assessment and Contingency Plan
Adani Hazira Port Private Limited,Hazira
Clean-up StrategyRevision No: 1
Page No: 61
7 CLEAN-UP STRATEGY
There are a number of techniques to remove the oil floating on the sea. The
clean-up strategy should be determined in relation to the assessment of the
risk of spills and to the defense of agreed priorities for protection. The
limitations of spill control techniques must be appreciated and the most
suitable equipment must be chosen for the anticipated range of weather
conditions and oil types. Various methods for clean-up of oil spills are: use of
booms, skimmers, absorbents, chemical dispersants and burning.
7.1 Booms
Booms are used for oil collection, deflection, containment/concentration and
protection.
Boom selection for a given situation must take into account the following
considerations:
The circumstances under which the boom will operate, i.e whether conditions,
wave heights, open or enclosed water, current speeds etc.
Logistic requirements, i.e. are they to be used at a fixed site, or will they need
to be easily transported?
Availability of man power and equipment to deploy the boom.
The necessity of making different types of booms, compatible to each other.
Booms can be deployed either:
(i). in the event of an oil spill
(ii). during the transfer operations
(iii). permanent deployment
Booms should be suitable for the operation in relatively shallow waters,
where high currents and choppy waves can be expected.

Oil Spill Risk Assessment and Contingency Plan
Adani Hazira Port Private Limited,Hazira
Clean-up StrategyRevision No: 1
Page No: 62
Booms also should have adequate reserve buoyancy to operate under
the above conditions.
Booms should have longer shelf life (> 5 years).
Booms should have easy handling facilities and compact storage
system.
Floating barriers should have good stability, buoyancy and corrosion
resistance for the oil spill containment solution.
7.2 Skimmers
A skimmer is a mechanical device designed to recover the oil or oily water
mixtures from the surface of the water, particularly where it has concentrated
in thicker layers against a boom or other obstacles. The efficiency of a
skimmer will depend on several parameters such as :
Operator skill
Oil thickness
Oil viscosity or degree of emulsification
Debris handling capability
Drag in action
Sea state
Storage capabilities
People deploying skimmers should be aware of three important points:
They must be selective in their choice of skimmer type
No skimmer will be 100% effective
Any skimmer will generally recover a mixture of oil and water. An oil
and water separator will be necessary
The main application for skimmers is in sheltered waters. Some can be used
in open seas but it is generally considered that when waves are higher than 2
meters (6 feet), the efficiency is very low. Skimmers should be used in

Oil Spill Risk Assessment and Contingency Plan
Adani Hazira Port Private Limited,Hazira
Clean-up StrategyRevision No: 1
Page No: 63
conjunction with containment booms to maximise recovery efficiency,
because they increase slick thickness.
7.3 Sorbents
Sorbents are defined as any material that recovers oil through either
absorption, in which the oil penetrates into the pores of the sorbent material,
or adsorption, in which the oil is attracted to the sorbent surface and then
adheres to it. Sorbents are generally marketed as sheets, rolls, pillows, and
booms, or in particulate form. The sorbent material can consist of natural
products such as peat or straw, mineral compounds such as ash, vermiculite,
or perlite, and most commonly, synthetic products such as polythylene,
polypropylene, or polyurethane foam. Sorbents are not used as the primary
method of cleanup in a large spill; rather they are usually used in the final
cleanup stages to remove small amounts of remaining oil, especially along the
shoreline. In addition, they are used to remove oil from areas inaccessible to
skimmers and other recovery equipment. Perhaps the greatest use of
sorbents is the cleanup of small operational spills in facilities, such as
refineries and plants.
The capacity of an adsorbent material depends on the amount of surface area
to which the oil can adhere. The adsorptive capacity of sorbent increases as
the surface area increases. In contrast, absorbent materials depend on
capillary action for their sorptive ability. Therefore, as the porosity of the
material increases, so does its ability to absorb oil into its capillaries. The
absorptive capacity of a material also depends on the specific gravity and
viscosity of the spilled oil. Absorbents will usually take up more light oil than
heavy oil because the light oil will be pulled farther up into the capillary
system.
Some of the sorbents are treated with oleophilic or hydrophobic agents to
increase their recovery capacity. Oleophilic agents attract oil, whereas
hydrophobic agents repel water. Both types of agents make it more likely that
Oil Spill Risk Assessment and Contingency Plan
Adani Hazira Port Private Limited,Hazira
Clean-up StrategyRevision No: 1
Page No: 64
the sorbent will pick up oil, rather than water. Treatment with oleophilic
agents would not only tend to increase the amount of oil sorbed but also
increase the amount of oil retained when the material is removed from the
water. Without treatment by hydrophobic agents, many sorbents, especially
natural sorbents such as peat moss, would sink after they had soaked up the
oil and then become water-saturated.
7.4 Dispersants
Chemical dispersants are used to combat oil pollution by breaking up oil slicks
into very small droplets. These become suspended in the water and are
rapidly diluted by the turbulent motion of the sea. Dispersion of oil into the
water prevents the formation of persistent water–in-oil emulsions and residues
are difficult to clean-up. In dispersed form, the oil is available for degradation
by microorganisms which occur naturally in the sea.
Dispersants consist of two components : a blend of surfactants which consists
of emulsifiers and wetting agents and a solvent system which acts as a carrier
for the surfactants.
Dispersants are designed to emulsify the oil into the water column in the form
of oil droplets, small enough for them to remain below the surface and not
reform as a slick. Natural water movement then ensures that the oil is diluted
in the sea, to levels which cause no environmental problem.
7.4.1 Advantages
Dispersants can be used under a wide range of weather and sea
conditions.
The use of dispersants is often the quickest response for combating
large oil spillages.

Oil Spill Risk Assessment and Contingency Plan
Adani Hazira Port Private Limited,Hazira
Clean-up StrategyRevision No: 1
Page No: 65
Sea-dispersion of floating oil reduces or removes risk of shoreline
contamination and potential fire hazard.
Dispersion of floating oil reduces the possible oil contamination of birds
and sea-mammals.
Dispersion potentially improves biodegradation by increasing oil droplet
surface area to a form more accessible for bacterial attack.
The timely use of dispersants may inhibit formation of “chocolate
mousse”
In general costs of treatment at sea are lower than costs of dealing with
oil on the shoreline.
7.4.2 Disadvantages
Dispersed oil may adversely affect marine ecology especially
sedentary species, fish forms, salt marshes and areas of low water
exchange.
Oil is not removed but dispersed into the water column.
Dispersed oil goes to areas where it would normally not go.
Oil viscosity is a limiting factor to the efficiency of dispersants. The oils
with a viscosity above 2000 and 3000 mpa are not amicable to
dispersants.
7.4.3 Areas where dispersants are not recommended to be used:
Near the water in takes to power stations, de-salination plants and processing
plants.
Salt marshes
Coral reefs
Shellfish beds
Fish hatchery
In any stagnant waters without good dilution factor.

Oil Spill Risk Assessment and Contingency Plan
Adani Hazira Port Private Limited,Hazira
Clean-up StrategyRevision No: 1
Page No: 66
7.4.4 Application in Indian Waters
As per the guidelines and policy of the Coast Guard for “use of oil spill
dispersants in Indian waters”, only those dispersants which are recommended
by NIO and approved by Coast Guard are to be used.
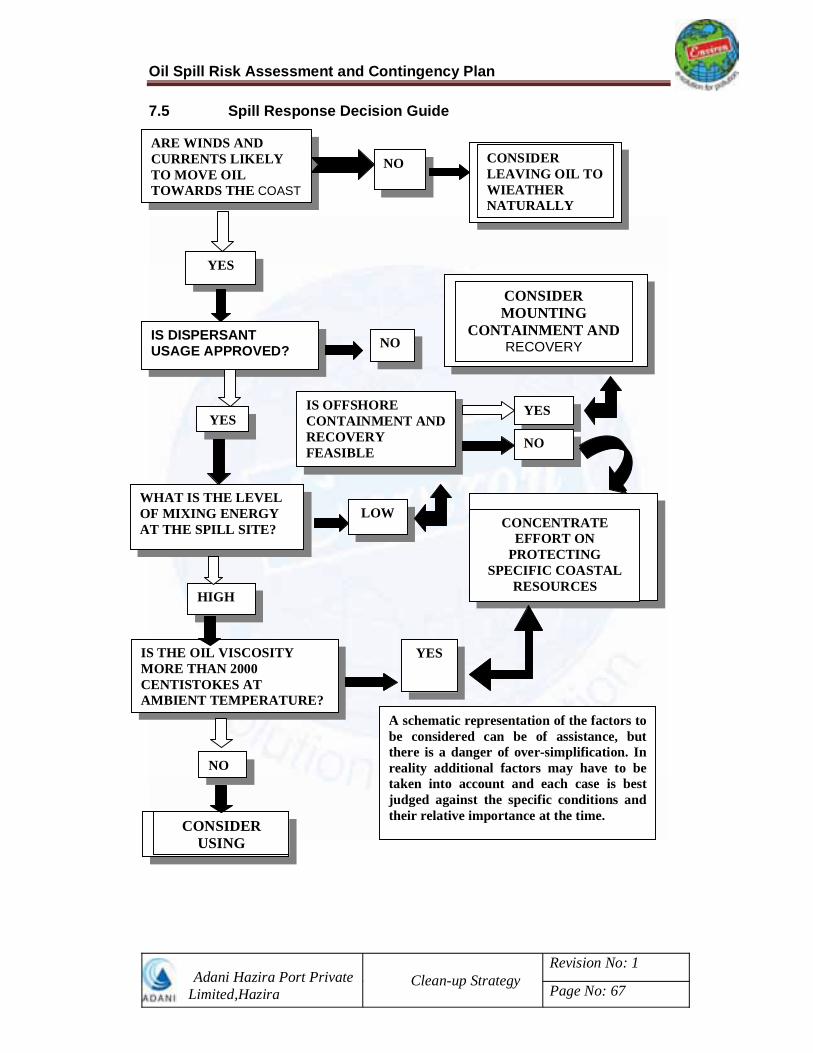
Oil Spill Risk Assessment and Contingency Plan
Adani Hazira Port Private Limited,Hazira
Clean-up StrategyRevision No: 1
Page No: 67
7.5 Spill Response Decision Guide
ARE WINDS AND CURRENTS LIKELY TO MOVE OIL TOWARDS THE COAST
NO CONSIDER LEAVING OIL TO WIEATHER NATURALLY
YES
IS DISPERSANT USAGE APPROVED? NO
CONSIDER MOUNTING
CONTAINMENT ANDRECOVERY
YESIS OFFSHORE CONTAINMENT AND RECOVERY FEASIBLE
YES
NO
WHAT IS THE LEVEL OF MIXING ENERGY AT THE SPILL SITE?
LOWCONCENTRATE
EFFORT ON PROTECTING
SPECIFIC COASTAL RESOURCES
HIGH
IS THE OIL VISCOSITY MORE THAN 2000 CENTISTOKES AT AMBIENT TEMPERATURE?
YES
NO
CONSIDER USING
A schematic representation of the factors to be considered can be of assistance, but there is a danger of over-simplification. In reality additional factors may have to be taken into account and each case is best judged against the specific conditions and their relative importance at the time.
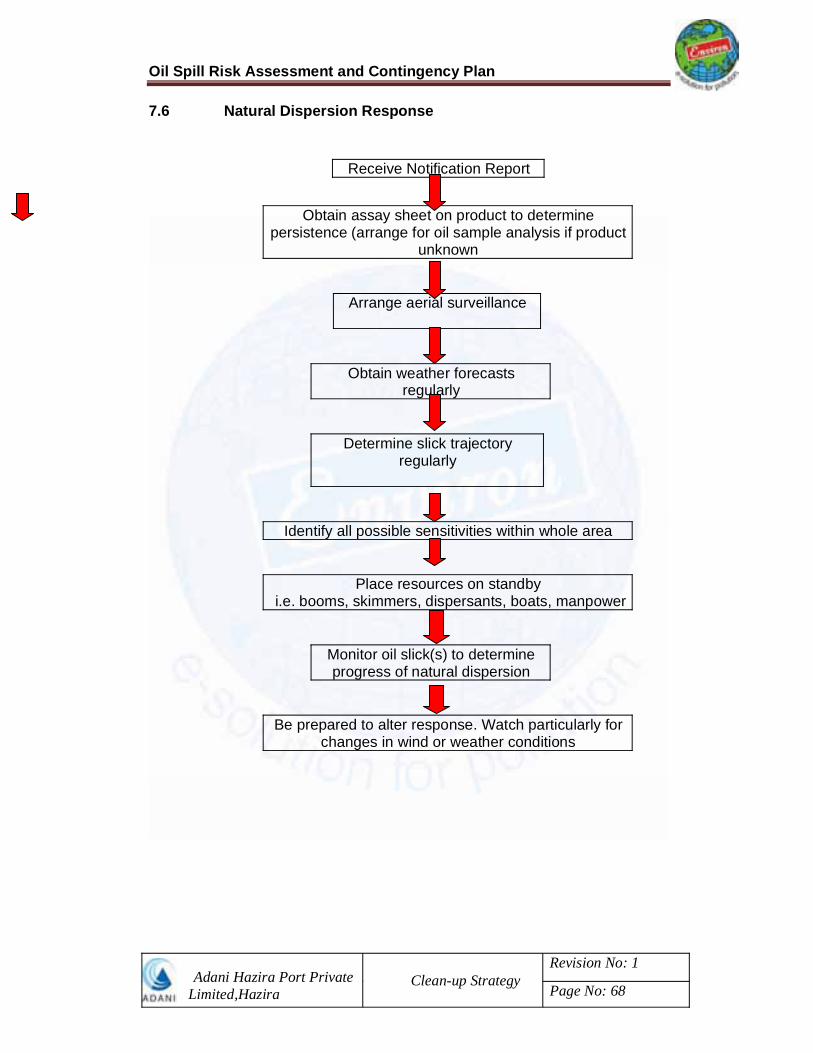
Oil Spill Risk Assessment and Contingency Plan
Adani Hazira Port Private Limited,Hazira
Clean-up StrategyRevision No: 1
Page No: 68
7.6 Natural Dispersion Response
Obtain assay sheet on product to determine persistence (arrange for oil sample analysis if product
unknown
Arrange aerial surveillance
Obtain weather forecasts regularly
Determine slick trajectory regularly
Identify all possible sensitivities within whole area
Place resources on standby i.e. booms, skimmers, dispersants, boats, manpower
Monitor oil slick(s) to determine progress of natural dispersion
Be prepared to alter response. Watch particularly for changes in wind or weather conditions
Receive Notification Report

Oil Spill Risk Assessment and Contingency Plan
Adani Hazira Port Private Limited,Hazira
Clean-up StrategyRevision No: 1
Page No: 69
7.7 Spill Response Options
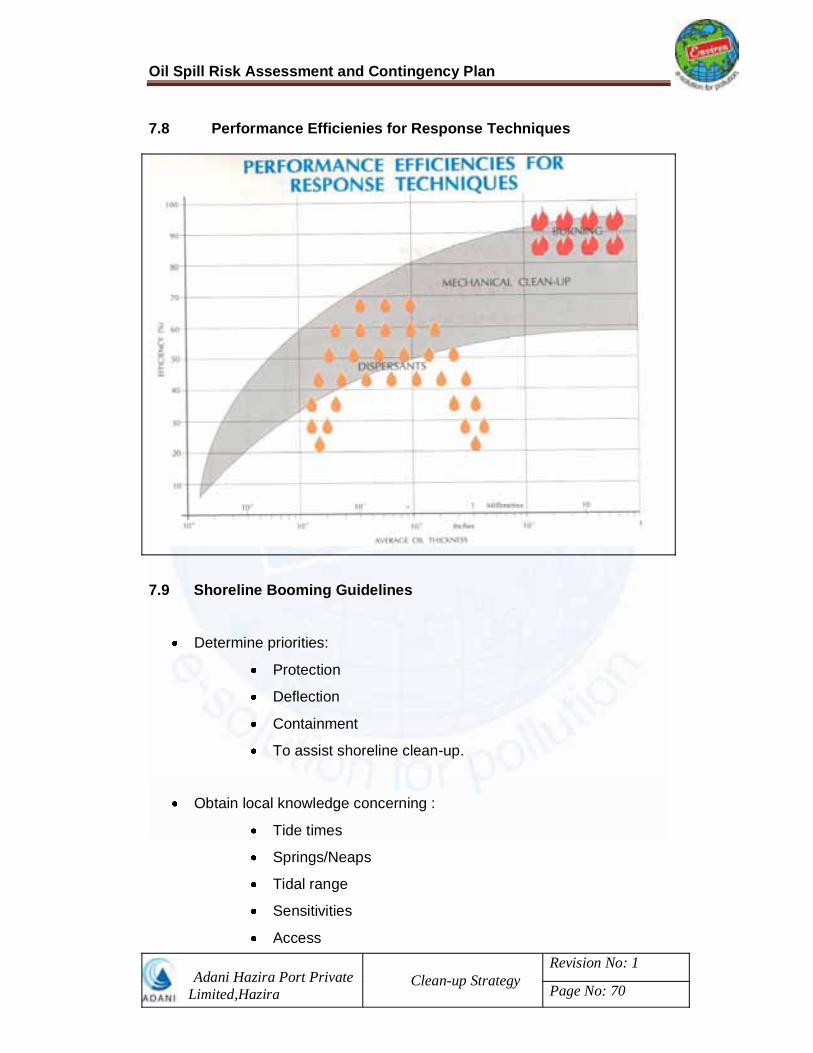
Oil Spill Risk Assessment and Contingency Plan
Adani Hazira Port Private Limited,Hazira
Clean-up StrategyRevision No: 1
Page No: 70
7.8 Performance Efficienies for Response Techniques
7.9 Shoreline Booming Guidelines
Determine priorities:
Protection
Deflection
Containment
To assist shoreline clean-up.
Obtain local knowledge concerning :
Tide times
Springs/Neaps
Tidal range
Sensitivities
Access

Oil Spill Risk Assessment and Contingency Plan
Adani Hazira Port Private Limited,Hazira
Clean-up StrategyRevision No: 1
Page No: 71
Shoreline type – Load bearing capacity (equipment /
moorings).
Gradient
HW/LW marks
Locate convenient slipways for launching boats / booms.
Containment
Find a natural collection point.
Look for where debris collects (remove if possible).
Utilise natural or manmade features e.g. sand bar or groyne.
Deflection
Extend from a land promontory e.g. peninsula or sand spit.
Assess current and wind strength to establish boom angle and length.
Use shoresealing boom in the intertidal zones.
Stockpile equipment above HW mark.
Establish how to fill shoresealing boom water tubes e.g. use incoming
tide
If flooding, or water tank supply above HW mark it ebbing.
Deployment vessels should - be shallow draft - have sufficient power
- have good deck space.
Before deployment - inshore moorings should be established (above
HW mark).
- booms pre-connected (shore sealing boom
empty of water).
- floating moorings prepared at aprox. 25m
intervals.
- ensure good communication between shore and
boats.
Oil Spill Risk Assessment and Contingency Plan
Adani Hazira Port Private Limited,Hazira
Clean-up StrategyRevision No: 1
Page No: 72
Upon deployment - vessels should tow boom out slowly, taking
account of wind and current.
- set moorings up current, unless wind ‘is
stronger over tide
- Moorings can be readjusted on tripping lines.
Upon completion - fill watertubes on shoresealing boom.
At turn of tide - Reverse boom angle (use slack period).
7.10 Shoreline Clean-up Equipment Checklist
General provisions
Protective clothing for everybody (including boots and gloves), spare
clothing.
Cleaning material, rags, soap, detergents, brushes.
Equipment to clean clothes, machinery, etc., with jets of hot water.
Plastic bags (heavy duty) for collecting oily debris.
Heavy duty plastic sheets for storage areas especially for the lining of
temporary storage pits.
Spades, shovels, scrapers, buckets, rakes
Ropes and lines
Anchors, buoys
Lamps and portable generators
Whistles
First Aid material.
Special equipment which may be used Workboats Trucks / cars (four wheel drive) Radio transmitter / receivers Workshop / repair facilities Bulldozers, mechanical scrapers and similar earthmoving Equipment Vacuum trucks

Oil Spill Risk Assessment and Contingency Plan
Adani Hazira Port Private Limited,Hazira
Clean-up StrategyRevision No: 1
Page No: 73
Tank trailers Life vests Explosive meters
7.11 Resources Required for Combating Oil Spill
Based on the oil spill modeling study, it has been observed that an oil spill of
Fuel Oil of 100 t will spread over an area having radius of around 170 m within
2 hours. Accordingly, the minimum resources required are estimated as
follows:
Resources required Equipment Quantity Pressure inflatable boom 200m Boom storage reel 1 Accessories Inflation blowers Towing bridles Boom repair kit
1
Hydraulic power unit 1 Temporary storage tanks (capacity) 5000 lit 1 Nos
Resources will be finalized in consultation with officials of Indian Coast Guard & AHPPL.
Resources may be upgraded as and when the expansion of the operational activity takes place.
Pollution control equipment to be procured for marine facilities to match the perceived risks

Oil spill Risk Assessment and Contingency Plan
Adani Hazira Port Private Limited, Hazira
Resources at Risk Revision No: 1
Page No :74
8 RESOURCES AT RISK
The Port of Hazira handles the LNG through southern open sea. There is a
need to protect the ecosystem and marine environment during the oil spill at
Hazira or within the limits of Hazira Port.
The resources likely to be threatened are as under.
Hazira Port surrounding areas
East coast of Khambhat – Hazira
Tidal flats (east) / ecosystem
Existing facilities of HPPL
The spills at the approach channel and at the entrance of the port moves
towards northern and southern directions, depending on tidal phase and wind
patterns. The spills at berths and turning circle will take longer duration to
escape from the basin area and partly obstructed due to the quay and
breakwaters.
Oil Spill Risk Assessment and Contingency Plan
Adani Hazira Port Private
Limited, HaziraTemporary storage facility and
disposal of Oil and Debris
Revision No: 1
Page No: 75
9 TEMPORARY STORAGE FACILITIES AND DISPOSAL OF OIL AND DEBRIS
Most oil spill clean-up operations, particularly those on shore, result in the
collection of substantial quantities of oil and oily debris, which must eventually
be dealt with. Manual collection has wide application and can be used on any
type coastline but is particularly for sensitive and inaccessible areas. It is
more selective than techniques involving heavy machinery although
productivity is low.
The consideration and selection of appropriate treatment methods, either to
recycle the oil or render the collected material suitable for disposal, are
important aspects of any contingency plan. Ideally as much of the collected oil
as possible should be processed through a refinery or oil recycling plant.
Unfortunately, this is rarely possible due to weathering of the oil and
contamination with debris and so some form of disposal is usually required.
This includes direct dumping; stabilization for use in land reclamation or road
foundations; and destruction through biological processes or burning. The
disposal option chosen will depend upon the amount and type of oil and
debris, the location of the spill, environmental and legal considerations, and
likely costs involved. In the case of large spills, it may be necessary to store
collected material for some time before it can all be dealt with.
9.1 Storage Facilities
Flexible open topped tank – Suitable for initial storage to allow operation to
start. Not movable when full. Primary use with low capacity skimmers up to 10
t/hr.
Flexible pillow tanks – no support – Suitable for initial storage to allow start
of operation. Not movable when full. Danger of being unable to remove heavy

Oil Spill Risk Assessment and Contingency Plan
Adani Hazira Port Private
Limited, HaziraTemporary storage facility and
disposal of Oil and Debris
Revision No: 1
Page No: 76
mousse once inside tank. Primary use with low capacity skimmers up to 10
t/hr.
Flexible pillow tanks – with support on pallets – Suitable for initial storage
to start operation. Can be moved provided suitable lifting equipment available.
May be difficult to remove heavy mousse from tank. Suitable for low capacity
skimmers up to 10 t/hr.
Dracones – buoyant rubber storage tanks – Suitable for initial storage for
operations at sea. May be problems in removing mousse from them. Suitable
for low to medium capacity skimming operations up to 50 t/hr. depending on
size of dracones
Mobile road tanks – Well suited for operations close to the shore, especially
when quays are available when they allow easy transportation of recovered oil
to disposal points. They are also used to recover oil from primary storage
vessels, dracones, barges, pillow tanks, etc.
Barges – Normally suitable for both small and large capacity skimmers not
only because of their capacity, but also because they can provide a stable
working platform off which skimmers can be operated.
Oil tankers – Suitable for very large spills – normally best used to collect oil
already recovered in barges etc. If recovery systems with very large capacity
(500 t/hr) are used, small coastal tankers will need to be used as primary
storages.
Ships tanks – It is rare that masters will permit the use of their spare tankage
for the reception of recovered oil. However, in a number of areas where boats
have been previously identified as oil recovery vessels, some tankage is set
aside for handling recovered oil.

Oil Spill Risk Assessment and Contingency Plan
Adani Hazira Port Private
Limited, HaziraTemporary storage facility and
disposal of Oil and Debris
Revision No: 1
Page No: 77
Movable open top tanks – Suitable at first storage in separating heavily oiled
solids from bulk of oil by use of coarse sieves of wire mesh.
Plastic bags (heavy duty) – Ideally suited when clearing beaches by hand.
They can be manhandled when full and moved well away from the high water
line for eventual collection. However, they lead to problems at the disposal
end.
Open topped barrels – Providing some lifting facilities are available they can
be suitable for collecting debris form beaches, transporting full plastic bags to
central storage / disposal areas.
Skips – Very robust containers ideally suited for the transportation of oil
contaminated solid debris to disposal sites. Can be transported on rig supply
boats / landing craft to get to isolated sites. If possible line with plastic sheet.
Lorries – Provided there is good access to beaches etc. lorries can be used
to transport solid debris with low oil contamination.
Temporary storage pits – Need to be lined with plastic sheets to prevent
contamination of ground waters and, where sharp rocks / protrusions may
cause damage to sheet, pre-lined with sand etc. to give smooth surface.
Should be close to major clean-up sites to act as temporary reception for
contaminated solid debris.
9.2 Disposal Methods Methods for separation and disposal of oil and debris are described in
Table.9.1

Oil Spill Risk Assessment and Contingency Plan
Adani Hazira Port Private
Limited, HaziraTemporary storage facility and
disposal of Oil and Debris
Revision No: 1
Page No: 78
Table : 9.1 Separation and disposal of oil and debris
Type of material Separation methods Disposal methods LIQUIDS Non-emulsified
oils Gravity separation of free water
Use of recovered oil as fuel or refinery feedstock
Emulsified oils Emulsion broken to release water by ; - Heat treatment - Emulsion breaking
chemicals- Mixing with sand
Use of recovered oil as fuel or refinery feedstockBurningReturn of separated sand to source
SOLIDS Oil mixed with sand
Collection of liquid oil leaching from sand during temporary storage Extraction of oil from sand by washing with water or solvent Removal of solid oil by sieving
Use of recovered oil as fuel or refinery feedstockDirect disposal Stablisation with inorganic material Degradation through land farming or composting Burning
Oil mixed with cobbles, pebbles or shingle
Collection of liquid oil leaching from beach material during temporary storage Extraction of oil from beach material by washing with water or solvents
Direct disposal Burning
Oil mixed with wood, plastics, sea weeds, sorbents
Collection of liquids leaching from debris during temporary storage Flushing of oil from debris with water
Direct disposal Burning Degradation through land farming or composting for oil mixed with sea weeds or natural sorbents
Tar balls Separation from sand by sieving
Direct disposal Burning
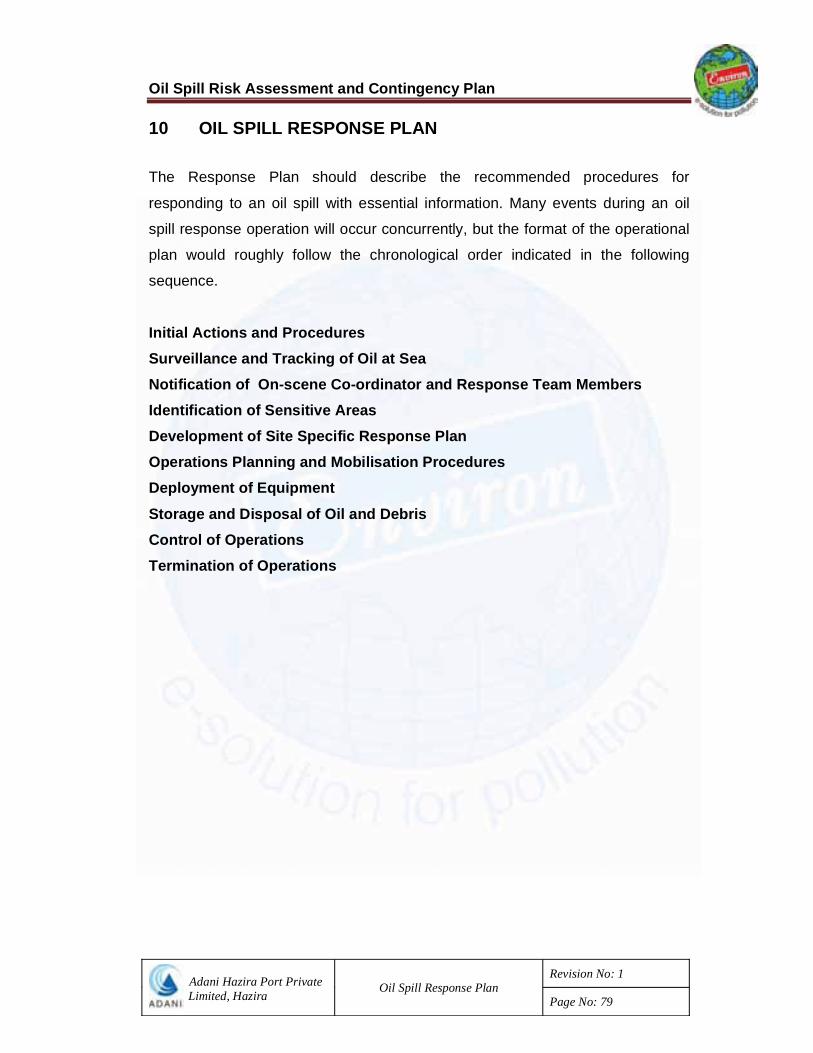
Oil Spill Risk Assessment and Contingency Plan
Adani Hazira Port Private Limited, Hazira
Oil Spill Response Plan Revision No: 1
Page No: 79
10 OIL SPILL RESPONSE PLAN
The Response Plan should describe the recommended procedures for
responding to an oil spill with essential information. Many events during an oil
spill response operation will occur concurrently, but the format of the operational
plan would roughly follow the chronological order indicated in the following
sequence.
Initial Actions and Procedures Surveillance and Tracking of Oil at Sea Notification of On-scene Co-ordinator and Response Team Members Identification of Sensitive Areas Development of Site Specific Response Plan Operations Planning and Mobilisation Procedures Deployment of Equipment Storage and Disposal of Oil and Debris Control of Operations Termination of Operations

Oil Spill Risk Assessment and Contingency Plan
Adani Hazira Port Private Limited, Hazira
Oil Spill Response Plan Revision No: 1
Page No: 80
10.1 INITIAL ACTIONS AND PROCEDURES
10.1.1 Reporting oil spill incidence Immediately upon notice of an oil spill, Incidence Reporting will be done in
the prescribed format to the following agencies:
Internal within organization
Indian Coast Guard
Oil Industry Safety Directorate
Directorate General of Hydrocarbon (DGH)
Concerned Port and Harbour Authorities
Mutual Aid Partners
10.1.2 Notification information details required as follows:
Date and time of observation (24 hr clock).
Position (preferably Lat./Long., and/or description using recognized
names).
Source and cause of spill.
Estimate of amount spilled and continued spillage rate.
Description of slick size.
Type of oil spilled and characteristics Specific gravity / density
API gravity Viscosity (at 20oC or as defined). Pour point (oC). Wax content (%) Tide, weather and sea conditions. Owners of oil and carrier. Clean-up organization in place/responsible – name and contact details of on-Scene Commander.

Oil Spill Risk Assessment and Contingency Plan
Adani Hazira Port Private Limited, Hazira
Oil Spill Response Plan Revision No: 1
Page No: 81
Actions, both taken and intended, to combat pollution and prevent further spillage. Statutory local environmental bodies and contact details. Name, occupation and contact details of initial observers.
10.1.3 Oil spill report form
Complete the oil spill report form as under using the details of notifications
and information known and report to the Coast Guard Regional Centre.
OIL SPILL REPORT FORM
PARTICULARS OF ORGANISATION/ PERSON REPORTING INCIDENT
Sl.No. Description Remarks
1 Person
2 Title
3 Company
4 Telephone number
5 Fax Number
6 Date of spill
7 Time of spill
8 Type of oil spill
9 Spill location
10 Quality of spill
11 Cause of spill
12 Response to spillage
13 Any other information
SIGNED BY Terminal Manager

Oil Spill Risk Assessment and Contingency Plan
Adani Hazira Port Private Limited, Hazira
Oil Spill Response Plan Revision No: 1
Page No: 82
10.2 Surveillance and Tracking of Oil at Sea
Immediately after the spill, carry out the surveillance for assessing the quantity
and movement of spilled oil:
Find oil slick (visually or by remote sensing)
Fly along slick length and breadth and measure distance
Log parameters of slick
Calculate area of slick in square kilometers
Determine types of oil on surface and percentage cover per type. Calculate oil volume
Time
Position of slick (Lat. & Long.).
Wind speed and direction
Dimensions of slick.
Overall cover
Percentage cover for each oil type (see table below).
Volume of each oil type.
General comments on oil appearance (shape, direction of movement).
General comments on weather.
Appearance of oil at sea.
Code Colour Oil Type Thickness Volume/ km2
1 Silvery Sheen 0.0001mm 0.1m3
2 Iridescent Sheen 0.0003mm 0.3m3
3 Black/dark brown Crude/Fuel Oil 0.1mm 100m3
4 Brown/orange Emulsion 1mm 1000m3

Oil Spill Risk Assessment and Contingency Plan
Adani Hazira Port Private Limited, Hazira
Oil Spill Response Plan Revision No: 1
Page No: 83
Movement of oil on the sea surface
Oil will move at 100% of the current speed and approximately 3% of the wind speed.
10.3 Notification of On-scene Co-ordinator and response team members
Notify on-scene co-ordinator and response team members
Establish the base control room
Report contact numbers of control room to all concerned for effective
co-ordination.
10.4 Identification of Sensitive Areas
Identify the sensitive areas and inform the parties.
Protect the sensitive areas as per the priorities.
The sensitive areas identified in this region are mangrove habitata,
coral reefs and mudflats.
10.5 Development of Site Specific Response Plan On-scene co-coordinator will identify the facilities required and sources from
where the resources are mobilized.
Immediate response plan: Includes control of spill at source keeping the pollution confined near to the
source with minimum requirement of gears. The plan will also highlight whether
the response is at all necessary.
Long term response plan: Includes containment, mechanical recovery, choice of equipment to be deployed,
and storage and disposal of recovered oil.

Oil Spill Risk Assessment and Contingency Plan
Adani Hazira Port Private Limited, Hazira
Oil Spill Response Plan Revision No: 1
Page No: 84
10.6 Operations Planning and Mobilisation Procedures
Mobilisation procedures are required only in case the spill is likely to affect the
coastline and damage the marine sensitive areas. In this case, follow the steps
as under.
Assemble full response team
Identify immediate response priorities
Mobilise immediate response
Prepare initial press statement
Decide to escalate to higher tier if required
Mobilise or place on stand by resources required
Establish field command post and communications
In the case of minor spills, roles may be combined
ADVICE
Salvage Firefighting Technical
Environmental Legal
Insurance Disposal
SUPPORT
Communications Administration
Historian Public Relations +
Government liaison Logistics:- Vehicles Vessels Aircraft
Equipment Materials
Manpower Provisions
Accommodation Maintenance
Safety Accountant
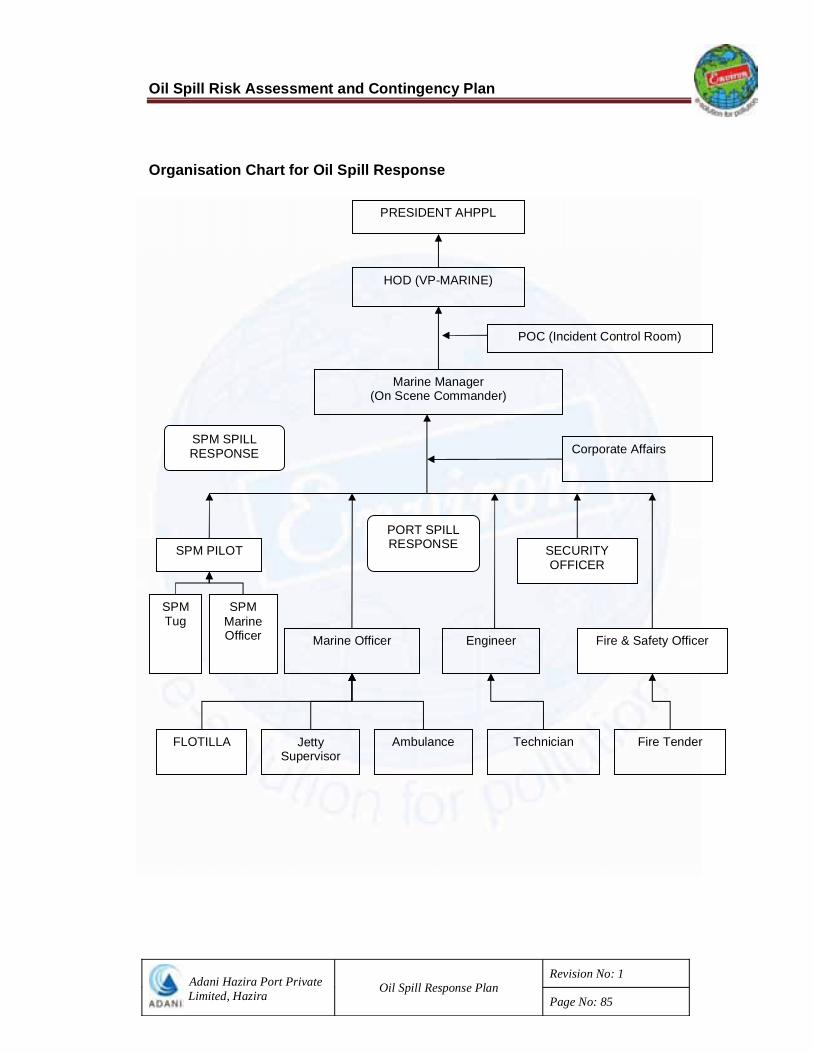
Oil Spill Risk Assessment and Contingency Plan
Adani Hazira Port Private Limited, Hazira
Oil Spill Response Plan Revision No: 1
Page No: 85
Organisation Chart for Oil Spill Response
PRESIDENT AHPPL
POC (Incident Control Room)
Marine Manager (On Scene Commander)
Corporate Affairs
Marine Officer Engineer
Ambulance Jetty Supervisor
Technician Fire Tender
HOD (VP-MARINE)
SPM PILOT
Fire & Safety Officer
SPM Tug
SECURITY OFFICER
PORT SPILL RESPONSE
SPM SPILL RESPONSE
FLOTILLA
SPM Marine Officer

Oil Spill Risk Assessment and Contingency Plan
Adani Hazira Port Private Limited, Hazira
Oil Spill Response Plan Revision No: 1
Page No: 86
LIST OF IMPORTANT TELEPHONE NUMBERS OF ADANI GROUP AHPPL, GOVT. OFFICIALS AND OTHER NEIGHBORING ORGANISATIONS RELATED TO SPILL COMBATING
EMERGENCY TELEPHONE NOS.
Sr. No. Name Designation OFFICE Resident
B. OTHERS, EXTERNAL
1. Collector, Surat 2471121 / 2472471 2669080
2. Dy Director of Industrial Safety & Health –Surat 2472422, 2473501 2667692
3. Controller of Explosive (0265) 2420512
4. GPCB Surat 2442696/2429733
5. Boiler Inspector, Surat 2472427
6. FIRE SERVICES
1. SMC, Fire Control Room 101, 2414195, 2414196, 2414139
2. Chief Fire Officer, SMC (Mr. G. M. Kutwala) 2436636, 2414195-96 2451724, 9724345234
3. Reliance Fire Station 3035068/ 3035555
4. KRIBHCO Fire Station 2802122
5. ONGC Fire Station 2840026
6. NTPC Fire Service (Kawas) 2860374, 2860445, 2877705 Ext. 5856,5808
7. L & T Exchange 2860345

Oil Spill Risk Assessment and Contingency Plan
Adani Hazira Port Private Limited, Hazira
Oil Spill Response Plan Revision No: 1
Page No: 87
Continue… EMERGENCY TELEPHONE NOS.
Sr. No. Name of Emergency Services
7. POLICE
1. Police Commissioner (Surat) 2463939 2667322, 9978406271
2. Police Control Room 2462100 / 2462600 2474488 / 100 -
3. Add. Police Commissioner -1 2463737
4. Add. Police Commissioner -2 2463838
5. Police Station (Ichhapore) 2860197, 9925143737 -
6. Police Station(Rander) 2766152 -
8. MEDICAL (HOSPITAL)-
1. Civil Hospital (New) 2244456 / 57/ 58 / 59
2. Mahavir General Hospital, Sagarampura 2332828/ 2330180/ 2331181/ 2330274
3. Mission (7th day) Hospital 2667591/2669615
4. Maskti Hospital, Surat 2420412
5. Lokhat Hospital 2422080-81
6. SDA Hospital, Athwa lines, Surat 2669615 2667591 to 95
7. Ashakttashram 2422060/ 9998270463 2422061
8. BAPS 2781000
9. Ridhi Sidhdhi 2599234/ 2599294
10. Sanjivani Hospital, Chalthan 2433076 271267
9. BLOOD BANK
Surat Raktdan Kendra 2594594/ 2597754
Samarpan Raktadan Kendra 2547575/ 2553020
10. OTHERS
1. Municipal Water Supply 2422285-86
2. Gujarat Gas Co. 2736333 / 2736388

Oil Spill Risk Assessment and Contingency Plan
Adani Hazira Port Private Limited, Hazira
Oil Spill Response Plan Revision No: 1
Page No: 88
Continue... EMERGENCY TELEPHONE NOS.
Sr. No. Name of Emergency Services OFFICE Resident
11. SOCIAL SERVICES
Akhil Hind Mahila Parisad, Bruhad Surat Branch 2470413 / 2462930
Nav Sargen Manav Vikas Kendra 2475683
12. EDUCATIONAL INSTITUTES FOR SHELTER
Navyug Arts College, Rander Road 2784293
Navyug Commerce College, Rander Road 2784102
Navyug Science College, Rander Road 2734103
V. D. Desai Vadiwala High School, Adajan Road 2734941
Daliya High School, Adajan Gam 2734002
13. MEDICAL FACILITIES
Reliance Industries Ltd. Mora 3035070
KRIBHCO 2802707
ONGC 2875531
NTPC 2877095

Oil Spill Risk Assessment and Contingency Plan
Adani Hazira Port Private Limited, Hazira
Oil Spill Response Plan Revision No: 1
Page No: 89
Continue.. EMERGENCY TELEPHONE NOS.
Sr. No. Name of Emergency Services OFFICE RESIDENCE
14. PRESS MEDIA FOR INFORMATION.
1. Dy. Director Information 2465541 2422233
2. All India Radio 2233416 2440033
3.Gujarat Mitra, Surat 2599991-92-93-94
4. Sandesh 2543000/ 2544000
5. Gujarat Samachar 2324545
8. Times of India 2256161-62
9. Indian Express 2473016
15. MEDIA
1. Doordarshan 2781179/ 2784700
2. Akashwani (All India Rasdio) 2233416/ 2236209
3. Pariwar Video Magagine (Surat Channel) 9825472908/ 6533700
16. EXPERTS (INDUSTRIAL SAFETY & HEALTH)
1. Shri. S. G. Patel, General Manager (Safety), Reliance Industries Ltd. Mora. 9998011604 / 2835066 3035064-66
2. Shri. S M Basha, Manager (F&S), KRIBHCO Ltd. Surat 9879827885 / 2802789 2802789
3. Shri A.K. Bansal, Head (HSE), ONGC Ltd. Surat 9426613904 ---
17. ELECTRICITY
1. South Gujarat Electricity 2804203
2. SGVCL, Ichchapor (GEB) 2254390
3. SGVCL, RANDER (GEB) 2776122
4. Gujarat Gas Co. 2736333/388

Oil Spill Risk Assessment and Contingency Plan
Adani Hazira Port Private Limited, Hazira
Oil Spill Response Plan Revision No: 1
Page No: 90
LOCAL CRISIS GROUPHAZIRA-OLPAD
TELEPHONE NUMBERS
Sr. No. Name OFFICE RESIDENCE
1Chair Person, Sub Divisional
Magistrate, Hazira Area, Tal-Olpad, Dist-Surat
2464261 2465116
2 Dy. Director of Industrial, Safety and Health, (Factory Inspector), Surat 2472422 2667692
M-9825058741
3 Mamlatdar, Olpad 02621-221245 02621-221259
4 Police Inspector, Ichchapore Police Station, Ichchapore 2860197 / 2840040 9925143737
5 Certifying Surgeon, Surat 2472422 9825085231
6 CMO, Community Health Centre, OLPAD 02621-222048
7 VP- Fire (Shri. D.M. Reddy), RIL- Hazira 3035069 2835061 /
9898876565
8 Sarpanch, Oldpad Group Grampanchayat, Oldpad 02621-222086 9825499735
9Factory Medical Officer, Cyanides
and Chemicals Co., GIDC Ind. Estate, Oldpad-394540
221681-2-3-4 Ext. 214 Ext. 240
10 Secretary, Kamal Club (Social Service Organisation), Olpad 2802022 9925240218
11 Sr. Manager(Fire &Safety),Kribhco 2862766/2862770/2802012 2802552
12 Chief Manager, ONGC, Bhatpore. Surat 2875500 2210270

Oil Spill Risk Assessment and Contingency Plan
Adani Hazira Port Private Limited, Hazira
Oil Spill Response Plan Revision No: 1
Page No: 91
DISTRICT CRISIS GROUPSURAT
TELEPHONE NUMBERSSr. No. Name OFFICE RESIDENCE
1 District Magistrate & Collector, Dist-Surat 0261-2471121, 2472471 2669080, 2669580
2 Commissioner, Surat Municipal Corporation
9825144800 / 0261-2422244 0261-2611560
3 District Development Officer, Surat 0261-24322154 0261-2667453
4 Police Commissioner, Surat 9978406271 / 2463939 2667322, 2668373 Mo.9978406271
5 District Supdt of Police 2479164 2667458
6 Residence Dy. Collector, Surat 02621-2472211,2472082-3-4 2650390,2652915
7 Jt. Director, Industrial Safety & Health,(Surat Region), Surat 2473501, 2472422 2667692
8 Dy. Director, Industrial Safety & Health, Surat 0261-2472422 2667692
M-9825188753
9 Chief Fire officer, Surat, Municipal Corporation, Surat
2414195-96, 2414139, 2436636/ 9724345234 2428904
10Executive Engineer, Public Health & Mechanical Division, Gujarat Water
Supply & Several Borard, Surat 2687376 2687975
11 Executive Engineer, (R & B), Surat 2464162 2660411
12 Regional Manager, GIDC, Surat 2667257, 2668443
13 District Agriculture Officer, Surat 2425751
14 Supdt. Engineer, S. G. E. B. SURAT 2573729, 2571292
15 Dy. Director of Information, District Information Office, Surat 2479172 2422233, 2440033
16 Chief Civil Defence, Surat 2472043 2669218, 2669077
17 Medical Superintendent, New Civil Hospital, Surat 2244456, 2244459 2653900
18 District Health Officer, Surat 9428509526 / 2430589 2669810
19 Regional Transport Officer, Surat 2472436, 2472185 2669064
20 State Manager Transport Office, Surat 2543365
21 Dy. Controller of Explosive, Vadodara (0265) 2420512
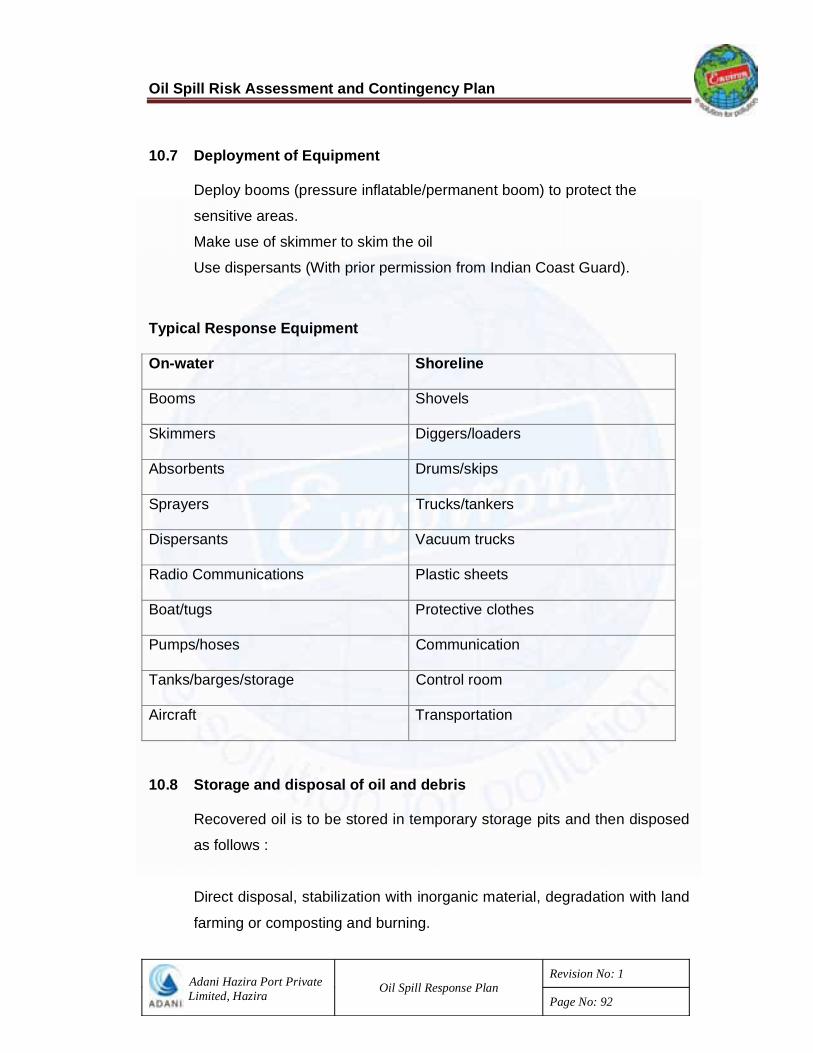
Oil Spill Risk Assessment and Contingency Plan
Adani Hazira Port Private Limited, Hazira
Oil Spill Response Plan Revision No: 1
Page No: 92
10.7 Deployment of Equipment
Deploy booms (pressure inflatable/permanent boom) to protect the
sensitive areas.
Make use of skimmer to skim the oil
Use dispersants (With prior permission from Indian Coast Guard).
Typical Response Equipment
On-water Shoreline
Booms Shovels
Skimmers Diggers/loaders
Absorbents Drums/skips
Sprayers Trucks/tankers
Dispersants Vacuum trucks
Radio Communications Plastic sheets
Boat/tugs Protective clothes
Pumps/hoses Communication
Tanks/barges/storage Control room
Aircraft Transportation
10.8 Storage and disposal of oil and debris
Recovered oil is to be stored in temporary storage pits and then disposed
as follows :
Direct disposal, stabilization with inorganic material, degradation with land
farming or composting and burning.

Oil Spill Risk Assessment and Contingency Plan
Adani Hazira Port Private Limited, Hazira
Oil Spill Response Plan Revision No: 1
Page No: 93
10.9 Control of Operations
Establish a management team with experts and advisors
Update information (sea/wind/weather forecast, aerial surveillance, beach
report)
Review and plan operations accordingly
Obtain additional equipment, supplies and man power if required
Prepare daily incident log and management reports
Prepare operations accounting and financing reports
Prepare releases for public and press conferences
Brief local and government officials including Coast Guards
10.10 Terminations of Operations
Standing-down equipment for cleaning, maintaining and replacing
Prepare formal detailed report
Review plans and procedures from lessons learnt
Oil Spill Response Management Checklist
General
Carry out initial actions and notifications.
Activate Response Team.
Set-up Command Centre.
Briefings – Ensure regular briefings to update relevant people,
including Public Relations staff.
Event log – keep a strict log of events, communications, personnel,
equipment ordered.
Liaise – get advice from relevant experts – environmental and
technical.
Priorities areas for clean-up.

Oil Spill Risk Assessment and Contingency Plan
Adani Hazira Port Private Limited, Hazira
Oil Spill Response Plan Revision No: 1
Page No: 94
Access – liaise with land owners for necessary clearances and
keys.
Locate and acquire necessary clean-up equipment and personnel.
Storage and disposal of oily waste.
Oiled birds clean-up.
Keep head office informed of events.
Media and public – press statements and conferences, guidelines
to personnel.
Personnel logistics
Safety -all personnel must be fully briefed in safety
matters and have necessary training and
certification.
-Safety and First Aid equipment
-Clothing; warm, dry, fully protective.
-Hygiene facilities – toilets and cleaning
areas.
Transportation -method
-visas and immigration procedures
Equipment -On-site training (e.g. VHF radios, all-terrain
vehicles).
Accommodation -Shelter from cold/heat/rain/snow.
-overnight sleeping accommodation.
Food and drink -maintain constant supply
Equipment logistics
Transportation - Road, lorries with tail lifts, rough terrain
vehicles.
- Sea.
- Air – large aperture doors.
- Customs and Documentation.

Oil Spill Risk Assessment and Contingency Plan
Adani Hazira Port Private Limited, Hazira
Oil Spill Response Plan Revision No: 1
Page No: 95
Equipment Storage - Security
Equipment - workshop facilities
Maintenance - cleaning areas.
- spare parts must accompany equipment
Command Centre Checklist
Forms of communication
Telephone - Network (maintain some private lines for outgoing calls).
- Cellular (Mobile)
- Recording Unit
VHF - Base Station.
Hand sets.
Spare Batteries.
Battery Charger
Headsets.
Pump-up Aerial.
Repeater Station.
Satellite Communication Set.
Telex
Fax (at least two for outgoing and incoming faxes).
Computer (Modem, E-mail).
Notes : Ensure suitable power sources. Preferably the Command Centre should
be positioned near spill site and on elevated ground for good VHF
communication.
Information

Oil Spill Risk Assessment and Contingency Plan
Adani Hazira Port Private Limited, Hazira
Oil Spill Response Plan Revision No: 1
Page No: 96
Response Log
Charts/Maps – Marine, Road, Sensitivity, etc.
Call signs.
Situation Report Boards.
Tide Tables
Contingency Plans
Contact Directories
Facilities Lots of space, desks and chairs.
Kitchen.
Toilets.
Reception room for media.
Meeting room(s).
Security.
Support equipment
Photocopier.
Computer and software (equipment databases, word-
processing, accounting, oil spill trajectory model).
Overhead projector
Stationary
First Aid box
Whiteboard
Contingency Planning Checklist
Information gathering and planning
Scope – General or specific plan; Tier 1, 2 or 3
response.

Oil Spill Risk Assessment and Contingency Plan
Adani Hazira Port Private Limited, Hazira
Oil Spill Response Plan Revision No: 1
Page No: 97
Assessment of spill risk – Previous spills – causes, locations,
volumes. - Types of oil – sp. gravities,
viscosities, toxicities.
- Spill scenarios – consider possibilities,
be imaginative.
Movement of oil – current directions and strengths at
different times of year.
- prevailing winds – potential winds at
different times of year
Fate of oil – Oil type – weathering characteristics. - Sea temperatures at different times of
year.
Resources at Risk – Amenity areas
- Industrial seawater intakes
- Aquaculture
- Fishing industry
- Marinas and water sports
- Ecologically sensitive areas
- Statutory protected areas
Priorities for Protection – priorities should be agreed with statutory
bodies.
Clean-up Strategy – Methods – consider feasibility.
- Equipment – how much required, where
from?
- Logistics – Access, Transportation etc.
Equipment Location – consider options
Manpower required – training programmes will need to be set up.
Temporary Storage – plan for different scenarios
Disposal – consider options and potential contractors.
Response Organisational Structure – allow for efficient flow of
information.
Command Centre – choose suitable location.

Oil Spill Risk Assessment and Contingency Plan
Adani Hazira Port Private Limited, Hazira
Oil Spill Response Plan Revision No: 1
Page No: 98
Logistic Support – consider all aspects of response operations.
Liaison with outside organizations – arrange suitable notification and
consultative procedures.
Operational plan
Notification procedures.
Emergency Procedures – Initial actions flowcharts for response personnel.
Responsibilities – job descriptions for response personnel.
Equipment lists – where located, who to contact.
Standard Reporting Forms – e.g. notification, equipment and services
order forms.
Contacts Directory – Emergency services, company management,
statutory bodies, contractors, consultants / experts, media.
Maintenance of contingency plan
Update – regular overhaul of information (e.g. telephone numbers) and
strategies.
Copies – keep track of all copies to ensure efficient updating.
Training – train personnel and potential contractors.
Exercises – test the plan and keep personnel at full readiness.
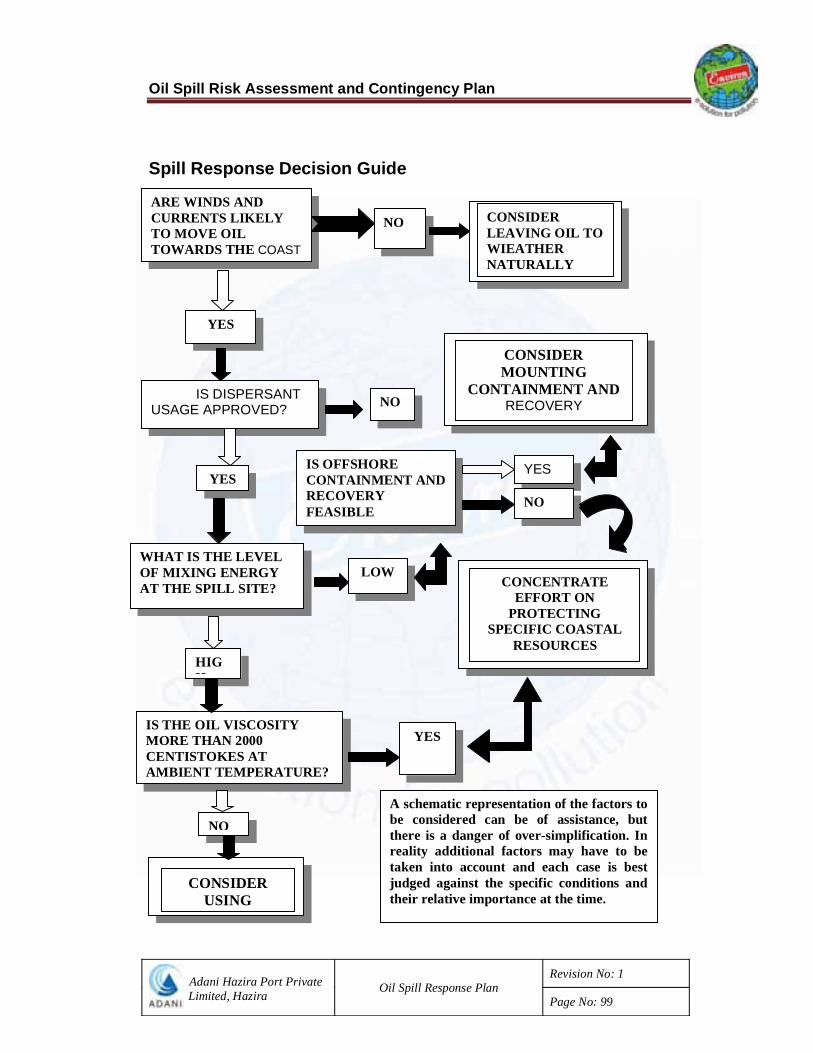
Oil Spill Risk Assessment and Contingency Plan
Adani Hazira Port Private Limited, Hazira
Oil Spill Response Plan Revision No: 1
Page No: 99
Spill Response Decision Guide
ARE WINDS AND CURRENTS LIKELY TO MOVE OIL TOWARDS THE COAST
NO CONSIDER LEAVING OIL TO WIEATHER NATURALLY
YES
IS DISPERSANT USAGE APPROVED? NO
CONSIDER MOUNTING
CONTAINMENT ANDRECOVERY
YESIS OFFSHORE CONTAINMENT AND RECOVERY FEASIBLE
YES
NO
WHAT IS THE LEVEL OF MIXING ENERGY AT THE SPILL SITE?
LOWCONCENTRATE
EFFORT ON PROTECTING
SPECIFIC COASTAL RESOURCES
HIGH
IS THE OIL VISCOSITY MORE THAN 2000 CENTISTOKES AT AMBIENT TEMPERATURE?
YES
NO
CONSIDER USING
A schematic representation of the factors to be considered can be of assistance, but there is a danger of over-simplification. In reality additional factors may have to be taken into account and each case is best judged against the specific conditions and their relative importance at the time.
Oil spill Risk Assessment and Contingency Plan
Adani Hazira Port Private Limited, Hazira
Conclusion and RecommendationRevision No: 1
Page No: 100
11 CONCLUSIONS AND RECOMMENDATIONS
Hydrodyn-OILSOFT has been validated successfully based on the available tide and current data.
Based on the oil spill modelling studies, the following conclusions are drawn:
The spill quantity has been selected as per Tier–I & Tier-II specification. Fuel oils have been considered to have more impact on the environment rather than other refined products (POL)
The spills within the port takes longer duration to escape during which it is easier to combat. The spills near the turning circle also can be contained using floating booms deployed immediately in case of an eventuality.
The spills in the channel moves north and south depending on the tidal phase irrespective of the seasons and form thin film which can not be contained using mechanical means. In such cases dispersants are the only option. However, no evidence has been found for these spills landing the coastline to impact marine ecology adversely.
The study has been carried out for operational leakage at berth during loading/unloading operations as well as for accidental spills, which indicated the usefulness of floating booms at the time of operations.
The details of spill volume and time taken to reach the coast and losses during its movement have been furnished in the report for preparedness.
The percentage of spill volume reaching the coast, extent of oiling on the coast in metres, likely vulnerable areas, spill analysis, have been furnished in the report to estimate the fate of the spill.
Oil spill contingency plan has been prepared as per IMO guidelines and presented in Strategy Plan. Strategy plans have been discussed in detail and formulated based on the risk analysis. Resources required to combat oil spills have been identified and furnished along with specifications.
RecommendationsBased on the oil spill modelling study, it has been observed that a spill of 100
tones will spread over an area having radius of 170 m within 2 hrs.
Accordingly, the resource requirement with specifications and details are
mentioned in the report. Specifications on equipments are based on the

Oil spill Risk Assessment and Contingency Plan
Adani Hazira Port Private Limited, Hazira
Conclusion and RecommendationRevision No: 1
Page No: 101
existing sea conditions and other environmental factors in the study area and
as such strictly to be adhered for better efficiency.
Priority should be given to contain the oil spill by physical means such as
booms and skimmers. Dispersants should be used as last resort. Only those
dispersants recommended by Indian Coast Guard should be put into use.
Training as per IMO guidelines should be given to the concerned operating
staff involve oil spill combating.
Mock drills should be conducted twice in a year.

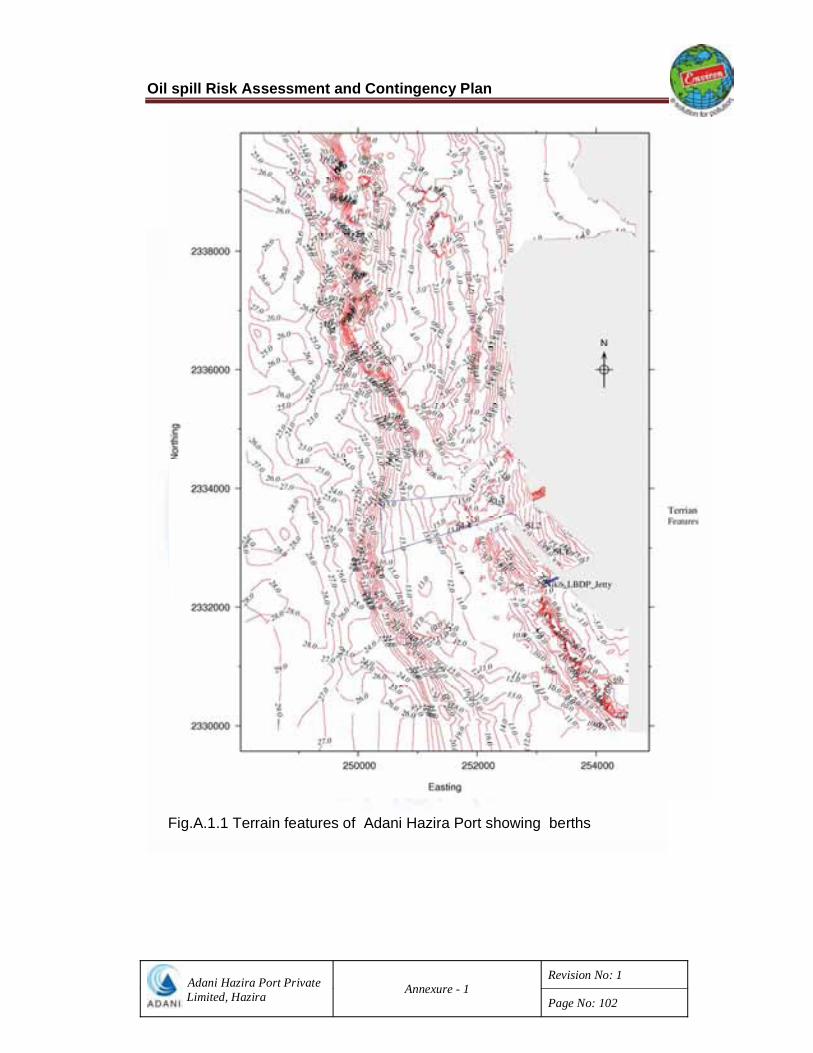
Oil spill Risk Assessment and Contingency Plan
Adani Hazira Port Private Limited, Hazira Annexure - 1
Revision No: 1
Page No: 102
Fig.A.1.1 Terrain features of Adani Hazira Port showing berths
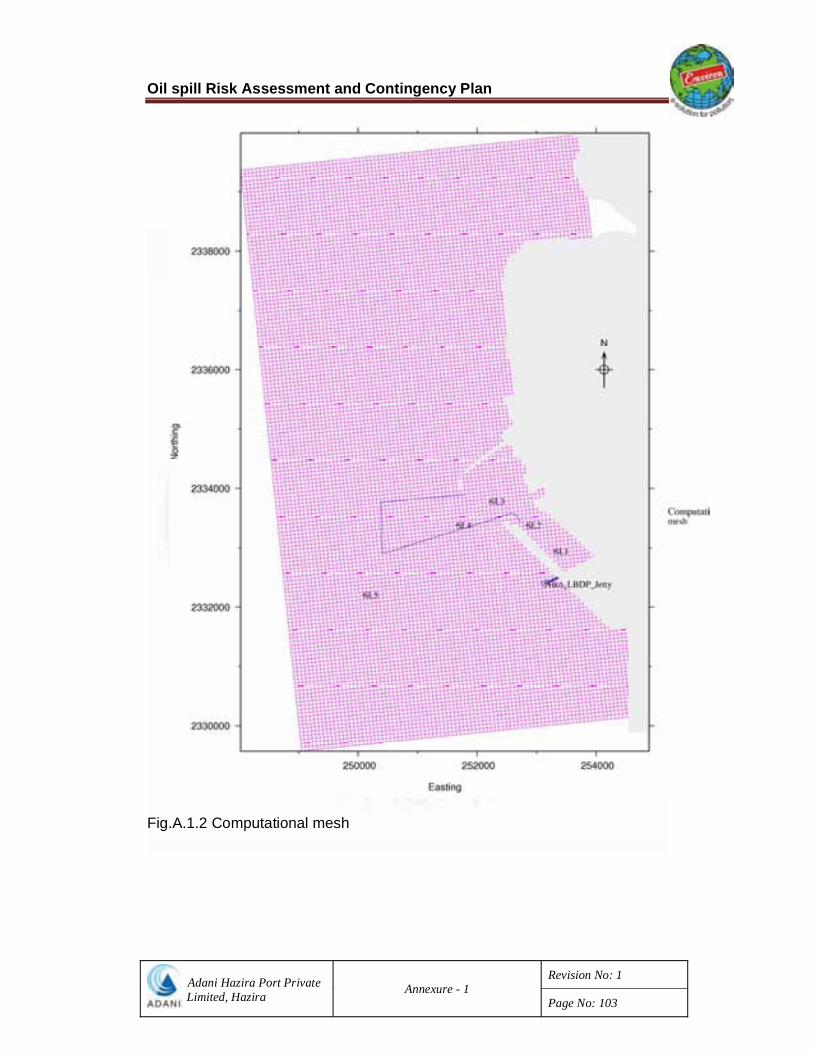
Oil spill Risk Assessment and Contingency Plan
Adani Hazira Port Private Limited, Hazira Annexure - 1
Revision No: 1
Page No: 103
Fig.A.1.2 Computational mesh

Oil spill Risk Assessment and Contingency Plan
Adani Hazira Port Private Limited, Hazira Annexure - 1
Revision No: 1
Page No: 104
Fig.A.1.3 Interpolated bathy depths

Oil spill Risk Assessment and Contingency Plan
Adani Hazira Port Private Limited, Hazira Annexure - 1
Revision No: 1
Page No: 105
Fig.A.1.4. Simulated Currents during LLW of neap tide (18 hr of 08th Dec 2008)

Oil spill Risk Assessment and Contingency Plan
Adani Hazira Port Private Limited, Hazira Annexure - 1
Revision No: 1
Page No: 106
Fig.A.1.5. Simulated Currents during Peak Flood of neap tide (21 hr of 08th Dec 2008)

Oil spill Risk Assessment and Contingency Plan
Adani Hazira Port Private Limited, Hazira Annexure - 1
Revision No: 1
Page No: 107
Fig.A.1.6. Simulated Currents during HHW of neap tide (00 hr of 09th Dec 2008)

Oil spill Risk Assessment and Contingency Plan
Adani Hazira Port Private Limited, Hazira Annexure - 1
Revision No: 1
Page No: 108
Fig.A.1.7. Simulated Currents during Peak EBB of neap tide (04hr of 09th Dec 2008)

Oil spill Risk Assessment and Contingency Plan
Adani Hazira Port Private Limited, Hazira Annexure - 1
Revision No: 1
Page No: 109
Fig.A.1.8.Simulated Currents during LLW of spring tide (19 hr of 09th Dec 2008)
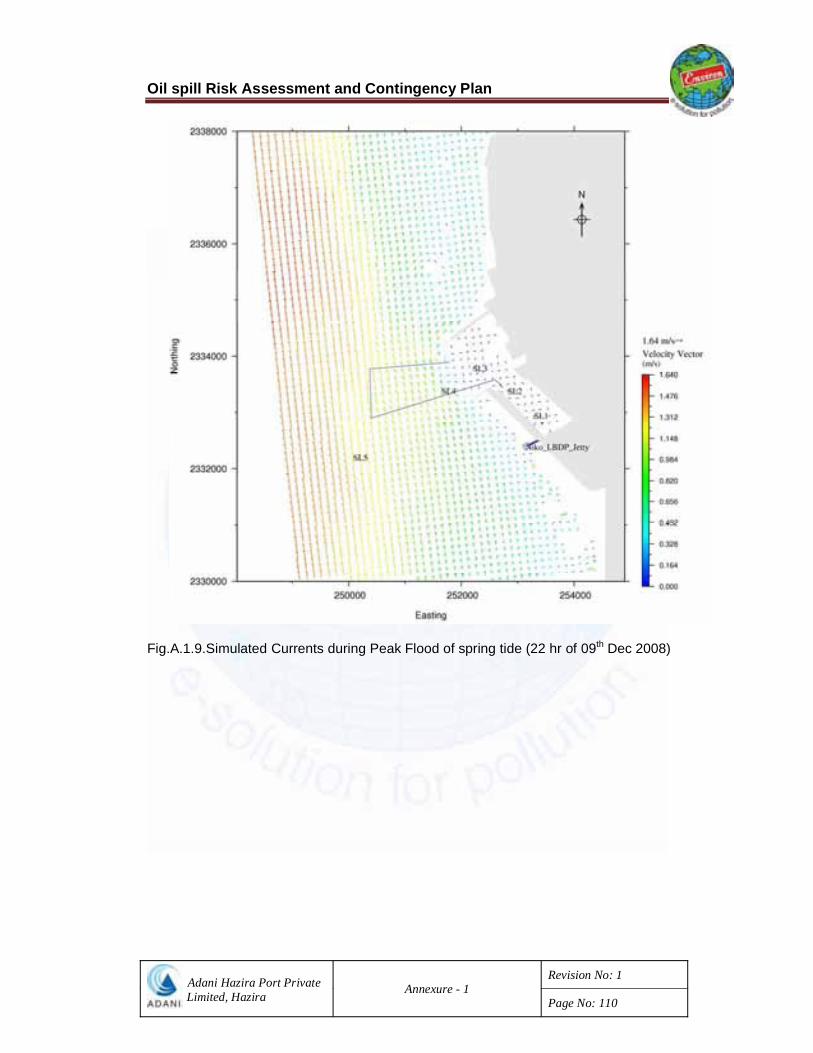
Oil spill Risk Assessment and Contingency Plan
Adani Hazira Port Private Limited, Hazira Annexure - 1
Revision No: 1
Page No: 110
Fig.A.1.9.Simulated Currents during Peak Flood of spring tide (22 hr of 09th Dec 2008)

Oil spill Risk Assessment and Contingency Plan
Adani Hazira Port Private Limited, Hazira Annexure - 1
Revision No: 1
Page No: 111
Fig.A.1.10. Simulated Currents during HHW of spring tide (01 hr of 10th Dec 2008)
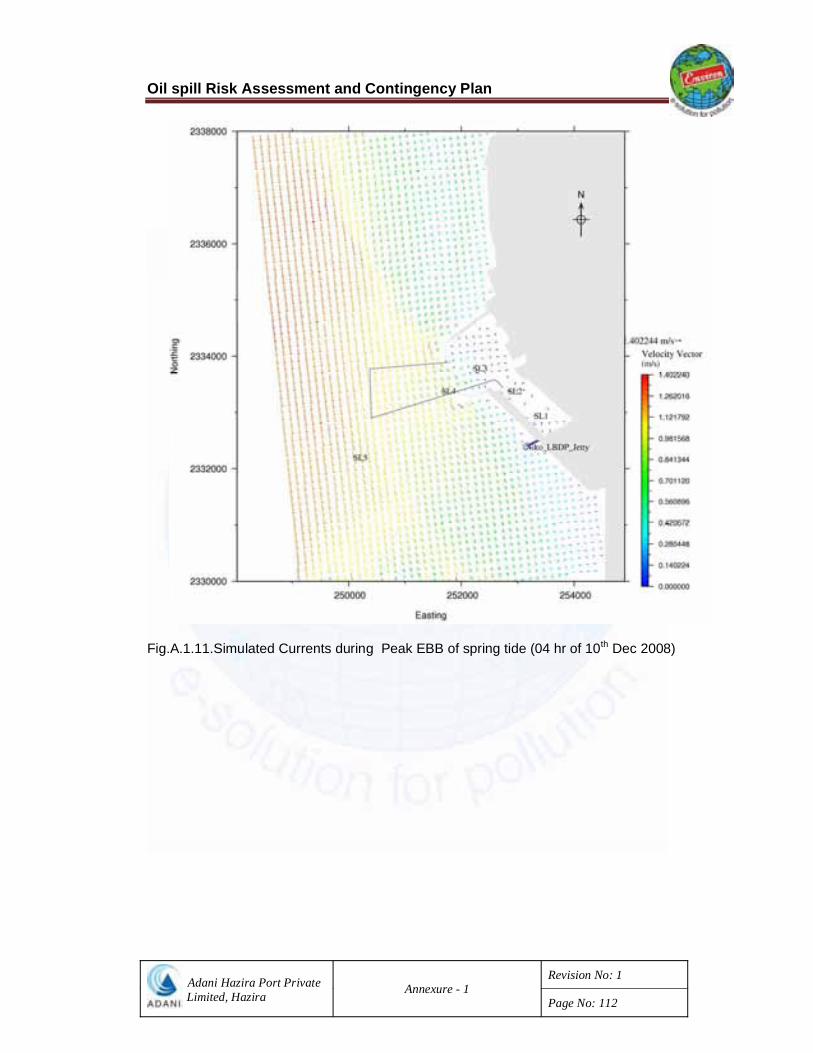
Oil spill Risk Assessment and Contingency Plan
Adani Hazira Port Private Limited, Hazira Annexure - 1
Revision No: 1
Page No: 112
Fig.A.1.11.Simulated Currents during Peak EBB of spring tide (04 hr of 10th Dec 2008)

Oil spill Risk Assessment and Contingency Plan
Adani Hazira Port Private Limited, Hazira
Annexure - 2Revision No: 1
Page No: 113
Fig.A.2.1 Simulated Currents during LLW of neap tide (17 hr of 20th March 2009)

Oil spill Risk Assessment and Contingency Plan
Adani Hazira Port Private Limited, Hazira
Annexure - 2Revision No: 1
Page No: 114
Fig.A.2.2 Simulated Currents during Peal Flood of neap tide (21 hr of 20th March 2009)

Oil spill Risk Assessment and Contingency Plan
Adani Hazira Port Private Limited, Hazira
Annexure - 2Revision No: 1
Page No: 115
Fig.A.2.3 Simulated Currents during HHW of neap tide (00 hr of 21th March 2009)

Oil spill Risk Assessment and Contingency Plan
Adani Hazira Port Private Limited, Hazira
Annexure - 2Revision No: 1
Page No: 116
Fig.A.2.4 Simulated Currents during Peak EBB of neap tide (03 hr of 21th March 2009)

Oil spill Risk Assessment and Contingency Plan
Adani Hazira Port Private Limited, Hazira
Annexure - 2Revision No: 1
Page No: 117
Fig.A.2.5 Simulated Currents during LLW of spring tide (10 hr of 11th March 2009)

Oil spill Risk Assessment and Contingency Plan
Adani Hazira Port Private Limited, Hazira
Annexure - 2Revision No: 1
Page No: 118
Fig.A.2.6 Simulated Currents during Peak Flood of spring tide (13 hr of 11th March 2009)

Oil spill Risk Assessment and Contingency Plan
Adani Hazira Port Private Limited, Hazira
Annexure - 2Revision No: 1
Page No: 119
Fig.A.2.7 Simulated Currents during HHW of spring tide (16 hr of 11th March 2009)
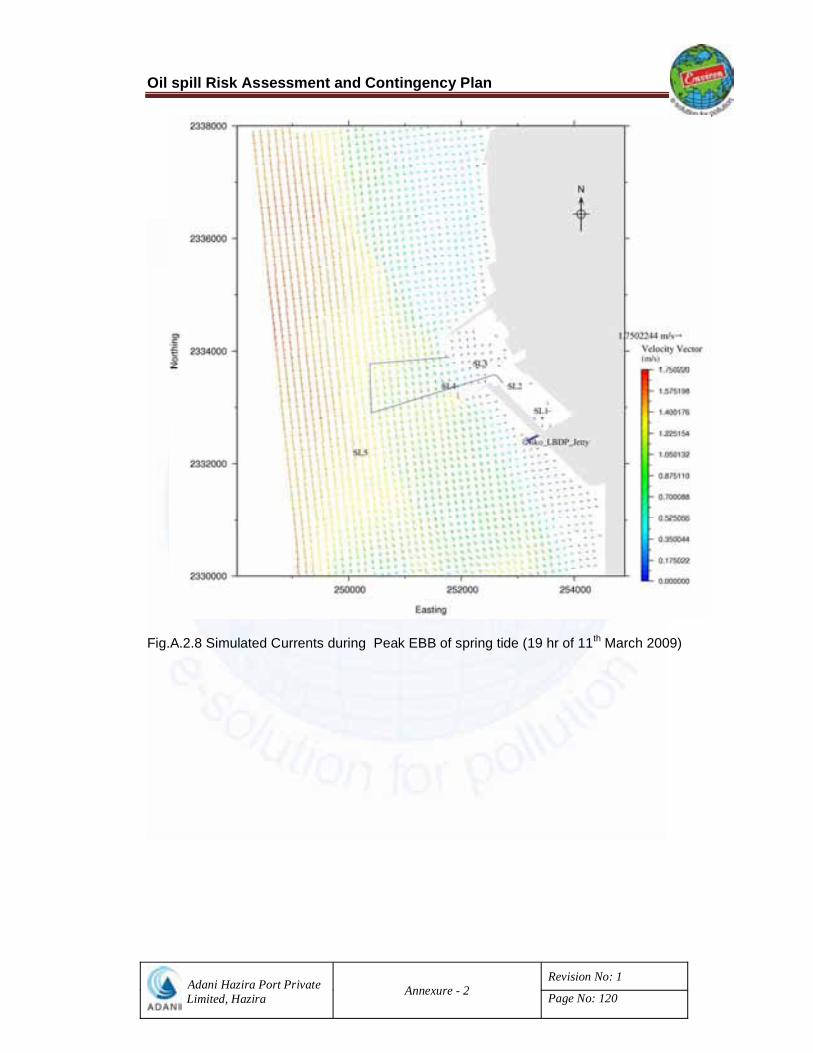
Oil spill Risk Assessment and Contingency Plan
Adani Hazira Port Private Limited, Hazira
Annexure - 2Revision No: 1
Page No: 120
Fig.A.2.8 Simulated Currents during Peak EBB of spring tide (19 hr of 11th March 2009)
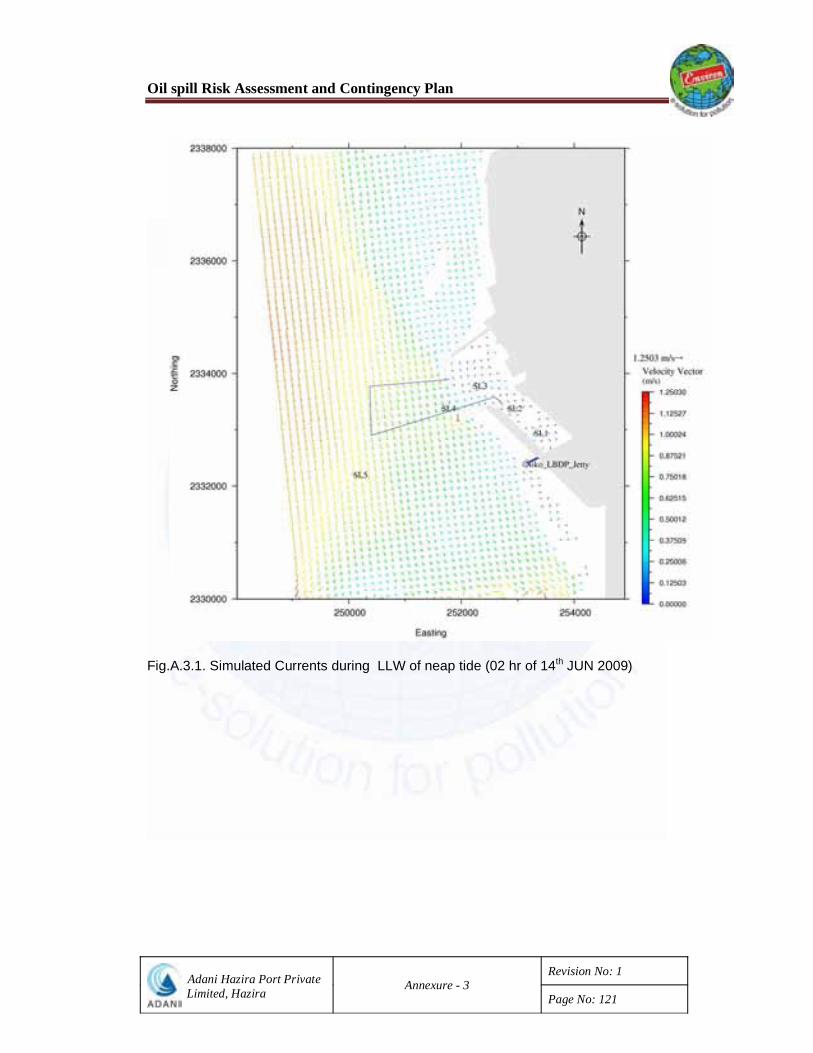
Oil spill Risk Assessment and Contingency Plan
Adani Hazira Port Private Limited, Hazira
Annexure - 3Revision No: 1
Page No: 121
Fig.A.3.1. Simulated Currents during LLW of neap tide (02 hr of 14th JUN 2009)
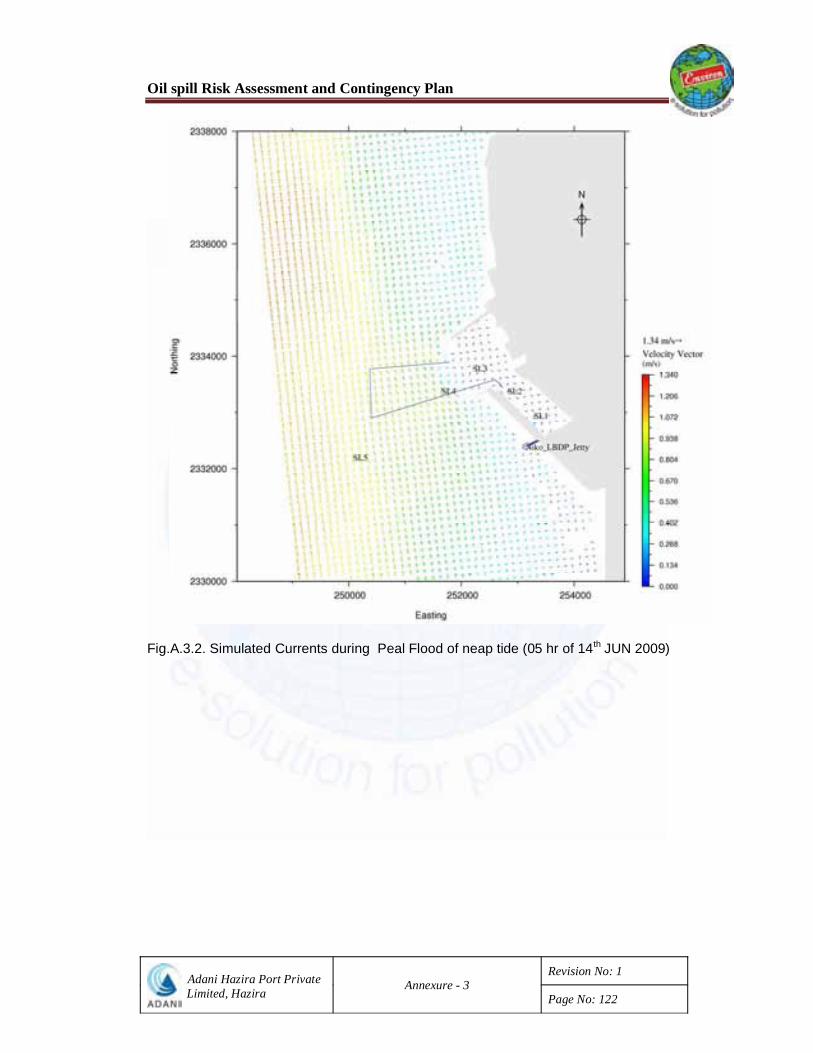
Oil spill Risk Assessment and Contingency Plan
Adani Hazira Port Private Limited, Hazira
Annexure - 3Revision No: 1
Page No: 122
Fig.A.3.2. Simulated Currents during Peal Flood of neap tide (05 hr of 14th JUN 2009)
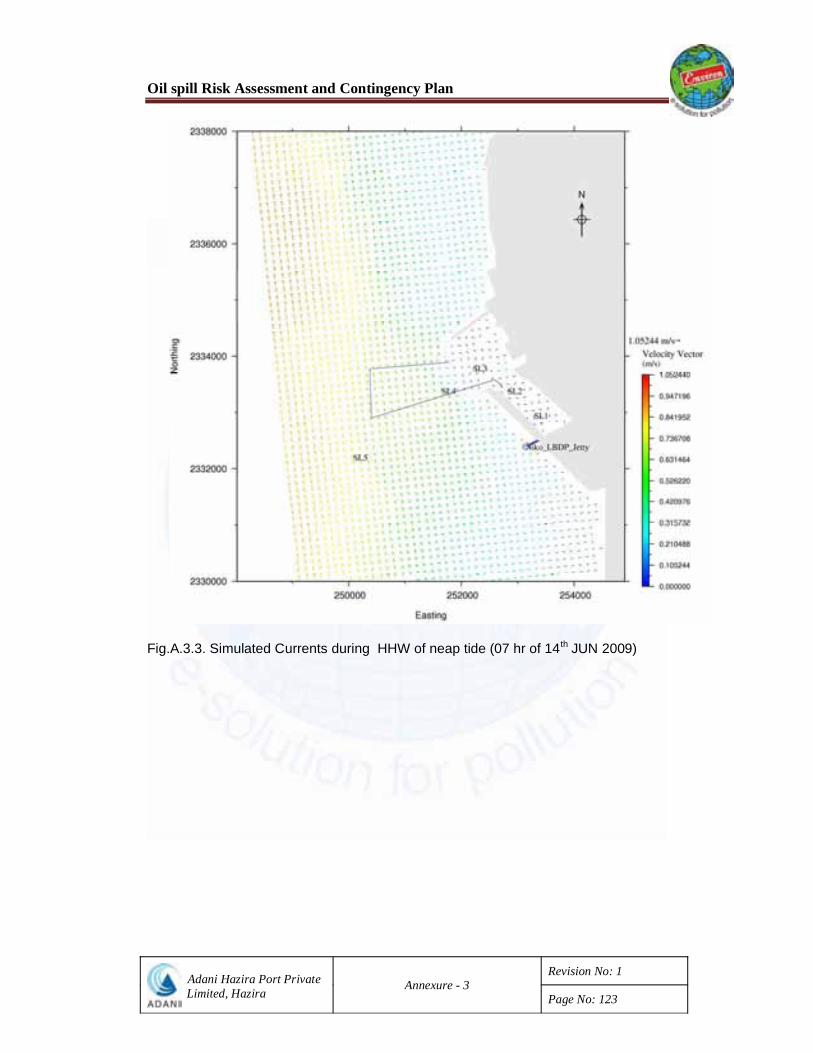
Oil spill Risk Assessment and Contingency Plan
Adani Hazira Port Private Limited, Hazira
Annexure - 3Revision No: 1
Page No: 123
Fig.A.3.3. Simulated Currents during HHW of neap tide (07 hr of 14th JUN 2009)

Oil spill Risk Assessment and Contingency Plan
Adani Hazira Port Private Limited, Hazira
Annexure - 3Revision No: 1
Page No: 124
Fig.A.3.4. Simulated Currents during Peak EBB of neap tide (10 hr of 14th JUN 2009)

Oil spill Risk Assessment and Contingency Plan
Adani Hazira Port Private Limited, Hazira
Annexure - 3Revision No: 1
Page No: 125
Fig.A.3.5. Simulated Currents during LLW of spring tide (11 hr of 14th JUN 2009)
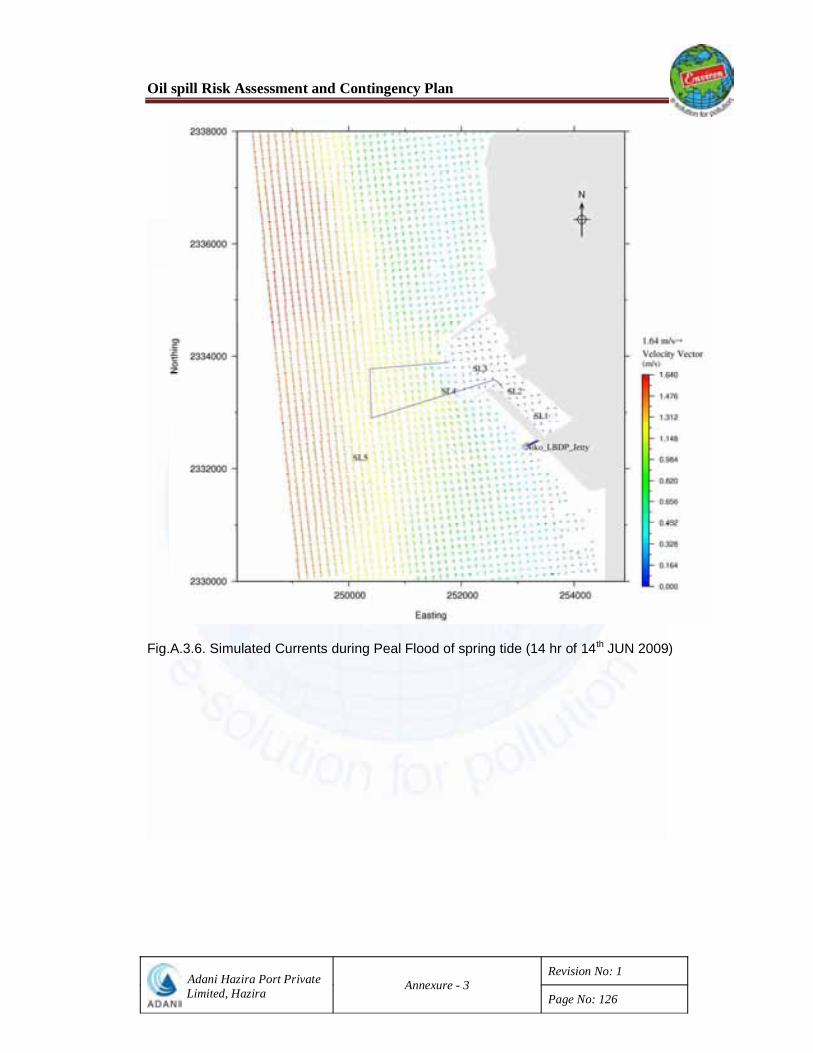
Oil spill Risk Assessment and Contingency Plan
Adani Hazira Port Private Limited, Hazira
Annexure - 3Revision No: 1
Page No: 126
Fig.A.3.6. Simulated Currents during Peal Flood of spring tide (14 hr of 14th JUN 2009)

Oil spill Risk Assessment and Contingency Plan
Adani Hazira Port Private Limited, Hazira
Annexure - 3Revision No: 1
Page No: 127
Fig.A.3.7. Simulated Currents during HHW of spring tide (17 hr of 14th JUN 2009)

Oil spill Risk Assessment and Contingency Plan
Adani Hazira Port Private Limited, Hazira
Annexure - 3Revision No: 1
Page No: 128
Fig.A.3.8. Simulated Currents during Peak EBB of spring tide (20 hr of 14th JUN 2009)

Oil spill Risk Assessment and Contingency Plan
Adani Hazira Port Private Limited, Hazira Annexure - 4
Revision No: 1
Page No: 129
Fig. A. 4. 1 Oil Spill trajectory due to Instantaneous spill of 100 tons FO at Cargo Berth-1 (Dec 2008 winds)

Oil spill Risk Assessment and Contingency Plan
Adani Hazira Port Private Limited, Hazira Annexure - 4
Revision No: 1
Page No: 130
Fig. A. 4. 2 Oil Spill trajectory due to Instantaneous spill of 100 tons FO at Cargo Berth-2 (Dec 2008 winds)

Oil spill Risk Assessment and Contingency Plan
Adani Hazira Port Private Limited, Hazira Annexure - 4
Revision No: 1
Page No: 131
Fig. A. 4. 3 Oil Spill trajectory due to Instantaneous spill of 100 tons FO in Turning circle (Dec 2008 winds)
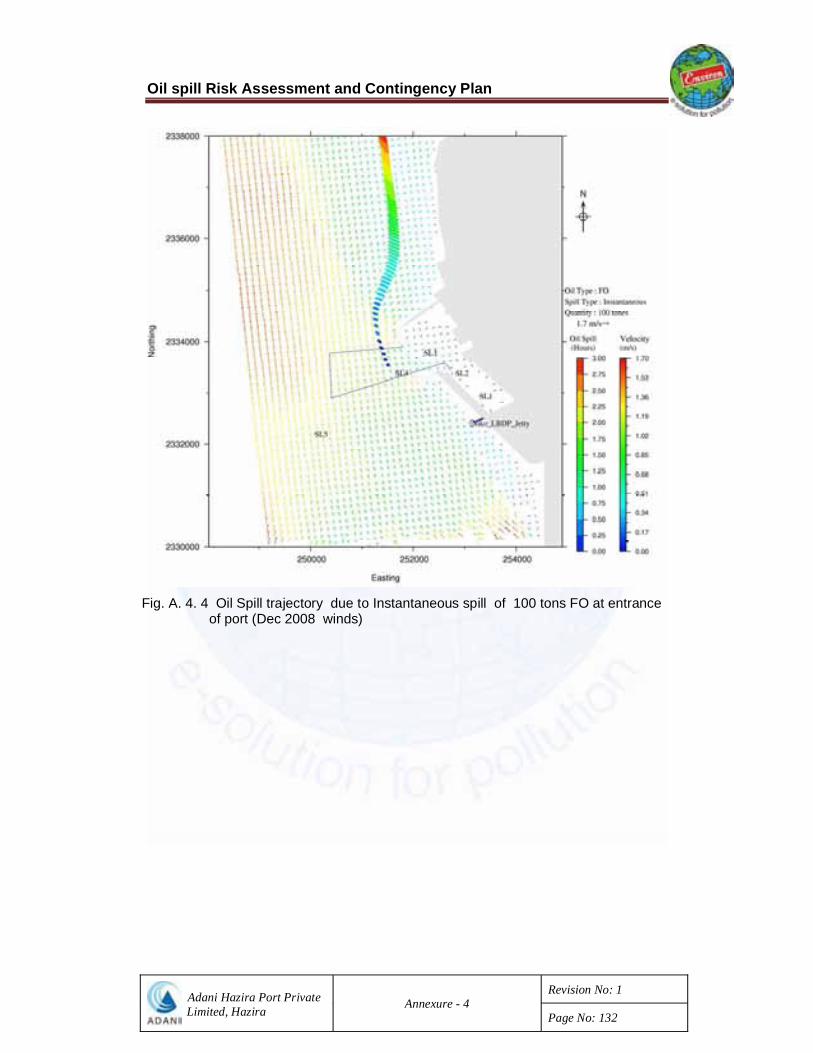
Oil spill Risk Assessment and Contingency Plan
Adani Hazira Port Private Limited, Hazira Annexure - 4
Revision No: 1
Page No: 132
Fig. A. 4. 4 Oil Spill trajectory due to Instantaneous spill of 100 tons FO at entrance of port (Dec 2008 winds)
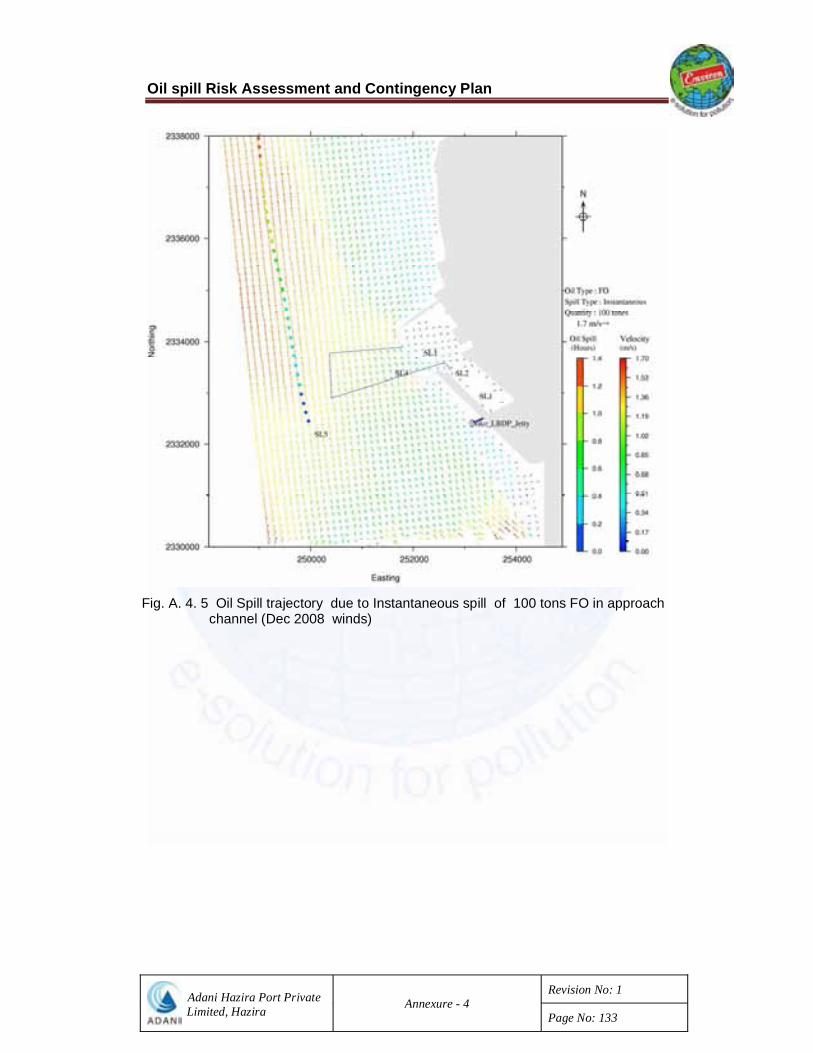
Oil spill Risk Assessment and Contingency Plan
Adani Hazira Port Private Limited, Hazira Annexure - 4
Revision No: 1
Page No: 133
Fig. A. 4. 5 Oil Spill trajectory due to Instantaneous spill of 100 tons FO in approach channel (Dec 2008 winds)

Oil spill Risk Assessment and Contingency Plan
Adani Hazira Port Private Limited, Hazira Annexure - 4
Revision No: 1
Page No: 134
Fig. A. 4. 6 Oil Spill trajectory due to Instantaneous spill of 100 tons HSD at Berth-1 (Dec 2008 winds)