transforming it itil based value proposition april 06
TRANSCRIPT

TRANSFORMING IT
Developing An ITIL-Based Value Proposition
COPYRIGHT CORPORATE RENAISSANCE GROUP, 2006

2
PATRICIA’S ISSUE
Patricia Caluchi, CIO of a $100 million Information Technology group for a “soon to be global” corporation, was worried about the demands on her division. At today’s annual planning meeting with her peers in the Corporation, it was apparent that the pending “globalization” was affecting all operations, and her IT group was not ready for the impact.
In the week before the meeting, Ms Caluchi met with each of the Business Unit and Service Unit leaders to get an understanding of their upcoming technology requirements. With this information in hand, she developed the required budget for her IT organization. As one can imagine, the new demand for technology significantly increased her spending requirements, much more than the 3% increase guideline that she was given by Finance.
When it came time for Ms Caluchi to present her next year’s operating and capital budget, she tried to ease into it by detailing all of the new technology demands. However, the shock that filled the room once she communicated the final number was greater than she had expected. She began fielding questions such as:
“You are spending $100 million now and I have to wait 4 weeks to get a PC for a new hire. Will increased spending solve this problem?”
“The response time on my financial application is causing productivity problems. What are you going to do about that?
“The last 3 IT projects that I have requested have been over budget and the implementation has been delayed for 3 – 6 months. Why can’t IT deliver on time and within project cost estimates?”
“We call the help desk, never get a human response, and wait days without getting our technical problem solved. Will your increase in spending gives us better help desk response?”
“What value are we getting for the money we are spending on technology? Why don’t we just outsource the entire thing?”
“I have no idea as to where you are coming up with this budget request; I do not even know how you translated our demands into your budget?”
Ms Caluchi had heard all of these questions before, but nothing ever seemed to change. Her internal customers wanted more and better service, but always complained about how much it was going to cost. Furthermore, the entire IT budget was allocated to Business Units as Corporate overheads, so there were no barriers on the demand for IT service, just barriers on the amount that IT could spend each year. As one of her colleagues said “services provided for free are always in highest demand”.
All of this happened on a Friday afternoon and she was scheduled to attend an IT Financial Management conference the following week. She had almost made up her mind to cancel her trip, but remembered that there were some workshops and presentations that might help her develop a solution to address these challenges.
The conference turned out to be better than she had expected. At the conference, she heard various discussions and presentations about ITIL Service Management, performance scorecards, portfolio management, project management, service costing, service level agreements, charge-backs, and so on. She even downloaded the Shared Services White
TRANSFORMING IT: DEVELOPING AN ITIL-BASED VALUE PROPOSITION

3
TRANSFORMING IT: DEVELOPING AN ITIL-BASED VALUE PROPOSITION
1 http://www.crgroup.com/ManagementConsulting/WhitePapers.cfm
paper1 published by Corporate Renaissance Group (www.crgroup.com). She liked the philosophy underlying the paper and felt excited by all the options, but a little overwhelmed as well.
Based on everything that she heard at the conference and what was happening within the Corporation, Ms Caluchi decided that her organization needed to operate more like a third party…a real business within the corporate market place. She wanted to prove the IT “value” to her internal customers. The comments she received from her peers demonstrated that she had some internal challenges with IT employees not responding to internal customer requirements and she needed to take a long, hard look at the IT service order process.
Ms Caluchi decided to put the CRG Shared Services management methodology to work. She was determined to integrate a good process management framework with a market-based, customer-friendly service management approach to providing value to her internal customers. She figured that if she could deliver IT Services to her customers at a lower than or equal to external market price and a greater than or equal to external market quality, she would be adding tremendous value to the corporation. In addition, she wanted to utilize the ITIL framework, but also wanted to create a list of Services that her internal customers could understand and that were comparable to the external market. As well, she wanted her customers to pay for what they consumed and have more accountability for their service demand behavior.
PATRICIA’S JOURNEY
Last year was a very hard but exciting year for Patricia and her team. They had implemented a framework that, they believed, would demonstrate the value of IT to her internal colleagues.
This year’s budget discussion was one of the best she and her team had ever had. Internal customers knew the value of IT, had a good understanding of IT services, were involved in demand planning discussions, and were convinced that she had a very good understanding about their needs and the ability of IT to meet those needs.
She had just finished the first draft of an executive project report on her journey and lessons learned. She wanted this paper to demonstrate the overall service management framework so that other shared services units might also learn from and duplicate it.
She started the report with…
One year ago, my team decided that we must change the way we conducted IT business by adopting a Service Management Model.
Service Management Model
Resources- People- Assets- Other
ServiceDelivery
Processes &Activities
Market-FocusedServices
Customers
- Strategy- Planning- Budgeting- Performance (cost, time, quality)- Business Information
Management Thinking
Service Management Model
Resources- People- Assets- Other
Resources- People- Assets- Other
ServiceDelivery
Processes &Activities
ServiceDelivery
Processes &Activities
Market-FocusedServices
Market-FocusedServices
Customers Customers
- Strategy- Planning- Budgeting- Performance (cost, time, quality)- Business Information
- Strategy- Planning- Budgeting- Performance (cost, time, quality)- Business Information
Management ThinkingManagement Thinking
The ITIL-based Service Management Model

4
This model required a customer-driven and rigorous approach combined with five essential components:
1. Service catalogue and Service Costing 2. Service Level Agreements and
Chargeback/Billings
3. Demand Management/Planning
4. Performance Scorecards 5. Customer Satisfaction
We also wanted to integrate this framework with the ITIL process framework.
We knew that we needed some new automated tools to enable our service management framework. After a thorough search, we found that Corporate Renaissance Group had the tools required. CRG’s Shared Service Manager toolset included FlexABM for costing, eAgreement for Service Level Agreements, eBilling for chargeback, eSurvey for customer satisfaction and Enterprise Scorecard for all performance metrics.
Creating a service catalogue within an ITIL framework
Our first step was to determine the IT Service offering, a “billable” service, one that is external market comparable and that our internal customers would recognize as something they actually consume and should pay for. We developed a bundled set of Services since we definitely did not want to overwhelm our internal customers with a long, extensive, very technical set of services. Below is a sample set of the bundled billable Services that we used as a starting point or as a “straw model”. Also, notice the “Unit of Sale”. In our chargeback (monthly Price times Quantity invoicing) process, this is the unit that internal customers will recognize as their unit of consumption. A chargeback discussion follows later in this report.
The next step was to create a “Delivery” model. Each billable Service has a “value-chain” of processes that must be performed in order to deliver the unit of Service to an internal customer. This is where we used ITIL process methodology. ITIL consists of various “books” with high-to-low process/activity levels. We discovered that we had to decide on the level of ITIL processes/activities we wanted to include in our service management solution.
We used a 5% rule of thumb; that is, if less than 5% of the IT budget was consumed by the activity, it is not worth the time and effort to
TRANSFORMING IT: DEVELOPING AN ITIL-BASED VALUE PROPOSITION
Applications:Application Development Service # of hoursApplication Maintenance Service # of hoursAd hoc Data Requests # of hours
Infrastructure:Central Processing Service # of ServersNetwork Service # of Network PortsDesktop Equipment Support # of DesktopsCall Center Desktop Support # of Call Center DesktopsLaptop Equipment Support # of LaptopsRegional Office Laptop Support # of Regional Office LaptopsOn-Line Report Viewing # of On-line Reporting log-insBasic Telephone Service # of ExtensionsLD Telephone Service # of MinutesInternet Connectivity % of Total BandwidthEmail Service # of Email Accounts
Service Description Unit of Sale

5
manage. We do not list all of the detailed ITIL processes/activities in this report. Rather, we are providing some examples in order to explain our journey.
We used these four major categories of ITIL processes:
1. Service Delivery
2. Service Support
3. Infrastructure Management 4. Application Software
Management
Within these highest-level processes, a sample of the next two levels of ITIL processes/activities includes, for example:
Here is a further breakdown of one of the above processes/activities:
TRANSFORMING IT: DEVELOPING AN ITIL-BASED VALUE PROPOSITION
Ensure Compliance with External RequirementsPO 8.0
Manage QualityPO 11.0
Manage ReportsPO 10.0
Develop and Maintain ProceduresAI 4.0
Acquire or Develop Application SoftwareAI 2.0
Application Development/Maintenance Management
Application Software Management
Ensure Compliance with External RequirementsPO 8.0
Manage QualityPO 11.0
Manage ReportsPO 10.0
Develop and Maintain ProceduresAI 4.0
Acquire or Develop Application SoftwareAI 2.0
Application Development/Maintenance Management
Application Software Management
Reassessment of System DesignAI 2.17
User Reference and Support MaterialsAI 2.16
Application Software TestingAI 2.15
IT Integrity Provisions in Application Program SoftwareAI 2.14
Availability as a Key Design FactorAI 2.13
ControllabilityAI 2.12
Output Requirements Definition and DocumentationAI 2.11
Processing Requirements Definition and DocumentationAI 2.10
User-Machine InterfaceAI 2.9
Definition of InterfacesAI 2.8
Input Requirements Definition & DocumentationAI 2.7
Source Data Collection DesignAI 2.6
Program SpecificationsAI 2.5
File Requirements Definition and DocumentationAI 2.4
Design ApprovalAI 2.3
Major Changes to Existing SystemsAI 2.2
Design MethodsAI 2.1
AL 2.0 Acquire or Develop Application Software
6
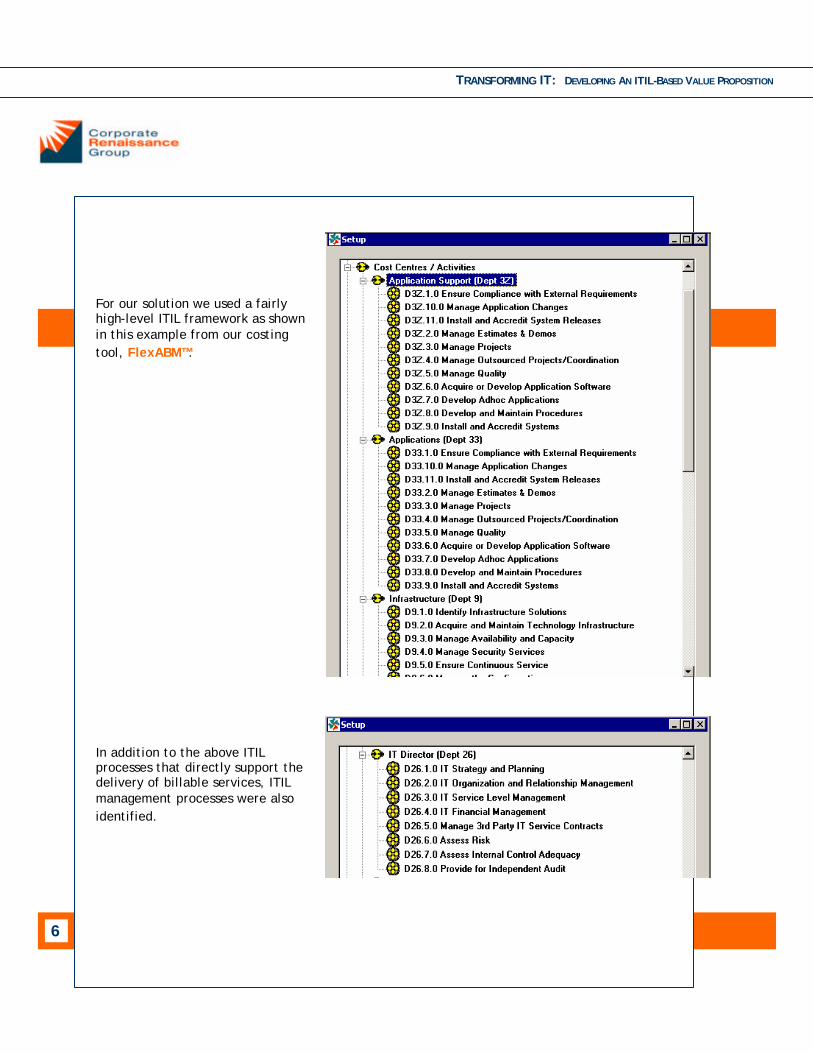
For our solution we used a fairly high-level ITIL framework as shown in this example from our costing tool, FlexABM™.
In addition to the above ITIL processes that directly support the delivery of billable services, ITIL management processes were also identified.
TRANSFORMING IT: DEVELOPING AN ITIL-BASED VALUE PROPOSITION

7
CREATING THE INTEGRATED COST MODEL
We discovered that one of the most important, and most often overlooked, aspects of service management is the ability to calculate and understand how much it costs to deliver a unit of billable service to an internal customer…a “cost-to-serve” calculation. We used to think that the practice of comparing a “budget center’s” actual monthly cost to their budget is an adequate cost management practice…it is not! In order to compete with an external market (outsourcers) we must understand our billable service unit cost. More importantly, we must manage the unit cost so that it is equal to or lower than market prices while maintaining equal to or greater than market quality/time. This is the way we can create economic value for our internal customers.
Once our “Delivery Model” was documented, we developed an activity-based cost model to calculate and understand the “unit cost” to deliver a unit of service to a customer.
The first requirement for the cost model was to understand the level of effort and cost for each ITIL process. We did this by defining the relationship between IT departments (cost centers) and those ITIL processes that they perform. Time recording is a normal activity for our IT group, so the number of hours could be “charged” to ITIL processes. We conducted storyboarding sessions to document “percent of effort” to individual ITIL processes. FlexABM includes a simple web-based survey tool that we used to gather this percentage data. The percent of effort was then used to calculate the number of FTE’s consumed by a process and even the number of hours.
Below is an example of a cost center to ITIL process relationship mapping using the “percent of effort” approach.
TRANSFORMING IT: DEVELOPING AN ITIL-BASED VALUE PROPOSITION
100.00%$20,000,000Total Infrastructure
Obtain Independent Assurance5.00%
Manage Problems and Incidents20.00%
Manage the Configuration10.00%
Ensure Continuous Service5.00%
Manage Security Services10.00%
Manage Availability and Capacity10.00%
Acquire and Maintain Technology Infrastructure30.00%
Identify Infrastructure Solutions10.00%$20,000,000Infrastructure100.7.009
ITIL Processes
Resource Driver
%Budget Amount
Cost Center Name
CC Code

8
A corresponding setup in FlexABM is as
follows:
The next step was to understand how our bundled billable services consume the ITIL process “value chain.”
As with the cost center to process mapping, the relationship between ITIL processes and billable services can be simply defined by a percentage. A more sophisticated approach, one that enables better management decision analysis, is to define the “causal” relationship, using available data, to create the mapping. For example, the “Acquire & Maintain Technology Infrastructure” process in the above list actually supports various billable services:
1. Central Processing Service 2. Network Service 3. Desktop Equipment Service 4. Laptop Equipment Service 5. Call Center Desktop Service 6. Regional Office Laptop Service 7. Basic Telephone Service 8. LD Telephone Service 9. Internet Connectivity Service
10. Email Service 11. On-line Report Viewing Service
Our goal was to define how each of the billable services consumed the cost of the process.
Fortunately, we discovered that our help desk tools included data on the number of service orders for each of the above, and amount of time consumed. Furthermore, our asset management tools detailed the quantity and historical costs of our infrastructure assets. We will eventually use this information as the relationship driver in the cost model. In order to get something quickly, we used percentages determined by knowledgeable IT employees as illustrated below:
The corresponding setup in FlexABM looked like this:
TRANSFORMING IT: DEVELOPING AN ITIL-BASED VALUE PROPOSITION
Online Report Viewing2.00%
Email Service15.00%
Internet Connectivity Service5.00%
LD Telephone Service4.00%
Basic Telephone Service4.00%
Regional Office Laptop Support Service20.00%
Laptop Equipment Support Service10.00%
Call Center Desktop Support Service2.50%
Desktop Equipment Support Service17.50%
Network Service10.00%
Central Processing Service10.00%Acquire and MaintainTechnology Infrastructure

9
The last step in the service management cost-to-serve model was to determine/understand the billable service volumes being demanded by each customer. To prove our value and to compete with an external market, we had to be able to track the unit of consumption of billable services and develop the ability to forecast future demand.
Here are two simple Cognos PowerPlay™ multi-dimensional reports from our service cost model:
TRANSFORMATION
Once we had created a business model and an accompanying cost model that defined the resource consumption relationships from people to processes (ITIL) to billable services to customers, we took steps to transform our management thinking and infrastructure to support this service management business model.
It’s actually a fairly simple solution…we just applied a performance management
framework to the service management model and decided that we would reward people for achievement of the metrics. This required us to develop performance metrics and targets for each of the “dimensions” (Resources, Processes, Billable Services, and Customers) of the model. We began with the end in mind, that is we began with identifying our customers and working backwards. Let me illustrate.
TRANSFORMING IT: DEVELOPING AN ITIL-BASED VALUE PROPOSITION

10
The most important element in designing and developing performance metrics is to first understand the expectations of internal customers. What do they expect from their IT service supplier and how do they perceive “Value”? Keep in mind that the customer exposure to IT providers should be through the billable services. Therefore, we needed to determine the most appropriate customer-facing metrics for each billable service in the form of cost, quality and/or time metrics. Obviously, customer satisfaction was an important metric, and the established Price for each billable service was a good cost metric.
Below is an example of metrics that we used at the service-level. This is not an inclusive set, just a sample to illustrate our thought process.
TRANSFORMING IT: DEVELOPING AN ITIL-BASED VALUE PROPOSITION
Once we established a good set of customer-facing, billable service-level metrics, the next step was to determine the cost, quality and time metrics at the ITIL process level that would support the billable service-level targets. These must be linked…it makes no sense to have process-level metrics that do not support the performance targets that customers are expecting. For example, let’s use a metric from the above list:
The customer expects that someone will satisfy their request for desktop support within one business day. One of the ITIL processes that support this billable service is “Acquire and Maintain Technology Infrastructure”. The lower level ITIL activities for this process include:
Consequently, performance metrics for the process/activities must provide some cause and effect (lead/lag) support for enabling the delivery of 1 day Desktop Equipment Support Service. It was critical that process metrics were linked to billable service/customer metrics.
IT employee (or Team) performance expectations must also support the ITIL process metrics. At the employee level, the most common metrics are quality and/or work-output related. Employees must have the competencies, training and resources available for them to achieve performance targets.
8 hoursAvg hours to get LD Service# of minuteLD Telephone Service
8 hoursAvg Hours to get New Phone Service# of extensionsBasic Telephone Service
4 hoursAvg Hours to get Email Account# of Email AccountsEmail Service
1 hourAvg Hours to complete Intranet Support Request
% of Total BandwidthIntranet Connectivity
5 sec.Avg Response Time for On-line Viewing# of On-line Reporting Log-ins
On-Line Report Viewing
3 daysAvg Days to complete Laptop Request# Regional Office Laptops
Regional Office Laptop Support
1 dayAvg Days to complete Laptop Request# of LaptopsLaptop Equipment Support
1 dayAvg Days to complete Desktop Request# of Call Center Desktops
Call Center Desktop Support
1 dayAvg Days to complete Desktop Request# of DesktopsDesktop Equipment Support
99.99%% Network Available# of Active PortsNetwork Service
99.99%% Servers Available# of ServersCentral Processing Service
16 hoursAvg Hours to complete Ad hoc Request# of HoursAd hoc Data Request
100%% of Customer Maintenance Requests delivered on time
# of HoursApplication Maintenance Service
100%% of Customer Projects Delivered on Time
# of HoursApplication Development Service
TargetMetricQty DescriptionService
1 dayAvg Days to complete
Desktop Request# of
DesktopsDesktop
Equipment Support 1 dayAvg Days to complete
Desktop Request# of
DesktopsDesktop
Equipment Support
User and Monitoring of System UtilitiesAI 3.7
System Software Change ControlsAI 3.6
System Software MaintenanceAI 3.5
System Software InstallationAI 3.4
System Software SecurityAI 3.3
Preventative Maintenance for HardwareAI 3.2
Assessment of New Hardware and SoftwareAI 3.1
AL 3.0 Acquire and Maintain Technology Infrastructure

11
SERVICE LEVEL AGREEMENTS (SLAS)
Another important issue for our service management solution was to institute an annual Service Level Agreement (SLA) process with our internal customers. We did not want to create a new bureaucracy but wanted a simple framework with which we could collaboratively manage the supply and demand of our services. This is basically our operating contract between the IT service provider and each of IT’s internal customers. We wanted it to be as simple as possible, but include some very important information for each billable service:
1. Coverage period
2. Full description
3. Price
4. Estimated annual demand
5. Performance metrics
6. Specific governance statements
Again, this is not an inclusive list, but highlights some of the more important information. Generally, SLAs are not legally enforceable, so they really become a planning/communication document between the provider and consumer. As such, they do not need multiple pages of legal paragraphs that are normally found in contracts between the company and external vendors.
Most importantly, the annual SLA details the IT services available, the price that our internal customer will be paying for them (see chargeback/billing below), the estimated demand and the performance expectations. These documents are a management tool to direct the IT provider regarding service delivery during the year. Our previous SLAs were prepared on paper (consuming a large volume of resource hours) and then put in a file drawer until the next year. This time we used an electronic SLA so we could create a
database of information and have it available for periodic management reporting.
The screenshot below is our web-based SLA with a database accessed at any time by the service provider and/or service consumer.
DEMAND MANAGEMENT/PLANNING
One of the most difficult concepts that we encountered regarding IT service management was understanding the volume demand for future service. In most cases, IT groups have never tracked the consumption (in units) of their billable services (with the possible exception of application development and mainframe usage) and have no way of predicting the future. However, this very important management information will enable better resource utilization.
The only way we could implement this concept was to begin tracking monthly volumes of billable services for each internal customer. We needed this information for service costing, SLAs and chargeback anyway, so tracking mechanisms were identified to populate either the costing (FlexABM) data base or the metrics tool (Enterprise Scorecard) data base.
TRANSFORMING IT: DEVELOPING AN ITIL-BASED VALUE PROPOSITION

12
CHARGEBACK/BILLING
This was the most controversial, political, passionate concept in the IT service management model. To chargeback, or not…that was our burning question.
There were a number of reasons why we would not want to formally charge our internal customers for the demand that those customers placed on IT:
♦ It’s not our culture
♦ We may be too high priced
♦ Customers may want choice
♦ Customers won’t like it ♦ It will cause our internal customers’
profitability to look bad
♦ It’s an administrative burden ♦ If customers get charged, they may
decide they don’t need it
We concluded that, if IT did not exist in the company, the operating business units would have to purchase technology service from an external vendor. They would contract for what they needed, get a monthly invoice for what they consumed, be required to pay the invoice, and it would affect their profit margins. So why should it be different for the company-owned IT business?
We spend the money because internal IT users demand technology solutions to deliver their products/services to revenue producing external customers. Someone in the corporate structure has to cover 100% of what IT spends: it has to be either external customers or corporate stockholders.
The concept of paying for consumption of goods and services is not new. It is how the entire free enterprise system works. It can also work within a corporate structure, like an internal market place. To this end, we decided that monthly quantity-X-price chargeback/billing is the best and most equitable chargeback solution: internal customers pay for what they consume based on data that reflects valid consumption. Besides, once we calculated an annual unit cost/price for each billable service, and once we tracked and understood the quantity demands for each billable service, the monthly invoice was very simple…take the quantity consumed for the month, times the price from the SLA, and generate a bill. We used eBilling to link the bill to the SLA directly and send it to the internal customer via our Intranet.
Here is an example of the top half of our invoice.
TRANSFORMING IT: DEVELOPING AN ITIL-BASED VALUE PROPOSITION

13
PERFORMANCE SCORECARDS
We also knew that, to be credible, performance results must be captured, reported and used to direct the IT organization towards improved service delivery. We used Enterprise Scorecard from CRG. This tool was easy to use, flexible enough to structure the metrics for the performance model (Balanced Scorecard) and had the ability to report and distribute performance results easily through graphs and/or dashboards.
We now had all the information in place to demonstrate the value of IT embedded with the ITIL framework.
♦ A well defined service catalogue aligned with the ITIL framework;
♦ A very good understanding of activity and service costs;
♦ Performance metrics against each service that can be used for benchmarking at a later stage;
♦ Measurement tools for tracking these metrics and providing dashboards;
♦ Service Level Agreements with our internal customer that span cost/price and quality and response time metrics;
♦ A framework for a demand management dialogue that is based on actual services and quantities demanded and delivered;
♦ A consistent way of measuring customer satisfaction.
TRANSFORMING IT: DEVELOPING AN ITIL-BASED VALUE PROPOSITION

14
CUSTOMER SATISFACTION SURVEY
After all this work, we were still not sure if our internal customers were happy.
It was clear to us that even if we continued to improve/reduce costs and improve performance metrics our internal customer may have higher expectations. On the other hand, we were very confident that we had made significant strides in delivering IT services and we knew that our customer satisfaction scores must have improved.
So we decided to do a survey of our customers based on the services they had received. Here is an example of the survey and the results.
Web-based customer satisfaction survey and
Customer satisfaction survey analysis report
This was the end of Patricia Caluchi’s executive report.
TRANSFORMING IT: DEVELOPING AN ITIL-BASED VALUE PROPOSITION
15
CONCLUSION
Imagine the business environment if the internal IT organization is managed as a real third-party provider of technology services! Would internal IT customers be getting a better value from their technology provider? Would internal technology users quit complaining about the cost of IT and the lack of service? Could the profitability of the providers of external goods and services improve?
The answer to these questions could be a resounding YES!
CRG’s IT service management model encompasses all dimensions of service delivery: Resources, ITIL Processes, Billable Services and Customers. The ITIL process framework establishes a good model for managing the IT organization. ITIL represents the work that must be done and the performance that must be achieved to provide value-add end-use service to internal customers.
The real economic transaction is between the internal customers and providers of technology services represented by a bundled set of market-comparable billable services. The integration of ITIL with Billable Services coupled with the CRG service management framework is a very powerful service management solution.
TRANSFORMING IT: DEVELOPING AN ITIL-BASED VALUE PROPOSITION
Let’s fast forward and check on Patricia Caluchi.
She has started her planning process for the upcoming fiscal year. Again, she has scheduled individual discussions with her Business Unit leader peers to talk about technology demands. This time she is armed with performance data, the results from the customer satisfaction survey and support from the CEO to begin a formal monthly invoicing process (chargeback). She has Service Level Agreements with each internal customer that list the billable services along with the Price per unit, an estimate of the number of units to be consumed (based on the current year consumption) and the performance expectations for each billable service.
She can now have the discussion about the cost of increases in demand to the customers and get feedback regarding their willingness to “pay for” their new demand. The IT budget is developed based on this new demand. The difference is that Ms Caluchi now knows how much additional volume of service can be delivered by her current staff. She calculates that 50% of the new demand is permanent increases and can be delivered without additional staff and that she can outsource the other 50% (short-term) increase in demand.
During the planning meeting with executives, she gives them all of this financial and operational information. She reports that cycle times have decreased by 60%, the network availability is at 99.99%, customer satisfaction is improving, and the prices quoted in the annual SLAs are 10% lower than current market prices. She also reports that increased demand for application development will cause her to hire external programmers for six months, but that her customers have approved the additional spending as part of their budgets. There are no questions.

16
This page intentionally left blank.

17
APPENDIX SOME BACKGROUND
What is Information Technology Infrastructure Library (ITIL)?
ITIL is a series of documents, originally created by the United Kingdom’s Office of Government Commerce. These are used to help implement an efficient framework for IT Service Management (ITSM).
This 'ITIL framework' essentially defines how to organize the system and network management departments within individual organizations. The concepts within ITIL support IT service providers in the planning of consistent, documented, and repeatable processes that improve service delivery to the business.
ITIL addresses the organizational structure and skill requirements for an IT organization by presenting a comprehensive set of management procedures with which an organization can manage its IT operations.
What is a “Process”?
A “process” is a grouping of work activities all focused on converting an input into a value-added output. It follows then that “Process Management” involves managing the work activities required to configure an input into a value-added output.
Processes come in different sizes. Large or “core” processes are those that encompass many related work activities that form a “value chain” linking the input, through the process, to the output.
What is an “Activity”?
An Activity consists of the subordinate/lower set of work actions contained within a core/support process or sub-process. Activities also have an input and output, but are normally at a low enough level that shared service customers do not see the output. That doesn’t mean that activities should not be managed, it just means that they are more internally focused than “customer-facing”.
For Information Technology groups, an emerging process management methodology is Information Technology Infrastructure Library (ITIL). This very popular methodology for transforming the IT “shop” from a traditional "resource management" model to a "process management" (or service management) model involves a fundamental change in management focus.
As with other process management methods, the implementation of ITIL can enhance the value that the IT “business” adds to its corporate customers.
ITIL focuses on improving the output of work through a standard process methodology. When IT groups were “back-office” functions and their services were “free” to their internal “users”, people management was very effective. Now terms like “service offerings” and “customer” have entered the management equation; there is no “back-office” anymore and IT Services should not be free to the internal consumer. The IT strategic focus is now customer-facing, so management focus must react and move closer to the customer, as shown below.
TRANSFORMING IT: DEVELOPING AN ITIL-BASED VALUE PROPOSITION

18
What is the ITIL-based Service Management Model?
Under the historical, established "resource management" focus, all management support systems are based on the management of people (resource-based). Generally, people with the same or comparable skills are grouped under a leader who has demonstrated expert competencies within
the same skill sets. These groups are commonly referred to as "functional units, departments, cost centers, etc." The management support systems that support these functional units include:
♦ Operational “functional” budgets (departments and financial accounts) mainly based on a pay increase guideline from year to year
♦ Cost accumulation and reporting against functional budgets (variance reporting)
♦ Performance metrics and targets for functional groups
♦ Incentive pay based on functional group performance, with little regard for strategic goals
To transform to a "process or service management" focus, the support systems must be reconfigured:
♦ Process or service output budgeting and/or resource allocation. The budget should now be a reflection of the resources required to maintain competitive unit costs and quality for the volume of services demanded by customers.
♦ Process or service output unit cost accumulation/calculation and reporting. Understanding the “fully-consumed” unit cost of the delivered service and/or process is critical in deciding how to affect it. Multi-dimensional activity/process-based methodologies are the most effective solutions for the required unit cost information.
♦ Process or service output performance metrics and targets. Since processes and/or the delivery of services can encompass many “functions”, performance models must be changed to reflect the results of service delivery. Furthermore, the performance metrics must reflect the needs of the customer and mirror those stated in annual (or periodic) service level agreements.
♦ Incentive pay based on process or delivered service performance results. Employee evaluations should be linked to service delivery and shared service strategic success.
8
Service Management Model
Resources-People- Assets- Other
ITIL Processes &
Activities
Market-Focused BillableServices
Internal Customers
- Strategy- Planning- Budgeting- Performance (cost, time, quality)- Business Information
Management Thinking
TRANSFORMING IT: DEVELOPING AN ITIL-BASED VALUE PROPOSITION

19
ITIL-based Service Management is much more than restructuring people into new process-based functional groups. It truly is a change in management focus. Actions required to move from "resource" to "process / service" management may include:
1. Developing a list of strategic processes, sub-processes and activities that support service delivery. This is already established in the ITIL methodology.
2. Assigning an “owner” for each major process and/or service line - overall management of the process/service line.
3. Developing "line-of-sight" performance metrics and targets for each process, sub-process, activity and/or service (should be focused on the output of the process).
4. Developing a process/service-based budget and holding managers accountable for the spending and output unit cost for the process/service.
5. Developing process/service-based management support tools.
6. Developing reporting tools to give process/service line leaders management information about the process/service.
7. Developing employee productivity targets and evaluations based on their role in the results of the process/service delivery.
8. Developing process/service-based incentive compensation (this is extremely important to support customer-focused behavior)
Moving to an "ITIL-based service management model" is a step in the right direction because it moves the management focus closer to the customer. However, most internal customers do not understand all of the “technical” processes in IT. Customers understand:
♦ How long it takes to get a new PC, or an access ID
♦ That projects are over budget and behind schedule
♦ That the help desk is not helping
♦ That their application is not working ♦ That the network is down when they
need it
So, we must demonstrate “value” at the internal customer level by delivering on a set of easily understood “billable” services.
TRANSFORMING IT: DEVELOPING AN ITIL-BASED VALUE PROPOSITION

20
CRG SHARED SERVICES MANAGER – “MEASURING, MANAGING, ENABLING TODAY'S SHARED SERVICES”
Shared Services Manager from CRG is a complete measurement and manage-ment solution that provides tools to answer these questions. Shared Services Manager transforms volumes of operational data into effective management information for today's Shared Services organization. Shared Services Man-ager's flexible drag-and-drop data modeling capabilities saves time and money by providing comprehensive, easy-to-understand information on all Key Performance Indicators. In addition, its robust reporting functionality satisfies the reporting needs of all users across the organization.
Shared Services Manager provides powerful multi-dimensional views of infor-mation through the use of Online Analytical Processing (OLAP) data cubes, customizable dashboards, drill-down functionality and online user feedback. Data required for the Shared Services framework can be obtained from a mul-titude of sources (general ledger, usage-based systems, etc.). Shared Services Manager's native data collection tools make the import process seamless to the company.
Automation is the key to efficiency, and Shared Services Manager delivers. Shared Services Manager's web-based architecture allows your company to deploy its management tools with minimal effort. Geographically dispersed organizations can easily implement Shared Services Manager.
TRANSFORMING IT: DEVELOPING AN ITIL-BASED VALUE PROPOSITION

21
ABOUT CRG
Established in 1989, Corporate Renais-sance Group is a global provider of inno-vative solutions and services that drive better business management and performance. With expertise in shared services, corporate finance, business in-telligence and value-based management, CRG has established itself as a leading provider of solutions that transform fi-nancial performance and operational effectiveness.
CRG is headquartered in Ottawa, Canada, with offices in the United States, South Africa and India. It is strategically aligned with technology partners Microsoft and Cognos. Products include a suite of Financial Systems (ERP), Shared Services, Activity-Based Costing, Performance Measurement, Business Management and Personnel Performance applications which are sold directly and are also available through a global network of more than 600 part-ners and resellers.
For additional information on CRG and our solutions, visit www.crgroup.com.
For information about CRG’s Shared Services practice and Shared Services Manager, please contact:
In the U.S.A.
Ron Bradley Executive Director, CRG-USA
Ron has extensive experience in implement-ing shared services along with his expertise in performance management, financial ac-countability, process redesign, business sys-tem design and strategic cost and profitabil-ity models. Mr. Bradley has extensive ex-perience in developing business driven solu-tions, was Director of Activity-based Costing and Performance Management for a large utility prior to his consulting career, and has hands-on knowledge of process redesign methodologies. Ron has a B.A. in business administration and economics with an MBA and holds a CPA designation.
Outside the U.S.A.
Vijay Jog President, CRG
Vijay consults extensively to many organiza-tions and assists them in improving financial and operational performance. He has been active in both costing and shared services area for last fifteen years. He is a frequent speaker at many executive development seminars on enterprise performance im-provement. He has implemented many shared services solutions across the world. Vijay is a Chemical engineer with a MBA and Ph.D. in management.
TRANSFORMING IT: DEVELOPING AN ITIL-BASED VALUE PROPOSITION
www.crgroup.com
Corporate Headquarters 6 Antares Drive, Phase 1 Suite 200 Ottawa, Ontario Canada K2E 8A9 Phone: 613.232.4295 Fax: 613.232.7276 Email: [email protected]
US Headquarters 7712 S 232nd E Ave. Broken Arrow, Oklahoma 74014 USA Phone: 918.357.9304 Fax: 918.357.5347 Email: [email protected]
South Africa No. 9 Dolphin Drive Bloubergrant 7443 Cape Town South Africa Phone: 27.21.557.5847 Email: [email protected]
India 5 Ramagovind Sahawas Society Karvenagar, Pune India Phone: 91.202.5457100 Email: [email protected]