differences in results of measurement between itil 2007 and itil 2011...
TRANSCRIPT

Abstract — The aim of this paper is to present differences between ITIL model from 2007 and ITIL model from 2011. IP Multimedia Subsystem is chosen as the test architecture for the implementation of these two models. The paper contains two different measurements. In the first measurement are taken only 2 parameters: time period needed for the implementation and the number of employees needed for the implementation. Results have showed that the model from 2011 is better for 12% than the model from 2007. In the second measurement are taken all Key Performance Indicators for 15 ITIL processes: Financial Management, Service Portfolio Management, Service Level Management, Capacity Management, Availability Management, IT Service Continuity Management, Information Security Management, Supplier Management, Change Management, Service Asset and Configuration Management, Release and Deployment Management, Service Validation and Testing, Incident Management, Problem Management and Continual Service Improvement process. Results in this measurement have showed that the model from 2011 is better for 10% than the model from 2007.
Keywords — ITIL V3, ITIL 2007, ITIL 2011, Service Strategy, Service Design, Service Transition, Service Operation, Continual Service Improvement, Key Performance Indicators, IMS.
I. INTRODUCTION
Every company that wants to increase its level of work and business depends on IT. If the IT processes and services are lead successfully, the operation of the company will become more fortunate and successful, which can be noticed in the decrease of costs, and increase of revenues and achievement of contacts with other business partners [6]. For the IT processes and services to be successfully lead, it is necessary for the company to define a gathering of specialized organizational skills
Manuscript received December 7, 2011: Revised version received February 13, 2012.
Corresponding author Anel Tanovic is teaching assistante and university researcher from Faculty of Electrical Engineering, University of Sarajevo, Zmaja od Bosne bb, 71000 Sarajevo, Bosnia and Herzegovina (phone: 387-61-481961, e-mail: [email protected])
Iosif Androulidakis is a seasoned security researcher, e-mail: [email protected]
Fahrudin Orucevic is teaching Professor and University researcher, from Faculty of Electrical Engineering, University of Sarajevo, Zmaja od Bosne bb, 71000 Sarajevo, Bosnia and Herzegovina (phone: 387-61-133920, e-mail: [email protected])
which are offered to clients in the form of a service. That set of specialized skills makes up the Service Management of a company [1], [6]. There are many IT Service Management methodologies and standards and one of them is also Information Technology Infrastructure Library (ITIL). ITIL in version 3 has 5 phases in which are placed 26 processes and 4 functions [1], [2], [3], [4], [5]. From 2007 to 2011, 500 of scientific papers about the future improvement of ITIL is written [7], [8], [13]. These papers are the consequency of the ITIL V3 implementations in business environments. For each ITIL V3 phase there is one or more changes:
Service Strategy – Two processes are added: Strategy Management for IT services and Business Relationship Management. Process Financial Management is improved and renamed to Financial Management for IT services. Process Strategy Generation is deleted [1].
Service Design – One new process is added: Design Coordination. It is created 1 new portfolio of IT services and stronger relationship to Service Strategy phase [2].
Service Transition - One new process is created: Change Evaluation. These 3 processes are improved: Change Management, Service Asset and Configuration Management and Release and Deployment Management [3].
Service Operation - These 3 processes are improved: Event Management, Incident Management and Problem Management [4].
Continual Service Improvement – It is performed Plan-Do-Check-Act cycle in the Continual Service Improvement Process. These 2 processes are deleted: Service Reporting and Service Measurement [5].
The IP Multimedia Subsystem (IMS) is a standardized IP-based architecture that allows the convergence of fixed and mobile communication devices, multiple network types, and multimedia applications [9], [10], [12]. Using IMS, applications can combine voice, text, pictures, and video in seamless call sessions, offering significant ease-of-use to subscribers and allowing service providers to drive branding through a common interface, while substantially reducing operating costs. This subsystem allows to users to send multimedia files from TV to mobile
Differences in results of measurement between ITIL 2007 and ITIL 2011 model for the IMS
system
A. Tanovic, I. Androulidakis and F. Orucevic
INTERNATIONAL JOURNAL OF COMPUTERS AND COMMUNICATIONS Issue 2, Volume 6, 2012
107

phone or from mobile phone to TV, or to send SMS messages from TV to mobile phones [11], [14]. Section II of the paper describes test environment in IPTV system of Telecom operator in which is implemented IMS system. Section III of the paper describes the implementation of the IMS system by using the old ITIL V3 model. Section IV of the paper describes the implementation of the IMS system by using the new ITIL V3 model. Section V shows results of the implementation of the IMS system by using the old ITIL V3 model and new the new ITIL V3 model. Section VI presents results for key performance indicators which are used in the implementation of the IMS system for both ITIL models (the old ITIL V3 model from 2007 and the new ITIL V3 model from 2011). Section VII is the conclusion of the paper in which is presented how much is better a new ITIL V3 model than the old ITIL V3 model. In the conclusion of the paper are presented summary results for 15 ITIL processes and for 5 ITIL phases. In these results are shownphases and processes from ITIL 2011 that need improvements in the future researches. Previously published paper of authors from this research area is [8] in which is presented a new ITIL V3 model for IMS architecture. In this paper is constructed IMS architecture by using only 6 ITIL V3 processes: Service Level Management, Supplier Management, Service Asset and Configuration Management, Release and Deployment Management, Service Validation and Testing and Evaluation Process. The second paper is [7] in which is described the process of integration of PRINCE2 model into last ITIL V3 model. The scientific value of this paper is a new proces which is called Project Management which is integrated into Service Transition phase. In paper [16] is described the complete process of the IPTV convergence into IMS system and advances of that implemented system. The authors have launched and developed system as a pilot service in their network. Based on this research, we did our research in one Telecom Operator in Bosnia and Herzegovina to show that IMS system is applicable in one real environment. Very similar research is [17] in which authors have described SIP applications servers and IMS service logic. They showed that these servers can be open services architecture (OSA) application servers or a customized applications for mobile networks using enhanced logic service environment. The authors have published a few papers before this papers that are connected to the implementation of the ITIL framework. The most important are: [18] in which is described the implementation of the ITIL Supplier Management process in IPTV system of Telecom operator and [19] in which is described the implementation of the ITIL Information Security Management process in IPTV/VoIP system of Telecom operator. The result of the first paper is 75% of successful implemented ITIL recommendations for IPTV system and the result of the second paper is 67% of successful implemented ITIL recommendations for IPTV and VoIP systems. These both researches are done in the same environment as this research.
Very interesting paper in this field is [20] in which is described Balanced Scorecard as the most popular technique for the measurement of the implementation of each ITIL process. We have chosen this technique for the measurement of key performance indicators. In paper [21] is described the usage of business process tools for modeling requirements on system changes. Paper [22] describes advantages of using some IT Service Management methodology or standard in the implementation of some cloud system. In paper [23] is described the spiral model development concept for one multimedia application. Finally, in paper [24] are described information security management concepts for SIP protocol in the implementation of the IMS system.
II. TEST ENVIRONMENT
We have chosen an IMS architecture as the test architecture for the implementation of the new ITIL V3 model. Tests are dome during the project of IMS implementation in BH Telecom [9], [11], the leading Telecom Operator in Bosnia and Herzegovina [7], [8]. All steps needed for the implementation of the IMS model are taken into account.
Figure 1. shows fixed IPTV system in BH Telecom [8], before the implementation of the IMS system. Components of this system are: IPTV Middleware, VoD Media server, Envivio 4 TV Encoder, Linear TV Content Source, Verimatrix CA/DRM Server and VoD Streaming Server.
Figure 1. Fixed IPTV system
Figure 2. shows mobile IPTV system in BH Telecom [8], before the implementation of the IMS system. Components of this system are: VoD Media server, Realnetwork transcoder, Linear TV Content Source, Xenon Live TV Encoder and VoD Streamnig server.
Figure 2. Mobile IPTV system
INTERNATIONAL JOURNAL OF COMPUTERS AND COMMUNICATIONS Issue 2, Volume 6, 2012
108

Figure 3. shows a new IMS system, after the convergence of fixed IPTV system and mobile IPTV system [8]. The new component of this system is Central IPTV Middleware which gives to users some new services like: TV – Mobile Timeshift, TV multimedia sharing, Mobile multimedia sharing, TV SMS, TV – Mobile SMS, TV Chat, Mobile Chat and TV-Mobile Chat.
Figure 3. Implemented IMS system
III. IMPLEMENTATION OF THE IP MULTIMEDIA SUBSYSTEM
BY USING THE OLD ITIL V3 MODEL
Table I describes the implementation of the IMS system by using the old ITIL V3 model. All 5 ITIL V3 phases with 26 IT processes and 4 IT functions are taken into account [7]. This table shows rules for the implementation of all ITIL V3 processes and functions.
TABLE I: IMPLEMENTATION OF THE IMS SYSTEM BY USING THE
OLD ITIL V3 MODEL
Process name The implementation of the process Strategy Generation Managing the position of the company
Managing the work of competing companies
Demand Management
Managing consumer demandsManaging the demands of other Telecom operatorsManaging relationships with other international organizations
Service Portfolio Management
Defining the services of the Telecom operatorManaging the sales
Financial Management
Investment management Resource managementRevenue managementManagement of the overall financesManaging the expenditure of the Telecom operator
Service Catalogue Management
Defining the contents for all services of the Telecom operatorDefining the IT service catalogue
Service Level Management
Managing contracts with end usersManaging human resources in the companyManaging contracts with foreign companiesSolving public complaints and court trials
Capacity Management
Managing IP network space of the Telecom operatorManaging the performance systemManaging the capacity of network elements, switches and DSLAMs
Availability Management
Defining the availability plan
IT Service
Continuity Management
Defining and surveilling the backup service
Information Security Management
Defining the levels of information security Defining administrational roles in the management of the Information system
Supplier Management
Defining tendersDefining juristic and economical services for the tenderDefining professional circumstances for the tender Conducting the realization of the tenderManaging the relationships with strategic partners
Transition Planning and Support
Planning the adaptation of new services and utilities
Change Management
Administrating network elements for managing the Internet Administrating network elements for managing the IPTV serviceAdministration and design application of the IPTV service Administration of network elements for managing the VoIP service Administration of network elements for managing the Hosting services Administration of network elements for managing the E-Mail service Administration of the Portal of the Telecom operator Administration of the Monitoring service and network Administration of the IP core network structure Administration of the DSLAM networkAdministration of terminal devices
Service Asset and Configuration Management
Administration of midpoint application of the Information system Administration of the Provisioning system Administration of the Billing system Administration of the SAP systemAdministration of the IT system infrastructure Implementation of the midpoint application of the Information systemImplementation of the Provisioning systemImplementation of the Billing system Implementation of the SAP system Implementation of the IT system infrastructure
Release and Deployment Management
Development of applications on the network element for managing the Internet Development of applications on the network element for managing the IPTV service Development of applications intended for the end user on the IPTV serviceDevelopment of applications on the network element for managing the VoIP service Development of applications on the network element for managing the Hosting serviceDevelopment of applications on the network element for managing the E-mail service Development of applications on the Portal of the Telecom operatorDevelopment of applications for the Monitoring service and networkDevelopment of the IP core network infrastructureDevelopment of the DSLAM network infrastructureDevelopment of software on terminal devicesTesting of applications on the network element for managing the Internet Testing of applications on the network element for managing the IPTV service Testing of applications intended for the end user on the IPTV service
INTERNATIONAL JOURNAL OF COMPUTERS AND COMMUNICATIONS Issue 2, Volume 6, 2012
109

Service Validation and Testing
Testing of applications on the network element for managing the VoIP service Testing of applications on the network element for managing the Hosting serviceTesting of applications on the network element for managing the E-mail service Testing of applications on the Portal of the Telecom operatorTesting of applications for the Monitoring service and networkTesting of the IP core network infrastructureTesting of the DSLAM network infrastructure
Evaluation Checking the validity of all tests Knowledge Management
Organization of professional workshops Professional and scientific education of the Telecom employees
Event Management Management of relations between organizational units of the Telecom operator Monitoring and managing the events of other Telecom operators
Incident Management
Solving incidents on the servers Solving the incidents on the DSLAM Solving incidents on terminal devices Solving incidents which occur in the Information and Billing system
Request FulfillmentManaging the contents on the Portal Managing the requests of users over the Portal Direct management of user requests
Problem Management
Solving problems on servicesSolving problems on the IP core network Solving problems on the DSLAM Solving problems on the Information system, Provisioning system or Billing system
Access Management Securing all objects of the Telecom operator Securing the server halls and network equipment Managing the security of human resources
Service Desk
Providing information and solutions to problems on the Internet service Providing information and solutions to problems on the IPTV service Providing information and solutions to problems on the VoIP service Providing information and solutions to problems on the Hosting service Providing information and solutions to problems on the E-mail service Providing information and solutions to problems about the Portal of the Telecom operator
Technical Management
Surveillance and monitoring of the core router Monitoring and the surveillance of the server of services of the Telecom operator Surveillance and monitoring of the system IT platform of the Telecom operator Surveillance and monitoring of the switches in the network Monitoring and surveillance of the DSLAMsSurveillance and monitoring of terminal equipment of end users
Application Management
Surveillance of functions of the central application of the Information system Surveillance of applications of the Provisioning system Surveillance of the Billing system Surveillance of the applications of the SAP system Surveillance of the Internet service Surveillance of the IPTV service Surveillance of the VoIP service Surveillance of the E-mail service Surveillance of the Hosting service Surveillance of the Portal of the Telecom operatorSurveillance of the power supply in the server
IT Operations Management
halls Surveillance of air conditioning in the server halls Managing the security employees
Continual Service Improvement
Monitoring the functional units of the Telecom operator Development of existing processes Recommending new organizational structure for the Telecom operator
Service Reporting Managing public relationships Designing final reports on the business of the Telecom operator
Service Measurement
Measuring the quality of the implemented service
IV. IMPLEMENTATION OF THE IMS SYSTEM BY USING THE
NEW ITIL V3 MODEL
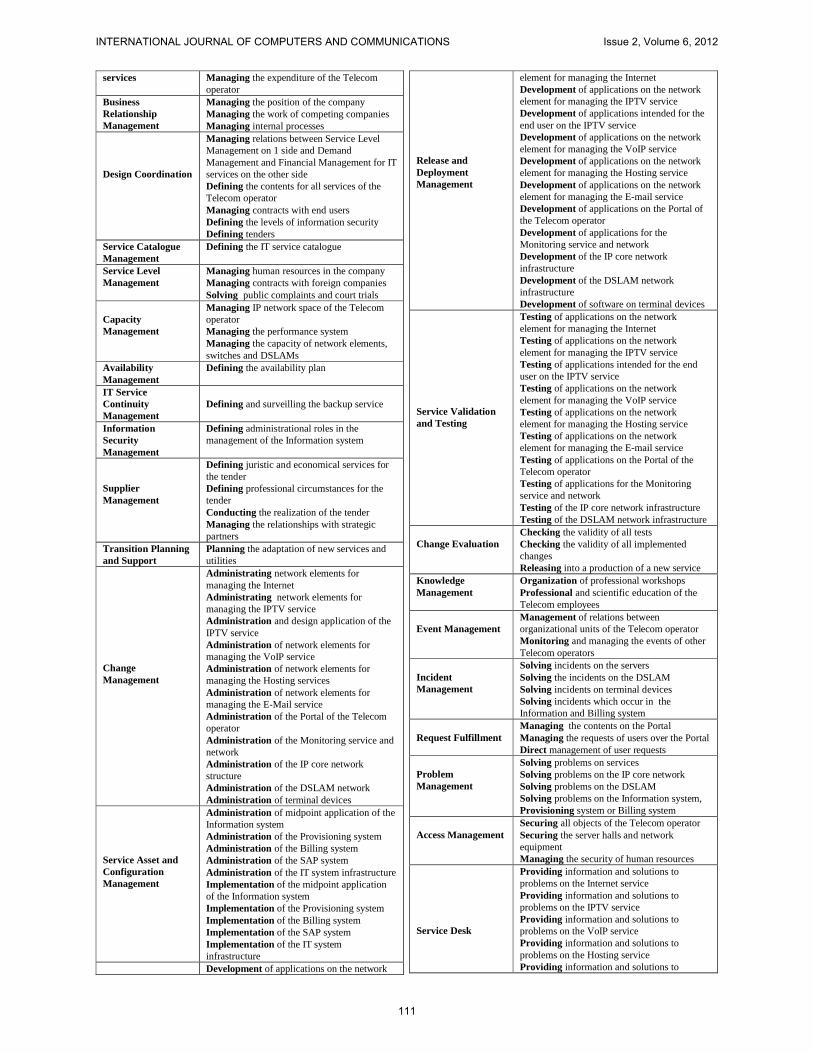
Table II describes the implementation of the IMS systemby using the new ITIL V3 model. All 5 ITIL V3 phases with 26 IT processes and 4 IT functions are taken into account [7]. New processes: Strategy Management [1] for IT services, Financial Management [1] for IT services, Business Relationship Management [1], Design Coordination [2] and Change Evaluation [3] are also taken in the implementation. Figure 4. presents a new ITIL V3 model from 2011. These new processes take some process functions from standard ITIL V3 processes. Strategy Management for IT services takes managing relationships with other international organizations from Demand Management and investment management from Financial Management. This process is also responsible for the management of all other Service Strategy processes [1]. Business Relationship Management is responsible for the management: of the position of the company, the work of competing companies and internal processes [1]. Design Coordination takes defining the contents for all services of the Telecom operator from Service Catalogue Management, contract with end users from Service Level Management, defining the levels of informational security from Information Security Management and defining tenders from Supplier Management [2]. Change Evaluation is responsible for a checking of the validity of all tests, checking the validity of all implemented changes and for decision about releasing into a production of a new service [3].
TABLE II: IMPLEMENTATION OF THE IMS SYSTEM BY USING THE
NEW ITIL V3 MODEL
Process name The implementation of the process
Strategy Management for IT services
Management of Demand Management, Service Portfolio Management, Financial Management for IT services and Business Relationship Management Managing relationships with other international organizationsInvestment management
Demand Management
Managing consumer demandsManaging the demands of other Telecom operators
Service Portfolio Management
Defining the services of the Telecom operatorManaging the sales
Financial Management for IT
Resource managementRevenue managementManagement of the overall finances
INTERNATIONAL JOURNAL OF COMPUTERS AND COMMUNICATIONS Issue 2, Volume 6, 2012
110
services Managing the expenditure of the Telecom operator
Business Relationship Management
Managing the position of the company Managing the work of competing companiesManaging internal processes
Design Coordination
Managing relations between Service Level Management on 1 side and Demand Management and Financial Management for IT services on the other side Defining the contents for all services of the Telecom operatorManaging contracts with end usersDefining the levels of information securityDefining tenders
Service Catalogue Management
Defining the IT service catalogue
Service Level Management
Managing human resources in the companyManaging contracts with foreign companiesSolving public complaints and court trials
Capacity Management
Managing IP network space of the Telecom operatorManaging the performance systemManaging the capacity of network elements, switches and DSLAMs
Availability Management
Defining the availability plan
IT Service Continuity Management
Defining and surveilling the backup service
Information Security Management
Defining administrational roles in the management of the Information system
Supplier Management
Defining juristic and economical services for the tenderDefining professional circumstances for the tender Conducting the realization of the tenderManaging the relationships with strategic partners
Transition Planning and Support
Planning the adaptation of new services and utilities
Change Management
Administrating network elements for managing the Internet Administrating network elements for managing the IPTV serviceAdministration and design application of the IPTV service Administration of network elements for managing the VoIP service Administration of network elements for managing the Hosting services Administration of network elements for managing the E-Mail service Administration of the Portal of the Telecom operator Administration of the Monitoring service and network Administration of the IP core network structure Administration of the DSLAM networkAdministration of terminal devices
Service Asset and Configuration Management
Administration of midpoint application of the Information system Administration of the Provisioning system Administration of the Billing system Administration of the SAP systemAdministration of the IT system infrastructure Implementation of the midpoint application of the Information systemImplementation of the Provisioning systemImplementation of the Billing system Implementation of the SAP system Implementation of the IT system infrastructureDevelopment of applications on the network
Release and Deployment Management
element for managing the Internet Development of applications on the network element for managing the IPTV service Development of applications intended for the end user on the IPTV serviceDevelopment of applications on the network element for managing the VoIP service Development of applications on the network element for managing the Hosting serviceDevelopment of applications on the network element for managing the E-mail service Development of applications on the Portal of the Telecom operatorDevelopment of applications for the Monitoring service and networkDevelopment of the IP core network infrastructureDevelopment of the DSLAM network infrastructureDevelopment of software on terminal devices
Service Validation and Testing
Testing of applications on the network element for managing the Internet Testing of applications on the network element for managing the IPTV service Testing of applications intended for the end user on the IPTV serviceTesting of applications on the network element for managing the VoIP service Testing of applications on the network element for managing the Hosting serviceTesting of applications on the network element for managing the E-mail service Testing of applications on the Portal of the Telecom operatorTesting of applications for the Monitoring service and networkTesting of the IP core network infrastructureTesting of the DSLAM network infrastructure
Change Evaluation Checking the validity of all tests Checking the validity of all implemented changes Releasing into a production of a new service
Knowledge Management
Organization of professional workshops Professional and scientific education of the Telecom employees
Event Management Management of relations between organizational units of the Telecom operator Monitoring and managing the events of other Telecom operators
Incident Management
Solving incidents on the servers Solving the incidents on the DSLAM Solving incidents on terminal devices Solving incidents which occur in the Information and Billing system
Request FulfillmentManaging the contents on the Portal Managing the requests of users over the Portal Direct management of user requests
Problem Management
Solving problems on services Solving problems on the IP core network Solving problems on the DSLAM Solving problems on the Information system, Provisioning system or Billing system
Access Management Securing all objects of the Telecom operator Securing the server halls and network equipment Managing the security of human resources
Service Desk
Providing information and solutions to problems on the Internet service Providing information and solutions to problems on the IPTV service Providing information and solutions to problems on the VoIP service Providing information and solutions to problems on the Hosting service Providing information and solutions to
INTERNATIONAL JOURNAL OF COMPUTERS AND COMMUNICATIONS Issue 2, Volume 6, 2012
111

problems on the E-mail service Providing information and solutions to problems about the Portal of the Telecom operator
Technical Management
Surveillance and monitoring of the core router Monitoring and the surveillance of the server of services of the Telecom operator Surveillance and monitoring of the system IT platform of the Telecom operator Surveillance and monitoring of the switches in the network Monitoring and surveillance of the DSLAMsSurveillance and monitoring of terminal equipment of end users
Application Management
Surveillance of functions of the central application of the Information system Surveillance of applications of the Provisioning system Surveillance of the Billing system Surveillance of the applications of the SAP system Surveillance of the Internet service Surveillance of the IPTV service Surveillance of the VoIP service Surveillance of the E-mail service Surveillance of the Hosting service Surveillance of the Portal of the Telecom operator
IT Operations Management
Surveillance of the power supply in the server halls Surveillance of air conditioning in the server halls Managing the security employees
Continual Service Improvement
Monitoring the functional units of the Telecom operator Development of existing processes Designing final reports on the business of the Telecom operatorMeasuring the quality of the implemented service Recommending new organizational structure for the Telecom operator
V. RESULTS OF THE FIRST MEASUREMENT
Table III shows results of the implementation of the IMS system for the old ITIL V3 system. Two parameters are taken into consideration: time period needed for the implementation and the number of employees needed for the implementation [7], [11], [12].
TABLE III: RESULTS OF THE IMPLEMENTATION OF THE IMS SYSTEM
FOR OLD THE ITIL V3 SYSTEM
Process name Time period needed for the implementation
The number of employees needed for the implementation
Strategy Generation 2 days 3 employees Demand Management
3 days 4 employees
Service Portfolio Management
4 days 4 employees
Financial Management
5 days 5 employees
Service Catalogue Management
2 days 2 employees
Service Level Management
7 days 6 employees
Capacity Management
1 day 2 employees
Availability Management
1 day 2 employees
IT Service Continuity Management
1 day 2 employees
Information Security Management
4 days 4 employees
Supplier Management
8 days 6 employees
Transition Planning and Support
3 days 2 employees
Change Management
4 days 5 employees
Service Asset and Configuration Management
4 days 5 employees
Release and Deployment Management
3 days 4 employees
Service Validation and Testing
2 days 2 employees
Evaluation 2 days 2 employeesKnowledge Management
3 days 3 employees
Event Management 2 days 2 employeesIncident Management
3 days 4 employees
Request Fulfillment 3 days 3 employeesProblem Management
4 days 5 employees
Access Management 1 day 2 employeesService Desk 1 day 2 employeesTechnical Management
1 day 2 employees
Application Management
1 day 2 employees
IT Operations Management
1 day 2 employees
Continual Service Improvement
2 days 4 employees
Service Reporting 2 days 2 employeesService Measurement
1 day 2 employees
Total 81 days 96 employees
Table IV shows results of the implementation of the IMS system for a new ITIL V3 system. Two parameters are taken into consideration: time period needed for the implementation and the number of employees needed for the implementation [7], [11], [12].
TABLE IV: RESULTS OF THE IMPLEMENTATION OF THE IMS SYSTEM
FOR A NEW ITIL V3 SYSTEM
Process name Time period needed for the implementation
The number of employees needed for the implementation
Strategy Management for IT services
5 days 5 employees
Demand Management
2 days 3 employees
Service Portfolio Management
2 days 3 employees
Financial Management for IT services
4 days 4 employees
Business Relationship
3 days 4 employees
INTERNATIONAL JOURNAL OF COMPUTERS AND COMMUNICATIONS Issue 2, Volume 6, 2012
112

ManagementDesign Coordination 4 days 3 employees Service Catalogue Management
1 day 1 employee
Service Level Management
4 days 4 employees
Capacity Management
1 day 1 employee
Availability Management
1 day 1 employee
IT Service Continuity Management
1 day 1 employee
Information Security Management
2 days 3 employees
Supplier Management
4 days 4 employees
Transition Planning and Support
2 days 2 employees
Change Management
3 days 4 employees
Service Asset and Configuration Management
3 days 4 employees
Release and Deployment Management
2 days 3 employees
Service Validation and Testing
2 days 2 employees
Change Evaluation 2 days 2 employees Knowledge Management
2 days 2 employees
Event Management 1 day 1 employeeIncident Management
2 days 3 employees
Request Fulfillment 2 days 3 employees Problem Management
2 days 4 employees
Access Management 1 day 2 employeesService Desk 1 day 2 employees Technical Management
1 day 2 employees
Application Management
1 day 2 employees
IT Operations Management
1 day 2 employees
Continual Service Improvement
2 days 4 employees
Total 64 days 81 employees
Figure 5. shows the ratio between the old ITIL V3 model and the new ITIL V3 model for the parameter: time period needed for the implementation. The result is: 56% of spended time for ITIL V3 model I (the old model) and 44% of spended time for ITIL V3 model II (the new model).
Figure 5. Results for time period needed for the implementation
Figure 6. shows the ratio between the old ITIL V3 model and the new ITIL V3 model for the parameter: number of employees needed for the implementation. The result is: 54% of employees are spended for ITIL V3 model I (the old model) and 46% of employees are spended for ITIL V3 model II (the new model).
Figure 6. Results for number of employees needed for the implementation
VI. MEASUREMENTS OF THE IMPLEMENTATION OF ITIL
2007 AND ITIL 2011 MODEL IN THE IMS SYSTEM BY USING
KEY PERFORMANCE INDICATORS
Last measurement has showed that the ITIL model from 2011 is better than ITIL model from 2007 in two parameters: the number of employees and the time needed for the implementation of the IMS system. Key performance indicators are taken in this measurement to see better differences between these two ITIL models [6]. Processes, which are chosen in this measurement, exist in both ITIL models: Financial Management [1], Service Portfolio Management [1], Service Level Management [2], Capacity Management [2], Availability Management [2], IT Service Continuity Management [2], Information Security Management [2], Supplier Management [2], Change Management [3], Service Asset and Configuration Management [3], Release and Deployment Management[3], Service Validation and Testing [3], Incident Management [4], Problem Management [4] and Continual Service Improvement Process [5]. All results show the ratio in percentages between these two models.
For the measurement of all key performance indicators, we have chosen a technique which is called: Balanced Scorecard [5], [20]. This technique makes a final result of the implementation of each key performance indicator based on these 4 parameters: the number of users, internal processes, organization growth and finances.
Table V shows key performance indicators for Financial Management [1], [6]. The final result of the implementation of all key performance indicators, which is showed as the ratio in percentages, is 43% of successful implemented key performance indicators for ITIL 2007 against 57% of successful implemented key performance indicators for ITIL 2011.
TABLE V: KEY PERFORMANCE INDICATORS FOR FINANCIAL
MANAGEMENT
Key Performance Indicator
ITIL 2007 ITIL 2011
Adherence to BudgetingProcess
46% 54%
INTERNATIONAL JOURNAL OF COMPUTERS AND COMMUNICATIONS Issue 2, Volume 6, 2012
113

Cost-/ Benefit Estimation 43% 57%Post Implementation Review
40% 60%
Adherence to Approved Budget
48% 52%
Adherence to ProjectResources
44% 56%
Proposals for Cost Optimization
38% 62%
Table VI shows key performance indicators for Service Portfolio Management [1], [6]. The final result of the implementation of all key performance indicators, which is showed as the ratio in percentages, is 47% of successful implemented key performance indicators for ITIL 2007 against 53% of successful implemented key performance indicators for ITIL 2011.
TABLE VI: KEY PERFORMANCE INDICATORS FOR SERVICE
PORTFOLIO MANAGEMENT
Key Performance Indicator
ITIL 2007 ITIL 2011
Number of Planned NewServices
48% 52%
Number of Unplanned NewServices
49% 51%
Number of Strategic Initiatives
39% 61%
Number of New Customers 48% 52%Number of Lost Customers 50% 50%
Table VII shows key performance indicators for Service Level Management [2], [6]. The final result of the implementation of all key performance indicators, which is showed as the ratio in percentages, is 44% of successful implemented key performance indicators for ITIL 2007 against 56% of successful implemented key performance indicators for ITIL 2011.
TABLE VII: KEY PERFORMANCE INDICATORS FOR SERVICE LEVEL
MANAGEMENT
Key Performance Indicator
ITIL 2007 ITIL 2011
Services covered by SLAs 47% 53%Services covered by OLAs 40% 60%Monitored SLAs 45% 55%SLAs under Review 46% 54%Fulfilment of Service Levels
39% 61%
Number of Service Issues 44% 56%
Table VIII shows key performance indicators for Capacity Management [2], [6]. The final result of the implementation of all key performance indicators, which is showed as the ratio in percentages, is 46% of successful implemented key performance indicators for ITIL 2007 against 54% of successful implemented key performance indicators for ITIL 2011.
TABLE VIII: KEY PERFORMANCE INDICATORS FOR CAPACITY
MANAGEMENT
Key Performance Indicator
ITIL 2007 ITIL 2011
Incidents due to CapacityShortages
43% 57%
Exactness of Capacity 42% 58%
ForecastCapacity Adjustments 41% 59%Resolution Time of CapacityShortage
52% 48%
Capacity Reserves 50% 50%Percentage of CapacityMonitoring
47% 53%
Table IX shows key performance indicators for Availability Management [2], [6]. The final result of the implementation of all key performance indicators, which is showed as the ratio in percentages, is 46% of successful implemented key performance indicators for ITIL 2007 against 54% of successful implemented key performance indicators for ITIL 2011.
TABLE IX: KEY PERFORMANCE INDICATORS FOR AVAILABILITY
MANAGEMENT
Key Performance Indicator
ITIL 2007 ITIL 2011
Service Availability 47% 53%Number of ServiceInterruptions
51% 49%
Duration of ServiceInterruptions
50% 50%
Availability Monitoring 42% 58%Availability Measures 40% 60%
Table X shows key performance indicators for IT Service Continuity Management [2], [6]. The final result of the implementation of all key performance indicators, which is showed as the ratio in percentages, is 42% of successful implemented key performance indicators for ITIL 2007 against 58% of successful implemented key performance indicators for ITIL 2011.
TABLE X: KEY PERFORMANCE INDICATORS FOR IT SERVICE
CONTINUITY MANAGEMENT
Key Performance Indicator
ITIL 2007 ITIL 2011
Business Processes withContinuity Agreements
43% 57%
Gaps in Disaster Preparation
42% 58%
Implementation Duration 51% 49%Number of Disaster Practices
39% 61%
Number of IdentifiedShortcomings during DisasterPractices
38% 62%
Table XI shows key performance indicators for Information Security Management [2], [6]. The final result of the implementation of all key performance indicators, which is showed as the ratio in percentages, is 44% of successful implemented key performance indicators for ITIL 2007 against 56% of successful implemented key performance indicators for ITIL 2011.
TABLE XI: KEY PERFORMANCE INDICATORS FOR INFORMATION
SECURITY MANAGEMENT
Key Performance Indicator
ITIL 2007 ITIL 2011
Number of Implemented 41% 59%
INTERNATIONAL JOURNAL OF COMPUTERS AND COMMUNICATIONS Issue 2, Volume 6, 2012
114

Preventive MeasuresImplementation Duration 45% 55%Number of Major SecurityIncidents
52% 48%
Number of Security Tests 47% 53%Number of IdentifiedShortcomings during SecurityTests
37% 63%
Table XII shows key performance indicators for Supplier Management [2], [6]. The final result of the implementation of all key performance indicators, which is showed as the ratio in percentages, is 42% of successful implemented key performance indicators for ITIL 2007 against 58% of successful implemented key performance indicators for ITIL 2011.
TABLE XII: KEY PERFORMANCE INDICATORS FOR SUPPLIER
MANAGEMENT
Key Performance Indicator
ITIL 2007 ITIL 2011
Number of Agreed Contracts
42% 58%
Number of Contract Reviews
46% 54%
Number of Identified ContractBreaches
38% 62%
Table XIII shows key performance indicators for Change Management [3], [6]. The final result of the implementation of all key performance indicators, which is showed as the ratio in percentages, is 47% of successful implemented key performance indicators for ITIL 2007 against 53% of successful implemented key performanceindicators for ITIL 2011.
TABLE XIII: KEY PERFORMANCE INDICATORS FOR CHANGE
MANAGEMENT
Key Performance Indicator
ITIL 2007 ITIL 2011
Number of Major Changes 45% 55%Time for Change Clearance 43% 57%Change Acceptance Rate 48% 52%Number of Urgent Changes 53% 47%
Table XIV shows key performance indicators for Service Asset and Configuration Management [3], [6]. The final result of the implementation of all key performance indicators, which is showed as the ratio in percentages, is 44% of successful implemented key performance indicators for ITIL 2007 against 56% of successful implemented key performance indicators for ITIL 2011.
TABLE XIV: KEY PERFORMANCE INDICATORS FOR SERVICE ASSET
AND CONFIGURATION MANAGEMENT
Key Performance Indicator
ITIL 2007 ITIL 2011
Verification Frequency 44% 56%Verification Duration 42% 58%Effort for CMS Verifications
39% 61%
Automatic CMS Update 47% 53%Number of CMS Errors 46% 54%
Table XV shows key performance indicators for Release and Deployment Management [3], [6]. The final result of the implementation of all key performance indicators, which is showed as the ratio in percentages, is 48% of successful implemented key performance indicators for ITIL 2007 against 52% of successful implemented key performance indicators for ITIL 2011.
TABLE XV: KEY PERFORMANCE INDICATORS FOR RELEASE AND
DEPLOYMENT MANAGEMENT
Key Performance Indicator
ITIL 2007 ITIL 2011
Number of Releases 47% 53%Duration of Major Deployments
42% 58%
Number of Release Backouts
47% 53%
Proportion of AutomaticRelease Distribution
54% 46%
Table XVI shows key performance indicators for Service Validation and Testing [3], [6]. The final result of the implementation of all key performance indicators, which is showed as the ratio in percentages, is 49% of successful implemented key performance indicators for ITIL 2007 against 51% of successful implemented key performance indicators for ITIL 2011.
TABLE XVI: KEY PERFORMANCE INDICATORS FOR SERVICE
VALIDATION AND TESTING
Key Performance Indicator
ITIL 2007 ITIL 2011
Percentage of Failed ReleaseComponent Acceptance Tests
50% 50%
Number of Identified Errors
49% 51%
Time for Error Fixing 47% 53%Incidents Caused by NewReleases
51% 49%
Percentage of Failed ServiceAcceptance Tests
50% 50%
Table XVII shows key performance indicators for Incident Management [4], [6]. The final result of the implementation of all key performance indicators, which is showed as the ratio in percentages, is 45% of successful implemented key performance indicators for ITIL 2007 against 55% of successful implemented key performance indicators for ITIL 2011.
TABLE XVII: KEY PERFORMANCE INDICATORS FOR INCIDENT
MANAGEMENT
Key Performance Indicator
ITIL 2007 ITIL 2011
Number of Repeated Incidents
51% 49%
Remotely Resolved Incidents
38% 62%
Number of Escalations 49% 51%Number of Incidents 52% 48%Incident Resolution Time 42% 58%First Time Resolution Rate 44% 56%Resolution within SLA 40% 60%
INTERNATIONAL JOURNAL OF COMPUTERS AND COMMUNICATIONS Issue 2, Volume 6, 2012
115

Incident Resolution Effort 41% 59%
Table XVIII shows key performance indicators for Problem Management [4], [6]. The final result of the implementation of all key performance indicators, which is showed as the ratio in percentages, is 44% of successful implemented key performance indicators for ITIL 2007 against 56% of successful implemented key performance indicators for ITIL 2011.
TABLE XVIII: KEY PERFORMANCE INDICATORS FOR PROBLEM
MANAGEMENT
Key Performance Indicator
ITIL 2007 ITIL 2011
Number of Problems 53% 47%Problem Resolution Time 42% 58%Number of Incidents perProblem
41% 59%
Number of Incidents per KnownProblem
44% 56%
Time until ProblemIdentification
42% 58%
Problem Resolution Effort 46% 54%
Table XIX shows key performance indicators for Continual Service Improvement process [5], [6]. The final result of the implementation of all key performance indicators, which is showed as the ratio in percentages, is 45% of successful implemented key performance indicators for ITIL 2007 against 55% of successful implemented key performance indicators for ITIL 2011.
TABLE XIX: KEY PERFORMANCE INDICATORS FOR CONTINUAL
SERVICE IMPROVEMENT PROCESS
Key Performance Indicator
ITIL 2007 ITIL 2011
Number of ProcessBenchmarkings, MaturityAssessments, and Audits
43% 57%
Number of Process Evaluations
42% 58%
Number of IdentifiedWeaknesses
49% 51%
Number of ImprovementInitiatives
45% 55%
Number of CompletedImprovement Initiatives
46% 54%
VII. FINAL RESULTS AND CONCLUSION
Table XX shows final results of all measurements for all 15 ITIL processes. ITIL 2011 is better than ITIL 2007 inall 15 processes. Two processes in which ITIL 2011 is much better than ITIL 2007 are: Financial Management and Supplier Management. ITIL 2011 is better in Financial Management than ITIL 2007 for 14% (57% against 43% for ITIL 2011). ITIL 2011 is better in Supplier Management than ITIL 2007 for 16% (58% against 42% for ITIL 2011).
Two processes in which are the results almost equal are: Service Validation and Testing process and Release andDeployment Management. ITIL 2011 is better in Service Validation and Testing Process than ITIL 2007 for 2%
(51% against 49% for ITIL 2011). ITIL 2011 is better in Release and Deployment Management than ITIL 2007 for 4% (52% against 48% for ITIL 2011).
Table XX shows final results for all 15 ITIL processes. Arithmetic sum of all 15 results shows that ITIL 2011 is better for 10% than ITIL 2007 (55% against 45%).
TABLE XX: SUMMARY RESULTS FOR ITIL PROCESSES
Key Performance Indicator
ITIL 2007 ITIL 2011
Financial Management 43% 57%Service Portfolio Management
47% 53%
Service Level Management
44% 56%
Capacity Management 46% 54%Availability Management 46% 54%IT Service Continuity Management
42% 58%
Information Security Management
44% 56%
Supplier Management 42% 58%Change Management 47% 53%Service Asset and Configuration Management
44% 56%
Release and Deployment Management
48% 52%
Service Validation and Testing
49% 51%
Incident Management 45% 55%Problem Management 44% 56%Continual Service Improvement process
45% 55%
Table XXI shows final results for all 5 ITIL phases. Results show that ITIL 2011 is better in all 5 phases than ITIL 2007 (the most in Service Design phase where is difference of 12% in favor of ITIL 2011 and the least in Service Transition phase where is ITIL better than ITIL 2007 for 5%) [20], [21], [22].
TABLE XXI: SUMMARY RESULTS FOR ITIL PHASES
Key Performance Indicator
ITIL 2007 ITIL 2011
Service Strategy 45% 55%Service Design 44% 56%Service Transition 47% 53%Service Operation 44.5% 55.5%Continual Service Improvement
45% 55%
All these results, which are described in this paper, show that ITIL 2011 is much better than ITIL 2007. It means that improvements in a new ITIL model from 2011 are achieved. In this research it was taken IP Multimedia Subsystem which is a system of convergence between fixed telephony and mobile telephony and also one complex and big system which is suitable for the research which is covered in this paper. Every organization that has implemented ITIL 2007 should think about introducing ITIL 2011 into its workaround. The organization should introduce these 3 new processes from ITIL 2011: Strategy Management for IT services, Business Relationship Management and Design Coordination. Except introducing
INTERNATIONAL JOURNAL OF COMPUTERS AND COMMUNICATIONS Issue 2, Volume 6, 2012
116

a new processes, a organization should change main process activities for these processes: Service Portfolio Management, Service Level Management, Event Management, Incident Management, Request Fulfillment and Problem Management [8].
Future work of authors in this field is connected to the improvement of the existing ITIL 2011 framework [8].This research has showed that some processes need some improvements like Service Validation and Testing Process and Release and Deployment Management. The future research of authors is connected to the improvement of these 2 ITIL processes in the test environment of the Telecom operator.
ACKNOWLEDGMENT
The authors of this paper would like to thank the experienced professionals from Telecom operator from Bosnia and Herzegovina for their advices in the realization of this project.
REFERENCES
[1] S. Taylor, M. Iqbal, and M. Nieves, “ITIL Version 3 Service Strategy”, The Office of Government Commerce, July 2011.
[2] S. Taylor, V. Lloyd, and C. Rudd, “ITIL Version 3 Service Design”, The Office of Government Commerce, July 2011.
[3] S. Taylor, S. Lacy, and I. Macfarlane, “ITIL Version 3 Service Transition”, The Office of Government Commerce, July 2011.
[4] S. Taylor, D. Cannon, and D. Wheeldon, “ITIL Version 3 Service Operation”, The Office of Government Commerce, July 2011.
[5] S. Taylor, G.Case, and G.Spalding, “ITIL Version 3 Continual Service Improvement”, The Office of Government Commerce, July 2011.
[6] J. van Bon, A. de Jong, A. Kolthof, M.Pieper, R. Tjassing, A. van der Veen, and T. Verheijen, ”Foundations of IT Service Management Based on ITIL V3”, The Office of Government Commerce, September 2007.
[7] A. Tanovic and F. Orucevic, “Integration of PRINCE 2 model into ITIL V3 model”, paper accepted for 19th Telecommunications Forum (TELFOR 2011), November 2011.
[8] A. Tanovic, I. Androulidakis, and F. Orucevic, “Design and implementation of the IP Multimedia Subsystem by using ITIL V3 recommendations”, paper accepted for 11th WSEAS International Conference on Applications of Computer Engineering (ACE’12).
[9] S. Pompei, M. Teodori, A. Valenti, S. Di Bartolo, G. Incerti, and D. Del Buono, “Experimental implementation of an IPTV architecture based on Content Delivery Network managed by VPLS technique”, International Congress on Ultra Modern Telecommunications and Control Systems and Workshops (ICUMT 2010), pp. 576-581, December 2010.
[10] R. Chaudhuri, “End to End IPTV Design and Implementation, How to avoid Pitfalls”, 13th International Telecommunications Network Strategy and Planning Symposium, pp. 1-119, January 2009.
[11] L. Xin, L. Jiangtao, and L. Hui, “Design and Implementation of the Mobile IPTV Service Based on the IMS Intelligent Terminal”, International Conference on Internet Technology and Applications (iTAP 2011), pp. 1-3, August 2011.
[12] H. Khlifi and J.C. Gregoire, “IMS for Enterprises”, International Journal of Communications Magazine, pp. 68-75, vol. 45, July 2007.
[13] R.F. de Sousa Pereira and M.M. da Silva, “A Maturity Model for Implementing ITIL v3”, 6th World Congress on Services (SERVICES-1), pp. 396-406, July 2010.
[14] T. Kovacik, I. Kotuliak, K. Konopkova, and J. Muranyi, ”Service availability enhancement in multimedia networks”, 3rd Joint IFIP Wireless and Mobile Networking Conference (WMNC 2010), pp. 1-6, October 2010.
[15] A. Tanovic, “Innovative model of ITIL V3 improvements based on comparative IT Service Management methodologies”, preparation doctoral study, Faculty of Electrical Engineering, University of Sarajevo.
[16] L. Xin, L. Jiangtao, and L. Hui, Design and Implementation of the Mobile IPTV Service Based on the IMS Intelligent Terminal, International Conference on Internet Technology and Applications (iTAP 2011), pp. 1-3, August 2011.
[17] H. Khlifi and J.C. Gregoire, IMS Application Servers: Roles, Requirements, and Implementation Technologies, IEEE Internet Computing, 12 (3), 2008, pp. 40-51.
[18] A. Tanovic and F. Orucevic, Comparative analysis of the practise of telecom operators in the realization of IPTV systems based on ITIL V3 recommendations for the Supplier Management Process, IEEE International Conference on Service-Oriented Computing and Applications (SOCA’10), 2010, pp. 1-8.
[19] A. Tanovic and F. Orucevic, Analysis of the implementation of the information security management in the IPTV/VoIP system of the Telecom operator, 18th International Conference on Systems, Signals and Image Processing (IWSSIP 2011), June 2011, pp. 1-5.
[20] Dz. Donko and I. Traljic, Continual Service Improvement Using Balanced Scorecard, 8th WSEAS International Conference on Telecommunications and Informatics (TELE-INFO ‘09), pp. 157-162, May 2009.
[21] S. Simonova and I. Zavadilova, Usage of business process tools for modelling requirements on system changes, WSEAS International Conference on Development, Energy, Environment, Economics (DEEE’10), pp. 321-326, November 2010.
[22] M. Jansen, What does it Service Management look like in the cloud, WSEAS International Conference on Computers, digital communications and computing (ICDCC’11) , pp. 87-92, September 2011.
[23] Z. Balantic, Spiral Model Development Concept of Multimedia Application, 10th WSEAS International Conference on Computers , pp. 317-320, July 2006.
[24] C.E. Vintila, A Solution for Secure SIP Conferencing over IMS and SAE, 4th European Computing Conference (ECC’10), pp. 224-229, April 2010.
Anel Tanovic is a teaching assistante at the Department of Informatics, Faculty of Electrical Engineering, University of Sarajevo, Bosnia and Herzegovina. His fields of interests are information systems, databases and management of information systems.
Iosif Androulidakis (IEEE, ACM) has an active presence in the ICT field having authored more than 60 papers and having presented more than 100 talks and lectures in international conferences, seminars and events in 19 countries, forming a strong international network of collaborators. He has served as editor and reviewer in international journals, and as programme committee member in international conferences, while his research has led to four patents.
Fahrudin Orucevic is a lecturer at the Department of Informatics, Faculty of Electrical Engineering, University of Sarajevo, Bosnia and Herzegovina. His fields of interests are information systems, management of information systems and geographical information systems.
INTERNATIONAL JOURNAL OF COMPUTERS AND COMMUNICATIONS Issue 2, Volume 6, 2012
117

Figure 4. New ITIL V3 model from 2011
INTERNATIONAL JOURNAL OF COMPUTERS AND COMMUNICATIONS Issue 2, Volume 6, 2012
118