transfer and development length and prestress losses …docs.trb.org/prp/11-2656.pdf · 1 transfer...
TRANSCRIPT

John, Ruiz, Floyd, and Hale 1
TRANSFER AND DEVELOPMENT LENGTH AND PRESTRESS LOSSES IN 1 ULTRA-HIGH PERFORMANCE CONCRETE BEAMS 2 3 Word count: 3830 4 Number of figures and tables: 9 5 6 Emerson E. John 7 Graduate Research Assistant 8 4190 Bell, 1 University of Arkansas 9 Fayetteville, AR 72701 10 E-mail: [email protected] 11 Fax: 479-5757168 12 Tel.: 479-2008404 13 14 Edmundo D. Ruiz 15 Graduate Research Assistant 16 4190 Bell, 1 University of Arkansas 17 Fayetteville, AR 72707 18 E-mail: [email protected] 19 Fax: 479-575-7168 20 Tel.: 479-575-6348 21 22 Royce W. Floyd 23 Graduate Research Assistant 24 4190 Bell, 1 University of Arkansas 25 Fayetteville, AR 72701 26 E-mail: [email protected] 27 Fax: 479-575-7168 28 Tel.: 501-317-8356 29 30 W. Micah Hale (corresponding author) 31 Associate Professor 32 4190 Bell, 1 University of Arkansas 33 Fayetteville, AR 72701 34 E-mail: [email protected] 35 Fax: 479-575-7168 36 Tel.: 479-575-6348 37 38 39 40 41 42 43 44 45 46
TRB 2011 Annual Meeting Paper revised from original submittal.

John, Ruiz, Floyd, and Hale 2
ABSTRACT 47 48 Results from a project that measured the transfer and development length and prestress losses 49 of beams cast with ultra-high performance concrete (UHPC) are presented. Seven beams 50 measuring 6.5 in. by 12 in. by 18 ft. were cast. The beams had compressive strengths that 51 ranged from approximately 27 ksi to 29 ksi. The results are compared with the calculated 52 values derived from the American Association of State Highway and Transportation 53 Officials’ Load and Resistance Factor Design (AASHTO LRFD) bridge design 54 specifications, National Cooperative Highway Research Program (NCHRP) Report 603, and 55 the University of New South Wales’ (UNSW) design guidelines for prestressed UHPC 56 beams. The research findings indicate that measured transfer and development lengths are 57 shorter than those predicted using the various design guidelines and recommendations 58 developed for conventional concrete and high-strength concrete. However, measured 59 transfer lengths correlate well with those predicted using the NCHRP 603 (neglecting f’c 60 limitations) and the University of New South Wales recommendations and guidelines. The 61 AASHTO LRFD specifications overestimated transfer length and development length and 62 prestress losses (refined method) by approximately 50 percent. The data also show that the 63 contribution of creep and shrinkage in prestress losses is minimal. 64 65 66 67 68 69 70 71 Key words: Transfer length, development length, prestress losses, ultra-high 72 performance concrete 73 74 75 76 77 78 79 80 81 82 83 84 85 86 87 88 89 90 91 92
TRB 2011 Annual Meeting Paper revised from original submittal.

John, Ruiz, Floyd, and Hale 3
INTRODUCTION 93 94 For centuries engineers and researchers have developed new materials and approaches to 95 solve engineering challenges. In the area of bridge construction, finding new ways to 96 construct structurally efficient and durable bridges that will require minimal maintenance at a 97 reasonable cost is one of those challenges. 98
There is a new development in the concrete industry, ultra-high performance concrete 99 (UHPC). This material possesses compressive strengths in excess of 20 ksi [1] and has very 100 low permeability which enhances its durability. The use of this material in the construction 101 of precast, prestressed bridge girders has many benefits. These include improved resistance 102 to chloride penetration, increased span length for a given girder depth and spacing, reduction 103 in the depth and number of girders for a given span and a reduction in the dead load carried 104 by the substructure [2]. 105
The number of bridges, be it highway or pedestrian, constructed to date which used 106 UHPC is comparatively low. The first reported use of UHPC in highway bridge construction 107 was in France in 2001 [2]. Since then, the state of Iowa has used UHPC in the construction 108 of two bridge structures [3]. Several other pedestrian and highway bridges were completed 109 in Europe, Asia and Australia during this decade [2]. 110
UHPC is a new product and for this reason there are limited design methodologies 111 that can be used by engineers to aid in the implementation of a UHPC project. Therefore, the 112 objective of this paper is to present experimental data for transfer and development lengths 113 and prestress losses in prestressed UHPC beams, the results of which can add to the existing 114 knowledge of the performance of UHPC structural elements. 115 116 BACKGROUND 117 118 UHPC was developed in France in the 1990s [3]. It is a mixture of fine sand, cement, silica 119 fume, quartz flour and steel fibers. The proportions are determined based on optimized 120 granular packing of the different constituent materials [1]. Typically, UHPC has water to 121 cementitious materials (w/cm) ratio of 0.15 to 0.19 [3]. The inclusion of steel fibers 122 enhances the ductility of the concrete and is added to the mixture in amounts of 123 approximately 2 percent by volume [3]. The compressive strength of UHPC can be in excess 124 of 20 ksi depending on the mixing and curing procedures [1]. 125
Researchers at Ohio University completed a study of the bond of prestressing strands 126 in UHPC [4]. The investigation focused on determining the development length for 0.50 in., 127 Gr. 270, low-relaxation prestressing strands cast in UHPC. Different lengths of strands were 128 cast into blocks of UHPC, then the strands were pulled until slip or strand rupture. 129 Embedment lengths (LE) were 12, 18, and 24 in. The researchers reported strand fracture 130 occurring before significant strand slip and thus concluded that the development length of the 131 prestressing strands when cast in UHPC is less than 12 in. 132
Graybeal [5] investigated the development length of prestressing strand in UHPC 133 prestressed I-Girders. The AASHTO Type II girders contained 0.50 in., Gr. 270, low-134 relaxation strands. Results from one of the tested beams showed that strand rupture occurred 135 prior to slip under flexural tensile loading at an embedment length of 48 in. In another beam 136 test, rupture of the prestressing strands occurred prior to slip at an embedment length of 37 137 in. which was in a region of very high shear stresses. These results indicate that the 138
TRB 2011 Annual Meeting Paper revised from original submittal.

John, Ruiz, Floyd, and Hale 4
development length of 0.50 in., Gr. 270, low-relaxation prestressing strands in UHPC is less 139 than 37 in. 140
Hegger and Bertram [6, 7] examined the shear capacity and the anchorage behavior of 141 pretensioned strands in UHPC. Their results indicated that transfer lengths ranged from 10 to 142 12 in. Measured prestress losses were 18 to 24 percent of the initial stress in the strands. 143 Almansour and Lounis [2] stated that total prestress losses can be estimated as 17 percent of 144 the ultimate strength of the prestressing tendons. This gives a value for total prestress losses 145 of approximately 46 ksi for Gr. 270 strands 146 147 RESEARCH OBJECTIVE 148 149 The objective of this research is to measure the transfer and development lengths and 150 prestress losses in UHPC beams and compare the results to values derived from design 151 specifications and guidelines from the literature. This empirical procedure is carried out with 152 the aim of evaluating the accuracy of the equations found within the literature in predicting 153 transfer and development lengths and prestress losses. 154 155 EXPERIMENTAL PROGRAM 156 157 Seven UHPC beams with dimensions of 6.5 in. by 12 in. and 18 ft. were cast. For each 158 beam, the transfer length, development length, and prestress losses were measured. The 159 beams contained two 0.60 in. , Gr. 270, low-relaxation prestressing strands located 10 in. 160 from the extreme compression fiber. The beams contained no mild reinforcement for shear 161 or flexure. 162
Ductal was the UHPC mixture used and was supplied by Lafarge North America Inc. 163 The mixture proportion is shown below in Table 1. The steel fibers were straight steel wire 164 fibers, also supplied by Lafarge North America, with a diameter of 0.008 in. and a length of 165 0.50 in. The fibers have a minimum tensile strength of 377 ksi and an elastic modulus of 166 29,000 ksi. 167
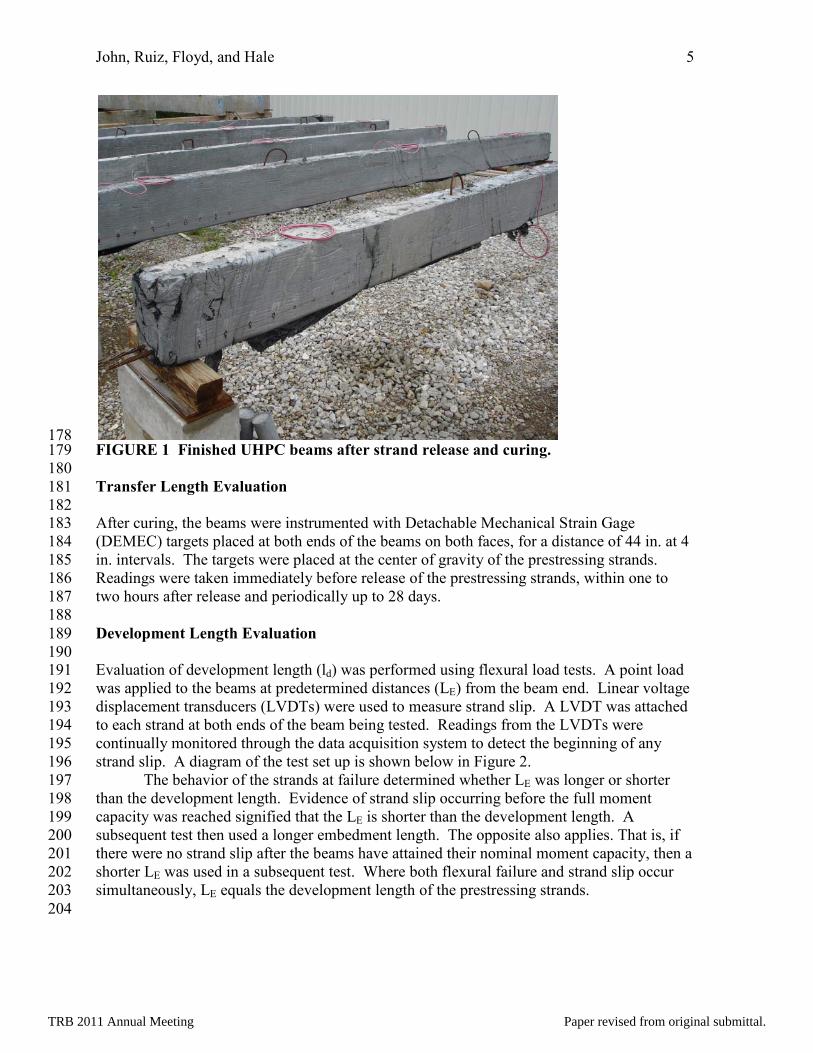
The beams were batched and cured at the University of Arkansas’ Engineering 168 Research Center. The UHPC was mixed in a rotating drum mixer, and the beams were cured 169 at 40oC for 4 days then at 60oC for 3 or 4 days. The beams were cast during the winter 170 months which affected the duration of the heat treatment. The mixing, casting and curing 171 procedures are discussed in detail in earlier publication by the authors [8]. The beams are 172 shown in Figure 1. 173
174 TABLE 1 UHPC Mixture Proportion 175 Materials UHPC Proportions (lb/yd3) Ductal premix 3696 Water 219 Steel fibers 263 HRWR 51
176 177
TRB 2011 Annual Meeting Paper revised from original submittal.
John, Ruiz, Floyd, and Hale 5
178 FIGURE 1 Finished UHPC beams after strand release and curing. 179
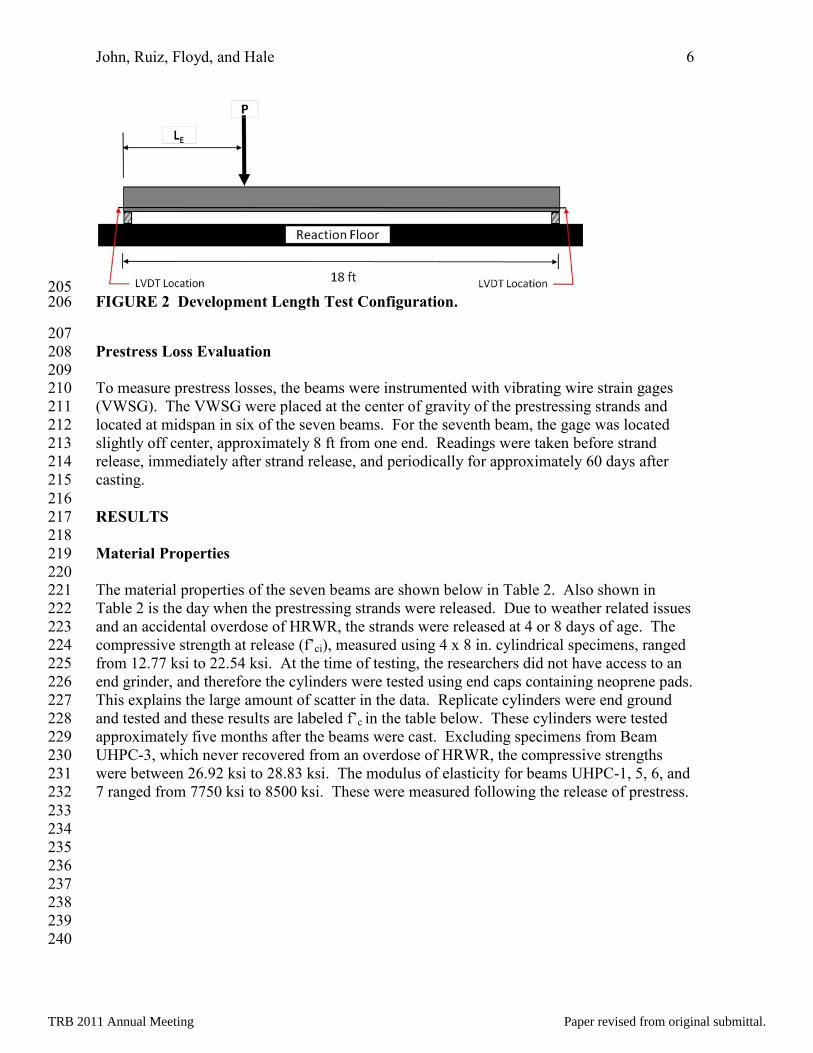
180 Transfer Length Evaluation 181 182 After curing, the beams were instrumented with Detachable Mechanical Strain Gage 183 (DEMEC) targets placed at both ends of the beams on both faces, for a distance of 44 in. at 4 184 in. intervals. The targets were placed at the center of gravity of the prestressing strands. 185 Readings were taken immediately before release of the prestressing strands, within one to 186 two hours after release and periodically up to 28 days. 187 188 Development Length Evaluation 189 190 Evaluation of development length (ld) was performed using flexural load tests. A point load 191 was applied to the beams at predetermined distances (LE) from the beam end. Linear voltage 192 displacement transducers (LVDTs) were used to measure strand slip. A LVDT was attached 193 to each strand at both ends of the beam being tested. Readings from the LVDTs were 194 continually monitored through the data acquisition system to detect the beginning of any 195 strand slip. A diagram of the test set up is shown below in Figure 2. 196
The behavior of the strands at failure determined whether LE was longer or shorter 197 than the development length. Evidence of strand slip occurring before the full moment 198 capacity was reached signified that the LE is shorter than the development length. A 199 subsequent test then used a longer embedment length. The opposite also applies. That is, if 200 there were no strand slip after the beams have attained their nominal moment capacity, then a 201 shorter LE was used in a subsequent test. Where both flexural failure and strand slip occur 202 simultaneously, LE equals the development length of the prestressing strands. 203
204
TRB 2011 Annual Meeting Paper revised from original submittal.
John, Ruiz, Floyd, and Hale 6
205 FIGURE 2 Development Length Test Configuration. 206
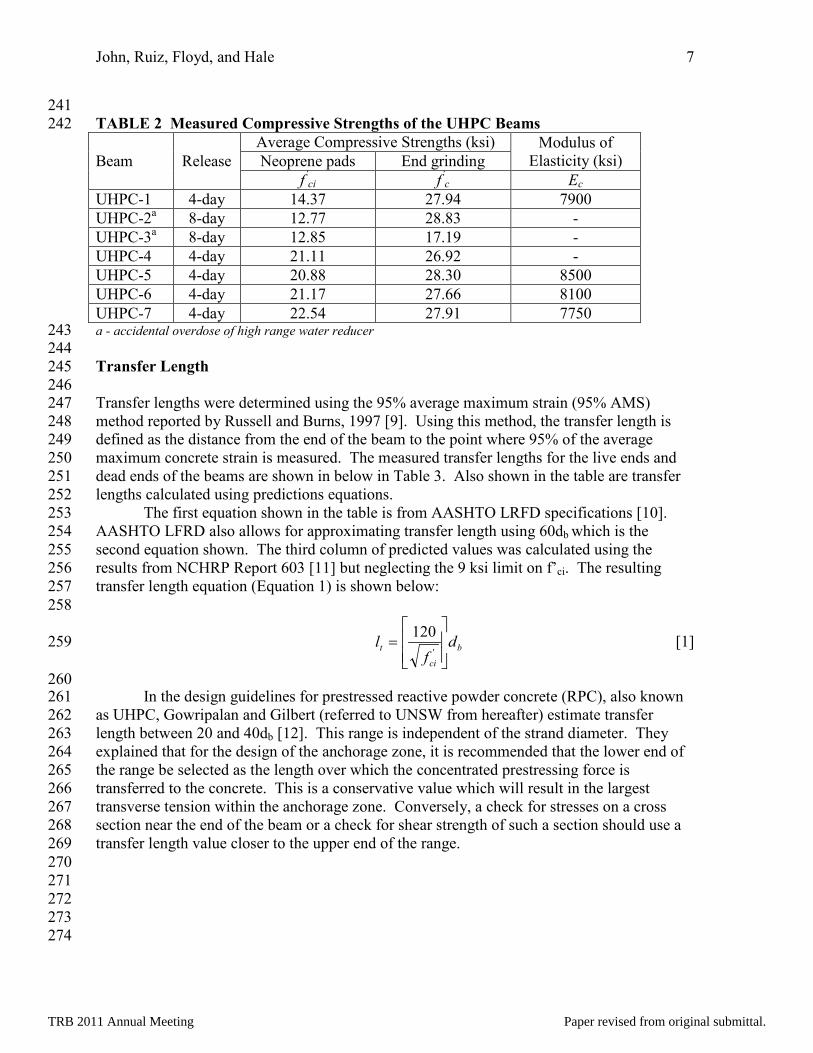
207 Prestress Loss Evaluation 208 209 To measure prestress losses, the beams were instrumented with vibrating wire strain gages 210 (VWSG). The VWSG were placed at the center of gravity of the prestressing strands and 211 located at midspan in six of the seven beams. For the seventh beam, the gage was located 212 slightly off center, approximately 8 ft from one end. Readings were taken before strand 213 release, immediately after strand release, and periodically for approximately 60 days after 214 casting. 215 216 RESULTS 217 218 Material Properties 219 220 The material properties of the seven beams are shown below in Table 2. Also shown in 221 Table 2 is the day when the prestressing strands were released. Due to weather related issues 222 and an accidental overdose of HRWR, the strands were released at 4 or 8 days of age. The 223 compressive strength at release (f’ci), measured using 4 x 8 in. cylindrical specimens, ranged 224 from 12.77 ksi to 22.54 ksi. At the time of testing, the researchers did not have access to an 225 end grinder, and therefore the cylinders were tested using end caps containing neoprene pads. 226 This explains the large amount of scatter in the data. Replicate cylinders were end ground 227 and tested and these results are labeled f’c in the table below. These cylinders were tested 228 approximately five months after the beams were cast. Excluding specimens from Beam 229 UHPC-3, which never recovered from an overdose of HRWR, the compressive strengths 230 were between 26.92 ksi to 28.83 ksi. The modulus of elasticity for beams UHPC-1, 5, 6, and 231 7 ranged from 7750 ksi to 8500 ksi. These were measured following the release of prestress. 232 233 234 235 236 237 238 239 240
TRB 2011 Annual Meeting Paper revised from original submittal.
John, Ruiz, Floyd, and Hale 7
241 TABLE 2 Measured Compressive Strengths of the UHPC Beams 242
Beam Release Average Compressive Strengths (ksi) Modulus of
Elasticity (ksi) Neoprene pads End grinding f’
ci f’c Ec
UHPC-1 4-day 14.37 27.94 7900 UHPC-2a 8-day 12.77 28.83 - UHPC-3a 8-day 12.85 17.19 - UHPC-4 4-day 21.11 26.92 - UHPC-5 4-day 20.88 28.30 8500 UHPC-6 4-day 21.17 27.66 8100 UHPC-7 4-day 22.54 27.91 7750 a - accidental overdose of high range water reducer 243 244 Transfer Length 245 246 Transfer lengths were determined using the 95% average maximum strain (95% AMS) 247 method reported by Russell and Burns, 1997 [9]. Using this method, the transfer length is 248 defined as the distance from the end of the beam to the point where 95% of the average 249 maximum concrete strain is measured. The measured transfer lengths for the live ends and 250 dead ends of the beams are shown in below in Table 3. Also shown in the table are transfer 251 lengths calculated using predictions equations. 252
The first equation shown in the table is from AASHTO LRFD specifications [10]. 253 AASHTO LFRD also allows for approximating transfer length using 60db which is the 254 second equation shown. The third column of predicted values was calculated using the 255 results from NCHRP Report 603 [11] but neglecting the 9 ksi limit on f’ci. The resulting 256 transfer length equation (Equation 1) is shown below: 257 258
b
ci
t df
l
=
'
120 [1] 259
260 In the design guidelines for prestressed reactive powder concrete (RPC), also known 261
as UHPC, Gowripalan and Gilbert (referred to UNSW from hereafter) estimate transfer 262 length between 20 and 40db [12]. This range is independent of the strand diameter. They 263 explained that for the design of the anchorage zone, it is recommended that the lower end of 264 the range be selected as the length over which the concentrated prestressing force is 265 transferred to the concrete. This is a conservative value which will result in the largest 266 transverse tension within the anchorage zone. Conversely, a check for stresses on a cross 267 section near the end of the beam or a check for shear strength of such a section should use a 268 transfer length value closer to the upper end of the range. 269 270 271 272 273 274
TRB 2011 Annual Meeting Paper revised from original submittal.

John, Ruiz, Floyd, and Hale 8
275 276 TABLE 3 Measured and Predicted Transfer Lengths 277
Beam fpe (ksi)
at 28 days
Measured Values (in.)
Predicted Values (in.)
(fpe/3)db1 60db
1 6032 20db3 40db
3 live end
dead end
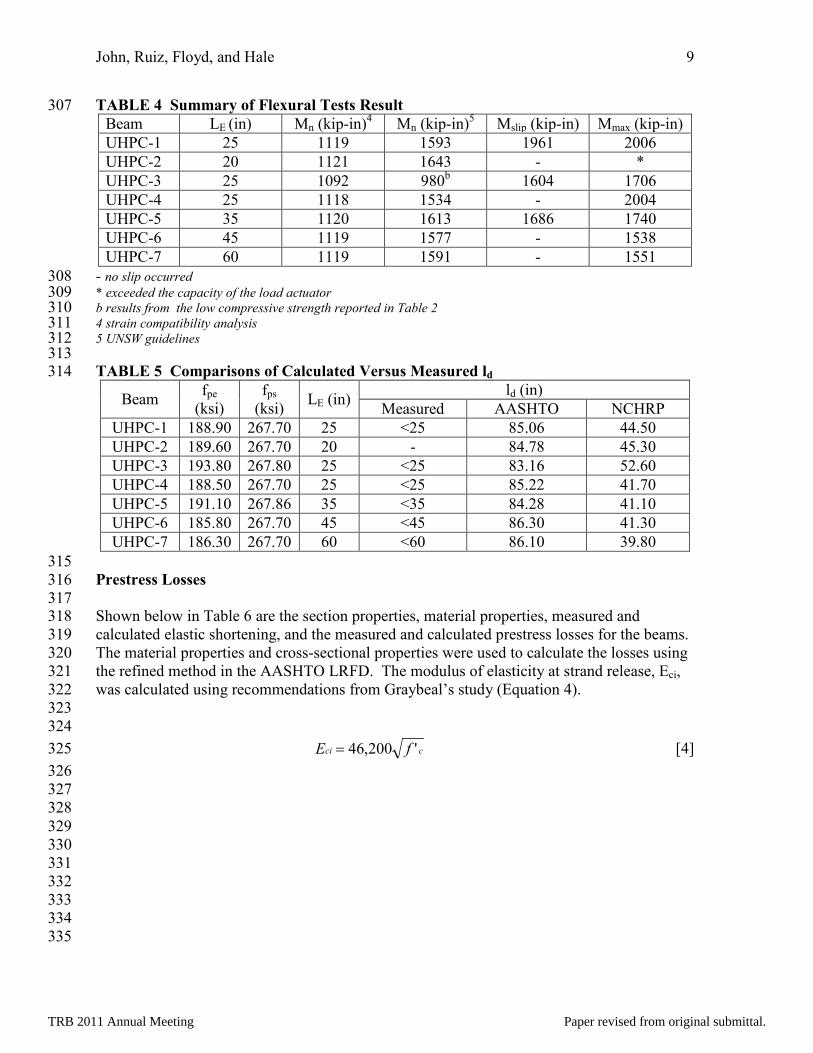
UHPC-1 188.9 16 11 37.8 36.0 19.0 12.0 24.0 UHPC-2 189.6 17 18 37.9 36.0 20.2 12.0 24.0 UHPC-3 193.8 16 15 38.8 36.0 20.1 12.0 24.0 UHPC-4 188.5 16 14 37.7 36.0 15.7 12.0 24.0 UHPC-5 191.1 12 12 38.2 36.0 15.8 12.0 24.0 UHPC-6 185.8 14 11 37.2 36.0 15.7 12.0 24.0 UHPC-7 186.3 14 13 37.3 36.0 15.2 12.0 24.0 1 = AASHTO Eqn. 278 2 = NCHRP Report 603 Eqn. 279 3= University of New South Wales Eqn. 280 281 Development length 282 283 The results of the development length tests are summarized in Table 4. In the table are 284 values for nominal capacity (Mn), maximum moment (Mmax) attained by the beams during 285 testing, and moment (Mslip) when strand slip occurred. Two methods were used to calculate 286 nominal moment capacity; strain compatibility and the UNSW guidelines. It can be seen that 287 the values obtained using strain compatibility are overly conservative. This can be explained 288 by the fact that the strain compatibility analysis does not account for the material’s ability to 289 carry load in tension while the UNSW procedure does. The values of Mn obtained from the 290 UNSW procedure are much closer to the measured maximum moment (Mmax). Development 291 lengths were calculated using the AASHTO LRFD Bridge Design Specifications (Equation 292 2) and the recommendations of NCHRP Report 603 (Equation 3). Once again, the 293 compressive strength limitations are neglected in the NCHRP equation. The measured and 294 predicted values are shown in Table 5. 295 296
bpepsd dffl
−≥
32κ [2] 297
298
bb
cci
d ddff
l 100225120''
≥
+= [3] 299
300 301 302 303 304 305 306
TRB 2011 Annual Meeting Paper revised from original submittal.
John, Ruiz, Floyd, and Hale 9
TABLE 4 Summary of Flexural Tests Result 307 Beam LE (in) Mn (kip-in)4 Mn (kip-in)5 Mslip (kip-in) Mmax (kip-in) UHPC-1 25 1119 1593 1961 2006 UHPC-2 20 1121 1643 - * UHPC-3 25 1092 980b 1604 1706 UHPC-4 25 1118 1534 - 2004 UHPC-5 35 1120 1613 1686 1740 UHPC-6 45 1119 1577 - 1538 UHPC-7 60 1119 1591 - 1551
- no slip occurred 308 * exceeded the capacity of the load actuator 309 b results from the low compressive strength reported in Table 2 310 4 strain compatibility analysis 311 5 UNSW guidelines 312 313 TABLE 5 Comparisons of Calculated Versus Measured ld 314
Beam fpe (ksi)
fps (ksi) LE (in) ld (in)
Measured AASHTO NCHRP UHPC-1 188.90 267.70 25 <25 85.06 44.50 UHPC-2 189.60 267.70 20 - 84.78 45.30 UHPC-3 193.80 267.80 25 <25 83.16 52.60 UHPC-4 188.50 267.70 25 <25 85.22 41.70 UHPC-5 191.10 267.86 35 <35 84.28 41.10 UHPC-6 185.80 267.70 45 <45 86.30 41.30 UHPC-7 186.30 267.70 60 <60 86.10 39.80
315 Prestress Losses 316 317 Shown below in Table 6 are the section properties, material properties, measured and 318 calculated elastic shortening, and the measured and calculated prestress losses for the beams. 319 The material properties and cross-sectional properties were used to calculate the losses using 320 the refined method in the AASHTO LRFD. The modulus of elasticity at strand release, Eci, 321 was calculated using recommendations from Graybeal’s study (Equation 4). 322 323 324
cci fE '200,46= [4] 325 326 327 328 329 330 331 332 333 334 335
TRB 2011 Annual Meeting Paper revised from original submittal.
John, Ruiz, Floyd, and Hale 10
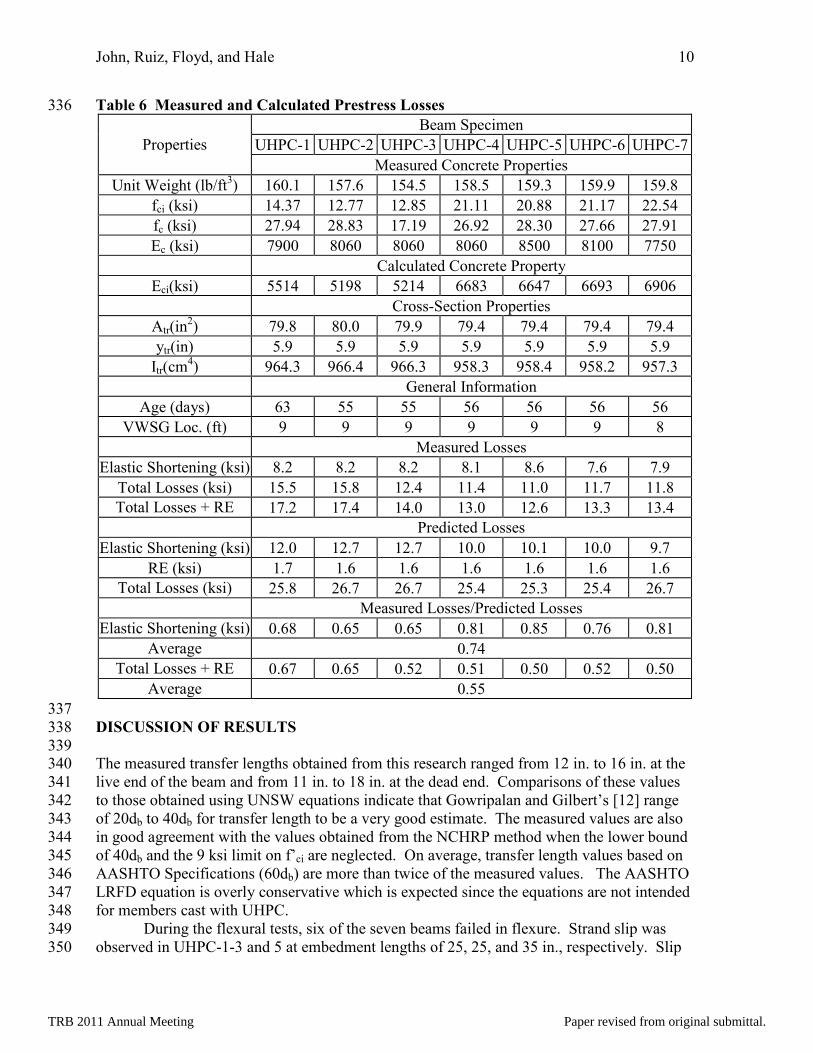
Table 6 Measured and Calculated Prestress Losses 336
Properties Beam Specimen
UHPC-1 UHPC-2 UHPC-3 UHPC-4 UHPC-5 UHPC-6 UHPC-7 Measured Concrete Properties
Unit Weight (lb/ft3) 160.1 157.6 154.5 158.5 159.3 159.9 159.8 fci (ksi) 14.37 12.77 12.85 21.11 20.88 21.17 22.54 fc (ksi) 27.94 28.83 17.19 26.92 28.30 27.66 27.91 Ec (ksi) 7900 8060 8060 8060 8500 8100 7750
Calculated Concrete Property Eci(ksi) 5514 5198 5214 6683 6647 6693 6906
Cross-Section Properties Atr(in2) 79.8 80.0 79.9 79.4 79.4 79.4 79.4 ytr(in) 5.9 5.9 5.9 5.9 5.9 5.9 5.9
Itr(cm4) 964.3 966.4 966.3 958.3 958.4 958.2 957.3 General Information
Age (days) 63 55 55 56 56 56 56 VWSG Loc. (ft) 9 9 9 9 9 9 8
Measured Losses Elastic Shortening (ksi) 8.2 8.2 8.2 8.1 8.6 7.6 7.9
Total Losses (ksi) 15.5 15.8 12.4 11.4 11.0 11.7 11.8 Total Losses + RE 17.2 17.4 14.0 13.0 12.6 13.3 13.4
Predicted Losses Elastic Shortening (ksi) 12.0 12.7 12.7 10.0 10.1 10.0 9.7
RE (ksi) 1.7 1.6 1.6 1.6 1.6 1.6 1.6 Total Losses (ksi) 25.8 26.7 26.7 25.4 25.3 25.4 26.7
Measured Losses/Predicted Losses Elastic Shortening (ksi) 0.68 0.65 0.65 0.81 0.85 0.76 0.81
Average 0.74 Total Losses + RE 0.67 0.65 0.52 0.51 0.50 0.52 0.50
Average 0.55 337 DISCUSSION OF RESULTS 338 339 The measured transfer lengths obtained from this research ranged from 12 in. to 16 in. at the 340 live end of the beam and from 11 in. to 18 in. at the dead end. Comparisons of these values 341 to those obtained using UNSW equations indicate that Gowripalan and Gilbert’s [12] range 342 of 20db to 40db for transfer length to be a very good estimate. The measured values are also 343 in good agreement with the values obtained from the NCHRP method when the lower bound 344 of 40db and the 9 ksi limit on f’ci are neglected. On average, transfer length values based on 345 AASHTO Specifications (60db) are more than twice of the measured values. The AASHTO 346 LRFD equation is overly conservative which is expected since the equations are not intended 347 for members cast with UHPC. 348 During the flexural tests, six of the seven beams failed in flexure. Strand slip was 349 observed in UHPC-1-3 and 5 at embedment lengths of 25, 25, and 35 in., respectively. Slip 350
TRB 2011 Annual Meeting Paper revised from original submittal.
John, Ruiz, Floyd, and Hale 11
occurred when the applied moment was in excess of Mn (using strain compatibility) by more 351 than 50%. When using UNSW guidelines, slip occurred at moments 8 and 26% greater than 352 the calculated capacity. The results indicated that the development length is between 25 and 353 35 in. which is similar to the 37 in. obtained by Graybeal [5]. The measured ld values 354 represents less than 50% of the ld estimates based on the AASHTO Specifications but 355 correlate fairly well with ld estimates based on NCHRP report 603 (neglecting the strength 356 limitations and the limit of 100 db). 357
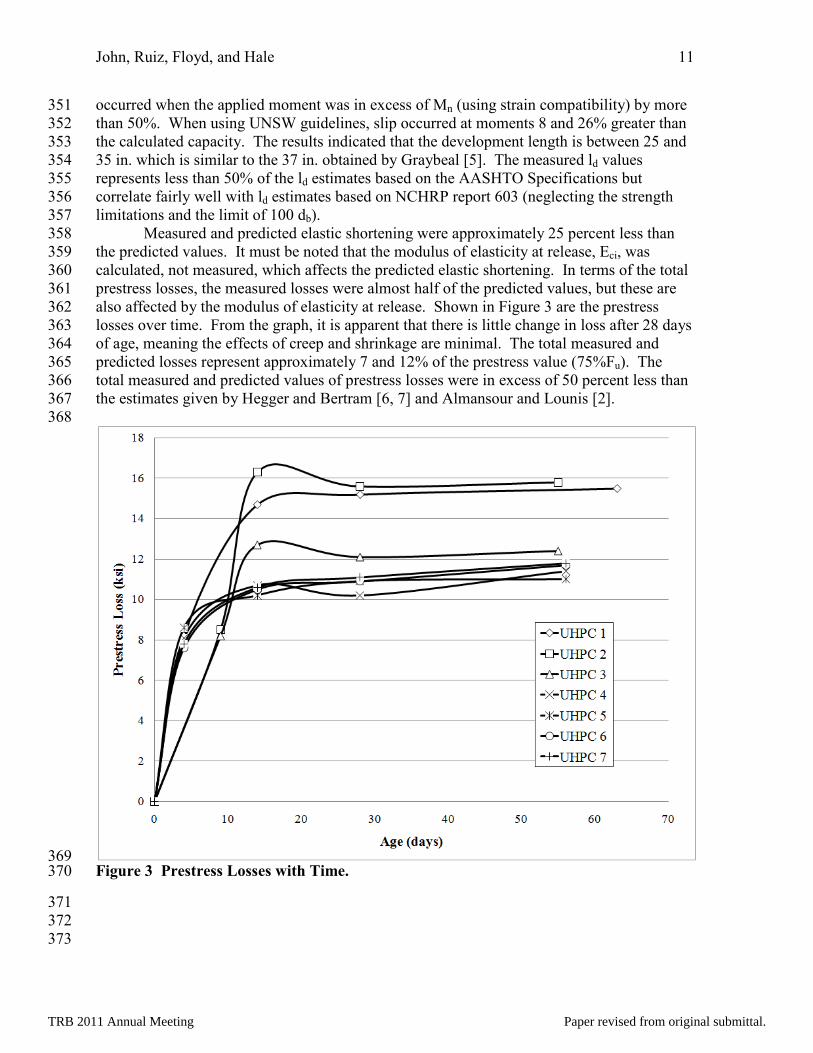
Measured and predicted elastic shortening were approximately 25 percent less than 358 the predicted values. It must be noted that the modulus of elasticity at release, Eci, was 359 calculated, not measured, which affects the predicted elastic shortening. In terms of the total 360 prestress losses, the measured losses were almost half of the predicted values, but these are 361 also affected by the modulus of elasticity at release. Shown in Figure 3 are the prestress 362 losses over time. From the graph, it is apparent that there is little change in loss after 28 days 363 of age, meaning the effects of creep and shrinkage are minimal. The total measured and 364 predicted losses represent approximately 7 and 12% of the prestress value (75%Fu). The 365 total measured and predicted values of prestress losses were in excess of 50 percent less than 366 the estimates given by Hegger and Bertram [6, 7] and Almansour and Lounis [2]. 367 368
369 Figure 3 Prestress Losses with Time. 370
371 372 373
TRB 2011 Annual Meeting Paper revised from original submittal.

John, Ruiz, Floyd, and Hale 12
CONCLUSIONS 374 375 The research program investigated the bond performance and prestress losses in UHPC using 376 7 rectangular beams. The measured values of transfer and development lengths and prestress 377 losses were compared to estimated values based on the AASHTO LRFD Bridge Design 378 Specifications, the University of New South Wales (UNSW) Guidelines, and 379 recommendations from NCHRP Report 603. The research reveals that there is an 380 improvement in bond performance between prestressing strands and UHPC. This is evident 381 from an average measured transfer length of 14in. and a development length less than 35in. 382 The range of 20 to 40db for transfer length in UHPC, outlined in the UNSW design 383 guidelines, appears to be a good estimate. However, a more conservative approach would be 384 application of the NCHRP recommended equation for ld neglecting the lower limit of 40db 385 and the compressive strength limitations. Prestress losses due to elastic shortening can be 386 reasonably approximated using the AASHTO LRFD Bridge Design Specifications. Based on 387 the losses measured in this research, it appears that creep and shrinkage contribute little to 388 total losses. Gowripalan and Graybeal mentioned creep and shrinkage strains in UHPC are 389 significant during the period of steam treatment. Thereafter, both creep and shrinkage strains 390 are reduced to negligible amounts. A similar conclusion was reached in this research based 391 on the results summarized in Figure 3. 392 393 ACKNOWLEDGEMENT 394 395 Thanks to Edmundo Ruiz, Nam Do, Blake Staton, Andy Tackett, and Royce Floyd for 396 performing the tests outlined in this research. Also, thanks to the Arkansas State Highway 397 and Transportation Department and the Mack Blackwell Transportation Center for providing 398 some of the support for the research. Thanks to Lafarge North America Inc. and Insteel 399 Industries Inc. for providing the materials used in the study. 400 401 REFERENCE 402 403
1. Graybeal, B. Material Property Characterization of Ulta-High Performance 404 Concrete. Publication FHWA-HRT-06-103. FHWA, U.S. Department of 405 Transportation, 2006. 406
2. Almansour, H. and Z. Lounis. Design of Prestressed UHPFRC Girder Bridges 407 According to Canadian Highway Bridge Design Code. Publication NRCC-51413, 408 National Research Council Canada, November 2009. 409
3. Bierwagen, D. and A. Abu-Hawash. Ultra-high Performance Concrete in Iowa. HPC 410 Bridge Views, Sept/Oct 2009, Issue 57, pp. 1-2. 411
4. Lubbers, A. Bond Performance between Ultra-High Performance Concrete and 412 Prestressing Strands. Master of Science Thesis, College of Engineering and 413 Technology of Ohio University, August 2003, pp. 155. 414
5. Graybeal, B. Structural Behavior of Ultra-High Performance Concrete Prestressed I-415 Girders. Publication FHWA-HRT-06-115. FHWA, U.S. Department of 416 Transportation, August 2006. 417
TRB 2011 Annual Meeting Paper revised from original submittal.
John, Ruiz, Floyd, and Hale 13
6. Hegger, J. and G. Bertram. Shear Carrying Capacity of steel Fiber Reinforced 418 UHPC. Proceedings, Second International Symposium on Ultra-High Performance 419 Concrete, Kassel, Germany, 2008. 420
7. Hegger, J. and G. Bertram. Anchorage Behavior of Pretensioned Strands in Steel 421 Fiber Reinforced UHPC. Proceedings, Second International Symposium on Ultra-422 High Performance Concrete, Kassel, Germany, 2008. 423
8. Ruiz, E., Do, N., Staton, B., and Hale, W. Preliminary Investigation into the Use of 424 UHPC in Prestressed Members. Proceedings, PCI National Bridge Conference, 425 Phoenix, AZ, 2007. 426
9. Russell, B. W. and N. H. Burns. Measurement of Transfer Lengths on Pretensioned 427 Concrete Elements. Journal of Structural Engineering, May 1997, pp. 541-549. 428
10. AMERICAN ASSOCIATION OF STATE HIGHWAY AND TRANSPORTATION 429 OFFICIALS. AASHTO LRFD Bridge Design Specification. 2007, 4th Edition 430
11. Ramirez, J. and B. Russell. Transfer, Development, and Splice Length for 431 Strand/Reinforcement in High-Strength Concrete. Publication NCHRP 603, 432 Transportation Research Board, Washington D.C, May 2008. 433
12. Gowripalan, N. and R. I. Gilbert. Design guidelines for RPC prestressed concrete 434 beams. The University of New South Wales, January 2000. 435
436 437 438
TRB 2011 Annual Meeting Paper revised from original submittal.