transcriptional control of floral anthocyanin pigmentation
TRANSCRIPT

Transcriptional control of floral anthocyanin pigmentation inmonkeyflowers (Mimulus)
Yao-Wu Yuan1,2, Janelle M. Sagawa1,2, Laura Frost1, James P. Vela1 and Harvey D. Bradshaw Jr1
1Department of Biology, University of Washington, Seattle, WA 98195, USA; 2Department of Ecology and Evolutionary Biology, University of Connecticut, Storrs, CT 06269, USA
Authors for correspondence:Yao-Wu YuanTel: +1 860 486 3469
Email: [email protected]
Harvey D. Bradshaw JrTel: +1 206 616 1796
Email: [email protected]
Received: 9 June 2014Accepted: 5 July 2014
New Phytologist (2014) 204: 1013–1027doi: 10.1111/nph.12968
Key words: anthocyanin pigmentation,autoregulation, flower color, monkeyflowers(Mimulus), MYB-bHLH-WD40, naturalvariation, phenotypic evolution.
Summary
� A molecular description of the control of floral pigmentation in a multi-species group
displaying various flower color patterns is of great interest for understanding the molecular
bases of phenotypic diversification and pollinator-mediated speciation.� Through transcriptome profiling, mutant analyses and transgenic experiments, we aim to
establish a ‘baseline’ floral anthocyanin regulation model in Mimulus lewisii and to examine
the different ways of tinkering with this model in generating the diversity of floral anthocyanin
patterns in otherMimulus species.� We find oneWD40 and one bHLH gene controlling anthocyanin pigmentation in the entire
corolla of M. lewisii and two R2R3-MYB genes, PELAN and NEGAN, controlling anthocyanin
production in the petal lobe and nectar guide, respectively. The autoregulation of NEGAN
might be a critical property to generate anthocyanin spots. Independent losses of PELAN
expression (via different mechanisms) explain two natural yellow-flowered populations of
M. cardinalis (typically red-flowered). The NEGAN ortholog is the only anthocyanin-activating
MYB expressed in theM. guttatus flowers.� The mutant lines and transgenic tools available for M. lewisii will enable gene-by-gene
replacement experiments to dissect the genetic and developmental bases of more complex
floral color patterns, and to test hypotheses on phenotypic evolution in general.
Introduction
Flower color produces some of the most beautiful displays innature, and serves an important function in the ecology andevolution of plants by attracting animal pollinators (Glover,2007; Davies et al., 2012). Many closely related plant speciesdisplay dramatically different floral color patterns, and in somecases the flower color or pattern change may have produced a pol-linator shift that leads to reproductive isolation and speciation(Bradshaw & Schemske, 2003; Hoballah et al., 2007; Streisfeldet al., 2013). A molecular description of the control of floralpigmentation in a multi-species group displaying various flowercolors and patterns would, therefore, be of great interest forunderstanding the molecular bases underlying phenotypic diver-sification, plant–pollinator interactions and pollinator-mediatedspeciation. The monkeyflower genus, Mimulus, provides anexcellent study system for such an endeavor.
The genus Mimulus contains 160–200 species that exhibitastonishing flower color variation (Fig. 1) and has been the sub-ject of intensive ecological and evolutionary studies for over 60 yr(Hiesey et al., 1971; Beardsley et al., 2004; Wu et al., 2008). Inthe past decade a wealth of genomic and genetic resources as wellas functional tools have been developed for multiple species inthe genus (Wu et al., 2008; Cooley et al., 2011; Hellsten et al.,2013; Streisfeld et al., 2013; Yuan et al., 2013a,b), enabling
in-depth genetic and developmental analyses of this traditionallyecological and evolutionary model system.
Two major pigment types determine flower color in Mimulus:anthocyanins are responsible for the pink/purple color and carot-enoids for the yellow (Vickery & Olson, 1956; Hiesey et al.,1971; Streisfeld & Kohn, 2005; Cooley & Willis, 2009; Yuanet al., 2013b). A combination of the two pigment types oftenresult in red color, as in the petal lobes of M. cardinalis and thespots on the corolla throat ofM. guttatus (Fig. 1).
The core enzymes involved in both anthocyanin and caroten-oid biosyntheses have been well characterized (reviewed in Grote-wold, 2006; Glover, 2007; Ruiz-Sola & Rodriguez-Concepcion,2012). The diversity of flower color in nature is largely deter-mined by when and where these enzymes are expressed (i.e. tran-scriptional regulation of these enzymes) (Schwinn et al., 2006;Glover, 2007; Shang et al., 2011; Martins et al., 2013). While thetranscriptional control of anthocyanin biosynthetic enzymes hasbeen elucidated in multiple plant species (Paz-Ares et al., 1987;Ludwig et al., 1989; Goodrich et al., 1992; Quattrocchio et al.,1998; Walker et al., 1999; Borevitz et al., 2000; Spelt et al., 2000;Schwinn et al., 2006; Albert et al., 2011, 2014; reviewed in Koeset al., 2005; Hichri et al., 2011; Davies et al., 2012), the regula-tion of carotenoid biosynthetic pathway in flowers is littleknown (Grotewold, 2006; Glover, 2007; Ruiz-Sola & Rodriguez-Concepcion, 2012). As such, anthocyanin pigmentation provides
� 2014 The Authors
New Phytologist� 2014 New Phytologist Trust
New Phytologist (2014) 204: 1013–1027 1013www.newphytologist.com
Research

a more suitable platform at the moment to understand thegenetic and developmental bases of natural variation between dif-ferent species (Sobel & Streisfeld, 2013).
The anthocyanin biosynthetic pathway (ABP) contains atleast six essential structural genes encoding core enzymes:
Chalcone synthase (CHS ), Chalcone isomerase (CHI ), Flavonoid3-hydroxylase (F3H ), Dihydroflavonol 4-reductase (DFR ),Anthocyanidin synthase (ANS ) and UDP-3-O-glucosyltransferases(UF3GT ). In maize (Zea mays), Petunia and Arabidopsis, ahighly conserved MYB-bHLH-WD40 (MBW) protein complex
M. lewisii
M. suksdorfiiM. palmeri M. shevockii
M. mephiticusM. constrictus M. layneae
M. angustatus
M. pictus
M. kelloggiiM. pulchellus
M. aurantiacus (red) M. aurantiacus (yellow)
M. norrisiiM. guttatus M. luteus var. variegatus
M. cardinalis M. filicaulis
Fig. 1 Natural flower color variation amongMimulus species. Shown on the left is aschematic illustration of the phylogeneticrelationships among majorMimulus clades,based on Beardsley et al. (2004) andGrossenbacher &Whittall (2011); on theright are representative species of each clade.Images ofM. norrisii,M. filicaulis,M. palmeri,M. shevockii,M. suksdorfii,M. layneae,M.mephiticus,M. angustatus
andM. pulchelluswere provided by DenaGrossenbacher; images ofM. aurantiacuswere provided by Matt Streisfeld; theremaining images were taken by Y-W.Y.
New Phytologist (2014) 204: 1013–1027 � 2014 The Authors
New Phytologist� 2014 New Phytologist Trustwww.newphytologist.com
Research
NewPhytologist1014
has been shown to coordinately activate all or some of the ABPstructural genes (Paz-Ares et al., 1987; Ludwig et al., 1989; deVetten et al., 1997; Quattrocchio et al., 1999; Walker et al.,1999; Borevitz et al., 2000; Spelt et al., 2000; Zhang et al.,2003; Carey et al., 2004). In Antirrhinum majus flowers, threeclosely related R2R3-MYBs (Rosea1, Rosea2 and Venosa) and abHLH (Delila) protein coordinately activate at least four ABPgenes (F3H, DFR, ANS and UF3GT) (Martin et al., 1991;Goodrich et al., 1992; Schwinn et al., 2006), but the WD40component has yet to be identified. The MYB and bHLH pro-teins represent the two largest transcription factor families inflowering plants (Feller et al., 2011). The anthocyanin-activatingMYBs and bHLHs belong to subgroup 6 of the R2R3-MYBfamily and subgroup IIIf of the bHLH family, respectively(Stracke et al., 2001; Heim et al., 2003; Feller et al., 2011).More recently, a group of single-repeat R3-MYBs has beenshown to negatively regulate ABP gene expression by competingwith the R2R3-MYB activators for the limited supply of bHLHproteins (Zhu et al., 2009; Nakatsuka et al., 2013; Yuan et al.,2013a; Albert et al., 2014).
The conserved nature of the ABP enzymes and their MBWregulators across flowering plants has enabled a number of inves-tigations on the genetic control of floral anthocaynin pigmenta-tion in nonmodel organisms, including Phalaenopsis orchids (Maet al., 2009), Asiatic hybrid lilies (Lilium spp.) (Yamagishi et al.,2010, 2014), morning glories (Ipomoea spp.) (Des Marais &Rausher, 2010), Iochroma spp. (Smith & Rausher, 2011), Phloxdrummondii (Hopkins & Rausher, 2011) and Clarkia gracilis(Martins et al., 2013). These studies provide valuable informa-tion on the potential players involved in flower color diversifica-tion in a wide range of angiosperm lineages. However, due to thelack of genetic resources or/and functional tools, reaching adeeper understanding of the precise molecular bases and develop-mental mechanisms that generate floral anthocyanin patterns(e.g. spots, stripes) or cause flower color variation between spe-cies, remains a formidable task in most of these systems.
Here we describe the major transcriptional regulators of ABPgenes in the pink flowered Mimulus lewisii (Fig. 1), an emergingmodel system particularly suitable for studying the developmen-tal genetics of ecologically important floral traits (Yuan et al.,2013a,b). Through transcriptome profiling, mutant analyses andtransgenic experiments, we find one WD40 (MlWD40a) and onebHLH (MlANbHLH1) gene controlling anthocyanin biosynthe-sis in the entire corolla of M. lewisii; one R2R3-MYB, namedPetal Lobe Anthocyanin (PELAN), controlling anthocyanin bio-synthesis in the petal lobe, and another R2R3-MYB, namedNectar Guide Anthocyanin (NEGAN ), controlling anthocyaninspot formation in the nectar guide. NEGAN, but not PELAN, isinvolved in an autoregulatory feedback loop, which might be acritical property required for the ‘spot’ pattern formation. Fur-thermore, using the M. lewisii model we demonstrate that twoindependent losses of PELAN expression (via different mecha-nisms) explain the yellow flower color of two natural populationsof M. cardinalis (usually red-flowered), which is the sister speciesof M. lewisii. Our M. lewisii model also explains the M. guttatusanthocyanin pattern by successfully predicting the NEGAN
ortholog as the only anthocyanin-activating MYB expressed inthe predominantly yellowM. guttatus flowers.
Materials and Methods
Plant materials and growth conditions
The Mimulus lewisii inbred line LF10 and M. cardinalis inbredline CE10 were described in Yuan et al. (2013a). The M. lewisiiboo mutants were generated by ethyl methanesulfonate (EMS)mutagenesis in the LF10 background (Owen & Bradshaw,2011). Seeds of two natural yellow-flowered M. cardinalis strains,SM and CI, collected from the Siskiyou Mountains of Oregon(US) and Cedros Island (Baja California, Mexico), respectively,were provided by Bob Vickery (University of Utah). Seeds ofM. guttatus inbred line IM767 were provided by John Willis(Duke University). Plants were grown in the University of Wash-ington and University of Connecticut glasshouses under similarconditions as described in Yuan et al. (2013a).
Transcriptome sequencing and analyses
In order to obtain a comprehensive view of the expression profileof the ABP genes and their putative transcriptional regulators inthe M. lewisii LF10 flowers, we isolated total RNA from thecorolla of 15-mm flower buds (3 d before opening) for transcrip-tome sequencing. The 15-mm corolla stage is the intermediatestage between when anthocyanins first become visible (10-mm,6 d before opening) and flower opening (Yuan et al., 2013a) –not too early to capture ABP gene expression and not too late tocapture the expression of their transcriptional regulators.
The RNA-Seq library was prepared at the University of NorthCarolina High-Throughput Sequencing Facility (UNC-HTSF)using the Illumina (San Diego, CA, USA) TruSeq RNA SamplePreparation Kit v2. Briefly, mRNA was first purified from 2 lgof total RNA using oligo-dT attached magnetic beads, and thencleaved into 200-bp pieces under elevated temperature. Theresulting RNA fragments were primed with random hexamersand were reverse transcribed into first strand cDNA, followed bysecond strand cDNA synthesis. The double strand cDNA wasend repaired and A-tailed, and then ligated to adapters for PCRenrichment to generate the final cDNA library for Illuminasequencing at the UNC-HTSF.
The resulting c. 85 million 100-bp paired-end RNA-Seq reads(NCBI Sequence Read Archive PRJNA232780: SRX403785)were assembled into 80 602 contigs (N50 = 1.4 kb; averagelength = 834 bp) using CLC Genomics Workbench (Qiagen,Venlo, Netherlands) with default de novo assembly parameters.We then mapped the RNA-Seq reads to the de novo transcriptomeassembly (available from http://www.eeb.uconn.edu/people/yuan/resources) to determine the RPKM expression value (Mort-azavi et al., 2008) of each transcript using the CLC GenomicsWorkbench ‘RNA-Seq Analysis’ tool, with the minimum readlength fraction set to 0.9 and minimum similarity set to 0.97.
Previously characterized ABP genes and their MBW regulatorsfrom Arabidopsis were used as queries (Table 1) to retrieve the
� 2014 The Authors
New Phytologist� 2014 New Phytologist TrustNew Phytologist (2014) 204: 1013–1027
www.newphytologist.com
NewPhytologist Research 1015

corresponding transcripts from the LF10 de novo transcriptomeassembly by TBLASTN searches (Altschul et al., 1997). To com-plement the transcriptome data, we also used the same querysequences to search against the genome assembly generated in aprevious study (Yuan et al., 2013a). The genomic copies of thesegenes were annotated and the sequences were deposited inGenBank (accession numbers are listed in Table 1).
Phylogenetic analyses
Multiple sequence alignments of R2R3-MYB and bHLH pro-teins were performed using MUSCLE (Edgar, 2004). Conservedregions of the alignments were selected using Gblocks (Talavera& Castresana, 2007) for subsequent phylogenetic analyses. Maxi-mum likelihood (ML) analyses were conducted using RAxML7.0.4 (Stamatakis, 2006), with the JTT amino acid substitutionmatrix and the GAMMA model of rate heterogeneity. Cladesupport was estimated by 200 bootstrap replicates.
Expression analyses by RT-PCR
Total RNA was isolated using the Spectrum Plant Total RNAKit (Sigma-Aldrich) and then treated with amplification gradeDNaseI (Invitrogen). cDNA was synthesized from 1 lg of theDNase-treated RNA using the SuperScript III First-Strand Syn-thesis System for RT-PCR (Invitrogen), then diluted 40-foldbefore PCR. The Mimulus ortholog of At5g25760/Ubiquitin-Conjugating Enzyme (UBC) was used as a reference gene asdescribed in Yuan et al. (2013a). Gene-specific primers used forRT-PCR are listed in Supporting Information Table S1. Quanti-tative RT-PCR was performed using iQ SYBR Green Supermix
(Bio-Rad) in a CFX96 Touch Real-Time PCR Detection System(Bio-Rad). Samples were amplified for 40 cycles of 95°C for 15 sand 60°C for 30 s. Reactions were run with three biological repli-cates and two technical replicates. Amplification efficiencies foreach primer pair were determined using critical threshold valuesobtained from a dilution series (1 : 4, 1 : 20, 1 : 100, 1 : 500).
Candidate gene sequencing of the boomutants
The transcriptome analyses revealed one WD40, one bHLH andone R2R3-MYB as potential candidate genes encoding the majortranscriptional regulators. To examine whether these genes har-bor mutations in the four boo mutant lines that were identified aspotential loss-of-function mutants of the MBW complex (see theResults section), full-length coding DNA sequences (CDS) ofthese candidate genes were amplified from the boo cDNAs. PCRproducts were treated with ExoSAP-IT (USB/Affymetrix, SantaClara, CA, USA) and sequenced using the BigDyeTerminatorv3.1 system (Applied Biosystems, Foster City, CA, USA) follow-ing the manufacturers’ protocols. Primers used for amplificationand sequencing are listed in Table S2.
Transgenic experiments
RNAi plasmids were constructed with a 133–350-bp fragmentamplified from the coding regions of MlWD40a, MlANbHLH1,PELAN and NEGAN (Table S3), essentially following the proto-col described in Yuan et al. (2013a). To ensure target specificity,the fragment included in each RNAi plasmid was BLASTedagainst the LF10 genome assembly with an E-value cutoff of 0.1so that no other genomic regions perfectly match this fragmentfor a contiguous block longer than 16 bp. For PELAN, it was notpossible to find a contiguous region longer than 100 bp in thecoding region fulfilling this criterion. Therefore, we connectedtwo shorter fragments (75 and 68 bp) with the required specific-ity by bridge PCR (Table S3).
In order to test whether NEGAN is self-activated, we generatedan over-expression plasmid by cloning the 804-bp full-lengthNEGAN CDS (without the stop codon; Table S3) into the pEar-leyGate 103 vector (Earley et al., 2006; Arabidopsis BiologicalResource Center, CD3-685), following Earley et al. (2006). Thisvector drives the expression of the transgene by the CaMV 35Spromoter.
The final plasmid constructs were verified by sequencing andthen transformed into Agrobacterium tumefaciens strain GV3101for subsequent plant transformation, as described in Yuan et al.(2013a).
Results
Identification of the putative ABP structural genes andMBW regulatory genes by BLAST searches
BLAST searches against the LF10 15-mm corolla transcriptomeidentified one copy of each of the six ABP structural genes(MlCHSa, MlCHI, MlF3Ha, MlDFR, MlANS and MlUF3GT)
Table 1 Gene expression profile from theMimulus lewisii LF10 15-mmcorolla transcriptome
Query GeneGenBankacc. no.
Expressionvalue (RPKM)
TT4 (AT5G13930) MlCHSa KJ011133 2696.65MlCHSb KJ595581 0MlCHSc KJ595582 0
TT5 (AT3G55120) MlCHI KJ011134 465.19TT6 (AT3G51240) MlF3Ha KJ011135 368.86
MlF3Hb KJ595583 49.33TT3 (AT5G42800) MlDFR KJ011136 188.31TT18 (AT4G22880) MlANS KJ011137 305.36UF3GT (AT5G54060) MlUF3GT KJ011138 571.61TTG1 (AT5G24520) MlWD40a KJ011139 30.34
MlWD40b KJ011140 3.08MlWD40c KJ011141 5.78
GL3 (AT5G41315),EGL3 (AT1G63650),TT8 (AT4G09820)
MlANbHLH1 KJ011142 75.95MlANbHLH2 KJ011143 12.55MlANbHLH3 KJ789366 0
PAP1 (AT1G56650),PAP2 (AT1G66390)
PELAN KJ011144 124.83NEGAN KJ011145 8.56PELAN-L1 KJ595584 0PELAN-L2 KJ595585 0PELAN-L3 KJ595586 0
The genes with ‘0’ RPKM values are found in the genome assembly, butnot in the transcriptome.
New Phytologist (2014) 204: 1013–1027 � 2014 The Authors
New Phytologist� 2014 New Phytologist Trustwww.newphytologist.com
Research
NewPhytologist1016
with high RPKM expression values, and an additional copy ofthe F3H gene (MlF3Hb) with relatively low RPKM value(Table 1). Searches against the LF10 genome assembly confirmedthe single copy of CHI, DFR, ANS and UF3GT, and the twoparalogs of F3H, but revealed two additional paralogs of CHS(MlCHSb and MlCHSc). RT-PCR across four corolla develop-mental stages (5-, 10-, 15- and 20-mm) suggests that MlCHSband MlCHSc are not expressed in the corolla (Supporting Infor-mation Fig. S1a), explaining the absence of these two copies inthe transcriptome. Furthermore, the RT-PCR experimentsshowed that MlF3Ha has much higher expression levels thanMlF3Hb in the 10- and 15-mm stages. MlF3Hb expression wasnot detectable until later stages (15- and 20-mm) (Fig. S1b).Because anthocyanin pigments already become visible in the10-mm corolla (Yuan et al., 2013a), we reasoned that MlF3Ha,not MlF3Hb, plays a primary role in anthocyanin biosynthesis inthe corolla. Taking these results together, we concluded thatMlCHSa, MlCHI, MlF3Ha, MlDFR, MlANS and MlUF3GT are
the six key ABP structural genes responsible for LF10 corollaanthocyanin pigmentation.
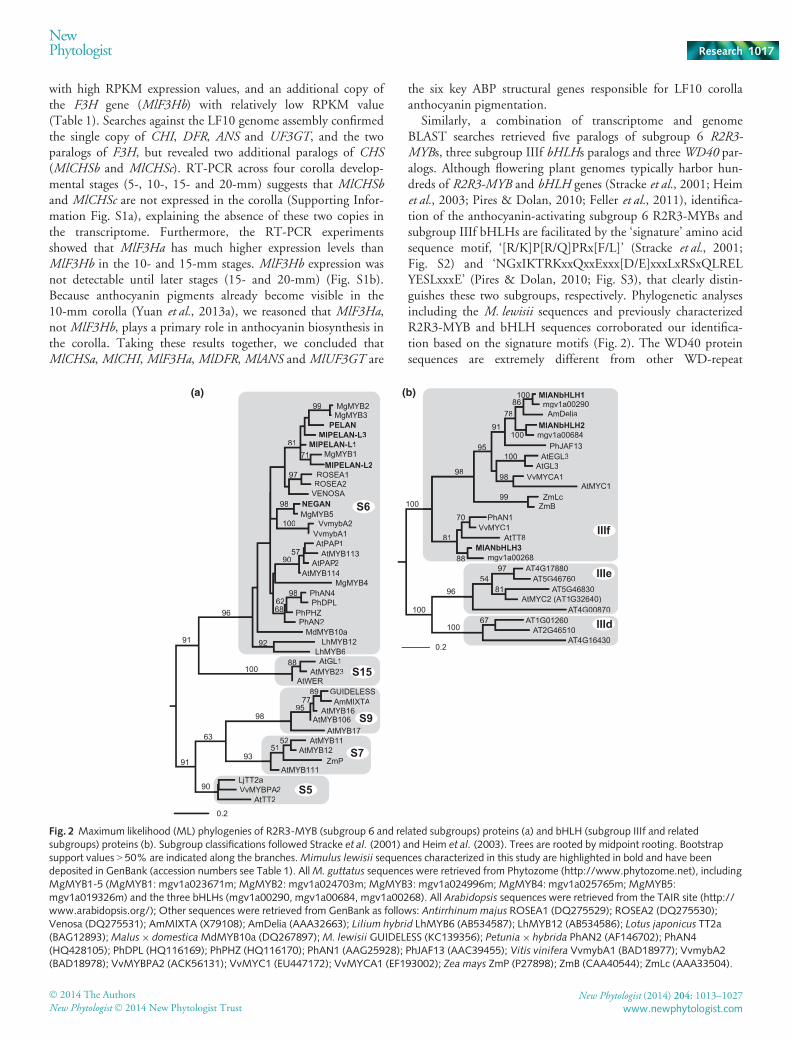
Similarly, a combination of transcriptome and genomeBLAST searches retrieved five paralogs of subgroup 6 R2R3-MYBs, three subgroup IIIf bHLHs paralogs and threeWD40 par-alogs. Although flowering plant genomes typically harbor hun-dreds of R2R3-MYB and bHLH genes (Stracke et al., 2001; Heimet al., 2003; Pires & Dolan, 2010; Feller et al., 2011), identifica-tion of the anthocyanin-activating subgroup 6 R2R3-MYBs andsubgroup IIIf bHLHs are facilitated by the ‘signature’ amino acidsequence motif, ‘[R/K]P[R/Q]PRx[F/L]’ (Stracke et al., 2001;Fig. S2) and ‘NGxIKTRKxxQxxExxx[D/E]xxxLxRSxQLRELYESLxxxE’ (Pires & Dolan, 2010; Fig. S3), that clearly distin-guishes these two subgroups, respectively. Phylogenetic analysesincluding the M. lewisii sequences and previously characterizedR2R3-MYB and bHLH sequences corroborated our identifica-tion based on the signature motifs (Fig. 2). The WD40 proteinsequences are extremely different from other WD-repeat
(b)(a)
0.2AT4G16430
AT2G46510AT1G01260
AT5G46830AT5G46760
AT4G17880
AT4G00870 AtMYC2 (AT1G32640)
AtMYC1
ZmBZmLc
PhJAF13
MlANbHLH2
MlANbHLH1100
100
100
100
100
100
86
88
81
8154
67
78
70
91
98
96
97
98
99
95
PhAN1
AmDelia
VvMYC1
VvMYCA1
AtTT8
AtGL3AtEGL3
MlANbHLH3mgv1a00268
mgv1a00684
mgv1a00290
AtMYC1
ZmBZmLc
PhJAF13
MlANbHLH2
MlANbHLH1100
100
100
86
88
81
78
70
91
9898
99
95
PhAN1
AmDelia
VvMYC1
VvMYCA1
AtTT8
AtGL3AtEGL3
MlANbHLH3mgv1a00268
mgv1a00684
mgv1a00290
IIIf
AT5G46830AT5G46760
AT4G17880
AT4G00870AtMYC2 (AT1G32640)
8154
97
AT4G16430AT2G46510
AT1G0126067
IIIe
IIId
MgMYB3
MgMYB4
MgMYB5
PhPHZ
AtMYB113AtPAP1
VvmybA1VvmybA2
AtPAP2AtMYB114
PhAN2MdMYB10a
LhMYB12LhMYB6AtGL1
AtMYB23
AtMYB16
AtMYB17AtMYB11
AtMYB111
VvMYBPA2AtTT2
0.2
LjTT2a
ZmPAtMYB12
AtMYB106
AtWERGUIDELESSAmMIXTA
PhAN4PhDPL
MgMYB1
ROSEA1
VENOSAROSEA2
MgMYB2
PELAN
MlPELAN-L1
MlPELAN-L2
MlPELAN-L3
NEGAN
90
98
98
98
99
97
8171
96
9057
92
100
100
88
93
63
6268
5251
91
91
9577
89
VvMYBPA2AtTT2
LjTT2aS5
AtMYB16
AtMYB17AtMYB106
GUIDELESSAmMIXTA
95777
89
S9
AtMYB11
AtMYB111ZmP
AtMYB1252
51
AtGL1AtMYB23
AtWER
88
MgMYB3
MgMYB4
MgMYB5
PhPHZ
AtMYB113AtPAP1
VvmybA1VvmybA2
AtPAP2AtMYB114
PhAN2MdMYB10a
LhMYB12LhMYB6
PhAN4PhDPL
MgMYB1
ROSEA1
VENOSAROSEA2
MgMYB2
PELAN
MlPELAN-L1
MlPELAN-L2
MlPELAN-L3
NEGAN
98
98
99
97
81717
9057
92
100
62268
S7
S15
S6
Fig. 2 Maximum likelihood (ML) phylogenies of R2R3-MYB (subgroup 6 and related subgroups) proteins (a) and bHLH (subgroup IIIf and relatedsubgroups) proteins (b). Subgroup classifications followed Stracke et al. (2001) and Heim et al. (2003). Trees are rooted by midpoint rooting. Bootstrapsupport values > 50% are indicated along the branches.Mimulus lewisii sequences characterized in this study are highlighted in bold and have beendeposited in GenBank (accession numbers see Table 1). AllM. guttatus sequences were retrieved from Phytozome (http://www.phytozome.net), includingMgMYB1-5 (MgMYB1: mgv1a023671m; MgMYB2: mgv1a024703m; MgMYB3: mgv1a024996m; MgMYB4: mgv1a025765m; MgMYB5:mgv1a019326m) and the three bHLHs (mgv1a00290, mgv1a00684, mgv1a00268). All Arabidopsis sequences were retrieved from the TAIR site (http://www.arabidopsis.org/); Other sequences were retrieved from GenBank as follows: Antirrhinum majus ROSEA1 (DQ275529); ROSEA2 (DQ275530);Venosa (DQ275531); AmMIXTA (X79108); AmDelia (AAA32663); Lilium hybrid LhMYB6 (AB534587); LhMYB12 (AB534586); Lotus japonicus TT2a(BAG12893);Malus9 domesticaMdMYB10a (DQ267897);M. lewisii GUIDELESS (KC139356); Petunia9 hybrida PhAN2 (AF146702); PhAN4(HQ428105); PhDPL (HQ116169); PhPHZ (HQ116170); PhAN1 (AAG25928); PhJAF13 (AAC39455); Vitis vinifera VvmybA1 (BAD18977); VvmybA2(BAD18978); VvMYBPA2 (ACK56131); VvMYC1 (EU447172); VvMYCA1 (EF193002); Zea mays ZmP (P27898); ZmB (CAA40544); ZmLc (AAA33504).
� 2014 The Authors
New Phytologist� 2014 New Phytologist TrustNew Phytologist (2014) 204: 1013–1027
www.newphytologist.com
NewPhytologist Research 1017

containing proteins, but highly conserved among WD40 mem-bers (Fig. S4). As such, the identification of WD40 sequences isstraightforward. The transcriptome profiling suggests that onlytwo of the five R2R3-MYB paralogs are expressed in the LF10corolla; one has much higher expression value than the other.Likewise, only one bHLH paralog and one WD40 paralog arepredominantly expressed in the corolla (Table 1). RT-PCR acrossdifferent corolla developmental stages confirmed the transcrip-tome results (Fig. S1c–e).
boo1, boo3, boo5 and boo14 are putative loss-of-functionmutants of the MBW regulatory complex
In order to determine whether these putative MBW genesretrieved from BLAST searches are actual transcriptional regula-tors of anthocyanin pigmentation in the M. lewisii flower, we setout to identify loss-of-function mutants of the MBW regulatorycomplex. We screened 12 recessive boo mutants with white flow-ers for coordinated downregulation of ABP structural genes. Therationale is that loss-of-function of one structural gene in thepathway should not affect the expression of other ABP genes,whereas loss-of-function of the MBW regulatory complex willlead to downregulation of multiple ABP genes simultaneously.Subsequent RT-PCR of the six key structural genes showed dra-matic downregulation of MlF3Ha, MlDFR and MlANS in fourof the 12 boo mutants (Fig. 3). Pair-wise complementationcrosses suggest that these four mutant lines belong to three com-plementation groups: boo3, boo1/boo5 and boo14.
Among the three complementation groups, boo3 has the mostspecific phenotypic effect (i.e. least pleiotropy), only lacking theanthocyanin pigments on the petal lobe. The anthocyanin spotsin the nectar guide and the purple color of the stem base remainunaffected. The seed coat color of boo3 is also indistinguishablefrom the wild-type LF10 (Fig. 4), being deep brown, presumablydue to proanthocyanidin accumulation (Lepiniec et al., 2006).The boo1/boo5 lines show the most pleiotropy: petal lobes are
white, anthocyanin spots in the nectar guide are completelyabsent, the stem base has no purple color and seed coat is paleyellow (Fig. 4). boo14 shows intermediate phenotypes, with noanthocyanins in the petal lobes or stem base, weak anthocyaninspots towards the base of the nectar guide, but having a seed coatcolor indistinguishable from the wild-type (Fig. 4).
boo3, boo1/boo5 and boo14 correspond to the R2R3-MYB,WD40 and bHLH genes, respectively
The different degree of pleiotropy displayed by the boo3, boo1/boo5 and boo14 mutants suggest that they may correspond to thethree different classes of transcriptional regulators: WD40 muta-tions are usually the most pleiotropic and R2R3-MYB mutationsare the least pleiotropic (Zhang et al., 2003; Koes et al., 2005).The R2R3-MYB, bHLH and WD40 genes with the highestexpression level in the corolla were considered as the most prom-ising candidate gene underlying boo3, boo14 and boo1/boo5, andwere named Petal Lobe Anthocyanin (PELAN), MlANbHLH1and MlWD40a, respectively (Table 1). To test this idea, wesequenced the full-length CDS of the three candidate genes forall four boo mutants. In each boo mutant line only one of thethree candidate genes harbored a mutation. The boo3 mutant hasa premature stop codon at the end of the first exon of PELAN(Figs 5a,S2); boo1 and boo5 have an amino acid replacement in ahighly conserved site and a premature stop codon, respectively, inMlWD40a (Figs 5b, S4), consistent with the complementationtest indicating that they are allelic; boo14 has a mutation in anintron/exon junction leading to nonsplicing of the last intron ofMlANbHLH1 (Figs 5c, S3). These results support our hypothesisthat boo3, boo1/boo5 and boo14 correspond to the R2R3-MYBgene PELAN, the WD40 gene MlWD40a and the bHLH geneMlANbHLH1, respectively.
A second R2R3-MYB controls anthocyanin spot formationin the nectar guide
The fact that both MlWD40a and MlANbHLH1 mutationsaffect the anthocyanin spots in the nectar guide, whereas thePELAN mutation does not, suggests that there must be anotherR2R3-MYB responsible for anthocyanin spot formation in thenectar guide. The transcriptome and RT-PCR experiments didshow one other R2R3-MYB paralog expressed in the corolla,although the RPKM expression value of this gene is much lowerthan PELAN (8.56 vs 124.83; Table 1). However, if this gene isonly expressed in the nectar guide, the relatively low expressionvalue estimated from the entire corolla can be explained by thefact that the nectar guide accounts for only a small proportion (c.10%) of the corolla tissue. To test this hypothesis, we dissectedthe 15-mm corolla into petal lobes and nectar guide and isolatedRNA from each tissue type. RT-PCR showed that PELAN is pre-dominantly expressed in the petal lobe (Fig. 5d), whereas theother R2R3-MYB paralog is expressed exclusively in the nectarguide. These results strongly suggest that this second R2R3-MYB,designated as Nectar Guide Anthocyanin (NEGAN), controls theanthocyanin spot formation in the nectar guide.
MlUBC
MlUF3GT
MlANS
MlDFR
MlF3Ha
MlCHSa
MlCHI
WT
(30×)
(30×)
(30×)
(30×)
(30×)
(30×)
(32×)
boo1 boo3 boo5 boo14
Fig. 3 Semi-quantitative RT-PCR of the structural anthocyaninbiosynthetic genes in theMimulus lewisii boomutants.MlF3Ha,MlDFR
andMlANS are dramatically downregulated in these mutants;MlUF3GT isalso downregulated, but to a lesser extent;MlCHSa andMlCHI are notaffected.MlUBC is shown as a reference gene. PCR cycle numbers areshown after the gene names. WT, wild-type.
New Phytologist (2014) 204: 1013–1027 � 2014 The Authors
New Phytologist� 2014 New Phytologist Trustwww.newphytologist.com
Research
NewPhytologist1018

RNAi transgenic lines accurately reproduce boo phenotypes
In order to further verify the function of these MBW regulators,we built gene-specific RNAi constructs to knock down theexpression of each of the four players identified above, in thewild-type LF10 background. We generated 4, 92, 12 and 14independent RNAi transgenic lines for PELAN, NEGAN,MlANbHLH1 and MlWD40a, respectively. For all genes butMlANbHLH1, more than half of the transgenic lines display astrong phenotype indistinguishable from the corresponding boomutants; the remaining lines usually show an intermediate phe-notype (Fig. 6). Even for MlANbHLH1, five of 12 independentlines have strong phenotypes indistinguishable from boo14.
The strong PELAN RNAi lines have white petal lobes, buthave normal nectar guide anthocyanin spots (Fig. 6a), purplestem base and deep brown seed coat color, accurately
phenocopying boo3. The strong NEGAN RNAi lines have noanthocyanin spots in the nectar guide, but are indistinguishablefrom LF10 in all other traits, including petal lobe color (Fig. 6b).The strong MlANbHLH1 lines have white petal lobes, weakanthocyanin spots towards the base of the nectar guide (Fig. 6c),a green stem base, but normal seed coat color, just like the boo14mutant. The fact that both boo14 and the MlANbHLH1 RNAilines have weak anthocyanin spots in the bottom part of the nec-tar guide suggests that there probably exists another functionallyredundant bHLH paralog (e.g. MlANbHLH2, Table 1) with lowexpression level in the nectar guide. MlWD40a knock-downaffects all of the aforementioned traits, as in boo5. Together withthe mutant analyses, these transgenic results support the modelthat MlANbHLH1 and MlWD40a regulate anthocyanin biosyn-thesis in the entire corolla, while PELAN and NEGAN act morespecifically in different parts of the corolla (Fig. 7).
boo3
LF10 boo3 boo5 boo14
boo14boo5
(c)(a)
(b)
LF10
boo5
boo3
boo14
LF10
LF10 boo5
boo3 boo14
(d)
Fig. 4 Phenotypes of the wild-typeMimuluslewisii LF10 and the boo3, boo5 and boo14
mutants. (a) Petal lobe color. (b)Anthocyanin spots in the nectar guide. (c)Color of the stem base. (d) Color of the seedcoat.
boo5
boo14
(R139*) TGAATGboo1
(D172N) 100 bp
100 bpATG TGA(GT->GC)
ATG TGA100 bpboo3
(R42*)
PELAN NEGAN MlUBC
PL NG PL NG PL NG
(a)
PELAN
MlWD40a
MlANbHLH1
(b)
(c)
(d)
32 cycles
Fig. 5 Mutation characterization of theMimulus lewisii boomutants. (a) boo3 has apremature stop codon in the PELAN R2R3-MYB gene. (b) boo1 and boo5 have anonsynonymous mutation (D172N) and apremature stop codon, respectively, in theMlWD40a gene. (c) boo14 has a mutation inan intron/exon junction inMlANbHLH1,leading to nonsplicing of the last intron. (d)Expression pattern of the PELANMYB andthe NEGANMYB in the wild-type petal lobe(PL) and nectar guide (NG).
� 2014 The Authors
New Phytologist� 2014 New Phytologist TrustNew Phytologist (2014) 204: 1013–1027
www.newphytologist.com
NewPhytologist Research 1019

NEGAN, but not PELAN, is involved in a self-activation loop
In order to verify that the target regulatory genes have been spe-cifically knocked down in the RNAi lines, we selected threestrong lines of each gene for molecular characterization. We first
verified transgene presence in these RNAi lines by PCR usingtransgene specific primers (Fig. S5), then performed semi-quanti-tative RT-PCR (Fig. S5) and qRT-PCR (Fig. 6e) at the 15-mmcorolla stage to examine gene expression. These two sets of exper-iments consistently showed that in the PELAN RNAi lines, the
PELAN_RNAi: strong (3/4) PELAN_RNAi: intermediate (1/4)
NEGAN_RNAi: strong (88/92) NEGAN_RNAi: intermediate (4/92)
MlANbHLH1_RNAi: strong (5/12) MlANbHLH1_RNAi: intermediate (7/12)
MlWD40a_RNAi: strong (11/14) MlWD40a_RNAi: intermediate (3/14)
(a)
(b)
(c)
(d)
(e)
PELAN
WTPELAN_RNAi
NEGAN_RNAi MlWD40a_RNAiMlANbHLH1_RNAi
0.0
0.2
0.4
0.6
1.0
0.8
1.2
NEGAN MlANbHLH1 MlWD40a* *
Fig. 6 Phenotypic and molecularcharacterization of the RNAi transgenic linesof PELAN (a), NEGAN (b),MlANbHLH1 (c)andMlWD40a (d) in theMimulus lewisii
LF10 background. The proportion oftransgenic lines with strong or intermediatephenotypes is indicated by the numbers inparentheses below the flower images. Thestrong RNAi lines of PELAN,MlANbHLH1
andMlWD40a accurately reproduce thephenotypes of boo3, boo14 and boo5,respectively, including the stem base colorand seed coat color (not shown). Note thatno EMS-induced mutants are available forNEGAN. (e) Quantitative RT-PCR of the fourgenes at the 15-mm corolla stage.MlUBC
was used as the reference gene. All fourgenes show substantial knock-down in theircorresponding RNAi lines. Asterisks highlightthe complete absence of NEGAN transcriptsin the NEGAN andMlWD40a RNAi linesafter 40 cycles of PCR. WT, wild-type. Bars,� 1 SD from three biological replicates.
New Phytologist (2014) 204: 1013–1027 � 2014 The Authors
New Phytologist� 2014 New Phytologist Trustwww.newphytologist.com
Research
NewPhytologist1020

expression level of PELAN is substantially lower than the wild-type control, and the expression levels of NEGAN, MlANbHLH1and MlWD40a are not affected (Figs 6e,S5). Similarly, in theMlANbHLH1 RNAi lines, MlANbHLH1 shows clear downregu-lation but the other genes are not affected (except NEGAN, seethe next paragraph).
Interestingly, in the NEGAN RNAi lines, while the other genesremain unaffected as expected, the NEGAN gene itself showed100% knock-down (no NEGAN transcripts were detected after40 cycles of PCR; Fig. 6e). This is somewhat surprising becausebased on our experience with several transcription factor genescharacterized in the LF10 background (Yuan et al., 2013a,b; thisstudy), RNAi usually results in 70–90% knock-down in strongtransgenic lines, not a complete knock-down. Even more intrigu-ingly, in the MlWD40a RNAi lines, not only was MlWD40aclearly knocked down, but expression of NEGAN also becomesundetectable, although the expression of PELAN is not affected(Fig. 6e). This suggests that MlWD40a is required for NEGAN,but not PELAN, expression. Assuming that MlWD40a functionsas part of the MBW complex activating NEGAN expression, wecould infer that NEGAN is involved in an autoregulatory feed-back loop, which explains its 100% knock-down in the NEGANRNAi lines. If NEGAN is indeed activated by the ‘NEGAN-MlANbHLH1-MlWD40a’ complex itself, one would predictthat MlANbHLH1 RNAi should also result in substantial down-regulation of NEGAN. However, our qPCR experiment showedonly c. 50% NEGAN knock-down (Fig. 6e). This is probably dueto a redundant bHLH factor (e.g.MlANbHLH2) expressed in thenectar guide, consistent with the ‘weak anthocyanin spot’ pheno-type of boo14 and theMlANbHLH1 RNAi lines.
In order to further test the NEGAN self-activation model,we generated 35S:NEGAN over-expression lines using thefull-length NEGAN CDS without 50 or 30 UTR sequences.We focused our analysis on the leaf tissue, which expresses
MlANbHLH1 and MlWD40a at comparable levels to flowers,but expresses no subgroup 6 R2R3-MYBs (unpublished leaftranscriptome data). The latter feature is important because thatmeans any detectable endogenous NEGAN transcript, which canbe distinguished from the transgene transcript by the presence ofUTRs, must be activated by the transgene. We obtained 50 inde-pendent 35S:NEGAN lines. A representative whole plant pheno-type is shown in Fig. 8(a). We selected three 35S:NEGAN lineswith strong leaf phenotypes (an example shown in Fig. 8b), andperformed RT-PCR using primers that can amplify part of the30UTR of NEGAN. Our results clearly showed that the endoge-nous NEGAN gene can be activated by the NEGAN transgene inthe over-expression lines, and no NEGAN expression was detect-able in the wild-type controls (Fig. 8c).
Independent losses of PELAN expression (via differentmechanisms) explain natural yellow-floweredM. cardinalispopulations
With a basic model of floral anthocyanin regulation establishedin M. lewisii (Fig. 7), next we explore the possibility of using thismodel to explain some simple cases of flower color variation inother Mimulus species. The first case involves two naturalM. cardinalis populations with yellow flowers.
M. cardinalis is the sister species of M. lewisii (Beardsleyet al., 2003) and is typically red-flowered (Fig. 9a) due to thecombination of high concentrations of both anthocyaninsand carotenoids. The two yellow populations are found in the
PELANNEGAN R2R3-MYB? R2R3-MYB?
MlANbHLH1 bHLH?
MlWD40a
Fig. 7 A regulatory network model of anthocyanin pigmentation inMimulus lewisii LF10. The bottom plant images (from left to right) showthe color of nectar guide spots, petal lobes, stem base and seed coat,respectively. The dashed lines indicate putative protein–proteininteractions; the arrow indicates self-activation.
NEGAN (SP3F&cdsR)
NEGAN (SP3F&3’UTR)
MlUBC
1 2 3 11 20 33WT
WT
35S:NEGAN
35S:NEGAN WT
32 cycles
35S:NEGAN
(a)
(c)
(b)
Fig. 8 NEGAN transgene activates the endogenous NEGAN geneexpression inMimulus lewisii over-expression lines. (a) A representative35S:NEGAN transgenic line showing the whole-plant phenotype. (b) Theentire leaf can be changed to dark purple in strong 35S:NEGAN lines. (c)RT-PCR showing activation of the endogenous NEGAN gene, which canbe distinguished from the transgene by the presence of 30UTR, in threeindependent 35S:NEGAN lines. WT, wild-type.
� 2014 The Authors
New Phytologist� 2014 New Phytologist TrustNew Phytologist (2014) 204: 1013–1027
www.newphytologist.com
NewPhytologist Research 1021

northern (Siskiyou Mountains, Oregon) and southern (CedrosIsland, Baja California) margins of the M. cardinalis geo-graphic range (Vickery, 1995; Paul et al., 2011), and hereafterwill be referred to as M. cardinalis SM and M. cardinalis CI,respectively. Both M. cardinalis SM and CI lack anthocyaninsin the petal lobe, but have strong anthocyanin pigmentationin the nectar guide (Fig. 9b,c). Genetic crosses withM. cardinalis CE10 (Fig. 9a) show that yellow is recessive tored. The similarity of floral anthocyanin pigmentation patternbetween M. cardinalis SM, CI and the M. lewisii boo3 mutantsuggests that the phenotype of all three is likely to be causedby the loss of function of the same gene, PELAN. Indeed,complementation crosses between the three suggest that theyare all allelic (Fig. S6).
Next we ask: What is the molecular nature of the loss-of-func-tion pelan allele of M. cardinalis SM and CI? These two popula-tions are geographically isolated from each other and displayslightly different phenotypes (Fig. 9b,c), which suggests that theyhave evolved independently from the typical red-flowered
phenotype. To address this question, we first attempted toamplify and sequence the full-length CDS of PELAN fromM. cardinalis SM and CI corolla cDNA at the stage correspond-ing to the 15-mm corolla stage of M. lewisii LF10, to examinepotential coding DNA mutations. However, although thePELAN CDS could be readily amplified from both M. lewisiiLF10 and the red-flowered M. cardinalis CE10 corolla cDNA, itcould not be amplified from either M. cardinalis SM or CI. Thissuggests that PELAN may not be expressed in the yellowM. cardinalis. Further RT-PCR experiments corroborate thisinference (Fig. 9e). To rule out the possibility that this failure ofdetecting PELAN expression by RT-PCR is due to primer mis-match in SM and CI, we performed PCR on the genomic DNAas a control. The RT-PCR primers produced a band of theexpected size with the CI genomic template, but, surprisingly,still failed to amplify any products in SM (Fig. 9f). These resultsindicate an intriguing possibility that the PELAN gene has beendeleted from the SM genome. To test this idea, we designedmultiple pairs of primers, from both exonic and intronic regions
M. cardinalis (CE10) M. cardinalis (SM) (Siskiyou Mts., OR)
M. cardinalis (CI) (Cedros Island, Baja CA)
cdsF & IN1R
IN1F & SP3R4
SP3F4 & SP3R2
SP3F2 & cdsR
MlUBC
MlUBC
PELAN
SM CI CE10
SMCICE10
(b)(a) (c)
(d)
(f)(e)
100 bp
cdsF
IN1R
SP3F4IN1F SP3F2
SP3R4 SP3R2 cdsR
33 cycles
Fig. 9 Molecular characterization of the twonatural yellow-floweredMimulus cardinalis
populations. (a)M. cardinalis inbred lineCE10 showing the typical red flower. (b)M. cardinalis (SM). (c)M. cardinalis (CI).The dissected nectar guide on the upper-right corner of the flower images show theanthocyanin spots in the nectar guide. (d)Structure of the PELAN gene and thepositions of PCR primers used in RT-PCR andgenomic PCR. (e) RT-PCR (primer pair SP3F4& SP3R2) shows no expression of PELAN inCI or SM. (f) Genomic PCR by multipleprimer pairs suggest that PELAN hasprobably been deleted from the SM genome.Primer sequences are listed in Table S4 (alsosee Fig. S7). GenBank accession numbers fortheM. cardinalis CE10 and CI PELAN genesequences are KJ595587–KJ595588.
New Phytologist (2014) 204: 1013–1027 � 2014 The Authors
New Phytologist� 2014 New Phytologist Trustwww.newphytologist.com
Research
NewPhytologist1022

and with sequences conserved between LF10, CE10 and CI(Figs 9d,S7) – all of these primer pairs produced a clean band ofexpected size in CE10 and CI, but no bands in SM (Fig. 9f).
Taken together, these results suggest that the losses of petallobe anthocyanins in M. cardinalis SM and CI are caused byindependent molecular lesions in the PELAN MYB gene. Theloss of PELAN expression in SM is linked with the probable dele-tion of the entire gene in the SM genome, whereas the loss ofPELAN expression in CI is most likely to be caused by cis-regula-tory changes because the complementation crosses have ruled outtrans-acting factors as a potential cause.
The NEGAN ortholog is the only anthocyanin-activatingMYB expressed in theM. guttatus corolla
The second case of using the M. lewisii model to explain floralanthocyanin pigmentation patterns in other Mimulus involvesM. guttatus, for which many genomic resources are available(Wu et al., 2008; Hellsten et al., 2013). M. guttatus belongs tothe ‘yellow flower’ clade (the top clade in Fig. 1), where mostspecies do not have petal lobe anthocyanins but do have anthocy-anin spots in the corolla throat (Fig. 10a), presumably serving asa nectar guide for pollinators.
The M. guttatus genome has five R2R3-MYB genes (MgMYB1-5) that are classified in the anthocyanin-activating group (Cooleyet al., 2011; Fig. 2a). Phylogenetic analysis suggests thatMgMYB1-3 groups together with PELAN and MgMYB5 groupswith NEGAN. MgMYB4 represents a more divergent lineage(Fig. 2a). Considering that NEGAN is the MYB that controlsanthocyanin spot formation in the M. lewisii nectar guide, wepredicted that the NEGAN ortholog, MgMYB5, is the onlyanthocyanin-activating MYB gene expressed in the M. guttatuscorolla, to explain the fact that anthocyanins are restricted to thenectar guide spots in the M. guttatus flower. RT-PCR experi-ments clearly show that this is the case (Fig. 10b). These resultssuggest that the function of NEGAN – making anthocyanin spotsin the nectar guide – is conserved between these two major cladesof Mimulus (Fig. 1), and our M. lewisii model can be used toexplain anthocyanin pigmentation patterns even in distantlyrelated species.
Discussion
In this study we have identified four major transcriptional regula-tors of anthocyanin pigmentation in M. lewisii flowers, includingtheMlWD40a andMlANbHLH1 genes that control anthocyaninpigmentation in the entire corolla, the PELAN R2R3-MYBthat controls the petal lobe color, and the NEGAN R2R3-MYBthat regulates the anthocyanin spot formation in the nectarguide. Furthermore, through two case studies in M. cardinalisand M. guttatus, we have demonstrated that the establishment ofa baseline floral anthocyanin regulation model in M. lewisii is ofgreat value towards understanding the molecular bases underly-ing the astonishing diversity of floral anthocyanin pigmentationspatterns in otherMimulus species.
The identities and functions of all four regulatory genes aresupported by multiple lines of evidence. Overall the differentdegrees of pleiotropy of these genes are consistent with the MBWregulatory network model characterized in other plant species(Zhang et al., 2003; Koes et al., 2005; Hichri et al., 2011) –WD40 is the most pleiotropic, while the R2R3-MYB is the leastpleiotropic and tends to act in a tissue-specific fashion. The iden-tity and function of PELAN are supported by multiple allelesfrom both EMS-induced (boo3) and natural mutants (M. cardinalis SM and CI), and by gene-specific RNAi knock-down exper-iments. The identity and function of NEGAN are supported bythe tissue-specific expression pattern (only in the nectar guide)and the distinct RNAi transgenic phenotype, with only theanthocyanin spots in the nectar guide being affected. Similarly, acombination of EMS-induced loss-of-function alleles and RNAiphenocopies confirm the identity and function of MlANbHLH1andMlWD40a.
The autoregulation of NEGAN is noteworthy. Although theregulatory role of the MBW complex in ABP structural geneexpression is highly conserved across all flowering plants charac-terized to date (Koes et al., 2005; Glover, 2007; Hichri et al.,2011; Davies et al., 2012), the transcriptional regulation ofthe MBW regulatory genes themselves is less understood. InPetunia, Arabidopsis and grapevine (Vitis vinifera), some anthocy-anin-activating bHLH genes can be activated by the MBW com-plex itself (Spelt et al., 2000; Baudry et al., 2006; Hichri et al.,
MgUBC
MgMYB5
MgMYB3
MgMYB4
MgMYB1
MgMYB2
cDNA gDNA(b)(a)
Fig. 10 Anthocyanin pigmentation inMimulus guttatus inbred line IM767. (a) Flower images showing the anthocyanin spots in the nectar guide. (b) TheNEGAN ortholog is the only anthocyanin-activatingMYB expressed in the corolla of IM767, indicated by the red arrow. Genomic DNA was used as controlto test primer quality. TheM. guttatus UBC ortholog (MgUBC) was used as a reference gene. The larger size of theMgUBC genomic amplicon is due tothe presence of an intron in the amplified fragment. Primer sequences are listed in Table S1.
� 2014 The Authors
New Phytologist� 2014 New Phytologist TrustNew Phytologist (2014) 204: 1013–1027
www.newphytologist.com
NewPhytologist Research 1023

2010). However, in maize, the three components of the MBWcomplex seem to be independently regulated (Carey et al., 2004).The bHLH inM. lewisii (MlANbHLH1) does not seem to be reg-ulated by the MBW complex, either, as neither MlWD40a norPELAN/NEGAN knock-down affects MlANbHLH1 expression.Little is known about the transcriptional control of the R2R3-MYBs, which usually show more tissue-specific expression pat-terns (e.g. PELAN and NEGAN). One interesting exception isthe apple MYB10 that activates anthocyanin biosynthesis in thered-fleshed apple varieties. The rearrangement of the MYB10upstream regulatory region in some apple varieties results in atandem repeat of a 23-bp sequence that serves as binding site forthe MYB10 protein itself, leading to the autoregulation ofMYB10 (Espley et al., 2009). Our RNAi and over-expressionexperiments strongly suggest that NEGAN, but not PELAN,is activated by the MBW complex itself (Figs 6e, 8). The factthat the MBW complex regulates NEGAN but not PELANsuggests that these two R2R3-MYB genes have evolved distinctcis-elements that respond to different transcriptional regulators.
It is also interesting to note the link between the self-activationof NEGAN and the formation of anthocyanin spots rather than asolid pattern in the nectar guide. Formation of spotty patterns inbiological objects is often explained by the reaction-diffusionmodel (Turing, 1952) or various modified versions of this model(Meinhardt, 1982; Meinhardt & Gierer, 2000; Kondo & Miura,2010). The essence of these reaction-diffusion based models is aninteracting network that contains a local autocatalytic feedbackloop and a long-range inhibitory feedback loop (Meinhardt &Gierer, 2000). The activation of NEGAN by the NEGAN-MlANbHLH1-WD40a complex itself forms such an autocata-lytic feedback, although what may constitute the long-rangeinhibitory feedback is not yet clear. Notably, the reaction-diffu-sion model has previously been proposed as a potential mecha-nism generating multicellular pigmented petal spots by Davieset al. (2012). In fact, the transcriptional network regulatinganthocyanin pigmentation in Petunia hybrida contains both anautocatalytic activator and a potential long-range repressor – thebHLH gene AN1 is activated by the MBW complex itself, whichalso activates an R3-MYB repressor, MYBx; MYBx inhibits theactivity of AN1 and is capable of intercellular movement (Albertet al., 2014). However, the flowers of Petunia hybrida do not usu-ally display anthocyanin spots. This suggests that the existence ofsuch feedback loops may be required, but may not necessarily besufficient for spot formation. The specific properties of eachcomponent (e.g. the relative diffusion rate of the long-rangeinhibitor to the short-range activators) could be critical to formdifferent patterns (Kondo & Miura, 2010). It will be interestingto determine whether one can ‘engineer’ anthocyanin spots inPetunia petals by fine-tuning the properties of these activatorsand repressors through transgenic manipulations.
In addition to the four major transcriptional activators, a sin-gle-repeat R3-MYB gene, ROI1, similar to the Petunia MYBx, hasbeen previously identified as a negative regulator of anthocyaninbiosynthesis in M. lewisii petal lobes (Yuan et al., 2013a). Yeast-two-hybrid experiments suggest that PELAN, NEGAN andROI1 can all interact with MlANbHLH1 in yeast (Y-W. Yuan &
H.D. Bradshaw, unpublished data), supporting the hypothesisthat ROI1 negatively regulates anthocyanin biosynthesis by com-peting with the R2R3-MYB activators for the limited supply ofbHLH proteins. At first glance ROI1 may appear as a good can-didate fulfilling the ‘inhibitory feedback’ requirement as a com-petitor of NEGAN, to explain the spotty anthocyanin pattern inthe nectar guide. However, this is unlikely to be the case becauseROI1 has very low expression level in the nectar guide comparedto petal lobes. Consistent with this, knocking down ROI1 inM. lewisii does not seem to have any effects on the nectar guideanthocyanin spots (Yuan et al., 2013a). There probably existsanother yet-to-be-identified repressor specifically expressed in thenectar guide, forming inhibitory interactions with NEGAN.
The successful prediction of the molecular bases underlyingthe natural yellow M. cardinalis populations and the M. guttatusfloral anthocyanin patterns using our M. lewisii model is particu-larly satisfying. The two yellow M. cardinalis populations arefound in the northern (Siskiyou Mountains of Oregon) andsouthern limit (Cedros Island, Baja California) of the speciesrange (Vickery, 1995; Paul et al., 2011), respectively, and thusrepresent a classical example of new forms evolving from isolatedpopulations on the periphery of a species range (Mayr, 1976).Pollination observations in a common garden environment usingthe typical red flowers and the mutant yellow forms suggestedthat the color change from red to yellow inM. cardinalis is proba-bly sufficient to ‘initiate partial, incipient reproductive isolation’(Vickery, 1995). As such, by revealing the loss of PELAN expres-sion as the cause for this color change, we might have recoveredthe molecular bases of two parallel incipient speciation events.
The M. cardinalis results also provide further evidence sup-porting the notion that phenotypic variation within and betweenspecies often involve the same ‘hotspot’ genes (Stern, 2011;Streisfeld & Rausher, 2011). The petal lobe-specific R2R3-MYB,PELAN, is such a hotspot gene occupying ‘a privileged position’(Stern, 2011) in a genetic network that can ‘maximize thephenotypic output’ by causing the downregulation of multipleanthocyanin biosynthetic genes, but meanwhile can ‘minimizepleiotropy’ by changing only the petal lobe color without affect-ing any other traits. However, there could be many different waysleading to loss-of-function of the same hotspot gene. In the twoisolated M. cardinalis populations, loss of PELAN expression hasevolved independently by two completely different mechanisms:one is probably caused by cis-regulatory changes and the otherlikely involves the deletion of the entire gene.
The M. guttatus case study demonstrates that our M. lewisiifloral anthocyanin regulation model is applicable not only toclosely related species, but also to relatively distantly related spe-cies (for phylogenetic relationships see Fig. 1). None of theR2R3-MYBs in the PELAN clade (Fig. 2a) is expressed inM. guttatus corolla (Fig. 10b), explaining the lack of anthocyaninsin petal lobes. The NEGAN orthog, MgMYB5, appears to beresponsible for the formation of nectar guide anthocyanin spotsinM. guttatus.
Ultimately, we would like to extend the two simple case stud-ies presented here and use the M. lewisii model to examine themolecular tinkering underlying the evolution of more complex
New Phytologist (2014) 204: 1013–1027 � 2014 The Authors
New Phytologist� 2014 New Phytologist Trustwww.newphytologist.com
Research
NewPhytologist1024

floral anthocyanin patterns, such as the different anthocyaninshades in the petal lobes ofM. pulchellus or the novel ‘spider-web’pattern in M. pictus (Fig. 1). With the necessary mutant lines andthe powerful transgenic tools available in M. lewisii, we can intro-duce genomic copies (including upstream regulatory regions) ofeach major anthocyanin regulator from other species, on a gene-by-gene basis, into the corresponding M. lewisii mutant back-ground. In doing so, we will be able to address the question ofhow many gene replacements are required to change one complexpigmentation pattern into another. More importantly, given thegradient of phylogenetic distances between the various speciesand M. lewisii, the gene-by-gene replacement strategy will allowus to test whether phenotypic evolution at deeper phylogeneticlevels (between distantly related species) involves different kindsof mechanisms, genes or mutations to those involved with pheno-typic evolution within species or between closely related species(Stern & Orgogozo, 2009).
Acknowledgements
We are grateful to Brian Watson, Doug Ewing, Jeanette Milne,Paul Beeman, Clinton Morse and Matt Opel for plant care. Wethank Dena Grossenbacher and Matt Streisfeld for kindly pro-viding flower images used in Fig. 1, and Bob Vickery and JohnWillis for providing M. cardinalis and M. guttatus seeds. PiotrMieczkowski at the University of North Carolina HighThroughput Sequencing Facility supervised the transcriptomesequencing. We would like to thank Dr Hongzhi Kong andthree anonymous reviewers for their constructive criticismthat greatly improved this manuscript. This work was supportedby an NSF FIBR grant (0328636) and an NIH grant(5R01GM088805) to H.D.B, and the University of Connecti-cut Start-up funds to Y-W.Y.
References
Albert NW, Davies KM, Lewis DH, Zhang HB, Montefiori M, Brendolise C,
Boase MR, Ngo H, Jameson PE, Schwinn KE. 2014. A conserved network of
transcriptional activators and repressors regulates anthocyanin pigmentation in
Eudicots. Plant Cell 26: 962–980.Albert NW, Lewis DH, Zhang H, Schwinn KE, Jameson PE, Davies KM. 2011.
Members of an R2R3-MYB transcription factor family in Petunia aredevelopmentally and environmentally regulated to control complex floral and
vegetative pigmentation patterning. Plant Journal 65: 771–784.Altschul SF, Madden TL, Schaffer AA, Zhang JH, Zhang Z, Miller W, Lipman
DJ. 1997. Gapped BLAST and PSI-BLAST: a new generation of protein
database search programs. Nucleic Acids Research 25: 3389–3402.Baudry A, Caboche M, Lepiniec L. 2006. TT8 controls its own expression in a
feedback regulation involving TTG1 and homologous MYB and bHLH
factors, allowing a strong and cell-specific accumulation of flavonoids in
Arabidopsis thaliana. Plant Journal 46: 768–779.Beardsley PM, Schoenig SE, Whittall JB, Olmstead RG. 2004. Patterns of
evolution in western North AmericanMimulus (Phrymaceae). American Journalof Botany 91: 474–489.
Beardsley PM, Yen A, Olmstead RG. 2003. AFLP phylogeny ofMimulus sectionErythranthe and the evolution of hummingbird pollination. Evolution 57:1397–1410.
Borevitz JO, Xia YJ, Blount J, Dixon RA, Lamb C. 2000. Activation tagging
identifies a conserved MYB regulator of phenylpropanoid biosynthesis. PlantCell 12: 2383–2393.
Bradshaw HD, Schemske DW. 2003. Allele substitution at a flower colour locus
produces a pollinator shift in monkeyflowers. Nature 426: 176–178.Carey CC, Strahle JT, Selinger DA, Chandler VL. 2004.Mutations in the palealeurone color1 regulatory gene of the Zea mays anthocyanin pathway havedistinct phenotypes relative to the functionally similar TRANSPARENTTESTA GLABRA1 gene in Arabidopsis thaliana. Plant Cell 16: 450–464.
Cooley AM, Modliszewski JL, Rommel ML, Willis JH. 2011. Gene duplication
inMimulus underlies parallel floral evolution via independent trans-regulatorychanges. Current Biology 21: 700–704.
Cooley AM, Willis JH. 2009. Genetic divergence causes parallel evolution of
flower color in ChileanMimulus. New Phytologist 183: 729–739.Davies KM, Albert NW, Schwinn KE. 2012. From landing lights to mimicry:
the molecular regulation of flower colouration and mechanisms for
pigmentation patterning. Functional Plant Biology 39: 619–638.Des Marais DL, Rausher MD. 2010. Parallel evolution at multiple levels in the
origin of hummingbird pollinated flowers in Ipomoea. Evolution 64: 2044–2054.
Earley KW, Haag JR, Pontes O, Opper K, Juehne T, Song KM, Pikaard CS.
2006. Gateway-compatible vectors for plant functional genomics and
proteomics. Plant Journal 45: 616–629.Edgar RC. 2004.MUSCLE: multiple sequence alignment with high accuracy and
high throughput. Nucleic Acids Research 32: 1792–1797.Espley RV, Brendolise C, Chagne D, Kutty-Amma S, Green S, Volz R, Putterill
J, Schouten HJ, Gardiner SE, Hellens RP et al. 2009.Multiple repeats of a
promoter segment causes transcription factor autoregulation in red apples.
Plant Cell 21: 168–183.Feller A, Machemer K, Braun EL, Grotewold E. 2011. Evolutionary and
comparative analysis of MYB and bHLH plant transcription factors. PlantJournal 66: 94–116.
Glover BJ. 2007. Understanding flowers and flowering: an integrated approach.Oxford, UK: Oxford University Press.
Goodrich J, Carpenter R, Coen ES. 1992. A common gene regulates
pigmentation pattern in diverse plant species. Cell 68: 955–964.Grossenbacher DL, Whittall JB. 2011. Increased floral divergence in sympatric
monkeyflowers. Evolution 65: 2712–2718.Grotewold E. 2006. The genetics and biochemistry of floral pigments. AnnualReview of Plant Biology 57: 761–780.
Heim MA, Jakoby M, Werber M, Martin C, Weisshaar B, Bailey PC. 2003.
The basic helix-loop-helix transcription factor family in plants: a genome-wide
study of protein structure and functional diversity.Molecular Biology andEvolution 20: 735–747.
Hellsten U, Wright KM, Jenkins J, Shu S, Yuan YW, Wessler SR, Schmutz J,
Willis JH, Rokhsar DS. 2013. Fine-scale variation in meiotic recombination in
Mimulus inferred from population shotgun sequencing. Proceedings of theNational Academy of Sciences, USA 110: 19 478–19 482.
Hichri I, Barrieu F, Bogs J, Kappel C, Delrot S, Lauvergeat V. 2011. Recent
advances in the transcriptional regulation of the flavonoid biosynthetic
pathway. Journal of Experimental Botany 62: 2465–2483.Hichri I, Heppel SC, Pillet J, Leon C, Czemmel S, Delrot S, Lauvergeat V, Bogs
J. 2010. The basic helix-loop-helix transcription factor MYC1 is involved in
the regulation of the flavonoid biosynthesis pathway in grapevine.MolecularPlant 3: 509–523.
Hiesey W, Nobs MA, Bj€orkman O. 1971. Experimental studies on the nature ofspecies. V. Biosystematics, genetics, and physiological ecology of the Erythranthesection of Mimulus. Washington, DC, USA: Carnegie Institute of Washington
publ. no. 628.
Hoballah ME, Gubitz T, Stuurman J, Broger L, Barone M, Mandel T,
Dell’Olivo A, Arnold M, Kuhlemeier C. 2007. Single gene-mediated shift in
pollinator attraction in Petunia. Plant Cell 19: 779–790.Hopkins R, Rausher MD. 2011. Identification of two genes causing
reinforcement in the Texas wildflower Phlox drummondii. Nature 469: 411–414.
Koes R, Verweij W, Quattrocchio F. 2005. Flavonoids: a colorful model for the
regulation and evolution of biochemical pathways. Trends in Plant Science 10:236–242.
Kondo S, Miura T. 2010. Reaction-diffusion model as a framework for
understanding biological pattern formation. Science 329: 1616–1620.
� 2014 The Authors
New Phytologist� 2014 New Phytologist TrustNew Phytologist (2014) 204: 1013–1027
www.newphytologist.com
NewPhytologist Research 1025

Lepiniec L, Debeaujon I, Routaboul JM, Baudry A, Pourcel L, Nesi N, Caboche
M. 2006. Genetics and biochemistry of seed flavonoids. Annual Review of PlantBiology 57: 405–430.
Ludwig SR, Habera LF, Dellaporta SL, Wessler SR. 1989. Lc, a member of the
maize R-gene family responsible for tissue-specific anthocyanin production,
encodes a protein similar to transcriptional activators and contains the
Myc-homology region. Proceedings of the National Academy of Sciences, USA 86:
7092–7096.Ma HM, Pooler M, Griesbach R. 2009. Anthocyanin regulatory/structural gene
expression in Phalaenopsis. Journal of the American Society for HorticulturalScience 134: 88–96.
Martin C, Prescott A, Mackay S, Bartlett J, Vrijlandt E. 1991. Control of
anthocyanin biosynthesis in flowers of Antirrhinum majus. Plant Journal 1: 37–49.
Martins TR, Berg JJ, Blinka S, Rausher MD, Baum DA. 2013. Precise
spatio-temporal regulation of the anthocyanin biosynthetic pathway leads to
petal spot formation in Clarkia gracilis (Onagraceae). New Phytologist 197:958–969.
Mayr E. 1976. Evolution and the diversity of life. Cambridge, MA, USA: Harvard
University Press.
Meinhardt H. 1982.Models of biological pattern formation. London, UK:Academic Press.
Meinhardt H, Gierer A. 2000. Pattern formation by local self-activation and
lateral inhibition. BioEssays 22: 753–760.Mortazavi A, Williams BA, McCue K, Schaeffer L, Wold B. 2008.Mapping and
quantifying mammalian transcriptomes by RNA-Seq. Nature Methods 5: 621–628.
Nakatsuka T, Yamada E, Saito M, Fujita K, Nishihara M. 2013.Heterologous
expression of gentian MYB1R transcription factors suppresses anthocyanin
pigmentation in tobacco flowers. Plant Cell Reports 32: 1925–1937.Owen CR, Bradshaw HD. 2011. Induced mutations affecting pollinator
choice in Mimulus lewisii (Phrymaceae). Arthropod-Plant Interactions 5: 235–244.
Paul JR, Sheth SN, Angert AL. 2011.Quantifying the impact of gene flow on
phenotype-environment mismatch: a demonstration with the scarlet
monkeyflowerMimulus cardinalis. American Naturalist 178: S62–S79.Paz-Ares J, Ghosal D, Wienand U, Peterson PA, Saedler H. 1987. The
regulatory C1 locus of Zea mays encodes a protein with homology to MYB
protooncogene products and with structural similarities to transcriptional
activators. EMBO Journal 6: 3553–3558.Pires N, Dolan L. 2010.Origin and diversification of basic-helix-loop-helix
proteins in plants.Molecular Biology and Evolution 27: 862–874.Quattrocchio F, Wing JF, van der Woude K, Mol JNM, Koes R. 1998. Analysis
of bHLH and MYB domain proteins: species-specific regulatory differences are
caused by divergent evolution of target anthocyanin genes. Plant Journal 13:475–488.
Quattrocchio F, Wing J, van der Woude K, Souer E, de Vetten N, Mol J, Koes
R. 1999.Molecular analysis of the anthocyanin2 gene of petunia and its role inthe evolution of flower color. Plant Cell 11: 1433–1444.
Ruiz-Sola M, Rodriguez-Concepcion M. 2012. Carotenoid biosynthesis in
Arabidopsis: a colorful pathway. The Arabidopsis Book 10: e0158.Schwinn K, Venail J, Shang YJ, Mackay S, Alm V, Butelli E, Oyama R, Bailey
P, Davies K, Martin C. 2006. A small family of MYB-regulatory genes
controls floral pigmentation intensity and patterning in the genus Antirrhinum.Plant Cell 18: 831–851.
Shang YJ, Venail J, Mackay S, Bailey PC, Schwinn KE, Jameson PE, Martin
CR, Davies KM. 2011. The molecular basis for venation patterning of
pigmentation and its effect on pollinator attraction in flowers of Antirrhinum.New Phytologist 189: 602–615.
Smith SD, Rausher MD. 2011. Gene loss and parallel evolution contribute to
species difference in flower color.Molecular Biology and Evolution 28: 2799–2810.
Sobel J, Streisfeld M. 2013. Flower color as a model system for studies of plant
evo-devo. Frontiers in Plant Science 4: Article 321.Spelt C, Quattrocchio F, Mol JNM, Koes R. 2000. anthocyanin1 of petuniaencodes a basic helix-loop-helix protein that directly activates transcription of
structural anthocyanin genes. Plant Cell 12: 1619–1631.
Stamatakis A. 2006. RAxML-VI-HPC: maximum likelihood-based phylogenetic
analyses with thousands of taxa and mixed models. Bioinformatics 22: 2688–2690.Stern DL. 2011. Evolution, development, and the predictable genome. Greenwood
Village, CO, USA: Roberts and Co.
Stern DL, Orgogozo V. 2009. Is genetic evolution predictable? Science 323: 746–751.
Stracke R, Werber M, Weisshaar B. 2001. The R2R3-MYB gene family in
Arabidopsis thaliana. Current Opinion in Plant Biology 4: 447–456.Streisfeld MA, Kohn JR. 2005. Contrasting patterns of floral and molecular
variation across a cline inMimulus aurantiacus. Evolution 59: 2548–2559.Streisfeld MA, Rausher MD. 2011. Population genetics, pleiotropy, and the
preferential fixation of mutations during adptive evolution. Evolution 65: 629–642.Streisfeld MA, Young WN, Sobel JM. 2013. Divergent selection drives genetic
differentiation in an R2R3-MYB transcription factor that contributes to
incipient speciation inMimulus aurantiacus. PLoS Genetics 9: e1003385.Talavera G, Castresana J. 2007. Improvement of phylogenies after removing
divergent and ambiguously aligned blocks from protein sequence alignments.
Systematic Biology 56: 564–577.Turing AM. 1952. The chemical basis of morphogenesis. PhilosophicalTransactions of the Royal Society of London B: Biological Sciences 237: 37–72.
de Vetten N, Quattrocchio F, Mol J, Koes R. 1997. The an11 locus controllingflower pigmentation in petunia encodes a novel WD-repeat protein conserved
in yeast, plants, and animals. Genes & Development 11: 1422–1434.Vickery RK. 1995. Speciation inMimulus, or, can a simple flower color mutant
lead to species divergence. Great Basin Naturalist 55: 177–180.Vickery RK, Olson RL. 1956. Flower color inheritance in theMimulus cardinaliscomplex. Journal of Heredity 47: 195–199.
Walker AR, Davison PA, Bolognesi-Winfield AC, James CM, Srinivasan N,
Blundell TL, Esch JJ, Marks MD, Gray JC. 1999. The TRANSPARENTTESTA GLABRA1 locus, which regulates trichome differentiation and
anthocyanin biosynthesis in Arabidopsis, encodes a WD40 repeat protein. PlantCell 11: 1337–1349.
Wu CA, Lowry DB, Cooley AM, Wright KM, Lee YW, Willis JH. 2008.
Mimulus is an emerging model system for the integration of ecological and
genomic studies. Heredity 100: 220–230.Yamagishi M, Shimoyamada Y, Nakatsuka T, Masuda K. 2010. Two
R2R3-MYB genes, homologs of Petunia AN2, regulate anthocyaninbiosyntheses in flower tepals, tepal spots and leaves of Asiatic hybrid lily. Plantand Cell Physiology 51: 463–474.
Yamagishi M, Toda S, Tasaki K. 2014. The novel allele of the LhMYB12 gene isinvolved in splatter-type spot formation on the flower tepals of Asiatic hybrid
lilies (Lilium spp.). New Phytologist 201: 1009–1020.Yuan YW, Sagawa JM, Di Stilio VS, Bradshaw HD. 2013b. Bulk segregant
analysis of an induced floral mutant identifies aMIXTA-like R2R3 MYBcontrolling nectar guide formation inMimulus lewisii. Genetics 194: 523–528.
Yuan YW, Sagawa JM, Young RC, Christensen BJ, Bradshaw HD. 2013a.
Genetic dissection of a major anthocyanin QTL contributing to
pollinator-mediated reproductive isolation between sister species ofMimulus.Genetics 194: 255–263.
Zhang F, Gonzalez A, Zhao MZ, Payne CT, Lloyd A. 2003. A network of
redundant bHLH proteins functions in all TTG1-dependent pathways of
Arabidopsis. Development 130: 4859–4869.Zhu HF, Fitzsimmons K, Khandelwal A, Kranz RG. 2009. CPC, a single-repeat
R3 MYB, is a negative regulator of anthocyanin biosynthesis in Arabidopsis.Molecular Plant 2: 790–802.
Supporting Information
Additional supporting information may be found in the onlineversion of this article.
Fig. S1 RT-PCR of different paralogs of CHS, F3H, and theMBW regulatory genes.
Fig. S2 Alignment of subgroup 6 R2R3-MYBs.
New Phytologist (2014) 204: 1013–1027 � 2014 The Authors
New Phytologist� 2014 New Phytologist Trustwww.newphytologist.com
Research
NewPhytologist1026
Fig. S3 Alignment of subgroup IIIf bHLHs.
Fig. S4 Alignment of WD40 proteins.
Fig. S5Molecular characterization of the RNAi transgenic lines.
Fig. S6Complementation test between Mimulus lewisii boo3,M. cardinalis SM andM. cardinalis CI.
Fig. S7 Alignment of PELAN sequences from Mimulus lewisiiLF10,M. cardinalis CE10 andM. cardinalis CI.
Table S1 Primers used in RT-PCR experiments
Table S2 Primers used for candidate gene sequencing of the boomutants
Table S3 Primers used for constructing RNAi and over-expres-sion plasmids
Table S4 Primers used for PELAN amplification in Mimuluscardinalis strains
Please note: Wiley Blackwell are not responsible for the contentor functionality of any supporting information supplied by theauthors. Any queries (other than missing material) should bedirected to the New Phytologist Central Office.
New Phytologist is an electronic (online-only) journal owned by the New Phytologist Trust, a not-for-profit organization dedicatedto the promotion of plant science, facilitating projects from symposia to free access for our Tansley reviews.
Regular papers, Letters, Research reviews, Rapid reports and both Modelling/Theory and Methods papers are encouraged. We are committed to rapid processing, from online submission through to publication ‘as ready’ via Early View – our average timeto decision is <25 days. There are no page or colour charges and a PDF version will be provided for each article.
The journal is available online at Wiley Online Library. Visit www.newphytologist.com to search the articles and register for tableof contents email alerts.
If you have any questions, do get in touch with Central Office ([email protected]) or, if it is more convenient,our USA Office ([email protected])
For submission instructions, subscription and all the latest information visit www.newphytologist.com
� 2014 The Authors
New Phytologist� 2014 New Phytologist TrustNew Phytologist (2014) 204: 1013–1027
www.newphytologist.com
NewPhytologist Research 1027