training needs in the further education sector · analysis of the characteristics of the 481...
TRANSCRIPT

TRAINING NEEDS IN THE FURTHER EDUCATION SECTOR An independent and comprehensive report of survey-based research into the training needs of people who work in post-16 education and training organisations in England BMG RESEARCH

2/127 Training Needs Analysis
27/04/2018
Education and Training Foundation
CONTENTS
TABLE OF FIGURES 3
EXECUTIVE SUMMARY 5
Introduction 5
Current training in FE institutions 6
The adequacy and sufficiency of current training 7
Future training needs 8
CHAPTER 1: INTRODUCTION 10
Summary of chapter 10
Purposes of the study 11
Method 12
Response: participants in the surveys 13
The sample of institutions 13
The sample of individuals 16
The qualitative sample 22
CHAPTER 2: CURRENT TRAINING IN FE INSTITUTIONS 24
Summary of chapter 24
Incidence and volume of training 25
Who gets trained? 29
Types of training supplied 34
Suppliers of training 40
Functions of training 43
Paying for training 45
Training infrastructure 54
CHAPTER 3: THE ADEQUACY AND SUFFICIENCY OF CURRENT TRAINING 56
Summary of chapter 56
Adequacy of budget 57
In-depth interviews: access to training and adequacy of budget 58
Gaps in training 59
Effective and ineffective training: the individual’s perspective 64
The quality of training: an institutional perspective 67
Most and least valuable forms of training: the individual’s perspective 68
Most and least valuable forms of training: the institution’s perspective 78
Barriers to training 79
CHAPTER 4: FUTURE TRAINING NEEDS 82
Summary of chapter 82
Drivers of training: an institutional perspective 83
Priorities for, and changes in, training: insights from depth interviews 91
The challenges ahead: insights from depth interviews 92
Who will need training? 95
What training will be required: the institutional perspective 100
What training will be required: the individual perspective 103
The likelihood of future training 118

3/127 Training Needs Analysis
27/04/2018
Education and Training Foundation
TABLE OF FIGURES
Figure 1: Number of FE providers contributing to the Training Needs Analysis................................ 13 Figure 2: Number of permanent sites from which providers operate ................................................ 14 Figure 3: Number of FE learners for which providers were responsible in the last academic year ... 15 Figure 4: Job roles of individuals ..................................................................................................... 17 Figure 5: Subject or curriculum areas in which individuals work ...................................................... 18 Figure 6: Time individuals have worked in the further education and training sector ........................ 19 Figure 7: Current working status of individuals ................................................................................ 19 Figure 8: Gender of individuals ........................................................................................................ 20 Figure 9: Ethnicity of individuals ...................................................................................................... 21 Figure 10: Age of individuals ........................................................................................................... 22 Figure 11: Proportion of staff and individuals who received formal training and development in the past year – institutional and individual perspectives ........................................................................ 26 Figure 12: Individuals who received training and development in the past year ............................... 31 Figure 13: Types of training provided by institutions and the proportions of individuals who took part in each type ..................................................................................................................................... 35 Figure 14: Types of improved competence or areas of knowledge that training and development has sought to enhance ........................................................................................................................... 36 Figure 15: Types of improved competence or areas of knowledge that training and development has sought to enhance – more detail ..................................................................................................... 37 Figure 16: Subject/sector areas in which training and development has taken place ....................... 38 Figure 17: Governance, leadership and management skills where training and development has taken place ...................................................................................................................................... 39 Figure 18: Mandatory training that been provided over the past year .............................................. 40 Figure 19: Suppliers of training and development over the past academic year ............................... 42 Figure 20: Importance of organisational motivations towards staff training and development .......... 43 Figure 21: Individuals’ reasons for undertaking training and development in the past year .............. 44 Figure 22: Proportion of institutions that have a formal budget for training and development ........... 45 Figure 23: Who paid fees for training and development – individual perspective ............................. 46 Figure 24: How training and development was initiated – individual perspective ............................. 50 Figure 25: Proportion of providers who have a training and development plan in place ................... 54 Figure 26: How training and development needs are identified within organisations ........................ 54 Figure 27: Proportion of providers which have a formal system in place for identifying training outcomes and benefits .................................................................................................................... 55 Figure 28: Sufficiency of training and development budget to meet the training and development needs of providers last year ............................................................................................................. 57 Figure 29: Adequacy of training and development activities in the past year ................................... 60 Figure 30: Forms of training and development institutions would like to have seen more of ............ 61 Figure 31: Forms of training and development institutions would like to have seen more of (in more detail) .............................................................................................................................................. 62 Figure 32: Proportions of individuals who did or did not undertake all the training and development they wanted and needed ................................................................................................................. 63 Figure 33: Individuals who did or did not undertake all the training and development they wanted and needed by length of service ...................................................................................................... 64 Figure 34: Individuals’ perspectives on training and development over the past year ...................... 65 Figure 35: Episodes of training that were of most use to individuals – subject matter ...................... 69 Figure 36: Episodes of training that were of most use to individuals – qualifications ........................ 70 Figure 37: Episodes of training that were of most value to individuals – training provider ................ 71 Figure 38: Episodes of training that were of least value to individuals – subject matter ................... 72 Figure 39: Episodes of training that were of least use to individuals – qualifications ........................ 73 Figure 40: Episodes of training that were of least use to individuals – training provider ................... 74 Figure 41: Comparison of training undertaken in the past academic year, most valuable episode and least valuable episode – subject matter ........................................................................................... 76

4/127 Training Needs Analysis
27/04/2018
Education and Training Foundation
Figure 42: Comparison of training undertaken in the past academic year, most valuable episode and least valuable episode – training provider ........................................................................................ 77 Figure 43: Barriers to providing all of the training and development which was needed ................... 80 Figure 44: Biggest drivers of training and development needs in the next year or so – institutions perspective ...................................................................................................................................... 83 Figure 45: Biggest drivers of training and development needs in the next year or so – national and sector needs .................................................................................................................................... 84 Figure 46: Biggest drivers of training and development needs in the next year or so – own workforce needs .............................................................................................................................................. 86 Figure 47: Biggest drivers of training and development needs in the next year or so – organisational needs .............................................................................................................................................. 87 Figure 48: Biggest drivers of training and development needs in the next year or so – local needs . 88 Figure 49: Staff groups that will need training and development in the next year or so .................... 96 Figure 50: Individuals who think further training and development would be of value ...................... 98 Figure 51: Individuals who think further training and development would be of value ...................... 99 Figure 52: Types of training and development that will be required ............................................... 100 Figure 53: Subject areas where training and development is needed in the next year or so .......... 101 Figure 54: Leadership areas where training and development is needed in the next year or so .... 102 Figure 55: Individuals’ perceptions of training and development that will be required ................... 104 Figure 56: Forms of training and development that will be required ............................................... 106 Figure 57: Individuals that would like to gain qualifications from future training and development.. 112 Figure 58: Level of qualification individuals would like to gain ........................................................ 113 Figure 59: Subject areas where individuals would value training and development ....................... 114 Figure 60: Areas of leadership where individuals would value more training and development ..... 116 Figure 61: Institutions’ confidence that training and development needs will be met ...................... 118 Figure 62: Expectations for training and development budget ....................................................... 118 Figure 63: Organisations from which institutions would welcome support ...................................... 120 Figure 64: Individuals likelihood to undertake new training and development in the next year? ..... 121 Figure 65: Barriers to individuals undertaking training and development in the next year .............. 122 Figure 66: Individuals’ agreement with statements about their employer organisation ................... 125

5/127 Training Needs Analysis
27/04/2018
Education and Training Foundation
EXECUTIVE SUMMARY
Introduction
The vocational skills and knowledge generated by the Further Education sector are critical to
the competence of much of the national workforce and, hence, to national productivity and
competitiveness. In turn, this depends on having a well-managed and highly skilled workforce in
the FE sector itself. However, no comprehensive and systematic picture of gaps in the skills of
that workforce, and of the training needs that such gaps would imply, has previously been
produced.
Thus, sector bodies and the Department for Education (DfE) joined forces under the aegis of the
Education and Training Foundation to undertake a major national exercise to find out what
teachers, trainers, leaders, and institutions across the Further Education (FE) and Training
sector see as their training needs. The Training Need Analysis has been conducted by the ETF,
in partnership with the Association of Colleges (AoC), Association of Employer and Learning
Providers (AELP) and HOLEX, the lead body for Adult and Community Learning providers.
The independent and comprehensive analysis will provide crucial baseline data to ensure future
training for teachers and trainers is aligned with their professional needs and priorities.
The method of study which was used in the research comprised large surveys of education and
training providers and of individuals working in the sector. In addition, a number of in-depth
interviews with providers added qualitative depth to the data provided by the surveys.
Analysis of the characteristics of the 481 training providers that responded to the survey shows
that around half, mainly Independent Training Providers (ITPs), were small with fewer than 50
staff, fewer than 500 learners per year, and operated from a single site. The remaining
organisations, including most of the 107 Colleges which responded, frequently had over 200
staff, several thousand learners per year, and operated from several or multiple sites.
Around half of the 2,366 respondents in the survey of individuals were employed by Colleges,
the remainder being employed by a range of other types of provider, including ITPs, Local
Authorities, and voluntary sector organisations. Most respondents were in full-time teaching or
management positions and a majority had substantial service, often of 20 years or more, in the
FE sector. Where they had particular subject responsibilities, these were spread across a range
of subject areas.

6/127 Training Needs Analysis
27/04/2018
Education and Training Foundation
Overall, the two surveys achieved a substantial volume of response and, assisted by
appropriate weighting, allow an analysis of sector training needs which is generally
representative of the sector as a whole.
Further depth is brought to the study by analysis of an additional 50 in-depth interviews which
were undertaken with senior managers in the sector.
Current training in FE institutions
As context for an understanding of skills gaps and training needs, the extent and character of
current training of managers and staff of training providers in the FE sector were identified in the
research.
Key findings are:
• A high proportion of providers (90%) supply training to their workforces and a high
proportion of the workforce (92%) received training and development in the last year.
This latter proportion compares well with the 63% of the national, all-sectors, workforce
which received training.
• The average amount of training received in the last year was 44 hours (or around five
and a half days). This was distributed across an average of 9 training events or episodes
of training.
• Virtually all providers report giving high priority to workforce training and development.
• This high level of training is not selective: all occupational groups in the workforce were
more-or-less equally likely to receive training.
• However, workers in support functions, such as teaching assistants or other support
workers, received, on average, only around half the hours of training reported by other
groups of staff.
• A wide variety of training modes were used, with day-long sessions (‘inset days’ in some
cases), attendance at conferences and workshops, short training courses, and on-line
training being most frequent.
• Key subjects of training and development, in terms of the numbers of individuals
involved, included: teaching and classroom competences (including, particularly, the use
of digital and other new technologies in teaching and learning); leadership and
management skills; and subject knowledge, particularly in maths and English
• The major sources of workforce training and development are specialist trainers or
training units within respondents’ organisations, external private training companies, and
coaching and mentoring of more junior staff by more senior staff.
• Organisations trained their workforces for a variety of reasons, including, most
frequently: improvement in staff performance; maintenance of the organisation’s overall
performance, competiveness, and reputation; and the need to keep up with public policy
change.

7/127 Training Needs Analysis
27/04/2018
Education and Training Foundation
• Eight out of ten organisations in the sector have a formal budget for training. Small
private sector training businesses of course have smaller average budgets than large FE
colleges but the former’s expenditures per trainee are considerably higher.
• Where training and development involved payment of fees or other direct costs,
employers were the dominant source of those fees – only 15% of individual workers in
the sector paid wholly or partly for episodes of training and development.
• However, although employers were the main source of funding for training, individuals
were very often wholly or partly involved in the decision to train.
• Alongside budgets for training, most providers have other elements of a training
infrastructure in place – nine out of ten have a training and development plan and
operate formal methods for identifying training needs. However, rather fewer, around
two-thirds, formally assess outcomes of their workforce training.
Overall, research findings indicate the presence of a strong training culture in the sector, of
which frequent and varied training activity is a reflection.
The adequacy and sufficiency of current training The research further examined the extent to which current training, in the opinion of institutions
and individuals, supplies the skills and knowledge which the sector needs in order to meet the
demands and challenges it faces.
Key findings are:
• A majority of providers regard their budget for training and development as sufficient but
around a quarter do not.
• However, nine out of ten providers report that their recent training and development
activities met most or all of their training needs.
• Where providers reported any deficiencies or gaps in their training, these most frequently
concerned leadership and management skills, skills in the teaching of maths and
English, and competence in the use of digital and other new technologies in teaching
programmes.
• As with organisations, around a quarter of people working in the sector reported that they
did not receive all the training they wanted or needed.
• Substantial minorities, of over a third in each case, of FE sector staff also reported that
some training they undertook was of little value to them or was just ‘tick box’ training to
meet organisational or external requirements.
• A smaller minority, however, only 12%, said that their training was of low quality.
• Where members of staff had undertaken more than one episode of training, they most
frequently reported that training in teaching or classroom skills, training related to
Prevent and safeguarding, training in leadership and management skills, and training
related to well-being and mental health were most valuable.
• However, smaller minorities of staff could also identify some of these areas, such as
training related to Prevent and safeguarding, as their least valuable training.

8/127 Training Needs Analysis
27/04/2018
Education and Training Foundation
• Data from the survey of individuals also suggest that training which is of longer duration,
which leads to a qualification, and which is externally provided is somewhat more likely
to be seen as valuable.
• Key barriers to training, for both organisations and individuals, are shortfalls in available
funding and pressures on staff time which make it difficult to release them for training.
Overall, it is suggested that, whilst the sector has a high level of organisational and individual
participation in training and development, this participation does not meet all needs and, if
budget and time permitted, there is scope and demand for additional training, with a particular
focus on leadership and management, maths and English, and use of digital and other new
technologies for teaching and learning.
However, whilst most organisations did not believe that the supplied training was not valuable, a
substantial minority of sector staff believed that some of the training they undertook was not
particularly productive – seeing it as being of little value to them or as ‘tick box’ training for their
employers. Much of this training may, however, be a statutory requirement.
Future training needs Against the background of evidence of a high volume and wide spectrum of training undertaken
by FE sector staff but also of some gaps in training and in the infrastructure for training,
institutions’ and individuals’ perceptions of the need for future training and development are
considered.
Ensuring the effective performance of the organisation will be the most frequent driver of the
training supplied in the near future by organisations, but the needs of the workforce (particularly
to adapt staff moving into the sector from other sectors and to keep staff up-to-date) and the
direction of national policy (particularly in respect of apprenticeships) are other key drivers – the
last of these being particularly important for private training businesses.
However, some key priorities for future training were not directly concerned with themes of
training but with its delivery methods. Particularly, there is much interest in using technology in
training by introducing or extending the use of on-line and other methods of distance learning
and virtual learning environments.
In realising their priorities, key challenges for providers remain the ones they face now –
restriction on budgets and the difficulty of releasing staff for training. Though not directly a
training issue, some providers noted staff recruitment and retention difficulties, often because of
wage competition from employment opportunities in teachers’ or potential teachers’ ‘home’
industries, as a constraint on skills supply.
Providers most frequently saw their ‘core’ workforce (in the sense of being most numerous in
the sector) – teachers, trainers, and managers – as in need of training in the near future.
And two-thirds (68%) of staff working in the sector report that further training would be of value
to them.
There is demand for training in a wide variety of areas but subject knowledge, leadership and
management skills, and teaching and classroom competences remain the most frequent areas
of demand.

9/127 Training Needs Analysis
27/04/2018
Education and Training Foundation
From the individual perspective, there is particular demand for training which leads to higher
level qualifications in education and training such as PGCE or the Diplomas in Education and
Training (DET).
In respect of their future training needs, six out of ten providers are wholly confident that their
future training needs will be met and most of the remainder are reasonably confident of this. In
support of this, a majority (59%) of providers expect their training budgets to stay the same next
year as they were in the previous year, and the minority (16%) which expect their budget to
decline, is balanced by the minority (15%) which expect it to increase (though it may be noted
that it is larger providers, often colleges, which on balance, are most pessimistic about their
future budgets for training).
Although, as above, organisations are generally confident about their future training, around
two-thirds would still welcome support (from ETF, the Department for Education, and
membership bodies) with realisation of their training ambitions and objectives.
Individuals working in the sector were also mainly confident that they would undertake new
training or development in the near future, with over seven out of ten expecting this.

10/127 Training Needs Analysis
27/04/2018
Education and Training Foundation
CHAPTER 1: INTRODUCTION
Summary of chapter
The vocational skills and knowledge generated by the Further Education sector are critical to
the competence of much of the national workforce and, hence, to national productivity and
competiveness. In turn, this depends on having a well-managed and highly skilled workforce in
the FE sector itself. However, no comprehensive and systematic picture of gaps in the skills of
that workforce, and of the training needs that such gaps would imply, has previously been
produced.
Thus, sector bodies and the Department for Education (DfE) joined forces under the aegis of the
Education and Training Foundation to undertake a major national exercise to find out what
teachers, trainers, leaders, and institutions across the Further Education (FE) and Training
sector see as their training needs. The Training Need Analysis has been conducted by the ETF,
in partnership with the Association of Colleges (AoC), Association of Employer and Learning
Providers (AELP) and HOLEX, the lead body for Adult and Community Learning providers.
The analysis will provide crucial baseline data to ensure future training for teachers and trainers
is aligned with their professional needs and priorities.
The method of study which was used in the research comprised large surveys of education and
training providers and of individuals working in the sector. In addition, a number of in-depth
interviews with providers added qualitative depth to the data provided by the surveys.
Analysis of the characteristics of 481 training providers which responded to the survey shows
that around half, mainly Independent Training Providers (ITPs), were small with fewer than 50
staff, fewer than 500 learners per year, and operated from a single site. The remaining
organisations, including most of the 107 Colleges which responded, frequently had over 200
staff, several thousand learners per year, and operated from several or multiple sites.
Around half of the 2,366 respondents in the survey of individuals were employed by Colleges,
the remainder being employed by a range of other types of provider, including ITPs, Local
Authorities, and voluntary sector organisations. Most respondents were in full-time teaching or
management positions and a majority had substantial service, often of 20 years or more, in the
FE sector. Where they had particular subject responsibilities, these were spread across a range
of subject areas.

11/127 Training Needs Analysis
27/04/2018
Education and Training Foundation
Overall, the two surveys achieved a substantial volume of response and, assisted by
appropriate weighting, allow an analysis of sector training needs which is generally
representative of the sector as a whole.
Further depth is brought to the study by analysis of an additional 50 in-depth interviews which
were undertaken with senior managers in the sector.
Purposes of the study
The scale, nature, and quality of vocational education and training of people aged 16 and over
but outside of universities and other institutions of higher education is recognised as an
important factor in national competitiveness and productivity.
The organisations which provide this education and training – school sixth forms to some extent,
but mainly Further Education colleges, privately-owned training companies, Local Authority
training organisations, and a range of organisations in the voluntary sector – and the systems by
which they are funded and governed have, in recent years, come under consistent pressure to
increase their contribution to national efficiency.
Most recently, on-going public policies to reform the FE system and the national apprenticeship
programme were extended, particularly by the Post-16 Skills Plan (CM9280, HM Government,
July 2016), which, amongst other things, seeks the development of much stronger technical
education and of clearer vocational ‘routes’ from school education into employment, seeks
simplification of the array of vocational qualifications, and emphasizes the need for the FE
sector to respond to employer needs.
The Skills Plan correspondingly recognises that progress towards achievement of its various
ambitions will be dependent on the existence and operations of ‘strong and dynamic colleges
and other training providers’ and, in turn, on the governance, management, and teaching skills
of those organisations.
Essentially, a skilled national workforce cannot be generated by inadequately managed or
under-skilled teachers and tutors.
Particularly, therefore, the Skills Plan proposed that substantial annual grants should be
awarded to ETF1 to extend their training programmes which help FE sector staff to enhance
their knowledge and skills. The efficient design, allocation, and development of these
programmes essentially depends on knowledge of need – how prevalent is under-skilling in the
sector? Who needs more training and what in? What are the barriers to workers in the sector
accessing the training they need? And how can those barriers be overcome?
However, while small-scale research studies in the sector and anecdotal contact with people
working in it have revealed some skills gaps and training needs, there has been no previous
systematic attempt to gain a reliable picture of training needs across the sector as a whole as a
basis for future planning and development. This research provides that picture.
1 The Education and Training Foundation (ETF) is a government-backed national support body for the Further Education sector. At the time of the research, ETF was supported by the Association of Colleges (AoC), the Association of Education and Learning Providers (AELP), and Holex, the lead body for Adult and Community Learning providers.
12/127 Training Needs Analysis
27/04/2018
Education and Training Foundation
Method
The study sought to get two perspectives on training needs in the sector – that of learning
providers as organisations and that of individuals working in the sector. Thus, the method
comprised:
• A telephone survey of 481 learning providers. This survey included 107 Further
Education and Sixth Form Colleges, 43 Local Authority training organisations, 210
Independent Training Providers (essentially private training companies), and 62
charitable or voluntary organisations which provide training to varying groups of people.
The 210 Independent Training Providers (ITPs) included 121 which were primary
contractors to the Education and Skills Funding Agency2 (ESFA) and 89 which had sub-
contract relationships with primary ESFA contractors. Telephone interviews, typically
lasting between 20 and 30 minutes, were conducted with senior managers able to
describe and discuss the training activities and needs of their organisations.
In addition to these groups of training providers, a number of providers which are not
funded, either directly or indirectly, by the ESFA were surveyed. This latter group of
providers (called Learning and Development Providers or LDPs on the advice of the
project steering group) were found to be quite distinctive in their approach to staff
training and development and therefore will be the subject of a separate report and are
not addressed in this document.
• An on-line survey of 2,366 governors, senior managers, teaching, and teaching-
related staff in the FE sector. Support staff (such as administrative and secretarial,
maintenance, catering, or cleaning staff) were not a primary target of the survey but a
small number were included. The basic method of this survey was to set up an on-line
questionnaire to which respondents could connect via a ‘click-on’ link in an e-mail which
described the survey’s purposes and encouraged their co-operation. The e-mail was
distributed to potential respondents by social media and via employing organisations
which had agreed to help the survey by distributing the e-mail to qualifying staff.
Participation in the survey was encouraged by a variety of marketing activity undertaken
by ETF and its founder members, the Association of Colleges (AoC), the Association of
Employment and Learning Providers (AELP), and Holex, the lead body for Adult and
Community Learning providers.
• A programme of 50 in-depth telephone discussions with senior representatives of
FE sector organisations, including public, private, and voluntary sector organisations.
The purpose of this programme was to add the kind of depth of understanding and
insights which would not be gained from the mainly structured interviews used in the first
survey described above.
In all three cases, the interviews and discussions, either from an institutional or individual
perspective, focussed on recent training activity, adequacy of that activity in relation to skill
development needs, barriers to staff participation in training, foreseeable future training needs,
and needs for support to improve the likelihood of training taking place.
2 The Education and Skills Funding Agency is the agency of the government which is accountable for funding education and skills development for children, young people, and adults

13/127 Training Needs Analysis
27/04/2018
Education and Training Foundation
In the case of the two main surveys, survey data has been weighted to reflect the relative sizes,
in terms of employee numbers in the FE sector’s sub-sectors (Colleges, Local Authority training
organisations, private sector Independent Training Providers, and charitable and voluntary
organisations). This weighting ensures that the positions and views of organisations and of staff
are represented, in statistics which describe the sector as a whole, in their due proportions.
A more detailed statement of the research method is set out in Appendix 1 of this report.
Response: participants in the surveys
Whilst, as noted above the main survey analyses are based on weighted data, the actual
samples which were achieved in the survey are described in this initial set of data without
weighting. The aim is to show the main characteristics of the institutions and individuals on
which subsequent analysis is based.
Please note that, to aid clarity, in the rest of this report, ‘colour coding’ is used in tables
and charts to distinguish findings from the institutions survey, in blue, from those from
the individuals survey, in magenta.
The sample of institutions
Starting with responses to the institutional survey, Figure 1 (following), shows that colleges and
ITPs were major contributors to the survey of institutions, but that Local Authority and charitable
or voluntary organisations were also substantially represented.
Figure 1: Number of FE providers contributing to the Training Needs Analysis
In terms of the size of responding institutions, Colleges, as would be expected, are generally
likely to be much larger than other types of provider. At the other end of the size scale, ITPs and
charitable/voluntary training organisations are most likely to be small, generally having fewer
than 50 staff and often no more than 10 (see Table 1).
481
107
43
121
89
62
Total
Colleges
Local Authorities
ITPs Prime contractors
ITPs Sub-contractors
Charitable/Voluntary

14/127 Training Needs Analysis
27/04/2018
Education and Training Foundation
Table 1: Number of staff of all types and at all levels employed by providers
Total Colleges
Local Authorities
ITPs Prime contractors
ITPs Sub-contractors
Charitable/Voluntary
1 to 10 employees 24% 0% 7% 17% 47% 50%
11 to 49 employees 31% 1% 19% 52% 45% 31%
50 to 199 employees 13% 9% 26% 22% 4% 8%
200 or more employees 20% 70% 23% 2% 0% 2%
Don't know 12% 20% 26% 6% 3% 10%
Sample base 481 107 43 121 89 62
Q6. In total, how many staff of all types and at all levels, does your organisation employ across all its sites,
including yourself?
A small majority of providers, typically smaller ITPs, operate from only one site, whilst the
remainder, typically Further Education and Sixth Form Colleges, operate from several or
multiple sites (see Figure 2).
Figure 2: Number of permanent sites from which providers operate
Sample base: 481
Q2. How many permanent sites does your organisation operate from? Please exclude any sites which you use
occasionally or those where you are not the primary user.
* denotes a figure greater than zero, but less than 0.5%
51%
37%
6%
5%
1%
*%
One site only
2 to 5 sites
6 to 10 sites
More than 10 sites
Don't know
Refused

15/127 Training Needs Analysis
27/04/2018
Education and Training Foundation
The number of learners taught or trained by providers in the year prior to the survey varied
substantially, from fewer than 50 to more than 5,000 (see Figure 3 following), with the larger
institutions, of course, being more likely to have greater numbers of learners.
Figure 3: Number of FE learners for which providers were responsible in the last
academic year
Sample base: 481
Q4b. For how many FE learners or students was your organisation across all its sites responsible in the last
academic year?
* denotes a figure greater than zero, but less than 0.5%
However, while Colleges tend to be substantially larger than other types of provider, they are
also more locally focussed than many of the private training companies which make up the bulk
of the ITP group. Table 2 (following) shows that, while around a third of colleges have multi-
regional or national operations, this is true of two-thirds of those ITPs which are prime
contractors to the ESFA.
Table 2: Number of regions in which providers operate
Total Colleges
Local Authorities
ITPs Prime contractors
ITPs Sub-contractors
Charitable/Voluntary
One region only 51% 66% 98% 31% 45% 56%
More than one region 23% 14% 2% 36% 28% 19%
Nationally 26% 19% 0% 33% 27% 24%
Don't know *% 1% 0% 0% 0% 0%
Sample base 481 107 43 121 89 62
Q3. Does your organisation operate in one region only, in more than one region, or nationally?
* denotes a figure greater than zero, but less than 0.5%
10%
21%
16%
11%
25%
13%
4%
*%
Fewer than 50
51 to 200
201 to 500
501 to 1000
1001 to 5000
5001 or more
Don't know
Refused

16/127 Training Needs Analysis
27/04/2018
Education and Training Foundation
The sample of individuals
Turning to the parallel survey of individuals who work in the FE sector in some capacity or other,
a further table (Table 3) shows the location of main employment of the 2,366 respondents in this
survey. Corresponding with the large size of the colleges sub-sector, around half of respondents
were employed in FE or Sixth Form Colleges with smaller numbers employed across the range
of other sub-sectors. It can also be seen that, in the survey of individuals, 131 respondents are
classified as employees within an ‘others’ category. In this case, these respondents worked for
organisations such as awarding bodies, were individuals delivering ETF training and
development, or in a small number of cases, were FE staff who were currently between jobs.
Table 3: Number of FE individuals contributing to the Training Needs Analysis
Sample size
Total 2,366
Colleges 1,125
Local Authorities 498
ITPs Prime contractors 204
ITPs Sub-contractors 70
Learning and Development Providers No ESFA funding 46
Learning and Development Providers (unsure of funding) 60
Charitable/Voluntary 114
Training division or unit of an employer 62
Education service within a prison or offender institution 25
Others 131
Prefer not to say 31
Q13. Have you received any of the following types of training or development activity in the last academic year?
The next figure, Figure 4, shows the roles played by respondents in their respective
organisations. The larger proportions of respondents were in management or teaching roles.
Data (not shown in the figure) also shows that, while the combined proportions are similar,
respondents from Colleges and other public and voluntary sub-sectors more often classified
themselves as ‘lecturer, teacher or trainer’ than as ‘specialist assessor or verifier, trainer or
instructor’ whereas the reverse was the case for respondents from ITPs.
Another study sponsored by ETF is an analysis of workforce data reported annually by around
200 organisations in the FE sector, recorded as the Staff Individualised Record or SIR, and
published in annual reports titled ‘Further Education Workforce Data for England’. Data allows
only a limited comparison of occupational structures between the two studies because the
categorisations of job roles used in the two studies are dissimilar. However, this study suggests
that the sector has more managers and fewer support staff than does the SIR data.

17/127 Training Needs Analysis
27/04/2018
Education and Training Foundation
Figure 4: Job roles of individuals
Sample base: Total: 2366
Q2. Which of the following best describes your role at your main employer?
Those respondents who had a role related to one or more subject areas – around 7 out of 10 of
all respondents – were spread across a wide variety of these areas (see Figure 5 following).
More detailed analysis (not shown in Figure 5) of respondents’ subject areas again
distinguishes colleges from other provider groups, particularly from ITPs.
The difference is that College staff were less likely to report that they had roles across several
subject areas. The larger size of Colleges may allow greater specialisation whereas other types
of provider more often require people able to work across varied subject areas. It is also evident
that providers other than Colleges, particularly ITPs, are heavily engaged in a mix of fields
which are preparing people for work rather than giving them skills and knowledge in particular
areas relevant to particular employment sectors – these ‘essential’ areas include ‘Education and
Training’, English, ICT, Maths, and ‘Preparation for life and work’.
Data from the Staff Individualised Record (SIR)3 offers a quite different picture of individuals’
subject specialisms, with the TNA recording a higher proportion of teaching staff working in the
areas of Education and Training, English, and maths. However, the SIR only allows for one
subject area per contract to be recorded, while the TNA individual questionnaire allowed for
respondents to select as many subjects as they felt applied to their work.
3 Include link to SIR when published
32%
20%
13%
9%
8%
5%
3%
2%
2%
1%
1%
4%
1%
Lecturer, teacher or tutor
Middle and junior manager
Senior Management Team
Specialist assessor or verifier, trainer or instructor
Support worker in an administrative or clerical role
Teaching, learning, or classroom assistant
Advanced practitioner
Specialist coach, mentor, or staff trainer
Support worker in areas such as maintenance, security,catering, or cleaning
Governors or Equivalent
Careers guidance specialist
Other role
Prefer not to say

18/127 Training Needs Analysis
27/04/2018
Education and Training Foundation
Figure 5: Subject or curriculum areas in which individuals work
Sample base: Total: 2366
Q9. If you work in a particular subject or curriculum area or areas please select these below.
* denotes a figure greater than zero, but less than 0.5%
Respondents from all of the FE sub-sectors had most frequently worked in the FE sector for
substantial periods of time, most frequently between 10 and 20 years, but often for more than
20 years (see Figure 6 following).
22%
19%
16%
13%
11%
11%
10%
6%
5%
5%
5%
4%
4%
4%
3%
3%
2%
2%
2%
*%
5%
28%
1%
Education and training
English
Maths
Preparation for life and work
Health, public services, and care
ICT
Business administration and law
Engineering and manufacturing
Arts, media, and publishing
Community development
Family learning
Construction planning and the built environment
Leisure, travel, hospitality, and tourism
Retail and commercial enterprise
Languages, literature and culture
Science
Agriculture, horticulture, and animal care
Humanities subjects
Social science
Is there any other subject area not mentioned?
Just subject knowledge generally/across all areas
Position not specific to subject(s)
Not specified

19/127 Training Needs Analysis
27/04/2018
Education and Training Foundation
Figure 6: Time individuals have worked in the further education and training sector
Sample base: Total: 2366
Q8. For how many years in total have you worked in the further education and training sector?
Two-thirds of respondents (four-fifths in ITPs) were full-time employees with most of the
remainder working part-time (see Figure 7). Data from the Staff Individualised Record (SIR),
however, suggests that a much higher proportion of staff than work part-time than is recorded
here.
Figure 7: Current working status of individuals
Sample base: Total: 2366
3%
7%
24%
43%
22%
1%
Less than 1 year
1 year but less than 3 years
3 years but less than 10 years
10 years and up to 20 years
More than 20 years
Prefer not to say
64%
26%
8%
1%
1%
Full time, working 35 or more hours per week
Part time, working less than 35 hours per week
Sessional
None of these, working on a voluntary basis
Prefer not to say

20/127 Training Needs Analysis
27/04/2018
Education and Training Foundation
Q12. Which of the following best describes your current working status within your institution?
In demographic terms, two-thirds of respondents were female (see Figure 8). By comparison,
the Staff Individualised Record (SIR) estimates a slightly lower percentage (62%) of female
staff.
Figure 8: Gender of individuals
Sample base: Total (2366), Colleges (1125), Local authority (498), ITPs Prime contractors (204), ITPs Sub-
contractors (70), Charitable (114), Other (133)
Q39. Please describe your gender identity.
* denotes a figure greater than zero, but less than 0.5%
As in Staff Individualised Record data, the great majority of respondents have a ‘white’ ethnicity
(see Figure 9 following).
69%
67%
80%
67%
66%
65%
52%
28%
30%
16%
31%
33%
32%
47%
*%
*%
1%
1%
3%
3%
3%
1%
1%
2%
Total
Colleges
Local Authorities
ITPs Prime contractors
ITPs Sub-contractors
Charitable/Voluntary
Other
Female Male X Other Prefer not to say

21/127 Training Needs Analysis
27/04/2018
Education and Training Foundation
Figure 9: Ethnicity of individuals
Sample base: Total (2366), Colleges (1125), Local authority (498), ITPs Prime contractors (204), ITPs Sub-
contractors (70), Charitable (114), Other (133)
Q40. What is your ethnicity?
* denotes a figure greater than zero, but less than 0.5%
And, consistent with frequent substantial length of service in the sector (as above) and with
findings from the Staff Individualised Record, the great majority of respondents were in middle
and later years of working life (see Figure 10 following).
85%
85%
83%
92%
86%
82%
86%
2%
2%
1%
1%
3%
2%
2%
4%
3%
7%
*%
3%
4%
5%
4%
4%
2%
4%
7%
6%
6%
1%
1%
1%
*%
Total
Colleges
Local Authorities
ITPs Prime contractors
ITPs Sub-contractors
Charitable/Voluntary
Other
White Mixed/Multiple ethnic groups
Asian/Asian British Black/African/Caribbean/Black British
Other

22/127 Training Needs Analysis
27/04/2018
Education and Training Foundation
Figure 10: Age of individuals
Sample base: Total (2366), Colleges (1125), Local Authority (498), ITPs Prime contractors (204), ITPs Sub-
contractors (70), Charitable (114), Other (133)
Q42. What is your age?
* denotes a figure greater than zero, but less than 0.5%
The qualitative sample
The qualitative research element of the study comprised 50 in-depth interviews undertaken on
the telephone, each interview lasting around 30-45 minutes.
The organisations which contributed to this element included:
• 10 Further Education or Sixth Form Colleges
• 7 charitable or voluntary organisations
• 11 Independent Training Providers Primary Contractors
• 13 Independent Training Providers Sub-contractors
• 9 Adult Community Learning colleges or Local Authority Adult Education providers
Respondents from these organisations were all senior managers. Their roles were varied and
included Managing or other Directors of private training companies, Assistant Principals of FE or
Sixth Form Colleges, HR managers, and Heads of other departments and functions (such as
workforce development, operations, quality, and adult skills).
1%
1%
*%
1%
3%
2%
8%
10%
5%
12%
9%
4%
4%
17%
19%
14%
18%
11%
18%
14%
33%
32%
38%
31%
41%
28%
38%
32%
31%
34%
30%
37%
35%
33%
4%
3%
3%
5%
1%
10%
8%
4%
5%
5%
2%
2%
3%
Total
Colleges
Local Authorities
ITPs Prime contractors
ITPs Sub-contractors
Charitable/Voluntary
Other
14-24 25-34 35-44 45-54 55-64 65+ Prefer not to say

23/127 Training Needs Analysis
27/04/2018
Education and Training Foundation
The organisations that took part in the qualitative stage varied in terms of the number of staff
that they employ and the number of learners for whom they are typically responsible over the
course of an academic year:
Sample size
Total 50
10 or less employees 11
11 – 20 employees 10
21 – 50 employees 5
51 – 200 employees 12
201 – 500 employees 5
More than 500 employees 7
Sample size
Total 50
Up to 100 learners 8
101 – 200 learners 3
201 – 500 learners 10
501 – 1,000 learners 4
1,001 – 2,000 learners 8
2,001 – 5,000 learners 8
More than 5,000 learners 8
Don’t know 1

24/127 Training Needs Analysis
27/04/2018
Education and Training Foundation
CHAPTER 2: CURRENT TRAINING IN FE INSTITUTIONS
Summary of chapter
As context for an understanding of skills gaps and training needs, the extent and character of
current training of managers and staff of training providers in the FE sector is identified and
described.
Key findings are:
• A high proportion of providers (90%) supply training to their workforces and a high
proportion of the workforce (92%) received training and development in the last year.
This latter proportion compares well with the 63% of the national, all-sectors, workforce
which received training.
• The average amount of training received in the last year was 44 hours (or around five
and a half days). This was distributed across an average of 9 training events or episodes
of training.
• Virtually all providers report giving high priority to workforce training and development.
• This high level of training is not selective: all occupational groups in the workforce were
more-or-less equally likely to receive training.
• However, workers in support functions, including learning support staff, received, on
average, only around half the hours of training reported by other groups of staff.
• A wide variety of training modes were used, with day-long sessions (‘inset days’ in some
cases), attendance at conferences and workshops, short training courses, and on-line
training being most frequent.
• Key subjects of training and development, in terms of the numbers of individuals
involved, included: teaching and classroom competences (including, particularly, the use
of digital and other new technologies in teaching and learning); leadership and
management skills; and subject knowledge, particularly in maths and English.
• The major sources of workforce training and development are specialist trainers or
training units within respondents’ organisations, external private training companies, and
coaching and mentoring of more junior staff by more senior staff.

25/127 Training Needs Analysis
27/04/2018
Education and Training Foundation
• Organisations trained their workforces for a variety of reasons, including, most
frequently: improvement in staff performance; maintenance of the organisation’s overall
performance, competiveness, and reputation; and the need to keep up with public policy
change.
• Eight out of ten organisations in the sector have a formal budget for training. Small
private sector training businesses of course have smaller average budgets than large FE
colleges but the former’s expenditures per trainee are considerably higher.
• Where training and development involved payment of fees or other direct costs,
employers were the dominant source of those fees – 15% of individual workers in the
sector paid wholly or partly for episodes of training and development.
• However, although employers were the main source of funding for training, individuals
were very likely to be wholly or partly involved in the decision to train.
• Alongside budgets for training, most providers have other elements of a training
infrastructure in place – nine out of ten have a training and development plan and
operate formal methods for identifying training needs. However, rather fewer, around
two-thirds, formally assess outcomes of their workforce training.
Overall, research findings in this chapter indicate the presence of a strong training culture in the
sector of which frequent and varied training activity is a reflection.
Incidence and volume of training
A first analysis looks at the proportion of staff who received training in the academic year prior to
survey (2016-2017).
Responses from institutions show that participation in some form of training is very frequent.
The institutions survey suggests that 9 out of 10 staff received some training with higher
proportions in ‘public’ institutions (Colleges and Local Authority training organisations) than in
institutions in the private and voluntary sectors (ITPs and charitable and voluntary training
organisations).
‘Triangulation’ of this picture using responses from the individuals’ survey, confirms this positive
picture. Responses from this survey suggest that 92% of respondents, a marginally higher
figure than the 90% estimate from the institutions survey, reported that they received some
training in the last year.
In this second case, there was a high level of training reported across all the sub-sectors
including ITPs and charitable and voluntary training organisations. The variation between the
two surveys is explained by the fact that the figure for institutions was calculated from a
question which simply asked them how many staff received ‘formal training and development’
whereas the question for individuals prompted for their participation in training with a substantial
list of possible forms of training and development which included some less formal forms of
training such as coaching and mentoring, and work shadowing.
The two sets of estimates, from the institutions and individuals surveys, are compared in Figure
11 (following).

26/127 Training Needs Analysis
27/04/2018
Education and Training Foundation
Figure 11: Proportion of staff and individuals who received formal training and
development in the past year – institutional and individual perspectives
Sample base: Staff - Total (49,782), Colleges (31,855), Local Authorities (6203), ITPs Prime contractors
(5019), ITPs Sub-contractors (1254), Charitable (1149)
Q20. How many staff have received formal training and development over the past year?
Individuals Total (2366), Colleges (1125), Local Authorities (498), ITPs Prime contractors (204), ITPs Sub-
contractors (70), Charitable (114), Other (133)
Q13. Have you received any of the following types of training or development activity in the last academic
year?
This positive picture – of widespread participation in training – is reinforced by the fact that
training was, on average, of significant length (an average of 44 hours per individual trained)
and that individuals who were trained had fairly substantial numbers of episodes of training – an
average of 9 per individual (see Table 4 following).
88%
90%
92%
74%
79%
67%
92%
91%
97%
94%
96%
93%
94%
Total
Colleges
Local Authorities
ITPs Prime contractors
ITPs Sub-contractors
Charitable/Voluntary
Others
Proportion of staff who received formal training and development in the past yearProportion of individuals who received training and development in the past year

27/127 Training Needs Analysis
27/04/2018
Education and Training Foundation
Table 4: Mean hours of training and number of episodes of training received in the past
year – individuals’ perspective
Total Colleges
Local Authorities
ITPs Prime contractors
ITPs Sub-contractors
Charitable/ Voluntary Others
Mean hours of training in the last year
44 38 37 53 70 41 61
Sample base 2366 1125 498 204 70 114 133
Mean number of separate episodes of training or development you undertook in the last year
9 8 9 11 8 8 9
Sample base 2184 1022 479 193 67 106 126
Q18. In total, how many hours of training and development would you estimate you received in the last
academic year?
Q25. Could you say how many separate episodes of training or development you undertook in the last year?
Overall, thus the two surveys do not deliver any prima facie evidence of major deficiencies in FE
sector training just from their account of training participation. An overall figure of around 90%
for participation in training and development compares well with 63% participation for the all-
sector UK workforce and with 75% for the whole education sector workforce (including schools
and higher education institutions as well as the FE sector).4
Additionally, the above-average level of participation in training does not appear to be at the
expense of below-average training duration. Thus, the average duration of training shown in
Table 4 (above) of 44 hours is comparable with the average of 5.5 days’ training for workers in
the whole UK education sector. While the average duration of training across all UK sectors is
somewhat higher, at 6.8 days per trainee, that average is inflated by higher training durations in
the retail and hospitality sectors which tend to have high labour turnover and, in the latter case,
a relatively frequent requirement for environmental health and food safety training.5
This picture, of very substantial training activity in the sector, is reinforced by the views of senior
managers expressed in the in-depth interviews undertaken as part of this research. The great
majority of these managers identified staff training and development as a high priority for their
organisations. Various reasons for giving a high priority to training were given, including…
Investors in People status....
“It's very important to us. We've just set up a senior leadership team and have got
Investors in People status and so are focussing on training and development.” (Charity)
Rising demands on staff…
4 Figures from the latest national Employer Skills Survey (UKCES/DFE) 2015 5 Figures from the latest national Employer Skills Survey (UKCES/DFE) 2015

28/127 Training Needs Analysis
27/04/2018
Education and Training Foundation
“It's crucial. It is what I’m responsible for. There's an increasing expectation on lecturers
and so they need training and development to allow them to do everything that they need
to do. They have to be more productive. It means that we are moving away from full day
training or CPD courses to a little and often approach with a tight cycle. We're doing
more learning walks, peer observations and one-to-one mentoring and coaching.” (FE
College)
Apprenticeship reform……
“It's very important. There have been a lot of changes. Apprenticeship reforms have
meant that we have had to upskill in terms of teaching and learning training.” (ITP
primary contractor)
Technological and legislative change…..
“It's really important. We have to make sure that they are up-to-date on technical
knowledge. We also have to make sure they are up-to-date on regulations, such as the
new electrical regulations. We are driven by industry. When legislation changes we have
to focus more on training and development to make sure that they are up-to-date.” (ITP
sub-contractor)
Staff retention…..
“Staff training is prioritised in order to minimise turnover: if you can up-skill the workforce
that you’ve got, you’re going to then be more able to promote them in your organisation,
keep them in your organisation. We place emphasis on funding and supporting
qualifications for teaching and learning staff. Lesson observation data is regularly
collected, and our strategy is reviewed annually. Decisions are made at senior
leadership level then signed off by the governing body.” (FE College)
“It's very important for us to train our staff as further education is a moving picture. It is
important to develop our staff so that they continue to move up and progress within the
college. We develop our staff so we aren't constantly having to go into the market for
new staff. It’s important to us because the learner’s experience is only as good as the
staff.” (FE College)
HR procedures…..
“The Staff Development Plan is almost a golden thread running through all of our other
documentation. Staff are set tailored plans (usually by line managers) in a yearly
development meeting, the progress of which is monitored in one-on-one sessions every
4-6 weeks. The broader plan is closely aligned to the service improvement plan which
addresses the staff body as a whole, and is reviewed quarterly by senior management
team.” (Local Authority)
Regulation…..
“It's a high priority as energy and utilities is a heavily regulated sector. We have recently
set up an internal teaching programme and we are waiting for Pearson to approve it. We
also do a lot of training on safeguarding, health and safety, and data protection.” (ITP
primary contractor)
29/127 Training Needs Analysis
27/04/2018
Education and Training Foundation
However, in a small number of cases, respondents recognised limitations on what the
organisation delivered. In two examples, this was because of reluctance to train staff to the
benefit of competitors or because of more pressing business issues:
“Meeting the requirements that are needed for staff to do their job is important, but there
is not much focus on training over and above what is expected. This is because a lot of
our assessors are part time and work for other people. We don’t want to pay for training
that they're going to go away and use with other providers. Every member of staff gets
the training they require to do the job but there is very little on top of that. The icing on
the cake stuff isn't, at the moment, being taken care of.” (ITP sub-contractor)
“If I had full time assessors then I'd invest a lot more in them but I use assessors that
only teach 5 learners for me, and that's the problem with the current market.” (ITP sub-
contractor)
“It's imperative to our organisation, but it doesn't get enough attention. It tends to get lost
on a day-to-day basis. Training and development gets pushed aside as business needs
take over.” (ITP sub-contractor)
Who gets trained?
Two further analyses (see Table 5 and Figure 12 following), from the surveys of institutions and
of individuals respectively, coincide in suggesting that not only is participation widespread in
general terms but that the overall statistics do not conceal any group within the workforce which
is substantially neglected in terms of its training and development. There is, however, one
possible minor issue (see Table 5), concerning the somewhat lower level of frequency of
training of those involved at governance level in providers other than Colleges.

30/127 Training Needs Analysis
27/04/2018
Education and Training Foundation
Table 5: Groups of staff for which organisations provided training and development in
the past year
Total Colleges
Local Authorities
ITPs Prime contractors
ITPs Sub-contractors
Charitable/Voluntary
Members of the governance body of the organisation/ Non-employed governors or trustees/ Non-executive owners or board directors
86% 90% 65% 75% 70% 68%
Senior Management Team 91% 92% 88% 90% 85% 83%
Middle and junior managers 94% 94% 92% 96% 89% 82%
Advanced practitioners 93% 95% 93% 91% 90% 63%
Lecturers, teachers or tutors 94% 94% 95% 97% 96% 83%
Specialist assessors, verifiers, trainers or instructors
94% 95% 94% 98% 96% 84%
Careers guidance specialists 91% 93% 93% 91% 83% 61%
Specialist coaches, mentors and staff trainers
93% 94% 96% 96% 90% 76%
Teaching, learning, and classroom assistants
92% 92% 92% 98% 93% 88%
Sample base varies
Q18. Does your organisation have people who fit into each of the following categories? / Q19. And which of
these groups have your organisation supported or provided training and development to in the past academic
year?

31/127 Training Needs Analysis
27/04/2018
Education and Training Foundation
Figure 12: Individuals who received training and development in the past year
Sample base: Total (2366), Governor/trustee/board member (34), Senior management team (305), Middle and
junior manager (472), Advanced practitioner (70), Lecturer, teacher or tutor (748), Specialist assessor or
verifier (203), Careers guidance specialist (23), Specialist coach, mentor or staff trainer (56), Teaching,
learning or classroom assistant (128), Support worker (administrative/clerical) (183), Support worker
(maintenance, security, catering or cleaning) (37)
Q13. Have you received any of the following types of training or development activity in the last academic
year?
A further analysis observes, however, that when people in governance roles do take part in
training and development, that training and development is more substantial, in terms of its
length (mean training hours) and of numbers of training episodes, than is average for other
groups of workers in the sector. Apart from this variation, the main other variation is that workers
in support functions, such as teaching assistants or other support workers, received, on
average, only around half the hours of training reported by other groups of staff (see Table 6
following) .
Although CPD hours are recorded a little differently in the Staff Individualised Record (SIR), and
are only recorded for teaching staff, it is interesting to compare to those reported in this survey.
The mean number of CPD hours for teaching staff in the SIR is 46, which compares to 41 hours
in this survey for lecturers, teachers and tutors. However it is worth noting that any entries of 0
hours have been discounted in the SIR, but have not been in the TNA and so SIR results will be
inflated.
92%
100%
98%
96%
95%
90%
93%
93%
96%
94%
80%
61%
Total
Governor/trustee/board member
Senior management team
Middle and junior manager
Advanced practitioner
Lecturer, teacher or tutor
Specialist assessor or verifier
Careers guidance specialist
Specialist coach, mentor or staff trainer
Teaching, learning or classroom assistant
Support worker (administative/clerical)
Support worker (maintenance, security, catering or cleaning)

32/127
Table 6: Mean hours of training and number of episodes of training received in the past year – individual perspective
Total
Governor/ trustee/ board member
Senior management team
Middle and junior manager
Advanced practitioner
Lecturer, teacher or tutor
Specialist assessor or verifier
Careers guidance specialist
Specialist coach, mentor or staff trainer
Teaching, learning or classroom assistant
Support worker (admin)
Support worker (maintenance, security, catering or cleaning)
Mean hours of training in the last year
44 73 46 51 43 41 52 27 62 22 25 16
Sample base 2366 34 305 472 70 748 203 23 56 128 183 37
Mean number of separate episodes of training or development you undertook in the last year
9 12 9 9 13 8 9 6 8 6 8 6
Sample base 2184 34 297 455 66 685 188 22 54 120 150 23
Q18. In total, how many hours of training and development would you estimate you received in the last academic year?
Q25. Could you say how many separate episodes of training or development you undertook in the last year?

33/127 Training Needs Analysis
27/04/2018
Education and Training Foundation
Two further tables (Tables 7 and 8) show, respectively, that middle and junior managers,
particularly in ITPs, receive a particularly large average amount of training but that the average
number of training episodes per individual trained does not vary greatly by job role or type of
organisation.
Table 7: Mean hours of training received in the past year – individual perspective
Total Colleges Local Authorities ITP
All roles 44 38 37 57
Senior management team 46 44 45 47
Middle and junior manager 51 49 39 70
Lecturer, teacher or tutor 41 40 32 47
Teaching support staff6 43 26 27 61
Sample base 1780 823 393 292
Q18. In total, how many hours of training and development would you estimate you received in the last
academic year?
Table 8: Mean number of episodes of training received in the past year – individual
perspective
Total Colleges Local Authorities ITP
All roles 9 8 9 9
Senior management team 9 10 8 9
Middle and junior manager 9 10 9 10
Lecturer, teacher or tutor 8 7 8 7
Teaching support staff6 8 6 9 10
Sample base 1651 760 372 262
Q25. Could you say how many separate episodes of training or development you undertook in the last year?
6 Teaching support staff includes Teaching, Learning or Classroom Assistants and Specialist Assessors or Verifiers.

34/127 Training Needs Analysis
27/04/2018
Education and Training Foundation
As might be expected, full-time workers participated in more training episodes and undertook
more hours of training than part-time, sessional, or voluntary workers but, still, training of these
latter groups was not negligible. Part-time workers, particularly, whilst often working
substantially fewer hours than full-time workers, still received almost as many training sessions
and over 60% of full-time workers’ training hours (see Table 9).
Table 9: Mean hours of training and number of episodes of training received in the past
year – individual perspective
Total Full time Part time Sessional Voluntary
Mean hours of training in the last year
44 50 32 36 30
Sample base 2366 1517 621 186 21
Mean number of separate episodes of training or development you undertook in the last year
9 9 7 6 5
Sample base 2184 1417 568 168 20
Q18. In total, how many hours of training and development would you estimate you received in the last
academic year?
Q25. Could you say how many separate episodes of training or development you undertook in the last year?
Types of training supplied
As Figure 13 (following) shows, a variety of types of training were each a frequent part of
institutions’ training repertoires. For example, nearly all providers offered training seminars,
short courses, and induction training or encouraged staff to attend conferences, meetings, and
so on which were aimed at increasing knowledge and competence; and many other forms of
training were offered with great frequency. Only two particular forms of training – that directed at
licence to practice and paid study leave – were somewhat less frequently offered.
However, data from the individuals’ survey provides a better numerical account of what training
actually takes place. Thus, Figure 4 also shows that the forms of training which FE sector
workers must frequently experience are: (1) Daylong training sessions for all or many staff in an
institution; (2) attendance at conferences and similar but smaller events; (3) training seminars or
short courses; and (4) on-line or other distance learning.
Other forms of training – including, for example, ‘substantial’ courses leading to higher level
qualifications or work experience in industry were accessed by much smaller proportions of the
workforce. It should be emphasized, however, that the survey inquired about training which had
taken place in the last year. It would not be expected that substantial courses, perhaps leading
to a higher degree or professional qualification, which might well only occur on one or two
occasions in a lifetime would be identified in the survey as frequently as more routine or shorter
forms of training.
Colleges were more likely to have provided training for each of the types explored. However,
this provision was not reflected in the responses of individuals from Colleges, where only day
long training sessions were more common than in other provider types.

35/127 Training Needs Analysis
27/04/2018
Education and Training Foundation
Figure 13: Types of training provided by institutions and the proportions of individuals
who took part in each type
Sample base: Institutions (481), Individuals (2366)
Q9. Can you say which of these were used by your organisation in the past academic year?
Q13. Have you received any of the following types of training or development activity in the last academic
year?
The areas of competence or knowledge which training sought to improve are shown in Figure
14 (following), again in terms of the proportions of institutions which supplied training in each of
the four areas and of proportions of individuals who actually received training in each area. The
analysis shows that more than 8 out of 10 institutions offered training directed at each area but,
in terms of the numbers of individuals benefiting, training directed at improvement in teaching
competences was most frequent, with between 20% and 30% of the workforce receiving training
in maths and/or English, other subject or sector knowledge, and governance, leadership or
management skills.
95%
95%
94%
89%
88%
88%
85%
83%
81%
75%
70%
42%
41%
50%
15%
53%
15%
54%
45%
3%
21%
15%
12%
7%
1%
2%
Training seminars or short courses
Induction programmes specific to your organisation
Conferences, workshops, seminars, meetings orwebinars
Coaching and mentoring
Day-long training sessions for the entire staff or a largeproportion of the staff
Formal on-line training and development programmes orother forms of distance learning
Initial teacher training for individuals who are new to theprofession
On-the-job training
Suppliers of equipment and materials training your staff intheir use/ Training in the use of new equipment or
materials by the supplier of the equipment or materials
Substantial formal courses that lead to a degree, higherdegree, trade or professional accreditation
Work experience or shadowing in industry or business
Licence to practice training
Paid study leave
Institutions Individuals

36/127 Training Needs Analysis
27/04/2018
Education and Training Foundation
Again, Colleges were more likely to seek to enhance competence in all of the areas, except
subject/sector knowledge, than ITPs or Charitable providers. Local Authorities were also more
likely than ITPs and Charitable providers to deliver training in maths and English, and
governance, leadership and management. However, individuals were more likely to have
received training in ITPs in maths and English and governance, leadership and management
skills than those in other provider types.
Figure 14: Types of improved competence or areas of knowledge that training and
development has sought to enhance
Sample base: Institutions (473), Individuals (2184)
Q11. Which of the following types of improved competence or areas of knowledge has your training and
development sought to enhance or develop in the past academic year?
Q14. Thinking about the training and development you have undertaken in the past academic year, did any of
it have the following aims?
Answers to further supplementary questions on the types of training supplied by institutions or
received by individuals offer more nuance to the ‘overview’ analysis in Figure 14 (above).
Thus, Figure 15 (following) shows a more substantial variety of training than Figure 14 implies.
The Figure shows that large proportions of institutions offered training in digital technologies,
special educational needs, assessment skills, soft skills, well-being and mental health, and so
on. And substantial proportions of the workforce participated in many of these – for example, a
quarter or more of staff had training related to public policy changes affecting their institution or
job role, to administrative procedures, to digital and other new technologies, and to soft skills.
Again, Colleges and Local Authorities are more likely to have provided training in most areas of
competence or knowledge when compared to ITPs and Charitable providers. As seen with the
broader areas of competence shown in Figure 14, individuals in ITPs are more likely to report
receiving training in most areas of competence or knowledge than individuals in other provider
types.
82% 84% 85% 85%
59%55%
28%
21%
28%
64%
Teaching and pedagogy Maths and English Subject/sectorknowledge
Governance, leadershipand management skills
Any other types ofcompetence or
knowledge
Institutions - Sought to enhance or develop the following types of improved competence or areas ofknowledge in the past academic year
Individuals - Training and development undertaken in the past academic year had the following aims

37/127 Training Needs Analysis
27/04/2018
Education and Training Foundation
Figure 15: Types of improved competence or areas of knowledge that training and
development has sought to enhance – more detail
Sample base: Institutions (473), Individuals (2184)
* Areas marked with * were not asked in the institutions survey
Q11. Which of the following types of improved competence or areas of knowledge has your training and
development sought to enhance or develop in the past academic year?
Q14. Thinking about the training and development you have undertaken in the past academic year, did any of
it have the following aims?
85%
85%
74%
69%
68%
66%
62%
57%
50%
49%
46%
45%
41%
39%
20%
21%
25%
20%
29%
27%
12%
16%
16%
26%
16%
30%
25%
4%
10%
10%
8%
11%
8%
8%
1%
1%
Subject/sector knowledge
Governance, leadership and management skills
Teaching of Maths and English
Other teaching or classroom competencies
Use of digital and other new technologies in teachingprogrammes
Specialist skills for working with learners with SEND
Individuals' own knowledge in Maths and English
Expertise to act as assessors for apprenticeship orother education or training programmes
Soft skills
Skills in the area of well-being or mental health
Knowledge of admin procedures
Knowledge of changes in public policy, procedures andfunding
QTLS
Expertise to offer careers advice and guidance tolearners
Research skills
Business or commercial skills*
Administrative or clerical or information technologyskills*
Technical or manual skills*
Awareness of SEND Code of Practice*
Knowledge of Prevent duty*
Knowledge of safeguarding (child protection)*
Institutions Individuals

38/127 Training Needs Analysis
27/04/2018
Education and Training Foundation
More particularly still, where staff had received training related to a particular subject or sector
area, this was again varied but was most frequent, in terms both of the number of institutional
offers and of the number of individual participants, in respect of training in education and
training, Maths, English, health and care, business administration, and ICT (see Figure 16).
Figure 16: Subject/sector areas in which training and development has taken place
Sample base: Institutions (407), Individuals (420)
Q21. You said that your institution has facilitated training and development to improve subject/sector
knowledge within your workforce. In what subject areas has that been?
Q15. In which of the following subject area(s) or curriculum areas did you undertake training and
development?
32%
28%
27%
27%
25%
24%
23%
21%
20%
17%
15%
15%
14%
12%
11%
9%
9%
5%
4%
21%
18%
14%
18%
49%
16%
4%
7%
5%
4%
5%
2%
10%
2%
3%
2%
3%
2%
3%
Health, public services, and care
English
Business administration and law
Maths
Education and training
ICT
Construction planning and the built environment
Engineering and manufacturing
Leisure, travel, hospitality, and tourism
Arts, media, and publishing
Retail and commercial enterprise
Science
Preparation for life and work
Social science
Languages, literature and culture
Agriculture, horticulture, and animal care
Humanities subjects
Family learning
Community development
Institutions Individuals

39/127 Training Needs Analysis
27/04/2018
Education and Training Foundation
Where staff had received training in governance, leadership, and management training, this was
most frequently in general management, team leadership, change management and business
improvement, strategic management and corporate planning, and senior leadership
development (see Figure17).
Figure 17: Governance, leadership and management skills where training and
development has taken place
Sample base: Institutions (354), Individuals (543)
Q13. You said that your institution has facilitated training and development in governance, leadership and
management skills. Could you say whether that was in any of the following areas?
Q16. In which areas of governance, leadership, and management did you undertake training and
development?
And several forms of ‘mandatory’ training (that required by statute or regulation) had been
widely offered by institutions, with 8 out of 10 staff receiving safeguarding and Prevent training
in the year prior to survey, two-thirds receiving equality and diversity training, and nearly half
receiving general health and safety training (see Figure 18 following).
79%
75%
70%
56%
56%
52%
51%
48%
32%
11%
40%
35%
27%
32%
12%
14%
30%
12%
3%
6%
General organisational management
Team leadership and supervisory skills
Senior leadership development
Change management and business improvement
Financial planning and management
Human resources planning and management
Strategic management and corporate planning
Management of commercial operations, businessdevelopment, marketing, or employer engagement
Facilities management
Any other form of governance, leadership, andmanagement (specify)
Institutions Individuals

40/127 Training Needs Analysis
27/04/2018
Education and Training Foundation
Figure 18: Mandatory training that been provided over the past year
Sample base: Institutions (473), Individuals (2184)
Q14. In the last year has your organisation provided training and development in relation to any of the
following?
Q17. Could you also indicate which, if any, forms of mandatory training you undertook in the last academic
year?
Suppliers of training
The surveys of institutions and individuals revealed the major suppliers of training in the
academic year leading up to the surveys. A range of internal and external sources of training
were widely used by institutions to supply training to their staff but, in terms of the numbers of
staff trained by each type of supplier, specialist training units or staff within the organisation,
external private training companies, senior/junior staff training relationships, professional
institutions, and the Education and Training Foundation (ETF) were most significant (see Figure
95%
94%
92%
90%
90%
74%
39%
1%
80%
80%
66%
47%
17%
8%
8%
1%
2%
5%
Safeguarding for young and vulnerable people
The Prevent duty
Equality and diversity
General health and safety
First aid and resuscitation
Health and safety related to specific sectors such asgas and electricity or food hygiene regulations
Environmental protection (waste minimisation anddisposal, energy efficiency, etc.)
None
Information governance/information protection
Any other mandatory training
Institutions Individuals

41/127 Training Needs Analysis
27/04/2018
Education and Training Foundation
19 following). It may also be noted that, in respect of this analysis, some respondents may not
have been wholly accurate in their responses in so far as some organisations, such as ETF, the
Association of Colleges and the Association of Employment and Learning Providers which
sponsor training, use other providers to deliver that training. In some of these cases,
respondents may have recognised the immediate rather than the actual provider.

42/127 Training Needs Analysis
27/04/2018
Education and Training Foundation
Figure 19: Suppliers of training and development over the past academic year
Sample base: Institutions (473), Individuals (2184)
Q21. Have any of the following supplied training and development to your organisation in the last academic
year?
Q22. Who supplied the training and development you undertook?
* denotes a figure greater than zero, but less than 0.5%
83%
82%
80%
57%
48%
41%
38%
30%
30%
26%
13%
12%
9%
0%
28%
57%
44%
16%
10%
6%
5%
16%
6%
2%
*%
5%
3%
2%
Senior individuals in the organisation who trained ordeveloped your skills and knowledge
Specialist trainers, or coaches, or members from within yourorganisation
An external private training company or consultancy
A professional institution
A university
Suppliers of equipment or materials to your organisation
An external further education college
ETF
AoC,
Trade Union
The National College for Teaching and Leadership
AELP
Any other supplier
E-learning/online training
Institutions Individuals

43/127 Training Needs Analysis
27/04/2018
Education and Training Foundation
Functions of training
The surveys also examined the motivations for training from institutional and individual
perspectives.
An institutional analysis shows that improved staff performance, maintenance of the
organisation’s competitive position, and keeping up with changes in the policy environment are
the most frequent drivers of training but staff retention and morale, staff demand for training,
and concern about staff career progression are also very significant factors (see Figure 20
following).
Figure 20: Importance of organisational motivations towards staff training and
development
Sample base: 473
Q22. If I read out a list of possible motivations, could you classify each one on a scale as very important,
moderately important, a bit important, or not at all important. I’m excluding here any training or development
which you have to do because it’s mandatory
Figures below 3% are not shown
From the individual perspective, it is evident that much training is employer-driven and,
thereafter, as with institutions, improved performance at work and the ‘regulatory’ driver were
very frequent motivations. Training’s contribution to progression was important to only a fifth or
so of individual staff and very few individuals trained in expectation of direct promotion or a pay
96%
95%
82%
59%
68%
89%
3%
4%
16%
34%
27%
9%
5%
4%
To improve individuals' performance at work
To maintain or improve the organisation'sperformance, competiveness, and reputation
To maintain or improve staff morale, job satisfaction,and retention
To assist the career progression of staff
To respond to staff requests for training ordevelopment
To keep up with changes in public policy,procedures, and funding
Very important Moderately important A bit important Not at all improtant Don't know

44/127 Training Needs Analysis
27/04/2018
Education and Training Foundation
increase (see Figure 21 following).
Figure 21: Individuals’ reasons for undertaking training and development in the past year
Sample base: 2184
Q23. Were any of the following reasons for undertaking training and development in the last academic year?
68%
60%
51%
35%
26%
26%
25%
22%
8%
8%
5%
3%
1%
Your organisation required you to do it
You wanted to improve your performance at work
It was required by regulation or legislation
You were interested in the subject of training anddevelopment for its own sake
It was an opportunity to train at no or subsidised cost
It helped to overcome a limitation in your skills andknowledge of which you were aware
It improved your professional status
It was important or useful in building your CV or for futurecareer progression
It was a change or break from your regular work routine
It would increase your chances of promotion from yourpresent employer
It would increase your chances of a pay increase from yourpresent employer
Was there any other reason for any of the training anddevelopment you did?
Prefer not to say

45/127 Training Needs Analysis
27/04/2018
Education and Training Foundation
Paying for training
Analysis of funding for training shows, first, that the presence of a budget for staff training is
much more likely in public sector bodies than in private organisations (ITPs or charities) (see
Figure 22).
Figure 22: Proportion of institutions that have a formal budget for training and
development
Sample base: Total (473), Colleges (107), Local authority (43), ITPs Prime contractors (119), ITPs Sub-
contractors (89), Charitable (62)
Q24. Does your organisation have a formal budget for training and development?
Organisations with training budgets were asked in the institutions survey to reveal the size of
that budget. Table 10 (following) allows the broad point to be made that, because ITPs are often
quite small, their training budgets are on average much smaller than those at much larger
organisations such as Colleges.
Table 10: Approximate size of institutions’ training and development budgets
Total Colleges Local Authorities
ITPs Prime contractors
ITPs Sub-contractors
Charitable/Voluntary
Less than £2,000 1% 1% 0% 0% 4% 14%
£2,000 - £4,999 3% 2% 6% 12% 19% 4%
£5,000 - £9,999 2% 0% 9% 6% 15% 11%
£10,000 to £19,999 4% 3% 6% 14% 11% 14%
£20,000 to £49,999 13% 14% 16% 8% 11% 4%
£50,000 to £99,999 12% 13% 19% 2% 0% 4%
£100,000 to £499,999 9% 10% 9% 4% 0% 4%
Mean £64,256 £70,977 £60,047 £22,087 £9,737 £18,554
Sample base 276 101 32 50 27 28
Q25. What was the approximate size of this budget for the last academic year?
However, while total budgets for ITPs may be smaller on average, the average amount spent
81%
94%
74%
42%
30%
45%
Total Colleges Local Authorities ITPs Prime contractorsITPs Sub-contractors Charitable

46/127 Training Needs Analysis
27/04/2018
Education and Training Foundation
per member of staff is actually quite large7 compared, particularly, with Colleges. While Colleges
are spending much more in absolute terms, they may spread that budget across many more
staff and additionally, because of their internal training resources (of which the cost may not be
included in the formal budget for training) may not need to spend as much per trainee on the
external training supply which does appear in budgets (see Table 11).
Table 11: Approximate training and development budget per member of staff
Total Colleges Local Authorities
ITPs Prime contractors
ITPs Sub-contractors
Charitable/Voluntary
Less than £200 61% 67% 59% 27% 25% 40% £200 - £499 30% 31% 29% 36% 13% 33% £500 - £999 4% 3% 12% 5% 19% 13% £1,000 to £1,999 3% 0% 0% 23% 38% 7%
£2,000 + 1% 0% 0% 9% 6% 7%
Mean £310 £172 £214 £761 £889 £883
Sample base 117 39 17 22 16 15 Q25. What was the approximate size of this budget for the last academic year? /
Q6. In total, how many staff of all types and at all levels does your organisation employ, including yourself?
Individual respondents revealed that much the greater part of their training was either funded by
their employer or did not involve a cost. Payment by the individual was relatively infrequent (see
Figure 23).
Figure 23: Who paid fees for training and development – individual perspective
Sample base: 2184
Q19. If any of your training and development involved payment of fees to training and development supplier(s)
outside your organisation, who paid these fees?
7 It is possible that this is due to some ITPs including the cost of staff time in their figures, but this could also be due to the relatively smaller size of ITPs causing more training to be done externally, and therefore at a greater cost to the organisation.
48%
30%
8%
7%
4%
1%
2%
My employer paid all
No fees involved
I paid all
The cost was shared
Not sure who paid
Paid by somebody else
Prefer not to say

47/127 Training Needs Analysis
27/04/2018
Education and Training Foundation
This distribution of payment was fairly consistent across all types of provider (see Table 12).
Table 12: Who paid fees for training and development – by sub-sector
Total Colleges
Local Authorities
ITPs Prime contractors
ITPs Sub-contractors
Charitable/Voluntary Others
I paid all 8% 6% 4% 8% 11% 7% 16%
My employer paid all 48% 47% 54% 52% 49% 54% 43%
The cost was shared 7% 8% 5% 5% 15% 5% 9%
Paid by somebody else 1% 1% 1% 1% 2% 2% 3%
Not sure who paid 4% 4% 6% 1% 2% 3% 2%
No fees involved 30% 32% 27% 32% 18% 27% 25%
Prefer not to say 2% 2% 3% 1% 5% 3% 3%
Sample base 2184 1022 479 193 67 106 126
Q19. If any of your training and development involved payment of fees to training and development supplier(s)
outside your organisation, who paid these fees?
There was some variation, however, in the payment for training between occupations in the
sector. Particularly, training for managers, though more likely than for other groups to involve
payment of a fee, was particularly likely to be employer-funded and particularly unlikely to be
self-funded (see Table 13 following).
In more detail (see Table 14 following), staff at several levels in ITPs were somewhat more
likely to report that they paid for their own training than were staff in other providers.

48/127
Table 13: Who paid fees for training and development – individual perspective
Total
Governor/ trustee/ board member
Senior management team
Middle and junior manager
Advanced practitioner
Lecturer, teacher or tutor
Specialist assessor or verifier
Careers guidance specialist
Specialist coach, mentor or staff trainer
Teaching, learning or classroom assistant
Support worker (admin)
Support worker (maintenance, security, catering or cleaning)
I paid all 8% 13% 4% 4% 13% 12% 11% 14% 5% 9% 2% 5%
My employer paid all 48% 31% 70% 60% 44% 39% 40% 40% 50% 36% 38% 57%
The cost was shared 7% 12% 8% 8% 5% 8% 6% 0% 12% 2% 4% 0%
Paid by somebody else 1% 3% 1% 1% 0% 1% 1% 0% 4% 2% 2% 5%
Not sure who paid 4% 7% 1% 1% 0% 5% 5% 1% 0% 11% 4% 6%
No fees involved 30% 23% 15% 24% 37% 32% 34% 45% 29% 39% 49% 23%
Prefer not to say 2% 10% *% 1% 2% 3% 3% 0% 0% 2% 1% 5%
Sample base 2184 34 297 455 66 685 188 22 54 120 150 23
Q19. If any of your training and development involved payment of fees to training and development supplier(s) outside your organisation, who paid these fees?
* denotes a figure greater than zero, but less than 0.5%

49/127
Table 14: Who paid fees for training and development – individual perspective
Senior management team Middle and junior manager Lecturer, teacher or tutor Teaching support staff
Colleges
Local Authorities
Independent Training Providers
Colleges Local Authorities
Independent Training Providers
Colleges Local Authorities
Independent Training Providers
Colleges Local Authorities
Independent Training Providers
I paid all 0% 1% 6% 3% 4% 5% 10% 6% 24% 5% 5% 11%
My employer paid all
73% 76% 68% 59% 66% 62% 39% 42% 35% 41% 46% 39%
The cost was shared
11% 4% 6% 10% 4% 7% 8% 6% 8% 5% 5% 4%
Paid by somebody else
1% 1% 2% 1% 3% 0% 1% 0% 0% 1% 0% 1%
Not sure who paid
1% 1% 1% 2% 2% 0% 4% 10% 6% 8% 11% 3%
No fees involved 13% 16% 16% 25% 18% 25% 35% 31% 27% 38% 32% 39%
Sample base 85 79 82 199 136 55 379 144 63 131 37 93
Q19. If any of your training and development involved payment of fees to training and development supplier(s) outside your organisation, who paid these fees?

50/127 Training Needs Analysis
27/04/2018
Education and Training Foundation
The survey of individuals reveals that around a third of training they undertook was mandated
by statute or regulation but, apart from that element, employers played a major role in the
initiation of training, either in collaboration with the individual or as the sole instigator. Individuals
themselves were the sole instigators of their training in around a fifth of cases (see Figure 24).
Figure 24: How training and development was initiated – individual perspective
Sample base: 2184
Q21. Considering all the training and development you undertook, could you indicate who initiated it?
* denotes a figure greater than zero, but less than 0.5%
Table 15 (following) shows more detail of this pattern. The table shows that colleges and local
authorities were more likely to initiate training whereas individuals working in other sub-sectors
were more likely to initiate training themselves. Workers in Colleges and local authorities were
also more likely to report being subject to mandatory training.
20%
28%
48%
12%
31%
2%
*%
*%
It was all initiated by me
It was all initiated by my employer
Some was initiated by me and some by my employer
Some or all was by mutual agreement between me and myemployer
It was mandatory training which had to be undertaken byregulation or legislation
It was initiated by someone else
Encouraged by Union Learning Representative
Other
Prefer not to say

51/127 Training Needs Analysis
27/04/2018
Education and Training Foundation
Table 15: How training and development was initiated – individual perspective
Total Colleges Local Authorities
ITPs Prime contractors
ITPs Sub-contractors
Charitable/Voluntary Others
It was all initiated by me 20% 15% 15% 20% 34% 24% 37%
It was all initiated by my employer
28% 35% 27% 12% 18% 24% 21%
Some was initiated by me and some by my employer
48% 48% 52% 61% 49% 44% 37%
Some or all was by mutual agreement between me and my employer
12% 11% 16% 12% 16% 16% 12%
It was mandatory training which had to be undertaken by regulation or legislation
31% 34% 31% 26% 21% 24% 29%
It was initiated by someone else
2% 2% 2% 2% 3% 3% 2%
Encouraged by Union Learning Representative
*% *% 1% 0% 0% 1% 1%
Other *% *% *% 1% 0% 2% 0%
Prefer not to say 1% 1% 0% 1% 2% 0% 1%
Sample base 2184 1022 479 193 67 106 126
Q21. Considering all the training and development you undertook, could you indicate who initiated it?
* denotes a figure greater than zero, but less than 0.5%
Table 16 (following) shows additionally that governors (or equivalent) and senior managers
were particularly likely to initiate their own training and that staff in various support functions
were particularly likely to report that their training was instigated by their employer and less
likely to say that they initiated it themselves.
As with paying for training (see earlier), staff at all levels in ITPs were more likely than staff of
other organisations to say they initiated their own training (see Table 17 following).

52/127
Table 16: How training and development was initiated – individual perspective
Total
Governor/ trustee/ board member
Senior management team
Middle and junior manager
Advanced practitioner
Lecturer, teacher or tutor
Specialist assessor or verifier
Careers guidance specialist
Specialist coach, mentor or staff trainer
Teaching, learning or classroom assistant
Support worker (admin)
Support worker (maintenance, security, catering or cleaning)
It was all initiated by me 20% 47% 33% 19% 20% 17% 21% 13% 26% 11% 9% 9%
It was all initiated by my employer 28% 18% 12% 18% 21% 37% 27% 36% 24% 46% 37% 47%
Some was initiated by me and some by my employer
48% 26% 52% 60% 54% 45% 52% 33% 48% 32% 39% 38%
Some or all was by mutual agreement between me and my employer
12% 8% 15% 17% 6% 8% 15% 7% 10% 6% 17% 9%
It was mandatory training which had to be undertaken by regulation or legislation
31% 20% 30% 32% 33% 30% 33% 20% 31% 43% 30% 29%
It was initiated by someone else 2% 11% 2% 2% 0% 2% 1% 0% 6% 3% 1% 0%
Encouraged by Union Learning Representative
*% 0% *% *% 0% *% 0% 0% 0% 0% 3% 0%
Other *% 0% 1% *% 0% 0% 1% 0% 0% 1% 1% 0%
Prefer not to say 1% 0% *% *% 0% 1% 1% 0% 0% 2% 1% 0%
Sample base 2184 34 297 455 66 685 188 22 54 120 150 23
Q21. Considering all the training and development you undertook, could you indicate who initiated it?
* denotes a figure greater than zero, but less than 0.5%
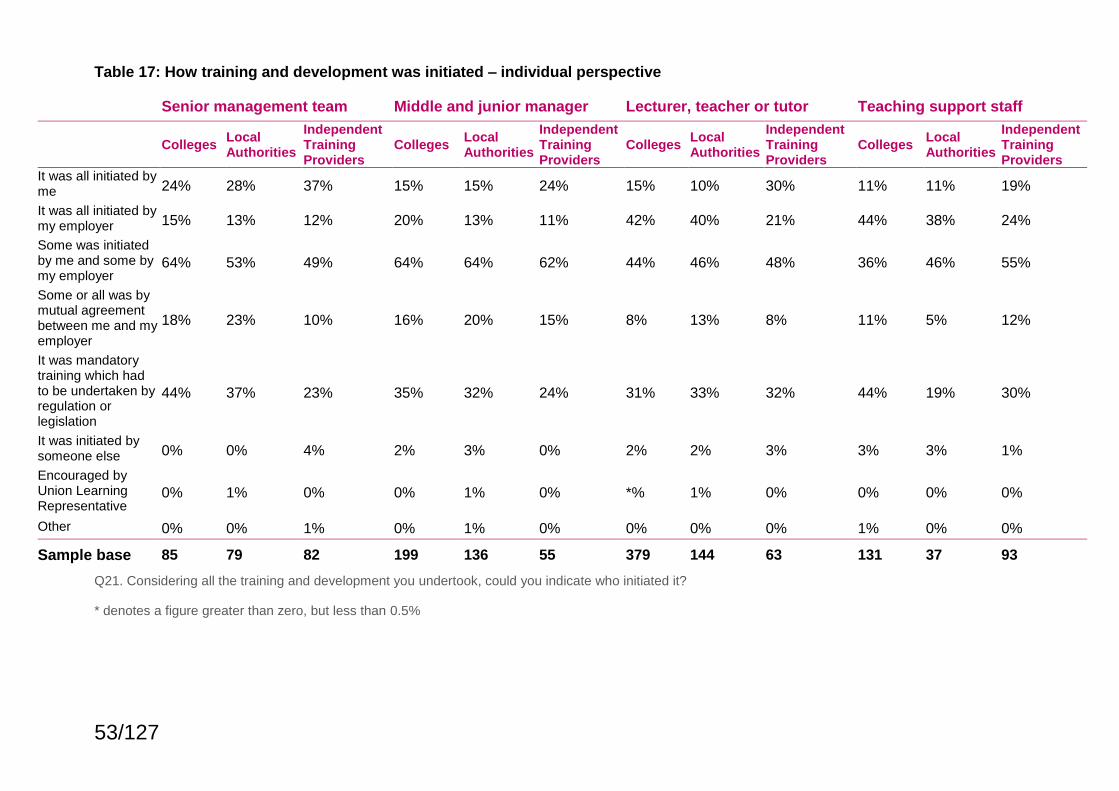
53/127
Table 17: How training and development was initiated – individual perspective
Senior management team Middle and junior manager Lecturer, teacher or tutor Teaching support staff
Colleges
Local Authorities
Independent Training Providers
Colleges Local Authorities
Independent Training Providers
Colleges Local Authorities
Independent Training Providers
Colleges Local Authorities
Independent Training Providers
It was all initiated by me 24% 28% 37% 15% 15% 24% 15% 10% 30% 11% 11% 19%
It was all initiated by my employer 15% 13% 12% 20% 13% 11% 42% 40% 21% 44% 38% 24%
Some was initiated by me and some by my employer
64% 53% 49% 64% 64% 62% 44% 46% 48% 36% 46% 55%
Some or all was by mutual agreement between me and my employer
18% 23% 10% 16% 20% 15% 8% 13% 8% 11% 5% 12%
It was mandatory training which had to be undertaken by regulation or legislation
44% 37% 23% 35% 32% 24% 31% 33% 32% 44% 19% 30%
It was initiated by someone else 0% 0% 4% 2% 3% 0% 2% 2% 3% 3% 3% 1%
Encouraged by Union Learning Representative
0% 1% 0% 0% 1% 0% *% 1% 0% 0% 0% 0%
Other 0% 0% 1% 0% 1% 0% 0% 0% 0% 1% 0% 0%
Sample base 85 79 82 199 136 55 379 144 63 131 37 93
Q21. Considering all the training and development you undertook, could you indicate who initiated it?
* denotes a figure greater than zero, but less than 0.5%

54/127 Training Needs Analysis
27/04/2018
Education and Training Foundation
Training infrastructure
The survey of institutions shows that most organisations, though less frequently in the charity
and voluntary sector, have a training and development plan in place (see Figure 25).
Figure 25: Proportion of providers who have a training and development plan in place
Sample base: Total (473), Colleges (107), Local authority (43), ITPs Prime contractors (119), ITPs Sub-
contractors (89), Charitable (62)
Q23. Does your organisation have a training and development plan which sets out the training and
development needs within the organisation which are to be addressed over a future period?
Varied methods of identifying training and development needs are widely used across the
sector, with the use of staff appraisals and performance reviews being virtually universal (see
Figure 26).
Figure 26: How training and development needs are identified within organisations
Sample base: 473
Q26. How are training and development needs identified in your organisation?
88%
91%
81%
87%
89%
69%
Total
Colleges
Local Authorities
ITPs Prime contractors
ITPs Sub-contractors
Charitable/Voluntary
95%
90%
59%
87%
87%
84%
10%
1%
By regular staff appraisals or performancedevelopment reviews
By observations of individuals' performance
By a human resources department or specialist
By formal training needs assessment across theorganisation or quality improvement plan
By the judgements of senior staff or managers
By requests from individuals who want training ordevelopment
By other means (specify)
Don't know

55/127 Training Needs Analysis
27/04/2018
Education and Training Foundation
However, rather fewer organisations, generally around two-thirds or a little more in each of the
sector’s sub-sectors, have a formal system for identifying the outcomes and benefits of training
(see Figure 27).
Figure 27: Proportion of providers which have a formal system in place for identifying
training outcomes and benefits
Sample base: Total (473), Colleges (107), Local authority (43), ITPs Prime contractors (119), ITPs Sub-
contractors (89), Charitable (62)
Q29. Does your organisation have a formal system for identifying training outcomes and benefits?
65%
64%
70%
71%
66%
60%
Total
Colleges
Local Authorities
ITPs Prime contractors
ITPs Sub-contractors
Charitable/Voluntary

56/127 Training Needs Analysis
27/04/2018
Education and Training Foundation
CHAPTER 3: THE ADEQUACY AND SUFFICIENCY OF CURRENT TRAINING
Summary of chapter
The previous chapter was descriptive of current training in the FE sector based on institutions’
and individuals’ reports of various characteristics of that training. This chapter moves on to look,
in various ways, at the extent to which current training, in the opinion of institutions and
individuals, supplies the skills and knowledge which the sector needs in order to meet the
demands and challenges it faces.
Findings reported in this chapter show:
• A majority of providers regard their budget for training and development as sufficient but
around a quarter do not.
• However, nine out of ten providers report that their recent training and development
activities met most or all of their training needs
• Where providers reported any deficiencies or gaps in their training, these most frequently
concerned leadership and management skills, skills in the teaching of maths and
English, and competence in the use of digital and other new technologies in teaching
programmes
• As with organisations, around a quarter of people working in the sector reported that they
did not receive all the training they wanted or needed
• Substantial minorities, of over a third in each case, of FE sector staff also reported that
some training they undertook was of little value to them or was just ‘tick box’ training to
meet organisational or external requirements
• A smaller minority, however, only 12%, said that their training was of low quality
• Where members of staff had undertaken more than one episode of training, they most
frequently reported that training in teaching or classroom skills, training related to
Prevent and safeguarding, training in leadership and management skills, and training
related to well-being and mental health were most valuable
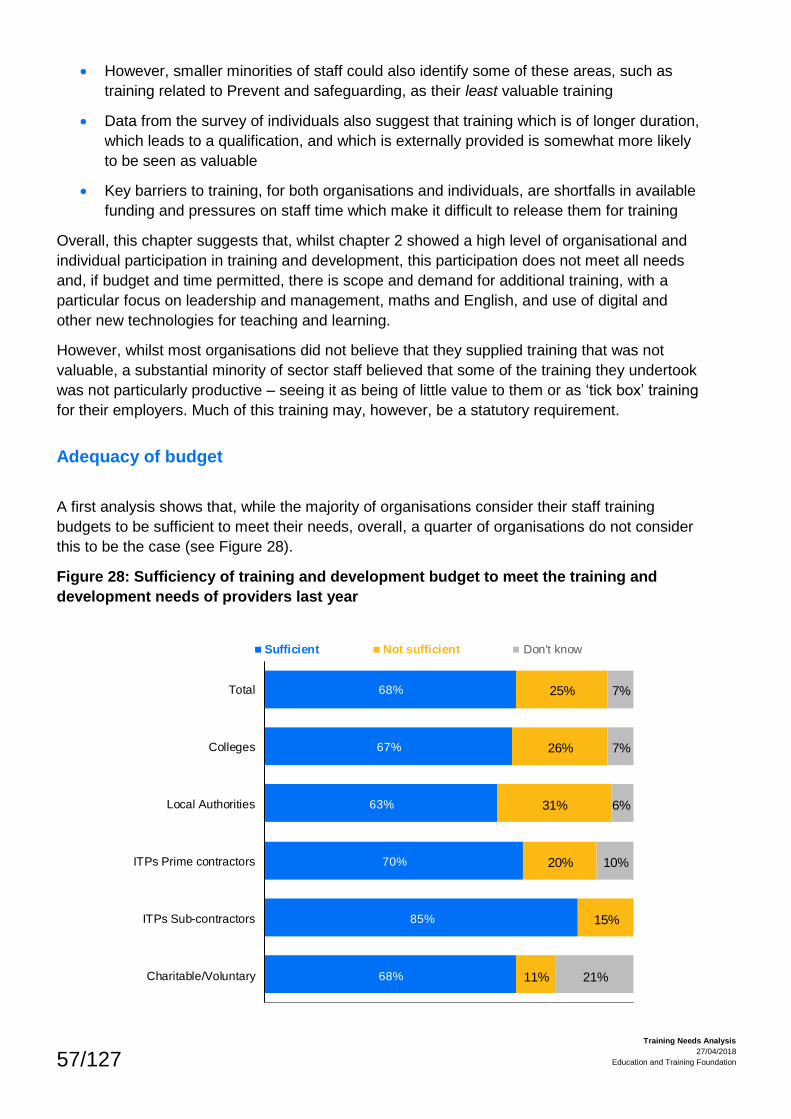
57/127 Training Needs Analysis
27/04/2018
Education and Training Foundation
68%
85%
70%
63%
67%
68%
11%
15%
20%
31%
26%
25%
21%
10%
6%
7%
7%
Charitable/Voluntary
ITPs Sub-contractors
ITPs Prime contractors
Local Authorities
Colleges
Total
Sufficient Not sufficient Don't know
• However, smaller minorities of staff could also identify some of these areas, such as
training related to Prevent and safeguarding, as their least valuable training
• Data from the survey of individuals also suggest that training which is of longer duration,
which leads to a qualification, and which is externally provided is somewhat more likely
to be seen as valuable
• Key barriers to training, for both organisations and individuals, are shortfalls in available
funding and pressures on staff time which make it difficult to release them for training
Overall, this chapter suggests that, whilst chapter 2 showed a high level of organisational and
individual participation in training and development, this participation does not meet all needs
and, if budget and time permitted, there is scope and demand for additional training, with a
particular focus on leadership and management, maths and English, and use of digital and
other new technologies for teaching and learning.
However, whilst most organisations did not believe that they supplied training that was not
valuable, a substantial minority of sector staff believed that some of the training they undertook
was not particularly productive – seeing it as being of little value to them or as ‘tick box’ training
for their employers. Much of this training may, however, be a statutory requirement.
Adequacy of budget
A first analysis shows that, while the majority of organisations consider their staff training
budgets to be sufficient to meet their needs, overall, a quarter of organisations do not consider
this to be the case (see Figure 28).
Figure 28: Sufficiency of training and development budget to meet the training and
development needs of providers last year

58/127 Training Needs Analysis
27/04/2018
Education and Training Foundation
Sample base: Total (276), Colleges (101), Local authority (32), ITPs Prime contractors (50), ITPs Sub-
contractors (27), Charitable (28)
Q32. In the last year, was your training and development budget sufficient to meet the training and
development needs of the organisation?
In-depth interviews: access to training and adequacy of budget
FE managers interviewed in in-depth interviews gave more general perspectives on their
organisations’ access to training and, in some cases on the adequacy of their training budgets.
On the first issue, the availability of training, respondents were positive in around 2 out of 3
cases, generally noting that they had good internal or external access to the training they
needed. On the budget issue, respondents were evenly split between those who said that they
had the budget they needed and those who recognised limitations.
Examples of generally positive responses were:
“We're able to source everything that they want. There is good access, helped along by the
fact that we offer a lot of courses ourselves that staff can go on. A lot of our training is done
in house... We allow our staff to attend any of the courses that we run free of charge. The
split internal/external is about 50/50. We encourage staff to go to events outside of the
college to provide fresh perspectives. It improves our staff both personally and their skill sets
to go externally as well. Our budget is sufficient. Funding cuts have meant that the budget
has reduced but there is a quiet understanding that if the budget is used up but there is some
important training that needs doing, then the funds will be made available.” (FE College)
“Good access - we have a lot of contacts and work closely with others such as the local
authority, local providers etc. We have a £54,000 budget. It's very rare that we spend right up
to that amount. External training tends to happen on their all-staff CPD days - normally
things to do with business support or curriculum. Other than that, the rest is internal.” (Adult
Community College)
“We've got a lot of skills internally. Being an FE college we can tap into a lot of what you've
got. Occasionally we outsource to give us a fresh perspective. We provide negotiable work
placements to send staff back into industry, as well as one day courses.” (FE College)
However, other providers identified ‘smallness’ as a constraint on both access and budget, for example:
“Due to our small size it is difficult for us to do external training. We tend to do the mandatory
training with external providers - through online - and everything else is provided internally.
So the issue is having enough knowledge and experience internally. Training is limited to
the skills that members of staff have and their perspectives. Expense is the main issue in
accessing external training, not that it doesn't exist. However, it all tends to be London-
centric and we would like more regionally - London is too far to go. We don't have the
budget to do lots of external training, but would be more inclined to do it if it was more local.
Face to face is better than online, but we have to do online to fit in with budgets.” (ITP sub-
contractor)
Another provider identified apprenticeship’s demands as a source of pressure, for example:

59/127 Training Needs Analysis
27/04/2018
Education and Training Foundation
“There are some significant gaps in terms of resources and information about end-point
assessment and about level 6 higher apprenticeships. This is a big struggle for us at the
moment. We are at the forefront of it and have apprentices going through end point
assessment before most others. We are having to put a lot of work and research to figure out
what we should be doing and how we should be doing it. We have to find the budget for
training and development as it's so important - but this is in terms of what is needed to know
how to successfully administer apprenticeships rather than anything else.” (ITP sub-
contractor)
One provider noted limitations in on-line training:
“Generally, legislative training is carried out online. It’s cheaper, very easy to monitor, but it’s
very linear in terms of you learn what you learn. More creative work is outsourced to private
companies, sourced through HOLEX to identify the best provider. As shifting priorities
privilege legislative and economic training, it is becoming increasingly difficult to source
specialized creative training.” (Local Authority)
Another observed that rapid policy change made it difficult to identify what training they should actually do:
“It's not adequate at the moment as there is no real guidance on what needs doing in terms
of standards and what is a requirement. Therefore we can't provide the right training as no-
one knows what it is. We do our own internal sessions but we are having to develop them
from scratch without any help.” (ITP Prime contractor)
Accessibility of training and availability of budget were sometimes linked by the issue of affordability:
“Sometimes we can struggle to find affordable training. We mostly do low-end training. We
don't have much budget. High-end training is out of reach. We do things like NVQs and
make the most of the apprenticeship levy. Our LA also allow us to have some mandatory
training such as health and safety and food hygiene for free.” (Charity)
However, other providers observed limitations in the nature of training available even if budget was available:
“There's quite a lot out there although it's not always at the right level for us. We are looking
for a lot of training at level 1 or 2 and don’t need to go any higher.” (ITP Prime contractor)
Gaps in training
More generally, however, the great majority of organisations were positive that their recent
training and development activity met at least most of their organisations’ needs (see Figure
29).

60/127 Training Needs Analysis
27/04/2018
Education and Training Foundation
Figure 29: Adequacy of training and development activities in the past year
Sample base: 473
Q33. Overall, do you think that the training and development of the organisation’s leaders and staff over the
last year …
A more detailed analysis shows that this picture was generally true across FE sub-sectors
though Local Authority training organisations, ITP sub-contractors, and charitable and voluntary
training organisations were somewhat less positive, with around 1 in 10 of these organisations
reporting that low proportions of training needs were met (see Table 18 following).
Table 18: Adequacy of training and development activities in the past year by sub-sector
Total Colleges Local Authorities
ITPs Prime contractors
ITPs Sub-contractors
Charitable/ Voluntary
Met all the significant needs of the organisation
22% 21% 14% 26% 30% 21%
Met most of the significant needs of the organisation
69% 69% 74% 71% 60% 69%
Met only a low proportion of the significant needs of the organisation
3% 2% 9% 3% 9% 8%
Didn't meet any of the significant needs of the organisation
1% 1% 0% 0% 0% 2%
Don't know 5% 7% 2% 0% 1% 0%
Sample base 473 107 43 119 89 62
Q33. Overall, do you think that the training and development of the organisation’s leaders and staff over the
last year …
22%
69%
3%
1%
5%
Met all the significant needs of the organisation
Met most of the significant needs of theorganisation
Met only a low proportion of the significant needs ofthe organisation
Didn't meet any of the significant needs of theorganisation
Don't know

61/127 Training Needs Analysis
27/04/2018
Education and Training Foundation
Where respondents saw deficiencies in the training provided by their organisations, these
deficiencies were more-or-less equally related to the development of teaching skills, of the
teaching of maths and English, and of leadership and management (see Figure 30).
Figure 30: Forms of training and development institutions would like to have seen more
of
Sample base: 347
Q34. Which forms of training and development would you liked to have seen more of?
In more detail, Figure 31 (following) shows that the most frequently reported deficiencies
concerned: governance, management and leadership skills; the teaching of maths and English;
and the application of digital and other technologies to teaching and learning. A wide range of
other perceived deficiencies in the training supplied by institutions were reported with lesser
frequency.
23%
18%
21%
9%7%
Teaching and Pedagogy Maths and English Leadership Any other types Individuals' knowledge insubjects other thanMaths and English

62/127 Training Needs Analysis
27/04/2018
Education and Training Foundation
Figure 31: Forms of training and development institutions would like to have seen more
of (in more detail)
Sample base: 347
Q34. Which forms of training and development would you liked to have seen more of?
The picture presented by the survey of institutions in Figure 29 earlier – that most training is
adequate to meet needs – was broadly confirmed by FE managers who were interviewed in
depth. Around a third or more of these managers reported that there were no gaps in the
training they were able to supply to staff.
The remaining managers identified one or more areas of training which they would like to start
or to extend. These areas included training related to leadership and management of different
types, to IT skills, to teaching skills, to new development areas in apprenticeship (including
training related to registration on the Register of Apprenticeship Training Providers), to
management of challenging behaviour and conflict resolution, and to team-building and
communications.
18%
16%
14%
9%
7%
6%
6%
6%
5%
5%
4%
4%
3%
3%
3%
2%
Governance, leadership, and management skills
Teaching of Maths and English
Use of digital and other new technologies in teachingprogrammes
Other teaching or classroom competences
Individuals' knowledge in subjects other than Maths andEnglish
Individuals' own knowledge and competence in Maths andEnglish
Business or commercial skills
Specialist skills for working with learners with people withSpecial Educational Needs (SEND)
Soft skills, including things such as team working,communication skills, time management, and…
Skills in the area of well-being or mental health
Knowledge of administrative procedures within yourorganisation or those required by external bodies
Research skills
QTLS
Expertise to act as assessors for apprenticeship or othereducation or training programmes
Knowledge of changes in public policy, procedures, andfunding which affect the organisation
Expertise to offer careers advice and guidance to learners

63/127 Training Needs Analysis
27/04/2018
Education and Training Foundation
59%
52%
62%
68%
71%
69%
16%
18%
15%
14%
17%
8%
23%
28%
21%
18%
13%
23%
1%
1%
1%
Total
Colleges
Local Authorities
ITPs Prime contractors
ITPs Sub-contractors
Charitable/Voluntary
Agree Neutral Disagree No opinion
However, overall, there was no theme of ‘missing’ training which was consistent across many
providers – the areas above were identified only by a handful or fewer ‘in-depth’ respondents –
and there was no sense in their replies that respondents believed the absence of particular
forms of training was having a critical or important impact on their operations as a whole.
Some minority concern from institutions about gaps in the training which they supplied to staff
was reflected in individuals’ reports of the sufficiency of their own training. Overall, 6 out of 10
individuals believed that they got all the training and development they wanted and needed but
almost a quarter (23%) said they did not, this negative proportion being particularly high in FE
and Sixth Form Colleges (see Figure 32).
Figure 32: Proportions of individuals who did or did not undertake all the training and
development they wanted and needed
Sample base: Total (276), Colleges (101), Local authority (32), ITPs Prime contractors (50), ITPs Sub-
contractors (27), Charitable (28)
Q24_1. How much do you agree or disagree with the statement: I undertook all the training and development
I wanted and needed
The proportion of individuals who were satisfied with their training and development declined
according to their length of service (see Figure 33 following) up to a ’20 years’ service point but
then rose somewhat thereafter.

64/127 Training Needs Analysis
27/04/2018
Education and Training Foundation
64%
56%
60%
60%
71%
59%
16%
19%
13%
16%
7%
16%
19%
24%
27%
23%
22%
23%
1%
1%
1%
1%
1%
More than 20 years
10 years and up to 20 years
3 years but less than 10 years
1 year but less than 3 years
Less than 1 year
Total
Agree Neutral Disagree No opinion
Figure 33: Individuals who did or did not undertake all the training and development they
wanted and needed by length of service
Sample base: Total (2184), Less than 1 year (60), 1 year but less than 3 years (151), 3 years but less than 10
years (527), 10 years and up to 20 years (957), More than 20 years (480)
Q24_1. How much do you agree or disagree with the statement: I undertook all the training and development
I wanted and needed
Effective and ineffective training: the individual’s perspective
Individual’s views on the adequacy and sufficiency of their training were elaborated by
requesting their agreement or disagreement with a number of statements concerning that
training. Figure 34 (following) suggests that, in the opinion of some individuals, there was some
lack of quality in the training undertook or it was perceived to be of little value – 32% said some
of their training had no value to them, 12% said some of their training was not of high quality,
and 38% said that some of their training was ‘tick box’ training to allow their organisation to
meet a particular requirement.

65/127 Training Needs Analysis
27/04/2018
Education and Training Foundation
38%
65%
32%
17%
21%
19%
44%
12%
47%
2%
1%
2%
Some or all of the training and development Iundertook was just a 'tick box' exercise for
my organisation
Most or all of the training and development Iundertook was of high quality (even if some
of it was not of particular value to you)
I was required to undertake some trainingand development which had little value to me
Agree Neutral Disagree No opinion
Figure 34: Individuals’ perspectives on training and development over the past year
Sample base: 2184
Q24. Thinking about all the training and development you have undertaken in the last academic year, please
indicate how much you agree or disagree with the statements
A more detailed analysis suggests that staff in Colleges more frequently held a negative view on
these statements than did staff in other FE sub-sectors (see Table 19 following).

66/127 Training Needs Analysis
27/04/2018
Education and Training Foundation
Table 19: Individuals’ perspectives on training and development over the past year –
proportions agreeing with each of a set of statements by sub-sector
Total Colleges Local Authorities
ITPs Prime contractors
ITPs Sub-contractors
Charitable/ Voluntary Other
I was required to undertake some training and development which had little value to me
32% 39% 26% 22% 30% 22% 27%
Most or all of the training and development I undertook was of high quality (even if some of it was not of particular value to you)
65% 62% 67% 73% 75% 65% 65%
Some or all of the training and development I undertook was just a 'tick box' exercise for my organisation
38% 46% 33% 28% 27% 23% 31%
Sample base 2184 1022 479 193 67 106 126
Q24. Thinking about all the training and development you have undertaken in the last academic year, please
indicate how much you agree or disagree with the statements
A further analysis (see Table 20 following) shows that training was generally seen more
positively by staff who had been employed in FE for less than a year. It might perhaps be
expected that staff who were new to the sector might give particularly high value to training
which assists them to adjust to a new occupation and environment.

67/127 Training Needs Analysis
27/04/2018
Education and Training Foundation
Table 20: Individuals’ perspectives on training and development over the past year -
proportions agreeing with each of a set of statements by length of service
Total Less than 1 year
1 year but less than 3 years
3 years but less than 10 years
10 years and up to 20 years
More than 20 years
I was required to undertake some training and development which had little value to me
32% 21% 32% 33% 33% 30%
Most or all of the training and development I undertook was of high quality (even if some of it was not of particular value to you)
65% 72% 63% 68% 63% 67%
Some or all of the training and development I undertook was just a 'tick box' exercise for my organisation
38% 28% 36% 38% 40% 33%
Sample base 2184 60 151 527 957 480
Q24. Thinking about all the training and development you have undertaken in the last academic year, please
indicate how much you agree or disagree with the statements
The quality of training: an institutional perspective
Data on the quality of training obtained from in-depth interviews with providers closely
reflected that from individuals (see second row of Table 26 above) in that around two-thirds of
providers saw the training they offered as generally good. This was exemplified by comments:
“We ask for feedback from all of our sessions and it's generally good. We use
recognised bodies and that helps to ensure good standards.” (Sixth Form College)
“It’s generally good, we’ve had a couple of lapses in quality but it doesn't happen very
often, and there's always a different provider/course that we can just use next time.
We're quite selective in terms of conferences and seminars and they're well known ones,
so these are always good.” (FE College)
For the third of respondents who had reservations about the training they supply, these concern
variations in quality between suppliers and perceived limitations in some forms of training rather
than any general view that poor quality is widespread:
“It varies depending on who we get to deliver it. If the feedback is quite negative, we
would look at why and maybe not ask those people to run it again. Hopefully in the future
it will be assessed by impact assessments.” (FE College)
“External training meets a requirement. All of the external training we do is online and so
tends to be very dry but it ticks the right boxes in terms of content. For internal training,
we are not particularly good at it but we do try. We involve all members of staff in

68/127 Training Needs Analysis
27/04/2018
Education and Training Foundation
deciding what needs to be covered and they draw on their own experiences. We try and
make sure that everything that needs to be covered is covered.” (ITP sub-contractor)
“Online optional packages are less useful because staff are unable to check that they
have understood it as one might with face-to-face instruction. Although it's not adding a
huge value, it’s not having a big strain on resources either. You can still count it, you can
still put it in a report and say we’re doing X,Y, and Z.” (FE College).
“Most of ours is internal and the quality is fairly good. If we could use external more we
would but budget doesn't allow that. External quality differs. Sometimes free training is
better than training that we pay for but we use it so infrequently that it's hard to recall
examples. On balance the good outweighs the poor.” (ITP sub-contractor)
Most and least valuable forms of training: the individual’s perspective
Respondents in the survey of individuals who had undertaken more than one episode of training
were asked to describe, in various ways, the episodes which were most and least valuable to
them.
In respect of their most valuable episodes, the most frequently reported subject matter of that
training concerned teaching competences, Prevent, safeguarding, leadership and management,
and well-being and mental health (see Figure 35 following).

69/127 Training Needs Analysis
27/04/2018
Education and Training Foundation
Figure 35: Episodes of training that were of most use to individuals – subject matter
Sample base: 2166
Q26. What was the theme of subject of the training or development?
12%
10%
8%
7%
7%
5%
5%
5%
4%
4%
4%
4%
3%
3%
3%
2%
2%
2%
13%
2%
Enhancing other teaching or classroom competences
Enhancing the knowledge of Prevent duty
Enhancing the knowledge of safeguarding (childprotection)
Enhancing your governance, leadership, or managementskills
Developing or enhancing specialist skills in the area ofwell-being or mental health
Enhancing your expertise to carry out assessments forapprenticeship or other education or training programmes
Enhancing your knowledge of changes in public policy,procedures, and funding which affect your organisation…
Enhancing your technical or manual skills
Enhancing your ability to use digital and other newtechnologies in a teaching or classroom setting
Enhancing your own knowledge and competence inEnglish and Maths
Enhancing your soft skills, including things such as team-working, communication skills, time management, and…
Developing or enhancing specialist skills for working withlearners with Special Educational Needs (SEND)
Enhancing your subject/sector knowledge inacademic/vocational subjects other than English and…
Developing or enhancing Health and Safety skills
Awareness of equality and diversity
Enhancing your competence and knowledge ofadministrative procedures within your organisation or…
Enhancing your business or commercial skills
Awareness of SEND Code of Practice
Any other type
None
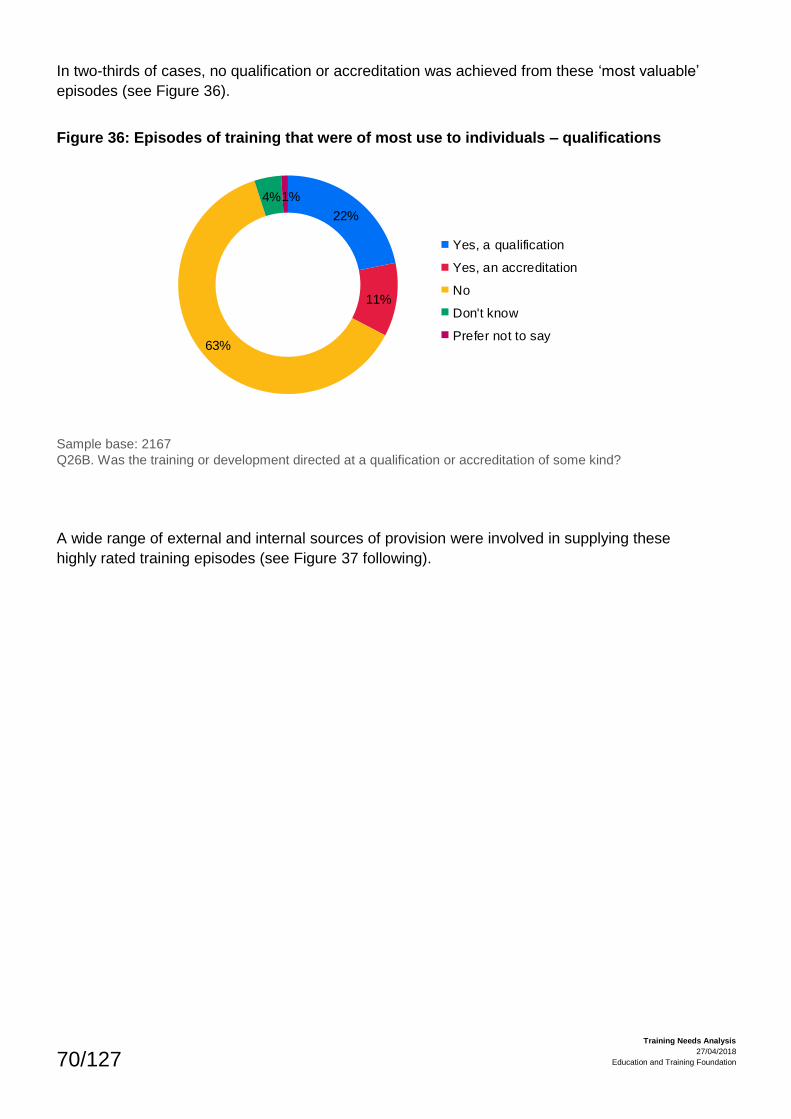
70/127 Training Needs Analysis
27/04/2018
Education and Training Foundation
22%
11%
63%
4%1%
Yes, a qualification
Yes, an accreditation
No
Don't know
Prefer not to say
In two-thirds of cases, no qualification or accreditation was achieved from these ‘most valuable’
episodes (see Figure 36).
Figure 36: Episodes of training that were of most use to individuals – qualifications
Sample base: 2167
Q26B. Was the training or development directed at a qualification or accreditation of some kind?
A wide range of external and internal sources of provision were involved in supplying these
highly rated training episodes (see Figure 37 following).

71/127 Training Needs Analysis
27/04/2018
Education and Training Foundation
Figure 37: Episodes of training that were of most value to individuals – training provider
Sample base: 2167
Q26D. Who delivered the training or development?
* denotes a figure greater than zero, but less than 0.5%
When asked to identify their least valuable training episodes, a substantial proportion of
respondents were not able or willing to put any of their training into this category. Those who did
so, however, mentioned a variety of subject matter, including Prevent and safeguarding training,
which often, though in smaller proportions, overlapped with subject matter identified, as above,
as being of highest value to other respondents (see Figure 38 following).
24%
24%
12%
8%
6%
5%
3%
2%
2%
2%
2%
2%
1%
*%
4%
4%
Specialist trainers, or coaches, or members from within yourorganisation
An external private training company or consultancy
Senior individuals in the organisation who trained ordeveloped your skills and knowledge
A professional institution
A university
ETF
An external further education college
AoC
AELP
Suppliers of equipment or materials to your organisation
E-learning/online training
Prefer not to say
Trade Union
The National College for Teaching and Leadership
Other
Don't know

72/127 Training Needs Analysis
27/04/2018
Education and Training Foundation
Figure 38: Episodes of training that were of least value to individuals – subject matter
Sample base: 1550
Q27A. What was the theme or subject of the training or development?
Three-quarters of these ‘least valuable’ training episodes were ones which did not lead to a
qualification, a higher proportion of non-qualification courses than in respect of ‘most valuable’
courses (see Figure 39 following).
8%
7%
6%
5%
5%
5%
4%
3%
2%
2%
2%
9%
11%
20%
3%
Developing or enhancing Health and Safety skills
Enhancing the knowledge of Prevent duty
Enhancing your administrative or clerical or informationtechnology skills
Enhancing other teaching or classroom competences
Enhancing the knowledge of safeguarding (child protection)
Awareness of equality and diversity
Enhancing your soft skills, including things such as team-working, communication skills, time management, and…
Enhancing your expertise to carry out assessments forapprenticeship or other education or training programmes
Enhancing your governance, leadership, or managementskills
Enhancing your technical or manual skills
Developing or enhancing specialist skills in the area of well-being or mental health
Not applicable
Any other type
None
Dont know/Not sure/Cant remember

73/127 Training Needs Analysis
27/04/2018
Education and Training Foundation
7%
6%
76%
7%4%
Yes, a qualification
Yes, an accreditation
No
Don't know
Prefer not to say
Figure 39: Episodes of training that were of least use to individuals – qualifications
Sample base: 1550
Q27B. Was the training or development directed at a qualification or accreditation of some kind?
And they were somewhat more likely than the ‘most valuable’ episodes to be delivered internally
to the organisation (see Figure 40 following).

74/127 Training Needs Analysis
27/04/2018
Education and Training Foundation
Figure 40: Episodes of training that were of least use to individuals – training provider
Sample base: 1550
Q27D. Who delivered the training or development?
* denotes a figure greater than zero, but less than 0.5%
There is, thus, an inference that training episodes are somewhat more likely to be seen as
valuable if they lead to a qualification and/or involve an external provider. Possibly related to
these factors, Table 21 (following) shows that ‘most valuable’ training episodes were, on
average, more than twice as long in terms of hours spent within the episode.
26%
19%
12%
4%
2%
2%
2%
1%
1%
1%
*%
*%
12%
12%
8%
Specialist trainers, or coaches, or members from withinyour organisation
An external private training company or consultancy
Senior individuals in the organisation who trained ordeveloped your skills and knowledge
A professional institution
An external further education college
ETF
Suppliers of equipment or materials to your organisation
A university
AoC
AELP
The National College for Teaching and Leadership
Trade Union
Other
Don't know
Prefer not to say

75/127 Training Needs Analysis
27/04/2018
Education and Training Foundation
Table 21: Episodes of training that were of most and least value – average hours spent
Total Colleges Local Authorities
ITPs Prime contractors
ITPs Sub-contractors
Charitable/ Voluntary Other
Most value - Hours spent on this training or development in the past year
20 17 16 25 25 19 29
Sample base 2167 1012 476 191 67 105 126
Least value - Hours spent on this training or development in the past year
8 6 7 11 10 10 16
Sample base 1550 705 350 143 51 79 91
Q26C/Q27C. How many hours did you spend on this training or development in the past year?
Figures 41 and 42 (following) show a direct comparison between most and least valuable
training episodes in terms of their subject matter and providers of the training.
It can be seen from Figure 41 that while a majority of individuals have undertaken training on
the subjects of Prevent duty, safeguarding, equality and diversity and health and safety skills
only a minority single these out as the most, or least, valuable episodes of training that they
undertook in the previous academic year. However, the area most frequently mentioned as the
most valuable, other teaching or classroom competences, was only undertaken by 29% of the
workforce and so represents a greater proportion of those who undertook such training.
From Figure 42 it can be seen that external private training companies, professional institutions,
Universities, and ETF get more ‘most valuable’ than ‘least valuable’ ratings.

76/127 Training Needs Analysis
27/04/2018
Education and Training Foundation
Figure 41: Comparison of training undertaken in the past academic year, most valuable
episode and least valuable episode – subject matter
Sample base: Individuals who have undertaken training (2,184), individuals who identified a most valuable
training episode (2166), individuals who identified a least valuable training episode (1,550)
* denotes a figure greater than zero, but less than 0.5%
80%
80%
66%
47%
30%
29%
27%
26%
25%
25%
21%
20%
16%
16%
16%
12%
11%
10%
10%
8%
8%
8%
4%
10%
8%
3%
3%
2%
12%
4%
4%
7%
5%
3%
1%
4%
5%
7%
4%
1%
1%
1%
2%
5%
2%
1%
7%
5%
5%
8%
0%
5%
1%
4%
2%
1%
1%
1%
1%
3%
2%
1%
6%
1%
*%
1%
2%
*%
*%
Knowledge of Prevent duty*
Knowledge of safeguarding*
Equality and diversity*
Health and Safety skills*
Knowledge of admin procedures
Other teaching or classroom competences
Use of digital and other new technologies in teaching…
Soft skills
Governance, leadership, or management skills
Knowledge of changes in public policy, procedures, and…
Subject/sector knowledge
Teaching of English and Maths
Individuals' own knowledge of English and Maths
Expertise to act as assessors for apprenticeship or other…
Skills in the area of well-being or mental health
Specialist skills for working with learners with (SEND)
Administrative or clerical or information technology skills
Expertise to offer careers advice and guidance to learners
Research skills
Business or commercial skills
Technical or manual skills
Awareness of SEND Code of Practice
QTLS
Training undertaken
Most valuable
Least valuable

77/127 Training Needs Analysis
27/04/2018
Education and Training Foundation
Figure 42: Comparison of training undertaken in the past academic year, most valuable
episode and least valuable episode – training provider
Sample base: Individuals who have undertaken training (2,184), individuals who identified a most valuable
training episode (2166), individuals who identified a least valuable training episode (1,550)
* denotes a figure greater than zero, but less than 0.5%
57%
44%
28%
16%
16%
10%
6%
6%
5%
5%
3%
3%
2%
2%
*%
24%
24%
12%
8%
5%
6%
2%
2%
3%
2%
4%
2%
1%
2%
*%
26%
19%
12%
4%
2%
1%
1%
2%
2%
1%
12%
8%
*%
0%
*%
Specialist trainers, or coaches, or members from within yourorganisation
An external private training company or consultancy
Senior individuals in the organisation who trained ordeveloped your skills and knowledge
A professional institution
ETF
A university
AoC
Suppliers of equipment or materials to your organisation
An external further education college
AELP
Any other supplier
Prefer not to say
Trade Union
E-learning/online training
The National College for Teaching and Leadership
Training undertaken
Most valuable
Least valuable

78/127 Training Needs Analysis
27/04/2018
Education and Training Foundation
Most and least valuable forms of training: the institution’s perspective
In the surveys, only individual respondents were asked to identify the training which they
regarded as most and least valuable. However, a comparison with these individual perceptions
with those of institutions can be made in that, in in-depth interviews, training providers were
also asked for their views as to which training they delivered was of most and least value.
In small numbers of cases, managers reported their most valuable training as that which was
related to apprenticeship changes, training in teaching skills, and training related to regulatory
requirements such as Prevent.
There were rather more frequent references to the value of training to develop, specifically,
English and maths teaching skills. For example:
“Training in functional skills, English and Maths.” (ITP Prime contractor)
“Monthly CPD through the ‘little and often’ approach. Teacher meetings, particularly with
English and Maths staff. We are part of the East Mids regional FE consortium of
colleges and meet once a term - these are really useful and give CPD that can be
cascaded.” (FE College)
“Efforts to improve maths and English are successful. The main things we are doing is
embedding maths and English into the curriculum” (Local Authority)
“Continued effort to ensure that all staff reach level 2 qualifications in maths and English
due to external pressures to embed such learning in the curriculum.” (General FE
college)
However, the training which was most frequently identified as successful or valuable was not
described in terms of its themes but in terms of its method – that is, as small group meetings or
workshops, sometimes involving an external input. For example:
“Monthly staff development days - we do these internally and staff talk about anything
that is topical, what they have learnt, and share best practice. It's about experiences and
focusses on teaching and assessment skills as well as sector learning.” (ITP sub-
contractor)
“Anything workshop-based where staff can take the knowledge but also have time to
apply it. This is because sometimes you can deliver something which they think is a
good idea but then they go away and don’t have time to implement it.” (FE College)
“We have a team meeting every month, and group training every 3 months - this sort of
sharing best practice is probably the most effective.” (ITP Prime contractor)
“It's good when an external trainer comes in and offers a new perspective. It's normally
to do with people skills, and takes the form of a small workshop. It shakes them up a bit
and makes them think about something new. Things that force people to interact are
always beneficial.” (ITP sub-contractor)

79/127 Training Needs Analysis
27/04/2018
Education and Training Foundation
“Classroom-based, 12 or so people. Group learning. This is because there's more scope
to share ideas and learn from each other.” (ITP sub-contractor)
The majority of organisations took the view that all the training they did was of value. The
summary viewpoints were essentially ‘we wouldn’t do it if we didn’t think it was valuable’ or ‘all
training is valuable since it increases skills and knowledge’.
A small number of organisations did, however, identify some training which they thought had
limited value:
• Most frequently, though in only a handful of cases, Prevent, safeguarding or Health and
Safety training was seen as ‘repetitive’, ‘laborious’, ‘not taken seriously enough by our
staff’, or ‘not applicable because of the type of learners we have’ (though it can also be
noted that, other providers, whilst recognising similar characteristics, also believed that
this type of training was essential)
• In two or three cases, Investors in People or Matrix training was regarded as being of
limited value
• And some respondents noted that some training methods, rather than themes, were not
effective, commenting that e-learning had a constrained or ‘linear’ nature which restricts
broader learning or that ‘training where people talk at you’ or ‘talk and chalk methods’ are
not well received.
Barriers to training
Organisations which reported that there was some shortfall in the training they would like to
have supplied to their staff also identified the barriers which accounted for that shortfall. The
main ones were pressure on staff time making it difficult to release them for training and shortfall
in funding for training (see Figure 43 following).

80/127 Training Needs Analysis
27/04/2018
Education and Training Foundation
Figure 43: Barriers to providing all of the training and development which was needed
Sample base: 347
Q36. What was the main barrier to providing all the training and development which was needed?
In depth interviews with provider respondents broadly concurred with the analysis above. Shortfalls
in training budgets or the costs of external training and difficulties in finding time for staff to train
away from their teaching duties were much the most frequently mentioned barriers. Some examples
are:
“Staff time. We are deliberately trying to keep assessors’ case loads high and so it is difficult
to find time. There's also the cost of getting everybody together as our organisation is
spread out.” (ITP prime contractor)
“The organisation adapts training to comply with budget. We'll just kind of minimise it to what
it is we can do at the moment. Most training is therefore provided internally, as external
providers are too expensive.” (Local Authority)
“The time factor. We have a limited number of staff and so if one is out training it puts a lot
of pressure on the others. We can only let one person do training at a time. We try to get
people to come to us but it doesn't always work. Staff willingness is not a problem.” (Charity)
“It's a funding issue. At the minute we try to offer the Business Administration Level 2
Framework apprenticeship to all our staff, but the current funding for that doesn't cover the
costs, so it's becoming financially unviable.” (ITP Prime contractor)
“The only barrier really is that it's very difficult to find a time that is suitable for
everybody... you're never going to get 100% attendance at any one event.” (Adult
Community College)
Whilst many respondents said that staff were keen to train, a minority noted some staff reluctance:
46%
32%
4%
3%
1%
1%
It is difficult to allow staff to have time off-the-job fortraining
Insufficient funding or income to the organisation
The organisation can't find or source the training anddevelopment needed
External training and development fees are too expensiveor over-priced
The organisation hasn't identified training anddevelopment needs accurately and/or hasn't planned
efficiently to meet them
Individuals are reluctant to train and/or are not responsiveto training and development opportunities

81/127 Training Needs Analysis
27/04/2018
Education and Training Foundation
“Staff enthusiasm is a big barrier. We offer to pay half of the course fees and expenses
for substantial external courses, including university and formal qualifications but staff
don't jump at the chance to take them up. We have to convince them by talking about
the benefits to them as an individual. We also sometimes have to take them away from
their scheduled work to ensure they have completed their course materials.” (Charity)
“There is some staff reluctance, particularly since we brought in return of service - staff
have to pay back for any accredited training if they leave within a certain time period.”
(ITP prime contractor)
A minority also noted reluctance to teach maths and English and to undertake the training necessary to do this:
“Dwindling resources - CPD now needs to be more bottom up. We have a lot of staff
who come from industry and so don't have the necessary teaching and pedagogy skills.
We need to be able to quickly get them up to speed, but don't have the bank of
resources. Materials need to be quick and easy for people to understand. There's also
a barrier in terms of individuals' perceptions of things like English and maths. They
struggle to see why their teaching needs to incorporate it.” (FE College)
“As a niche provider all our staff are specialists, so they know their industry very well. So
when they're forced to provide English and maths it's a big problem because they're not
set up to be able to do that and it puts a lot of pressure on the business. We don’t want
to put the staff through English and maths training because they're not English and
maths teachers, and they wouldn't want to do the training anyway. It makes it difficult for
employers too, because they want the English and maths but the centre can't provide it.
We have to find some way around it, normally by bringing someone external to deliver it.”
(ITP sub-contractor)
Two respondents also noted the new demands of apprenticeship as a barrier:
“We see the impending transition of apprenticeships frameworks to standards as the
biggest challenge. The actual training itself isn’t an issue it’s the admin and planning that
goes along with it.” (ITP Prime contractor)
“Our only difficulty is around updating apprenticeships and the funding around it. This is
down to nothing being confirmed - it brings uncertainty. Even with the Trailblazers it was
‘this is how we envisage this happening’ but it’s never actually confirmed. Generally
keeping up with ever-changing government initiatives and programmes”. (ITP sub-
contractor)
Shortfalls in supply or availability of training were not frequently mentioned by respondents but
one example was:
“The only thing is training from scratch. Looking after young apprentices. The mentoring
and the pastoral side. I don’t think there is any of that anymore. There is no structured
training for anyone new like there was 30 years ago. I wouldn't know where to look for
this type of training.” (ITP sub-contractor)

82/127 Training Needs Analysis
27/04/2018
Education and Training Foundation
CHAPTER 4: FUTURE TRAINING NEEDS
Summary of chapter
Against a background which includes evidence of a high volume and wide spectrum of training
undertaken by FE sector staff but also of some gaps in training and in the infrastructure for
training, this chapter considers institutions’ and individuals’ perceptions of the need for future
training and development
Ensuring the effective performance of the organisation will be the most frequent driver of the
training supplied in the near future by organisations, but the needs of the workforce (particularly
to adapt staff moving into the sector from other sectors and to keep staff up-to-date) and the
direction of national policy (particularly in respect of apprenticeships) are other key drivers – the
last of these being particularly important for private training businesses.
However, some key priorities for future training were not directly concerned with themes of
training but with its delivery methods. Particularly, there is much interest in using technology in
training by introducing or extending the use of on-line and other methods of distance learning
and virtual learning environments.
In realising their priorities, key challenges for providers remain the ones they face now –
restriction on budgets and the difficulty of releasing staff for training. Though not directly a
training issue, some providers noted staff recruitment and retention difficulties, often because of
wage competition from employment opportunities in teachers’ or potential teachers’ ‘home’
industries, as a constraint on skills supply.
Providers most frequently saw their ‘core’ workforce (in the sense of their being most numerous
in the sector) – teachers and trainers and managers – as in need of training in the near future.
And two-thirds (68%) of staff working in the sector report that further training would be of value
to them.
There is demand for training in a wide variety of areas but subject knowledge, leadership and
management skills, and teaching and classroom competences remain the most frequent areas
of demand.
From the individual perspective, there is particular demand for training which leads to higher
level qualifications in education and training such as PGCE or the Diploma in Education and

83/127 Training Needs Analysis
27/04/2018
Education and Training Foundation
15%
35%
39%
26%
12%
17%
21%
8%
11%
14%
20%
18%
47%
27%
25%
26%
36%
34%
13%
21%
17%
19%
15%
16%
3%
1%
4%
12%
7%
7%
2%
8%
4%
5%
10%
8%
Charitable/ Voluntary
ITPs Sub-contractors
ITPs Prime contractors
Local Authorities
Colleges
Total
National and sector needs, including policy changes
The needs of your own workforce
The needs of your organisation
Local employers and the local economy
None of the above
Don't know
Training (DET).
In respect of their future training needs, six out of ten providers are wholly confident that their
future training needs will be met and most of the remainder are reasonably confident of this. In
support of this, a majority (59%) of providers expect their training budgets to stay the same next
year as they were in the previous year. The minority (16%) which expect their budget to decline,
is balanced by the minority (15%) which expect it to increase (though it may be noted that it is
larger providers, often colleges, which on balance, are most pessimistic about their future
budgets for training).
Although, as above, organisations are generally confident about their future training, around
two-thirds would still welcome support (from ETF, the Department for Education, and
membership bodies) with realisation of their training ambitions and objectives.
Individuals working in the sector were also mainly confident that they would undertake new
training or development in the near future, with over seven out of ten expecting this.
Drivers of training: an institutional perspective
A first analysis shows that the requirement for organisations to maintain and improve
performance is the most frequent driver of training needs in the immediate future. Beyond that,
the needs of the workforce and of local economies are often the main driver of training but, for
ITP prime contractors, the nature of public policy is the single largest driver of staff training and
development (see Figure 44).
Figure 44: Biggest drivers of training and development needs in the next year or so –
institutions perspective

84/127 Training Needs Analysis
27/04/2018
Education and Training Foundation
Sample base: Total (473), Colleges (107), Local Authorities (43), ITPs Prime contractors (119), ITPs Sub-
contractors (89), Charitable (62)
Q37. Turning to the future now, which of the following do you see as being the biggest driver of training and
development needs in your organisation over the next year or so?
Figures below 3% have not been shown
Where public policy is seen as the most powerful driver, apprenticeship reform, the drive to
improve technical education, and efforts to professionalise the FE sector workforce are seen as
important specific elements of that pressure (see Figure 45).
Figure 45: Biggest drivers of training and development needs in the next year or so –
national and sector needs
Sample base: 121
Q37A. And more specifically, what national and sector needs do you see as being the biggest driver?
Sample bases are small, but the data suggests that Colleges are particularly likely to see
reforms to technical education as a driver whilst ITPs see responsiveness to apprenticeship
reform as a very frequent driver (see Table 22 following).
24%
42%
7%
22%
5%
The reforms of technical education (including theintroduction of T-Levels)
The reforms of apprenticeships including the levy andstandards
Other changes in public policy at national level
National and sector concern to further professionalise thesector workforce
Other

85/127 Training Needs Analysis
27/04/2018
Education and Training Foundation
Table 22: Drivers of training and development in the next year or so – national and sector
needs
Total Colleges Local Authorities
ITPs Prime contractors
ITPs Sub-contractors
The reforms of technical education (including the introduction of T-Levels)
24% 38% 18% 7% 10%
The reforms of apprenticeships including the levy and standards
42% 31% 9% 78% 68%
Other changes in public policy at national level
7% 0% 27% 9% 10%
National and sector concern to further professionalise the sector workforce
22% 23% 36% 7% 13%
Other 5% 8% 9% 0% 0%
Sample base 121 13 11 46 31
Q37A. And more specifically, what national and sector needs do you see as being the biggest driver ?

86/127 Training Needs Analysis
27/04/2018
Education and Training Foundation
Where workforce needs are seen as the strongest driver, development of staff brought into the
sector from other sectors, up-dating of existing staff, and staff demand for training are key
forces (see Figure 46).
Figure 46: Biggest drivers of training and development needs in the next year or so –
own workforce needs
Sample base: 71
Q37B. And more specifically, what needs of your own workforce do you see as being the biggest driver?
Again sample bases are small, but Colleges appear more likely to see training as being driven
by the need to induct teaching recruits from industry whist ITPs are particularly concerned to
update the skills of their existing teachers (see Table 23 following).
34%
34%
24%
4%
4%
The requirement to develop the teaching capability of staffrecruits from industry or commerce
Need to maintain up-to-date industry knowledge and skillsof teaching and learner-facing staff
Demand for training and development coming from staffmembers
Other
Don't know

87/127 Training Needs Analysis
27/04/2018
Education and Training Foundation
Table 23: Drivers of training and development in the next year or so – own workforce
needs
Total Colleges ITPs Prime contractors
Charitable/ voluntary
The requirement to develop the teaching capability of staff recruits from industry or commerce
34% 38% 23% 23%
Need to maintain up-to-date industry knowledge and skills of teaching and learner-facing staff
34% 33% 62% 15%
Demand for training and development coming from staff members
24% 19% 15% 54%
Other 4% 5% 0% 0%
Don't know 4% 5% 0% 8%
Sample base 71 21 13 13
Q37B. And more specifically, what needs of your own workforce do you see as being the biggest driver?
In respect of the needs of organisations, the key factor is simply the need to maximise
organisational performance (see Figure 47).
Figure 47: Biggest drivers of training and development needs in the next year or so –
organisational needs
Sample base: 151
Q37C. And more specifically, what needs of your organisation do you see as being the biggest driver?
In this case, public sector providers were somewhat more likely to say that efficiency and
organisational performance would drive training than were private sector organisations (see
Table 24 following)
13%
10%
69%
4%
3%
1%
Meeting the needs of a growing organisation
The organisation's awareness of training and developmentneeds in your present workforce
The organisation's desire to maximise the efficiency,performance, and professionalism of its workforce
The further development of digital technology approachesin teaching and learning
Other
Don't know

88/127 Training Needs Analysis
27/04/2018
Education and Training Foundation
Table 24: Drivers of training and development in the next year or so – organisational
needs
Total Colleges Local Authorities
ITPs Prime contractors
ITPs Sub-contractors
Charitable/ voluntary
Meeting the needs of a growing organisation
13% 13% 0% 13% 17% 17%
The organisation's awareness of training and development needs in your present workforce
10% 11% 9% 17% 13% 3%
The organisation's desire to maximise the efficiency, performance, and professionalism of its workforce
69% 71% 82% 63% 58% 59%
The further development of digital technology approaches in teaching and learning
4% 3% 0% 3% 4% 17%
Other 3% 3% 0% 3% 4% 3%
Don't know 1% 0% 9% 0% 0% 0%
Sample base 151 38 11 30 24 29
Q37C. And more specifically, what needs of your organisation do you see as being the biggest driver?
And in respect of local needs, there is recognition of the pressure to meet the skills needs of
employers in the local economy (see Figure 48).
Figure 48: Biggest drivers of training and development needs in the next year or so –
local needs
Sample base: 81
Q37D. And more specifically, what local needs do you see as being the biggest driver?
* denotes a figure greater than zero, but less than 0.5%
66%
31%
3%
*%
Responding to the skills needs of the local economy
A need to be more commercial driven and employer-focused
Other
Don't know

89/127 Training Needs Analysis
27/04/2018
Education and Training Foundation
In respect of local needs, Colleges and ITP prime contractors were particularly likely to see the
skills needs of local economies as a key driver of training whereas ITP sub-contractors were
more likely to see direct responsiveness to particular employers and to commercial pressures
on their organisation as drivers (see Table 25).
Table 25: Drivers of training and development in the next year or so – local needs
Total Colleges ITPs Prime contractors
ITPs Sub-contractors
Responding to the skills needs of the local economy
66% 69% 65% 42%
A need to be more commercial driven and employer-focused
31% 31% 25% 53%
Other 3% 0% 5% 5%
Sample base 81 16 20 19
Q37D. And more specifically, what local needs do you see as being the biggest driver?
In depth interviews with senior managers in the sector provide more detail of the factors which
will drive their future training.
Some managers did not identify any major new drivers and reported that they would continue to
respond to existing pressures such as tight budgets, Ofsted requirements or, in Local Authority
cases, local political direction. However, other managers identified a wide range of other drivers.
Those mentioned with some frequency included:
• Apprenticeship reform with particular reference to new standards, the apprenticeship
levy, and new assessment requirements.
• Changes to the curriculum and qualifications with some references to T-levels.
• A variety of pressures from public policy change and from legislative and compliance
demands, with some particular reference to data protection and new GDPR regulations.
• The requirement to become more market oriented and responsive to employers’ needs
and to exploit new business opportunities.
• Circumstances affecting particular organisations, including mergers and adaptation to
new premises.
• Technological factors including the use of digital technologies and social media in
marketing and responding to technological change in industry such as robotics and
artificial intelligence.
Illustrative quotes from these interviews, sequenced in relation to the types of driver which are
itemised above, are:
Apprenticeship reform:
“With the arrival of the apprenticeship standards it's a different skill set the assessors
need now, they're more like a coach or a mentor.” (ITP sub-contractor)

90/127 Training Needs Analysis
27/04/2018
Education and Training Foundation
“All our courses are mapped to the relevant standards, and so our training is based
around these. As such the new standards coming in are going to impact the training that
is offered to our staff.” (ITP sub-contractor)
“New standards. Changes to the role of the assessor - how we coach and mentor
learners so that the learner is prepared for endpoint assessment.” (ITP prime contractor)
Curriculum and qualifications: “Curriculum change - the pace of it and lack of information about what is happening will
mean that we’ll have to be keeping track.” (FE College)
“At the moment we are changing into real added value courses and we have expanded
our course network to include some new qualifications. Teachers for the new subject
areas will receive training and also, as we go into more added value courses which are
more training rather than assessment orientated, people's knowledge refreshers will be a
priority.” (ITP sub-contractor)
“T-levels. We are applying to deliver pilot T-levels in Childcare and Development.” (ITP Prime contractor) “The drivers are the changes to qualifications and standards based on the
recommendations of employers and funding agencies. And transferring over to teach
GCSE level is also going to be a massive driver - we really need to gear up to make sure
that we’re ready for it.” (ITP Prime contractor)
Responsiveness to policy change:
“The landscape is changing quite significantly, and has done in the last 12 months with
multiple strategies coming out. It's far too much for many staff in the sector and that is
why we are losing a lot of strong professionals. They've gone from changing GCSEs to
changing the standards. There isn't enough guidance and support out there. It's having
the capacity and support to allow your team to up-skill.” (ITP sub-contractor)
“We’re preparing for an Ofsted assessment so we’re focusing more and will focus more
on the governmental/compliancy side of the organisation.” (ITP sub-contractor)
“The drivers will continue to be ensuring that we’re keeping up with whatever the
government throws at us - GDPR will be one of them.” (ITP sub-contractor)
Mergers:
“There is the merger which means we need to standardise practices across the board
and share best practice. Our college is high performing compared to the other colleges
so we want to take some of the practices and ethos to the other colleges.” (FE College)
“We’re going to be merging with another College this year, so there's going to be a lot of
new processes, systems etc. So there's going to be a lot of internal training. The adult
college in its current form is kind of winding down in preparation for the merger.” (Local
Authority)

91/127 Training Needs Analysis
27/04/2018
Education and Training Foundation
Technology:
“Only around the digital technologies area - it's our biggest growth area with lots of
changes afoot, but I don’t think that there's enough people coming in to the industry with
enough knowledge in this area.” (ITP prime contractor)
Priorities for, and changes in, training: insights from depth interviews
FE sector managers interviewed in depth were also asked whether their priorities for training
would change in the near future. A minority of these managers picked out particular aspects of
training which might be given a new or higher priority – such as QTLS training, preparing for
GDPR, adjusting to new apprenticeship standards, and so on – but there was no consistent
pattern in the priorities identified nor any sense that major shifts in the sector’s priorities overall
was underway.
Rather, the bulk of providers said that their current priorities would continue or that they were
uncertain, as yet, about the impact of various external or internal changes which would or could
occur and their aim was therefore, simply to respond to particular challenges as they arose.
Consequently, a frequent response to a question about future change in the delivery pattern of
their current training was that this would not change substantially or would only change when
and if circumstances changed, for example:
“We will probably be carrying on exactly as we are. Rather than respond to external
drivers, it's going to be built upon what we've already got due to budget constraints.”
(Local Authority)
“It’s uncertain ahead of annual review but my gut feeling is that it won't change that
much: everything is in there that needs to be in there.” (Local Authority)
“The balance will probably stay the same... We might well have a slight increase in
bespoke training once we're clear about standards. Once we're clear about what the
standards are actually going to involve for our sector, then I think we can unpick the
situation.” (ITP sub-contractor)
“We've worked quite hard on it over the last couple of years... We're at a position of
where we're happy with it and we'd like to think we can run with that the way it is.” (Local
Authority)
In around half of cases, however, these managers did foresee changes. Some of these
changes concerned particular themes of training, such as apprenticeship standards or levy,
pedagogical skills, leadership and management skills, and so on. However, the more frequent
responses concerned change in training methods with two types of change – one, towards on-
line, distance, and blended learning and towards virtual learning and, second, towards the
greater use of external sources of training. These latter responses are exemplified below.

92/127 Training Needs Analysis
27/04/2018
Education and Training Foundation
“We are going more e-portfolio based and more kind of blended learning approach or
that's what we are trying to get into at the moment. The main provider that we work with
to deliver things like safeguarding training is unfortunately going in the other direction
and requiring everyone to be kind of there in person which means a lot of travelling. So
we are trying to make better use of technology.” (ITP sub-contractor)
“We’re looking at bringing in Virtual Learning Environments and doing some more
blended learning - staff doing some training from home etc.” (ITP prime contractor)
“We’ve bought licences to use a commercial supplier’s training which is an
online/distance learning centre, so we’re pushing that sort of online training a bit more.”
(ITP Prime contractor)
“There is the hope that we'll be able to improve our virtual learning environment (VLE)
and in that case we would provide more blended type training which would be really
helpful.” (Local Authority)
“We’ll be trying to get more external trainers to come into us and deliver training to avoid
having to send so many staff out. This may mean that only a small number get trained
initially but then they cascade the training to the rest of staff.” (ITP prime contractor)
The challenges ahead: insights from depth interviews Asked to identify key challenges to the future delivery of their staff training ambitions, providers essentially focussed on three main issues:
• Availability of budget for training from a variety of perspectives
• Time for staff to train
• Recruitment challenges
These issues are exemplified in the following quotations. Budget issues:
“We’re anticipating a shift towards e-learning and distance learning, because 'it's
something that's relatively budget effective but we are unable to implement immediately
because we've not got the resources to do that…we'd have to bring in an external
company.” (Local Authority)
“Levels of income being reduced due to approaching endpoint assessments. Risk of
apprentices failing endpoint assessment and the costs associated with this. The new
funding structure generally.” (ITP sub-contractor)
“Funding access. You can't be funded twice for the same thing – you can’t do training
again at the same level.” (Charity)
“Maintaining the budget within a tight financial environment.” (Sixth Form College)

93/127 Training Needs Analysis
27/04/2018
Education and Training Foundation
“The biggest challenge will be the devolved budget. It'll change how our organisation is
funded, and at the minute we don't know what that'll mean for us.” (Local Authority)
Time-to-train issues:
“Finding time for training and getting people together. Another challenge is that people
come into FE thinking it will be easier than the job they have been doing in industry but
there are lots of things to balance.” (ITP prime contractor)
“Just the time - it's balancing taking a member of staff away from a fee earning day... But
that's always going to be a challenge for us because we're a commercial company.” (ITP
sub-contractor)
“Finding the time for training and changes in standards and the focus of staff.” (ITP prime
contractor)
“The only thing I think that is always an issue is when you work for a small organisation
it’s just trying to weigh up time to actually do the job and time to invest in skills,
knowledge and behaviours to make sure you can do that job well.” (ITP sub-contractor)
Recruitment issues:
“Some recruitment challenges in that we can't offer the same salaries as a general FE
institution because we’re [a] charity.” (Charity)
“It's difficult to get the right staff, particularly in maths and English. So the main challenge
is getting the staff in the first place, rather than providing the training.” (Local Authority)
“Massive challenges. For health and social care there is such a shortage of funds to
retain the quality of staff. The biggest issue is retaining the right personalities within
health and social care. It should be a vocation and it's not. It's about meeting a need, but
even on that the priority is making sure that that person is equipped with the right skills
set to be able to deliver a quality service.” (ITP sub-contractor)
Respondents in these in-depth interviews also identified their priorities for future training,
many respondents identifying several of these. There were a wide variety of priorities but the
ones which were most frequently mentioned were:
• Delivery of mandatory training, including Prevent, safeguarding, and health and safety
training, to ensure regulatory compliance and Ofsted standards.
• Teaching skills and professional standards.
• Training related to apprenticeship reform and, particularly, to apprenticeship standards.
• Assessor skills (particularly those required by apprenticeship end-point assessments).
• Leadership and management skills.
A range of other priorities were mentioned in smaller numbers, in some cases just in one or two
instances. These priorities included information, advice, and guidance skills, conversion of staff
from industry into teaching occupations, digital literacy, English and maths, dealing with

94/127 Training Needs Analysis
27/04/2018
Education and Training Foundation
challenging behaviours and conflict management, and keeping up with public policy changes.
Example quotes in these areas are set out below.
Mandatory training:
“All staff have had the mandatory training that they need - Prevent, Health and Safety
etc. We refresh them every year as they need updating. We need to make sure that we
are complying. As we have a limited budget we do the ones that we have to.” (ITP sub-
contractor)
Teaching skills:
“The teaching and learning aspect is our main priority - putting the learners first and
making sure that we're doing right by them. To ensure that our learners are getting the
best deal, to make sure that we're fulfilling every aspect. That our tutors are performing
well and our learners are learning in terms of subject matter. We've been prioritising
embedding English and maths, British values.” (Local Authority)
“Teaching and pedagogy skills. More thorough induction for those coming from
industry.” (FE College)
Apprenticeship-related skills:
“Apprenticeships and the standards that go with them, including end-point assessment.
We will have learners at that stage soon. Standards training has been taking priority
over teaching and pedagogy skills recently due to all of the recent changes. Finance
teams have been prioritised due to the levy and levy contributions. We've also prioritised
training for our business development team.” (ITP private contractor)
Assessment skills:
“Assessment skills - both formative and quality of assessment.” (FE College)
Management skills:
“Management is a big one. Going forward we've got management and succession
planning. We have an ageing workforce which we are currently looking at putting in
steps to deal with. Most notably, a lot of our knowledge base is in our older delivery
chaps. So it’s a case of doing a lot of coaching and shadowing to pull their knowledge
out and give it to younger members of the team.” (ITP sub-contractor)
Information, advice, and guidance:
“IAG training - we want all of our staff to have it - some at level 2 and some at level 4. All
of our staff are customer facing and so need it.” (Charity)
Digital systems:
“System capability and digital literacy. We’re transitioning to new work and learning
spaces. These are quite linked. We’re moving into a more digitally aligned building and
making the organisation paperless. The detail is still being worked out.” (Local Authority)

95/127 Training Needs Analysis
27/04/2018
Education and Training Foundation
Keeping up to date:
“Our priority is to keep the staff up to date. Keeping them up to date in their own subject
knowledge is important, but the biggest priority is keeping them up to date with
legislation because that’s always changing.” (Charity)
In terms of the main drivers of these priorities, managers interviewed in depth, clustered
them into four or five main areas.
The first of these is a blend of simple commercial necessity, operational needs, organisational
culture, and maintenance of reputation. The basic characteristics of this message were summed
up as ‘if our staff aren’t good enough, we won’t have a job’ or ‘this is what we are, we need to be
the best for our learners’.
The second, very frequent, set of drivers was simply the range of regulations and legislation
which affects the sector, these particularly driving the near-universal training related to Prevent,
safeguarding, and health and safety.
As sub-areas of this, the particular demands placed on performance by Ofsted inspection and
compliance requirements and by apprenticeship reform were also frequently identified.
Beyond these organisational and external pressures to keep staff skill levels at a high level,
several respondents also noted that staff demand for training was significant and that they
responded to this for staff morale and retention reasons.
Who will need training?
The core workforce of the sector – lecturers, teachers, or tutors – is most frequently identified by
FE institutions as the group of people who will need training in the near future, with
management staff being the next most frequently identified group (see Figure 49 following).
However, it needs to be recognised that the fact that fewer providers identified training needs for
some other groups (such as careers guidance specialists, advanced practitioners, and so on) is
likely to reflect the circumstance that these roles are less frequent in the sector than, say,
teachers and tutors. The lower figures may reflect this lower incidence of some roles rather than
a belief that people in those roles have a lesser need for training.

96/127 Training Needs Analysis
27/04/2018
Education and Training Foundation
Figure 49: Staff groups that will need training and development in the next year or so
Sample base: 473
Q39. Which of the following people do you anticipate will need training and development in the next year or
so?
85%
79%
78%
74%
64%
64%
63%
61%
56%
4%
4%
Lecturers, teachers or tutors
Senior Management Team
Middle and junior managers
Specialist assessors, verifiers, trainers or instructors
Careers guidance specialists
Specialist coaches, mentors and staff trainers
Teaching, learning, and classroom assistants
Members of the governance body of the organisation/ Non-employed governors or trustees/ Non-executive owners or
board directors
Advanced practitioners
Don't know
None of the above

97/127 Training Needs Analysis
27/04/2018
Education and Training Foundation
Generally, Colleges, possibly because of their larger and more varied workforces, reported the
need for training of all occupational groups (see Table 26).
Table 26: Staff groups that will need training and development in the next year or so
Total Colleges Local Authorities
ITPs Prime contractors
ITPs Sub-contractors
Charitable/ Voluntary
Governors or equivalent 61% 74% 28% 43% 30% 39%
Senior Management Team
79% 81% 79% 77% 72% 53%
Middle and junior managers
78% 87% 79% 67% 40% 37%
Advanced practitioners 56% 64% 56% 41% 33% 23%
Lecturers, teachers or tutors
85% 89% 79% 84% 72% 63%
Specialist assessors, verifiers, trainers or instructors
74% 77% 63% 80% 76% 50%
Careers guidance specialists
64% 76% 53% 44% 29% 32%
Specialist coaches, mentors and staff trainers
64% 71% 51% 53% 43% 40%
Teaching, learning, and classroom assistants
63% 77% 56% 34% 24% 16%
Don't know 4% 6% 0% 2% 2% 5%
None of the above 4% 3% 9% 3% 6% 10%
Sample base 473 107 43 119 89 62 Q39. Which of the following people do you anticipate will need training and development in the next year or
so?
From an individual perspective, 7 out of 10 workers in the industry believe further training and
development would be valuable to themselves and/or their organisation, this proportion being a
little higher in ITPs (see Figure 50 following).

98/127 Training Needs Analysis
27/04/2018
Education and Training Foundation
Figure 50: Individuals who think further training and development would be of value
Sample base: Total (2366), Colleges (1125), Local Authorities (498), ITPs Prime contractors (204), ITPs Sub-
contractors (70), Charitable (114), Other (133)
Q28. Thinking about the year ahead, is there any new training or development (excluding any that you are
already doing) which you think it would be of value to you and/or to your organisation for you to undertake?
This is regardless of whether or not you are likely to do it and whether or not you particularly want to do it.
More than half of all individuals in virtually all particular job roles thought that further training
would be of value, with particularly high proportions of advanced practitioners, middle and junior
managers, and specialist coaches, mentors, and staff trainers believing this (see Figure 51
following).
68%
67%
67%
77%
75%
69%
73%
Total
Colleges
Local Authorities
ITPs Prime contractors
ITPs Sub-contractors
Charitable/Voluntary
Other

99/127 Training Needs Analysis
27/04/2018
Education and Training Foundation
Figure 51: Individuals who think further training and development would be of value
Sample base: Total (2366), Governor/trustee/board member (34), Senior management team (305), Middle and
junior manager (472), Advanced practitioner (70), Lecturer, teacher or tutor (748), Specialist assessor or
verifier (203), Careers guidance specialist (23), Specialist coach, mentor or staff trainer (56), Teaching,
learning or classroom assistant (128), Support worker (administrative/clerical) (183), Support worker
(maintenance, security, catering or cleaning) (37)
Q28. Thinking about the year ahead, is there any new training or development (excluding any that you are
already doing) which you think it would be of value to you and/or to your organisation for you to undertake?
This is regardless of whether or not you are likely to do it and whether or not you particularly want to do it.
68%
70%
63%
75%
88%
70%
73%
59%
75%
58%
49%
56%
Total
Governor/trustee/board member
Senior management team
Middle and junior manager
Advanced practitioner
Lecturer, teacher or tutor
Specialist assessor or verifier
Careers guidance specialist
Specialist coach, mentor or staff trainer
Teaching, learning or classroom assistant
Support worker (administative/clerical)
Support worker (maintenance, security, catering or cleaning)

100/127 Training Needs Analysis
27/04/2018
Education and Training Foundation
What training will be required: the institutional perspective
Institutions believe that a wide variety of future training will be required – most frequently,
development of subject or sector knowledge, of governance, leadership, and management
skills, and of teaching competences (see Figure 52).
Figure 52: Types of training and development that will be required
Sample base: 473
Q40B. You said that you will need to improve teaching and pedagogy. Is this in any of the following areas?
Q40C. You said that you will need to improve maths and English skills is this...?
Q40. Which of the following types of training and development will be required?
In more detail, where it was believed that subject or sector knowledge needed to be
developed, providers identified a wide variety of subject/sector areas but health and care,
engineering and manufacturing, English, business administration, education and training, and
maths headed the list in terms of their frequency (see Figure 53 following).
78%
75%
64%
62%
60%
59%
49%
Subject/sector knowledge
Governance, leadership and management skills
Other teaching or classroom competences
Teaching of maths and English
Specialist skills for working with learners with SEND
Use of digital and other new technologies in teachingprogrammes
Individuals' own knowledge in maths and English

101/127 Training Needs Analysis
27/04/2018
Education and Training Foundation
Figure 53: Subject areas where training and development is needed in the next year or so
Sample base: 355
Q42. You said that you will need to improve subject/sector knowledge within your workforce. Which subject
areas are they?
The particular areas in which it is believed that leadership and management training and
development will be required are shown in Figure 54 (following). The development of general
organisational management skills heads the list but there is substantial demand for training
across a range of leadership and management areas.
38%
27%
22%
22%
21%
21%
21%
19%
19%
17%
15%
13%
12%
10%
9%
9%
8%
8%
7%
5%
3%
3%
Just subject knowledge generally/across all areas
Health, public services, and care
Engineering and manufacturing
English
Business administration and law
Education and training
Maths
Construction planning and the built environment
ICT
Leisure, travel, hospitality, and tourism
Arts, media, and publishing
Science
Preparation for life and work
Humanities subjects
Agriculture, horticulture, and animal care
Retail and commercial enterprise
Languages, literature and culture
Social science
Family learning
Community development
Is there any other subject area not mentioned?
Don't know

102/127 Training Needs Analysis
27/04/2018
Education and Training Foundation
Figure 54: Leadership areas where training and development is needed in the next year
or so
Sample base: 302
Q43. You said you will need to improve the organisation’s governance, leadership, and management skills.
Are these skills in any of the following areas?
There was substantial demand for most types of leadership training from most types of
organisations but demand was particularly high for training in general organisational
management, team leadership, and supervisory skills in Colleges and for senior leadership skills
in Local Authority training organisations (see Table 27 following).
76%
70%
65%
63%
61%
61%
60%
56%
43%
6%
6%
General organisational management
Team leadership and supervisory skills
Senior leadership development
Change management and business improvement
Management of commercial operations, businessdevelopment, marketing, or employer engagement
Financial planning and management
Strategic management and corporate planning
Human resources planning and management
Facilities management
Any other form of governance leadership, andmanagement? (specify)
Don't know

103/127 Training Needs Analysis
27/04/2018
Education and Training Foundation
Table 27: Leadership areas where training and development is needed in the next year or
so
Total Colleges Local Authorities
ITPs Prime contractors
ITPs Sub-contractors
Charitable/Voluntary
Senior leadership development
65% 63% 80% 69% 73% 46%
Strategic management and corporate planning
60% 62% 63% 57% 56% 54%
General organisational management
76% 82% 73% 58% 56% 42%
Change management and business improvement
63% 64% 57% 65% 62% 46%
Management of commercial operations, business development, marketing, or employer engagement
61% 62% 57% 64% 54% 54%
Financial planning and management
61% 68% 43% 39% 40% 42%
Human resources planning and management
56% 62% 37% 45% 35% 42%
Facilities management 43% 49% 37% 31% 13% 19%
Team leadership and supervisory skills
70% 74% 50% 65% 52% 58%
Any other form of governance leadership, and management
6% 6% 3% 4% 8% 15%
None 0% 0% 0% 0% 0% 0%
Don't know 6% 6% 7% 3% 10% 8%
Sample base 302 87 30 74 52 26
Sample base: 302
Q43. You said you will need to improve the organisation’s governance, leadership, and management skills.
Are these skills in any of the following areas?
What training will be required: the individual perspective
As above, institutions more frequently identified training in subject or sector knowledge as being
required than other prospective areas of training. However, the individual survey suggests that,
in terms of the actual number of people requiring training, training in teaching competences and
in leadership and management may have greater prominence (see Figure 55 following).

104/127 Training Needs Analysis
27/04/2018
Education and Training Foundation
Figure 55: Individuals’ perceptions of training and development that will be required
Sample base: 1594
Q29. What forms of training or development would that be?
Q30. And which of these are your top priorities?
When these perceptions of training need are analysed by individual respondents’ job roles (see
Tables 28 and 29 following), there is a natural association whereby people want types of
training which are significant to their roles. Thus, for example, managers more frequently want
leadership and management training whereas teachers more often want training in teaching and
pedagogical skills.
59%
24%
38%
56%
16%
44%
13%
24%
34%
7%
Teaching and Pedagogy Maths and English Leadership Any other Enhancing your subjectknowledge in academic
subjects other thanEnglish and Maths
Training or development that will add value to organisation Top priority Training and development

105/127
Table 28: Individuals’ perceptions of training and development that will be required
Total
Governor/ trustee/ board member
Senior management team
Middle and junior manager
Advanced practitioner
Lecturer, teacher or tutor
Specialist assessor or verifier
Careers guidance specialist
Specialist coach, mentor or staff trainer
Teaching, learning or classroom assistant
Support worker (admin)
Support worker (maintenance, security, catering or cleaning)
Teaching and pedagogy 59% 46% 35% 51% 72% 74% 72% 30% 67% 74% 20% 35%
Maths and English 24% 9% 9% 21% 24% 31% 37% 0% 33% 37% 4% 15%
Leadership 38% 70% 71% 57% 28% 22% 30% 39% 35% 14% 37% 10%
Any other 56% 62% 65% 63% 55% 49% 54% 79% 50% 49% 65% 45%
Subject/sector knowledge 16% 24% 5% 14% 32% 20% 18% 12% 20% 16% 13% 15%
Sample base 1594 24 194 346 61 525 142 14 43 75 86 20
Q29. What forms of training or development would that be?
Table 29: Individuals’ perceptions of training and development that will be required – top priorities
Total
Governor/ trustee/ board member
Senior management team
Middle and junior manager
Advanced practitioner
Lecturer, teacher or tutor
Specialist assessor or verifier
Careers guidance specialist
Specialist coach, mentor or staff trainer
Teaching, learning or classroom assistant
Support worker (admin)
Support worker (maintenance, security, catering or cleaning)
Teaching and pedagogy 44% 24% 23% 34% 60% 57% 57% 10% 58% 56% 14% 25%
Maths and English 13% 0% 2% 7% 17% 18% 24% 0% 12% 26% 1% 0%
Leadership 24% 46% 55% 44% 14% 10% 10% 28% 17% 4% 20% 5%
Any other 34% 44% 42% 39% 37% 27% 22% 68% 32% 12% 53% 30%
Subject/sector knowledge 7% 9% 2% 6% 9% 10% 9% 0% 11% 4% 7% 5%
Sample base 1594 24 194 346 61 525 142 14 43 75 86 20
Q30. And which of these are your top priorities?

106/127 Training Needs Analysis
27/04/2018
Education and Training Foundation
The broad categories of training needs set out in Figure 55 (above) can be broken down into
more detailed areas of demand. At this level of disaggregation, the development of leadership
and management skills heads a long list of varied priorities with use of digital and new
technologies in teaching situations and other teaching competences following closely behind
(see Figure 56 following).
Figure 56: Forms of training and development that will be required
Sample base: 1594
Q29. What forms of training or development would that be? Q30. And which of these are your top priorities?
33%
27%
26%
22%
21%
20%
20%
18%
18%
16%
15%
14%
13%
13%
13%
12%
11%
11%
11%
3%
2%
20%
12%
12%
10%
9%
5%
10%
9%
6%
7%
7%
4%
9%
5%
4%
3%
3%
4%
3%
2%
2%
Governance, leadership, or management skills
Other teaching or classroom competences
Use of digital and other new technologies in teachingprogrammes
Changes in public policy, procedures, and funding
Specialist skills in the area of well-being or mental health
Soft skills
Specialist skills for working with learners with SpecialEducational Needs (SEND)
Teaching of English and Maths
Administrative procedures within your organisation or thoserequired by external bodies
Subject knowledge in subjects other than English and Maths
Assessments for apprenticeship or other education ortraining programmes
Own knowledge and competence in English and Maths
QTLS status
Business or commercial skills
Research skills
Expertise to offer careers advice and guidance to learners
Administrative, clerical or IT skills
Technical or manual skills
Awareness of SEND Code of Practice
Other
Prefer not to say
Forms that will add value Top priorities

107/127 Training Needs Analysis
27/04/2018
Education and Training Foundation
When these more detailed training requirements are again broken down by job role (see Tables
30 and 31 following), the same sorts of association are seen such that, for example, managers
and leaders more frequently want training in management and leadership and in public policy
change, teachers want training in teaching skills, careers guidance specialists in careers
guidance skills, and so on. There are, however, demands for some types of training which is
quite evenly spread across all or a variety of occupations, such as that related to use of digital
technologies, soft skills, and administrative procedures.

108/127
Table 30: Forms of training and development that will be required
Total
Governor/ trustee/ board member
Senior management team
Middle and junior manager
Advanced practitioner
Lecturer, teacher or tutor
Specialist assessor or verifier
Careers guidance specialist
Specialist coach, mentor or staff trainer
Teaching, learning or classroom assistant
Support worker (admin)
Support worker (maintenance, security, catering or cleaning)
Teaching of English and Maths
18% 0% 4% 13% 21% 26% 33% 0% 24% 20% 0% 5%
Use of digital and other new technologies in teaching programmes
26% 19% 8% 25% 40% 38% 27% 8% 28% 23% 4% 5%
Other teaching or classroom competences
27% 19% 8% 19% 37% 41% 34% 16% 27% 28% 4% 10%
QTLS status 13% 5% 4% 6% 11% 21% 21% 8% 9% 18% 0% 5% Own knowledge and competence in English and Maths
14% 9% 6% 13% 14% 15% 23% 0% 23% 26% 4% 15%
Subject knowledge in subjects other than English and Maths
16% 24% 5% 14% 32% 20% 18% 12% 20% 16% 13% 15%
Soft skills 20% 17% 20% 21% 25% 17% 23% 14% 20% 24% 23% 20% Governance, leadership, or management skills
33% 64% 62% 51% 26% 19% 24% 12% 35% 14% 27% 10%
Administrative procedures within your organisation or those required by external bodies
18% 27% 17% 20% 11% 16% 19% 23% 14% 21% 34% 20%

109/127
Assessments for apprenticeship or other education or training programmes
15% 17% 12% 15% 14% 13% 39% 12% 16% 8% 4% 5%
Expertise to offer careers advice and guidance to learners
12% 19% 12% 9% 11% 11% 14% 52% 12% 15% 10% 5%
Changes in public policy, procedures, and funding
22% 26% 39% 28% 15% 13% 20% 48% 13% 16% 32% 15%
Business or commercial skills
13% 28% 28% 20% 13% 7% 10% 28% 5% 4% 11% 0%
Administrative, clerical or IT skills
11% 19% 8% 7% 8% 8% 10% 16% 8% 10% 42% 20%
Technical or manual skills
11% 14% 6% 8% 7% 12% 19% 20% 6% 8% 7% 45%
Specialist skills for working with learners with Special Educational Needs (SEND)
20% 9% 15% 16% 21% 23% 16% 18% 33% 50% 14% 25%
Specialist skills in the area of well-being or mental health
21% 19% 20% 20% 27% 23% 11% 18% 23% 32% 22% 25%
Research skills 13% 24% 10% 11% 18% 14% 14% 19% 19% 5% 13% 10% Awareness of SEND Code of Practice
11% 0% 9% 11% 14% 13% 5% 10% 17% 25% 5% 10%
Sample base 1594 24 194 346 61 525 142 14 43 75 86 20
Q29. What forms of training or development would that be?

110/127
Table 31: Forms of training and development that are top priorities
Total
Governor/ trustee/ board member
Senior management team
Middle and junior manager
Advanced practitioner
Lecturer, teacher or tutor
Specialist assessor or verifier
Careers guidance specialist
Specialist coach, mentor or staff trainer
Teaching, learning or classroom assistant
Support worker (admin)
Support worker (maintenance, security, catering or cleaning)
Teaching of English and Maths
9% 0% 1% 5% 13% 15% 20% 0% 5% 15% 0% 0%
Use of digital and other new technologies in teaching programmes
12% 0% 2% 11% 22% 20% 8% 8% 8% 7% 0% 5%
Other teaching or classroom competences
12% 5% 3% 8% 20% 22% 12% 0% 13% 6% 2% 5%
QTLS status 9% 5% 4% 3% 9% 13% 16% 0% 2% 13% 0% 5% Own knowledge and competence in English and Maths
4% 0% 1% 3% 6% 5% 5% 0% 9% 13% 1% 0%
Subject knowledge in subjects other than English and Maths
7% 9% 2% 6% 9% 10% 9% 0% 11% 4% 7% 5%
Soft skills 5% 5% 6% 4% 11% 5% 4% 12% 3% 5% 9% 10% Governance, leadership, or management skills
20% 42% 45% 37% 14% 9% 8% 12% 17% 4% 18% 5%
Administrative procedures within your organisation or those required by external bodies
6% 9% 3% 8% 4% 4% 5% 2% 3% 5% 16% 5%

111/127
Assessments for apprenticeship or other education or training programmes
7% 14% 8% 6% 4% 4% 23% 0% 11% 2% 4% 0%
Expertise to offer careers advice and guidance to learners
3% 5% 4% 3% 2% 3% 1% 39% 12% *% 3% 0%
Changes in public policy, procedures, and funding
10% 21% 25% 15% 7% 2% 6% 17% 0% 1% 19% 10%
Business or commercial skills
5% 14% 17% 10% 2% 1% 3% 16% 0% 0% 2% 0%
Administrative, clerical or IT skills
3% 0% 3% 2% 0% 1% 2% 2% 3% 1% 21% 10%
Technical or manual skills
4% 0% 3% 4% *% 5% 8% 0% 3% 6% 1% 30%
Specialist skills for working with learners with Special Educational Needs (SEND)
10% 0% 7% 8% 14% 10% 9% 10% 28% 32% 7% 10%
Specialist skills in the area of well-being or mental health
9% 5% 7% 9% 9% 10% 4% 10% 10% 12% 16% 10%
Research skills 4% 0% 3% 3% 8% 4% 2% 8% 8% 0% 5% 0% Awareness of SEND Code of Practice
3% 0% 2% 4% 2% 2% 0% 0% 6% 2% 2% 0%
Sample base 1594 24 194 346 61 525 142 14 43 75 86 20
Q30. And which of these are your top priorities?

112/127 Training Needs Analysis
27/04/2018
Education and Training Foundation
61%18%
20%
1%
Yes
No
Not sure
Prefer not to say
There was also substantial demand for future training which leads to a qualification. Six out of
ten individuals who would like to train in the near future would also like to gain a qualification
from that training (see Figure 57).
Figure 57: Individuals that would like to gain qualifications from future training and
development
Sample base: Total (1550)
Q31. Would you like to gain a qualification from that training and development?
Demand for particular levels and types of qualification varied but most demand was at level 4
and above and particularly at post-graduate level 7 (see Figure 58).

113/127 Training Needs Analysis
27/04/2018
Education and Training Foundation
Figure 58: Level of qualification individuals would like to gain
Sample base: 938
Q32. Would that qualification be any of the following….
In terms of subject areas, there is particular demand for training in knowledge and skills related
to education and training, followed by training in essential or basic skills – ICT, English, and
maths (see Figure 59).
10%
26%
10%
17%
14%
10%
5%
8%
8%
10%
7%
6%
7%
12%
Academic qualifications
Level 8 (e.g. Doctorate)
Level 7 (e.g. Masters degree, PG Dip, PG Certificate)
Level 6 (e.g. Bachelors degree)
Level 5 (e.g. HND, Foundation Degree)
Level 4 (e.g. HNC, Certificate of Higher Education)
Level 3 (e.g. A Levels and equivalent)
Level 2 (e.g. GCSEs grade A*-C and equivalent)
Teaching qualifications
Level 7 (e.g. Postgraduate Certificate in Education)
Level 6 (e.g. BEd/BA/BSc with qualified teacher…
Level 5 (e.g. Diploma in Education and Training)
Level 4 (e.g. Certificate in Education and Training)
Level 3 (Award in Education and Training)
Or any other academic, or professional, or…
Prefer not to say

114/127 Training Needs Analysis
27/04/2018
Education and Training Foundation
Figure 59: Subject areas where individuals would value training and development
Sample base: 260
Q33. In which of the following subject area(s) would you value training and development?
* denotes a figure greater than zero, but less than 0.5%
Disaggregation of the statistics in Figure 59 for different occupations is mainly unreliable
because of small sub-sample bases. However, Table 32 (following) shows that lecturers,
teachers, and tutors (for whom there is a reasonable sub-sample) would most frequently value
training in education, ICT, English, and maths.
43%
19%
15%
15%
14%
13%
13%
9%
8%
7%
7%
5%
5%
5%
4%
3%
3%
3%
3%
5%
*%
12%
Education and training
ICT
English
Maths
Health, public services, and care
Business administration and law
Preparation for life and work
Arts, media, and publishing
Social science
Engineering and manufacturing
Science
Community development
Family learning
Languages, literature and culture
Humanities subjects
Agriculture, horticulture, and animal care
Construction planning and the built environment
Leisure, travel, hospitality, and tourism
Retail and commercial enterprise
Just subject knowledge generally/across all or many areas
Is there any other subject area not mentioned?
Prefer not to say

115/127 Training Needs Analysis
27/04/2018
Education and Training Foundation
Table 32: Subject areas where individuals would value training and development
Total
Senior management team
Middle and junior manager
Advanced practitioner
Lecturer, teacher or tutor
Specialist assessor or verifier
Teaching, learning or classroom assistant
Support worker (admin)
Agriculture, horticulture, and animal care
3% 0% 7% 0% 3% 0% 9% 0%
Arts, media, and publishing
9% 34% 5% 10% 10% 0% 27% 23%
Business administration and law
13% 0% 14% 10% 12% 14% 0% 22%
Community development
5% 20% 5% 12% 4% 3% 0% 0%
Construction planning and the built environment
3% 0% 0% 0% 1% 4% 9% 0%
Education and training
43% 34% 30% 76% 38% 63% 29% 31%
Engineering and manufacturing
7% 20% 10% 0% 5% 13% 0% 13%
English 15% 17% 9% 19% 20% 13% 18% 0%
Family learning 5% 17% 3% 19% 3% 4% 9% 0%
Health, public services, and care
14% 0% 9% 18% 8% 36% 9% 23%
Humanities subjects
4% 0% 3% 0% 6% 4% 0% 0%
ICT 19% 6% 10% 24% 23% 17% 30% 47% Languages, literature and culture
5% 0% 2% 0% 9% 4% 0% 10%
Leisure, travel, hospitality, and tourism
3% 0% 2% 0% 0% 9% 9% 0%
Maths 15% 0% 6% 1% 22% 18% 52% 0% Preparation for life and work
13% 17% 6% 13% 15% 13% 9% 2%
Retail and commercial enterprise
3% 0% 0% 5% 1% 12% 9% 0%
Science 7% 0% 7% 0% 9% 4% 9% 22%
Social science 8% 17% 10% 12% 7% 9% 0% 13%
Other subjects? *% 0% 0% 0% *% 0% 0% 0% Just subject knowledge generally/ across all or many areas
5% 20% 3% 0% 6% 0% 9% 10%
Prefer not to say 12% 9% 21% 6% 10% 5% 9% 21%
Sample base 252 12 48 19 103 26 11 11
Q33. In which of the following subject area(s) would you value training and development?
* denotes a figure greater than zero, but less than 0.5%

116/127 Training Needs Analysis
27/04/2018
Education and Training Foundation
Where individuals wanted leadership or management training, the most frequent demand was
for team leadership and supervisory skills training followed closely by demand for training in a
range of more senior management skills (see Figure 60).
Figure 60: Areas of leadership where individuals would value more training and
development
Sample base: 518
Q34. In which areas of governance, leadership, and management would you value training and development?
As would be anticipated, demand for senior and strategic leadership and management training
was more frequent amongst those holding more senior positions while demand for lower level
management and team leadership skills was more widely distributed across the occupational
spectrum (see Table 33 following).
40%
39%
36%
35%
34%
20%
20%
20%
5%
4%
2%
Team leadership and supervisory skills
Strategic management and corporate planning
Senior leadership development
Change management and business improvement
General organisational management
Management of commercial operations, businessdevelopment, marketing, or employer engagement
Financial planning and management
Human resources planning and management
Facilities management
Any other form of governance leadership, and management?
Prefer not to say

117/127
Table 33: Areas of leadership where individuals would value more training and development
Total
Governor/ trustee/ board member
Senior management team
Middle and junior manager
Advanced practitioner
Lecturer, teacher or tutor
Specialist assessor or verifier
Specialist coach, mentor or staff trainer
Support worker (admin)
Senior leadership development
36% 40% 58% 38% 13% 29% 19% 7% 7%
Strategic management and corporate planning
39% 82% 63% 41% 12% 24% 26% 23% 21%
General organisational management
34% 20% 15% 42% 72% 37% 42% 43% 41%
Change management and business improvement
35% 29% 43% 42% 28% 26% 29% 46% 21%
Management of commercial operations, business development, marketing, or employer engagement
20% 48% 22% 21% 13% 15% 23% 20% 10%
Financial planning and management
20% 38% 29% 20% 6% 9% 19% 23% 16%
Human resources planning and management
20% 38% 16% 18% 25% 24% 17% 16% 22%
Facilities management 5% 12% 2% 7% 6% 4% 3% 0% 6%
Team leadership and supervisory skills
40% 42% 12% 37% 64% 58% 56% 52% 32%
Any other form of governance leadership, and management
4% 20% 1% 3% 0% 2% 7% 0% 28%
Prefer not to say 2% 0% 3% 1% 0% 3% 0% 2% 9%
Sample base 518 15 119 184 14 97 31 15 21
Q34. In which areas of governance, leadership, and management would you value training and development?

118/127 Training Needs Analysis
27/04/2018
Education and Training Foundation
15%
15%
59%
11% 1%
Increase
Decrease
Stay about the same
Don't know
Refused
The likelihood of future training
In respect of future training, a majority of institutions were confident, wholly or reasonably so,
that their future training and development needs will be met (see Figure 61 following).
Figure 61: Institutions’ confidence that training and development needs will be met
Sample base: 473
Q44. Generally, how confident are you that the training and development needs of your organisations
leadership and staff over the next year will be substantially met?
The majority of institutions expected that their next year’s budget for staff training and
development would stay at the same level as this year, whilst, amongst the remaining minority,
there were equally frequent expectations of budget growth and decline (see Figure 62).
Figure 62: Expectations for training and development budget
Sample base: 473
Q45. Do you expect your budget for training and development to increase, decrease, or stay about the same
next year?
57%
37%
2%
1%
2%
Wholly or very confident
Moderately confident
Not very confident
Not at all confident
Don't know

119/127 Training Needs Analysis
27/04/2018
Education and Training Foundation
However, in institutions employing higher numbers of staff – Colleges in many cases – the
picture was somewhat more negative, with expectations of budget decline substantially out-
weighing expectations of increase (see Tables 34 and 35 following).
Table 34: Expectations for training and development budget
Total Colleges
Local Authorities
ITPs Prime contractors
ITPs Sub-contractors
Charitable/ Voluntary
Increase 15% 10% 12% 31% 31% 24%
Stay about the same 59% 60% 63% 51% 55% 55%
Decrease 15% 19% 12% 8% 7% 10%
Don't know 11% 11% 12% 8% 6% 8%
Refused 1% 0% 2% 2% 1% 3%
Sample base 473 107 43 119 89 62
Q45. Do you expect your budget for training and development to increase, decrease, or stay about the same
next year?
Table 35: Expectations for training and development budget
Total 10 or less 11 to 49 50-199 200+
Increase 15% 31% 31% 14% 7%
Stay about the same 59% 52% 51% 58% 63%
Decrease 15% 7% 8% 24% 18%
Don't know 11% 8% 7% 3% 12%
Refused 1% 2% 3% 0% 0%
Sample base 473 109 147 62 96
Q45. Do you expect your budget for training and development to increase, decrease, or stay about the same
next year?
Despite general confidence that most training needs will be met, a majority of organisations
would welcome external support in developing their staff training and development activity.
There was a substantial positive response on this issue with clear demand for support from
ETF, its founder members, and from the Department for Education, and sector membership
bodies (see Figure 63 following). There was particularly strong demand for support from most
sources from ITPs (see Table 36 following).

120/127 Training Needs Analysis
27/04/2018
Education and Training Foundation
Figure 63: Organisations from which institutions would welcome support
Sample base: 473
Q46. Would you welcome support in the form of information, guidance, or the provision of training or
development from any of the following organisations?
Table 36: Organisations from which institutions would welcome support
Total Colleges
Local Authorities
ITPs Prime contractors
ITPs Sub-contractors
Charitable/ Voluntary
The Department for Education
65% 64% 63% 75% 76% 55%
The Education and Training Foundation
66% 65% 58% 80% 71% 58%
The Association of Colleges
57% 64% 47% 42% 37% 26%
The Association of Education and Learning Providers
61% 61% 53% 74% 69% 53%
HOLEX 37% 38% 44% 37% 30% 32%
Is there any other source of support which you would welcome? (specify)
10% 7% 16% 16% 10% 23%
No support required/wanted
22% 24% 28% 11% 12% 23%
Don't know 4% 5% 2% 2% 0% 3%
Refused 1% 1% 2% 0% 0% 2%
Sample base 473 107 43 119 89 62
Q46. Would you welcome support in the form of information, guidance, or the provision of training or
development from any of the following organisations?
Individuals, where they could predict, were reasonably confident that they would undertake
training and development over the next year (see Figure 64 following).
66%
65%
61%
57%
37%
10%
22%
4%
1%
The Education and Training Foundation
The Department for Education
The Association of Education andLearning Providers
The Association of Colleges
HOLEX
Is there any other source of supportwhich you would welcome? (specify)
No support required/wanted
Don't know
Refused

121/127 Training Needs Analysis
27/04/2018
Education and Training Foundation
Figure 64: Individuals likelihood to undertake new training and development in the next year?
Sample base: 2366
Q36. How likely is it that you will undertake new training or development in the next year?
However, despite this confidence, around 8 out of 10 individuals could see barriers in the way of
their undertaking training and development – most frequently, those of employer and/or
personal unwillingness or inability to pay for it and difficulty in finding time ‘off-the-job’ to
undertake it (see Figure 65 following).
39%
33%
12%
2%
13%
1%
Certain or very likely
Quite likely
Quite unlikely
Certainly won't
Can't say at this stage
Prefer not to say

122/127 Training Needs Analysis
27/04/2018
Education and Training Foundation
Figure 65: Barriers to individuals undertaking training and development in the next year
Sample base: 2366
Q37. Do any of the following present barriers to your training or development at present or in the next year?
Respondents working in Colleges were somewhat more likely to see funding and time barriers
to their undertaking training (see Table 37 following)
33%
31%
38%
14%
13%
16%
2%
20%
3%
Your employer is unlikely to supply or fund it
You would be reluctant to fund it yourself or can'tafford it
You are too busy at work
Domestic or personal circumstances would limit yourability to take part
Staying away or travel distance or time would be abarrier
It's difficult to find the right training or development
Is there any other barrier?
No barriers apply
Prefer not to say

123/127 Training Needs Analysis
27/04/2018
Education and Training Foundation
Table 37: Barriers to individuals undertaking training and development in the next year
Total Colleges Local Authorities
ITPs Prime contractors
ITPs Sub-contractors
Charitable/ Voluntary Other
Your employer is unlikely to supply or fund it
33% 39% 30% 22% 26% 27% 34%
You would be reluctant to fund it yourself or can't afford it
31% 34% 31% 21% 27% 29% 35%
You are too busy at work
38% 42% 40% 38% 35% 36% 32%
Domestic or personal circumstances would limit your ability to take part
14% 13% 14% 12% 16% 11% 18%
Staying away or travel distance or time would be a barrier
13% 12% 15% 16% 9% 17% 12%
It's difficult to find the right training or development
16% 17% 16% 18% 18% 13% 15%
Is there any other barrier?
2% 2% 3% 1% 6% 2% 2%
No barriers apply 20% 16% 19% 27% 27% 27% 21%
Prefer not to say 3% 4% 2% 1% 1% 1% 1%
Sample base 2366 1125 498 204 70 114 133
Q37. Do any of the following present barriers to your training or development at present or in the next year?
Generally, respondents working in more senior positions in management were less likely than
other staff to see funding as a barrier to training but more likely to see lack of time as a barrier
(see Table 38 following).

124/127
Table 38: Barriers to individuals undertaking training and development in the next year
Total
Governor/ trustee/ board member
Senior management team
Middle and junior manager
Advanced practitioner
Lecturer, teacher or tutor
Specialist assessor or verifier
Careers guidance specialist
Specialist coach, mentor or staff trainer
Teaching, learning or classroom assistant
Support worker (admin)
Support worker (maintenance, security, catering or cleaning)
Your employer is unlikely to supply or fund it
33% 12% 14% 41% 48% 39% 26% 38% 40% 36% 29% 48%
You would be reluctant to fund it yourself or can't afford it
31% 31% 17% 29% 37% 39% 31% 19% 36% 32% 25% 23%
You are too busy at work
38% 39% 50% 47% 39% 39% 33% 34% 28% 17% 26% 40%
Domestic or personal circumstances would limit your ability to take part
14% 19% 13% 11% 16% 16% 13% 15% 8% 15% 12% 3%
Staying away or travel distance or time would be a barrier
13% 16% 12% 14% 14% 13% 15% 0% 4% 17% 11% 11%
It's difficult to find the right training or development
16% 20% 14% 21% 9% 16% 15% 0% 16% 17% 12% 26%
Is there any other barrier?
2% 2% 3% 1% 0% 2% 3% 0% 4% 6% 1% 3%
No barriers apply 20% 18% 26% 15% 15% 16% 24% 33% 13% 20% 28% 15%
Prefer not to say 3% 0% 1% 1% 5% 3% 2% 1% 4% 9% 8% 14%
Sample base 2366 34 305 472 70 748 203 23 56 128 183 37
Q37. Do any of the following present barriers to your training or development at present or in the next year?

125/127 Training Needs Analysis
27/04/2018
Education and Training Foundation
53%
66%
60%
62%
44%
22%
15%
19%
19%
25%
23%
15%
18%
16%
27%
3%
3%
3%
3%
4%
...has a training and development policy orstrategy which is clear to you
...operates a form of staff appraisal or usesother means by which your training and
development needs are identified
...has a clear route or mechanism by whichyou can request training and development
...generally has a positive and supportiveattitude to training and developing its leaders
and staff
...allows employees to set aside time fortraining and development
Agree Neutral Disagree No opinion
As a final and general indicator of the supportiveness of the environment for training and
development in the FE sector, respondents in the individuals’ survey expressed their agreement
or disagreement with a number of statements about that environment. Views on these
statements are positive but only moderately so. For example, while over 6 out of 10 workers in
FE said their organisation has a positive and supportive attitude to training and developing its
staff, over a third (35%) could not agree that this was the case, and 1 in 6 (16%) actively
disagreed with the proposition (see Figure 66).
Figure 66: Individuals’ agreement with statements about their employer organisation
Sample base: 2366
Q38. Thinking about your employer or organisation, how strongly would you agree or disagree with the
following statements. Please use a scale as: 1 = strongly disagree, 2 = disagree, 3 = neutral, 4 = agree, 5 =
strongly agree, and 6 = you don’t have an opinion.
Overall, respondents working in Colleges were less positive in their views on these matters than
were respondents working in other types of training organisations (see Table 39 following).
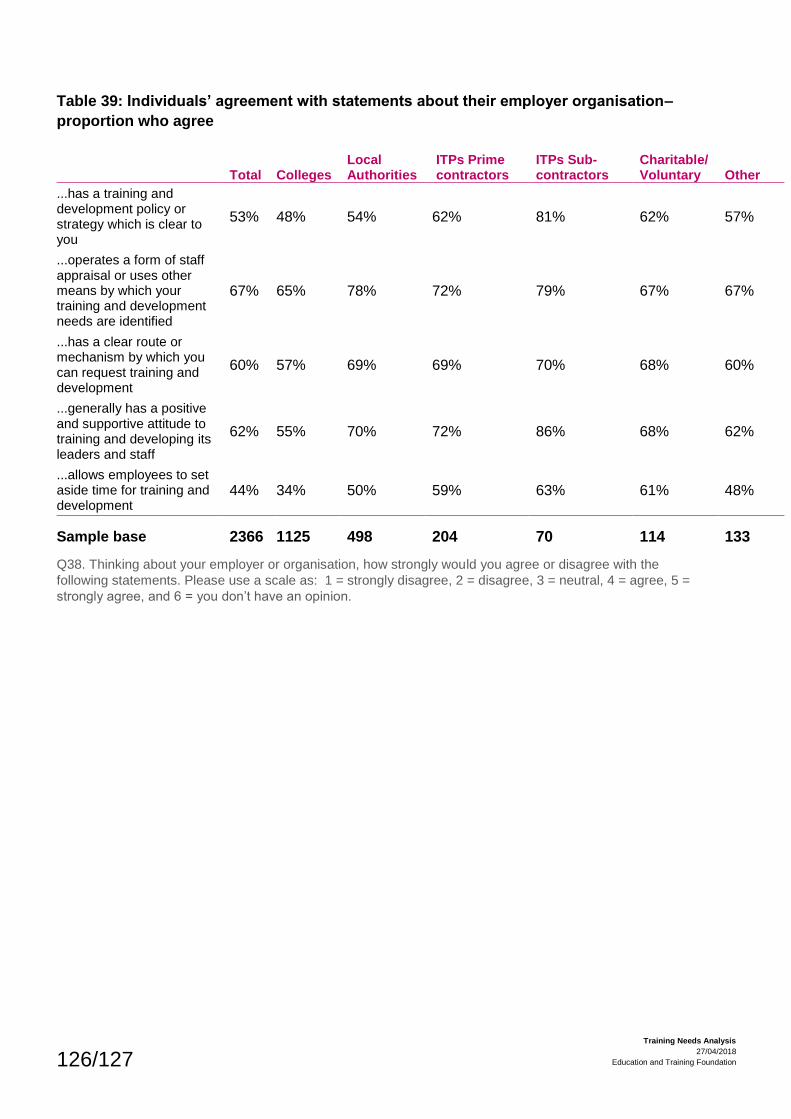
126/127 Training Needs Analysis
27/04/2018
Education and Training Foundation
Table 39: Individuals’ agreement with statements about their employer organisation–
proportion who agree
Total Colleges Local Authorities
ITPs Prime contractors
ITPs Sub-contractors
Charitable/ Voluntary Other
...has a training and development policy or strategy which is clear to you
53% 48% 54% 62% 81% 62% 57%
...operates a form of staff appraisal or uses other means by which your training and development needs are identified
67% 65% 78% 72% 79% 67% 67%
...has a clear route or mechanism by which you can request training and development
60% 57% 69% 69% 70% 68% 60%
...generally has a positive and supportive attitude to training and developing its leaders and staff
62% 55% 70% 72% 86% 68% 62%
...allows employees to set aside time for training and development
44% 34% 50% 59% 63% 61% 48%
Sample base 2366 1125 498 204 70 114 133
Q38. Thinking about your employer or organisation, how strongly would you agree or disagree with the
following statements. Please use a scale as: 1 = strongly disagree, 2 = disagree, 3 = neutral, 4 = agree, 5 =
strongly agree, and 6 = you don’t have an opinion.

127/127
Training Needs Analysis
27/04/2018
Education and Training Foundation